Article

Deployment of XRF Sensors Underground: An Opportunity for Grade Monitoring or Bulk Ore Sorting in Cave Mines

1
Norman B. Keevil Institute of Mining Engineering, University of British Columbia, 517-6350 Stores Road, Vancouver, BC V6T 1Z4, Canada
2
Newcrest Mining Limited, Level 8, 600 St. Kilda Road, Melbourne, VIC 3004, Australia
3
MineSense Technologies Ltd., 100-8365 Ontario Street, Vancouver, BC V5X 3E8, Canada
*
Author to whom correspondence should be addressed.
Minerals 2023, 13(5), 672; https://doi.org/10.3390/min13050672
Submission received: 19 April 2023 / Revised: 2 May 2023 / Accepted: 12 May 2023 / Published: 13 May 2023
(This article belongs to the Section Mineral Processing and Extractive Metallurgy)

Abstract

:
Ore grades are monitored regularly in cave mines through drawpoint sampling. Automating grade monitoring through deploying X-ray fluorescence (XRF) sensors on the buckets of production loaders has been proposed as an alternative approach to address the issues around the traditional practice of drawpoint sampling. Bucket-mounted sensors can also be employed for bulk ore sorting underground. This study is aimed at evaluating the deployment of XRF sensors on production loaders as an opportunity for grade monitoring or bulk ore sorting in caving operations. The mill feed grade prediction performances of the drawpoint sampling program and mine planning software were assessed for the Cadia East panel cave mine. The results showed that the drawpoint samples underestimated the mill feed quality during a 10-month investigation period. The cave portions with bulk ore sorting potential were linked to the extraction level layout to estimate the number of drawpoints where sensors could be situated for diverting ore and waste. Samples obtained from the mine were tested to evaluate the ability of a lab-scale proxy of a bucket-mounted XRF sensor system to measure copper and gold grades. R-squared values of 0.84 and 0.68 were achieved between the predicted and measured copper and gold grades of the samples, respectively. Sensor test results are promising in revealing the potential to utilize XRF sensors underground. Future test work is encouraged to further validate the applicability of XRF sensors in an underground mining environment.

1. Introduction

Block and panel caving are underground mining methods that involve undercutting an orebody to initiate caving and then progressively recovering caved ore through drawpoints [1,2]. Cave mining has become the primary method of choice for large, steeply dipping, relatively low-grade, and deeply situated orebodies, as it can offer high production rates at low operating costs that are comparable to open-pit mining [3,4].
Caving differs from open pits and other underground methods in terms of the lack of grade selectivity. In cave mining, following cave establishment, ore starts to fragment due to stresses in the cave back and subsequently flows and mixes in draw columns before reporting to drawpoints established on the extraction level [4,5]. There is limited control over recovered grades in caving since the fragmentation, gravity flow, and mixing of ore are variable and relatively uncontrollable events that are impacted by the draw strategy, the fragment size distribution of caved ore, and the undercutting rate and direction [6].
Tools simulating the gravity flow in draw columns have been developed to minimize the risks involved in the design and operational aspects of cave mines [3,4,6,7]. Such tools are utilized for planning and scheduling production in caving operations by forecasting the properties of caved ore. GEOVIA PCBC, for instance, is a software package designed specifically for block and panel cave mines. The software applies various material mixing algorithms to geological block models to aid production scheduling by predicting ore grades at drawpoints [6,8].
Caving is not a selective mining method. Ore is drawn according to the production plans nominated by mine planning and scheduling software. Regardless, the grade of the ore is monitored regularly in block and panel cave mines through drawpoint sampling. Sampling typically involves collecting material from a drawpoint muck pile by hand or by using a shovel at a fixed time or a tonnage interval [9]. Drawpoint grades are reconciled to the block model to estimate draw column heights and remaining ore reserves [9] and can be used to calibrate ore mixing models applied to a specific cave mine for improved grade forecasting and production scheduling [8].
Issues relating to the sampling of drawpoints have been discussed previously [9]. These include the grade prediction bias that might arise due to the size of the rocks that can be sampled, the difficulty in maintaining a consistent sampling frequency without impeding production, and the health and safety risks faced by the sampling personnel due to the unpredictable nature of material movement at a drawpoint. Another concern is that sample sizes are small, e.g., tens of kilograms, which may not be representative. In addition, as cave mines are becoming larger operations, regular sampling of several hundred drawpoints can be a challenging task to perform, both logistically and financially.
Integration of grade-measuring sensor technologies with mobile equipment for automated real-time grade monitoring has been proposed as an alternative to the conventional drawpoint sampling practice [4,6,9]. X-ray fluorescence (XRF), a surface analytical technique employed to determine the elemental composition of materials, is considered a candidate technology for monitoring drawpoint grades. XRF sensors have been fitted to shovels, excavators, and loaders, providing rapid grade measurements.
For cave mines, such as Cadia East in Australia and New Afton in Canada, there have been attempts to implement bulk ore sorting to separate ore and waste. These attempts involved mounting sensors on the ore conveyor belt at the surface. A previous study for the Cadia East mine showed that mixing along the material handling system eliminates most of the heterogeneity and concluded that bulk ore sorting should be conducted as close to the drawpoints as possible [10]. The XRF shovel sensing system has been applied in open-pit mines for directing ore and waste to correct destinations as the material is mined [11,12]. It has been proposed that XRF sensors could be installed on the buckets of underground loaders for bulk ore sorting in cave mines to address the limited grade selectivity associated with cave mining [4,5].
This study is aimed at evaluating the deployment of XRF sensors on production loaders as an opportunity for automated grade monitoring or bulk ore sorting underground in cave mining operations. The mill feed grade prediction performances of the drawpoint sampling program and mine planning software were evaluated for the Cadia East panel cave mine. The panel cave portions with sorting potential were linked to the extraction level layout to estimate the number of drawpoints at which bucket-mounted XRF sensors could be deployed. Lab-scale tests were performed to evaluate the capability of XRF sensors in determining copper and gold grades of the Cadia East ore. The results presented in this study are significant for cave mining operations investigating the use of sensor technologies underground for automated grade monitoring or bulk ore sorting.

2. Methodology

2.1. Assessing Performances of Drawpoint Sampling and PCBC in Predicting Mill Feed Grades

Cadia East, located in New South Wales, Australia, is a gold-copper panel cave mine operating three panel caves referred to as PC1, PC2-West, and PC2-East. The caved ore at Cadia East is collected from drawpoints by load-haul-dump (LHD) units with a nominal payload capacity of 20 tonnes each and dumped into underground crushers. The crushed ore is transported to the surface via a belt conveyor operating at a rate of 4600 tonnes per hour and is stockpiled ahead of milling. The stockpile feeds two concentrators producing gold doré and gold-rich copper concentrate with a total milling capacity of 30 million tonnes of ore per annum [13].
The Cadia East drawpoints are sampled regularly, ideally once a week, to monitor caved ore grades. The sampling procedure involves collecting sub-samples from at least three different locations of a drawpoint muck pile and collecting them in 5 kg bags [13]. The samples are assayed for copper, gold, silver, molybdenum, and sulphur, as well as other elements. The drawpoint sample grades are then compared with the grades forecasted by the PCBC planning software to reconcile the production to the orebody block model and to update the remaining reserves.
In this study, a drawpoint assay data set was employed to assess the performances of Cadia East’s sampling program and the PCBC planning software in estimating mill feed grades. The data set contained the grades of drawpoint samples collected weekly from August 2018 to May 2019, PCBC’s grade predictions and the grades of ore milled in the Cadia East concentrators during the same 10-month period. The number of drawpoints and drawpoint samples and the mean sampling frequency per drawpoint between the dates specified are shown in Table 1.
As part of the assessment, first, the relative differences between the weekly drawpoint sample grades and PCBC’s grade forecasts were determined. Second, the sample and PCBC grades were reconciled to the mill feed grades to determine the performances of each in terms of being able to predict the quality of ore feeding into the concentrators. The reconciliation of mine grades and mill feed grades was carried out on a monthly basis to compensate for the lag time for ore to travel to the surface and then pass through the coarse ore stockpile with a live capacity of 40,000 tonnes. In both cases, the calculations were carried out for the two major commodities of the Cadia East mine, copper and gold, using the following equation:
Relative   difference   ( RD )   ( % )   = x x reference x reference   ×   100
The variables used in Equation (1) and the objectives of the respective relative difference calculations are presented in Table 2.

2.2. Estimating the Number of Drawpoints with Potential to Apply Bulk Ore Sorting

Bulk ore sorting systems should ideally be placed as close to the mining face as possible to be able to take full advantage of an orebody’s naturally occurring grade heterogeneity before it is deteriorated by blending practices and mixing during the handling of ore [4,10,14]. Assuming that a waste stream in parallel to the ore stream is integrated with the mine design, deploying bulk ore sensor technologies at the extraction level of a caving operation is considered the most advantageous method in leveraging the variability in ore grades [4,5].
An evaluation of the sorting potential of the Cadia East mine revealed that the low-grade portions of one currently operating (PC2-East) and two future panel caves are amenable to preconcentration by bulk ore sorting [15]. Bulk ore sorting applied to specific portions of a cave’s footprint would require sensor technologies to be positioned at selected drawpoints that are identified as having high sorting potential. In this study, the portions of the Cadia East panel caves with sorting potential were linked to the mine’s extraction level layout to estimate the number of drawpoints where loaders equipped with XRF sensors could be situated.
A previously built block model of the Cadia East mine was merged with the drawpoint coordinates using a Python script. The block model contained the theoretical improvement in the Net Smelter Return (NSR) of the ore in the case of a bulk ore sorting application at the extraction level. The cost and price assumptions and mill recovery models [13] used in the NSR estimations are presented in Table 3.
A draw column radius of 14 m was assumed [13] to correctly assign the vertically clustered ore blocks with a size of 5 × 5 × 5 m3 each reporting to the drawpoints. The number of drawpoints where XRF sensors on LHDs could be employed was estimated for the PC2-East cave and the two future panel caves. The future caves were undisclosed for confidentiality and called “Cave A” and “Cave B.” The estimations were not performed for the PC1 and PC2-West caves, as they were found to not possess bulk ore sorting potential.
For an underground bulk ore sorting application using XRF sensors on LHDs, the sorting cost per unit of material would need to be estimated considering the size of the mine, the cost and number of XRF sensors, the cost of establishing separate ore and waste streams, etc. For this study, a bulk sorting cost of US$ 0.4 per tonne of ore [16] was nominated as an approximate of the operating costs.
The impact of mixing was not incorporated in the NSR estimations. It was anticipated that the production LHDs with 20-tonne capacities would observe a higher grade heterogeneity than the block model of the deposit (the 5 × 5 × 5 m3 block size corresponds to 345 tonnes) due to an approximately 18-fold difference in the scales of the selective mining units. Based on a suggested approach [17], it was assumed that the adverse influence of mixing on the sorting potential could be compensated for by the higher grade resolution that would be observed by the bucket-mounted sensors.

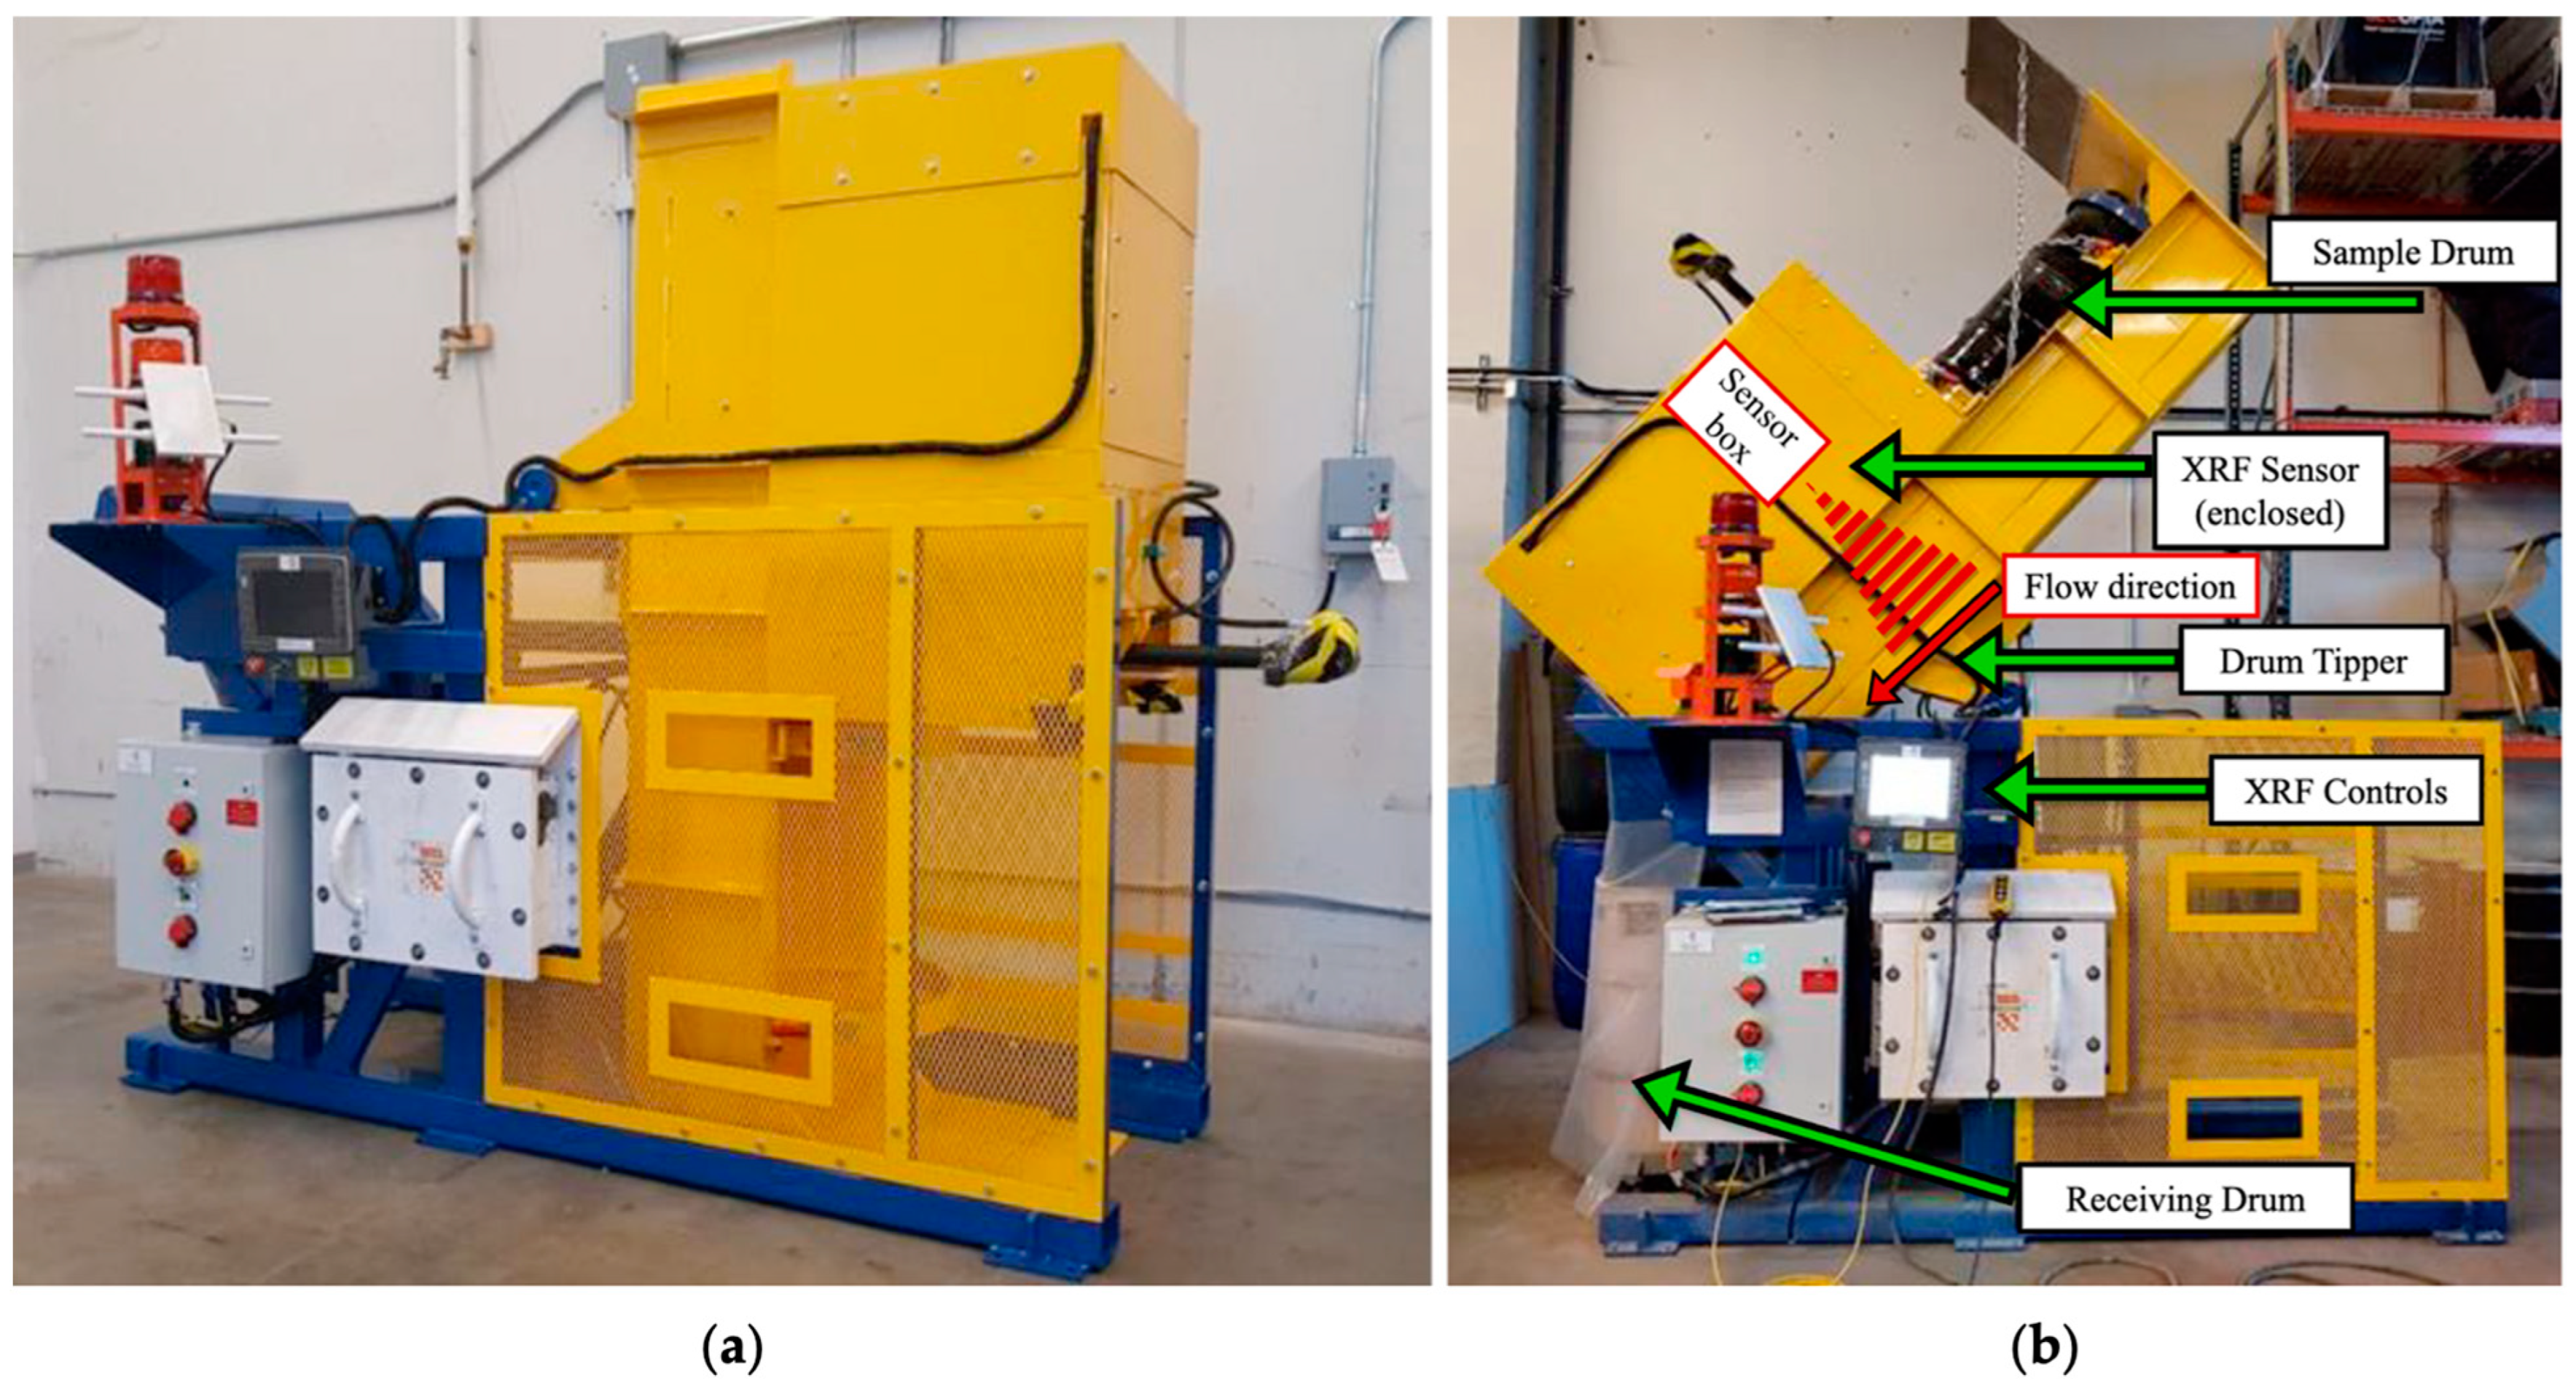
2.3. Lab-Scale Evaluation of Bucket-Mounted XRF Sensors

Seven belt-cut samples obtained from the Cadia East mine were tested to evaluate the capability of lab-scale bucket-mounted XRF sensors in measuring copper and gold grades. Drawpoint samples were not available at the time of the study. Therefore, a decision was made to use belt-cut samples for the XRF sensor tests. Another consideration was to select samples with significant grade differences that represent the variation that may be expected at the drawpoints.
Samples weighing approximately 120 kg each were collected monthly between July 2020 and May 2021 from the main trunk belt and were prepared for testing and multi-element analysis. The samples had previously been crushed to −40 mm top size; therefore, they did not exactly represent the typical size distribution of the caved ore drawn from the Cadia East drawpoints. The samples were subsequently sent to MineSense’s testing facility in Vancouver, British Columbia, for the XRF sensor tests. Table 4 presents the samples’ copper and gold grades, determined by inductively coupled plasma atomic emission spectroscopy (ICP-AES) and fire assay methods at the ALS Geochemistry laboratory in Vancouver, British Columbia.
ShovelSense, a grade control system developed by MineSense Technologies Ltd., integrates XRF sensors with mobile mining equipment, such as cable shovels, front-facing excavators, and front-end-loaders, to measure ore grades in real time. The ShovelSense system scans the rocks as they flow into the bucket, with up to four XRF sensors installed in the brow. XRF spectra are collected at a 100-ms frequency in a window between approximately 1000 and 350 mm away from the sensor with wide-angle X-ray emitters. Bucket fill cycles typically allow for 2 to 7 s of scan time within the analysis window, which equates to 20 to 70 XRF shots per head and 80 to 280 XRF shots per bucket. This ensures that the XRF responses of coarse and fine fragments are captured as they roll through the sensing window, which is critical to delivering a representative scan of the material in the bucket. The XRF spectra are aggregated and converted into predictions of the element grades of interest. The real-time integration of ShovelSense grade measurements and local mine grade estimates allows the system to accurately classify ore and waste [11].
The Cadia East samples were tested with a lab-scale proxy of ShovelSense that is referred to as the Amenability Testing Machine (ATM), which mimics the flow of rocks that is observed in buckets of mining equipment with ShovelSense (Figure 1). The ATM allows rock samples of up to 600 kg to flow past a single XRF sensor while the XRF spectra are collected. The test setup includes a drum tipper, which secures the sample drum and tips the sample to flow past the XRF sensor into a hopper and receiving drum. The XRF sensor is mounted over the center of the flow chute at a height of 600 mm, simulating the sensor readings as they may be taken in a shovel, with the sample flowing within a working distance of 450 mm from the sensor head. The tests are repeated multiple times per drum, with cleaning between runs and different samples. Depending on the volume or mass of the sample, a single ATM run takes around two seconds.
The ATM tests were repeated at least five times for each Cadia East ore sample to determine the repeatability of grade measurements. The accuracy of copper grade measurements was determined by regression analysis of ICP copper grades and average copper K-alpha (Cu K-α) counts measured by the XRF sensor. A regression model predicting the gold grades of the samples was developed using the XRF spectra reported by the sensor. Copper, iron and molybdenum were selected for modelling gold grades, as gold is associated with these metals in chalcopyrite (CuFeS2), bornite (Cu5FeS4) and molybdenite (MoS2) in the Cadia East ore [13]. Sulphur, on the other hand, is a lower-energy element, the signal of which becomes attenuated in air due to the working distance between the sensor and the material. Hence, the ShovelSense X-ray detectors are unable to collect a measurable sulphur XRF response. Sulphur is also associated with gold in the Cadia East ore. However, sulphur was not included in the regression modelling of gold grades, as it cannot be measured by the XRF sensor.

3. Results and Discussion

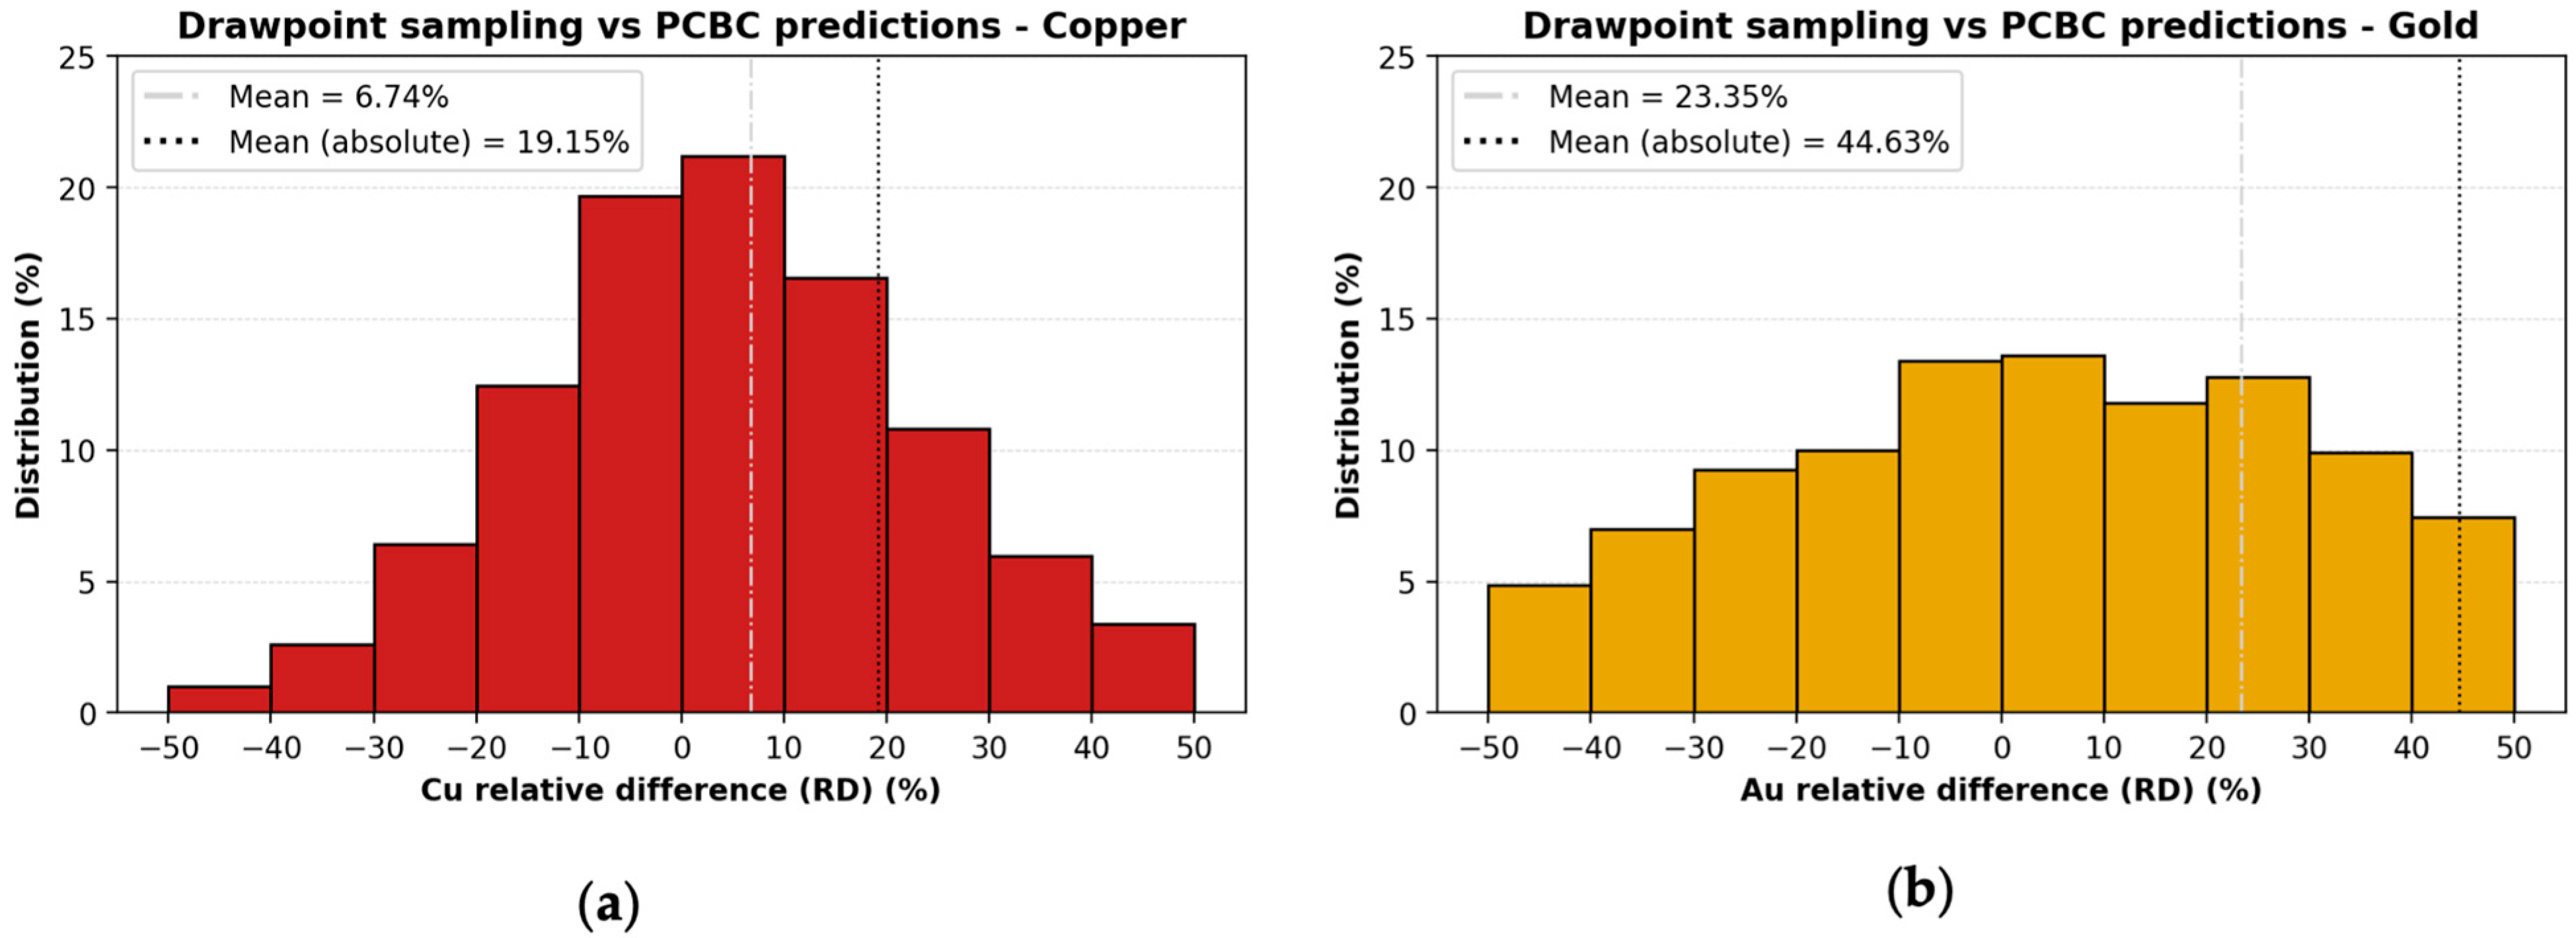
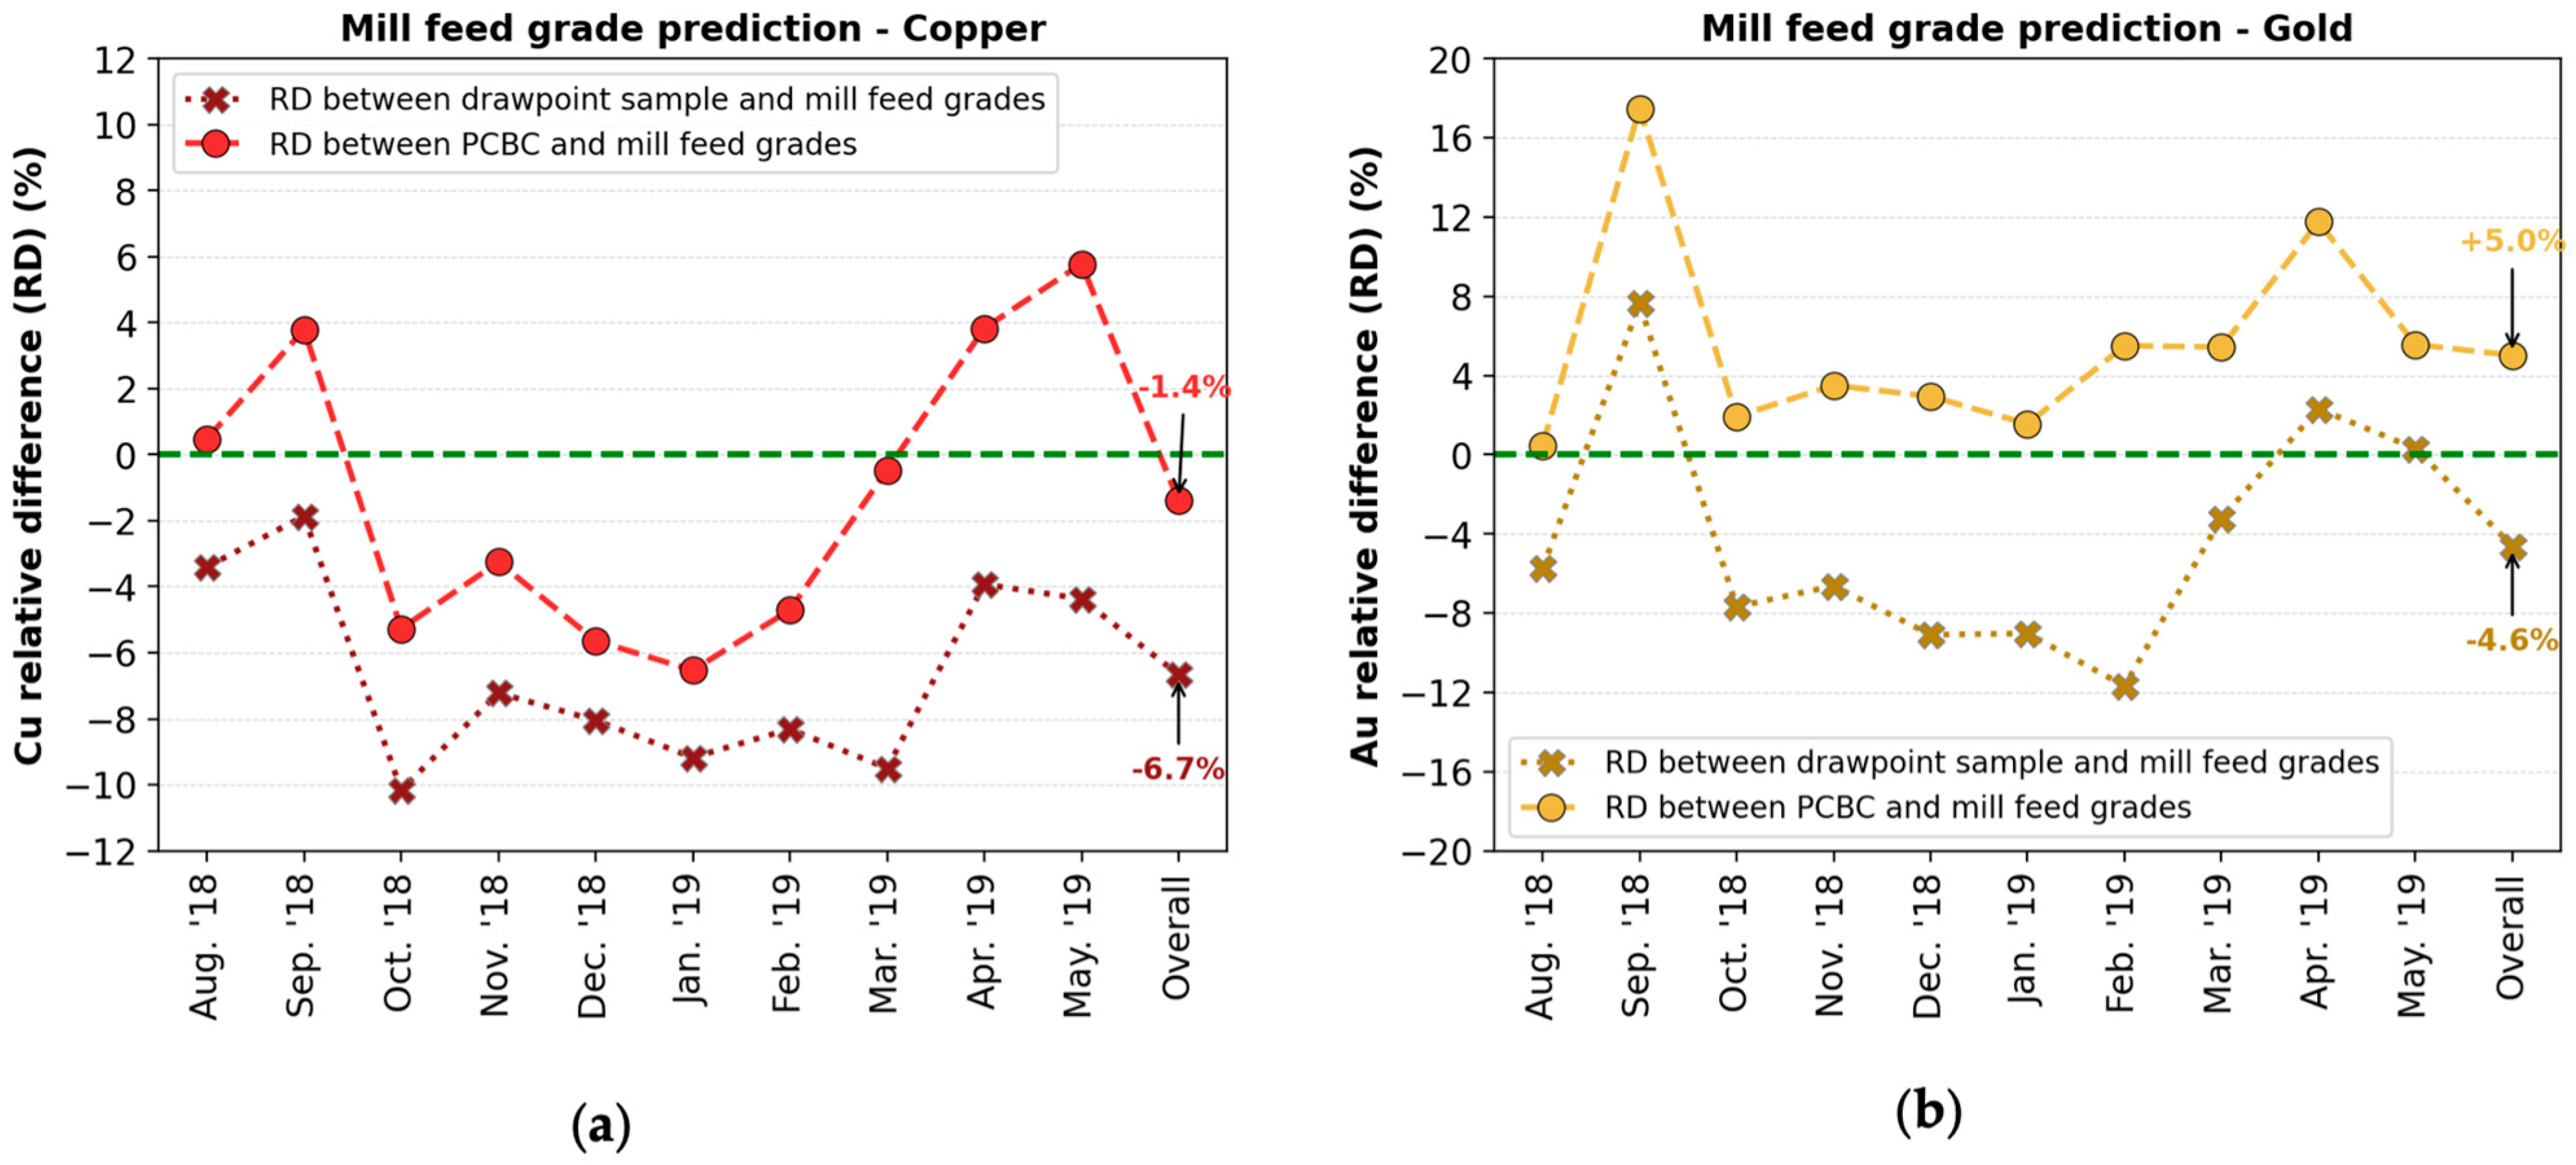
3.1. Drawpoint Sample Grades vs. PCBC’s Grade Predictions

Figure 2 shows the distribution of the relative difference between the weekly drawpoint sample grades and PCBC’s drawpoint grade predictions from August 2018 to May 2019. An inconsistency exists between the measured and predicted drawpoint copper grades: approximately 62% of the PCBC copper grade forecasts varied from the drawpoint sample copper grades by a relative difference of 10% or more (Figure 2a). A more significant discrepancy was observed for gold grade estimations, as revealed by an almost uniform distribution of the relative difference, which yielded a mean absolute difference of about 45% (Figure 2b). PCBC’s gold grade forecasts deviated from the drawpoint gold grades by at least 10% for approximately 81% of the data points assessed. Compared to the PCBC software, the sampling program tends to underestimate the metal grades of the drawpoint muck piles, which is evident by the positive mean difference values of 6.74% and 23.35% for copper and gold, respectively (Figure 2).
A drawpoint fragmentation assessment undertaken using digital image processing techniques concluded for the PC1 cave of the Cadia East mine that the measured size distribution at drawpoints varied significantly as a function of the geotechnical domain and generally became finer as drawpoint tonnages increased [7]. Therefore, it was deemed that the variation in the size distribution of caved rock and the potential deportment of copper and gold into specific size fractions that cannot be sampled practically could be the factors leading to lower metal grade estimates with drawpoint sampling. The poorer match between measured and predicted gold grades might be related to the relatively low concentrations of gold in the ore, leading to challenges in obtaining representative samples for analyses.
Figure 3 presents how the measured and predicted mine grades reconcile to the mill feed grades. The figure reveals that the mill feed quality was underpredicted by the drawpoint sampling program for almost every month investigated in the assessment. The mill feed copper grades were underestimated by about 2% to 10% monthly based on the drawpoint samples (Figure 3a). The mill feed gold grades also differed from the drawpoint sample grades by amounts varying from −12% to +8% (Figure 3b). Overall, on average, the drawpoint sample grades fell short of mill feed grades by 6.7% for copper and 4.6% for gold (Figure 3).
In contrast, PCBC performed rather satisfactorily in predicting the copper content of mill feed. PCBC’s monthly copper grade forecasts for caved ore deviated from the mill feed copper grades by ±6% on a monthly basis, yielding an overall difference of only −1.4% (Figure 3a). However, PCBC overestimated the gold grades of mill feed by up to 17% monthly, resulting in an overall difference of 5% (Figure 3b).
Despite differing from the mill feed grades, the measured and predicted mine grades aligned with each other to a certain extent on a monthly basis rather than weekly, following similar grade difference trends for copper and gold, as shown in Figure 3. Even though the fluctuations in reconciled mine and mill grades could be caused by sampling errors and PCBC’s grade predictions, they may also be due to the errors made in the mill’s grade assessment of the processed material [18]. The difference between the measurements and mill data may also be due to ore mixing during transport and stockpiling, preventing the comparison of the same ore. Regardless, it can be concluded that the PCBC software performed more satisfactorily than the drawpoint sampling program, particularly in forecasting the mill feed copper grades.

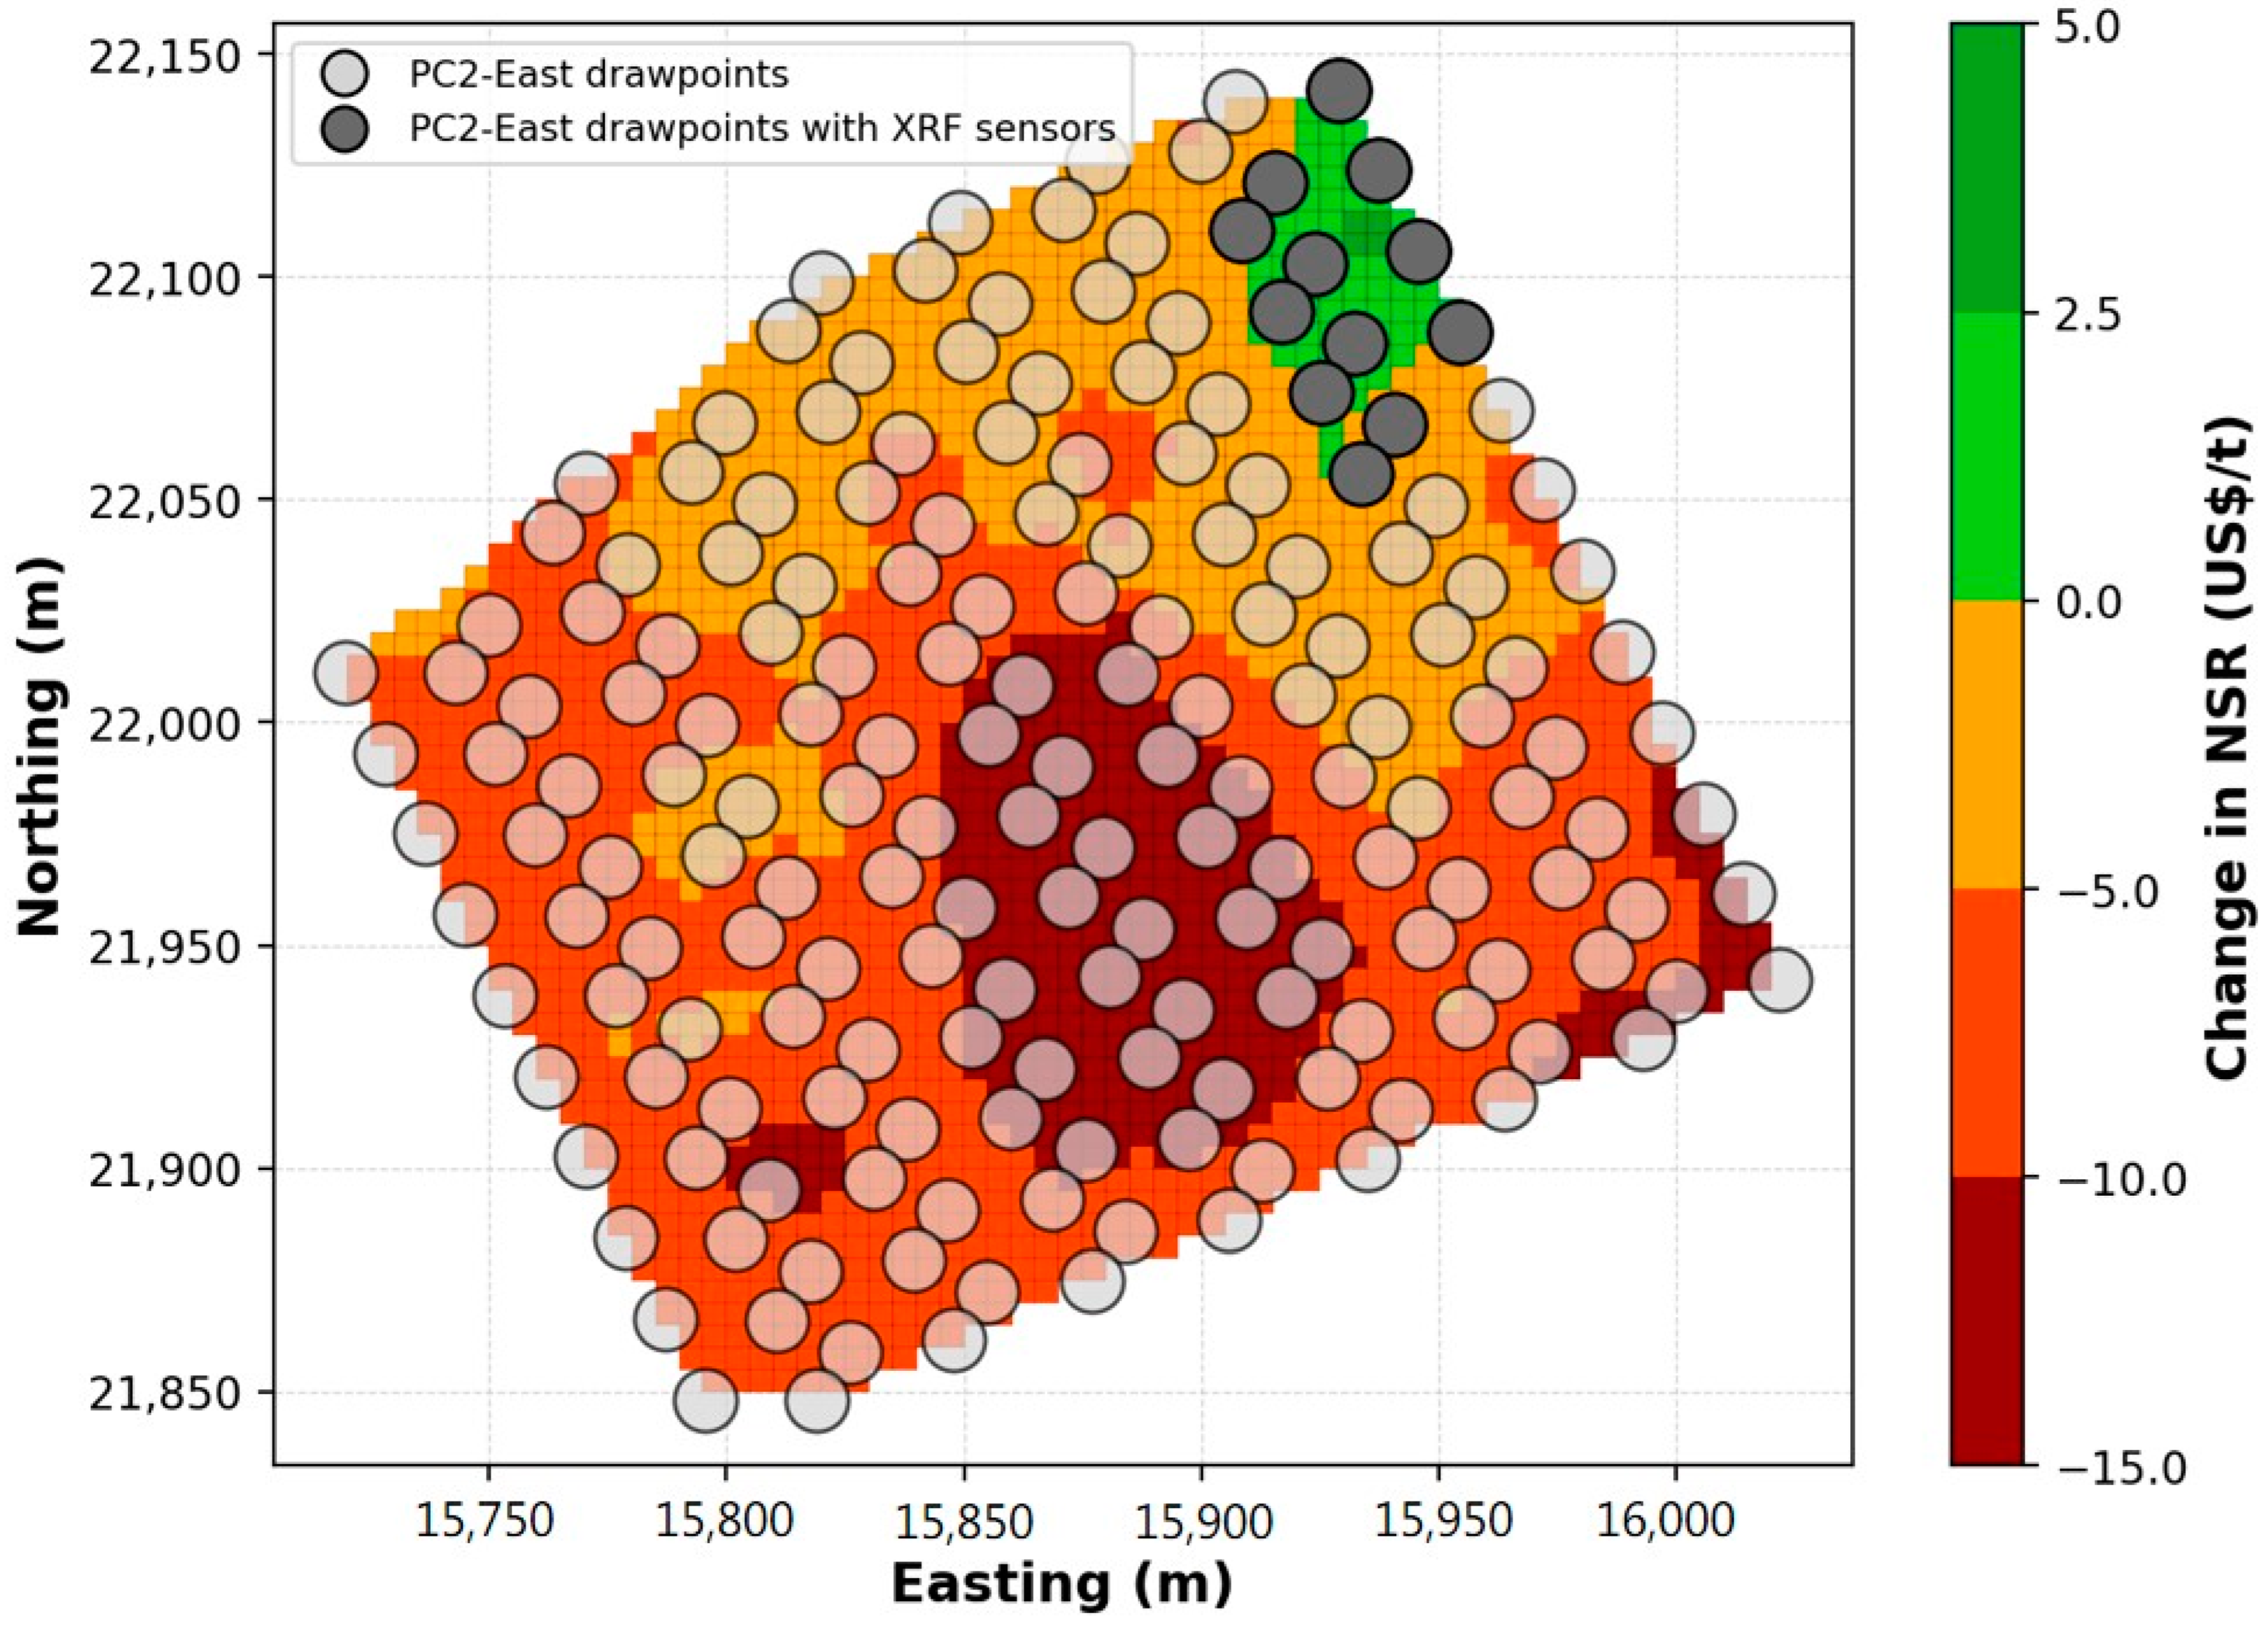
3.2. Potential to Apply Bulk Ore Sorting Underground at Cadia East

Figure 4 presents the NSR map of the PC2-East cave when bulk ore sorting is hypothetically applied using XRF sensors on LHDs. The figure also shows the locations of the PC2-East drawpoints. The NSR maps of PC1 and PC2-West are not presented in the figure, as the caves were found to not show sorting potential. In addition, the maps of the future caves, Cave A and Cave B, are not presented due to confidentiality.
The PC2-East cave is designed to operate with 8 extraction drives and a total of 182 drawpoints. If sorting was applied to the sortable portions of PC2-East at a 0.1% Cu sorting cut-off grade, an improvement in the ore value of $0.20 per tonne could be achieved [15]. It was estimated that such a sorting practice would require equipping production LHDs with sensors at six drawpoints along two neighbouring extraction drives to preconcentrate caved ore, as shown in Figure 4.
Similarly, for Cave A and Cave B, it was found that bulk ore sorting could improve the NSR of the ore drawn from the respective caves by $0.04 and $0.77 per tonne at sorting cut-off grades of 0.05% and 0.1% Cu [15]. For Cave A, deploying bucket-mounted sensors at two drawpoints along a single extraction drive was determined to be required to sort ore drawn from its footprint. The estimations showed that Cave B would necessitate situating mobile bulk sensors at 71 drawpoints throughout eight production drives (five on the north and three on the south side) of its extraction level.
The results of the hypothetical bulk ore sorting application performed underground with mobile XRF sensors are summarized in Table 5.

3.3. XRF Sensor Evaluation

The results of the lab-scale evaluation of bucket-mounted XRF sensors for determining copper grades are presented in Figure 5. An R-squared value of 0.84 was achieved between the copper grades (determined by ICP analysis) and the average copper K-alpha counts (measured by ATM’s XRF sensor) for the tests conducted on seven bulk samples (Figure 5a). The tests yielded a measurement repeatability range with standard deviations between 0.016% and 0.039% Cu, as shown in Figure 5b.
Figure 6 compares the lab-scale XRF sensor’s copper grade predictions for Cadia East and various copper porphyry deposits. Despite the results being in line with the results of previous lab simulations performed on various copper porphyry ores (Figure 6), a possible explanation can be proposed for the variation in copper grade measurements obtained for the Cadia East samples. Since XRF is a surface technique unable to penetrate the whole volume of rocks, the orientation of individual particles relative to the sensor location as they are being scanned during each test may lead to variations in grade measurements, thereby impacting the accuracy of grade predictions. Such variation that may be experienced in bulk ore sorting studies was identified as heterogeneity error [19]. The heterogeneity error is expected in lab simulations to a certain level, since, as described previously, a single XRF sensor is mounted on the ATM test device with a typical 2-s measurement window. In contrast, for a field deployment, the ShovelSense system can partially mitigate the heterogeneity error by employing two to four independent XRF sensors, scanning the rocks over a wide range of distances and gathering XRF responses across various rock surfaces for up to 7 s [11]. Nevertheless, more test work should be conducted to expand the results database and validate the system’s ability to produce precise grade measurements while scanning greater volumes of coarser material.
Equation (2) shows the regression model developed to predict the gold grades of the samples using the raw spectral information provided by ATM’s XRF sensor:
Au   = 2.95   ×   10 3 CuK α 1.01   ×   10 3 FeK α 1.58   ×   10 3 MoK α + 1.18
where Au is the predicted gold content in grams per tonne of material, CuKα, FeKα and MoKα are the average copper, iron and molybdenum K-α counts measured by the XRF sensor. Figure 7 shows a plot of predicted and measured gold grades, where an R-squared value of 0.68 was achieved. Compared to the copper grades, the gold grades of the samples were slightly less accurately predicted by the ATM system, which was to some degree expected due to the technical challenges of detecting elements in low concentrations.

4. Conclusions

An assessment of caved ore grades at the Cadia East mine showed a discrepancy between the grades measured by drawpoint samples and those forecasted by the PCBC software. The drawpoint sampling program underperformed compared to PCBC, as the mill feed quality was mispredicted, or, more precisely, underpredicted, with a more significant margin by the drawpoint samples during the 10-month assessment period. The variation in the size distribution of caved ore and the difficulty in collecting samples representing a whole drawpoint muck pile due to the likely deportment of copper and gold into specific size fractions were deemed as the potential factors leading to lower metal grade estimates obtained with the drawpoint samples.
The automation of grade monitoring in cave mines through the integration of XRF sensors on load haul dump units can address the issues of the conventional grab sampling practice of drawpoints. A potential benefit of automated grade monitoring systems is to perform real-time grade measurements rather than waiting for samples to be assayed. Besides, such automated systems can provide more accurate grade estimations, as they collect larger samples that are likely more representative of the material at a drawpoint. In addition, a consistent grade control frequency can be achieved without interfering with the production, as the grade measurements are carried out concurrently with collecting caved ore from drawpoints. As the accuracy and frequency of drawpoint grade estimations are improved, a more developed production reconciliation can also be achieved. By automating grade control in cave mines, the health and safety risks presented to the sampling staff can be eliminated, and the cost and labour involved in the process can be minimized.
Alternatively, the bucket-mounted sensors can be employed at drawpoints to divert waste from ore early in the mining value chain. Low-grade portions of three Cadia East panel caves were determined to be amenable to bulk ore sorting. The portions of cave footprints with sorting potential were linked to the extraction level layout to estimate the number of drawpoints at which XRF sensors can be utilized for an underground ore sorting application.
Seven bulk samples obtained from the Cadia East mine were tested to evaluate the ability of XRF sensors to measure copper and gold grades. The obtained results are promising, particularly in determining the copper grades of the Cadia East samples. More test work can further confirm the grade prediction capability of bucket-mounted XRF sensors. As XRF sensing is a surface analysis technique where only the outermost layer of the sample is analyzed, future tests should be performed with drawpoint samples, which typically have a coarser size distribution than the samples used in this work. Future tests should aim to determine whether accurate grade measurements can still be achieved when scaling up from laboratory testing to operational predictions. In addition, future test work should also address the challenges of employing grade-measuring sensor technologies in an underground mining environment, where varying amounts of moisture, dust, and heat are prevalent.

Author Contributions

Conceptualization, M.C.C. and B.K.; methodology, M.C.C. and G.L.; software, M.C.C.; validation, M.C.C.; formal analysis, M.C.C., M.H. and A.W.; investigation, M.C.C., G.L., M.H. and A.W.; resources, B.K., W.F., M.H. and A.W.; Data curation, M.C.C.; writing—original draft, M.C.C.; writing—review and editing, M.C.C., B.K., G.L., W.F., M.H. and A.W.; visualization, M.C.C.; supervision, B.K. and M.H.; project administration, B.K. and W.F.; funding acquisition, B.K. All authors have read and agreed to the published version of the manuscript.

Funding

This work was supported by the Center for Innovation in Mineral Resource Engineering (CIMRE), the International Caving Research Network (ICaRN) and Mitacs (IT12768).

Data Availability Statement

Not applicable.

Acknowledgments

The authors would like to thank Newcrest Mining Limited for providing the samples and data used in this research project.

Conflicts of Interest

The authors declare no conflict of interest.

References

  1. Laubscher, D.H. Cave mining–the state of the art. J. South. Afr. Inst. Min. Metall. 1994, 94, 279–293. [Google Scholar]
  2. Brown, E.T. Block Caving Geomechanics, Brisbane: Julius Kruttschnitt Mineral Research Centre; The University of Queensland: Brisbane, QLD, Australia, 2003. [Google Scholar]
  3. Chitombo, G. Cave mining: 16 years after Laubscher’s 1994 paper ‘Cave mining–state of the art’. Min. Technol. 2010, 119, 132–141. [Google Scholar] [CrossRef]
  4. Moss, A.; Klein, B.; Nadolski, S. Cave to mill: Improving value of caving operations. In Proceedings of the Caving 2018: Proceedings of the Fourth International symposium on Block and Sublevel Caving, Vancouver, BC, Canada, 15–17 October 2018. [Google Scholar]
  5. Nadolski, S.; Klein, B.; Elmo, D.; Scoble, M.; Liu, Y.; Scholar, J. Investigation into the Implementation of Sensor-based Ore Sorting Systems at a Block Caving Operation. In Proceedings of the Seventh International Conference & Exhibition on Mass Mining, Sydney, NSW, Australia, 9–11 May 2016. [Google Scholar]
  6. Nadolski, S. Cave-to-mill: Mine and mill integration for block cave mines. Ph.D. Thesis, University of British Columbia, Vancouver, BC, Canada, 2018. [Google Scholar]
  7. Brunton, I.; Lett, J.L.; Thornhill, T. Fragmentation Prediction and Assessment at the Ridgeway Deeps and Cadia East Cave Operations. In Proceedings of the Seventh International Conference & Exhibition on Mass Mining, Sydney, NSW, Australia, 9–11 May 2016. [Google Scholar]
  8. Diering, T.; Richter, O.; Villa, D. Block cave production scheduling using PCBC. In Proceedings of the SME Annual Meeting, Phoenix, AZ, Australia, 28 February–3 March 2010. [Google Scholar]
  9. Ross, I.T. Sampling in Block Cave Mines. In Proceedings of the Sampling Conference, Perth, WA, Australia, 21–22 August 2012. [Google Scholar]
  10. Cetin, M.C.; Klein, B.; Li, G.; Fucther, W. Tracking grade heterogeneity in a panel cave mine: A reconciliation study from an ore sorting perspective. 2023; submitted for publication. [Google Scholar]
  11. Haest, M.; Hume, K.; Bradshaw, M.; Lang, H.; Faraj, F.; Pal, M. ShovelSense measuring grade at bucket resolution-the new tool in the mine geologist toolbox. In Proceedings of the International Mining Geology Conference, Brisbane, QLD, Australia, 22–23 March 2022. [Google Scholar]
  12. Lang, H.; Botha, R.; Hume, K.; Sandler, S.; Haest, M. MineSense technology empowering bucket resolution Mine to Mill reconciliation. In Proceedings of the International Mining Geology Conference, Brisbane, QLD, Australia, 22–23 March 2022. [Google Scholar]
  13. Gleeson, K.; Newcombe, G.; Griffin, P.; Stephenson, P. Cadia Operations New South Wales, Australia NI 43–101; Technical Report; Newcrest Mining Limited: Melbourne, VIC, Australia, 2020. [Google Scholar]
  14. Duffy, K.; Valery, W.; Jankovic, A.; Holtham, P.; Valle, R. In search of the Holy Grail-bulk ore sorting. In Proceedings of the Austmine 2015-Transforming Mining, Technology and Innovation, Brisbane, QLD, Australia, 19–20 May 2015. [Google Scholar]
  15. Cetin, M.C.; Li, G.; Klein, B.; Futcher, W. Key factors determining the bulk ore sorting potential in a caving mine. 2023; submitted for publication. [Google Scholar]
  16. Li, G.; Klein, B.; Sun, C.; Kou, J. Insight in ore grade heterogeneity and potential of bulk ore sorting application for block cave mining. Miner. Eng. 2021, 170, 106999. [Google Scholar] [CrossRef]
  17. Reple, A.; Chieregati, A.C.; Valery, W.; Prati, F. Bulk ore sorting cut-off estimation methodology: Phu Kham Mine case study. Miner. Eng. 2020, 149, 105498. [Google Scholar] [CrossRef]
  18. Schofield, N.A.; Moore, J.; Carswell, J.T. Mine to Mill Reconciliation-Three Case Studies. In Proceedings of the International Mine Management Conference, Melbourne, VIC, Australia, 20–21 November 2012. [Google Scholar]
  19. Li, G.; Klein, B.; Sun, C.; Kou, J. Lab-scale error analysis on X-ray fluorecence sensing for bulk ore sorting. Miner. Eng. 2021, 164, 106812. [Google Scholar] [CrossRef]
Figure 1. Amenability testing machine (ATM): (a) Idle; (b) Post-run. Sample drum is loaded, elevated, and dumped into hopper and receiving drum. During rock flow, XRF spectra are collected and processed to yield a single composite spectrum per run.
Minerals 13 00672 g001
Figure 2. Distribution of relative difference between weekly drawpoint sample grades vs. PCBC’s grade predictions from August 2018 to May 2019: (a) Copper; (b) Gold.
Minerals 13 00672 g002
Figure 3. Change in monthly relative differences between mine (measured and predicted) and mill feed grades from August 2018 to May 2019: (a) Copper; (b) Gold.
Minerals 13 00672 g003
Figure 4. NSR map of PC2-East in case of bulk ore sorting application underground (plan view).
Minerals 13 00672 g004
Figure 5. Results of ATM-XRF sensor tests: (a) Comparison of average Cu K-α counts measured by ATM’s XRF sensor and copper grades of samples determined by ICP; (b) Distribution of copper grade measurements for each sample (SD: standard deviation % Cu).
Minerals 13 00672 g005
Figure 6. Comparison of copper grade predictions for samples from Cadia East and various copper porphyry deposits.
Minerals 13 00672 g006
Figure 7. Gold grades of bulk samples predicted using spectral information collected by ATM’s XRF sensor and gold grades determined by fire assaying.
Minerals 13 00672 g007
Table 1. Statistics of Cadia East’s sampling program between August 2018 and May 2019.
Panel CaveNumber of DrawpointsNumber of Drawpoint SamplesMean Sampling Frequency per Drawpoint (Tonnes)
PC11442497871
PC2-West13641692512
PC2-East18255221730
Total46212,188
Table 2. Variables and objectives of relative difference calculations.
Data EmployedVariablesObjective
PCBC and drawpoint sample grades x : PCBC grades
x reference : Drawpoint sample grades
Assessing the performances of drawpoint sampling and PCBC grade predictions relative to each other
Drawpoint sample and mill grades x : Drawpoint sample grades
x reference : Mill grades
Assessing the performance of drawpoint sampling in predicting the mill feed grades
PCBC and mill grades x : PCBC grades
x reference : Mill grades
Assessing the performance of PCBC forecasts in predicting the mill feed grades
Table 3. Cost and price assumptions and mill recovery models used in NSR calculations.
AssumptionsUnitwith Bulk Ore Sortingwithout Bulk Ore Sorting
ConcentrateReject
CostMining costUS$/t4.884.884.88
Processing costUS$/t7.3507.35
Tailings management costUS$/t0.600.6
General and administration costUS$/t2.142.142.14
Sorting costUS$/t0.40.40
Total15.377.4214.97
PriceAuUS$/oz1300
CuUS$/lb3.4
Plant recovery modelsMetalCaveModel
AuPC2-East Recovery   ( % ) = 79.76 + 3.52 ln ( Au )
Cave A Recovery   ( % ) = 80.65 + 2.88 ln ( Au )
Cave B Recovery   ( % ) = 79.76 + 3.52 ln ( Au )
CuPC2-East Recovery   ( % ) = 50.64 Cu 2 + 47.91 Cu + 76.27
Cave A Recovery   ( % ) = 91.06 + 2.02 ln ( Cu )
Cave B Recovery   ( % ) = 112.6 + 17 ln ( Cu ) 23.4 ( Cu )
Table 4. Copper and gold grades of the Cadia East bulk samples.
Operating CaveMonth of CollectionCu (%)Au (g/t)
PC2-WestJuly 20200.360.59
PC2-EastOctober 20200.430.99
PC2-WestNovember 20200.330.67
PC2-EastFebruary 20210.310.67
PC2-WestFebruary 20210.290.67
PC2-EastApril 20210.441.21
PC2-WestMay 20210.250.30
Table 5. A summary of hypothetical bulk ore sorting application performed underground with bucket-mounted sensors.
Panel CaveNumber of Drawpoints and Extraction Drives with Sorting PotentialSorting Cut-Off Grade (% Cu)Change in NSR when Bulk Ore Sorting Is Applied (US$/t)
PC2-East6 (2 extraction drives)0.1+0.20
Cave A2 (1 extraction drive)0.05+0.04
Cave B71 (8 extraction drives)0.1+0.77
Disclaimer/Publisher’s Note: The statements, opinions and data contained in all publications are solely those of the individual author(s) and contributor(s) and not of MDPI and/or the editor(s). MDPI and/or the editor(s) disclaim responsibility for any injury to people or property resulting from any ideas, methods, instructions or products referred to in the content.

