Review

Impact of Mining and Ore Processing on Soil, Drainage and Vegetation in the Zambian Copperbelt Mining Districts: A Review

1
Czech Geological Survey, Geologická 6, 152 00 Prague, Czech Republic
2
Department of Geology, School of Mines, University of Zambia, Lusaka P.O. Box 32379, Zambia
3
Department of Geology, Faculty of Science, Palacky University, 771 46 Olomouc, Czech Republic
4
Institute of Mineralogy, Geochemistry and Mineral Resources, Faculty of Science, Charles University, 128 43 Prague, Czech Republic
*
Author to whom correspondence should be addressed.
Minerals 2023, 13(3), 384; https://doi.org/10.3390/min13030384
Submission received: 8 February 2023 / Revised: 23 February 2023 / Accepted: 23 February 2023 / Published: 9 March 2023
(This article belongs to the Special Issue Pollution and Remediation in Mining and Metallurgical Districts)

Abstract

:
The regional environmental–geochemical surveying of the long-term impacts of mining and ore processing on a large part of the Zambian Copperbelt mining district was carried out by the Czech Research Group with cooperation of the Geology Department, University of Zambia, and the Geological Survey of Zambia in the period 2002–2018. This included the characterization of various sources of contamination, the extent of contamination of soils and crops, and the degree of contamination of river water and sediments. Solid speciation studies of potentially harmful chemical elements (PHEs), plant and human bioaccessibility studies, and a range of mineralogical techniques were used to assess the pathways of PHE cycling in terrestrial and aqueous systems and their impacts on human health. Ores of the Zambian Copperbelt mining district are mined for Cu and Co, but a number of other trace elements (Pb, As, Cd, Hg, Pb, Zn) gradually accumulated in soils and stream sediments. It was concluded that the most important problems related to ore mining and processing are the contamination of soil and crops due to dust fall out from tailing facilities and emissions from smelters. Moreover, leakages of solutions from tailing dams, insufficient technological control of their stability and breakdowns on pipelines transporting slurry from treatment plants to tailing impoundments cause contamination of water courses and deposition of metal(loids) in stream sediments. However, the contamination of the Kafue River water is relatively limited due to its high neutralization capacity. In contrast, in some Kafue River tributaries, especially those close to big mining centers, the concentrations of dissolved Cu and Co are high (up to 14,752 μg/L and 1917 μg/L) and exceed Zambian effluent limits. We also recommend measures that could contribute to minimizing the impact of ore mining and processing on the environment and the health of the local population.

1. Introduction

For decades, the mining industry has been recognized as one of the most important sources of environmental pollution [1,2,3,4]. The smelting of non-ferrous metals has a significant environmental impact via direct emissions or contaminant releases from waste disposal sites and subsequent contamination of soil, fluvial systems, and vegetation [5,6,7,8].
The cycles and fate of contaminants in these polluted environments have been studied using various approaches: concentration patterns and solid speciation [9,10,11,12], and long-term laboratory and field experimental studies [13,14,15]. Direct emissions from mining and ore processing facilities are often accompanied by toxic dust emissions and effluents from waste disposal sites of flotation tailings, waste rock and/or metallurgical slags. Wind erosion can lead to the transport of these particles by the atmosphere over a large distance, especially under semi-arid and arid conditions [16]. Apart from the atmosphere, soil and fluvial systems are the primary recipients of this contamination [17,18,19]. Dust particulates emitted from mining and smelting operations, as well as wind-eroded contaminated soils in mining districts, also have a direct impact on the quality of crops used for food production [17,18,19] and on the health status of local populations, which can potentially ingest or inhale fine dust particles [20,21,22,23,24].
The impact of mines or technological solutions on the local drainage patterns has been studied by many authors [5,7,25]. Many mine drainage waters have low pH and carry high concentrations of metals and metalloids [26,27,28,29]. It is well known that acid mine drainage (AMD) forms when mining activities expose sulfide minerals to the near-surface environment and oxygen [30,31]. The AMD causes the pollution of surface water and groundwater resources and destroys aquatic ecosystems [5,7]. Environments in less developed areas, such as in the Copperbelt Province of Zambia, are more vulnerable to mine and smelter contamination than in more developed countries. Relatively less attention has been paid to the impact of mining on the environment in the Zambian Copperbelt in the past. Environmental agenda was not a part of the integrated plans of mining and ore processing. Reclamation of spoil banks and tailings ponds was not carried out, chemistry of industrial waters was monitored only haphazardly, and environmental data were scattered throughout a wide range of mine owners. Since the late nineties, the situation has significantly improved when the state environmental agency, the Environmental Council of Zambia (ECZ), was established. As a result of regulatory reporting by companies to the ECZ and the requirement for the environmental impact assessment (EIA) before the start-up of any project [32], the state of the environment was gradually improving. Enforcing agencies, such as ECZ and the Mines Safety Department (MSD), ensure that industries will become increasingly interested in environmental issues. General data about the state of the environment in Zambia are given in the Annual Report and the State of the Environment 2000 [33], in the Zambia Environment Outlook Report [34], and in the Zambia Environmental Outlook Report [35]. The ECZ and ZEMA also collect data on the chemical composition of industrial waters discharged to watercourses. General mapping of potentially hazardous anthropogenic disposal sites on the Copperbelt has been carried out by Berlingen [36] and the strategy to reduce the impact of mining on the environment has been elaborated. The strategy for the step-by-step improvement of the environment in the Copperbelt region is based on several private companies’ reports. The most important is a large study by Roberstson and Kirsten Ltd. [37] which determined the areal extent of mine works, tailing impoundments, and spoil banks. In addition, the costs of the reclamation and remediation works were quantified. The Copperbelt Environmental Project (CEP) [38] was formulated to help the Government of the Republic of Zambia (GRZ) to address the environmental problems associated with the mining in the Copperbelt Province. It also evaluated the potential impacts of anthropogenic sediments on human health and proposed the best available reclamation and remediation strategies. In 2011, the Environmental Management Act [39], and in 2015, the Mines and Minerals Development Act were accepted by the Government of Zambia [40].
The application of the environmental data to the management system for the Copperbelt Mining Areas has been summarized in many papers [41,42,43,44,45,46,47].
However, all these reports are mostly focused on the local “hot spots” of contamination and the impacts of contamination on the environment and human health in the whole area of the Copperbelt are sparse or missing. Moreover, environmental damage, especially the contamination of soils and crops affected by a long-term contamination in the past were not considered and the data on plant and human bioaccessbility of PHEs are missing. As a result, in the period 2002–2018, the Czech Research Group conducted a regional environmental–geochemical survey of the long-term impacts of mining and ore processing on a large portion of the Zambian Copperbelt with the cooperation of the Geology Department, University of Zambia and the Geological Survey of Zambia. The main findings are summarized here and compared with the results of other authors working in the Copperbelt area in Zambia and the Democratic Republic of the Congo.

2. General Information on the Zambian Copperbelt

2.1. Population

The studied region belongs to the Zambian part of the Copperbelt Administrative Province of Zambia, which covers an area of about 31,000 km2. Compared to Zambia as a whole, the Copperbelt Province is densely populated. The Zambia 2010 census [48] showed the Copperbelt Province population to be 1.6 million, which constitutes 15% of the total Zambian population. Ndola (528,330 inhabitants) serves as the administrative center of the Copperbelt Province with other centers of Kitwe with the total population of 363,734, Chingola (216,626), and Mufulira (122,000). Other important towns are Luanshya (117,579), Chililabombwe (87,000), Kalulushi, and Chambishi.

2.2. Climate

The Zambian Copperbelt has three distinct seasons: the winter months from May to July are generally cool and dry, with a mean daily temperature of around 20 °C and rainfall below 150 mm; August to October is characterized by hot, dry conditions, with maximum temperatures around 36 °C; and the wet season is typically from November to April, when over 90% of the region’s mean annual precipitation of 1350 mm falls. The predominant wind direction is from the southeasterly quadrant (thus producing a net atmospheric contaminant plume to the north-west), with maximum speeds of about 30 m/s in the summer months and 22 m/s in the winter [49].

2.3. Geomorphology, Drainage, Soils, and Vegetation

The surface is generally undulating but dissected by the Kafue River and its tributaries. River floodplains are usually narrow but may be wider locally along the rivers. The drainage system in the Copperbelt area is controlled by the Kafue River, which runs first southeast and then south, following the Kafue Anticline. The most important sinistral tributaries of Kafue River are the Lubengele River which drains the Chililabombwe Mining District, and the Mufulira River that drains the Mufulira Mining District. Other important tributaries are the Mutupa, Mwekera, and Kamfinsa rivers. The most important dextral tributary rivers in the Chingola District are the Mushishima and its tributaries, Mwambashi and Muntimpa. The Kitwe Region is drained by several small streams (Uchi, Mindolo, Kitwe and Wusakile), the area south-west of Kitwe is drained by the Kalulushi River. Streams Itawa, Twapia, Chibolele, Kansenchi, Moshiashi, and Kafubu flow south from Ndola and merge to form the Kafubu River, which is one of the main southern tributaries of the Kafue in this area. Most tributary streams and rivers rise in headwater wetlands called dambos in Zambia.
Mendelsohn [50] groups the soils on the Zambian Copperbelt under two headings: freely drained soils, and dambo (waterlogged) soils. According to the IUSS Working Group [51], freely drained soils of the Zambian Copperbelt can be classified as Haplic Ferralsol Eutric, Haplic Plinthosol Eutric, Haplic Ferrasol Xantic, and Haplic Plinothosoil Dystric [10]. Ferrasols are red and yellow soils whose colors result from an accumulation of metal oxides, particularly iron and aluminum. According to the FAO-UNESCO classification [52], freely drained soils of the Copperbelt can be assigned to the ferrasol group (acric, orthic, or rhodic ferralsols). Ferrasols in the surveyed area are usually acid (pHKCl: 3.94–7.15), poor in organic carbon (<0.2–7.2 wt.%) and nitrogen (<0.05–1.59 wt.%), and display low values of cation exchange capacity (CEC: 0.9–12.6 mmol/100 g; [53]. Plinthosols are made up of a humus-poor mixture of kaolinite, quartz, and other constituents that irreversibly hardens to petroplinthite (hardpan) when exposed to repeated wetting and drying. The soils of the dambo-type (poorly drained soils in wetlands) are seasonally or permanently wet, with a high water table inhibiting tree growth. They contain a high proportion of swelling clays, or swelling clays produced by neoformation from rock weathering. According to the FAO-UNESCO [51] and the IUSS Working Group [52], they can be classified as Vertisols.
Soils are usually covered with Miombo and acacia woodland, shrubland, and grassland. Under canopy, there are Mupapa (Afzeia quanzensis), Mulobwa (Pterocarpus angolensis), Mubanga (Afrormosis angolensis), Musase (Albizia antunesiana), and Saninga (Faurea saligna). Tall canopy is formed mainly by Muputu (Brachystegia spiciformis) Musamba (Brachystegia boehmii), Mopane (Colophospermum mopane), and acacia [50].

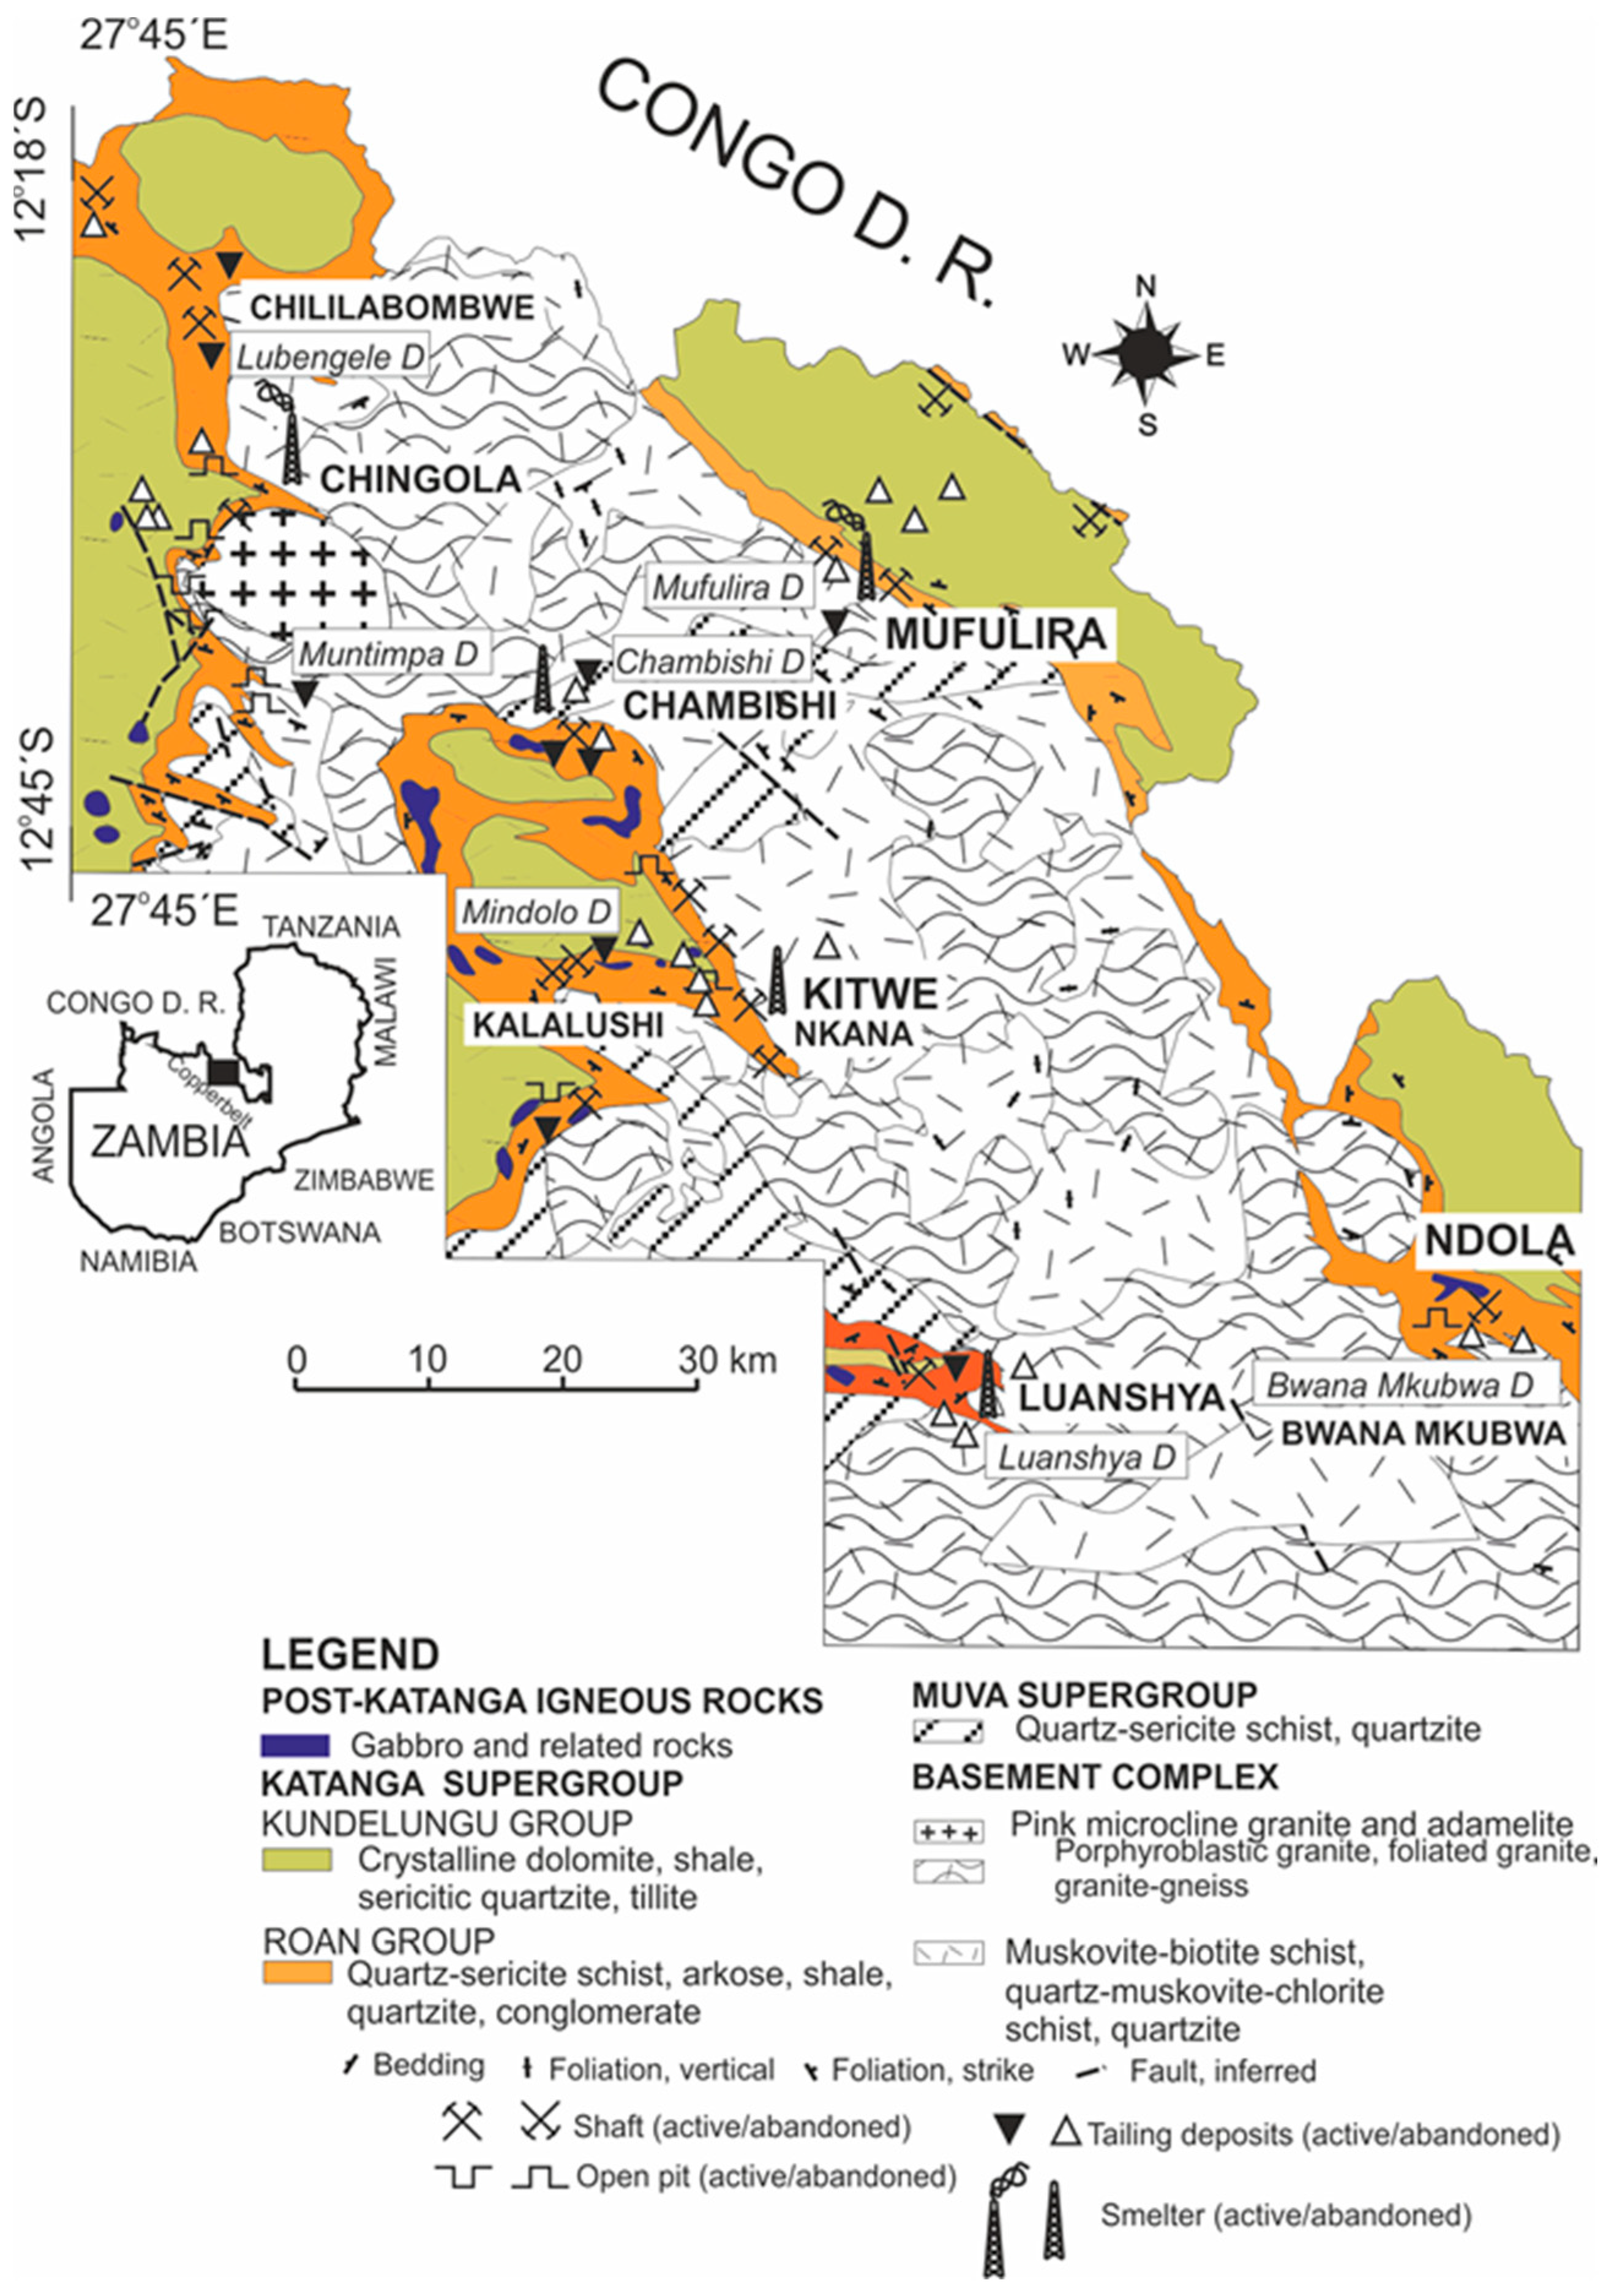
2.4. Geology and Ore Mineralization

In the Zambian Copperbelt, the oldest pre-Katanga Basement Complex consists of a Palaeoproterozoic magmatic arc sequence (Figure 1), comprising the Lufubu schists and intrusive granitoids, dated at between 1980 ± 7 and 1874 ± 8 Ma [54]. The Basement Complex is overlain unconformably by quartzites and metapelites of the Palaeproterozoic Muva Supergroup. The Nchanga pink microcline granite and adamelite is the youngest intrusion in the pre-Katanga Supergroup, and is unconformably overlain by the Neoproterozoic Katanga Supergoup, which consists of metasediments traditionally divided into the Roan Group and overlying Kundulungu Group (Figure 1) [55]. The first rift cycle of the Katanga Supergroup lasted from 880 to 820 Ma when the Roan Group was deposited [56]. After uplift, the Kundelungu Group of the Katanga Supergroup was likely deposited during the second rift basin development (765–635 Ma) [57,58,59].
Copper and cobalt mineralization is bound to the lower part of the Katanga Supergroup (the Lower Roan Formation) which comprises conglomerates, argillaceous and carbonate shale, limestone, and dolomite. Stratiform and stratbound Cu–Co deposits are dominated by pyrite (FeS2), chalcopyrite (CuFeS2), bornite (Cu5FeS4), chalcocite (Cu2S), digenite (Cu9S5), linnaeite (Co3S4), and carrolite (Cu(Co,Ni)2S4), embedded in carbonate-rich shale, argillite, or in sandstone [60]. The average ore grade is 3 wt.% for Cu and 0.18 wt.% for Co [61]. Such a large concentration of metals has prompted a number of genetic theories for the origin of the Cu and Co [56]. The genetic models include syndiagenetic, hydrothermal-epigenetic, and metamorphic variants [62].
Figure 1. Geological sketch map of the surveyed part of the Copperbelt Province in Zambia. Compiled and simplified after Garrard [63], Marjonen [61], and Mukwila [64] with the location of major sources of contamination (smelters and tailing impoundments).
Minerals 13 00384 g001

2.5. Copper and Cobalt Industry

The abundance of mineral resources has led to their exploitation in Zambia for over 100 years. At present, the sector contributes more than 70% of total export value, 10% of gross domestic product, and 28% of national revenue [65]. Significant mineral exploration started in the Zambian Copperbelt during the 1920s when the British South African Company (BSAC) offered prospecting rights to large multinational companies. This resulted in the discovery and development of Luanshya and Nkana mines (1931), Mufulira (1933), and Nchanga (1936). In 1957, Konkola Mine and Nchanga Mine were brought into production as the demand for metals rose in the post-World War II era. In 1969, the Zambian Government nationalized the industry by acquiring a 51% stake in all mining utilities and reorganized them into Nchanga Consolidated Copper Mines Limited (NCCM) and Roan Copper Mines Limited (RCM). In 1979, this stake was further increased to 60.3%. In 1982, in an attempt to redress falling production trends, NCCM and RCM were merged into the Zambia Consolidated Copper Mines Limited (ZCCM), but this did not restore productivity in the sector. In 1995, a process for the purchase of mining and ore processing facilities was initiated [66].
At present, the two biggest copper mining companies in the Copperbelt are Mopani Copper Mines (MCM) with First Quantum and Glencore providing the major investment, and Konkola Copper Mines (KCM). The KCM was purchased by Vedanta Resources (India) in 2006. Smaller companies operating in the surveyed part of the Copperbelt include Lubambe Copper Mine, Chibuluma Mines, NFC Africa Mining, CNMC Luanshya, Chambishi Copper Smelting Company, Sino-Metals, and Chambishi Metals. Ores are processed by flotation at Kitwe (the Nkana Ore Treatment Plant), Chingola, Chililabombwe, Chambishi, Chibuluma and Mufulira ore treatment plants, and for a long time were smelted and refined at the Mufulira, Chambishi, Nkana, Chingola, and Luanshya smelters. The Luanshya Smelter was decommissioned in 1999, the Nkana (Kitwe) Smelter in 2008, and a new smelter was commissioned in Chingola in the same year. The Chambishi Smelter used the submerged lance (TSL) bath technology ISASMELTMM and reprocessed old slag from the Nkana smelter [67]. The Nkana Smelter was equipped with a reverberatory furnace, Pierce-Smith convertors, and anode furnaces [68], and the Mufulira smelter with reverberatory furnaces; in 2006, the Mufulira smelting process was upgraded, when ISASMELTMM technology was commissioned [69,70]. The Chingola Smelter is equipped with the modern and cleanest Outotec Flash Smelting Technology which meets the stickiest environmental requirements [71].

3. Materials and Methods

The material and methods are described in corresponding papers and only their summaries are presented here.

3.1. Regional Environmental–Geochemical Surveying of Soils and Stream Sediments

A regional-environmental geochemical survey of soils on the Copperbelt was carried out using the methodology recommended for the regional geochemical soil mapping by the FOREGS Geochemistry Working Group [72]. A composite topsoil sample was prepared by blending individual samples into a 25 m2 dimension. At selected sampling points, composite samples of the subsurface soil were taken from a depth of 70 to 90 cm using a soil probe. The distribution of elements in the topsoil and the deeper part of the soil profile was used to assess the contamination degree of the Copperbelt region [73]. Within the projects of the Czech Geological Survey, 6978 km2 of the Copperbelt area were covered by the environmental–geochemical mapping and 973 composite samples of topsoil and 167 samples of subsurface soils were collected and analyzed [74]. Composite samples of stream sediments were taken in an irregular network, according to the distribution and character of the drainage pattern. Composite samples were prepared by blending of four individual samples collected within a 20 m long segment of the individual streams [73,74]. Altogether, 261 stream sediment samples were collected. At the same points as stream sediments, water samples were collected. For the analytical (“total”) determination of metal(loid) concentrations in soils and stream sediments, samples were leached using a solution of concentrated nitric acid (HNO3) and hydrochloric acid (HCl) in the ratio 1:9 (Aqua Regia). Trace elements were determined in the Central Analytical Laboratory of the Czech Geological Survey, and in the Geochemical Laboratory of the Faculty of Science, Charles University, Prague. The elements Be, Fe, Cd, Co, Cr, Cu, Mo, Ni, Pb, V, and Zn were analyzed using flame atomic absorption spectroscopy (FAAS), whereas As was determined by hydride-generation atomic absorption spectrometry (HGAAS), and Hg mercurimetrically. Details of analytical procedures are given in Kříbek et al. [53]. In bioavailability/bioaccessibility studies, the sequential extraction procedures, and leaching experiments, concentrations of elements were determined using inductively coupled plasma mass spectrometry (ICP-MS) in the Faculty of Sciences, Charles University. When describing the analytical methods, we refer to relevant publications. Because of the extreme variability of geogenic controls (e.g., different lithology, geochemical composition of bedrock, and different degree of weathering) and anthropogenic controls (different sources of contamination), it is very difficult to establish general background values for individual populations of elements in the Copperbelt. For the determination of the extent and intensity of contamination of surface soils and stream sediments in the Zambian Copperbelt by PHEs, calculations were undertaken using the “Coefficient of Industrial Pollution” (CIP). The CIP is an average of the concentrations of selected metals in in topsoils at individual sampling sites, divided by the median values of the same metal in surface soil of the whole region, is given as Kříbek et al. [53]:
C I P = ( A s m A s + C o m C o + H g m H g + P b m P b + Z n m Z n ) 6
where mMe is a median value of the metal concentration in the whole surveyed area. The areas with CIP values > 1 are considered as contaminated by industrial activities. The CIP reflects a higher-than-median or lower-than-median average content for the six elements of interest, selected on the basis of the chemical composition of the contamination sources [53].

3.2. Regional Environmental–Geochemical Surveying of Surface Water

Over 260 water samples from the Kafue River and its tributaries were collected between years 2004 and 2010. Analyses of major and trace elements are described in Sracek et al. [75,76]. In all streams, both filtered and unfiltered samples were collected and analyzed and differences in concentrations were attributed to the presence of colloids.

3.3. Trace Elements in Plants

To evaluate the uptake of trace elements by plants in the contaminated and non-contaminated parts of the mapped region, several agricultural plant species were sampled: cassava (Manihot esculenta Cranz, leaves and roots), sweet potato (Pomoela batatas sp., leaves, and roots), and maize (Zea mays ssp. Mays, grains). Within the projects, over 160 samples of vegetation were collected and analyzed. Sampling, digestion, and analyses of plants are described in Kříbek et al. [19]. In addition to agricultural plants, the above-ground parts of plants growing on tailing deposits an in dambos (Pteris Vittate, Cyperus alternifolius, Phragmites mauritianus and Typna domingensis) were collected and analyzed [77]. Trace elements and copper isotopic record in pine tree rings near copper smelters were studied by Mihaljevič et al. [78,79].

3.4. Bioavailability/Bioaccessibility of Contaminants

From “labile” (available) contaminant fractions in the soils, stream sediments were determined by a 1 h extraction with 0.05 mol/L ethylendiammintetraacetic acid (EDTA) according to the methodology described by Quevauviller [80]. The presumed potentially harmful element (PHE) pool using this reactant is adsorbed and organically complexed in soil [81]. Details of the analytical procedure are given by Ettler et al. [9,10,82,83]. The (human) bioaccessibility of PHEs in soils and dust samples was determined using an EPA-approved in vitro method, which employed a simulating gastric fluid containing a 0.4 M solution of glycine adjusted to pH 1.5 by HCl. The extraction in simulated lung fluid (SLF) was performed according to the experimental fluid of Twining et al. [84], with a salt solution having the pH adjusted to 7.4 ± 0.2. For details, see Ettler et al. [85].

3.5. Sequential Extraction Procedure (SEP)

Sequential extractions for soils and stream sediments were performed using the four-step BCR procedure [86]. The fraction below 2 mm was used directly for the extraction procedure. Details are given in Ettler et al. [9], and Sracek et al. [76].

3.6. Leaching Experiments on Mineral Wastes

The dusts and slags were also subjected to a 48 h pH-static leaching experiment according to EN 14,997 (2015). Moreover, these wastes were also subjected to a simple batch leaching test used in the European Union (EU) as a regulatory “compliance test”, EN 12457-2 [87] for classifying waste materials for potential landfilling [88]. The concentration of elements was determined using ICP-MS. Details are given in Vítková et al. [89,90,91], and Ettler et al. [92].

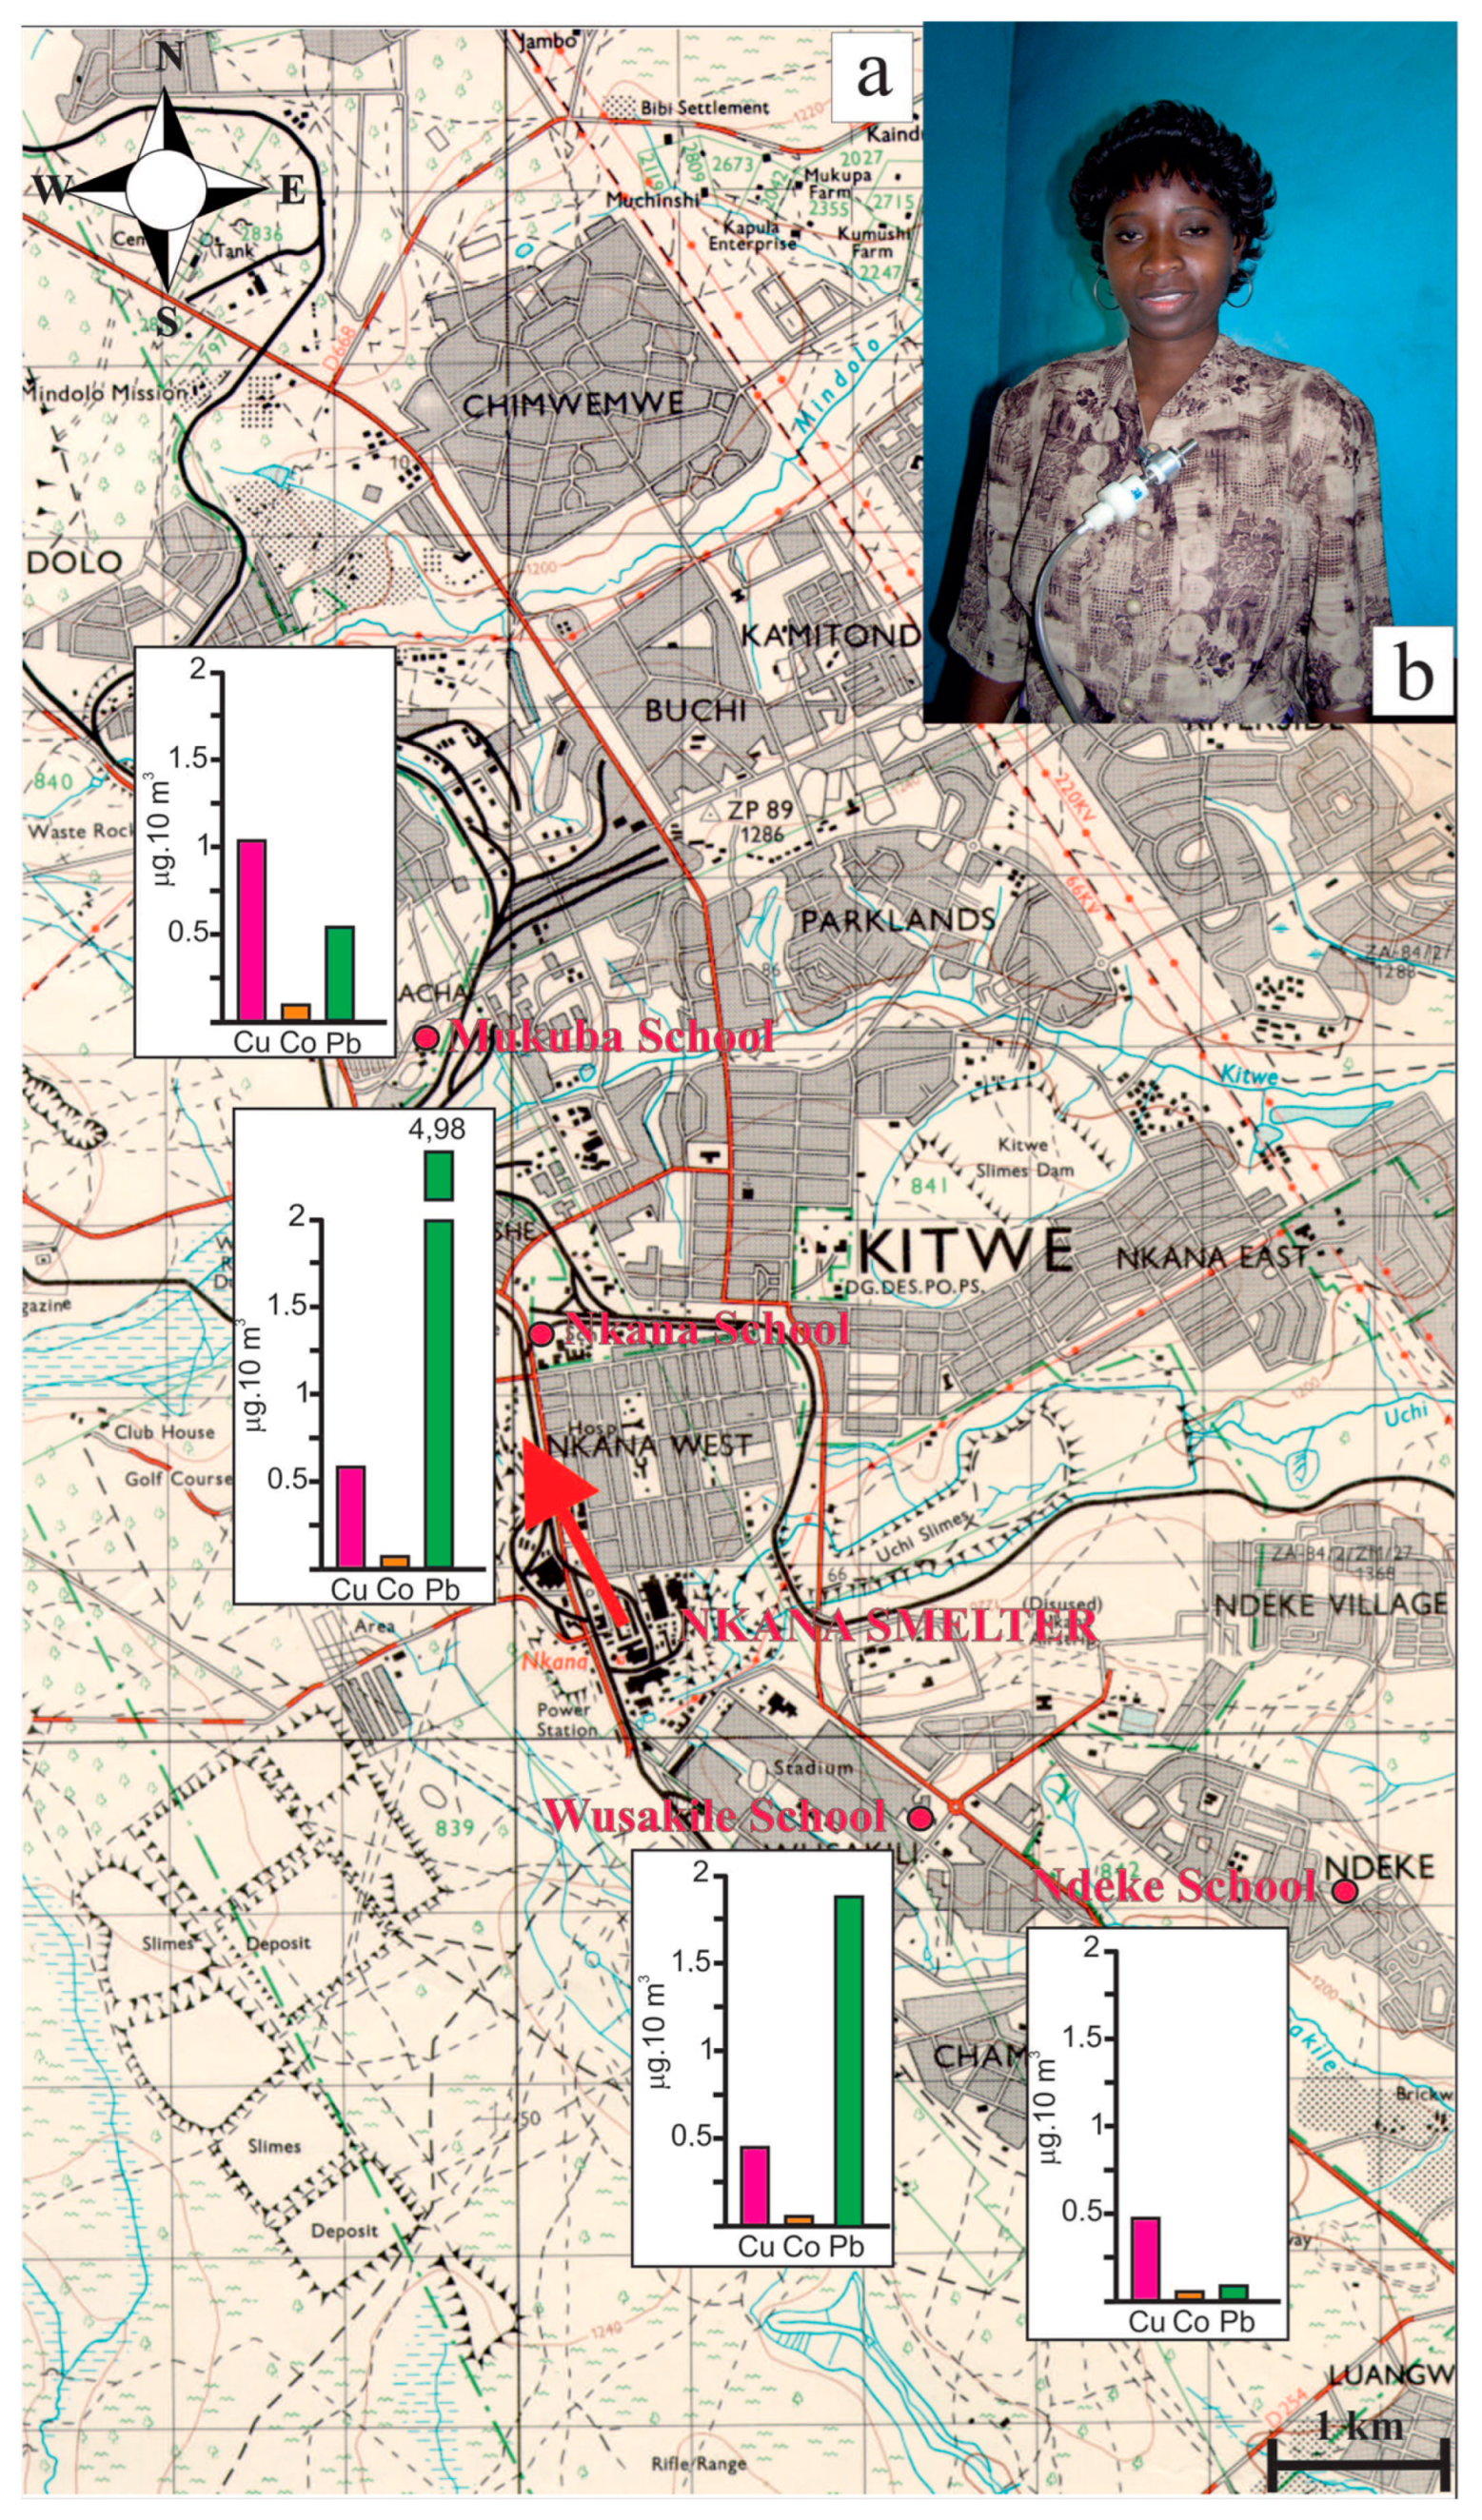
3.7. Monitoring of Sulfur Dioxide Emissions and Dust Chemical Composition

Passive diffusive samplers (PDs) were used for the monitoring of local variations in sulfur dioxide emissions in the vicinity of the Nkana Smelter in Kitwe. The PD sampling technique is based on the molecular diffusion of SO2 into impregnated filters. The Swedish Environmental Research Institute PDs were used for monitoring. The chemical composition of dust from smelters and tailing ponds were monitored using portable, low volume personal samplers (LVPs, type PV-1.7, Kubik, Czech Republic [93].

3.8. Mineralogical Studies

A wide range of mineralogical methods, including X-ray diffraction (XRD), combined with scanning microscopy (SEM) equipped with dispersive X-ray spectrometry (EDS) and micro-Raman and Mössbauer spectroscopy, were applied to identify individual inorganic phases in soils, stream sediments, slags, and in dust emitted from smelters [92,93,94].

4. Sources of Contamination

The main sources of contamination related to ore mining and processing in the Zambian part of Copperbelt are the following:
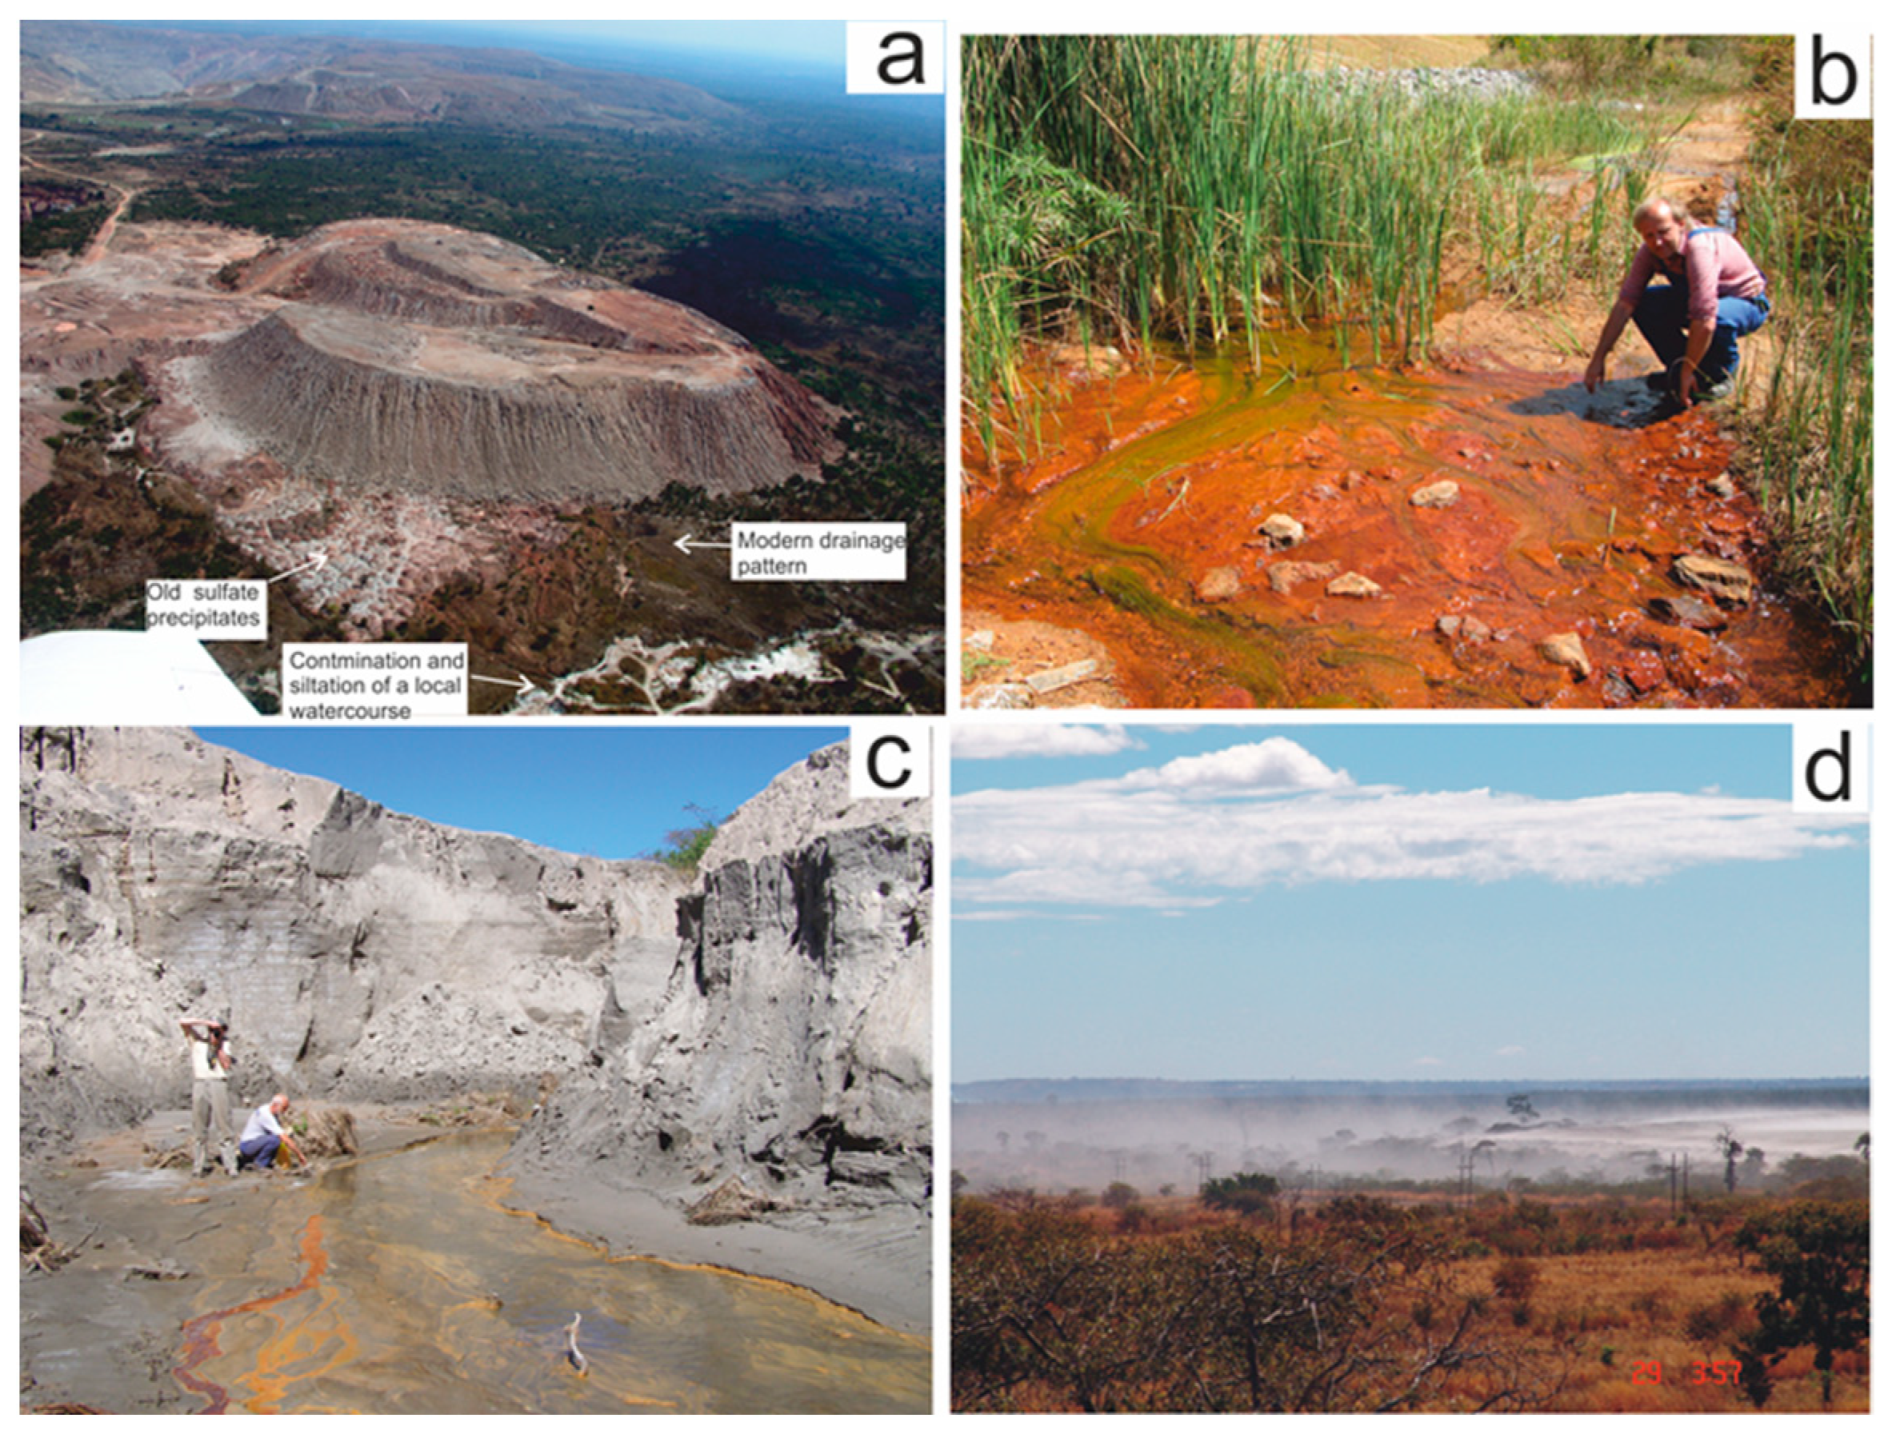
  • Mining waste rock disposal sites: Open-pit mining and to less degree underground mining generate a high tonnage of the overburden and waste rocks which are disposed of in dumps (Figure 2a). The dumps with 77 million tons cover an area of about of 388 hectares [95]. The weathering of residual pyrite in waste rocks results in the formation of gypsum (CaSO4 · 2 H2O), syngenite (K2Ca(SO4)2 · H2O), hexahydrite (MgSO4 · 6H2O, prevailing secondary mineral), picromerite (K2Mg(SO4)2 · 6H2O), bloedite (Na2Mg(SO4)2 · 4H2O), and mooreite (Mg9Zn4Mn2(SO4)2(OH)26 · 8 H2O) [93]. During rainy seasons, soluble sulfates, and fine fractions of the wastes are washed out from the waste rock deposits and deposited in watercourses [96].
  • Pipelines leakage: The flotation pulp is transported from concentrators through pipe-lines. Leakage of pipelines through which flotation pulp is transported from ore dressing plants to tailing ponds is another source of contamination. The lack of maintenance leads to frequent equipment failure (e.g., pipeline burst) and results in a discharge of transported materials [97].
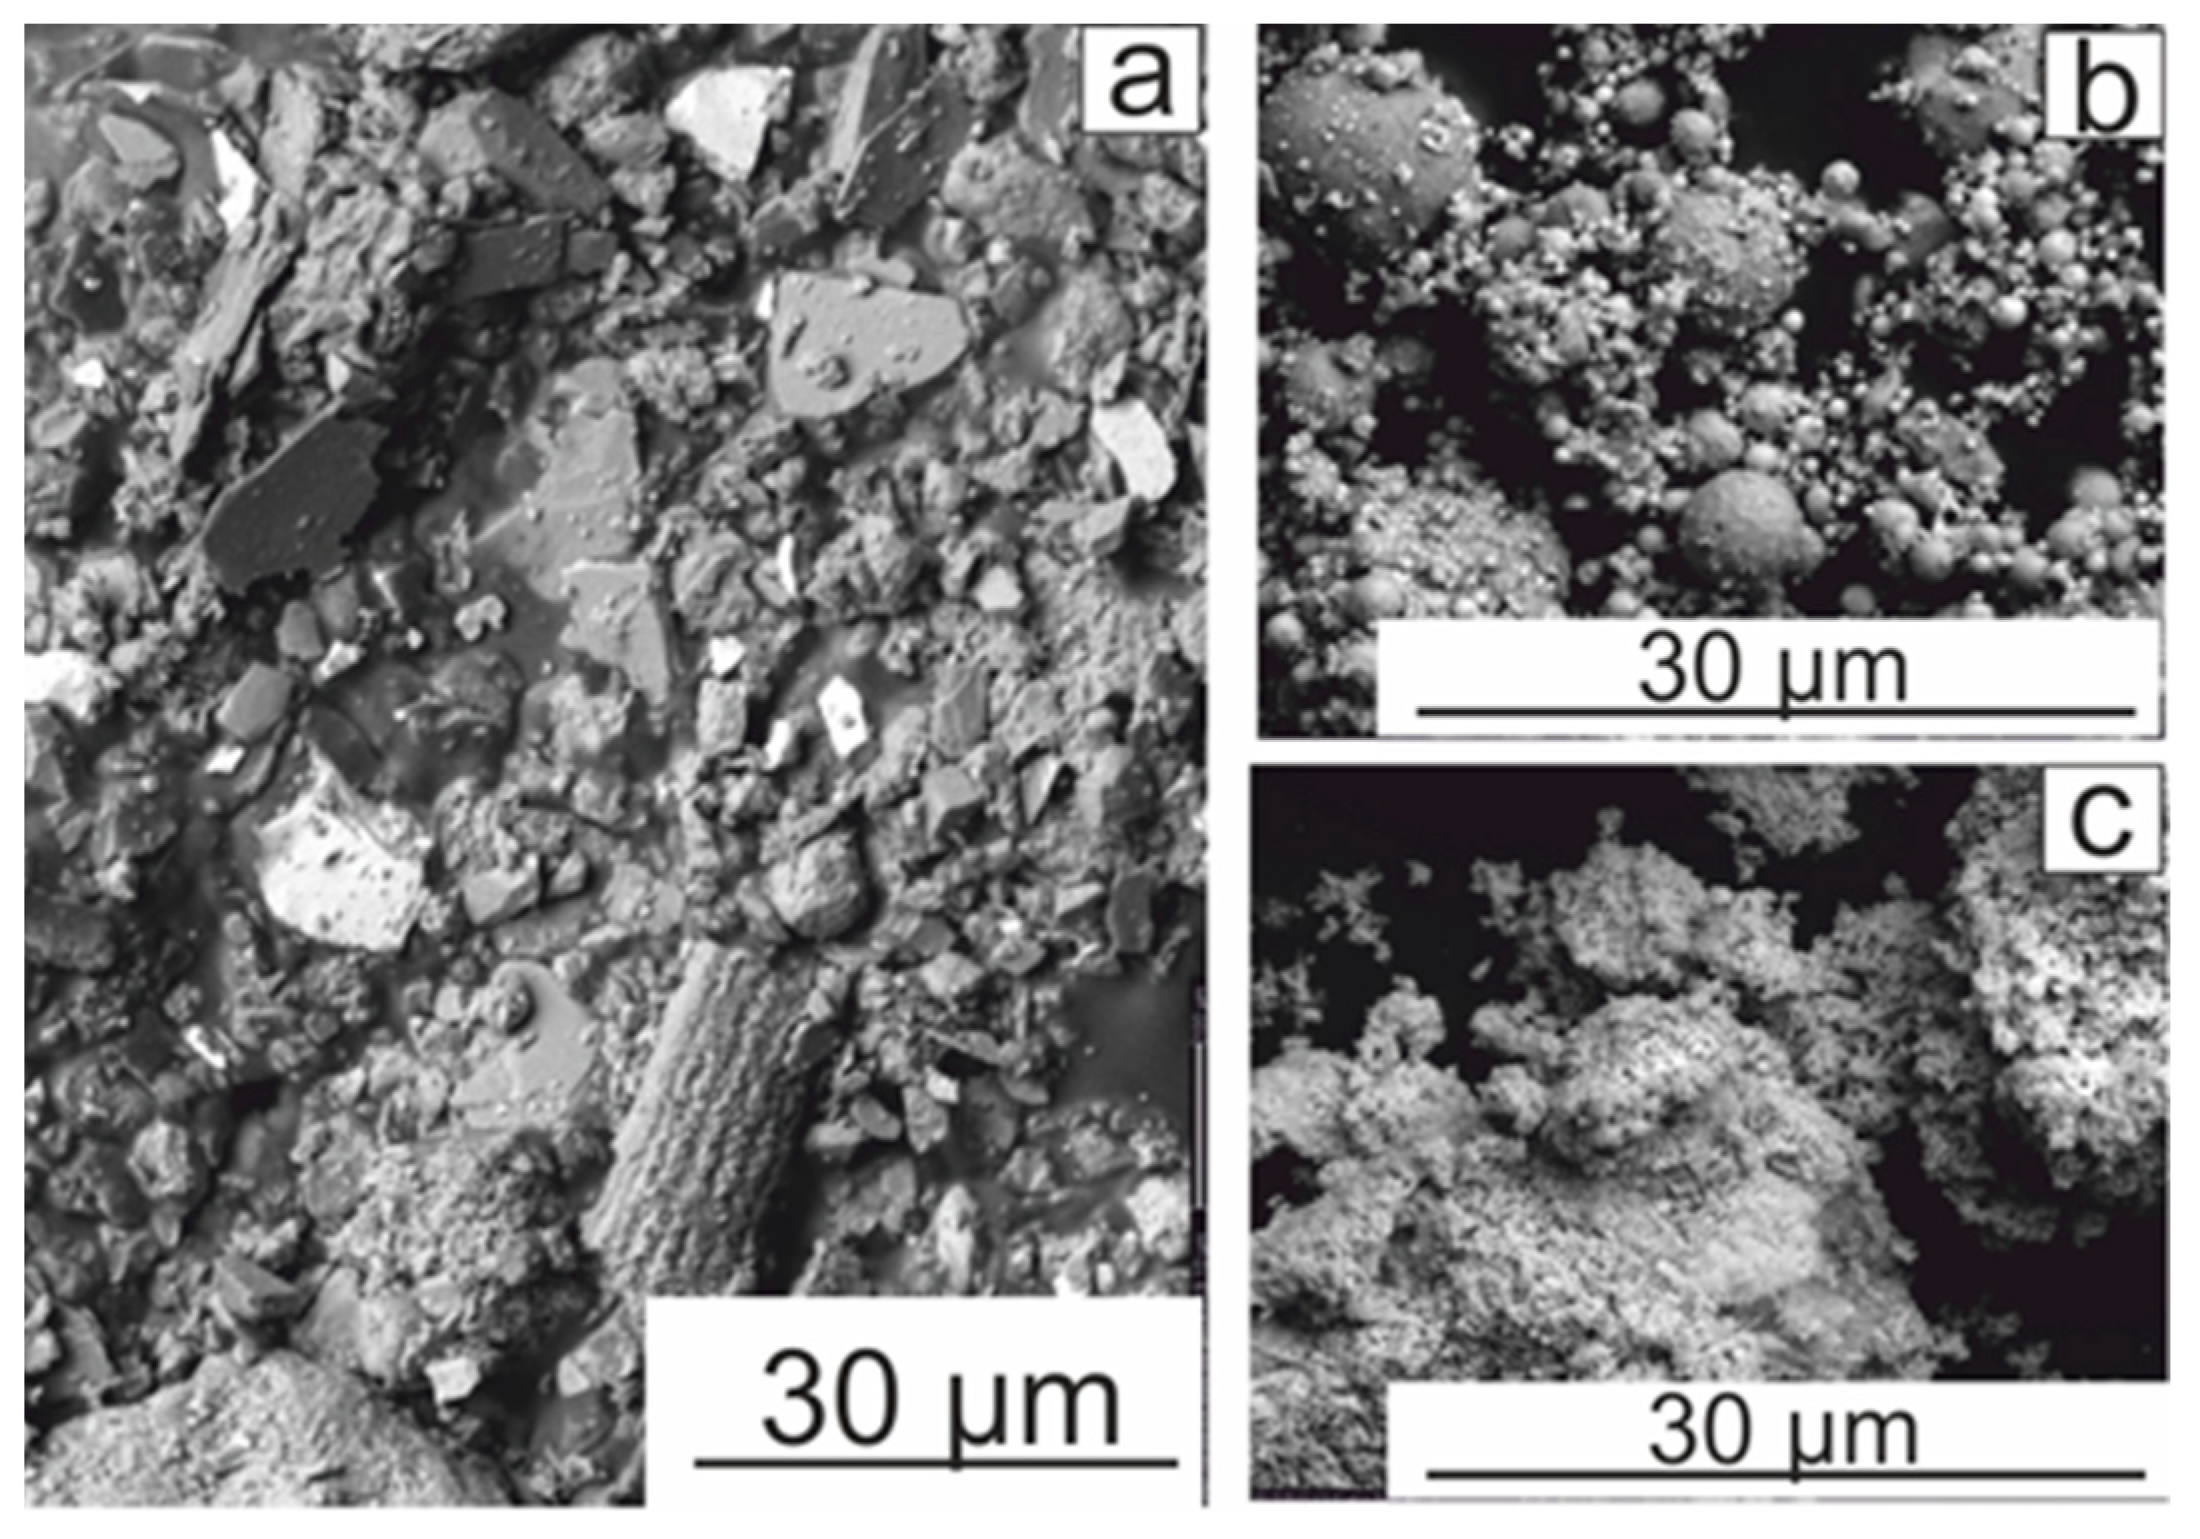
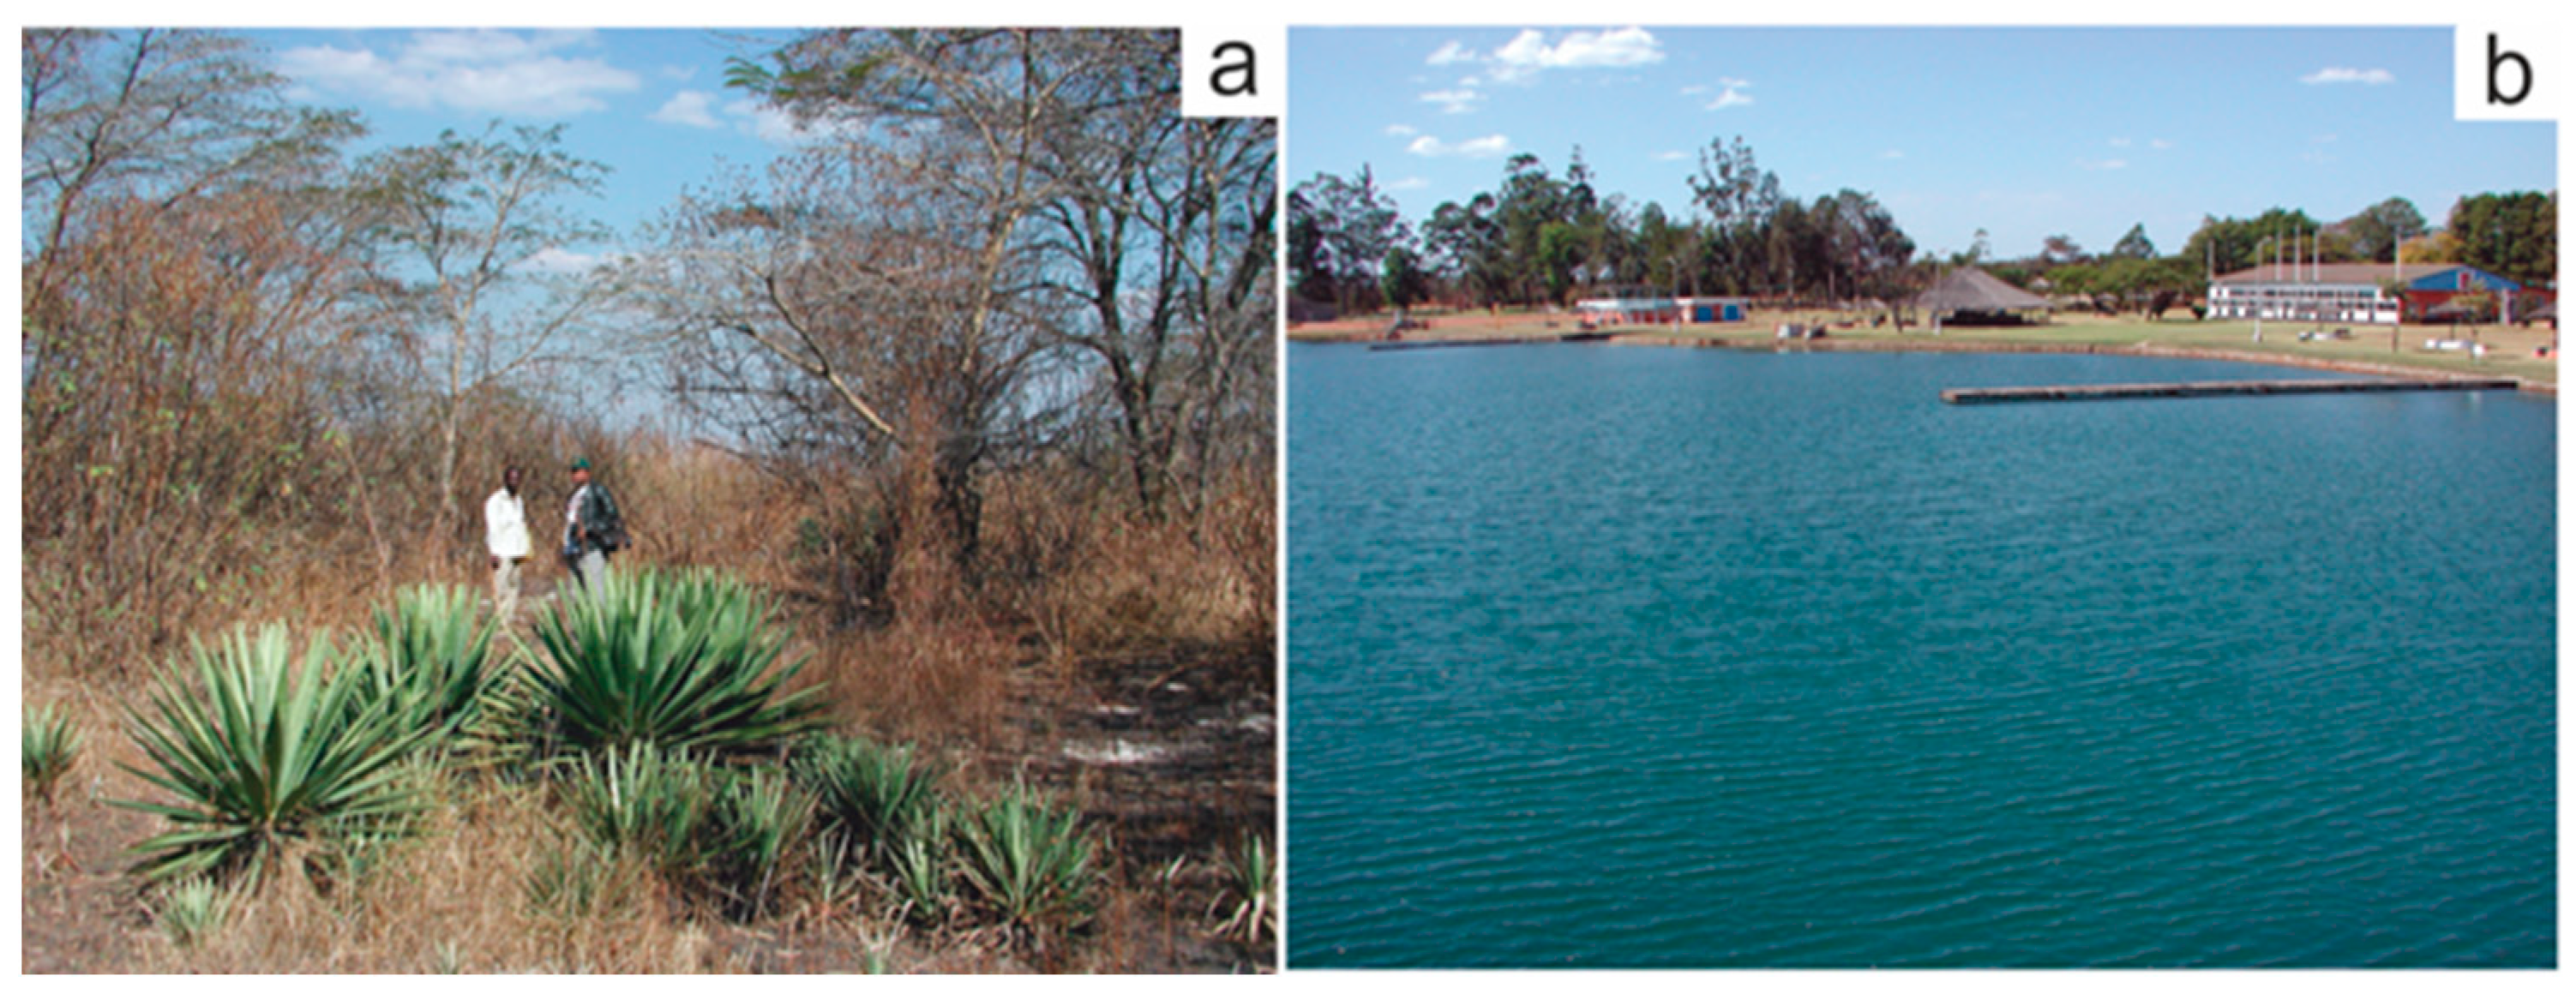
  • Flotation tailing facilities: Tailing facilities (paddock dumps and cross-valley ponds) cover the area of more than 9125 hectares [34]. The chemical composition of tailings is very variable: As, 1.99–350.7 mg/kg; Co, 95–1928 mg/kg; Cu, 2570–5510 ppm; Hg, 0.023–0.110 mg/kg; Mo, 15–525 mg/kg; Pb, 19–27 mg/kg; Zn, 63–109 mg/kg [93]. The detailed study of mine tailings was performed at two sites: (1) at the abandoned Chambishi Cross-valley tailings pond (Chambishi area); and (2) at the active Mindolo Cross-valley tailings pond (the Kitwe area) [98]. The neutralization capacity based on carbonates in tailings material at both sites remained high and resulted in neutral to alkaline conditions (paste pH up to 8.5 at Chambishi and up to 6.9 at Mindolo). Pore water at Chambishi contained 568 mg/L of Ca and 1820 μg/L of sulfate, but concentrations of Cu and Co were below 0.05 μ/L. The principal secondary minerals at both sites were gypsum, hematite, and amorphous Fe(III) phases. Secondary Fe(III) phases were present as mineral coatings or completely replaced primary sulfides (pyrite and chalcopyrite), and included large quantities of Cu and Co in surface rims. At the abandoned Chambishi Site, precipitation of secondary minerals resulted in hardpan formation at 0.6–0.9 m depth, composed mostly of gypsum and hematite. This zone also corresponded to maximum contents of Cu and Co in the solid phase. In contrast, no hardpan was found at the active Mindolo Site, where red tailings material, which included amorphous Fe(III) phases and hematite, was found only in discrete banded zones at several depth levels. Based on geochemical modeling of the Mindolo Site samples, precipitation of secondary Cu phases such as brochantite and malachite was possible in the zone of evaporation enrichment close to the mine tailings surface [99]. At both sites, there does not seem to be a threat of acid mine drainage formation in foreseeable future. Furthermore, the Cu and Co incorporated in hematite seems to be immobilized within the mine tailings [100]. However, it should be noted that old dams of cross-valley tailings ponds are leaking, which leads to discharge of tailings water and precipitates rich in iron, which are encrusting the aqueous vegetation (Figure 2b). At the abandoned Chambishi Tailings Dam, the iron rich precipitates contain from 25 to 40 wt.% Fe2O3 and a range of trace elements: up to 350 mg/kg As, 1930 mg/kg Co, 2570 mg/kg Cu, 26 mg/kg Mo, 270 mg/kg Se, and 109 mg/kg Zn [96]. Spillage from the Luanshya Paddock tailings site (Ndola area) contains up to 1514 mg/kg Cu, 235 mg/kg Co, 39 mg/kg Pb, and 2.45 mg/kg As, but most contaminants are attenuated in the local wetland [100]. At many sites, due to insufficient maintenance, the collapse of flotation tailing dams results in a massive siltation of the local watercourse (Figure 2c). Although there is no threat of acid mine drainage formation, dust from dry beaches of abandoned or active tailings ponds is blown away by winds causing contamination of farmlands (Figure 2d). Dust particles collected from leaves of vegetation growing close to the Mindolo Talings Pond contains 2.22–2.86 mg/kg As, 200–300 mg/kg Co, 1250–1520 mg/kg Cu, and 10–230 mg/kg Zn. Contents of Stot (in the form of sulfate) range from 0.64 to 0.65 wt.%, and contents of carbonate (Ccarb) from 2.85 to 2.95 wt.% [97]. The uptake of metals by consumable crops and other plants grown in proximity to tailing dams has also been reported. Communities around the Luano Tailings Dam (NFC Africa Mining Plc) grow vegetables up to 50 m from the tailings. Metals absorbed by plants could present a potential contamination of a food chain [101].
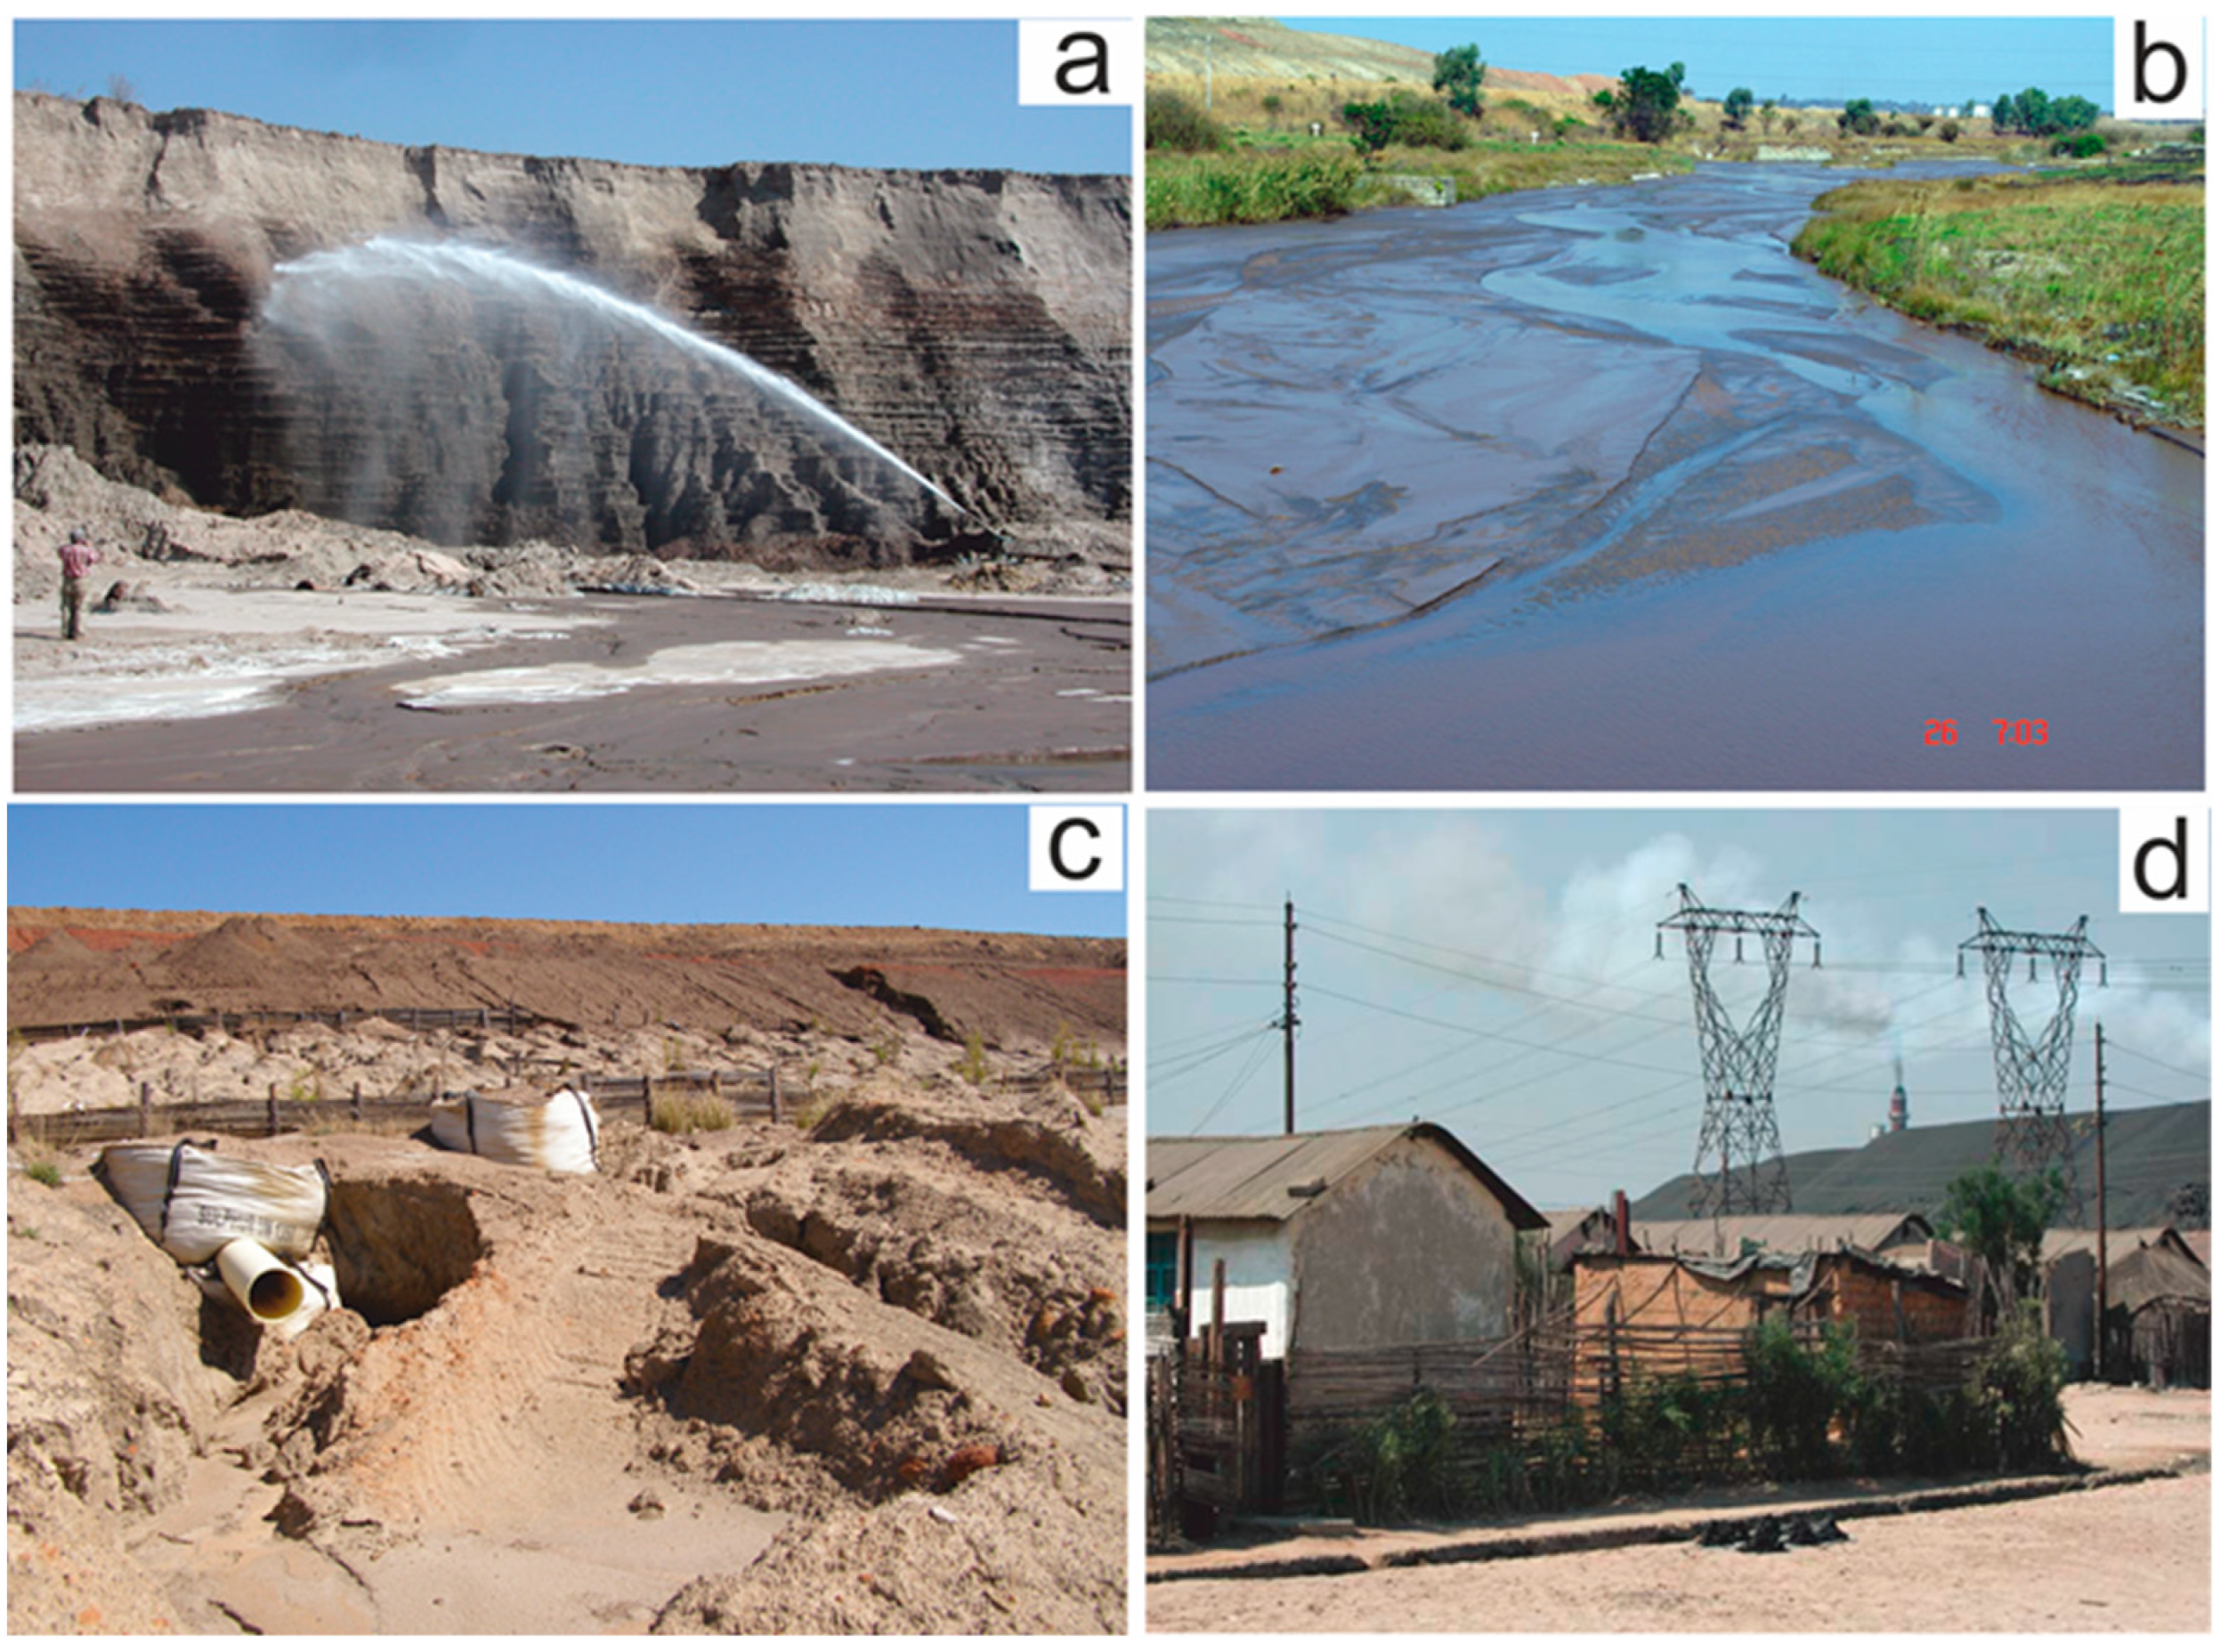
  • Reprocessing of old flotation tailing sites: A part of old flotation tailings rich in Cu in the Chingola Township is reprocessed in the local tailing leach plant (Figure 3a). Hydraulic disintegration of old flotation tailings is associated with overflows of the tailing suspensions to the Mushishima and Chingola rivers (tributaries of the Kafue River) due to the insufficient capacity and low maintenance of the local control dam (Figure 3b). The released tailing suspensions contain up to 1600 mg/kg Cu, 450 mg/kg Co, 14.7 mg/kg As, 12 mg/kg Pb, and also elevated concentrations of Bi, Cd, Hg, and Zn [102]. Because the Kafue River water is in the Chingola Towhship is used for the production of drinking water, the cost of water purification is high and the water mains are often clogged with sediment [45,103];
  • Dumped wastes after chemical leaching: Dumped wastes after chemical leaching plant from the Bwana Mkubwa (the Ndola area) are stored in large tailings ponds. Surface materials collected from the dam of the chemical leaching plant contains on average of 2483 mg/kg Co, 321 mg/kg Ni, 22.6 mg/kg Cu, 637 mg/kg Zn, and 38.1 wt.% Stot [53]. Water collected in the Bwana Mkubwa Waste Pond in the year 2009 was acid (pH = 4.10) and displayed very high values of conductivity (5580 μS/m). The average concentration of SO4 was 7378 mg/L [53]. The Bwana Mkubwa Chemical Waste ponds are made of earth and waste rock from the decommissioned local mine. The dams suffer from erosion and their stability is endangered (Figure 3c). Washing out the dam material can be seen on a distance of a few hundreds of meters towards the populated valley of the Little Mukulungwe River.
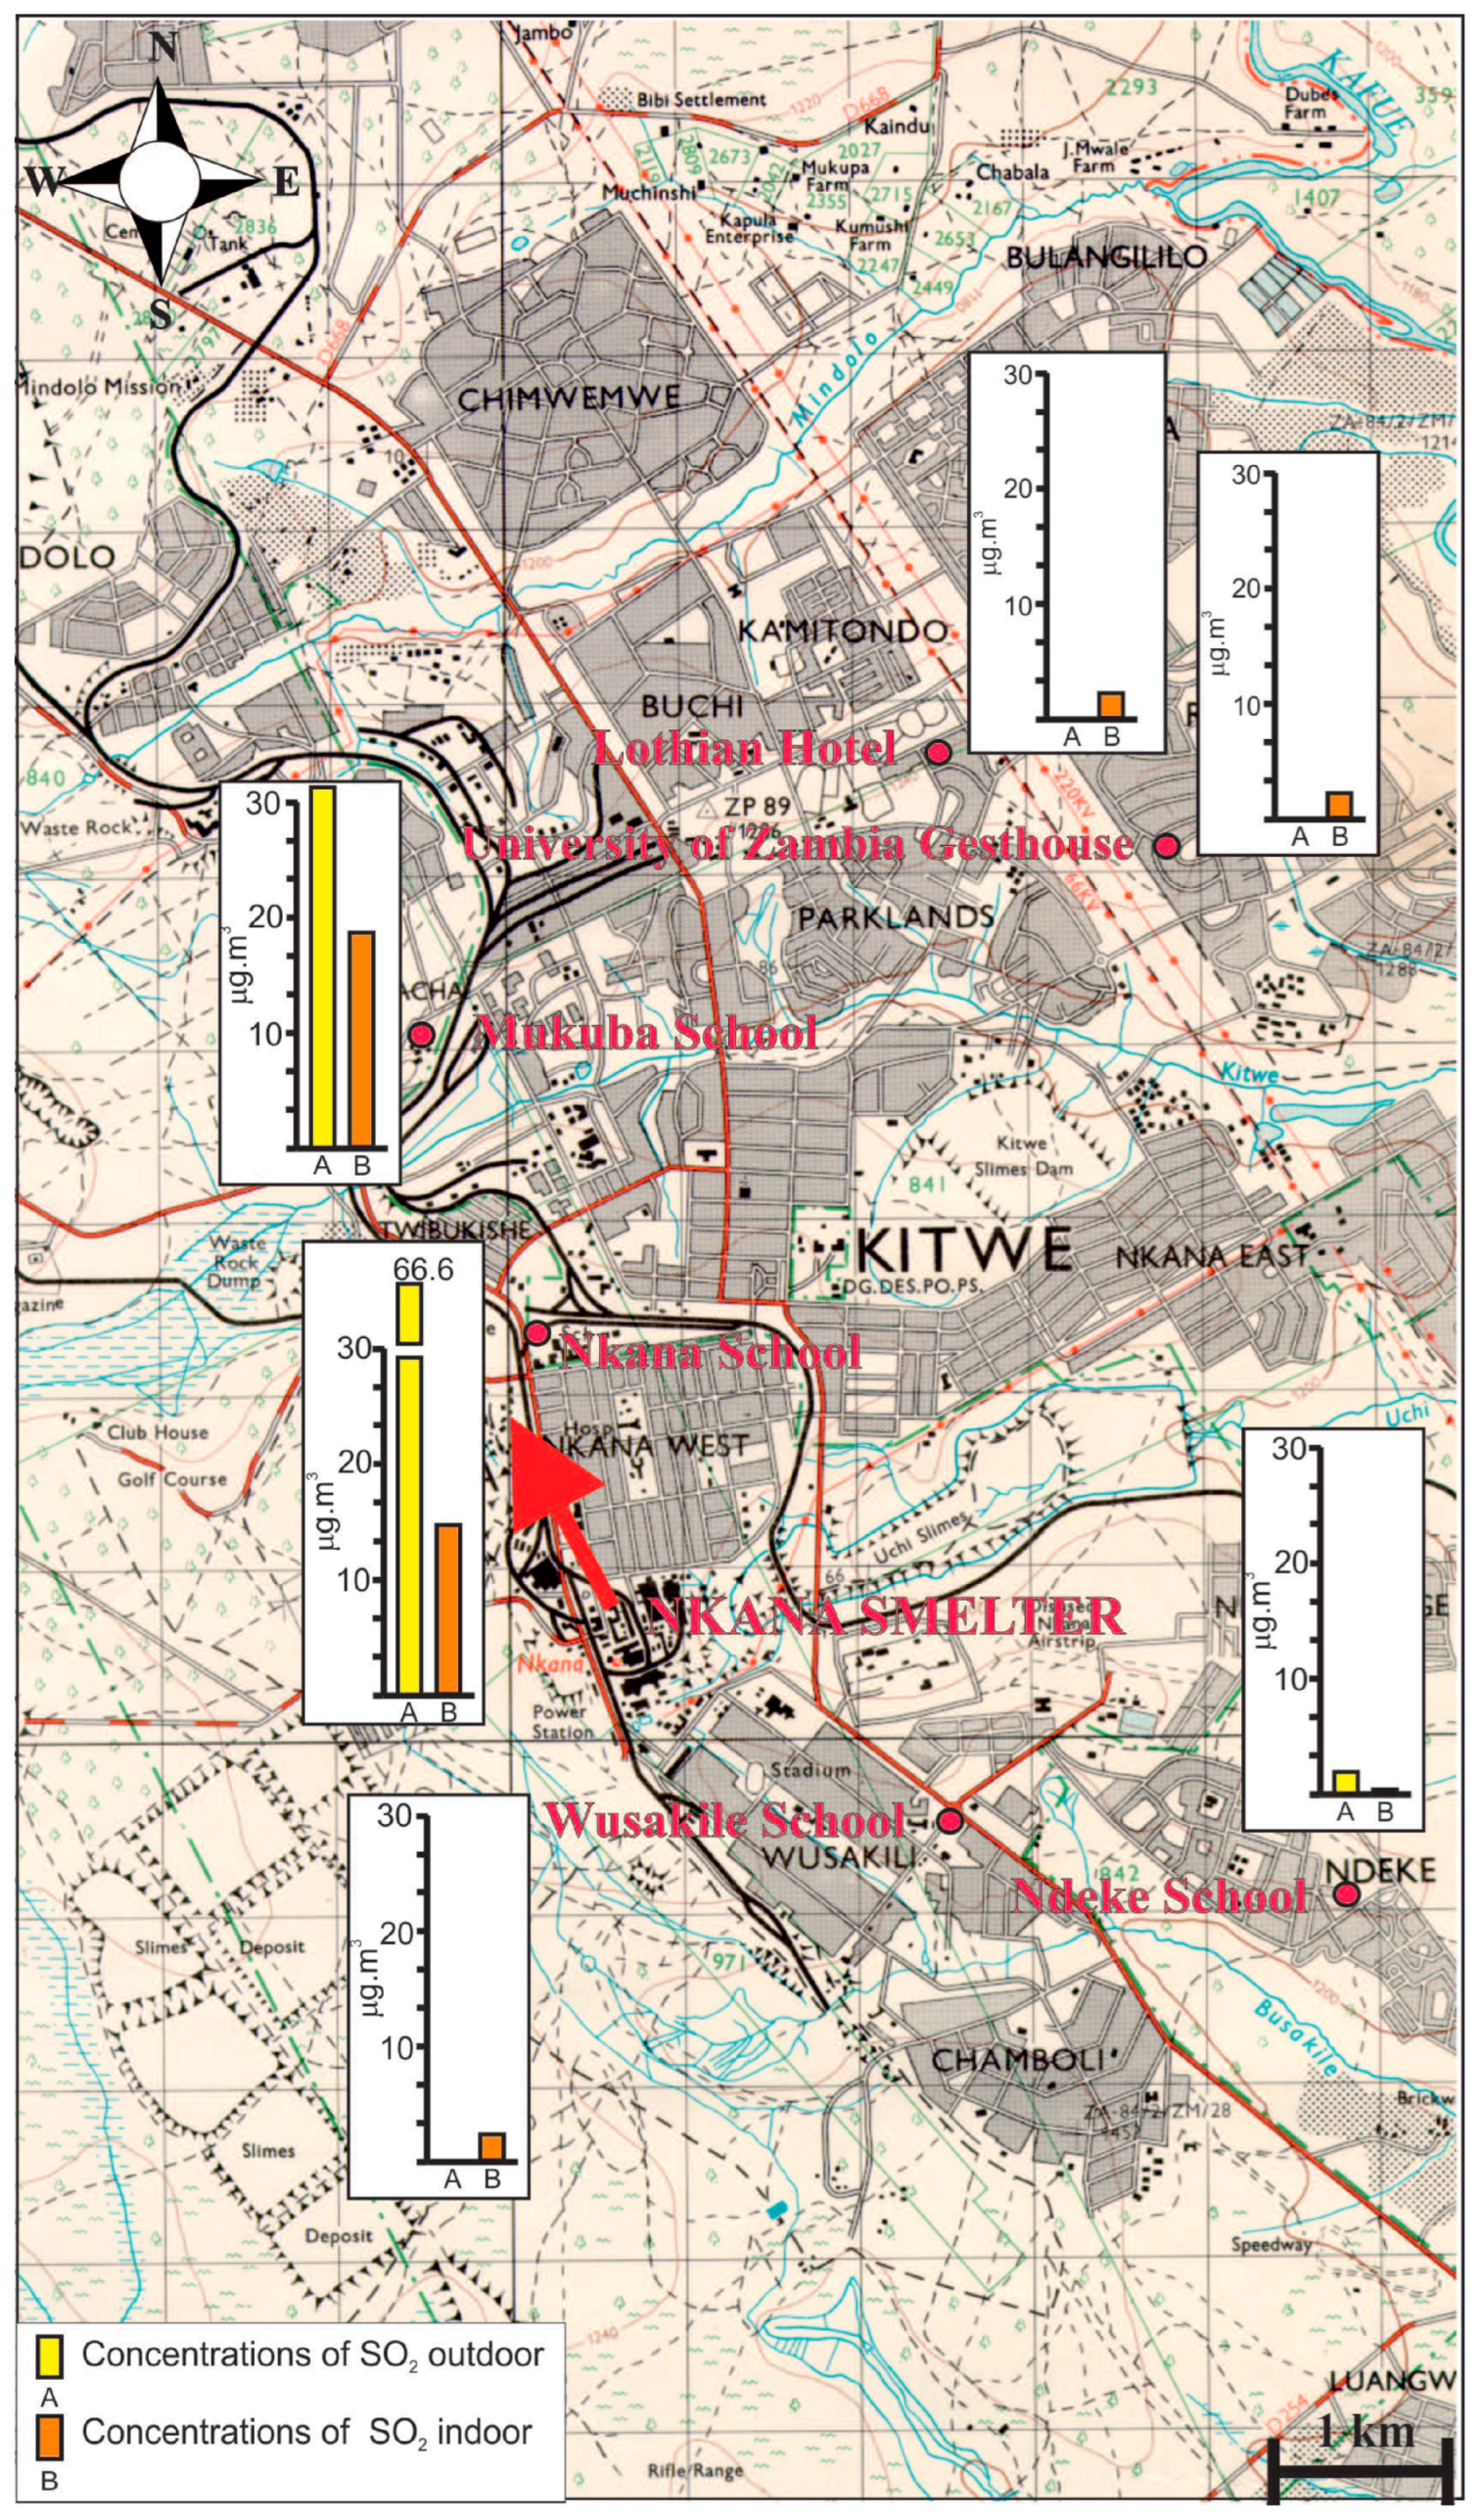
  • Gaseous and particulate emissions from smelters: Gaseous and particulate emissions from smelters are the most important sources of contamination in the Zambian Copperbelt, especially in the past. Emissions of SO2 from smelters in nearby residential areas contained on average up to 70 µg/m3 annually [43]. Emissions of sulfur dioxides from the Copperbelt smelters ranged from between 300,000 and 700,000 tons per year in the past [104]. However, smelters operation in the Copperbelt have undergone several process and infrastructure upgrades and expansions, such as the replacement of the old electric furnace with an ISASmelt furnace and matte electric settling furnace (MSEF), which have resulted in significant operational transformations over the past decades [69]. The average annual atmospheric sulfur dioxide level for the years 2017/2018 was 144.5 μg/m3 in the Kankoyo Township in Mufulira in the vicinity of the Mufulira Smelter, which is 15.6% above the statutory limit of 125 μg/m3 per 24 h in ambient air [43,104]. The heritage of the ore smelting in the past resulted in the acidification of soil around smelters [105] and caused the gradual deforestation of the emission affected areas. For example, gardening in the immediate vicinity of smelters in Wusakile (Kitwe) and Kanokoyo (Mufulira, Figure 3d) is not possible due to high SO2 loads.
Short-term monitoring of the atmospheric SO2 concentrations, using passive samplers, was performed around the Nkana Smelter (now decommissioned) in the Kitwe Township in the year 2005 [93]. The highest SO2 concentrations were found downwind, i.e., 2.1 km NW of the smelter, in the townships of Nkana High School. Here, the amounts of SO2 attained were up to 66.2 μg/m3 outdoors, and up to 19.5 μg/m3 indoors, in the classroom of the Nkana High School. The background values from the Kitwe area not affected by dust fallout from the smelter varied between 2.1 and 2.3 μg/m3 (Figure 4). Together with SO2 concentration, the amount and chemical composition of particulate matter (PM) was studied around the Nkana Smelter using dust samplers [93]. The results of the chemical composition of the dust captured by the personal dust sampler filters are indicated at Figure 5 and in Table 1. The highest average contents of copper and cobalt in PM were recorded in the schools lying northwest of the Cu and Co processing Nkana Smelter, i.e., in the downwind direction (the Mukuba High School, 0.108 μg/m3 Cu, 0.008 μg/m3 Co; the Nkana High School, 0.059 μg/m3 Cu, 0.006 μg/m3 Co of ambient air). In the Ndeke High School, located 4.2 km upwind of the Nkana Smelter, the Cu and Co contents were lower (Table 1). Lead exhibits interesting area distribution (Figure 5). The average concentration of Pb is by far the highest in the immediate neighborhood of the metallurgical plant in the Nkana High School (0.498 μg/m3 of air). However, surprisingly, high average concentrations of lead were also found in the dust sampled in the Wusakile Primary School (0.187 μg/m3, Figure 5). This school lies in the upwind direction of the prevailing winds, i.e., south-east of the metallurgical plant; however, it is in the immediate neighborhood of the highway that connects the city of Kitwe to the city of Ndola. In our opinion, this is a case of atmospheric pollution from the combustion products of leaded gasoline. This is supported by the fact that the average content of Pb in the dust in the remote Ndeke High School, which lies outside the main road, is very low (0.019 μg/m3 Pb).
  • Pyrometallurgical slags: Approximately 40 million tons of pyrometallurgical slags are deposited at nine slag dumps occupying 279 ha in the Zambian Copperbelt. Slags from the Nkana, Mufulira, Chambishi and Luanshya Cu–Co smelters) were studied from mineralogical and chemical points of view [106]. Slags are predominantly composed of olivine, clinopyroxene, silicate glass, and spinel-family oxides. Copper-(Fe) sulfides, cobaltpentlandite (Co,Fe)9S8, Fe sulfides, and metallic Cu prills embedded in the silicate matrix are the major hosts of Cu and Co. The EU regulatory leaching test [87] indicated that the release of contaminants from the Luanshya Cu–Co slag is relatively limited and only Cu slightly exceeded the EU limit values for landfilling of inert waste [92]. However, weathering features corresponding to the presence of secondary metal-bearing phases, such as malachite Cu2(CO3)(OH)2, brochantite Cu4SO4(OH)6, and sphaerocobaltite CoCO3, were observed on the slag surfaces [10,22,92], which indicates that the slags studied are reactive on contact with water/atmosphere and that their environmental stability and release of potentially harmful metals and metalloids must be evaluated in long-term experiments.

5. Environmental Impacts of Large-Scale Mining in the Zambian Copperbelt Mining Districts

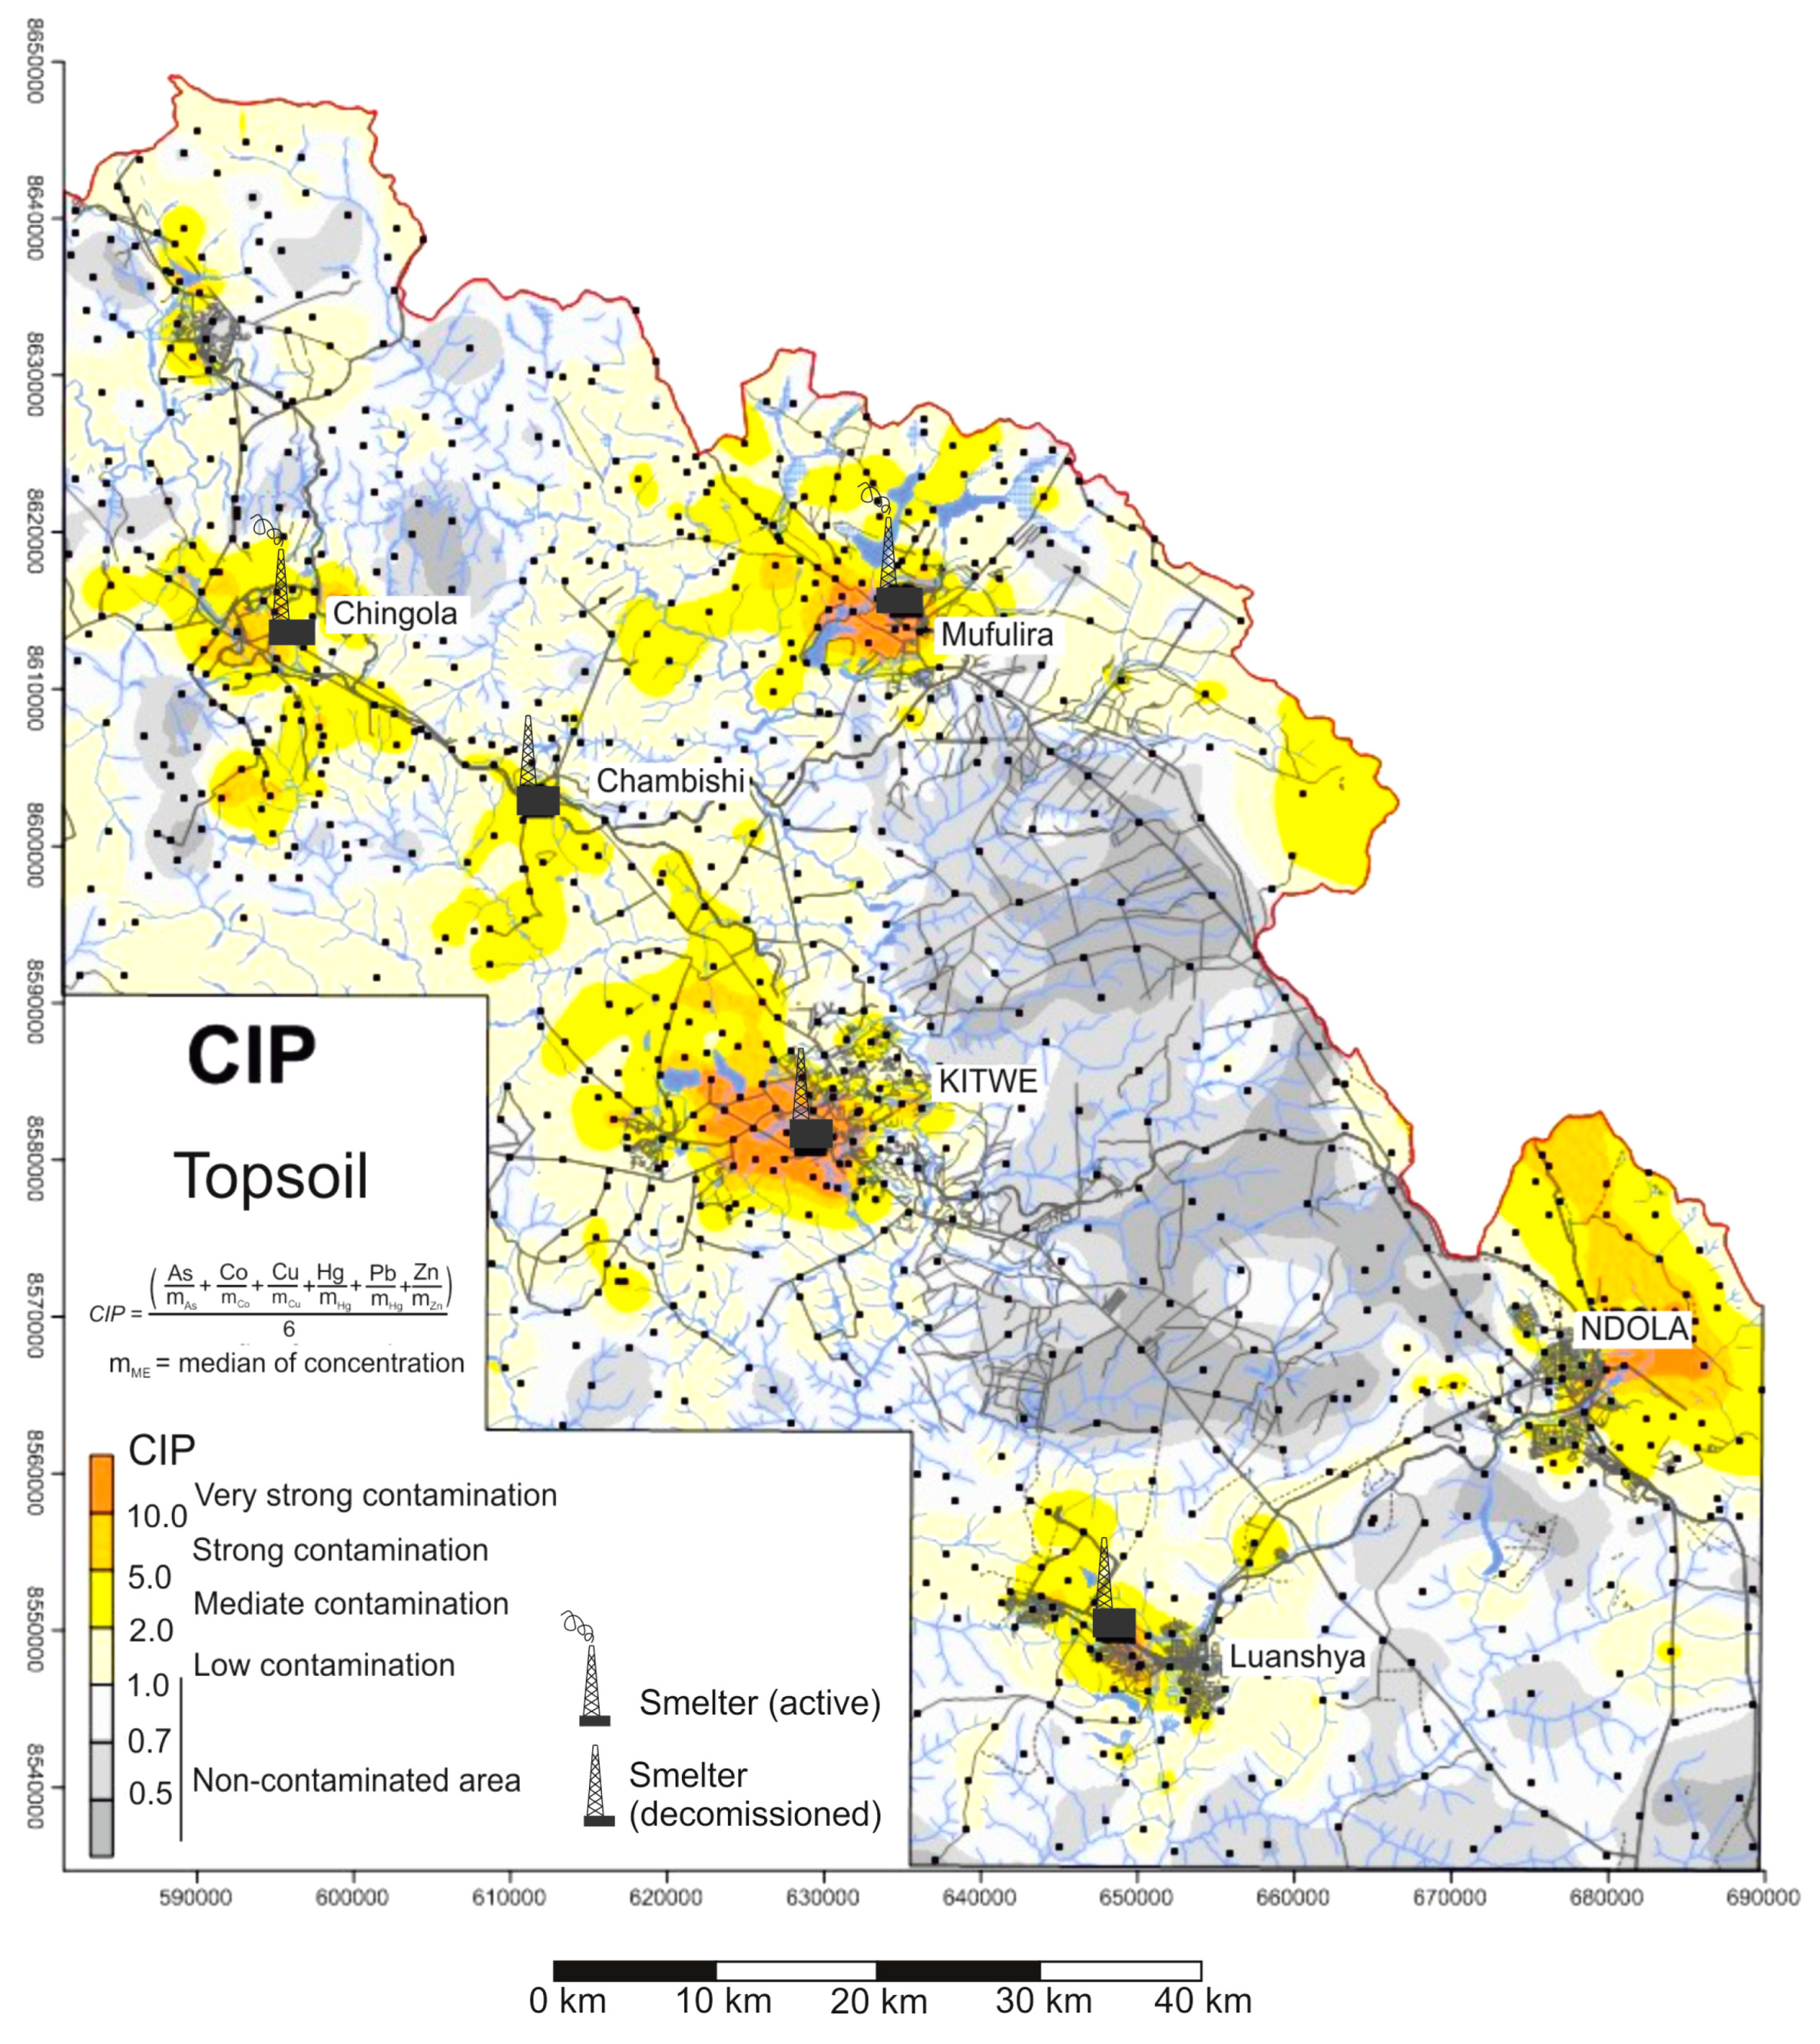
5.1. Contamination of Soils

Regarding the relative homogeneity of the Ferrosol profiles in the mapped region, the higher concentrations of chemical elements in the topsoil in comparison with their concentration in the deeper soil horizon indicate their anthropogenic (industrial) contamination, whereas the higher concentration of a chemical element in the deeper horizon in comparison with surface soil indicates its authigenic (“geogenic”) origin [53,97].
The distribution of selected elements in the soil profile in a heavily contaminated area west of the Nkana Smelter (the Kitwe Township) revealed that only the uppermost part of the soil profile (0–10 cm depth) is affected by contaminants (Stot, Co, Cu, Hg, Pb, and Zn), whereas concentrations of geogenic elements (Cr, Ni, V) are essentially the same in the topsoil and lower part of the soil profile or slightly increase toward the depth (Figure 6). The authors of this review are aware of many variables that may affect the distribution of chemical elements in soils: For example, the adsorption capacity, chemical composition, amount of organic carbon, clay minerals, and hydroxides of iron in soils, as well as the pH of soil solutions can substantially affect the distribution of metals in different soil horizons. Therefore, the comparison of a chemical element’s value in topsoil with its value in deeper soil horizon to discriminate between anthropogenic contamination and background data can be understood only as a simplification.
Numerous anthropogenic metal-bearing particles were detected in the most polluted soil layers. The spherical smelter-derived particles were mainly composed of covellite CuS and chalcocite Cu2S, while the angular mining-derived particles were mostly composed of chalcopyrite CuFeS2. Additionally, Fe–Cu oxide particles predominantly corresponding to tenorite (CuO) and delafossite Cu1+Fe3+O2, along with hydrated Fe-oxides corresponding to secondary weathering products [10].
Examples of the areal distribution of pH values, Stot, and selected elements concentrations in soils in the surveyed area, both in the topsoils and deeper soil horizon of the Zambian Copperbelt, are shown in Figure 7 and Figure 8. A full set of data is given in Tables S1 and S2. The pH(KCl) values of topsoils (Figure 7a) range from 3.56 to 9.17 (median value: 5.06). The large scatter in the data can be explained by the acidification of topsoils due to SO2 emissions from smelters on the one hand, and by the increase in the basicity due to the dispersion of carbonate-rich dust from large-scale flotation tailings deposits on the other. In general, pH values in the topsoil are more variable in the western part of the study area, where most of the mining and treatment of Cu–Co ores is located. High pH values in the Ndola area can be explained by the dust contamination from local lime and cement plants.
Concentrations of the Stot in topsoils (0.004–1.43 wt.%; median: 0.017 wt.%) are higher when compared with subsurface soils (0.002–0.038 wt.%; median 0.010 wt.%) (Figure 7b; Tables S1 and S2). The high contents of Stot (>0.06 wt.%) in the topsoil, especially around Kitwe, Mufulira, Ndola, and Luanshya, and downwind are interpreted as a result of sulfur oxide emissions from smelters or and dust fallout from dry beaches of tailing impoundments. The contamination with Stot around the Chambishi Smelter is low because this smelter re-processed sulfur-poor slag from the decommissioned Nkana Smelter in Kitwe. In the Chingola Mining area and surroundings, high Stot concentrations in surface soils can be explained as due to dust fall-out from mining operations and contamination of this area during the reprocessing (washing and acid leaching) of old metalliferous tailings.
Concentrations of Cu in the Zambian Copperbelt in the topsoil range between 6.1 and 41,900 mg/kg (median: 212 mg/kg; Figure 7c). Therefore, the regional distribution of Cu in topsoils predominantly indicates an anthropogenic contamination in the surveyed area. The highest copper concentrations in topsoils (>2000 mg/kg) were recorded around smelters in Mufulira and Kitwe and downwind, in the northwest direction. Other contaminated areas are located around tailing impoundments due to metalliferous dust fallout from dry beaches of the impoundment. Contents of Cu in deeper soil horizon (6–1560 mg/kg; median: 33 mg/kg; (Figure 7d, Table S2) are lower than in topsoils but generally mimic the areas with high Cu concentrations in topsoil, which probably indicate an infiltration of dissolved Cu species or transport of Cu-rich fine particles to the deeper part of the soil profile.
Concentrations of Co in topsoils range from 9 to 41,900 mg/kg (median: 212 mg/kg). The highest values (>80 mg/kg) were found in the vicinity and downwind from the Cu–Cu smelters at Mufulira, Chambishi, and Luanshya, and in wind-contaminated areas in the vicinity of tailing impoundments (Figure 8a). In the deeper soil horizon, the concentrations of Co are much lower (2–144 mg/kg; median 6 mg/kg) and do not correlate with Co anomalies in topsoil (compare Figure 8a,b). This indicates that the distribution of Co in the deeper soil horizon is probably affected not only by its migration from the topsoil, but also by geogenic factors, the most important of which are the chemical composition of the bedrock and/or intensity of the chemical weathering of pre-Katanga and Katanga rocks.
Concentrations of Pb in topsoils range from 4 to 503 mg/kg (median: 4 mg/kg), and in some places they are higher, and in others lower than in the lower soil horizon (Figure S1a,b). Nevertheless, in the industrial regions of Kitwe, Mufulira, and Chingola, the high concentration of lead in the topsoil (>40 mg/kg) can be related to industrial contamination. Therefore, along with the use of leaded petrol in vehicles in the past, concentrate smelting can contribute to the contamination of industrial areas [55]. Very variable concentrations of Pb in topsoil and deeper soil horizon indicate that high concentrations of trace elements in soils cannot always be attributed to mining and ore processing. Consequently, the comparison of the regional distribution of Pb in the topsoil and in the deeper soil horizon documents that the commonly used concept of “normalization” of anthropogenically contaminated areas with a reference contamination-free area is problematic if we are dealing with an area with variable lithology and/or with natural (geogenic) mineralization.
Concentrations of As in the topsoil range from 0.04 to 255 mg/kg, but the median value is low (0.42 mg/kg; Table S1). Nevertheless, the relatively high concentration of As (>5 mg/kg) in the topsoil in the Kitwe and Mufulira industrial areas can be interpreted as due to emission from smelters (Figure S1c,d). The concentration of As in the deeper soil horizon (0.04–50.1 mg/kg; median: 40 mg/kg) does not fit the distribution of As in topsoils (Tables S1 and S2, Figure S1c,d). It is particularly true for the area south-east of Mufulira and north-east of Ndola, where the contents of As in the deeper soil horizon clearly correlate with the distribution of the Katanga Supergroup rocks [53].
In contrast to Cu and Co which usually display high concentrations in the topsoil, the concentration of Ni in topsoils (1–64 mg/kg, median: 2 mg/kg; Figure 8a) is lower compared to the concentrations in the deeper soil horizon (2–132 mg/kg; median: 16 mg/kg; Figure 8d). This suggests that concentrations of Ni do not reflect the anthropogenic contamination. The higher contents of Ni in the deeper soil horizon generally correspond to areas of deeply weathered rocks of the Katanga Supergroup [53]. The same distribution as for Ni was found for V and Ni (Tables S1 and S2), e.g., elements that display a high concentration in uncontaminated lateritic soils with high Fe content.
The degree of anthropogenic contamination of topsoils can be expressed using the Coefficient of Industrial Pollution (CIP). It is evident from CIP values (Figure 9) that medium to very strong contamination (CPI > 5) is restricted to the industrial areas of Kitwe, Mufulira, Chingola, Luanshia, and Ndola downwind, towards the north-west direction. It should be noted that the areal distribution of “volatile” metal(loids) (As, Hg, Pb) in the topsoil can be substantially modified due to their redistribution during extensive bush fires [78,79,107]. In areas of low contamination (CPI < 2), the distribution of values can be substantially modified by the interference of industrial contamination and the primarily higher contents of trace element in soils derived from the Katanga Supergroup metasediments.
The effect of anthropogenic contamination of topsoils in the Kankoyo Township located downwind of the Mufulira Smelter (CPI > 5) on soil biota was tested using Enchytraeus crypticus (soil-dwelling annelid worm [108]). Soils at this site recorded excessive amounts of metals (up to 8980 mg/kg Cu, 46 mg/kg Co, 42 mg/kg Pb, and 83 mg/kg Zn). The results of biotoxicity tests revealed that the number of reproduced enchytraeids correlated negatively with total Cu and Co concentrations (r = –0.97 and –0.94 at p < 0.001), and no reproduction was possible in soils with Cu levels of >5000 ppm. The median effect concentration (EC50) values were calculated for total Cu and Co and corresponded to 351 mg/kg and 7.8 mg/kg, respectively. In these soils, the number of reproduced enchytraeids was also negatively correlated with total sulfur (r = −0.80, p 0.05).
The sequential extraction (SEP) data from the contaminated soil profiles studied at the surveyed Copperbelt area confirmed that the exchangeable/acid-soluble fraction accounted for up to 26% (Co), 35% (Cu), 7% (Pb), and 27% (Zn) of the total amount of pollutants in the uppermost part of the soil profiles [83].
The “labile” contaminant fractions in soils at the Mufulira area revealed that from 39.0% to 42.2% of total concentration of Cu in soils, 4.3% to 36.5% of Co, 11.8% to 25.2% of Pb, 1.6% to 30.3% of Zn, and 1.1% to 3.3% of Zn can be extracted using the EDTA solution. The differences of “labile” fraction between individual sampling sites varies in relation to the distance from the contamination sources (emissions from smelter or dust from tailings), soil type and a degree of weathering of emitted particulates [83]. High amounts of “labile” Cu in assessed soils were attributed to the high amount of easily soluble chalcanthite CuSO4 · 5H2O [10,90,91,109], which forms an important part of the dust emitted from the Mufulira smelter, is subsequently deposited into soil. Therefore, due to the high availability of pollutants in soils, the risk of contaminant uptake by crops in contaminated soils in the studied area of the Copperbelt is relatively high [13,82].
The bioaccessible concentrations of As, Co, Cu, Pb, and Zn in contaminated topsoils from mining and smelting areas in the Zambian Copperbelt were evaluated using an adopted in vivo method using a simulated gastric fluid (SGF; US EPA [110,111,112,113]) in the predominantly mining area (Chingola) and smelting area (the Nkana Smelter in Kitwe; [85]. Higher bioaccessibilities in the smelter-dominated area were found for As and Pb, attaining 100% of the total metal(loid) concentration. The maximum bioaccessibilities of As and Pb in the mining area were lower (84% and 81%). The differences in biocessibility in the two areas can be explained by a volatilization of As and Pb in smelters, as well as the different grain size of the emitted particles. Dust from crushers in mining areas are generally large in size, whereas particles emitted by the smelters generally consists of fine-grained materials with a high specific surface area and solubility (Figure 10).

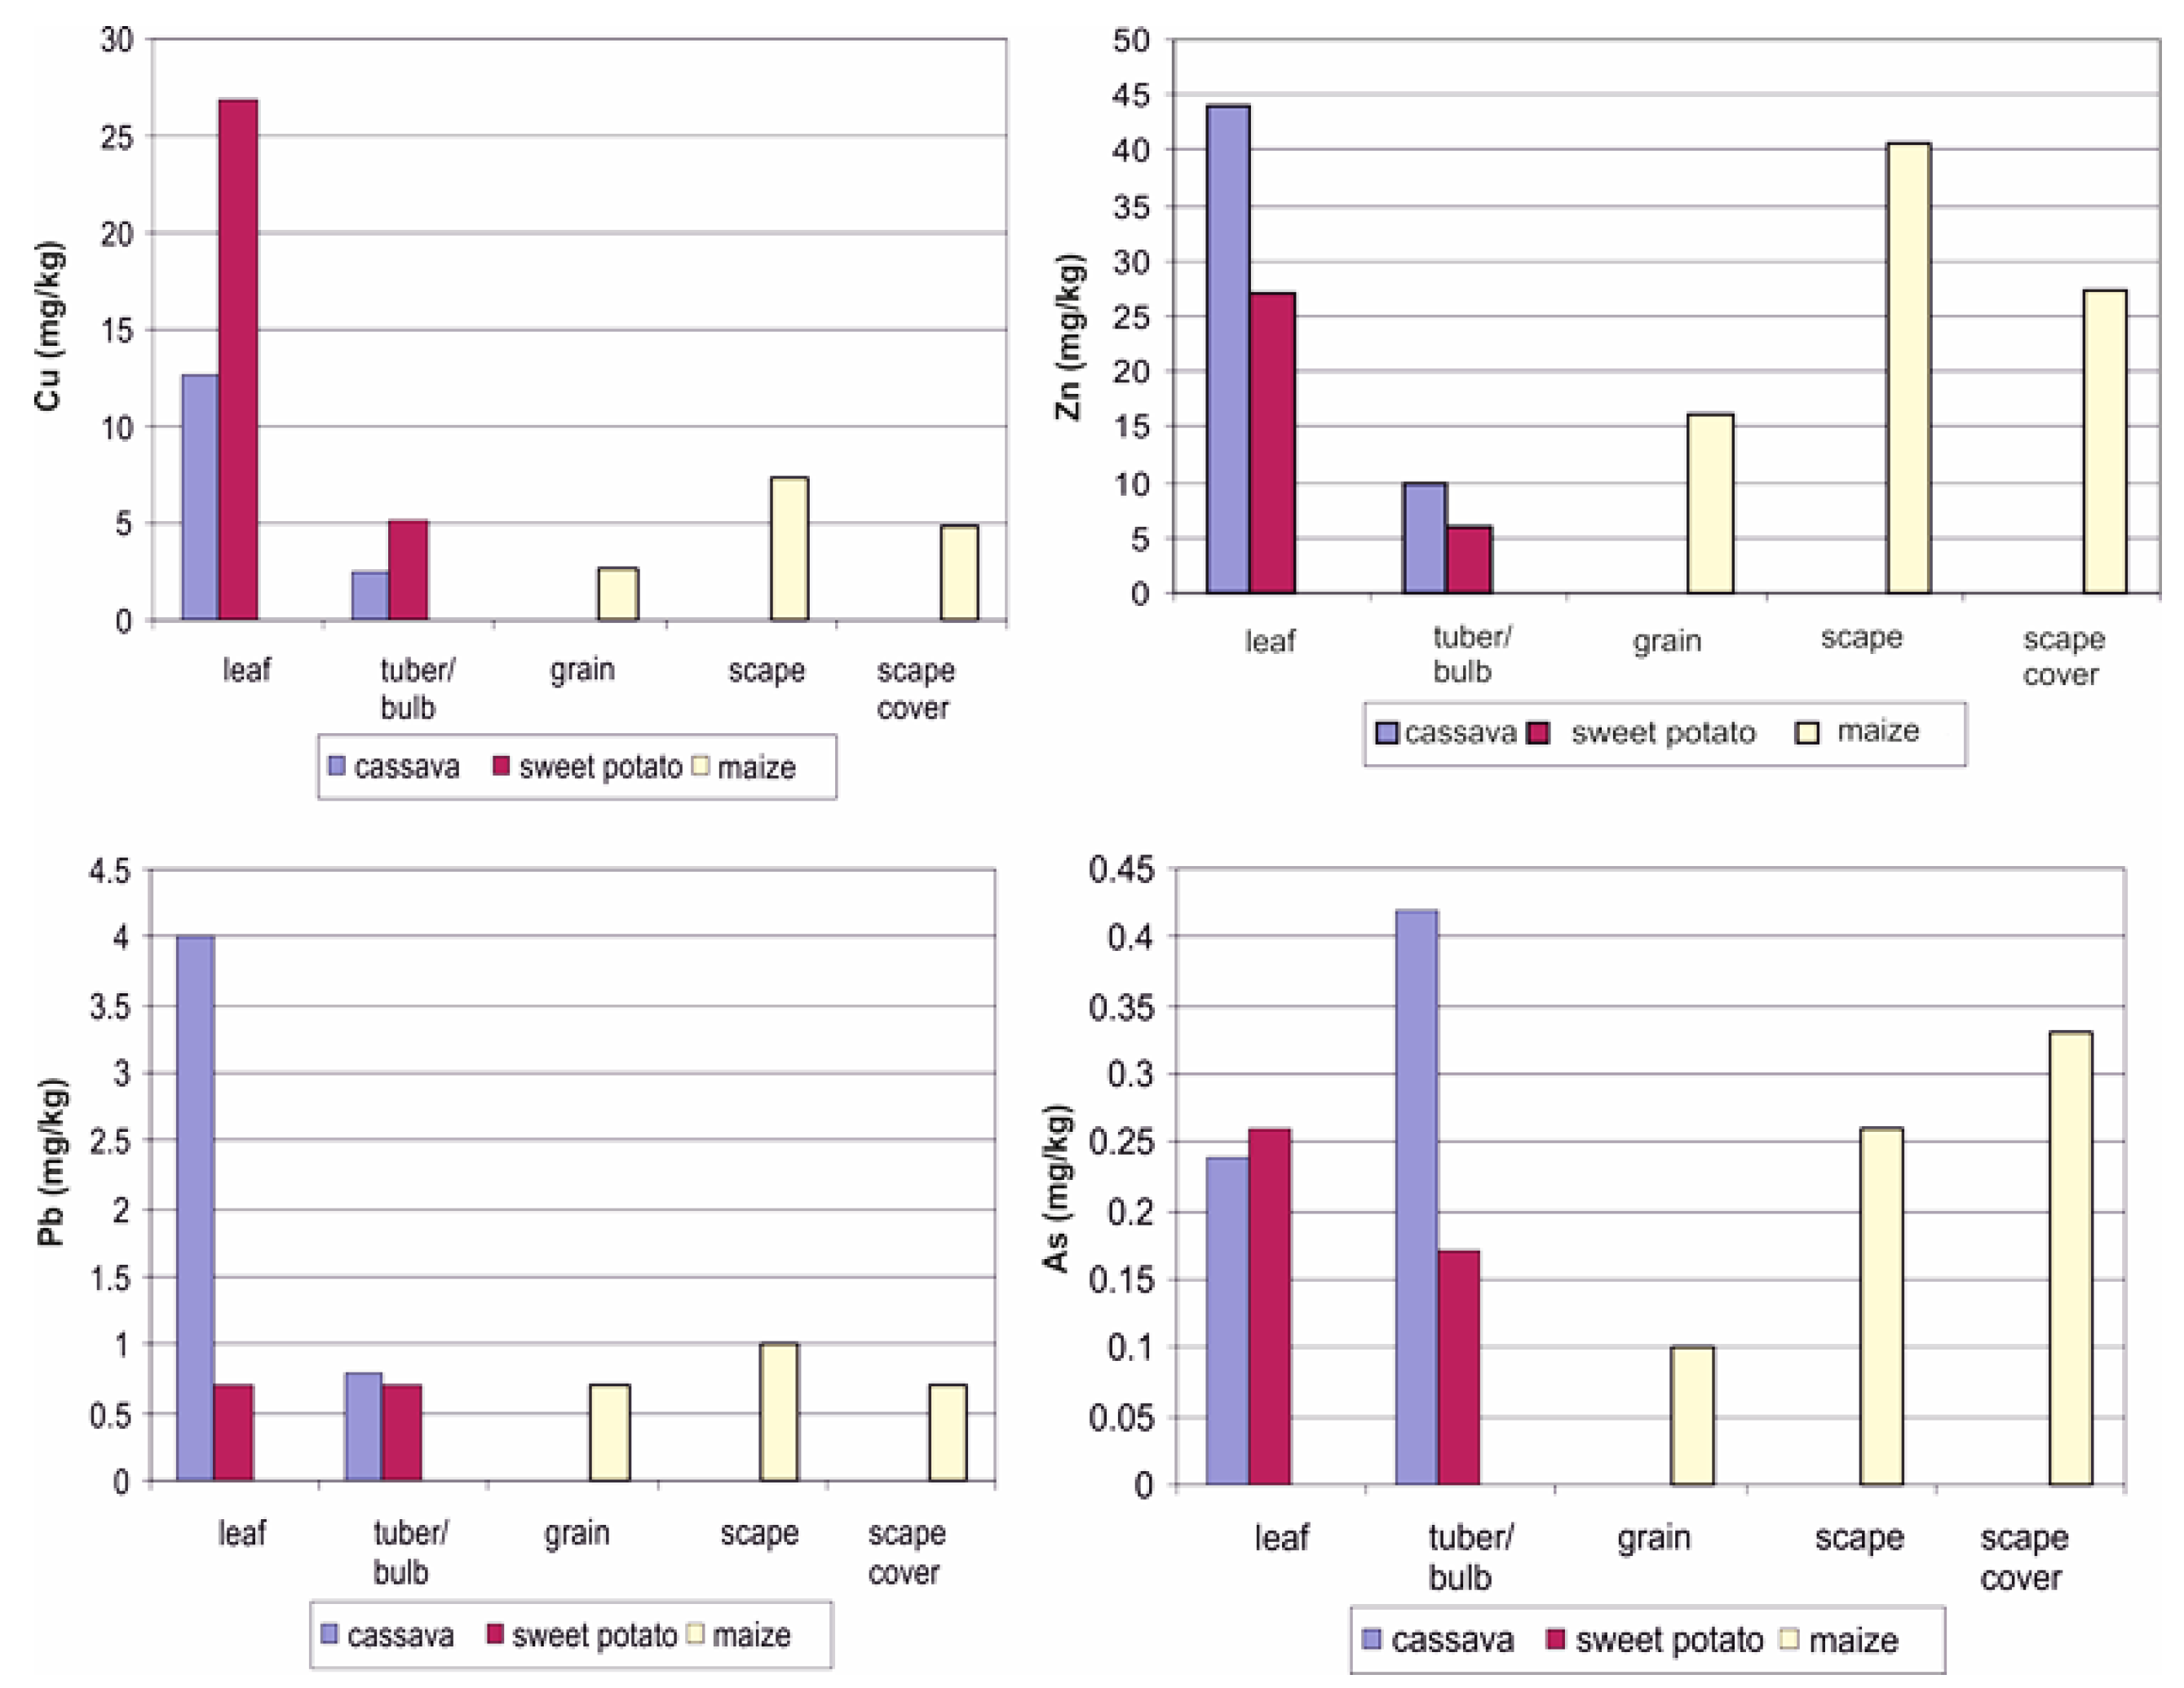
5.2. Contamination of Plants

Due to the significantly high metal(loid) availability in contaminated soils [10,13], the risk of contaminant uptake by crops was evaluated. The concentrations of Cu, Co, Pb, Zn, and As (total dry weight) were studied in cassava and sweat potato leaves and tubers, and in maize grains. Generally, the concentration of all elements is low in uncontaminated areas but differs in plant parts. At crops growing in the same stand (Figure 11), the concentrations of Cu, Zn, Pb, and As are always higher in the cassava or sweet potato leaves compared with tubers/bulbs. In maize grains, the concentrations are low, but increase in maize grains scape, and especially in scape cower. This indicates that the surface contamination by dust is an important control of contents of elements in the aboveground parts of crops. In other words, the windblown metal(loid)-rich dust particles deposited on the foliage remain the major source of the contamination of agricultural crops, rather than contaminants translocation from soils via the root system [19,114]. Statistically significant differences in the concentration of studied elements in maize grains were not found in uncontaminated and contaminated areas. Therefore, growing of maize in strongly contaminated areas should be recommended instead of leafy crops.
Substantial contamination was found on the surface of leaves of cassava (second staple crop after maize in Zambia) grown near the smelters [19]. The leaves of cassava cultivated in the immediate vicinity of smelters were found covered with tiny particles of dust that contained potentially toxic levels of PHEs. Their presence in the fallout dust was confirmed when their concentrations in washed and unwashed cassava leaves were compared [20]. Overall, using the highest tolerable weekly ingestion limits established by the Joint FAO/WHO Expert Committee on Food Additives [115], this study concluded that dietary exposure to metals through the consumption of uncooked cassava leaves and tubers posed a moderate hazard to human health. It was further noted that as the surfaces of leaves were strongly contaminated in the polluted areas, there is still a potential hazard of ingesting dangerous levels of copper, lead, and arsenic if dishes were prepared with poorly washed foliage.
In addition to crops, the concentrations of metal(loids) were also monitored in the vegetation growing on tailings impoundments. The concentrations of metal(loids) were established in fern, papyrus, and reed, which are the most common plants growing on wet or semi-dry parts of tailings ponds [74]. The results show that the Chinese brake fern (Pteris vittata) is a hyperaccumulator of not only As (mean and standard error: 5534 ± 533 mg/kg) but also Cu (216 ± 53 mg/kg). Relatively high contents of Cu were also found in leaves of umbrella papyrus (Cyperus alternifolius, 112 ± 23.2 mg/kg), while concentrations of Cu in other plants are substantially lower: in reed grass (Phragmites mauritianus; 64.1 ± 42 mg/kg) and in southern cattails (Typha domingensis; 53.2 ± 7.2 mg/kg). Therefore, the bioaccumulation ability of the Chinese brake fern and umbrella papyrus in relation to As and Cu can be used in the bioremediation of contaminated areas in the Zambian Copperbelt or in the construction of water-treatment wetlands [74,77].
The Cu content and isotopic composition were studied in soils and in pine tree rings at locations close to and far from the Nkana Cu Smelter, located at the Kitwe City [79]. The Cu isotopes confirm that the metal contents in the tree rings in the vicinity of the Nkana Smelter are good indicators of the atmospheric pollution history, whereas the tree ring chemistry in remote areas might be affected by the soil chemistry and root uptake of Cu metal.

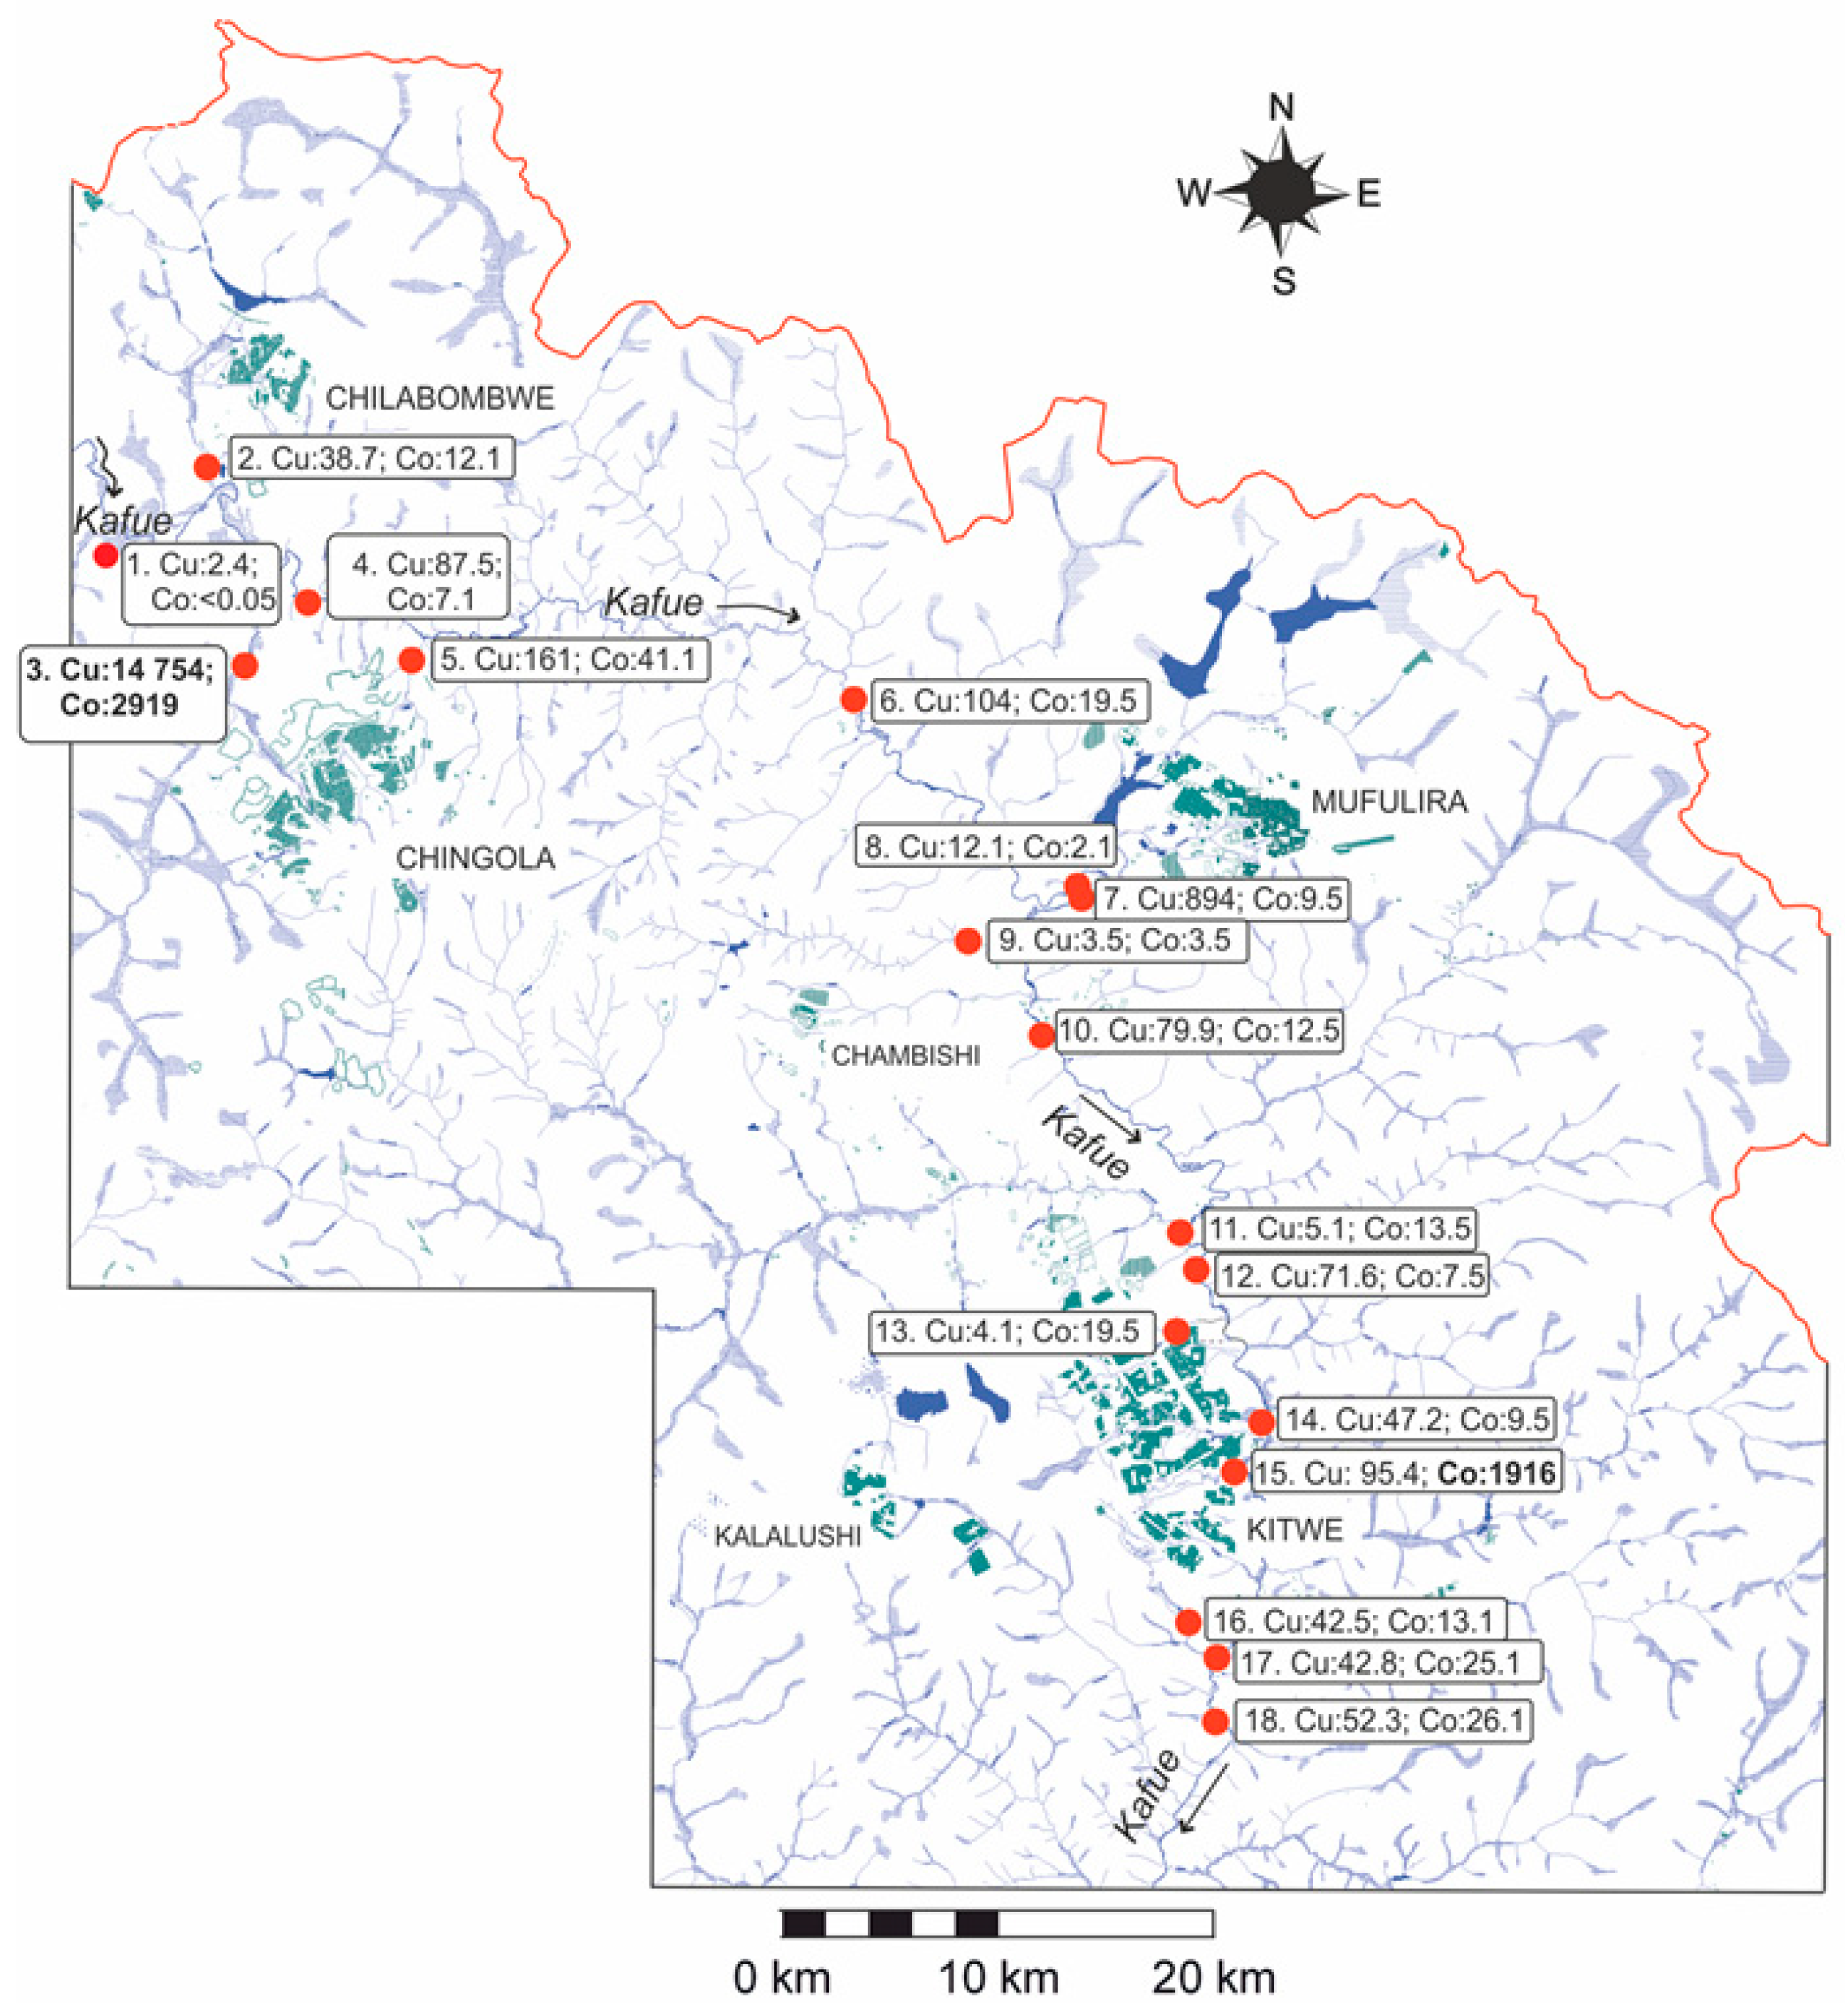
5.3. Contamination of Surface Water and River Sediments

The mining operations are within the catchment areas of the tributaries of and the Kafue River itself. It is a source of 40% drinking water for the cities and about half of the population lives in the catchment area [116]. Water sampling of the Kafue River and its tributaries was carried out in 2008 and 2009 by Kříbek and Nyambe [74] (Table S3). Compared with the Kafue River inflow to the surveyed area, the pH at the outflow is slightly higher, and concentration of SO42− as well as the concentration of many trace elements generally increase at the Kafue outflow from the industrial area of the Zambian Copperbelt (Table 2, Figure 12). Values of pH in the Kafue River and its tributaries are near-neutral or slightly alkaline and concentrations of sulfate gradually increase downstream. Water balance based on dissolved sulfate indicated that inflow from the most contaminated tributaries is about 5% of total discharge in the Kafue River [75]. The elemental composition of the Kafue River clearly shows seasonal variations that are not related to dilution effects or to the mining activities within the area. Concentrations of SO42− and trace elements in the Kafue water are lower than the Zambian water effluent discharge limits (Table 2) [117]. Nevertheless, very high concentrations of dissolved Cu and Co exceeding the Zambian effluent limits were recorded in the Mushishima River (tributary of the Kafue River) in the Chingola region (Sampling site 3, Figure 12), that drains large, reworked tailings dams south of Chingola. The average concentration of Co in 2008 and 2009 was 919 μg/L, and that of Cu 14,752 μg/L. The Uchi River at the Kitwe area (Sampling site 15, Figure 12) is polluted with industrial water released from the Nkana Smelter and Chemical Plant where the average concentration of dissolved Co in years 2008 and 2009 was 1917 μg/L. At the same site, concentration of SO42– (1416 mg/L) was slightly lower than the Zambia effluent limit (1500 mg/L). Relatively high concentration of dissolved Cu (894 μg/L), but not exceeding the water effluent discharge limit, was also recorded in the Mufulira River, tributary to the Kafue River from an area of large tailing ponds south of Mufulira (Figure 12, Sampling site 7). In 2005, very low pH (2.04) and very high concentrations of SO42– (1396 mg/L) and dissolved Al (2115 μg/L, Co (909 μg/L), Cu (7405 μg/L) Ni (51.5 μg/L), Pb (161 μg/L), and Zn (346 μg/L) were recorded in the Wusakile River (Sampling site 16, Figure 12), flowing from the area of the Nkana Industrial Complex in Kitwe [91]. Therefore, occasional accidents in chemical plants processing copper and cobalt ores result in short-term but sharp increase in acidification of surface waters. On 6 November 2006, for example, the Kafue River turned blue in the Chingola District, when a pipe delivering slurry from the Tailing Leach Plant of the Konkola Copper Mines Plc. burst, releasing effluents with very high concentrations of Cu, Mn, and Co [118].
In spite of the relatively low concentration of trace elements dissolved in the Kafue River water, it should be noted that they are released from the contamination sources and transported not only in solution, but also in suspension [76]. At the monitoring site downstream of the Kitwe Industrial Complex, 96.9% of the total concentration of Pb, 83.4% Cu, 58.3% Cd, 33.7% Co, 20.2%, and As, 32.7% were transported in the suspended phase [119]. Sedimentation of suspended particles, together with sorption of trace elements dissolved in the water phase, is reflected in the high concentrations of metals and metalloids load in stream sediments. Suspended particles show high levels of several trace elements within the mining area. When lime is added to mining effluents, secondary particles rich in Ca, S, Fe, Mn, Cu, and Co are formed and discharged into the Kafue River. These secondary particles aggregate and settle on the riverbed quite rapidly, where they may coat the benthic flora and fauna.
Compared with the uncontaminated Kafue River sediments (Sampling site 1, Figure 12), the sediments at the outflow Kafue River from the industrial area of the Zambian Copperbelt (Sampling site 18, Figure 12) are enriched in Stot, Co, Cu, Mn, and to less degree in Pb, Zn, As, and Hg (Table 3 and Table S4). The enrichment of these elements in stream sediments is supported by very high concentrations of Cu, Co, and other elements in tributaries of the Kafue River in the industrial areas of Chingola and Kitwe. In the Kitwe industrial area, the sediments of the Uchi River (Sampling site 15, Figure 12) which drains the area of the Nkana Smelter and Chemical Plant in Kitwe contained 0.97 wt.% Stot, 1222 mg/kg Co, 17,060 mg/kg Cu, 192 mg/kg Zn, 121 mg/kg Pb, and 94.24 mg/kg As, and 0.56 ppm Hg. The sediments of the Wusakile River in the same area (sampling site 16) contained 0.29 wt.% Stot, 1060 mg/kg Co, 6316 mg/kg Cu, 129 mg/kg Zn, 60 mg/kg Pb, and 30.9 mg/kg As. At the Chingola industrial area, sediments of the Changa River (Sampling site 5, Figure 12), contaminated with owerflow from the Chingola KCM thickeners contain 0.09 wt.% Stot, 258 ppm Co, 7006 ppm Cu and 6.55 ppm As [94]. During periods of increased water discharge particles enriched in elements from the mining effluents, they are re-suspended and transported further downstream in the Kafue River system [120].
Elevated concentrations of Co can be found in the sediments about 100 km downstream of the mining area, and elevated concentrations of Cu can be found about 300 km downstream [120]. Compared with Stot, Co, Cu, Zn, Pb, As, and Hg, concentrations of Fe, Cr, and Ni are the same or even lower in contaminated sediments compared with uncontaminated sediments in the inflow of the Kafue River to the industrial district of the Zambian Copperbelt (Table 3). This indicates that the concentrations of the above elements in sediments are controlled by natural processes such as the erosion of lateritic soils in rainy period.
Sequential analyses of stream sediments revealed that the substantial amounts of Cu, Co, and Mn in contaminated sediments are bound to the acid extractable fraction (exchangeable metals and carbonates), whereas most metals in uncontaminated sediments of Kafue are confined to the oxidizable (organic matter) and residual fractions of the SEP [76]. In contaminated Kafue sediments, the oxidizable fraction is represented mostly by sulfides (pyrite, chalcopyrite). The host mineral in the exchangeable fraction is kaolinite, in the acid-soluble fraction both kaolinite and Fe (Mn) oxyhydroxides [47]. Hence, the potential for their desorption or dissolution and remobilization is high, especially in low pH conditions. These metals can be released during “acid spikes”, i.e., during accidents and spills of acidic solutions from chemical plants in the Copperbelt, and may pose a potential environmental risk. In 1982, cattle losses due to drinking contaminated water were reported along the Mwambashi River [121,122] and Kambole [123] reported several fish kills in the Kafue River in the past due to acid spikes and mobilization of metals from river sediments.
Heavy minerals found in uncontaminated as well as contaminated sediments of the Kafue River consist mostly of ilmenite, limonite, rutile, amphibole, and tourmaline, while apatite, clinochlore, and zircon are minor. On the other hand, the contaminated sediments contain, besides rock-forming minerals, chalcopyrite CuFeS2, pyrite FeS2, bornite Cu5FeS4, malachite, Cu2(CO3)(OH)2, and azurite Cu3(CO3)2(OH)2, the concentrations of which vary considerably [75]. Limonite with an elevated content of Cu is a characteristic component of contaminated sediments. Contents of sulfides and carbonates of Cu increase with decreasing distance from sources of contamination. In addition to sulfides and carbonates, particles of slag rich in magnetite and partly oxidized particles of intermediate solid solution (ISS) of Cu–Co–Fe–S were found in the Kafue River sediments (Figure 13).

6. Measures Proposed to Reduce Environmental and Health Risks, and Suggestions for Future Work in the Zambian Copperbelt Mining Districts

Based on the work carried out by the Czech Team and Zambian counterpart in the area of the Zambian Copperbelt and taking into account the results of many other authors who worked in this area in the past years, it is possible to suggest a number of measures aimed at reducing environmental and health risks resulting from the negative legacy and impacts of mining and processing of Cu–Co ores in the Copperbelt in the past, as well as recommendations related to increased environmental control of ongoing and future mining operations. A series of these measures below are based on and complete the conclusions that were drawn up during implementation of the Zambia Copperbelt Environment Project (CEP) [38].

6.1. Monitoring and Mitigating Historical Burdens and Impact of Mining and Ore Processing on the Environment

Monitoring and measures aiming to reduce environmental and health risks resulting from the negative legacy of mining and processing of Cu–Co ores in the Copperbelt in the past include the following:
  • Execution of the risk assessment study for shut-down and abandoned mine sites in the Zambian Copperbelt;
  • Characterization of mining wastes and the possibility of mitigation of their impacts on the environment;
  • The assessment of soil and plant contamination;
  • The assessment of water and stream sediment contamination;
  • The evaluation of contamination impact on human health;
  • Continuous updating of the existing environmental data management system.

6.1.1. Risk Assessment for Shut-Down and Abandoned Mine Sites in the Zambian Copperbelt

The methods used to assess the risks associated with mining activities in the past are described in several papers [124,125,126,127,128]. Risk analysis of the area affected by mining includes several stages, the most important of which are the following: (1) identification of situations that involve a risk; (2) estimation of the probability of the occurrence of hazards; (3) estimation of the severity of consequences to receptors; (4) calculation of a risk assessment to distinguish between “significant” and “insignificant” risks; and (5) the application of detailed risk analysis (DRA) methods. This procedure makes it possible to classify individual sites according to the order with respect to the magnitude of risks [129,130].
Except for the study by Albanese et al. [131], which is based on the determination of risks related to soil contamination and population density in individual areas of the Zambian Copperbelt, an analysis of the risks to the environment and the health of the population in the Zambian Copperbelt has never been carried out. This means that the selection of sites and their priorities for the remediation of old burdens is carried out in this area to a large extent based on subjectively determined estimates and visual inspections.

6.1.2. Determining the Risk Characteristics of Wastes after Mining and Ore Processing

The assessment of the risk properties of mining wastes is determined by environmental legislation in individual states. In the European Union, the assessment of the risk characteristics of wastes from the viewpoint of their disposal method and deposition is determined by Directive 1999/31/EC (“Landfill Directive”) [87,88]. The assessment of hazardous properties of mining waste is dealt with by Directive 2006/21/EC [132] of the European Parliament and of the Council of March 15, 2006 on the management of wastes from the extractive industries (the “Mining Waste Directive”), which classifies the mining waste storage sites as hazardous (i.e., those at risk of failure, e.g., the collapse of a heap or those that contain substances or materials classified as dangerous) under Directive 1999/45/EC [133] above a certain threshold. The investigation of the dangerous properties of mining wastes includes, among other things, the determination of their neutralization and acid potential, as well as the content of hazardous substances (Ag, As, Ba, Be, Cd, Co, Cr, Cu, Hg, Ni, Pb, Sb, Se, Sn, Te, Tl, U, V, Zn, and asbestos), cyanides, phenols, and flotation agents.
In the Zambian Copperbelt Mining districts, mining wastes include overburden sites, flotation and chemical slimes, and slag storage sites. The overburden material is mostly considered unsuitable for the reclamation of contaminated sites [134]. However, the possibility of remediation depends on the petrographic composition of the deposited material and the rate of its weathering [135]. Old overburden storage sites that contain a higher amount of clay particles were spontaneously revegetated (e.g., an old overburden dump in the Minambe Region, north of Mufulira (Figure 14a) [93]). The petrographic and chemical composition of overburden storage sites change over time, and due to the weathering of sulfides, their acid potential gradually decreases. It is therefore necessary to monitor the chemical evolution of these accumulations over time [136,137]. Complete cultivation of these sites, for example, adjusting their contours, covering them with a layer of soil, and revegetation, are not the priority of remediation works in the Copperbelt due to their high cost.
Flotation and chemical tailings, on the other hand, pose considerable danger to the environment and human health as their dry “beaches” are a significant source of dust that contaminates their surroundings. Dust reduction can be achieved in different ways, e.g., by covering them with granulated slag [46], strengthening the surface with cement or waste pozzolans, or moistening the tailings surface with bitumen [138,139]. Water reclamation in the Kitwe area was used to rehabilitate the abandoned Mindolo Tailings Impoundment and the area is used for recreational purposes (Figure 14b). However, the most common method of tailings reclamation is their revegetation. Previous studies of tailings revegetation have mainly been focused on evaluating the revegetation potential of grasses or shrubs, herbs, and trees [140,141]. There are several benefits of using trees. Planting a mixture of tree species can create long-term vegetation cover, increase the available nutrients and organic matter in the soil through litter fall [142,143,144]. However, tailings revegetation requires the study of the properties of deposited materials and screening the candidate tree species. Moreover, a breeding program to promote promising species showing tolerance for elevated levels of metal(loids) should be initiated. The use of organic amendments should be evaluated, especially biochar and other easily accessible amendments, such as poultry, cow manure, or treated municipal waste [135].
Tailing ponds are not only a source of dust, but due to the leakage of their dams, technological solutions often seep from them, causing contamination of surface waters [116]. This can be reduced by proper routing of drainage ways through natural or constructed wetlands wherever possible [145,146,147]. In wetlands, there is both sorption of potentially hazardous elements (PHEs) to organic matter, Fe-hydro(oxides), clay minerals [76,94,96], and their uptake by plants [74].
Due to the instability of dams of the old tailings ponds, they have eroded or collapsed during the rainy seasons in many areas of the Copperbelt, resulting in leakage of a significant amount of flotation or chemical sludges and massive siltation of riverbeds. This can be prevented by establishing perimeter collection ditches and silt traps in their vicinity. Dry beaches of tailings ponds are in many places used as a playground for children (Figure S2). It is therefore necessary to restrict access to tailings ponds at ore treatment plants and ensure their security, especially in the vicinity of urban agglomerations.
The slag landfills compared to tailings ponds have a relatively small impact on the environment. This is mainly because they contain only a small amount of fine fraction that is a source of dust and most potentially hazardous elements (PHEs) are bound in their aluminosilicate matrix. However, it should be noted that dust from slag storage sites contains acicular particles reminiscent of glass fiber, in addition to isometric particles [71]. These fine, glassy, needle-like particles probably represent serious danger to human health, causing silicosis and lungs cancer [148,149].

6.1.3. Assessment of Soil and Plant Contamination and the Measures to Mitigate the Impacts of Negative Legacy of Mining and Ore Processing

In Zambia, there are no criteria for evaluating of the intensity and spatial distribution of soil contamination. In several countries, these criteria are set according to current or future land use. A distinction is usually made between agricultural, residential, commercial, and industrial land use [150]. A comparison of the criteria for assessing the degree of soil contamination in individual countries is given in the ESdat database [151]. Another possibility to evaluate the degree of soil contamination is a comparison to a nearby, lithologically similar area that was not affected by contamination [152]. The best way to assess the impact of contaminants on soil and terrestrial biota is the application of ecotoxicological tests. Mushrooms, springtails, earthworms, and maggots are usually used for testing. The impact of contamination on plants can also be monitored based on seedling emergence and seedling growth tests [153,154]. The earth worms (Enchytraeus crypticus; Ref. [108] were used to evaluate soil contamination in the Mufulira area of Zambia.
The simplest method of remediation of contaminated soil is its removal or covering with a layer of uncontaminated earth or soil [155,156]. However, this method is not cheap and can only be applied to a limited extent. It should be applied wherever communities cultivate home-grown vegetables (lettuce, rape, cassava, sweet potato), and where the local residents are exposed to high amounts of contaminants via their diet [157]. Using a field experiment on farmers’ fields adjacent to a large mine tailings impoundment in the Zambian mining town of Kitwe, it was concluded [158] that the concentrations of Cu and Pb in pumpkin leaves were above the prescribed FAO/WHO safe limits [115] by 60%–205% and by 33%–133%. In these areas, the aboveground parts of vegetables are mainly affected by foliar contamination consisting of resuspended dust particles blown out from contaminated soils [20]. The removal or covering of contaminated soils with a non-contaminated substrate should also be considered where there is a turbulence of contaminated soil dust and its inhalation, especially by children (children’s and sports fields around schools).
Reduction of dust inhalation can be partly achieved even without the costly removal of contaminated soil by irrigation or adding calcium chloride, which is a strongly hygroscopic substance that causes the aggregation of dust particles, preventing them from being dispersed [159]. Mitigation of the impacts of negative legacy of ore mining and processing on soils and vegetation in the Zambian Copperbelt can also be achieved by phytoextraction of toxic elements by plants or, conversely, by reducing their bioavailability in the soil [8]. Phytoextraction is carried out by various methods (for example, by adding chelating agents), but it is a relatively slow process and is not very effective for the decontamination of soils [160,161]. The reduction of the solubility of hazardous elements in the soil is of great importance. Numerous chemicals are used for the immobilization of contaminants, for example, phosphoric acid, diammonium phosphate (DAP), hydroxyl apatite, or humic substances [159,162,163,164]. Additionally, the addition of lime or limestone to soil reduces the solubility of a range of metals by increasing soil pH, leading to their sorption onto soil particles and organic matter [165]. In all cases, the efficacy of various methods of remediation of contaminated soils and the quality of cultivated agricultural products must be monitored over a long time period [49]. In extreme cases, it is also important to consider the necessity of relocating the population from extremely contaminated areas, especially in the vicinity of active or abandoned smelters, for example, in the Kankoyo Township, the Mufulira area [45]; or downwind of the decommissioned Nkana Smelter in Kitwe.

6.1.4. Assessment of Water and Stream Sediment Contamination, and Measures to Mitigate the Impacts of Negative Legacy of Ore Mining and Processing

Zambian effluents limits are met in the Kafue River, which drains the entire Copperbelt area, particularly because of the limited solubility of a whole range of PHEs in a near-neutral water environment [76]. However, the amount of PHEs in water is highly variable and depends primarily on the discharge in the river network. Although the chemical composition of the water is monitored by several mining and water management companies, the data are not publicly available. Moreover, the surface and groundwater quality data are not regularly monitored and evaluated by the Zambia Environmental Management Agency (ZEMA). Since a significant part of trace elements in surface waters is carried in the form of suspensions [94,119,120,166,167] it is necessary to monitor not only the chemical composition of water, but also the water turbidity and to correlate turbidity to sediment accumulation, using a regression developed from water samples that are filtered, dried, and weighed. Siltation of waterways with solid particles negatively affects the ecosystems. The identified negative impacts of siltation include a decrease in biodiversity of aqueous vegetation, destruction of fish breeding areas, flooding, poor water quality affecting human and animal use, and increased conflicts among users of the given resource [122,166,167].
Environmental standards for stream sediments pollution are not specified in Zambia, but it is possible to rely on the same standards used in several other countries [150,151]. The degree of pollution of material deposited in rivers (its toxicity) can be verified by a series of ecotoxicological tests [152], most often using fish or daphnia [153,154]. The most effective (and the only) method of reclamation works is the identification and technical adjustment of sources of siltation (reinforcement or reconstruction of tailings ponds dams), removal of contaminated sediment deposits in riverbeds, and/or the construction of dams and sedimentation pools on rivers.
Regarding the groundwater contamination, the water leakage from chemical waste disposal facilities using monitoring boreholes is carried out in the vicinity of tailings ponds by mining companies. An example is a regular monitoring of the groundwater chemistry at the Bwana Mkubwa chemical waste storage near Ndola [74]. However, it should be noted that mere monitoring of contamination in the vicinity of tailings ponds is not sufficient. It can be recommended to use models when mapping the contamination plume, which, on the basis of geological and hydrodynamic data, make it possible to determine the extent and dynamics of the contamination, also allowing to select the rehabilitation strategies with a focus on generic and site specific contamination [168,169].

6.1.5. Assessment of Contamination Impact on Human Health

Although the threat of contamination to human health associated with the mining and processing of ores can be quantified by measuring the concentrations of individual trace elements in water, food, or dust, the problem remains how to assess the contamination risks when a population is exposed to a “cocktail” of PHEs for a long time, as in the case of the Zambian Copperbelt. In this particular case, it is necessary to use biomonitoring studies, which are based on the systematic measurements of internal exposure of PHEs in adults and children. Biomonitoring studies measure not only the intake of PHEs present in water, food, or dust, which is determined by their bioavailability and degree of gastrointestinal absorption, but also consider other factors, such as the duration of exposure, age, and health status of the studied population [170,171]. Several biomonitoring studies have been conducted in Cu–Co ore mining districts in the Democratic Republic of the Congo (DRC), documenting high concentrations of multiple trace elements in the urine or blood of residents or mine and smelter workers [21]. The result of these studies was the finding that, compared to areas without contamination, the contents of a whole range of trace elements in the urine and blood of residents and workers were several times higher in the vicinity of mines and smelters [172,173]. The urinary Co concentrations detected in this population were the highest ever reported for any residents. Using human hair and nails as biomarkers to assess the exposure of the PHEs to populations living near mine waste dump in the Zambian Copperbelt, Nakaona et al. [174] concluded that local inhabitants are at imminent health risk, because the tolerable daily intakes (PTDIs) of Mn, Pb, Ni, and Cd exceed the FAO-WHO tolerable limits [115]. It is recommended that biomonitoring studies should be performed both in areas that are contaminated by dust fallout from flotation and chemical waste storage facilities and in areas that are affected by fallout from smelters, so that pathways of exposure from different sources of contamination can be identified and assessed.

6.1.6. An Improvement of the Environmental Data Management System (EDMS)

One of the main objectives of the World Bank Copperbelt Environment Project [40] was the development and implementation of the Environmental Data Management System (EDMS) for the Zambia Environmental Management Agency (ZEMA, former Environmental Council of Zambia, ECZ). The system consists of a GIS platform, licensing and monitoring the information system and databases containing environmental regulated facilities and historical monitoring data [175]. However, the EDM system needs to be continuously supplemented with results that have been achieved in recent years in the study of environmental issues by several research teams [44]. Additionally, due to the lack of data from various time periods, the EDM system cannot be used to monitor changes and predict contamination intensity due to the rapid development of new mining and processing methods. To increase the efficacy of the EDM system, it should be continuously updated with the participation of a wide range of experts from various fields of environmental sciences, medical staff, epidemiologists, technologists, and economists.

6.2. Improving the Control and Management of Active and Future Mines

To improve the control and management of active and future mines, the following is recommended:
  • Increase responsibility for environmental legislation in Zambia;
  • Build a permanent water quality monitoring system in the Kafue River Watershed;
  • Build a permanent SO2 and particulate matter emission system in the industrial part of the Zambian Copperbelt Province;
  • Increase the Environmental Impact Assessment (EIA) performance.

6.2.1. Responsibility for Environmental Legislation in Zambia

Despite the progress in recent years, the environmental issues are still not adequately or systematically integrated into Zambia’s national development plans and program therein. Future studies should focus not only on mitigating the impact of old burdens, but particularly on better and more effective management of the active or future mining industry to improve the quality of the environment, management plans, and their implementation. This requires, in particular, a better implementation of existing environmental legislation, installation of air and water quality monitoring system, and an improvement of the quality and control of the Environmental Impact Assessments and Management Plans.
At present, the responsibility for environmental legislation belongs to the competence of several ministries, which naturally poses a large problem in its implementation. The situation is changing for the better through the relatively new Act on Environmental Management [39]. However, organizations with a comprehensive environmental management mandate suffer from insufficient resources and funding to fulfill their mandate, and have insufficient staff to adequately conduct environmental monitoring and auditing. The lack of effective control of the environmental liabilities of mines in operation leaves the existing legal framework largely unimplemented [176]. Better control and compliance with legal regulations and industry supervision are very much needed, especially when monitoring water and air quality.

6.2.2. Water Quality Monitoring System

The water quality monitoring system in the Zambian Copperbelt should be focused on observing water quality downstream from individual sources of contamination. The pH, conductivity, and turbidity values should be especially monitored. The measurements should be performed preferably continuously and the results should be made available online. The surface water quality monitoring network is recommended to be built according to the scheme developed by the Czech Team and Zambian Counterpart [72,76,94,95]. The installation of automatic monitoring stations powered by solar panels should also be considered. The system is to be set up to provide early warning to residents when water quality parameters exceed specified limits. This would enable the creation of an emergency response system and the fast reaction and resolution of the problems that arise.

6.2.3. Sulfur Dioxide and Particulate Matter Emissions

Due to technological progress, a reduction in SO2 emissions from metallurgical plants can be expected in the future. Although this monitoring of SO2 emissions is currently carried out by individual mining companies, it would be worth to install a control system not only in the immediate vicinity of SO2 sources, but also in urban areas using mobile or stationary monitoring stations to ensure an early warning system in case of accidents.
A considerable amount of attention must also be paid to the concentration of particulate matter (PM) in the air. This especially applies to fine PM10 and PM2.5 particles, which are potentially the most dangerous due to their small size, large surface area, deep penetration in the airways, and their ability to be retained in the lungs. Dust particles in the Copperbelt atmosphere come from a variety of sources. These are not only exhalations from smelters and mines, but also emissions from cement plants and limestone quarries, which mainly affect the city of Ndola, as well as “road dust” produced especially by road traffic. In order to distinguish between different sources of dust, and potentially also isotopes, tracers should be employed to identify individual sources of air contamination.

6.2.4. Environmental Impact Assessment (EIA) Performance

The Environmental Impact Assessment (EIA) performance appears to be improving in Zambia, but the quality of reporting remains rather low [177]. A checklist of required topics is often considered sufficient, but EIAs are more of a routine procedure than well-advised individual applications. This is a serious issue because mining operations can vary substantially in their environmental impact depending on geology and other factors. It can therefore be recommended that the existing sector specific guidelines on mining projects be compared to international standards and evaluated according to selected criteria [178]. Technical guidelines on wastes characterization and how to properly handle them should also be established. Early identification and selection of options and initiatives for water conservation and management are very important, especially for mining in regions where water resources are scarce. Regarding mine closure and reclamation plans, individual projects should be compiled and evaluated in comparison to the best available practice methods that are used in developed countries [179,180,181,182,183,184]. These plans, apart from the environmental agenda, must also take into account the possibility of using flotation tailings and slags for the extraction of metals and metalloids, for their use as construction sand (tailings) or for the development of transport infrastructure (granulated slag) [185,186].

7. Conclusions

Mining and processing of Cu–Co ores in the Zambian Copperbelt have historically been accompanied by poor environmental awareness and stewardship. This has had a significantly negative impact on the health of the local population, vegetation, flora, and fauna, and has resulted in serious damage to the local infrastructure. The main environmental issues caused by mining in the past include air pollution by SO2 emissions and particulate matter (PM), water pollution due to ore treatment and chemical plant leaks, and flotation tailings ponds seepage. Others are tailings dam instability due to inadequate maintenance, leakage of sludge into the drainage network, large-scale pollution of soils and vegetation with dust from mining operations, dry beaches of tailings ponds, and, in particular, emissions from metallurgical plants. These ecological and/or environmental issues that arose in the past will persist for decades, long after the closure of mining metallurgical operations. In some cases, especially in the vicinity of smelters, there have been irreversible environmental changes and damages that have resulted in the formation of wastelands. The study of old burdens and their impact during the mining and processing of ores on the environment in the Zambian Copperbelt allows not only to accept a number of proposals for the mitigation of historical burdens, but also to formulate and specify measures in order to increase the environmental control of active and future mines. These include a rigorous implementation of current legislation, especially in the field of strict control of environmental obligations of mining companies, long-term monitoring of air and water conditions (especially in densely populated parts of the Zambian Copperbelt), and, in particular, improving the quality of the EIA reports that are being prepared and evaluated within the licensing procedures. It is obvious that the fulfillment of these tasks requires legislative changes, the investment of capital and strengthening the capacity of governmental institutions responsible for mitigating the environmental impacts of mining, especially the Zambia Environmental Management Agency and the Department of Mines Safety in the Ministry of Mines and Mineral Development.
The capacity building of state organizations should be accompanied by close cooperation with academic and research centers that can provide excellent background knowledge regarding the issues related to soil contamination, stream sediment pollution, effects on agricultural products, as well as to assess the pathways of the contaminants’ dispersal and their attenuation. Moreover, the academic institutions can clarify and verify the impact of contaminants on the health of residents and the incidence of occupational diseases in areas affected by the hazards associated with mining and ore processing through biomonitoring and epidemiological studies. Last but not least, the strengthening of interest of the local population and local administrations in improving the environment and establishing non-governmental interest groups that would force mining companies to fulfill their environmental obligations and apply environmentally friendly technologies are highly desirable. Public awareness of environmental issues should be promoted, especially in local schools, parishes, NGOs, and communities.

Supplementary Materials

The following supporting information can be downloaded at: https://www.mdpi.com/article/10.3390/min13030384/s1. Figure S1. Contour map of Pb concentrations in the topsoil (a), contour map of the Pb concentrations in the deeper soil horizon (b), contour map of As concentrations in the topsoil (c), contour map of As concentrations in the deeper soil horizon. Table S1. The location, pH, Stot, CO2 (carbonates) values, and selected elements in the topsoil of the surveyed part of the Copperbelt province, Zambia. Table S2. The location, pH, Stot, CO2 (carbonates), and selected elements in the deeper soil horizon (a depth of 70 to 90 cm) of the surveyed part of the Copperbelt province, Zambia. Table S3. The pH values and concentration of selected elements in the water of the Kafue River catchment. Table S4. Concentrations of selected elements in sediments of the Kafue River catchment. Figure S2. Dry beaches of tailings ponds are in many places used as a playground for children. It is, therefore, necessary to restrict access to tailings ponds at ore treatment plants and ensure their security, especially in the vicinity of urban agglomerations. The Lubengele tailings pond.

Author Contributions

Conceptualization, B.K., O.S. and M.M.; data curation, I.K.; formal analysis, I.K.; investigation, B.K., O.S. and M.M.; methodology, B.K., O.S. and M.M.; writing—original draft, B.K. and O.S.; writing—review and editing, B.K. and I.N.; funding acquisition, M.M.; supervision, B.K. and I.N. All authors have read and agreed to the published version of the manuscript.

Funding

This review was completed within the Project No. 23-05051 S “Metals and their isotopes in active and abandoned mining areas of sub-Saharan Africa—towards understanding of their geochemistry and impacts”, funded by the Czech Science Foundation.

Data Availability Statement

Not applicable.

Acknowledgments

The authors are grateful to J. Pašava, P. Bezuško, J. Godany, V. Pecina, and P. Rambousek (Czech Geological Survey); J. Adamovič (Geological Institute, Academy of Sciences, Czech Republic); Z. Vencelides and J. Čížek (Protection of Groundwater Ltd., Prague); M. Tuhý (Institute of Mineralogy, Geochemistry and Mineral Resources, Faculty of Science, Charles University, Prague); F. Chibesakunda, M. Mwale, K. Mwamba, and A. Dokowe (Geological Survey Department, Ministry of Mines and Mineral Development, Zambia); and to S. Simasiku (University of Zambia, School of Mines, Geology Department) for their participation and initiative in field operations and in the interpretation of interim results produced during the years 2002–2022. The MS benefited from critical review by V.Ettler, three anonymous reviewers and from editorial handling.

Conflicts of Interest

The authors declare no conflict of interest.

References

  1. Nriagu, J.O. A history of global metal pollution. Science 1996, 272, 223–224. [Google Scholar] [CrossRef]
  2. Adamo, P.; Dudka, S.; Wilson, M.J.; McHardy, W.J. Chemical and mineralogical forms of Cu and Ni in contaminated soils from the Sudbury mining and smelting region. Canada. Environ. Pollut. 1996, 91, 11–19. [Google Scholar] [CrossRef] [PubMed]
  3. Plumlee, G.S. The environmental geology of mineral deposits. Rev. Econom. Geolog. 1999, 6, 71–116. [Google Scholar]
  4. Plumlee, G.S.; Morman, S.A. Mine wastes and human health. Elements 2011, 7, 399–404. [Google Scholar] [CrossRef]
  5. Blowes, D.W.; Ptacek, C.J.; Jambor, J.L.; Weisener, C.G. The geochemistry of acid mine drainage. In Treatise on Geochemistry; Lollar, B.S., Holland, H.D., Turekian, K.K., Eds.; Environmental Geochemistry; Elsevier: Amsterdam, The Netherlands, 2003; Volume 9, pp. 149–204. [Google Scholar]
  6. Bini, C. Environmental Impact of Abandoned Mine Waste: A Review; Nova Science; Nova Science Publishers, Inc.: New York, NY, USA, 2011; p. 90. ISBN 978-1-61324-837. [Google Scholar]
  7. Sarmiento, A.M.; Caraballo, M.A.; Sanchez-Rodas, D.; Nieto, J.M.; Parviainen, A. Dissolved and particulate metals and arsenic species mobility along a stream affected by acid mine drainage in the Iberian Pyrite Belt (SW Spain). Appl. Geochem. 2012, 27, 1944–1952. [Google Scholar] [CrossRef]
  8. Ettler, V. Soil contamination near non-ferrous metal smelters: A review. Appl. Geochem. 2016, 64, 56–74. [Google Scholar] [CrossRef] [Green Version]
  9. Ettler, V.; Mihaljevič, M.; Kříbek, B.; Majer, V.; Šebek, O. Tracing the spatial distribution and mobility of metal/metalloid contaminants in Oxisols in the vicinity of the Nkana copper smelter, Copperbelt province, Zambia. Geoderma 2011, 164, 73–84. [Google Scholar] [CrossRef]
  10. Ettler, V.; Konečný, L.; Kovářová, L.; Mihaljevič, M.; Šebek, O.; Kříbek, B.; Majer, V.; Veselovský, F.; Penížek, V.; Vaněk, A.; et al. Surprisingly contrasting metal distribution and fractionation patterns in copper smelter affected tropical soils in forested and grassland areas (Mufulira, Zambian Copperbelt). Sci. Total Environ. 2014, 473, 117–124. [Google Scholar] [CrossRef]
  11. Lanteigne, S.; Schindler, M.; McDonald, A.M.; Skeriew, K.; Abdu, Y.; Mantha, N.M.; Murayama, M.; Hawthorne, F.C.; Hochella, M.F., Jr. Mineralogy and weathering of smelter-derived spherical particles in soils: Implications for the mobility of Ni and Cu in the surficial environment. Water Air Soil Pollut. 2012, 223, 3619–3641. [Google Scholar] [CrossRef]
  12. Kříbek, B.; Majer, V.; Knésl, I.; Keder, J.; Mapani, B.; Kamona, F.; Mapani, B.; Kamona, F.; Mihaljevič, M.; Ettler, V.; et al. Contamination of soil and grass in the Tsumeb smelter area, Namibia. Modeling of contaminants dispersion and ground geochemical verification. Appl. Geochem. 2016, 64, 75–91. [Google Scholar] [CrossRef]
  13. Ettler, V.; Petráňová, V.; Vítková, M.; Mihaljevič, M.; Šebek, O.; Kříbek, B. Reactivity of fly ash from copper smelters in an Oxisol: Implications for smelter-polluted soil systems in the tropics. J. Soils Sediments 2016, 16, 115–124. [Google Scholar] [CrossRef]
  14. Jarošíková, A.; Ettler, V.; Mihaljevič, M.; Drahota, P.; Culka, A.; Racek, M. Characterization and pH dependent environmental stability of arsenic trioxide-containing copper smelter flue dust. J. Environ. Manag. 2018, 209, 71–80. [Google Scholar] [CrossRef] [PubMed]
  15. Jarošíková, A.; Ettler, V.; Mihaljevič, M. Penizek, Transformation of arsenic-rich copper smelter flue dust in contrasting soils: A 2-year field experiment. Environ. Poll. 2018, 237, 83–92. [Google Scholar] [CrossRef] [PubMed]
  16. Csavina, J.; Field, J.; Taylor, M.P.; Gao, S.; Landázuri, A.; Betterton, E.A.; Sáez, A.E. A review on the importance of metals and metalloids in atmospheric dust and aerosol from mining operations. Sci. Total Environ. 2012, 433, 58–73. [Google Scholar] [CrossRef] [PubMed] [Green Version]
  17. Darral, N.M. The effect of air pollutants on physiological processes in plants. Plants Cell Environ. 1989, 12, 1–30. [Google Scholar] [CrossRef]
  18. Mishra, P.C. Soil Pollution and Soil Organisms; Ashish Publishing House: New Delhi, India, 2011; p. 188. ISBN 10: 8131303446. [Google Scholar]
  19. Kříbek, B.; Majer, V.; Knésl, I.; Nyambe, I.; Mihaljevič, M.; Ettler, V.; Šráček, O. Concentrations of arsenic, copper, cobalt, lead and zinc in cassava (Manihot Esculenta Crantz) growing on incontaminated and contaminated soils of the Zambian Copperbelt. J. Afr. Earth Sci. 2014, 99, 713–723. [Google Scholar] [CrossRef]
  20. Banza, C.L.N.; Nawrot, T.S.; Haufroid, V.; Decrée, S.; De Putter, T.; Smolders, E.; Kabyla, B.I.; Luboya, O.N.; Ilunga, A.N.; Mutombo, A.M.; et al. High human exposure to cobalt and other metals in Katanga, a mining area of the Democratic Republic of Congo. Environ. Res. 2009, 109, 745–752. [Google Scholar] [CrossRef]
  21. Cheyns, K.; Banza, C.L.N.; Ngombe, L.K.; Asosa, J.A.; Haufroid, V.; De Putter, T.; Nawrot, T.; Kimpanga, C.M.; Numbi, O.L.; Ilunga, B.K.; et al. Pathways of human exposure to cobalt in Katanga, a mining area of the D. R. Congo. Sci. Total Environ. 2014, 490, 313–321. [Google Scholar] [CrossRef]
  22. Ettler, V.; Cihlová, M.; Jarošíková, A.; Mihaljevič, M.; Drahota, P.; Kříbek, B.; Vaněk, A.; Penížek, V.; Sraček, O.; Klementová, M.; et al. Oral bioaccessibility of metal(loid)s in dust materials from mining areas of northern Namibia. Environ. Int. 2019, 124, 205–215. [Google Scholar] [CrossRef]
  23. Smolders, E.; Roels, L.; Kuhangana, T.C.; Coorevits, K.; Vassilieva, E.; Nemery, B.; Lubaba Nkulu, C.B. 2019. Unprecedentedly high dust ingestion estimates for the general population in a mining district of DR Congo. Environ. Sci. Technol. 2019, 53, 7851–7858. [Google Scholar] [CrossRef] [PubMed]
  24. Muimba-Kankolongo, A.; Banza, C.; Nkulu, L.; Mwitwa, J.; Kampemba, F.M.; Nabuyanda, M.M.; Haufrois, V.; Smolders, E.; Nemery, B. Contamination of water and food crops by trace elements in the AfricanCopperbelt: A collaborative cross-border study in Zambia and the Democratic Republic of Congo. Environ. Adv. 2021, 6, 100103. [Google Scholar] [CrossRef]
  25. Banks, D.; Younger, P.L.; Arnesen, R.; Iversen, E.R.; Banks, S.B. Mine-water chemistry: The good, the bad and the ugly. Environ. Geol. 1997, 32, 157–174. [Google Scholar] [CrossRef]
  26. Boult, S. Fluvial metal transport near sources of acid mine-drainage: Relationships of soluble, suspended and deposited metal. Mineral. Mag. 1996, 60, 325–335. [Google Scholar] [CrossRef]
  27. Dinelli, E.; Tateo, F. Different types of fine-grained sediments associated with acid mine drainage in the Libiola Fe-Cu mine area (Ligurian Apennines, Italy). App. Geochem. 2002, 17, 1081–1092. [Google Scholar] [CrossRef]
  28. Lee, Y.-J.; Romanek, C.S.; Wiegel, J. Desulfosporosinus youngiae sp. nov., a spore forming, sulfate-reducing bacterium isolated from a constructed wetland treating acid mine drainage. Int. J. Syst. Evol. Microbiol. 2009, 59, 2743–2746. [Google Scholar] [CrossRef] [PubMed] [Green Version]
  29. Gray, N.F. Acid mine drainage composition and the implications for its impact on biotic systems. Water Res. 1998, 32, 2122–2134. [Google Scholar] [CrossRef]
  30. Schrenk, M.O.; Edwards, K.J.; Goodman, R.J.; Hemersand, R.J.; Banfield, J.F. Distribution of Thiobacillus ferrooxidans and Leptospirillum ferrooxidans: Implications for generation of acid mine drainage. Science 1998, 279, 1519–1522. [Google Scholar] [CrossRef] [Green Version]
  31. Nordstrom, D.K. Advances in the hydrogeochemistry and microbiology of acid mine waters. Int. Geol. Rev. 2000, 42, 499–5015. [Google Scholar] [CrossRef]
  32. Environmental Impacts Assessment Process in Zambia; Environmental Council of Zambia, Environmental Council of Zambia Statutary Instrument No. 28 of 1997. 1997, p. 38. Available online: https://wedocs.unep.org/bitstream/handle/20.500.11822/8968/-Environmental%20Impact%20Assessment%20Process%20in%20ZambiaEIA-Process%20Zambia.pdf. (accessed on 9 September 2022).
  33. Environmental Council of Zambia. State of Environment in Zambia 2000; Environmental Council of Zambia and Norwegian Agency for Development Cooperation: Lusaka, Zambia, 2000; p. 163. ISBN 978-99828-6. [Google Scholar]
  34. Environmental Council of Zambia. Zambia Environment Outlook Report 3; Environmental Council of Zambia: Lusaka, Zambia, 2008; p. 173. ISBN 978-9982-861-05-2. [Google Scholar]
  35. Zambia Environmental Management Agency. Zambia Environmental Outlook Report 4; Zambia Environmental Management Agency: Lusaka, Zambia, 2017; p. 142. ISBN 998-2705-989. [Google Scholar]
  36. Berglingen, T. Environmental Impacts of Mine Waste; Environmental Council of Zambia: Lusaka, Zambia, 1997; p. 32, unpublished work. [Google Scholar]
  37. Robertson and Kirsten Ltd. (In Association with Knight Piesold and African Mining Consultants). Environmental Impact Statement for Konkola, Mufulira, Nkana, Chambishi, Bchanga, Chibuluma and Luanshia Mining Licences; Mines Safety Department: Kitwe, Zambia, 1997; p. 24, Unpublished Work. [Google Scholar]
  38. World Bank. Zambia Copperbelt Environment Project (CEP); World Bank: Washington, DC, USA, 2015; p. 97. Available online: http://documents.worldbank.org/curated/en/615451468170065644/pdf (accessed on 15 September 2021).
  39. Environmental Management Act. No. 12 of 2011; Government of Zambia. 2011. Available online: https://www.parliament.gov.zm/sites/default/files/documents/acts/Environmetal%20Mangement%20Act%2012%20of%202011.pdf (accessed on 20 June 2022).
  40. The Mines and Minerals Development Act. Mines and Minerals Development No. 11 of 2015, 159; Government of Zambia. 2015, p. 159. Available online: https://www.ilo.org/dyn/natlex/docs/ELECTRONIC/101344/122055/F-1171521983/ZWE101344.pdf (accessed on 10 December 2021).
  41. Ncube, E.; Banda, C.; Mundike, J. Air pollution on the Copperbelt province of Zambia: Effect of sulphur dioxide on vegetation and humans. J. Nat. Environ. Sci. 2012, 3, 34–41. Available online: http://refhub.elsevier.com/S2405-8440(19)36145-6/sref32 (accessed on 15 February 2023).
  42. Lindahl, J. Environmental Impacts of Mining in Zambia: Towards Better Environmental Management and Sustainable Exploitation of Mineral Resources; SGU-Rapport 2014:22; Geological Survey of Sweden: Uppsala, Sweden, 2014; Volume 22, p. 26. [Google Scholar]
  43. Mwaanga, P.; Silondwa, M.; Kasali, G.; Banda, P.M. Preliminary review of mine air pollution in Zambia. Helion 2019, 5, e02485. [Google Scholar] [CrossRef]
  44. Peša, I. Between waste and profit: Environmental values on the Central African Copperbelt. Extractive Industries and Society 2021, 8, 100793. [Google Scholar] [CrossRef]
  45. Phiri, C.; Schimazui, D.; Otake, T.; Kikuchi, R.; Chintu, I.; Chirwa, M.; Kalaba, L.; Nyambe, I.; Satoa, T. Geochemical behaviour of heavy metals in sludge effluents and solid deposits on the Zambian Copperbelt: Implication for effluent treatment and sludge reuse. Sci. Tot. Environ. 2021, 769, 144342. [Google Scholar] [CrossRef] [PubMed]
  46. Aurélien, N.; Ousmane, S.; Pitiya, R.P. Zambia’s Copperbelt Area and Copper Mining: A Review. J. Geosci. Environ. Prot. 2022, 10, 67–75. [Google Scholar] [CrossRef]
  47. Mulenga, C. Soil governance and the control of mining pollution in Zambia. Soil Secur. 2022, 6, 100039. [Google Scholar] [CrossRef]
  48. Zambia Central Statistical Office. Census of Population and Housing—2010. Government of the Republic of Zambia. 2010. Available online: https://en.wikipedia.org/wiki/2010_Zambian_census (accessed on 15 February 2023).
  49. World Bank Group. Climate Portal. Climate Change Knowledge Portal—Zambia. Available online: https://climateknowledgeportal.worldbank.org (accessed on 25 May 2021).
  50. Mendelsohn, F. (Ed.) The Geology of the Northern Rhodesian Copperbelt; MacDonald: London, UK, 1961; p. 523. [Google Scholar]
  51. IUSS, 2014 Working Group WRB. World Reference Base for Soil Resources; 2014. International Soil Classification System for Naming Soils and Creating Legends for Soil Maps. World Soil Resources Reports No. 106; FAO: Rome, 2014; 192p, Available online: https://www.fao.org/3/i3794en/I3794en.pdf (accessed on 20 May 2022).
  52. FAO-UNESCO, 1997. Soil Map of the Word. Technical Paper 20. ISRIC Wageningen; 1997; 140p, ISBN 90-6672-057-3. Available online: https://www.fao.org/fileadmin/user_upload/soils/docs/isricu_i9264_001.pdf (accessed on 10 November 2021).
  53. Kříbek, B.; Majer, V.; Veselovský, F.; Nyambe, I. Discrimination of lithogenic and anthropogenic sources of metals and sulphur in soils of the central-northern part of the Zambian Copperbelt Mining District: A topsoil vs. subsurface soil concept. J. Geochem. Explor. 2010, 104, 69–86. [Google Scholar] [CrossRef]
  54. Rainaud, C.; Master, S.; Armstrong, R.A.; Robb, L.J. Geochronology and nature of the Palaeoproterozoic basement of theCentral African Copperbelt (Zambia and the Democratic Republic of Congo), with regional implications. J. Afr. Earth Sci. 2005, 42, 1–31. [Google Scholar] [CrossRef]
  55. Caileux, L.H.; De Putter, T. The Neoproterozoic Katanga Supergroup (D. R. Congo): State-of-the-art and revisions of the lithostratigraphy, sedimentary basin and geodynamic evolution. J. Afr. Earth Sci. 2019, 150, 522–531. [Google Scholar] [CrossRef]
  56. Sillitoe, R.H.; Perelló, J.; Creaser, S.; Wilton, J.; Wilson, A.; Dawborn, T. Age of the Zambian Copperbelt. Miner. Depos. 2017, 52, 1245–1268. [Google Scholar] [CrossRef]
  57. Armstrong, R.A.; Master, S.; Robb, L.J. Geochronology of the Nchanga Granite, and constraints on the maximum age of the KatangaSupergroup, Zambian Copperbelt. J. Afr. Earth Sci. 2005, 42, 32–40. [Google Scholar] [CrossRef]
  58. Liu, C.-F.; Zhang, J.; Tang, L.; Yang, F.; Guo, J.T.; Zhou, C.; Cai, Z.-W.; Bian, X.L. Detrital zircon U–Pb geochronology and provenance of the Neoproterozoic Lower Roan Group, Chambishi Basin, North-eastern Zambia: Implication for rift evolution of the Congo Craton. Geol. J. 2019, 55, 1245–1261. [Google Scholar] [CrossRef]
  59. Hitzman, M.W.; Broughton, D.; Selley, D.; Woodhead, J.; Wood, D.; Bull, S. The Central African Copperbelt: Diverse stratigraphic, structural and temporal settings the world’s largest sedimentary copper district. In Geology and Genesis of Major Copper Deposits and Districts of the World; A Tribute to Richard H Sillitoe; Hedenquiest, J.W., Harris, M., Camus, F., Eds.; Special Publications, Society of Economic Geologists: Littleton, CO, USA, 2012; Volume 16, pp. 487–514. Available online: https://www.researchgate.net/publication/284429710 (accessed on 10 November 2022).
  60. Cox, D.P.; Lindsey, D.A.; Singer, D.P.; Moring, B.C.; Diggles, M.F. Sediment-hosted copper deposits of the world: Deposit models and database. In U.S. Geological Survey Open File Report; USGS: Reston, VA, USA, 2007; pp. 3–107. [Google Scholar]
  61. Marjonen, R. Geological Map of the Kitwe–Mufulira Area to the Scale 1: 100,000; Quarter degree sheets 122 SW and part of 1228 NW; Geological Survey Department: Lusaka, Zambia, 2002; p. 1. [Google Scholar]
  62. Muchez, P.; Minnen, M.; Dewaele, D.; Hulsbosch, N. The Geology of the Mufulira Deposit Implications for the Metallogenesis of Arenite-Hosted Ore Deposits in the Central African Copperbelt. In Ore Deposits: Origin, Exploration, and Exploitation; Decrée, S., Robb, L., Eds.; Geophysical Monograph Series; American Geophysical Union: Washington, DC, USA, 2019; pp. 98–124. ISBN 9781119290537. [Google Scholar]
  63. Garrard, P. Geological Map of the Chingola Area to the Scale 1: 100,000. Degree Sheet 1227, SE Quarter; Geological Survey Department: Lusaka, Zambia, 1994. [Google Scholar]
  64. Mukwila, H. Geological map of the Copperbelt area to the scale 1: 150,000; MS Consulting Geologists Department, Konkola Copper Mines Plc.: Chingola, Zambia, 2002; Unpublished Map. [Google Scholar]
  65. Fraser, A.; Lungu, J. For Whom the Windfalls? Winners & Losers in the Privatisation of Zambia’s Copper Mines; Civil Society Trade Network of Zambia: Lusaka, Zambia, 2007; p. 87. Available online: https://sarpn.org/documents/d0002403/Zambia_copper-mines_Lungu_Fraser.pdf (accessed on 10 October 2022).
  66. Ruffini, A. Central Africa’s Copper Renaissance. WOMP (World of Mining Professionals); e-Journal. 2008, p. 16. Available online: www.womp-int.com/story/2008vol2/story024.htm (accessed on 15 August 2022).
  67. Zhai, X.-J.; Li, N.-J.; Zhang, X.; Fu, Y.; Jiang, L. Recovery of cobalt from converter slag of Chambishi Copper Smelter using reduction smelting process. Transac. Nonferrous Metals Soc. China 2011, 21, 2117–2121. [Google Scholar] [CrossRef]
  68. Cutler, C.J.; Natarajan, M.E.; Mponda, E.; Eksteen, J.J. Phasing out Reverberatory Furnace Operations at KCM Nkana. In Proceedings of the South African Pyrometalurgy Conference, Cradle of Humankind, South Africa, 5–8 March; South African Institute of Mining and Metallurgy Saxonwold: Johannesburg, South Africa, 2009; pp. 251–264. Available online: https://www.saimm.co.za/Conferences/Pyro2006/251_Nkana.pdf (accessed on 10 December 2022).
  69. Burrows, A.; Partington, P.; Sakala, J.; Mascrenhas, P.H. IsasmeltAM at Mufulira—Increased flexibility on the Zambian Copperbelt. In Sustainable Industrial Processing Summit, Volume 6: Aqueous, Low Temperature & Electrochemical Processing; Kongoli, F., Ed.; FLOGEN Stars Outreach: Mont-Royal, QC, Canada, 2012; p. 528. ISBN 978-0-9879917-5-1. [Google Scholar]
  70. Viítková, M.; Ettler, V.; Johan, Z.; Kříbek, B.; Šebek, O.; Mihaljevič, M. Primary and secondary phases in copper-cobalt smelting slags from the Copperbelt Province, Zambia. Min. Mag. 2010, 74, 581–600. [Google Scholar] [CrossRef]
  71. Flash Smelting Technology. An introduction to Metso Outotec Flash Smelting; Metso Outotec Corporation: Helsinki, Finland, 2023; p. 12. Available online: https://www.mogroup.com/globalassets/210617_mo_flash_smelting_technology_brochure_update-hr.pdf (accessed on 15 January 2023).
  72. Salminen, R.; Tarvainen, T.; Demetriades, A.; Duriš, M.; Fordyce, F.M.; Gregorauskiene, V.; Kahelin, H.; Kivisilla, J.; Klaver, G.; Klein, H.; et al. FOREGS Geochemical Mapping Field Manual; Geological Survey of Finland: Espoo, Finland, 1998; Volume 47, p. 36. [Google Scholar]
  73. Kříbek, B.; Nyambe, I. (Eds.) Evaluation of the Environmental Impacts of Copper and Cobalt Mining in the Zambian Part of the Copperbelt and a Heavy Metals and Sulfur Contamination and Monitoring System Proposal. Chambishi Area. Project of the Technical Aid of the Czech Republic to the Republic of Zambia in the Year 2002; Record Office—File Report No. 1/2003; Czech Geological Survey: Prague, Czech Republic, 2003; p. 140, Unpublished Work, Available on Request. [Google Scholar]
  74. Kříbek, B.; Nyambe, I. (Eds.) Assessment of Impacts of Mining and Mineral Processing on the Environment and Human Health in Selected Regions of the Central and Copperbelt Provinces of Zambia, Republic of Zambia. The Ndola Area. Project of the Development Cooperation Programme of the Czech Republic to the Republic of Zambia. Final report for the year 2009—The Ndola Area; MS Czech Geological Survey: Prague, Czech Republic, 2010; p. 157, Unpublished Work, Available on Request. [Google Scholar]
  75. Sracek, O.; Filip, J.; Mihaljevič, M.; Kříbek, B.; Majer, V.; Veselovský, F. Attenuation of dissolved metals in neutral mine drainage in the Zambian Copperbelt. Environ. Monitor. Assess. 2011, 172, 287–299. [Google Scholar] [CrossRef] [PubMed]
  76. Sracek, O.; Kříbek, B.; Mihaljevič, M.; Majer, V.; Veselovský, F.; Vencelides, Z.; Nyambe, I. Mining-related contamination of surface water and sediments of the Kafue River drainage system in the Copperbelt district, Zambia: An example of a high neutralization capacity system. J. Geoch. Explor. 2012, 112, 174–188. [Google Scholar] [CrossRef]
  77. Kříbek, B.; Mihaljevič, M.; Sracek, O.; Knésl, I.; Ettler, V.; Nyambe, I. The extent of arsenic and of metals uptake by aboveground tissues of Pteris vittata and Cyperus involucratus growing in copper- and cobalt-rich tailings of the Zambian Copperbelt. Arch. Environ. Contam. Toxicol. 2011, 61, 228–242. [Google Scholar] [CrossRef] [PubMed]
  78. Mihaljevič, M.; Ettler, V.; Šebek, O.; Sracek, O.; Kříbek, B.; Kyncl, T.; Majer, V.; Veselovský, F. Lead isotopic and metallic pollution record in tree rings from the Copperbelt mining-smelting area, Zambia. Water Air Soil Pollut. 2011, 216, 657–668. [Google Scholar] [CrossRef]
  79. Mihaljevič, M.; Jarošíková, A.; Ettler, V.; Vaněk, A.; Penížek, V.; Kříbek, B.; Chrastný, V.; Sracek, O.; Trubač, J.; Svoboda, M.; et al. Copper isotopic record in soils and tree rings near a copper smelter, Copperbelt, Zambia. Sci. Tot. Environ. 2018, 621, 9–17. [Google Scholar] [CrossRef]
  80. Quevauviller, P. Operationally defined extraction procedures for soil and sediment analysis I. Standardization. Trends Anal. Chem. 1998, 17, 289–298. [Google Scholar] [CrossRef]
  81. Adamo, P.; Zampella, M. Chemical speciation to assess potentially toxic metals (PTMs´) bioavailability and geochemical forms in polluted soils. In Site Characterization, Data Analysis and Case Histories; De Vivo, B., Belkin, H.E., Lima, A., Eds.; Environmental Geochemistry; Elsevier: Amsterdam, The Netherlands, 2008; pp. 175–212. ISBN 978-0-444-53159-9. [Google Scholar]
  82. Ettler, V.; Vítková, M.; Mihaljevič, M.; Šebek, O.; Klementová, M.; Veselovský, F.; Vybíral, P.; Kříbek, B. Dust from Zambian smelters: Mineralogy and contaminant bioaccessibility. Environ. Geochem. Health 2014, 36, 919–933. [Google Scholar] [CrossRef]
  83. Ettler, V.; Johan, Z.; Kříbek, B.; Veselovský, F.; Mihaljevič, M.; Vaněk, A.; Penížek, V.; Majer, V.; Sracek, O.; Mapani, B.; et al. Composition and fate of mine- and smelter-derived particles in soils of humid subtropical and hot semi-arid areas. Sci. Total Environ. 2016, 563–564, 329–339. [Google Scholar] [CrossRef]
  84. Twining, J.; McGlinn, P.; Loi, E.; Smith, K.; Gieré, R. Risk ranking of bioaccessible metals from fly ash dissolvedin simulated lung and gut fluids. Environ. Sci. Technol. 2005, 39, 7749–7756. [Google Scholar] [CrossRef] [PubMed]
  85. Ettler, V.; Kříbek, B.; Majer, V.; Knésl, I.; Mihaljevič, M. Differences in the bioaccessibility of metals/metalloids in soils from mining and smelting areas (Copperbelt, Zambia). J. Geochem. Explor. 2012, 113, 68–75. [Google Scholar] [CrossRef]
  86. Rauret, G.; Lopéz-Sánchez, J.F.; Sahuquillo, A.; Rubio, R.; Davidson, C.; Ureb, A.; Quevauviller, P. Improvement of the BCR three step sequential extraction procedure prior to the certification of new sediment and soil reference materials. J. Environ. Monit. 1999, 1, 57–61. [Google Scholar] [CrossRef] [PubMed]
  87. EN 12457-2, 2002; Characterisation of Waste—Leaching—Compliance Test for Leaching of Granular Waste Materials and Sludges—Part 2: One Stage Batch Test at a Liquid to Solid Ratio of 10 l/kg for Materials with Particle Size below 4 mm (without or with Size Reduction). Comite Europeen de Normalisation: Brussels, Belgium, 2002; p. 22. Available online: https://standards.iteh.ai/catalog/standards/cen/db6fbdf3-1de7-457c-a506-46c4898e3f09/en-12457-2-2002 (accessed on 10 May 2022).
  88. European Council. Decision of 19 December 2002 Establishing Criteria and Procedures for the Acceptance of Waste at Landfills Pursuant to Article 16 of and Annex II to Directive 1999/31/EC. Off. J. Eur. Comm. 2002, 11, 27–49. [Google Scholar]
  89. Vítková, M.; Ettler, V.; Hyks, J.; Astrup, T.; Kříbek, B. Leaching of metals from copper smelter flue dust (Mufulira, Zambian Copperbelt). Appl. Geochem. 2011, 26, S263–S266. [Google Scholar] [CrossRef]
  90. Vítková, M.; Ettler, V.; Mihaljevič, M.; Šebek, O. Effect of sample preparation on contaminant leaching from copper smelting slag. J. Hazard. Mater. 2011, 197, 417–423. [Google Scholar] [CrossRef]
  91. Vítková, M.; Hyks, J.; Ettler, V.; Astrup, T. Stability and leaching of cobalt smelter fly ash. Appl. Geochem. 2013, 29, 117–125. [Google Scholar] [CrossRef]
  92. Ettler, V.; Mihaljevič, M.; Drahota, P.; Kříbek, B.; Nyambe, I.; Vaněk, A.; Penížek, V.; Sracek, O.; Natherová, V. Cobalt-bearing copper slags from Luanshya (Zambian Copperbelt): Mineralogy, geochemistry, and potential recovery of critical metals. J. Geochem. Explor. 2022, 237, 106987. [Google Scholar] [CrossRef]
  93. Kříbek, B.; Nyambe, I. (Eds.) Impact Assessment of Mining and Processing of Copper and Cobalt Ores on the Environment in the Copperbelt, Zambia. Chingola and Chililabombwe Areas. Project of the Development Assistance Programme of the Czech Republic for the Years 2004–2006; Final Report for the Year 2005; Czech Geological Survey: Prague, Czech Republic, 2006; p. 196, Unpublished Work, Available on Request. [Google Scholar]
  94. Resongles, E.; Casiot, C.; Frydier, R.; Dezileau, L.; Viers, J.; Elbaz-Poulichet, F. Persisting impact of historical mining activity to metal (Pb, Zn, Cd, Tl, Hg) and metalloid (As, Sb) enrichment in sediments of the Gardon River, Southern France. Sci. Total Environ. 2014, 481, 509–521. [Google Scholar] [CrossRef]
  95. Sikaundi, G. Copper Mining Industry in Zambia: Environmental Challenges; Environmental Council of Zambia: Lusaka, Zambia, 2016; p. 28. [Google Scholar]
  96. Kříbek, B.; Nyambe, I. (Eds.) Impact Assessment of Mining and Processing of Copper and Cobalt Ores on the Environment in the Copperbelt, Zambia. Nsato, Mokambo and Kitwe Areas. Project of the Technical Aid of the Czech Republic to the Republic of Zambia in the Year 2004; Record Office—File Report No. 1/2005; Czech Geological Survey: Prague, Czech Republic, 2005; p. 160, Unpublished Work, Available on Request. [Google Scholar]
  97. Kříbek, B.; Nyambe, I. (Eds.) Impact Assessment of Mining and Processing of Copper and Cobalt Ores on the Environment in the Copperbelt, Zambia. Eastern Part of the Kitwe and Mufulira Areas. Project of the Technical Aid of the Czech Republic to the Republic of Zambia in the Year 2006; Czech Geological Survey: Prague, Czech Republic, 2007; p. 135, Unpublished Work, Available on Request. [Google Scholar]
  98. Sracek, O.; Mihaljevič, M.; Kříbek, B.; Majer, V.; Veselovský, F. Geochemistry and mineralogy of Cu and Co in mine tailings at the Copperbelt, Zambia. J. Afr. Earth Sci. 2010, 57, 14–30. [Google Scholar] [CrossRef]
  99. Sracek, O. Formation of secondary hematite and its role in attenuation of contaminants at mine tailings: Review and comparison of sites in Zambia and Namibia. Front. Environ. Sci. 2015, 2, 64. [Google Scholar] [CrossRef] [Green Version]
  100. Sracek, O.; Kříbek, B.; Mihaljevič, M.; Ettler, V.; Vaněk, A.; Penížek, V.; Filip, J.; Veselovský, F.; Nyambe, I. The impact of wetland on neutral mine drainage from mining wastes at Luanshya in the Zambian Copperbelt in the framework of climate change. Environ. Sci. Poll. Res. 2018, 25, 28961–28972. [Google Scholar] [CrossRef] [PubMed]
  101. Kosgei, H.; Mukuwa, M. Environmental Effects of Tailing Damps in the Zambian Copperbelt: A Review. Conference: “Enhacing Healthy, Safety and Environment Synergies to Combat Adverse Effects” Ndola Project: African Centre of Excellence (ACE II) in Sustainable Mining. 2020. Available online: https://www.researchgate.net/publication/341030787_ENVIRONMENTAL_EFFECTS_OF_TAILING_DAMPS_IN_THE_ZAMBIAN_COPPER_BELT_A_REVIEW_PAPER. (accessed on 13 November 2022).
  102. Nkandu, C. An Investigation into the Effects of Mining and Other Operations on the Water and Air Quality in the Chingola Area of the Zambian Copperbelt; Mines Safety Department: Kitwe, Zambia, 1996; p. 17, Unpublished Report. [Google Scholar]
  103. Investment Holdings Plc. Environmental Assessment of the Copperbelt and Kabwe areas Zambia; Copper and Cobalt Mining; MS E 539; Investment Holdings Plc.: Nkana Zambia, 2002; p. 268, Unpublished Work. [Google Scholar]
  104. Muma, D.; Besa, B.; Manchisi, J.; Banda, W. Effects of mining operations on air and water quality in Mufulira district of Zambia: A case study of Kankoyo Township. J. Sout. Afr. Inst. Min. Metall. 2020, 120, 287–298. [Google Scholar] [CrossRef]
  105. Limpitlaw, D. An Assessment of Mining Impacts on the Environment in the Zambian Copperbelt. Ph.D. Thesis, University of the Witwatersrand, Johannesburg, South Africa, 2003; p. 294. [Google Scholar]
  106. Vítková, M.; Ettler, V.; Šebek, O.; Mihaljevič, M.; Grygar, T.; Rohovec, J. The pH dependent leaching of inorganic contaminants from secondary lead smelter fly ash. J. Hazard. Mater. 2009, 167, 427–433. [Google Scholar] [CrossRef] [PubMed]
  107. Tuhý, M.; Ettler, V.; Rohovec, J.; Matoušková, Š.; Mihaljevič, M.; Kříbek, B.; Mapani, B. Metal(loid)s remobilization and mineralogical transformations in smelter-polluted savanna soils under simulated wildfire conditions. J. Environ. Manag. 2021, 293, 112899. [Google Scholar] [CrossRef] [PubMed]
  108. Konečný, L.; Ettler, V.; Kristiansen, S.M.; Amorim, M.J.B.; Kříbek, B.; Mihaljevič, M.; Šebek, O.; Nyambe, I.; Scott-Fordsmand, J.J. Response of Enchytraeus crypticus worms to high metal levels in tropical soils polluted by copper smelting. J. Geochem. Explo. 2014, 144, 427–432. [Google Scholar] [CrossRef] [Green Version]
  109. Ettler, V.; Vítková, M. Slag Leaching Properties and Release of Contaminants. In Metallurgical Slags: Environmental Geochemistry and Resource Potential; Piatak, N.M., Ettler, V., Eds.; Chemistry in the Environment Series No. 2, Chapter 5; Royal Society of Chemistry: London, UK, 2021; pp. 151–173. [Google Scholar] [CrossRef]
  110. Office of Solid Waste and Emergency Response. Estimation of Relative Bioavailability of Lead in Soil and Soil-Like Materials Using In Vivo and In Vitro Methods; Office of Solid Waste and Emergency Response: Washington, DC, USA, 2007; OSWER 9285; pp. 7–77. [Google Scholar]
  111. Caboche, J.; Perdrix, E.; Malet, B.; Alleman, L.Y. Development of an in vitro method to estimate lung bioaccessibilityof metals from atmospheric particles. J. Environ. Monit. 2011, 13, 621–630. [Google Scholar]
  112. Drysdale, M.; Bjorklund, K.L.; Jamieson, H.E.; Weinstein, P.; Cook, A.; Watkins, R.T. Calculating the respiratory bioaccessibility of nickel in soil through the use of simulated lung fluid. Environ. Geochem. Health 2012, 34, 279–288. [Google Scholar] [CrossRef]
  113. Baars, A.J.; Theelen, R.M.C.; Janssen, P.J.C.M.; Hesse, J.M.; van Apeldoorn, M.E.; Meijerink, M.C.M.; Verdam, L.; Zeilmaker, M.J. Re-Evaluation of Human-Toxicological Maximum Permissible Risk Levels; RIVM Report 711701 025; National Institute of Public Health and the Environment: Bilthoven, The Netherlands, 2001; 297p. [Google Scholar]
  114. Kříbek, B.; Majer, V.; Pašava, J.; Kamona, F.; Mapani, B.; Keder, J.; Ettler, V. Contamination of soils with dust fallout from the tailings dam at the Rosh Pinah Area, Namibia: Regional assessment, dust dispersion modeling and environmental consequences. J. Geochem. Explor. 2014, 144, 391–408. [Google Scholar] [CrossRef]
  115. Joint FAO/WHO Expert Committee on Food. Database of Food Additives and Pollutants. 2007. Available online: http://jecfa.ilsi.org/search.cfm. (accessed on 10 October 2021).
  116. Ngulube, R.; Katundu, L.; Nakena, K.; Nyirenda, K.; Siakamba, A. A review of Nchanga Tailings Dam operations and seasonal assessment of its effluent quality. Am. J. Environ. Prot. 2016, 5, 90–96. [Google Scholar] [CrossRef] [Green Version]
  117. The Zambian Environmental Management Agency. Environmental Management (Licesing) Regulations (S.I. No. 112 of 2013) Limits for Effluent and Waste Water. 2013, p. 36. Available online: https://leap.unep.org/countries/zm/national-legislation/environmental-management-licensing-regulations-si-no-112-2013. (accessed on 14 September 2022).
  118. M’kandawire, E.; Choongo, K.; Yabe, J.; Mwase, M.; Saasa, N.; Nakayama, S.M.M.; Bortey-Sam, N.; Blindauer, C.A. Sediment metal contamination in the Kafue River of Zambia and ecological risk assessment. Bull. Environ. Contam. Toxicol. 2017, 99, 108–116. [Google Scholar] [CrossRef] [PubMed]
  119. Norrgren, L.; Pettersson, U.; Örn, S.; Bergqvist, A. Environmental Monitoring of the Kafue River, Located in the Copperbelt, Zambia. Arch. Environ. Contam. Toxicol. 2000, 38, 334–341. [Google Scholar] [CrossRef] [PubMed]
  120. Pettersson, U.T.; Ingri, J.; Andersson, P.S. Hydrogeochemical processes in the Kafue River upstream from the Copperbelt Mining Area, Zambia. Aquat. Geochem. 2000, 6, 385–411. [Google Scholar] [CrossRef]
  121. Lubungu, M. Factors affecting the livestock herd size among smallholder households in Zambia. Trop. Anim. Health Prod. 2017, 49, 1607–1612. [Google Scholar] [CrossRef]
  122. Pollution Control Department. A Review of Factors Relevant to the Reported Incidence of Cattle Loses on Farms Bordering the Mwambashi River Zambia; Zambia Consolidated Copper Mines, Mining Industry Technical Services; Pollution Control Department: Bangkok, Thailand, 1982; 62p, MITS/PA/30/82, unpublished work. [Google Scholar]
  123. Kambole, M.S. Managing the water quality of the Kafue River. Phys. Chem. Earth 2003, 28, 1105–1109. [Google Scholar] [CrossRef]
  124. Poggio, L.; Vrščaj, B.; Hepperle, E.; Schulin, R.; Ajmone Marsan, F. Introducing a method of human health risk evaluation for planning and soil quality management of heavy metal polluted soil—An example from Grugliasco (Italy). Landsc. Urban Plan. 2008, 88, 64–72. [Google Scholar] [CrossRef]
  125. Hall, T. (Ed.) Risk and Prioritisation Framework for Abandoned Mine Management and Remediation; Technical Services, Department of Resources: State of Queensland, Australia, 2021. Available online: www.resources.qld.gov.au/_data/assets/pdf_file/0005/1552973/abandoned-mines-risk-prioritisation-framework.pdf (accessed on 15 May 2021).
  126. Demetriades, A. Hazard and exposure assessment in contaminated land investigations and environmental management. In Mapping the Chemical Environment of Urban Areas; Johnson, C.C., Demetriades, A., Locutura, J., Ottesen, R.T., Eds.; John Wiley & Sons Ltd.: Chichester, UK, 2011; pp. 151–172. [Google Scholar]
  127. Horvath, E.; Jordan, G.; Fugedi, U. Risk Assessment of Heavy Metals in Abandoned Mine Lands as Signifcant Contamination Problem in Romania. EGU General Assembly Held 19–24 April, 2009 in Vienna. p. 8916. Available online: http://meetings.copernicus.org/egu2009 (accessed on 15 November 2022).
  128. Ceto, N.; Mahmud, S. (Eds.) Abandoned Mine Site Characterization and Cleanup Handbook; United States Environmental and Protection Agency: Seattle, DC, USA, 2002; p. 127. ISBN 10-075673035:X. Available online: https://semspub.epa.gov/work/HQ/174437.pdf (accessed on 10 May 2022).
  129. Walmsley, B.; van Niekerk, W.; Terbrugge, P.; Ellmies, R.; Schneider, G. Risk Assessment Handbook for Shut down and Abandoned Mine sites in Namibia; BGR-GSN Technical Cooperation Project, Windhoek, Namibia; (CD Version); Geological Survey of Namibia: Windhoek, Namibia, 2010; p. 169. [Google Scholar]
  130. Hasheela, I.; Schneider, G.I.C.; Ellmies, R.; Haidula, A.; Leonard, R.; Ndalulilwa, K.; Shigwana, O.; Walmsey, B. Risk assessment methodology for shut-down and abandoned mine sites in Namibia. J. Geochem. Explor. 2014, 144, 572–580. [Google Scholar] [CrossRef]
  131. Albanese, S.; De Vivo, B.; Lima, A.; Frattasio, G.; Kříbek, B.; Nyambe, I.; Majer, V. Prioritising environmental risk at the regional scale by a GIS aided technique: The Zambian Copperbelt Province case study. J. Geochem. Explor. 2014, 144, 433–442. [Google Scholar] [CrossRef]
  132. Directive 2006/21/EC of the European Parliament and of the Council of 15 March 2006 on the Management of Waste from Extractive Industries and Amending. Available online: https://eur-lex.europa.eu/legal-content/EN/TXT/?uri=CELEX:31999L0045 (accessed on 24 April 2021).
  133. Directive 1999/45/EC of the European Parliament and of the Council of 31 May 1999 Concerning the Approximation of the Laws, Regulations and Administrative Provisions of the Member States Relating to the Classification, Packaging and Labelling of Dangerous Preparations. 1999. Available online: https://eur-lex.europa.eu/legal-content/EN/TXT/?uri=CELEX:31999L0045 (accessed on 25 April 2021).
  134. Rankin, W.J. Minerals, Metals and Sustainability: Meeting Future Material Needs; CSIRO Pub.: Collingwood, Australia, 2011; p. 419. ISBN 9780415684590. [Google Scholar]
  135. Sandell Festin, E. Post-Mining Restoration in Zambia Screening Native Tree Species for Phytoremediation Potential. MS Doctoral Thesis, Faculty of Forest Science Southern Swedish Research Centre Alnarp, Acta Universitatis Agriculturae Sueciae, Uppsala, Sweden, 2020. (Electronic Version); Volume 17. p. 72, ISBN 978-91-7760-553-9. Available online: http://pub.epsilon.slu.se/ (accessed on 15 January 2022).
  136. Franks, D.M.; Boger, D.V.; Côte, C.M.; Mulligan, D.R. Sustainable development principles for the disposal of mining and mineral processing wastes. Resour. Policy 2011, 36, 114–122. [Google Scholar] [CrossRef]
  137. Carrick, P.J.; Krüger, R. Restoring degraded landscapes in lowland Namaqualand: Lessons from the mining experience and from regional ecological dynamics. J. Arid Environ. 2007, 70, 767–781. [Google Scholar] [CrossRef]
  138. Chang, J.E.; Lin, T.T.; Lo, M.S.; Liaw, D.S. Stabilization/solidification of sludges containing heavy metals by using cement and waste pozzolans. J. Environ. Sci. Health 1999, 34, 1143–1160. [Google Scholar] [CrossRef]
  139. dos Reis, G.S.; Cazacliu, B.G.; Correa, C.R.; Ovsyannikova, E.; Kruse, A.; Sampaio, C.H.; Lima, E.C.; Dotto, G.L. Adsorption and recovery of phosphate from aqueous solution by the construction and demolition wastes sludge and its potential use as phosphate-based fertiliser. J. Environ. Chem. Eng. 2020, 8, 103605. [Google Scholar] [CrossRef]
  140. Laghlimi, M.; Baghdad, B.; Hadi, H.E.; Bouabdli, A. Phytoremediation mechanisms of heavy metal contaminated soils: A review. Open J. Ecol. 2015, 5, 375–388. [Google Scholar] [CrossRef] [Green Version]
  141. Weiersbye, I.M.; Witkovski, E.T.F.; Reichards, M. Floristic composition of gold and uranium tailings dams, and adjacent polluted areas, on South Africa’s deep-level mines. Bothalia—Afr. Biodivers. Conserv. 2006, 36, 101–127. [Google Scholar] [CrossRef] [Green Version]
  142. Sandell Festin, E.; Salk, C.; Tigabu, M.; Syampungani, S.; Christer Odén, P. Biological traits of tropical trees suitable for restoration of copper-polluted lands. Ecol. Eng. 2019, 138, 118–125. [Google Scholar] [CrossRef]
  143. Osei-Tutu, G.; Abunyewa, A.A.; Dawoe, E.K.; Agbenyega, O.; Barnes, R.V. Effect of multipurpose trees and shrubs on degraded mined-out soil in a semi-deciduous forest zone of West Africa. Land Degrad. Dev. 2018, 29, 3432–3439. [Google Scholar] [CrossRef]
  144. Ssenku, J.E.; Ntale, M.; Backeus, I.; Lehtila, K.; Oryem-Origa, H. Dynamics of plant species during phytostabilisation of copper mine tailings and pyrite soils, Western Uganda. J. Environ. Eng. Ecol. Sci. 2014, 3, 4. [Google Scholar] [CrossRef] [Green Version]
  145. Otte, M.L.; Kearns, C.C.; Doyle, M.O. Accumulation of arsenic and zinc in the rhizosphere of wetland plants. Bull. Environ. Contam. Toxicol. 1995, 55, 154–161. [Google Scholar] [CrossRef]
  146. Weis, J.S.; Weis, P. Metal uptake, transport and release by wetland plants: Implication for phytoremediation and restoration. Environ. Int. 2004, 30, 685–700. [Google Scholar] [CrossRef]
  147. Sheoran, A.S.; Sheoran, V. Heavy metal removal mechanism of acid mine drainage in wetlands: A critical review. Miner. Eng. 2006, 19, 105–116. [Google Scholar] [CrossRef]
  148. Mulenga, E.M.; Miller, H.B.; Sinkala, T.; Hysong, T.A.; Burgess, J.L. Silicosis and tuberculosis in Zambian miners. Int. J. Occup. Environ. Health 2005, 11, 259–262. [Google Scholar] [CrossRef]
  149. Greenberg, M.I.; Waksman, J.; Curtis, J. Silicosis: A Review. Dis.-A-Mon. 2007, 53, 394–416. [Google Scholar] [CrossRef] [PubMed]
  150. Canadian Council of Ministers of the Environment (CCME). Canadian Environmental Quality Guidelines. Canadian Council of Ministers of the Environment (CCME): Winipeg, Canada. 2000. Available online: https://ccme.ca/en/current-activities/canadian-environmental-quality-guidelines-and-https://ccme.ca/en/summary-table (accessed on 12 November 2020).
  151. EScIS Ltd. Environmental Data Management Software (ESdat). EScIS Ltd.: Byron Bay, Australia. 2022. Available online: https://esdat.net/environmental-standards/ (accessed on 6 May 2022).
  152. Dusengemungu, L.; Mubemba, B.; Gwanama, C. Evaluation of heavy metal contamination in copper mine tailing soils of Kitwe and Mufulira, Zambia, for reclamation prospects. Sci. Sci. Rep. 2022, 12, 11283. [Google Scholar] [CrossRef] [PubMed]
  153. Valavanidis, A.; Vlachogianni, T. Ecotoxicity test methods and ecological risk assessment. Aquatic and Terrestrial Ecotoxicology Tests under the Guidelines of International Organization. Sci. Adv. Environ. Chem. Toxicol. Ecotoxicol. 2015, 10, 1–27. Available online: https://www.researchgate.net/publication/281061444_Ecotoxicity_Test_Methods_and_Ecological_Risk_Assessment_Aquatic_and_Terrestrial_Ecotoxicology_Tests_under_the_Guidelines_of_International_Organizations. (accessed on 15 August 2022).
  154. OECD and EU Test Guidelines. Electronic version. European Chemical Agency. 2015. Available online: https://echa.europa.eu/support/oecd-eu-test-guidelines (accessed on 20 November 2021).
  155. Mirshal, I.A. Soil Pollution Origin, Monitoring & Remediation, 2nd ed.; Springer: Berlin/Heidelberg, Germany, 2008; p. 312. ISBN 978-3-5 40-70777-6. [Google Scholar]
  156. Hodson, M.E. The need for sustainable soil remediation. Elements 2010, 6, 363–368. [Google Scholar] [CrossRef]
  157. Douay, F.; Roussel, H.; Pruvot, C.; Loriette, A.; Fourrier, H. 2008. Assessment of a remediation technique using the replacement of contaminated soils in kitchengardens nearby a former lead smelter in Northern France. Sci. Total Environ. 2008, 401, 29–38. [Google Scholar] [CrossRef] [PubMed]
  158. Kaninga, B.; Lark, R.M.; Chishala, B.H.; Maseka, K.K.; Sakala, G.M.; Scott, D.; Tye, Y.A.; Hamilton, E.M.; Watt, M.J. Crop uptake of heavy metals in response to the environment and agronomic practices on land near mine tailings in the Zambian Copperbelt Province. Environ. Geochem. Health 2021, 43, 3699–3713. [Google Scholar] [CrossRef]
  159. Kříbek, B.; Nyambe, I.; Majer, V.; Knésl, I.; Mihaljevič, M.; Ettler, V.; Vaněk, A.; Penížek, V.; Sracek, O. Soil contamination near the Kabwe Pb-Zn smelter in Zambia: Environmental impacts and remediation measures proposal. J. Geochem. Explor. 2019, 197, 159–173. [Google Scholar] [CrossRef]
  160. Vysloužilová, M.; Tlustoš, P.; Száková, J. Cadmium and zinc phytoextraction potential of seven clones of Salix spp. planted on heavy metal contaminated soils. Plant Soil Environ. 2003, 49, 542–547. Available online: http://refhub.elsevier.com/S0883-2927(15)30055-X/sref176 (accessed on 10 September 2021). [CrossRef] [Green Version]
  161. Tack, F.M.G.; Meers, E. Assisted phytoextraction: Helping plants to help us. Elements 2010, 6, 383–388. [Google Scholar] [CrossRef]
  162. O’Day, P.A.; Vlassopoulos, D. Mineral-based amendments for remediation. Elements 2010, 6, 375–381. [Google Scholar] [CrossRef] [PubMed] [Green Version]
  163. Yang, J.; Mosby, D.E.; Casteel, S.W.; Blanchar, R.W. Lead immobilization using phosphoric acid in a smelter-contaminated urban soil. Environ. Sci. Technol. 2001, 35, 3553–3559. [Google Scholar] [CrossRef] [PubMed]
  164. Basta, N.T.; McGowen, S.L. Evaluation of chemical immobilization treatments for reducing heavy metal transport in a smelter-contaminated soil. Environ. Pollut. 2004, 127, 73–82. [Google Scholar] [CrossRef] [PubMed]
  165. Bade, R.; Oh, S.; Shin, W.S. Assessment of metal bioavailability in smelter contaminated soil before and after lime amendment. Ecotox. Environ. Safe. 2012, 80, 299–307. [Google Scholar] [CrossRef]
  166. Pettersson, U.A. Geochemical Study of the Kafue River, Zambia. Ph.D. Thesis, Luelå University of Technology, Luleå, Sweden, 2002; p. 29. [Google Scholar]
  167. Pettersson, U.T.; Ingri, J. The geochemistry of Co and Cu in the Kafue River as it drains the Copperbelt mining area, Zambia. Chem. Geol. 2001, 177, 399–414. [Google Scholar] [CrossRef]
  168. Bobba, A.G.; Singh, V.P. Groundwater contamination modelling. In Environmental Hydrology; Singh, V.P., Ed.; Water Science and Technology Library; Springer: Dordrecht, The Netherlands, 1995; Volume 15, pp. 225–319. [Google Scholar] [CrossRef]
  169. Al-Hashimi, O.; Hashim, K.; Loffill, E.; Marolt Cebašek, T.; Nakouti, I.; Faisal, A.A.H.; Al-Ansari, N.A. Comprehensive Review for Groundwater Contamination and Remediation: Occurrence, Migration and Adsorption Modelling. Molecules 2021, 26, 5913. [Google Scholar] [CrossRef] [PubMed]
  170. Ali, H.; Khan, E.; Ilahi, I. Environmental chemistry and ecotoxicology of hazardous heavy metals: Environmental persistence, toxicity, and bioaccumulation. J. Chem. 2019, 6730305. [Google Scholar] [CrossRef] [Green Version]
  171. Riediker, M.; Zink, D.; Kreyling, W.; Oberdörster, G.; Elder, A.; Graham, U.; Lynch, I.; Duschl, A.; Ichihara, G.; Ichihara, S.; et al. Particle toxicology and health—Where are we? Part. Fibre Toxicol. 2019, 16, 19. [Google Scholar] [CrossRef] [PubMed] [Green Version]
  172. Nemery, B.; Banza, L.N.C. Assessing exposure to metals using biomonitoring: Achievements and challenges experienced through surveys in low and middle-income countries. Toxicol. Lett. 2018, 298, 13–18. [Google Scholar] [CrossRef]
  173. Obadia, P.M.; Kayembe-Kitenge, T.; Haufroid, V.; Banza, L.N.C.; Nemery, B. Preeclampsia and blood lead (and other metals) in Lubumbashi, DR Congo. Environ. Res. 2018, 167, 468–471. [Google Scholar] [CrossRef]
  174. Nakaona, L.; Maseka, K.K.; Hamilton, E.M.; Watts, M.J. Using human hair and nails as biomarkers to assess exposure of potentially harmful elements to populations living near mine waste dumps. Environ. Geochem. Health 2020, 42, 1197–1209. [Google Scholar] [CrossRef]
  175. Staudt, M. Application of an environmental data management system for the Copperbelt Mining Areas, Zambia. In Proceedings of the 6th European Congress on Regional Geoscientific Cartography and Informations Systems, Munich, Germany, 9–12 June 2009; Project: Copperbelt Environmental Project 2007–2010, Zambia. Volume 1, pp. 94–97. Available online: https://www.researchgate.net/publication/271812042 (accessed on 10 November 2022).
  176. Shamba, I.O. An Overview of the Law Relating to the Environmental Protection and Pollution Control in Zambia—Administration and Enforcement. PhD. Thesis, Department of Law, School of Law and Social Sciences, The Zambian Open University, Lusaka, Zambia, 2008; p. 59, Unpublished Work. Available online: https://www.academia.edu/26702288/THE_ZAMBIAN_OPEN_UNIVERSITY_ENVIRONMENTAL_PROTECTION_AND_POLLUTION_CONTROL_IN_ZAMBIA_ADMINISTRATION_AND_ENFORCEMENT (accessed on 15 November 2022).
  177. Mubanga, R.O.; Kwarteng, K. A comparative evaluation of the environmental impact assessment legislation of South Africa and Zambia. Environ. Impact Assess. Rev. 2020, 83, 10641. [Google Scholar] [CrossRef]
  178. Wood, C. Environmental Impact Assessment: A comparative Review, 2nd ed.; Routledge: London, UK, 2002; p. 432. eBook; ISBN 978131583895. [Google Scholar] [CrossRef]
  179. Laurence, D. Establishing a sustainable mining operation: An overview. J. Clean. Prod. 2011, 19, 278–284. [Google Scholar] [CrossRef]
  180. Fourie, A.; Brent, A. A project-based Mine Closure Model (MCM) for sustainable asset life cycle management. J. Clean. Prod. 2005, 14, 1085–1095. [Google Scholar]
  181. Amirshenava, S.; Osanloo, M. Mine closure risk management: An integration of 3D risk model and MCDM techniques. J. Clean. Prod. 2018, 184, 389–401. [Google Scholar] [CrossRef]
  182. Fonseca, A.; Sánchez, L.E.; Ribeiro, C.J. Reforming EIA systems: A critical review of proposals in Brazil. Environ. Impact Assess. Rev. 2017, 62, 90–97. [Google Scholar] [CrossRef]
  183. Sánchez, L.E.; Silva-Sánchez, S.S.; Neri, A.C. Guide for Mine Closure Planning; Instituto Brasileiro de Mineração: Belo Horizonte, Brazil, 2014; p. 224. ISBN 978-85-61993-05-4. [Google Scholar]
  184. Unger, C.J.; Lechnerab, A.M.; Kenway, J.; Glenn, V.; Walton, A. A jurisdictional maturity model for risk management, accountability and continual improvement of abandoned mine remediation programs. Resour. Policy 2015, 43, 1–10. [Google Scholar] [CrossRef]
  185. Ettler, V.; Mihaljevič, M.; Stranad, L.; Kříbek, B.; Hrstka, T.; Kamona, F.; Mapani, B. Gallium and germanium extraction and potential recovery from metallurgical slags. J. Clean. Prod. 2022, 379, 134677. [Google Scholar] [CrossRef]
  186. Golik, V.I.; Klyuev, R.V.; Martyushev, N.V.; Brigida, V.; Efremenkov, E.A.; Sorokova, S.N.; Mengxu, Q. Tailings utilization and zinc extraction based on mechanochemical activation. Materials 2023, 16, 726. [Google Scholar] [CrossRef]
Figure 2. Main sources of contamination in the Zambian Copperbelt. (a) Mimbula Open Pit waste rock dump (the Chingola region). Soluble sulfates and fine fractions of the deposit were washed out and deposited on a local drainage pattern. Aerial photography. (b) Leaking of water from the flotation tailings dam in Chingola results in the formation of iron-rich precipitates which contain from 25% to 40% Fe2O3 and a range of trace elements (As, Co, Cr, Cu, Hg, Mo, Ni, Se, and Zn). (c) Collapse of the flotation tailings dam results in a massive siltation of local watercourse in the Luanshya Mining District. (d) Sandstorm over a dry beach of the active Mindolo Flotation tailings impoundment west of the Kitwe Township. The dust from the impoundment contaminates the agricultural land in its wide vicinity. The author of the photos: Bohdan Kříbek.
Minerals 13 00384 g002
Figure 3. Main sources of contamination in the Zambian Copperbelt. (a) A part of old flotation tailings are eroded using hydraulic washing and they are processed in a chemical leaching plant in the Chingola Township. (b) An excess of tailings after hydraulic washing deposited in the Chingola River due to the insufficient capacity and low maintenance of the local Control Dam in Chingola. (c) The Bwana Mkubwa Chemical wastes dam. The dam is strongly deformed by erosion and seepage of technological waters. Light gray material at the foot of the tailings pond is used for dam stabilization. (d) Effects of sulfur dioxide emissions on buildings in the Kankoyo Township, part of Mufulira Town are documented by a rapid corrosion of steel roofs and discoloration of wall painting. Gardening in the backyards of houses in the immediate vicinity of the Mufulira Smelter is not possible due to high SO2 loads. The author of the photos: Bohdan Kříbek.
Minerals 13 00384 g003
Figure 4. Concentrations of sulfur dioxide in the air in selected monitoring points in Kitwe, Zambia. Red arrow indicates the direction of prevailing dust fallout from the Nkana Smelter. After Kříbek and Nyambe [93].
Minerals 13 00384 g004
Figure 5. (a) Concentrations of Cu, Co, and Pb in ambient air in selected basic and high schools in Kitwe, Zambia. Red arrow indicates prevailing wind direction. (b) Voluntary collaborator in the particulate matter (PM) sampling, Ms. Jean Chokwe, Mukuba High School. The measurements were carried out at 8 h intervals. After Kříbek and Nyambe [93].
Minerals 13 00384 g005
Figure 6. Distribution of pH, Fe, Mn, Stot, and trace elements in a heavily polluted Ferrasol profile, located 1 km north-west of the Nkana Smelter (SW outskirts of the Kitwe Township), Zambia. Modified after Kříbek and Nyambe [93].
Minerals 13 00384 g006
Figure 7. Contour maps of selected parameters on Zambian Copperbelt Mining districts. (a) Contour map of the pH values in the topsoil, (b) contour map of the total S (Stot) in the topsoil, (c) contour map of the Cu concentrations in the topsoil, (d) contour map of the Cu concentrations in the deeper soil horizon. Sampling sites are shown as black dots. Modified after Kříbek and Nyambe [74].
Minerals 13 00384 g007
Figure 8. Contour maps of selected parameters on Zambian Copperbelt Mining districts. (a) Contour map of the Co concentrations in the topsoil, (b) contour map of the Co concentrations in the deeper soil horizon, (c) contour map of the Ni concentrations in the topsoil, (d) contour map of the Ni concentrations in the deeper soil horizon. Sampling points are shown as black dots. Modified after Kříbek and Nyambe [74].
Minerals 13 00384 g008
Figure 9. Contour map of the Coeficient of the Industrial Contamination (CIP) in topsoil in the surveyed area of the Zambian Copperbelt. Sampling points are shown as black dots. Modified after Kříbek and Nyambe [74].
Minerals 13 00384 g009
Figure 10. Different morphology of collected PM from the mining area (from crushers), and from the smelter area. (a) Coarse grained dust from crusher, Chingola area, (b) spherical particles of chalcantite (CuSO4 · 5H2O) from the Pierce-Smith convertor, and (c) clusters of fine metalliferous dust particles from the electric furnace, the Nkana Smelter, Kitwe area. SEM, back-scattered electrons. Modified after Kříbek and Nyambe [93].
Minerals 13 00384 g010
Figure 11. Comparison of metal(loid) contents in individual parts of cassava, sweet potato, and maize growing in the same stand in the Ndola Region, Zambia. Concentration in mg/kg (total dry weight). Modified after Kříbek and Nyambe [74].
Minerals 13 00384 g011
Figure 12. Concentrations of Cu and Co in the water of the Kafue River Catchment, Zambian Copperbelt Mining districts. Concentration in µg/L, filtered water. Sampling campaign 2008 and 2009, average data. Values exceeding the water effluent discharge limit in Zambia are printed in bold. Sampling sites description: 1. An inflow of the Kafue River to the Copperbelt area (reference point of the non-contaminated Kafue); 2. Lubengele River, tributary of the Kafue River from the Chililabombwe industrial area; 3. Mushishima River polluted with washed-out material from old flotation tailings south of Chingola re-processed through chemical leaching plant, tributary of the Kafue River; 4. Kafue River, after junction with contaminated Mushishima and Chililabombwe rivers; 5. Changa River, contaminated with overflow from the Chingola KCM thickeners. Tributary to the Kafue River; 6. Kafue River, after passing through the Chingola industrial area; 7. Mufulira River, tributary to the Kafue from an area of large tailing ponds south of Mufulira; 8. Kafue River, after junction with the Mufulira River; 9. Musakashi River, tributary to the Kafue River from an area of large tailing ponds north of Chambishi Town; 10. Kafue River, middle stream; 11. Mbabwashi River, tributary to the Kafue River from an area of large tailing ponds south of the Chambishi Town; 12. Kafue River, middle stream; 13. Mindolo River, tributary to the Kafue River from an area of tailing ponds of the Mindolo Mine; 14. Kitwe River, flowing through the waste dumps area west of Kitwe; 15. Uchi River polluted with industrial water released from the Nkana Smelter and Chemical Plant. Tributary of the Kafue River; 16. Wusakile River, tributary to the Kafue River from an area of the Nkana Industrial Complex; 17. Kafue River after passing the Kitwe industrial area; 18. Kafue River, outflow from the Copperbelt industrial area.
Minerals 13 00384 g012
Figure 13. Components of contaminated sediments of the Kafue River and its tributaries in the Zambian Copperbelt districts. (a) Cu-phosphate (CuP—pseudomalachite?) with the accumulation of native copper (Cu) and grain of microcline (Kfs), the Changa River. (b) Bornite (Bn), malachite or azurite (? Mi), apatite (Ap), covellite (Cv), and zircon (Zr), the Kafue River, Chingola area. (c) Intermediate solid solution of Cu, Fe, and S (SM), and magnetite-rich slag glass (Gmt) in sediments of the Uchi River (tributary of the Kafue River in Kitwe). (df) Chemical composition of different types of intermediate solid solution particles (Cu–Fe–S, Cu–Fe–Co–S, and Cu–Fe–S–O) in sediments of the Uchi River, tributary to Kafue, Kitwe area. SEM, backscattered electrons. Modified after Sracek et al. [75].
Minerals 13 00384 g013
Figure 14. (a) An example of the spontaneous revegetation of an old overburden dump in the Minambe region, north of Mufulira, Zambian Copperbelt. (b) A successful water remediation of the abandoned Mindolo slimes deposit, west of Kitwe, Zambian Copperbelt (b). Photographs by Bohdan Kříbek.
Minerals 13 00384 g014
Table 1. The chemical composition of the dust fall in the Mukuba, Nkana, Wusalile and Ndeke schools in Kitwe (average data, n = 7), Zambia. The Mukuba High School is located 3.2 km downwind of the Nkana Smelter, the Nkana High School 1.6 km downwind of the smelter. The Wusakile and Ndeke schools are located upwind of the Nkana Smelter. For location of sampling sites, see Figure 5. The dust fall was monitored from 21 July to 27 July 2005 by portable samplers. Sampling was carried out in cooperation with the staff of the individual schools. The concentration of trace elements is in μg/m3 of normalized air, concentrations of Fe and Ca are in mg/m3. After Kříbek and Nyambe [93].
Sampling SiteMukuba SchoolNkana SchoolWusaklile SchoolNdeke School
Distance from the Nkana Smelter3.2 km Downwind1.6 km Downwind2.9 km Upwind4.2 Km Upwind
μg/m3
Be0.000480.0010.00050.001
Al0.4730.5130.5010.505
Cr0.0250.0250.0230.035
Mn0.0210.0180.0170.026
Co0.0080.0060.0030.004
Ni0.01050.0080.0050.034
Cu0.1080.0590.0430.051
Zn1.0981.0651.0380.976
As0.00170.00170.00150.0015
Mo0.00540.001560.001560.0209
Cd0.004730.012940.006080.0051
Pb0.0520.4980.1870.019
mg/m3
Fe0.00080.00090.000880.00117
Ca0.000880.001630.00130.00094
Table 2. The pH values, SO42− (mg/L), and selected trace element concentrations (μg/L) in filtered water at an inflow (Sampling site 1) and at an outflow (Sampling site 16) of the Kafue River to and from industrial part of the Zambian Copperbelt. Sampling period: 2008–2009, average values [74]. For sampling site location, see Figure 12. Water effluent discharge limits for Zambia [117] are given for comparison.
Sampling SitepHSO4AlAsBaCoCuMnMoNiPPbSeZn
1 (Kafue River Inflow)6.61.024.5<0.515.3<0.053.512.5<0.10.1133.50.110.051.7
18 (Kafue River outflow)6.879.520.50.837.933.152.31581.180.8262.10.250.913.7
Water effluent discharge limit, Zambia6.0–9.01500250050500100015001000500050018,0005002010,000
Table 3. Concentration of Stot, Fe, and selected trace elements in stream sediments at the inflow of Kafue River (Sampling site 1, Figure 12) and the outflow from the industrial part of the Zambian Copperbelt (Sampling site 16, Figure 12). Concentrations of Stot and Fe in wt.%, concentration of trace elements in mg/kg. Modified after Kříbek and Nyambe [74].
Sampling SiteStotFeCrCoNiCuZnPbAsHgMn
1 (Kafue River inflow to the industrial part of the Copperbelt)0.08.2.2764182716162.58.50.360.026117
18 (Kafue River outflow from the industrial part of the Copperbelt)0.132.014054023152055.524.53.770.112251
Disclaimer/Publisher’s Note: The statements, opinions and data contained in all publications are solely those of the individual author(s) and contributor(s) and not of MDPI and/or the editor(s). MDPI and/or the editor(s) disclaim responsibility for any injury to people or property resulting from any ideas, methods, instructions or products referred to in the content.

