Article

Lithofacies and Shale Oil Potential of Fine-Grained Sedimentary Rocks in Lacustrine Basin (Upper Cretaceous Qingshankou Formation, Songliao Basin, Northeast China)

1
Key Laboratory of Ministry of Education on Safe Mining of Deep Metal Mines, School of Resources and Civil Engineering, Northeastern University, Shenyang 110819, China
2
Key Laboratory of Liaoning Province on Deep Engineering and Intelligent Technology, Northeastern University, Shenyang 110819, China
3
China National Oil and Gas Exploration and Development Company Ltd. (CNODC), Beijing 100034, China
4
Daqing Oilfield Limited Company, Daqing 163002, China
5
School of Resources and Materials, Northeastern University at Qinhuangdao, Qinhuangdao 066004, China
6
National Engineering Research Center of Offshore Oil and Gas Exploration, Beijing 100028, China
7
Exploration and Development Research Institute of Daqing Oilfield Co., Ltd., Daqing 163318, China
*
Authors to whom correspondence should be addressed.
Minerals 2023, 13(3), 385; https://doi.org/10.3390/min13030385
Submission received: 7 December 2022 / Revised: 23 February 2023 / Accepted: 7 March 2023 / Published: 9 March 2023

Abstract

:
Shale oil has become a global hotspot of unconventional exploration and development. In this study, the latest drill core and experiment analyses of the Qingshankou Formation in the northern Songliao Basin were used to evaluate its lithofacies classification, sedimentary environment, pore types, pore-throat structure characterization, and shale oil potential. Lithofacies classification was determined according to the total organic carbon (TOC) content, sedimentary structure, and rock mineral content. Laminae genesis and micro-sedimentary structures indicate the deposition of fine-grained sedimentary rocks (FGSRs) in a semi-deep to deep lacustrine environment; however, evidence also suggests partial reworking by storm events and bottom current flows. FGSRs mostly comprise type I kerogen, with small amounts of type II1. The average vitrinite reflectance of the FGSRs was 1.37%, indicating middle to high stages of thermal maturation within the oil generation window. The N2 adsorption experiment indicated that silty mudstone (SM), silty fine mixed sedimentary rock (SFMR), and argillaceous fine mixed sedimentary rock (AFMR) had ink-bottle-shaped and slit-shaped pores, and the lithofacies were dominated by mesopores, accounting for 77.4%, 71.9%, and 80.8% of the total pore volume, respectively. Mercury injection capillary pressure analysis indicated that SM and SFMR had an average pore-throat radius of 0.01–0.04 μm, whereas AFMR and CM were dominated by nanopores, mainly distributed in the range of 0.004–0.0063 μm. Based on the comprehensive studies of TOC content, pore development, and brittleness, we concluded that organic-rich laminated SM and SFMR should be the focus of shale oil exploration of the Qingshankou Formation in the northern Songliao Basin, followed by organic-rich or organic-moderate laminated and layered AFMR, as well as calcareous fine mixed sedimentary rocks.

1. Introduction

With the advancement of horizontal drilling and hydraulic fracturing technology, unconventional resources in global petroliferous basins, including tight sandstone oil, shale gas and oil, and coalbed methane, have recently been explored and developed successfully [1,2,3,4,5,6]. Therefore, fine-grained sedimentary rocks (FGSRs) have received attention for their vast unconventional hydrocarbon resources, notably shale oil [7,8,9,10]. FGSRs were first proposed by Krumbein [11] according to their grain size, which included rocks with dominant grains < 0.0625 mm in diameter [12]. FGSRs are poorly understood because of their very fine grain size, complex compositions, and homogeneous sedimentary structures. Clay and carbonate minerals, organic matter (OM), volcanic ash, and quartz and feldspar minerals can be found in FGSRs; hence, they usually exhibit mixed composition characteristics [13]. FGSRs have a longstanding interpretation of having been deposited in quiet water bodies due to suspension [14], and they are described as “massive” or “structureless”. However, these beliefs have been challenged in recent years through detailed analyses of thin sections, scanning electron microscopy (SEM) observations, and flume experiments [15,16]. Shales and mudstones could be deposited in low-energy and bottom-current conditions, as they exhibit intermittent erosion characteristics [17].
Research on FGSR lithofacies includes their mineral composition, OM content, and sedimentary structures. Lithofacies analysis can aid in the reconstruction of paleoenvironments and paleoclimates, sedimentary processes, and reservoir quality to further understand shale oil enrichment mechanisms [18,19,20,21,22]. Reservoir quality is an essential aspect in evaluating shale oil storage and seepage capacity; however, due to the very fine grain size and micro/nanoscale reservoir space, it is difficult to analyze pore structure through conventional analytical techniques. Owing to the ultra-low permeability of shale and mudstone, the pulse-decay experiment is widely used to measure shale permeability [23,24]. The double-porosity, dual-continuum model has also been investigated in detail [24]. The dynamic properties of shales are important for shale oil development because they can reflect the change trends of shale properties with different pressures and temperatures. In recent years, some new techniques have been used to evaluate pore spaces and structures, including SEM, transmission electron microscopy, atomic force microscopy, focused ion beam scanning electron microscopy, constant velocity mercury injection, micron computed tomography, nanometer computed tomography, nuclear magnetic resonance, and gas adsorption (N2, CH4, and CO2) [25,26,27,28,29,30,31,32]. The integration of multiple techniques can qualitatively and quantitatively describe the pore morphology, volume, size distribution, and architecture, pore and pore-throat connection, and fractal behavior [31,33,34].
Shale oil and gas have been successfully explored in North America, where they are concentrated in Devonian, Carboniferous, Permian, and Cretaceous formations, including the Bakken Shale in the Williston Basin [2,35], the Barnett Shale in the Fort Worth Basin [36], and the Eagle Ford Shale in southern Texas [37]. These commercial development shale oils are concentrated in marine sedimentary layers composed of highly brittle minerals. Shale oil has also been explored in Canada [38], NW Europe (Poland, Germany, the UK, and France) [39], Mexico, India, and Australia [40], where it is also concentrated in marine shales. Similarly, China has recently had success in exploring continental lacustrine shale oil, demonstrating notable potential [41,42]. At present, shale oil has been discovered in the following formation and basins: the Shahejie Formation in the Dongying Sag [43,44], the Luocaogou Formation in the Jimusaer Sag [45], the Kongding Formation in the Cangdong Sag [46], the Yanchang Formation in the Ordos Basin [21], the Lianggaoshan Formation in the Sichuan Basin [47], and the Qingshankou Formation in the Songliao Basin [48,49]. Among these basins, the Songliao Basin has demonstrated excellent prospects for shale oil extraction, with predicted geological reserves of 12.68 × 10⁸ t [50]; the horizontal well YP1 in the Gulong Sag of the Qingshankou Formation initially produced 30.52 t/d [51]. However, the recognition of FGSRs in the Qingshankou Formation of the Northern Songliao Basin is novel [52].
The paleoenvironments of the FGSRs, the relationship between their lithofacies and reservoir quality, and the shale oil potential of different lithofacies should be comprehensively analyzed. This study aimed to determine the lithofacies and reservoir characteristics of FGSRs in the Qingshankou Formation by using mineralogical and geochemical analyses, as well as pore structure data, and combining these with the latest exploration results to provide essential information on continental shale oil exploration.

2. Geological Setting

The Songliao Basin is one of the largest petroliferous basins, with an area of approximately 260,000 km2, located in northeastern China (Figure 1A). The basin has an NNE-SSW trend, with a length of 750 km and a width of approximately 370 km [53]. It can be divided into six first-order structural units: the Northern Plunge, Western Slope, Southwestern Uplift, Central Deep Depression, Northeastern Uplift, and Southeastern Uplift [54]. The Central Deep Depression is an important petroleum exploration area, encompassing the main shale oil and gas distribution districts, such as the Qijia-gulong and Sanzhao Sags (Figure 1A and Figure 2). The study area was mainly located in Qijia-gulong Sag, covering an area of approximately 15,000 km2 (Figure 1B).
The Songliao Basin has experienced a complex tectonic evolution, which can be divided into four periods: the pre-rift (Late Jurassic), syn-rift subsidence (Early Cretaceous), post-rift (thermal subsidence) (Middle Cretaceous), and overprinted basin inversion (Late Cretaceous to Quaternary period) stages [55]. The basin is filled with Mesozoic to Cenozoic terrestrial clastic rocks, including conglomerate, fine sandstones, silty stones, muddy siltstones, mudstones, and shale, with a thickness of approximately 7000 m (Figure 3). The basal layer of the basin comprises Paleozoic metamorphic and granite rocks and is approximately 3000 m thick. The Cretaceous strata, known for their abundant petroleum resources, can be divided into the Lower (Huoshiling, Shahezi, Yingcheng, Denglouku, and Quantou Formations) and Upper Cretaceous (Qingshankou, Yaojia, Nenjiang, Sifangtai, and Mingsui Formations) (Figure 2 and Figure 3). The basin experienced five small-scale uplift and erosion events from the Upper Cretaceous to the Neogene, caused by tectonic movement of the Pacific plate subducting westward to the northeast Asian plate in the late Cretaceous [53,56]. The basin also experienced complex sedimentary evolution, resulting in diverse sedimentary facies (shallow lake, deep lake, delta, fan delta, meandering river, alluvial fan, and floodplain) (Figure 3). Two lake flooding periods during the Upper Cretaceous, the Qingshankou and Nenjing Formations, formed the primary source rocks of the Songliao Basin (Figure 3). The target layer, the Qingshankou Formation, formed during the first large-scale lacustrine flooding period under a humid climate (Figure 3), and deposited thick black mudstones and shales (100 m). The main targets for shale oil exploration and development are the FGSRs of the Qingshankou Formation.

3. Samples and Methods

Seven typical wells (X2HC, X3HC, X7, X8HC, X851, X34, and X58) were selected (well location is shown in Figure 1B) for the lithofacies and reservoir quality analyses, including petrographic analysis, SEM, geochemistry analysis, low-pressure N2 adsorption, and mercury injection capillary pressure (MICP) analysis. In addition, partly X-ray diffraction (XRD) data, permeability, and porosity data were obtained from the Exploration and Development Research Institute of the Daqing Oilfield Limited Company.

3.1. Petrographic Analysis

The petrographic analysis included detailed core and thin section observations and XRD analysis. Core observations were concentrated on describing sedimentary structures, lithology, color, and oil-bearing characteristics. Thin sections revealed information on mineral composition and pore structures. A total of 80 samples were used for thin section analysis. These were first impregnated with blue epoxy resin for the pore type analysis, then dyed with red-S and potassium ferricyanide for carbonate mineral identification. The casted thin sections were examined using a Leica DM2700P high-precision microscope (Danaher, Washington, WA, USA) at the Exploration and Development Research Institute of the Zhongyuan Oilfield company of Sinopec.
XRD analysis involved whole-rock (729 samples) and clay fraction (247 samples) mineralogy analyses. The samples were first dried and then powdered to ~2-μm-sized fragments using an agate pestle and mortar. The powdered samples were separated in water and processed according to Moore and Reynolds [58]. A D/max-Ultima IV X-ray diffractometer (Rigaku, Akishima-shi, Japan) with Cu-Kα radiation was used to quantitatively determine whole-rock mineral and clay fraction composition. Individual minerals were identified according to their peak area in the ethylene-glycol diffractogram [59]. The analytical error of major mineral content was <10%.

3.2. Organic Geochemical Analysis

A total of 944 samples were used for geochemical analysis, which involved TOC analysis, Rock-Eval pyrolysis, vitrinite reflectance (Ro), maceral and OM elemental compositions, and kerogen carbon isotope fractionation.
Approximately 10 g of the shales were used to evaluate TOC. The samples were first powdered to <0.2 mm grain size and reacted with 10% HCl to dissolve the inorganic carbon. The processed samples were dried in an oven and then burned with oxygen to determine organic carbon content using a LECO CS-230 carbon and sulfur analyzer (LECO, Saint Joseph, MI, USA).
Pyrolysis data were acquired using a Rock-Eval 6 Plus analyzer (Vinci Technologies, France), and the production process was in accordance with the Chinese Industrial Standard GB/T 18602-2012 (2012) [60]. Approximately 10 g of shales were powdered to a particle size of < 0.15 mm and then heated under helium conditions. The amount of hydrocarbon released during the “pyrolysis stage” of Rock-Eval analysis was measured under S1 and S2 peaks. Volatile hydrocarbon content (S1, mg HC/g rock) was acquired when the temperature reached 300 °C and held for 3 min. The remaining hydrocarbon generative potential (S2, mg HC/g rock) was measured when it reached 300–650 °C. The temperature producing the maximum pyrolysis yield (Tmax) is the temperature at which the rate of hydrocarbon generation is at its maximum during pyrolysis. Additionally, we obtained the hydrogen index (HI) values according to the method of Behar et al. [61].
HI = 100 × S 2 TOC
Ro analysis was conducted using a fully automatic microscope photometer LEICADM 4P (Danaher, Washington, DC, USA). The kerogen types were analyzed based on fluorescent thin sections observation using a Leica DM6000M microscope (Danaher, Washington, DC, USA). The abundances of primary maceral compositions, including sapropelinite, exinite, vitrinite, and inertinite, were determined by quantitative statistics. Discriminant analysis of kerogen types depending on their maceral content, defined as TI, was based on the following equation:
TI = a × 100 +   b 1 × 80 + b 2 × 50 c   × 75 d   × 100 / 100
where a, b1, b2, c, and d were the abundances of sapropelinite, resinite, exinite except resinite, vitrinite, and inertinite, respectively. TI > 80%, 40% < TI < 80%, 0 < TI < 40%, and TI < 0 represent types I, II1, II2, and III kerogen, respectively.
The elemental compositions (C, H, O, and N) and H/C, as well as O/C atomic ratios of OM, were measured using a Vario-MICRO elemental analyzer (Elementar, Langenselbold, Germany). The C and H of the OM were calculated from oxidized CO2 and H2O. Additionally, we also calculated the amount of O that was transformed to CO at a high temperature.
Kerogen carbon isotope (δ13C) values were measured using a EUO E3000 GV IsoPrime instrument (GV Instruments, Cheshire, UK). These values are reported as per mil (‰) relative to Vienna Pee Dee Belemnite. The precision of isotope content determination was ± 0.1 ‰ (2σ).

3.3. SEM Analysis

SEM observations were used to qualitatively characterize crystal morphology, pore structures, and pore-throat connections, which were then used to assess reservoir quality and interpret diagenesis. A total of 60 samples were used for SEM observation. The experiment was performed at the Institute of Geomechanics, Chinese Academy of Geological Sciences, using a SIGMA300 field-emission SEM with an X-ray energy spectrometer (Zeiss, Jena, Germany). The samples were first pretreated using argon ion polishing technology to improve their observation clarity, then gold-coated to strengthen their conductivity. High-resolution images were obtained using backscattered electron detectors.

3.4. Low-Pressure N2 Adsorption Analysis

Twenty-one samples were used for low-pressure N2 adsorption analysis. A low-pressure N2 adsorption experiment was conducted at the Central Laboratory of Exploration and Development Research Institute, Daqing Oilfield Limited Company, using a Micromeritics ASAP 2460 Surface Area and Porosity Analyzer (USA) at 25 °C. The samples were crushed to 60–80 mesh size and degassed for 8 h at 110 °C under high vacuum conditions. During the experiment, the instrument bath temperature was maintained at 77 K. Pore specific surface area (SSA) was calculated according to the Brunauer–Emmett–Teller (BET) theoretical model [62], and pore volume was calculated based on the model of the Barrett–Joyner–Halenda (BJH) theory according to the Kelvin equation for the whole adsorption branch [63]. The detailed method introduction of BET and BJH is described in the literature [64,65]. In this study, we defined macropores, mesopores, and micropores as having pore diameters > 50 nm, 2–50 nm, and <2 nm, respectively, according to the International Union of Pure and Applied Chemistry (IUPAC) [66].

3.5. MICP Analysis

Twenty samples were used for MICP analysis. The MICP test can be used to analyze pores and pore-throat connections. The AutoPore IV9505 instrument (Micromeritics, Norcross, GA, USA) at the Central Laboratory of Exploration and Development Research Institute, Daqing Oilfield Limited Company, was used for this experiment. The samples were dried at ~80 °C for 12 h before the experiment. Samples were vacuumized, and the pressure was changed several times during the experiment. The maximum mercury injection pressure was 200 MPa. The MICP curves were acquired by examining the mercury saturation at each pressure point, obtaining parameters to quantitatively characterize the pore structure. The pore-throat radius was calculated using the Washburn equation (Equation (3)) [67], and subsequently, the pore-throat size distribution was quantitatively characterized.
r = 2 σ   cos θ P c
where r is the pore-throat radius (μm), Pc is the capillary pressure (MPa), σ is the interfacial tension (dynes/cm), and θ is the contact angle (°). In this study, the σ = 480 dynes/cm, and θ = 140°. Mercury saturation can be calculated as follows:
S Hg   = V Hg V p
where VHg is the cumulative volume of mercury at a certain capillary pressure, Vp is the total pore volume, and SHg is expressed as a percentage. Displacement pressure represents the capillary pressure of the maximum connected pore-throat. The sorting coefficient is calculated based on capillary pressures at 25% and 75% mercury saturation [68]; skewness reflects the asymmetry of the pore-throat sizes distribution [69].

4. Results

4.1. Minerals Composition

XRD data showed that the FGSRs of the Qingshankou Formation were mainly composed of quartz, feldspar, and clay minerals (Table S1). The quartz content ranged from 0 to 52.9%, with an average of 33.8%; the feldspar ranged from 0 to 39.8%, averaging 16.5%; and the clay mineral content ranged from 0 to 58.8%, averaging 34.7% (Figure 4A). The carbonate mineral content was between 0% and 98.5%, with an average of 10.6%, including calcite (0–92.7%, average of 4.8%), ankerite (0–93.0%, average of 4.9%), and dolomite (0–98.2%, average of 1.0%) (Figure 4A and Figure 5). In addition, pyrite and siderite were present at an average content of 1.4% and 3.1%, respectively. The identified authigenic clay minerals comprised kaolinite, chlorite, illite, mixed-layer illite/smectite (I/S), mixed-layer chlorite/smectite (C/S), and a percentage of smectite in I/S (S%), for a total of 100%.
They were mostly composed of illite and mixed-layer I/S, with an average of 62.9% and 21%, respectively, whereas the average chlorite content was 13.4%, and the contents of kaolinite and mixed-layer C/S were 1.7% and 1.0%, respectively (Figure 4B) (Table S1).

4.2. Sedimentary Structures

The sedimentary structures of the FGSRs were analyzed through detailed core and thin section observations (Figure 6). According to the thickness of the lamina, it could be divided into laminated (lamina thickness < 1 mm), layered (1 mm < lamina thickness < 10 mm), and massive (thickness > 10 mm). Laminated structures revealed the sedimentary clay and felsic mineral laminae cycles (Figure 6A,B), where weak cross-bedding or lenticular structures were prevalent in the felsic lamina (Figure 6A,B). Additionally, ostracod fragments interbedded with the felsic or clay laminae were observed (Figure 6C,D). The ostracod fragments were usually mixed with felsic grains or algae fragments (Figure 6C). Layered structures were thicker than laminated structures, exhibiting the rhythm of felsic and clay laminae or ostracod fragments (Figure 6E,F). Massive structures had homogeneous features and were composed of single minerals with no obvious layers. Massive argillaceous dolomites (Figure 6G), ostracod limestones (Figure 6H), and silty mudstones were observed in the FGSRs.

4.3. Organic Geochemical Analysis

The abundance of OM in source rocks is an important indicator of hydrocarbon generation potential. TOC and Rock-Eval parameters were used to evaluate OM [70] abundance. The TOC content ranged from 0.73 to 6.68 wt%, with an average of 2.18 wt% (Figure 7A) (Table S2). The S1 values ranged from 0.76 to 8.25 mg/g, averaging 2.59 mg/g (Figure 7B), and S2 values ranged from 0.84 to 24.83 mg/g, with an average of 6.19 mg/g (Table S2). The oil saturation index (OSI) denotes the oil crossover effect and can be used to analyze oil production potential. It is calculated according to Jarvie [2].
OSI = 100 × S 1 TOC
The OSI values ranged from 75.71 to 350.77 mg/g, with an average of 120.06 mg/g (Figure 7C). Approximately 66% of the samples had values higher than 100 mg/g, indicating efficient oil production potential. In addition, the S1 and S2 values exhibited a positive correlation (Figure 7D). The HI values ranged from 100.11 to 762.07 mg/g, with an average of 284.74 mg/g (Table S2).
Fluorescent thin section analysis indicated that the maceral composition of the FGSRs was predominantly composed of sapropelinite (87–91.67%, averaging 89.15%), with the other components being exinite, vitrinite, and inertinite with average contents of 1.78 %, 3.14%, and 5.94%, respectively (Figure 8A). The compositional characteristics revealed that the kerogen types present in the studied samples were predominantly of type I with minor amounts of type II1. The H/C atomic ratios of kerogen ranged from 0.55 to 1.29, with an average of 0.87, while O/C atomic ratios were between 0.06 and 0.13, with an average of 0.08 (Table S3), indicating that the OM was dominated by type II1 and type II2, according to the van Krevelen diagram (Figure 8B) [71]. The δ13C values of different types of kerogens found in typical continental basins of China showed that the contents of type I, II, and III kerogens ranged from –27‰ to –29‰, –26‰ to –27‰, and –22.5‰ to –26‰, respectively [72]. The δ13C values of FGSRs ranged from –31.75‰ to –26.38‰, averaging –28.25‰ (Figure 8C), indicating type I and type II kerogen.
Ro values are generally used to indicate the maturity of hydrocarbon source rocks. The Ro values varied from 1.12 to 1.70%, with an average of 1.37% (Figure 9A), indicating that the shale rocks were in the middle to high stages of thermal maturation, having entered the oil generation window. In addition, the Tmax values between 381 °C and 481 °C, with an average of 427 °C, indicated that the source rocks had mature OM (Figure 9B).

4.4. Lithofacies Classification
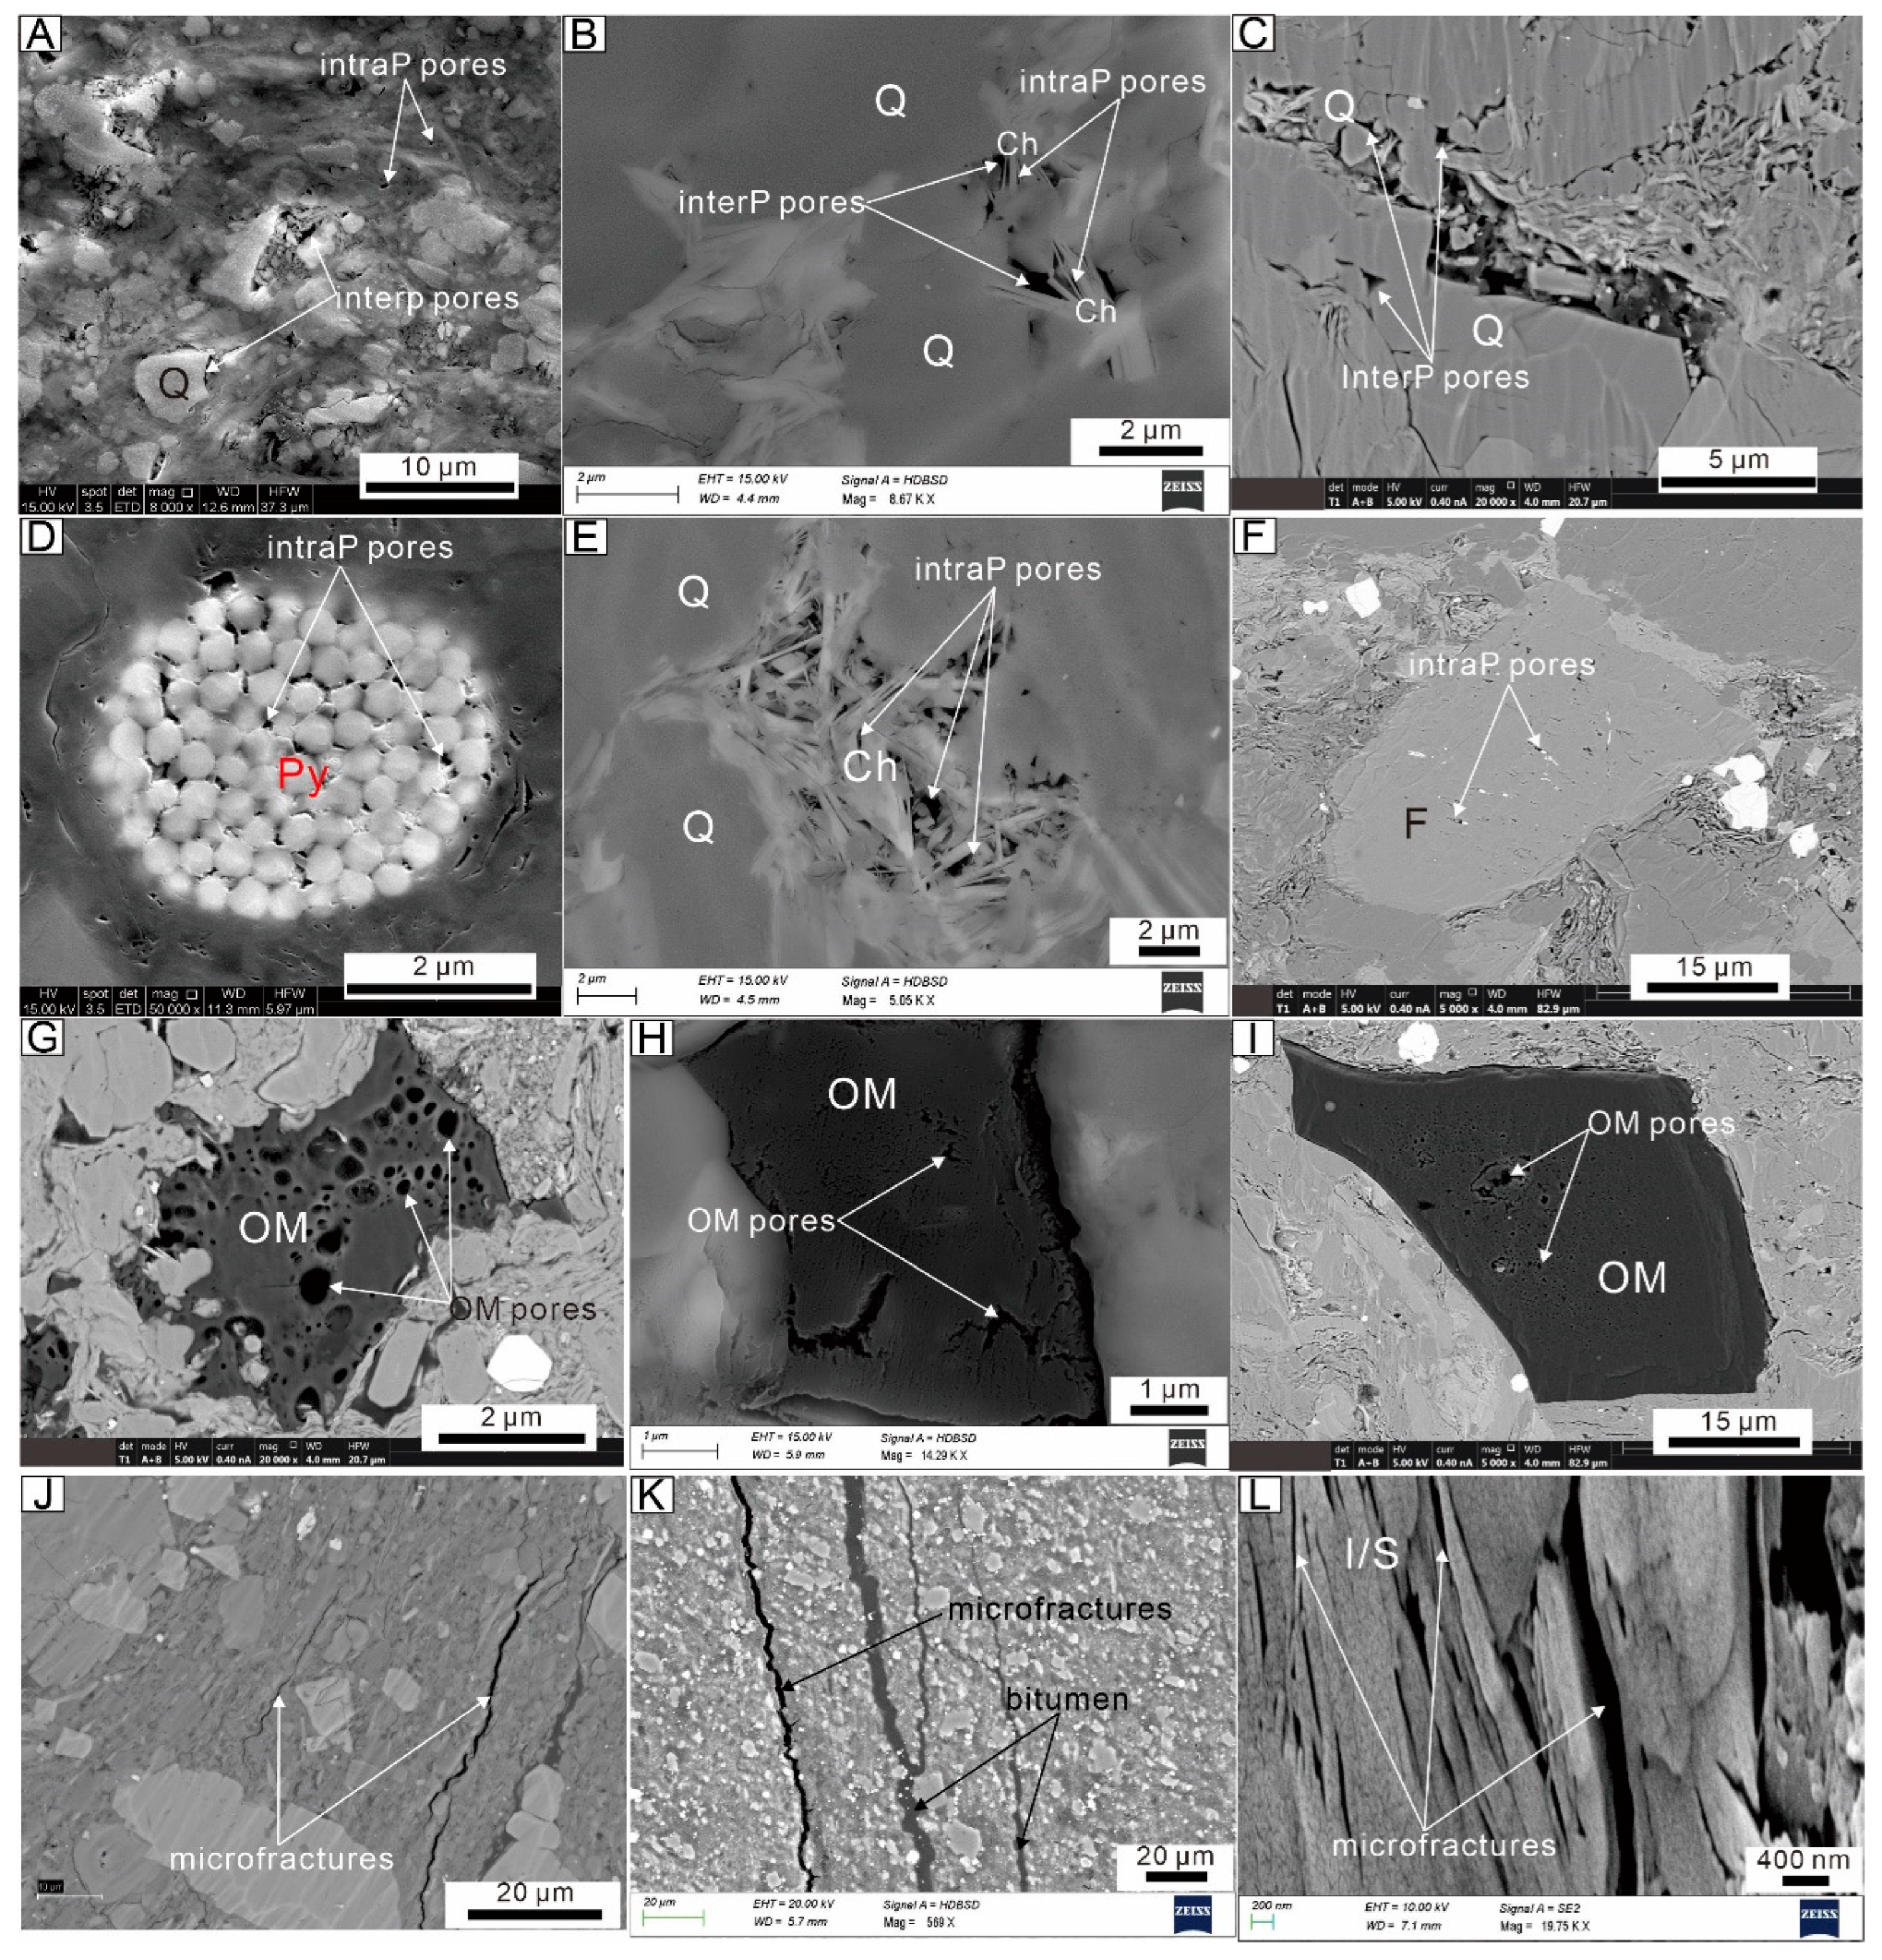
Lithofacies of FGSRs were classified according to the mineralogical composition, sedimentary structures, and OM contents. Based on the method of Li et al. [20], Lazar et al. [72], and Zhang and Li [73], the three key components (quartz and feldspar, clay mineral, and carbonate mineral contents) were used to classify the mineralogical facies (Figure 5), which were divided into six types (Table 1): silty mudstone (SM), argillaceous mudstone (AM), calcareous mudstone (CM), silty fine-grained mixed sedimentary rocks (SFMR), argillaceous fine-grained mixed sedimentary rock (AFMR), and calcareous fine-grained mixed sedimentary rock (CFMR). The OM content classification relied on the shale hydrocarbon potential and shale oil exploration practices of the Daqing Oilfield Limited Company [74]. Based on this, they were classified into three levels: organic-rich (O-R) (TOC ≥ 2 wt%), organic-moderate (O-M) (1 wt% ≤ TOC < 2 wt%), and organic-containing (O-C) (TOC < 1 wt%). The microstructure was described according to the thickness of the single lamina (laminated, layered, and massive) (Figure 6). Through observation and analysis of the seven wells, we concluded that the main lithofacies of the FGSRs in the Qingshankou Formation included O-R laminated SM, O-M laminated SM, O-R laminated SFMR, O-C layered SM, O-M massive AM, and O-M massive CM (Figure 10).

4.5. Pore Types

Pores in mudstones and shales are mostly nanometers to micrometers in size. The pores connect matrix-related spaces and fractures and act as important permeability pathways of unconventional shale gas and oil. Based on the relationships of pores and particles, Loucks et al. [75] proposed a simple and objective classification that included mineral matrix pores such as interparticle (interP) pores and intraparticle (intraP) pores, organic-matter pores, and fractures. This study used Loucks’s classification to analyze the pore characteristics of the FGSRs. Pores between grains, clay minerals, and crystals are interP pores. The rigid grains (quartz, feldspar, carbonate minerals, pyrite) can protect primary pores from compaction; therefore, the interP pores are more easily formed between rigid grains and soft grains (Figure 11A–C). They exhibited triangular, polygonal, or elongated morphologies. IntraP pores were distributed within grains, including pyrite framboids (Figure 11D), clay crystal aggregates (Figure 11E), dissolution pores within grains (Figure 11F), and fossil body pores. The pyrite framboid and clay aggregate pores had the greatest distribution of intraP, particularly intercrystalline pores within illite and chlorite. In addition, dissolution pores were observed within feldspar (Figure 11F) and calcite. These pores had elongated, polygonal, and elliptical outlines. OM pores occurred within OM (Figure 11G–I), which are usually found in relatively high Ro-value samples. These pores exhibited bubble-shaped outlines. Micro- and nanoscale microfractures usually occurred subparallel to the bedding plane (Figure 11J–L). Some of them were filled with bitumen (Figure 11K). According to the SEM-based pore type identification and statistical analysis, the FGSRs had mostly interP and intercrystalline pores, accounting for 42.5% and 31.3%, respectively, while intraP pores, OM pores, and microfractures accounted for 10.7%, 8.9%, and 6.6%, respectively (Figure 12).

4.6. Pore-Throat Structure Characteristics

4.6.1. N2 Adsorption Experiment

Low-temperature N2 adsorption was used to analyze mesopore characteristics. Hysteresis is caused by the noncoincidence of isothermal adsorption and desorption curves. Its morphological characteristics, such as hysteresis loops, can be used to characterize pore shapes in micromaterials. In this study, the hysteresis loop types were classified into types H1, H2, H3, and H4 according to the IUPAC guidelines (Figure 13) [76]. The results of the classification were used to analyze the pore types of the different lithofacies of FGSRs. The silty mudstones contained H2 and H3 type hysteresis loops (Figure 14A) in the low-pressure section (P/Po < 0.45), wherein the adsorption and desorption coincided, indicating that closed pores were more developed within small apertures. In the medium-pressure section (0.45 ≤ P/Po < 0.95), wider type H2 hysteresis loops were found, and the adsorption curve changed slowly, while the desorption curve exhibited an obvious inflection point and a steep change. Type H3 had narrower hysteresis loops, and the adsorption curve was nearly parallel to the desorption curve. In the high-pressure section (0.95 ≤ P/Po < 1), the slopes of adsorption and desorption curves both increased, indicating that macropores were associated with cracks [77]. The H2 and H3 hysteresis loops revealed complex pore structures and ink-bottle-shape and wedge-shape pores, respectively. SFMR, AFMR, and CM all exhibited type H2 hysteresis loops (Figure 14B–D). In addition, the CM also exhibited type H4 hysteresis loops (Figure 14D), which indicated low adsorbing capacity; additionally, the adsorption and desorption curves tended to overlap, indicating association with narrow slit-like pores.
In general, mesopores and macropores contribute most of the pore volume, whereas micropores provide SSA [78]. N2 adsorption experiments indicated that SM, SFMR, AFMR, and CM contained mesopores predominantly (Figure 15), accounting for 77.4%, 71.9%, 80.8%, and 65.2% of the total pore volume (Figure 15B,D,F,H), respectively. Pores with diameters between 2 nm and 10 nm accounted for a majority of the mesopores, while within macropores, pores with a diameter of 50–100 nm were prevalent (Figure 15A,C,E,G). SM, SFMR, AFMR, and CM had average SSA values of 30.82, 30.24, 31.88, and 16.29 m2/g, respectively, and average pore diameters of 6.08, 6.73, 6.22, and 6.21 nm, respectively (Table 2). Overall, AM and AFMR had relatively consistent pore diameter distributions, whereas SFMR and CM exhibited a wider range of pore diameters (Figure 15).

4.6.2. MICP Experiment

The MICP experiment was used to characterize pore-throat distribution from microscale (>350 μm) to nanoscale (2 nm) [78]. The intrusion and extrusion curves and pore-throat radius distribution that were obtained from MICP are shown in Figure 16 and Figure 17, and the pore-throat parameters are presented in Table 3. The parameters of capillary curve morphology, such as sorting coefficient and skewness, can be used to reflect pore-throat structure. Sorting coefficient values approaching 1.0 suggest an efficient sorting of the shale reservoir, further indicating a concentrated distribution of pore-throat size [69]. SM, SFMR, AFMR, and CM exhibited average sorting coefficients of 1.1, 1.3, 1.4, and 2.2 (Table 3), respectively, indicating that SM and SFMR have relatively concentrated pore-throat distribution, while AFMR and CM have strong complexity and heterogeneity in pore-throat structure. Skewness can be divided into coarseness (>0) or fineness (<0) according to their value; the coarse skewness reflects an efficient percolation ability of the shale reservoir, while the fine skewness reflects poor percolation. SM, SFMR, AFMR, and CM exhibited average skewness of –0.82, –0.84, –1.0, and –0.87 (Table 3), respectively, suggesting poor storage and percolation ability of the reservoir.
FGSRs of the Qingshankou Formation had no significant differences in terms of capillary pressure curves, showing a steep slope in the mercury injection process (Figure 16 and Figure 17). SM and SFMR had a relatively horizontal trend in the intermediate stage because they had relatively more macropores and mesopores and bigger pore-throat size. However, AFMR and CM showed more steep slope characteristics in the intermediate stage, indicating more micropores and relatively smaller pore-throat size.
The pore-throat distribution of SM and SFMR exhibited four peaks from left to right: 0.004–0.0063 μm, 0.01–0.016 μm, 0.025–0.04 μm, and 0.4–1.6 μm (Figure 16B,D). The first to third peaks from the left showed fluctuations due to the complex pore types and multi-micro/nanopores in clay minerals, while the fourth peak at the right was associated with large, interconnected pores or possible microfractures. These lithofacies exhibited average permeabilities of 0.06 and 0.09 × 10⁻³ μm2, and average porosities of 7.8% and 8.1%, respectively. The median pore-throat radius was 0.005 μm. The SFMR had a lower average displacement pressure of 18.9 MPa and a relatively lower average maximum mercury saturation at 53.5%.
The pore-throat distribution of AFMR and CM exhibited three peaks: 0.004–0.0063 μm, 0.025–0.04 μm, and 0.63–1.6 μm (Figure 17B,D). The first peak accounted for the dominance, indicating more developed nanopores in these lithofacies. The average displacement pressures were 10.67 and 0.57 MPa, respectively; the relatively low values are associated with microfractures. The average permeabilities were 0.01 and 1.42 × 10⁻³ μm2, and the average porosities were 6.5% and 7.8%, respectively. The median pore-throat radius was 0.005 μm, and the average maximum mercury saturations were 43.4% and 57.0%, respectively.
Overall, the SM and SFMR exhibited concentrated pore-throat distributions and were dominated by pores ranging from 0.01 to 0.04 μm in radius, while AFMR and CM were dominated by nanopores, with radii mainly ranging from 0.004 to 0.0063 μm.

5. Discussion

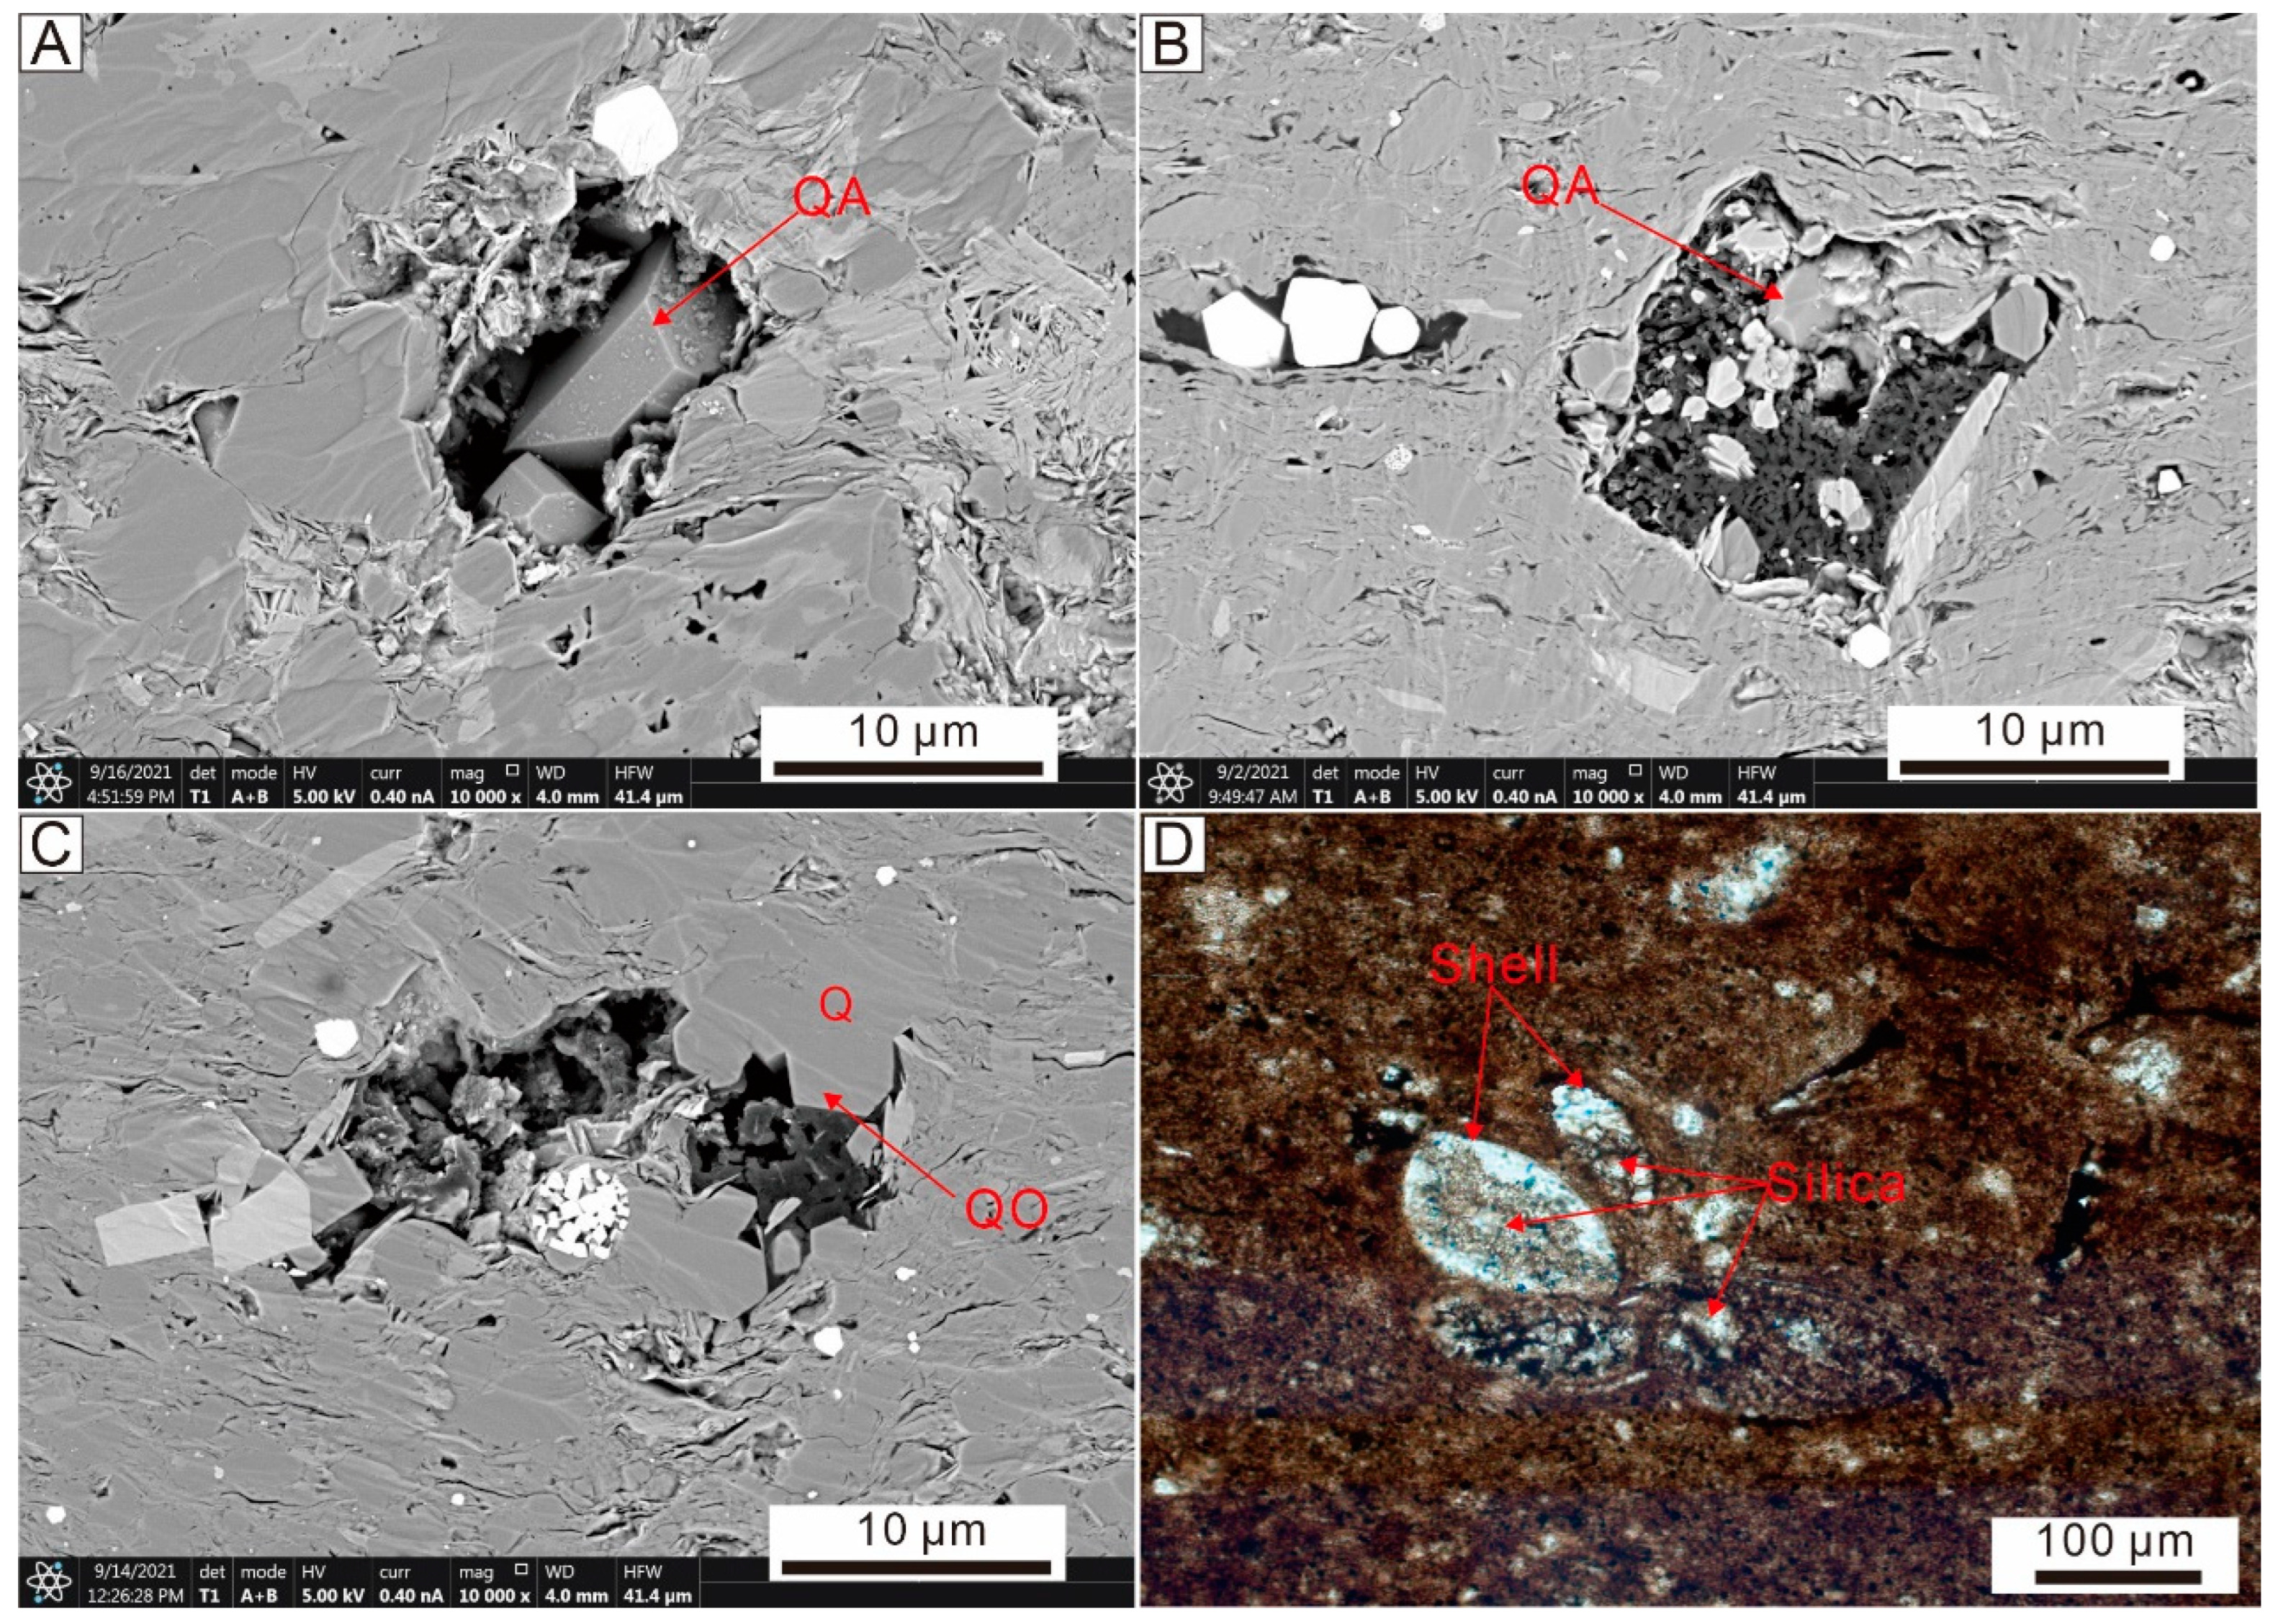
5.1. Laminae and Mineral Genesis and Sedimentary Environment

Laminae characteristics and mineral genesis can provide important information regarding the paleoclimate and depositional conditions of FGSRs [21,72]. Felsic and clay minerals were the dominant minerals in the FGSRs (Figure 4 and Figure 5), with felsic and clay laminae as well as ostracod and algae fragments commonly present in the study area (Figure 6 and Figure 10). Detrital quartz and authigenic quartz precipitated during the diagenetic are the major origins of quartz in shales [7,79]. Detrital quartz can have extrabasinal and intrabasinal origins and it shows good crystallization [80]. A number of felsic laminae exhibited weak cross-bedding (Figure 6A), suggesting that they were formed as a result of hydrodynamic conditions [16]. Terrigenous materials can be supplied by floods as they form low-density flows. The combination of felsic laminae and ostracod fragments was common (Figure 6C,E,F), with some of the felsic laminae exhibiting erosional scour surfaces, indicating reworking by strong hydrodynamic forces such as storms [49]. Some of the felsic laminae showed normally graded bedding sequences (Figure 10K), having no clear contact boundaries with upper clay laminae, and exhibited the Bouma sequence, attributed to turbidity currents [81]. These felsic laminae indicated terrigenous material supply.
Authigenic quartz sources included conversion of smectite to illite, dissolution and precipitation of siliceous organisms, volcanic alteration, and pressure dissolution of detrital quartz [21,79,82]. The XRD data showed that the smectite–illite ratio ranging from 10 to 20%, combined with the Ro data (average of 1.37%), indicated that FGSRs entered in the middle diagenetic stage B. Transformation of smectite to illite partly produced SiO2 [83]:
Smectite + K + = Illite +   SiO 2 + Na + + Ca 2 + + Fe 2 + +   Mg 2 + +   H 2 O
The excess silica generates authigenic micro-sized quartz with good crystallization and usually surrounded by clay minerals (Figure 18A,B). Quartz overgrowth could also be observed (Figure 18C); the silica sources were feldspar dissolution or pressure dissolution of detrital quarz [84]. Biogenic silica is also an important quartz source, and poorly crystallized biogenic quartz in shells could be observed in thin sections (Figure 18D). The authigenic biogenic silica of the Qingshankou Formation has been studied in detail by Bai et al. [85].
XRD data shows that feldspar was mainly composed of K-feldspar and plagioclase, apart from terrigenous genesis; some authigenic albites were also observed and reported [86]. They were derived from K-feldspar transformation or magmatic hydrothermal alteration [87].
Ostracod fragments were abundant in the FGSRs, often flat or parallel to the bedding, and were complexed with felsic (Figure 6C,E,F) and clay grains (Figure 6D and Figure 10Q). Some of these ostracod fragments were associated with erosional scour surfaces (Figure 6C), indicating that they were reworked by combined flows. Storm events are an important formation mechanism that can transport shallow shore sediments to semi-deep or deep lake environments [88,89].
Algae are important hydrocarbon generation indicators, as they are usually suspended on lake surfaces, where they flocculate and are subsequently deposited in combination with clay minerals (Figure 6D). As a result, the clay laminae containing algae fragments and clay minerals were mainly distributed in quiet environments such as deep lakes (Figure 19). In addition, some ostracod fragments could be transported into deep lakes through bottom current flows.
In summary, the FGSRs of the Qingshankou Formation were formed during the first large-scale lacustrine flooding period under humid climate conditions [90,91]. However, the sediments were further reworked by storm events and bottom current flows. Debris and turbidity flows were among the sedimentary formation mechanisms of the FGSRs (Figure 19).

5.2. Factors Influencing Pore Development

OM content, rock composition, and Ro are important factors that influence pore development [2,37,75,77]. The pore volume increases with increasing OM content (Figure 20A), especially in mesopores and micropores. Normally, OM content is closely related to micropores in marine shales [1,28,92,93]. Micropores were also present in the OM of the studied FGSRs; however, OM pores accounted for only 8.9% of the total pores (Figure 12), indicating a limited contribution to total micropore volume.
Mesopores related to OM may be the interP pores between rigid grains and OM. Prior research indicates that OM pores have a good correlation with Ro; when shale has an Ro > 0.9%, the OM pores increase with an increase in thermal evolution [93]. Here, the Ro values of the FGSRs were between 1.12% and 1.70%, with an average of 1.37% (Figure 9A), indicating that OM pore development was influenced by thermal evolution.
Pore volume is positively correlated with clay mineral content, and this correlation is more obvious with mesopores and micropores (Figure 20B). Clay minerals possess well-developed intercrystalline micropores (Figure 11B,E); greater clay mineral content indicates greater micropore volume. Mesopore volume has a close relationship with clay minerals; these mesopores were related to interP pores between clay minerals and rigid grains (Figure 11A,B). Although compaction could collapse original open clay fabrics, pressure shadows could help preserve interP pores between compaction-resistant grains and soft grains. In addition, diagenetic mineral growth can reopen clay flakes and form meso/macro/interP pores. I/S and illite are the dominant clay minerals of the FGSRs (Figure 4B), and I/S minerals are more strongly associated with pore volume than illite (Figure 20C,D). Felsic minerals have a positive relationship with pore volume (Figure 20E) because FGSRs in the study area were dominated by inorganic pores, and interP pores were the most developed pore types. InterP pores are mainly developed between felsic grains (Figure 11A–C), and these pores are related to mesopores and macropores. Felsic minerals are brittle and have better supporting capacity than clay minerals; therefore, they could effectively preserve original storage pores from compaction. In addition, the dissolved feldspar could provide some mesopores (Figure 11F). Carbonate minerals are weakly negatively correlated with pore volume (Figure 20F). CM or CFMR usually have massive structures (Figure 6G,H) and contain ostracod fragments mixed with clay and felsic minerals (Figure 6F); due to the poor sorting and strong compaction, they rarely form storage spaces.
In summary, lithofacies of SM, SFMR, and AFMR possess more interP pores as well as intercrystalline pores, which are available for shale oil storage.

5.3. Implications for Shale Oil Exploration

TOC is one of the most important evolution indices of shale oil potential [2]. The FGSRs have TOCs ranging from 0.73 to 6.68 wt%, with an average of 2.18 wt%, indicating an efficient shale oil potential. The relationship between TOC and minerals indicates that TOC is positively correlated with clay mineral content (Figure 21A) and negatively correlated with felsic and carbonate mineral contents (Figure 21B,C). These relationships reflect that lithofacies of AM and AFMR have high shale oil potential, followed by SFMR and CFMR. FGSRs with high felsic and carbonate mineral content have low shale oil potential.
OSI could be used to evaluate the production of shale oil; normally, shale with OSI > 100 mg/g represents a good recoverable shale oil value [94]. The cross plot of TOC and OSI indicates that most of the FGSRs have shale oil production potential (Figure 21D), while shales with TOC < 2 wt%, such as silty mudstone and calcareous mudstone with high felsic mineral content (>80%) as well as carbonate mineral content (>80%), have little shale oil potential.
OM quality, reservoir space, and brittleness of FGSRs may be considered factors that influence shale oil production [12,48,77,92]. FGSRs with TOC > 2 wt% are considered high quality [10,21]. FGSRs with more brittle minerals are prone to fracturing and obtain better economic benefits. Brittle minerals usually contain quartz, feldspars, carbonate minerals, and pyrites. The FGSRs in the study area had an average brittle mineral content of 65.3% (Figure 4A), indicating good brittleness.
Considering the TOC, pore development, and brittleness and combined with the sedimentary environment, it can be concluded that O-R laminated SM and SFMR should be the shale oil exploration targets of the Qingshankou Formation in the northern Songliao Basin, followed by O-R or O-M laminated and layered AFMR, as well as CFMR. Due to the bed brittleness and poor pore volume, the AM and CM have a low potential for shale oil exploration and development.

6. Conclusions

Fine-grained sedimentary rocks (FGSRs) in the lacustrine basin commonly have complex lithofacies and heterogeneous inherent reservoirs, which are structures that are difficult to identify and hinder shale oil exploration. Our study addresses these problems by providing a detailed lithofacies classification scheme, analyzing laminae origins and depositional environments, as well as organic geochemical characteristics, describing pore types, quantifying pore sizes and pore-throat structures, and proposing favorable shale oil exploration lithofacies. Based on the data acquired, the following conclusions were reached:
(1).
The lithofacies classification of FGSRs, which considered the total organic carbon (TOC) content, sedimentary structure, and rock mineral composition, can be used to evaluate shale oil reservoir quality. FGSRs of the Qingshankou Formation were deposited in a semi-deep to deep lacustrine environment; however, these sediments were further reworked by storm events and bottom current flows.
(2).
The TOC content of FGSRs ranged from 0.73 to 6.68 wt%, with an average of 2.18 wt%; the S1 values ranged from 0.76 to 8.25 mg/g, averaging 2.59 mg/g, and S2 values ranged from 0.84 to 24.83 mg/g, with an average of 6.19 mg/g; the OSI had an average of 120.06 mg/g. Organic matter types were mainly composed of type I kerogen, with small amounts of type II; the Ro values varied from 1.12 to 1.70%, with an average of 1.37%, indicating that source rocks had entered the maturity stage.
(3).
Intraparticle pores and intercrystalline pores were the main pore types of silty mudstone (SM), silty fine mixed sedimentary rocks (SFMR), and argillaceous fine mixed sedimentary rocks (AFMR). The N2 adsorption experiment showed that these FGSRs had ink-bottle-shaped and slit-shaped pores, with mesopores accounting for 77.4%, 71.9%, and 80.8% of the total pore volume, respectively. Mercury injection capillary pressure analysis indicated that FGSRs contained nanopores, and the steep slope in the mercury injection process indicated a relatively small pore-throat size.
(4).
Through the comprehensive analyses of organic chemistry, pore development, and brittleness characteristics, we concluded that organic-rich laminated SM and SFMR should be the focused shale oil exploration target lithofacies of the Qingshankou Formation in the northern Songliao Basin, followed by organic-rich or organic-moderate laminated and layered AFMR as well as calcareous fine mixed sedimentary rocks.

Supplementary Materials

The following are available online at https://www.mdpi.com/article/10.3390/min13030385/s1, Table S1: Mineralogical analysis of the FGSRs in the Qingshankou Formation of the Songliao Basin, Table S2: TOC and pyrolysis data of the FGSRs in the Qingshankou Formation of the Songliao Basin, Table S3: Organic matter element of the FGSRs of the Qingshankou Formation in the Songliao Basin.

Author Contributions

N.S.: methodology, software, data curation, and writing—original draft preparation. W.H.: validation and resources. J.Z.: methodology and resources. J.G.: software and investigation. P.S.: Software and formal analysis. All authors have read and agreed to the published version of the manuscript.

Funding

This work was supported by National Natural Science Foundation of China (Grant No. 42072138).

Data Availability Statement

Data will be made available upon request.

Acknowledgments

We gratefully acknowledge the Research Institute of Exploration and Development, Daqing Oilfield Company Limited for providing geological data and samples. We also thank the editors and four anonymous reviewers for reading our manuscript and for the very constructive comments.

Conflicts of Interest

The authors declare no conflict of interest.

References

  1. Slatt, R.M.; O’Brien, N.R. Pore types in the Barnett and Woodford gas shales: Contribution to understanding gas storage and migration pathways in fine-grained rocks. AAPG Bull. 2011, 95, 2017–2030. [Google Scholar] [CrossRef]
  2. Jarvie, D.M. Shale resource systems for oil and gas: Part 2—Shale oil resource systems. In Shale Reservoirs—Giant Resources for the 21st Century; Breyer, J.A., Ed.; AAPG Memoir: Tulsa, OK, USA, 2012; Volume 97, pp. 89–119. [Google Scholar]
  3. Zou, C.; Zhu, R.; Chen, Z.Q.; Ogg, J.G.; Wu, S.; Dong, D.; Qiu, Z.; Wang, Y.; Wang, L.; Lin, S.; et al. Organic-matter-rich shales of China. Earth Sci. Rev. 2019, 189, 51–78. [Google Scholar] [CrossRef]
  4. Solarin, S.A.; Gil-Alana, L.A.; Lafuente, C. An investigation of long range reliance on shale oil and shale gas production in the US market. Energy 2020, 195, 116933. [Google Scholar] [CrossRef]
  5. Hackley, P.C.; Ryder, R.T. Organic geochemistry and petrology of Devonian shale in eastern Ohio: Implications for petroleum systems assessment. AAPG Bull. 2021, 105, 543–573. [Google Scholar] [CrossRef]
  6. Jin, Z.; Zhi, R.; Liang, X.; Shen, Y. Several issues worthy of attention in current lacustrine shale oil exploration and development. Petrol. Explor. Dev. 2021, 48, 1471–1484. [Google Scholar] [CrossRef]
  7. Loucks, R.G.; Ruppel, S.C. Mississippian Barnett Shale: Lithofacies and depositional setting of a deep-water shale-gas succession in the Fort Worth Basin, Texas. AAPG Bull. 2007, 91, 579–601. [Google Scholar] [CrossRef] [Green Version]
  8. Macquaker, J.H.; Taylor, K.G.; Keller, M.; Polya, D. Compositional controls on early diagenetic pathways in fine-grained sedimentary rocks: Implications for predicting unconventional reservoir attributes of mudstones. AAPG Bull. 2014, 98, 587–603. [Google Scholar] [CrossRef]
  9. Wei, W.; Swennen, R. Sedimentology and lithofacies of organic-rich Namurian Shale, Namur Synclinorium and Campine Basin (Belgium and S-Netherlands). Mar. Pet. Geol. 2022, 138, 105553. [Google Scholar] [CrossRef]
  10. Pan, Y.; Huang, Z.; Guo, X.; Li, T.; Zhao, J.; Li, Z.; Qu, T.; Wang, B.; Fan, T.; Xu, X. Lithofacies types, reservoir characteristics, and hydrocarbon potential of the lacustrine organic-rich fine-grained rocks affected by tephra of the Permian Lucaogou Formation, Santanghu basin, western China. J. Petrol. Sci. Eng. 2022, 208, 109631. [Google Scholar] [CrossRef]
  11. Krumbein, W.C. The mechanical analysis of fine-grained sediments. J. Sediment. Res. 1932, 2, 140–149. [Google Scholar] [CrossRef]
  12. Aplin, A.C.; Macquaker, J.H. Mudstone diversity: Origin and implications for source, seal, and reservoir properties in petroleum systems. AAPG Bull. 2011, 95, 2031–2059. [Google Scholar] [CrossRef]
  13. Chiarella, D.; Longhitano, S.G.; Tropeano, M. Types of mixing and heterogeneities in siliciclastic-carbonate sediments. Mar. Petrol. Geol. 2017, 88, 617–627. [Google Scholar] [CrossRef] [Green Version]
  14. Potter, P.E.; Maynard, J.B.; Depetris, P.J. Muddy Depositional Systems. In Mud and Mudstones; Potter, P.E., Maynard, J.B., Depetris, P.J., Eds.; Springer: Berlin/Heidelberg, Germany, 2005; pp. 75–126. [Google Scholar]
  15. Schieber, J.; Southard, J.; Thaisen, K. Accretion of mudstone beds from migrating floccule ripples. Science 2007, 318, 1760–1763. [Google Scholar] [CrossRef] [PubMed] [Green Version]
  16. Yawar, Z.; Schieber, J. On the origin of silt laminae in laminated shales. Sediment. Geol. 2017, 360, 22–34. [Google Scholar] [CrossRef]
  17. Schieber, J.; Southard, J.; Schimmelmann, A. Lenticular shale fabrics resulting from intermittent erosion of water-rich muds-interpreting the rock record in the light of recent flume experiments. J. Sediment. Res. 2010, 80, 119–128. [Google Scholar] [CrossRef] [Green Version]
  18. Macquaker, J.H.; Adams, A.E. Maximizing information from fine-grained sedimentary rocks: An inclusive nomenclature for mudstones. J. Sediment. Res. 2003, 73, 735–744. [Google Scholar] [CrossRef]
  19. Crombez, V.; Baudin, F.; Rohais, S.; Riquier, L.; Euzen, T.; Pauthier, S.; Ducros, M.; Caron, B.; Vaisblat, N. Basin scale distribution of organic matter in marine fine-grained sedimentary rocks: Insight from sequence stratigraphy and multi-proxies analysis in the Montney and Doig formations. Mar. Petrol. Geol. 2017, 83, 382–401. [Google Scholar] [CrossRef] [Green Version]
  20. Li, W.; Cao, J.; Shi, C.; Xu, T.; Zhang, H.; Zhang, Y. Shale oil in saline lacustrine systems: A perspective of complex lithologies of fine-grained rocks. Mar. Petrol. Geol. 2020, 116, 104351. [Google Scholar] [CrossRef]
  21. Sun, N.; Chen, T.; Zhong, J.; Gao, J.; Shi, X.; Xue, C.; Swennen, R. Petrographic and geochemical characteristics of deep-lacustrine organic-rich mudstone and shale of the Upper Triassic Chang 7 member in the southern Ordos Basin, northern China: Implications for shale oil exploration. J. Asian Earth Sci. 2022, 227, 105118. [Google Scholar] [CrossRef]
  22. Fathy, D.; Abart, R.; Wagreich, M.; Gier, S.; Ahmed, M.S.; Sami, M. Late Campanian climatic-continental weathering assessment and its influence on source rocks deposition in Southern Tethys, Egypt. Minerals 2023, 13, 160. [Google Scholar] [CrossRef]
  23. Jia, B.; Xian, C.G. Permeability measurement of the fracture-matrix system with 3D embedded discrete fracture model. Petrol. Sci. 2022, 19, 1757–1765. [Google Scholar] [CrossRef]
  24. Chen, T.Y.; Feng, X.T.; Cui, G.L.; Tan, Y.L.; Pan, Z.J. Experimental study of permeability change of organic-rich gas shales under high effective stress. J. Nat. Gas Sci. Eng. 2019, 64, 1–14. [Google Scholar] [CrossRef]
  25. Schmitt, M.; Fernandes, C.P.; da Cunha Neto, J.A.B.; Wolf, F.G.; dos Santos, V.S.S. Characterization of pore systems in seal rocks using nitrogen gas adsorption combined with mercury injection capillary pressure techniques. Mar. Pet. Geol. 2013, 39, 138–149. [Google Scholar] [CrossRef]
  26. Loucks, R.G.; Reed, R.M.; Ruppel, S.C.; Jarvie, D.M. Morphology, genesis, and distribution of nanometer-scale pores in siliceous mudstones of the Mississippian Barnett shale. J. Sediment. Res. 2009, 79, 848–861. [Google Scholar] [CrossRef] [Green Version]
  27. Liu, K.; Ostadhassan, M. Microstructural and geomechanical analysis of Bakken shale at nanoscale. J. Pet. Sci. Eng. 2017, 153, 133–144. [Google Scholar] [CrossRef]
  28. Davudov, D.; Moghanloo, R.G.; Lan, Y. Evaluation of accessible porosity using mercury injection capillary pressure data in shale samples. Energy Fuel 2018, 32, 4682–4694. [Google Scholar] [CrossRef]
  29. Gou, Q.; Xu, S.; Hao, F.; Yang, F.; Zhang, B.; Shu, Z.; Zhang, A.; Wang, Y.; Lu, Y.; Cheng, X.; et al. Full-scale pores and micro-fractures characterization using FE-SEM, gas adsorption, nano-CT and micro-CT: A case study of the Silurian Longmaxi Formation shale in the Fuling area, Sichuan Basin, China. Fuel 2019, 253, 167–179. [Google Scholar] [CrossRef]
  30. Li, S.; Liu, L.; Chai, P.; Li, X.; He, J.; Zhang, Z.; Wei, L. Imaging hydraulic fractures of shale cores using combined positron emission tomography and computed tomography (PET-CT) imaging technique. J. Pet. Sci. Eng. 2019, 182, 106283. [Google Scholar] [CrossRef]
  31. Chandra, D.; Vishal, V. A critical review on pore to continuum scale imaging techniques for enhanced shale gas recovery. Earth Sci. Rev. 2021, 217, 103638. [Google Scholar] [CrossRef]
  32. Pang, X.; Wang, G.; Kuang, L.; Li, H.; Zhao, Y.; Li, D.; Zhao, X.; Wu, S.; Feng, Z.; Lai, J. Insights into the pore structure and oil mobility in fine-grained sedimentary rocks: The Lucaogou Formation in Jimusar Sag, Junggar Basin, China. Mar. Petrol. Geol. 2022, 137, 105492. [Google Scholar] [CrossRef]
  33. Zhang, P.; Lu, S.; Li, J.; Zhang, J.; Xue, H.; Chen, C. Comparisons of SEM, lowfield NMR, and mercury intrusion capillary pressure in characterization of the pore size distribution of Lacustrine Shale: A case study on the Dongying depression, Bohai Bay Basin, China. Energy Fuel 2017, 31, 9232–9239. [Google Scholar] [CrossRef]
  34. Wu, Y.Q.; Tahmasebi, P.; Lin, C.; Zahid, M.A.; Dong, C.; Golab, A.N.; Ren, L. A comprehensive study on geometric, topological and fractal characterizations of pore systems in low-permeability reservoirs based on SEM, MICP, NMR, and X-ray CT experiments. Mar. Pet. Geol. 2019, 103, 12–28. [Google Scholar] [CrossRef]
  35. Bhattacharya, S.; Carr, T.R. Integrated data-driven 3D shale lithofacies modeling of the Bakken Formation in the Williston Basin, North Dakota, United States. J. Pet. Sci. Eng. 2019, 177, 1072–1086. [Google Scholar] [CrossRef]
  36. Bowker, K.A. Barnett shale gas production, Fort Worth Basin: Issues and discussion. AAPG Bull. 2007, 91, 523–533. [Google Scholar] [CrossRef]
  37. Jennings, D.S.; Antia, J. Petrographic characterization of the Eagle Ford Shale, south Texas: Mineralogy, common constituents, and distribution of nanometer-scale pore types. In Electron Microscopy of Shale Hydrocarbon Reservoirs; Camp, W., Diaz, E., Wawak, B., Eds.; AAPG Memoir: Tulsa, OK, USA, 2013; Volume 102, pp. 101–113. [Google Scholar]
  38. Li, G.X.; Luo, K.; Shi, D.Q. Key technologies, engineering management and important suggestions of shale oil/gas development: Case study of a Duvernay shale project in western Canada sedimentary basin. Petrol. Explor. Dev. 2020, 47, 791–802. [Google Scholar] [CrossRef]
  39. Song, J.; Littke, R.; Weniger, P.; Ostertag-Henning, C.; Nelskamp, S. Shale oil potential and thermal maturity of the Lower Toarcian Posidonia Shale in NW Europe. Int. J. Coal Geol. 2015, 150, 127–153. [Google Scholar] [CrossRef]
  40. Salygin, V.; Guliev, I.; Chernysheva, N.; Sokolova, E.; Toropova, N.; Egorova, L. Global shale revolution: Successes, challenges, and prospects. Sustainability 2019, 11, 1627. [Google Scholar] [CrossRef] [Green Version]
  41. Zou, C.; Yang, Z.; Cui, J.; Zhu, R.; Hou, L.; Tao, S.; Yuan, X.; Wu, S.; Lin, S.; Wang, L.; et al. Formation mechanism, geological characteristics and development strategy of nonmarine shale oil in China. Petrol. Explor. Dev. 2013, 40, 15–27. [Google Scholar] [CrossRef]
  42. Ma, Y.S.; Cai, Y.Y.; Zhao, P.R.; Hu, Z.Q.; Liu, H.M.; Gao, B.; Wang, W.Q.; Li, Z.M.; Zhang, Z.L. Geological characteristics and exploration practices of continental shale in China. Acta Geol. Sin. 2022, 96, 155–171, (In Chinese with English abstract). [Google Scholar]
  43. Li, Y.; Yin, J.; Wang, Z. Lithofacies Characteristics and Controlling Factors of Fine-Grained Sedimentary Rocks in the Lower First Member of the Shahejie Formation in the Northern Lixian Slope of Raoyang Sag, China. Minerals 2022, 12, 1414. [Google Scholar] [CrossRef]
  44. Liu, H.; Zhang, S.; Song, G.; Xuejun, W.; Teng, J.; Wang, M.; Bao, Y.; Yao, S.; Weng, W.; Zhang, S.; et al. Effect of shale diagenesis on pores and storage capacity in the Paleogene Shahejie Formation, Dongying Depression, Bohai Bay Basin, east China. Mar. Petrol. Geol. 2019, 103, 738–752. [Google Scholar] [CrossRef]
  45. Zhang, S.; Cao, Y.; Liu, K.; Jahren, J.; Xi, K.; Zhu, R.; Yang, T.; Cao, X.; Wang, W. Characterization of lacustrine mixed fine-grained sedimentary rocks using coupled chemostratigraphic-petrographic analysis: A case study from a tight oil reservoir in the Jimusar Sag, Junggar Basin. Mar. Petrol. Geol. 2019, 99, 453–472. [Google Scholar] [CrossRef]
  46. Li, M.; Wu, S.; Hu, S.; Zhu, R.; Meng, S.; Yang, J. Lamination texture and its effects on reservoir and geochemical properties of the Palaeogene Kongdian Formation in the Cangdong Sag, Bohai Bay Basin, China. Minerals 2021, 11, 1360. [Google Scholar] [CrossRef]
  47. Yang, R.; Wang, F.; Yun, N.; Zeng, H.; Han, Y.; Hu, X.; Diao, N. Pore structure characteristics and permeability stress sensitivity of Jurassic continental shale of Dongyuemiao Member of Ziliujing Formation, Fuxing Area, eastern Sichuan Basin. Minerals 2022, 12, 1492. [Google Scholar] [CrossRef]
  48. Cai, Y.; Zhu, R.; Luo, Z.; Wu, S.; Zhang, T.; Liu, C.; Zhang, J.; Wang, Y.; Meng, S.; Wang, H.; et al. Lithofacies and source rock quality of organic-rich shales in the Cretaceous Qingshankou Formation, Songliao Basin, NE China. Minerals 2022, 12, 465. [Google Scholar] [CrossRef]
  49. He, W.; Zhong, J.; Sun, N. Discovery and significance of tempestites and storm deposits in the Qignshankou Formation of the Gulong Sag, northeastern China. Front. Earth Sci. 2023, 10, 999135. [Google Scholar] [CrossRef]
  50. Zhang, B.; Zhang, J.; Feng, Z.; Zeng, H.; Huo, L.; Zhang, K. Geological conditions and resource potential for the formation of light crude oil from Gulong shale in Qingshankou Formaiton, Songliao Basin. Acta Petrol. Sin. 2021, 42, 1625–1639, (In Chinese with English abstract). [Google Scholar]
  51. He, W.; Bai, X.; Meng, Q.; Li, J.; Zhang, D.; Wang, Y. Accumulation geological characteristics and major discoveries of lacustrine shale oil in Sichuan Basin. Acta Petrol. Sin. 2022, 43, 885–898, (In Chinese with English abstract). [Google Scholar]
  52. Sun, L.; Liu, H.; He, W.; Li, G.; Zhang, S.; Zhu, R.; Jin, X.; Meng, S.; Jiang, H. An analysis of major scientific problems and research paths of Gulong shale oil in Daqing Oilfield, NE China. Petrol. Explor. Dev. 2021, 48, 527–540. [Google Scholar] [CrossRef]
  53. Feng, Z.Q.; Jia, C.Z.; Xie, X.N.; Zhang, S.; Feng, Z.H.; Cross, T.A. Tectonostratigraphic units and stratigraphic sequences of the nonmarine Songliao Basin, Northeast China. Basin Res. 2010, 22, 79–95. [Google Scholar]
  54. Song, Y.; Stepashko, A.; Liu, K.; He, Q.; Shen, C.; Shi, B.; Ren, J. Post-rift Tectonic history of the Songliao Basin, NE China: Cooling events and Post-rift unconformities driven by Orogenic Pulses from Plate Boundaries. J. Geophys. Res. Solid Earth 2018, 123, 2363–2395. [Google Scholar] [CrossRef]
  55. Wang, P.J.; Mattern, F.; Didenko, N.A.; Zhu, D.F.; Singer, B.; Sun, X.M. Tectonics and cycle system of the Cretaceous Songliao Basin: An inverted active continental margin basin. Earth Sci. Rev. 2016, 159, 82–102. [Google Scholar] [CrossRef] [Green Version]
  56. Liu, K.; Zhang, J.; Xiao, W.; Wilde, S.A.; Alexandrov, I. A review of magmatism and deformation history along the NE Asian margin from ca. 95 to 30 Ma: Transition from the Izanagi to Pacific plate subduction in the early Cenozoic. Earth Sci. Rev. 2020, 209, 103317. [Google Scholar] [CrossRef]
  57. Xu, C.; Shan, X.; He, W.; Zhang, K.; Rexiti, Y.; Su, S.; Zou, X. The influence of paleoclimate and a marine transgression event on organic matter accumulation in lacustrine black shales from the Late Cretaceous, southern Songliao Basin, Northeast China. Int. J. Coal Geol. 2021, 246, 103842. [Google Scholar] [CrossRef]
  58. Moore, D.M.; Reynolds, R.C. X-ray Diffraction and the Identification and Analysis of Clay Minerals; Oxford University Press: Oxford, UK, 1997; pp. 28–371. [Google Scholar]
  59. Hillier, S. Quantitative analysis of clay and other minerals in sandstones by X-ray powder diffraction (XRPD). In Clay Mineral Cements in Sandstones, International Association of Sedimentologists; Worden, R., Morad, S., Eds.; Special Publication. International: Oxford, UK, 2003; pp. 213–251. [Google Scholar]
  60. GB/T 18602-2012; Rock Pyrolysis Analysis. G.A.O.Q. Supervision: Beijing, China, 2012. (In Chinese)
  61. Behar, F.; Beaumont, V.; Penteado, H.D.B. Rock-Eval 6 technology: Performances and developments. Oil Gas Sci. Technol. 2001, 56, 111–134. [Google Scholar] [CrossRef]
  62. Brunauer, S.; Emmett, P.; Teller, E. Adsorption of gases in multimolecular layers. J. Am. Chem. Soc. 1938, 60, 309–319. [Google Scholar] [CrossRef]
  63. Coasne, B.; Gubbins, K.E.; Pellenq, R.J.-M. A Grand Canonical Monte Carlo study of adsorption and capillary phenomena in nanopores of various morphologies and topologies: Testing the BET and BJH characterization methods. Part. Part. Syst. Charact. 2004, 21, 149–160. [Google Scholar] [CrossRef]
  64. Gregg, S.J.; Sing, K.S.W. Adsorption, Surface Area and Porosity, 2nd ed.; Academic Press: New York, NY, USA, 1982. [Google Scholar]
  65. Ross, D.J.K.; Bustin, R.M. The importance of shale composition and pore structure upon gas storage potential of shale gas reservoirs. Mar. Petrol. Geol. 2009, 26, 916–927. [Google Scholar] [CrossRef]
  66. Groen, J.C.; Peffer, L.A.; Pérez-Ramírez, J. Pore size determination in modified micro-and mesoporous materials. Pitfalls and limitations in gas adsorption data analysis. Microporous Mesoporous Mater. 2003, 60, 1–17. [Google Scholar] [CrossRef]
  67. Washburn, E.W. The dynamics of capillary flow. Phys. Rev. 1921, 17, 273–283. [Google Scholar] [CrossRef] [Green Version]
  68. Jennings, J.B. Capillary pressure techniques: Application to exploration and development geology. AAPG. Bull. 1987, 71, 1196–1209. [Google Scholar]
  69. Li, P.; Zheng, M.; Bi, H.; Wu, S.; Wang, X. Pore throat structure and fractal characteristics of tight oil sandstone: A case study in the Ordos Basin, China. J. Pet. Sci. Eng. 2017, 149, 665–674. [Google Scholar] [CrossRef]
  70. Tissot, B.; Welte, D.H. Petroleum Formation and Occurrence; Springer: Berlin/Heidelberg, Germany, 1984. [Google Scholar]
  71. Huang, D.; Zhang, D.; Li, J.; Huang, X. Hydrocarbon genesis of Jurassic coal measures in the Turpan Basin, China. Org. Geochem. 1991, 17, 827–837. [Google Scholar]
  72. Lazar, O.R.; Bohacs, K.M.; Macquaker, J.H.; Schieber, J.; Demko, T.M. Capturing key attributes of fine-grained sedimentary rocks in outcrops, cores, and thin sections: Nomenclature and description guidelines. J. Sediment. Res. 2015, 85, 230–246. [Google Scholar] [CrossRef] [Green Version]
  73. Zhang, M.; Li, Z. The lithofacies and reservoir characteristics of the fine-grained sedimentary rocks of the Permian Lucaogou Formation at the northern foot of Bogda Mountains, Junggar Basin (NW China). J. Pet. Sci. Eng. 2018, 170, 21–39. [Google Scholar] [CrossRef]
  74. Fu, X.; Meng, Q.; Zheng, Q.; Wang, Z.; Jin, M.; Bai, Y.; Cui, K. Cyclicity of organic matter abundance and lithofacies paleogeography of Gulong shale in Songliao Basin. Petr. Geol. Oilfield Dev. Daqing 2022, 41, 38–52, (In Chinese with English abstract). [Google Scholar]
  75. Loucks, R.G.; Reed, R.M.; Ruppel, S.C.; Hammes, U. Spectrum of pore types and networks in mudrocks and a descriptive classification for matrix-related mudrock pores. AAPG Bull. 2012, 96, 1071–1098. [Google Scholar] [CrossRef] [Green Version]
  76. Sing, K.S. Reporting physisorption data for gas/solid systems with special reference to the determination of surface area and porosity (Recommendations 1984). Pure Appl. Chem. 1985, 57, 603–619. [Google Scholar] [CrossRef]
  77. Xue, C.; Wu, J.; Qiu, L.; Zhong, J.; Zhang, S.; Zhang, B.; Wu, X.; Hao, B. Lithofacies classification and its controls on the pore structure distribution in Permian transitional shale in the northeastern Ordos Basin, China. J. Petrol. Sci. Eng. 2020, 195, 107657. [Google Scholar] [CrossRef]
  78. Lai, J.; Wang, G.; Wang, Z.; Chen, J.; Pang, X.; Wang, S.; Zhou, Z.; He, Z.; Qin, Z.; Fan, X. A review on pore structure characterization in tight sandstones. Earth Sci. Rev. 2018, 177, 436–457. [Google Scholar] [CrossRef]
  79. Zhao, J.; Jin, Z.; Jin, Z.; Wen, X.; Geng, Y. Origin of authigenic quartz in organic-rich shales of the Wufeng and Longmaxi Formations in the Sichuan Basin, South China: Implications for pore evolution. J. Nat. Gas Sci. Eng. 2017, 38, 21–38. [Google Scholar] [CrossRef]
  80. Milliken, K.L.; Ergene, S.M.; Ozka, A. Quartz types, authigenic and detrital, in the upper cretaceous eagle ford formation, south Texas, USA. Sediment. Geol. 2016, 339, 273–288. [Google Scholar] [CrossRef]
  81. Talling, P.J.; Masson, D.G.; Sumner, E.J.; Malgesini, G. Subaqueous sediment density flows: Depositional processes and deposit types. Sedimentology 2012, 59, 1937–2003. [Google Scholar] [CrossRef]
  82. Chen, X.; Shi, W.; Hu, Q.; Hou, Y.; Zhai, G.; Dong, T.; Zhou, Z.; Du, X. Origin of authigenic quartz in organic-rich shales of the Niutitang Formation in the northern margin of Sichuan Basin, South China: Implications for pore network development. Mar. Petrol. Geol. 2022, 138, 105548. [Google Scholar] [CrossRef]
  83. Campo, D.M.; Papa, D.C.; Nieto, F.; Petrinovic, I. Integrated analysis for constraining palaeoclimatic and volcanic influences on clay-mineral assemblages in orogenic basins (Palaeogene Andean foreland, Northwestern Argentina). Sediment. Geol. 2010, 228, 98–122. [Google Scholar] [CrossRef]
  84. Sun, N.; Zhong, J.; Hao, B.; Ge, Y.; Swennen, R. Sedimentological and diagenetic control on the reservoir quality of deep-lacustrine sedimentary gravity flow sand reservoirs of the Upper Triassic Yanchang Formation in Southern Ordos Basin, China. Mar. Pet. Geol. 2020, 112, 104050. [Google Scholar] [CrossRef]
  85. Bai, B.; Dai, C.; Hou, X.; Liu, X.; Wang, R.; Yang, L.; Li, S.; He, J.; Dong, R. Authigenic silica in continental lacustrine shale and its hydrocarbon significance. Petrol. Explor. Dev. 2022, 49, 1033–1045. [Google Scholar] [CrossRef]
  86. Hua, G.; Wu, S.; Zhang, J.; Liu, R.; Guan, M.; Cai, Y.; Zhang, S. Laminar Structure and Reservoir Quality of Shales with High Clay Mineral Content in the Qingshankou Formation, Songliao Basin. Energies 2022, 15, 6132. [Google Scholar] [CrossRef]
  87. He, W.; Zhao, Y.; Zhong, J.; Sun, N. Study on organic matter and micropores of Qingshankou Formation shale oil reservoir in Gulong Sag, Songliao Basin. Geol. Rev. 2022. (In Chinese with English abstract). [Google Scholar]
  88. Plint, A.G. Mud dispersal across a Cretaceous prodelta: Storm-generated, wave-enhanced sediment gravity flows inferred from mudstone microtexture and microfacies. Sedimentology 2014, 61, 609–647. [Google Scholar] [CrossRef]
  89. Abdlmutalib, A.; Abdullatif, O.; Alqubalee, A.; Gonzalez, L.; Humphrey, J. Effects of lithofacies on pore system evolution of storm-wave silt-rich fine-grained sediments. Early Silurian Qusaiba Member (Qaliba Formation), NW Saudi Arabia. Mar. Petrol. Geol. 2021, 128, 105048. [Google Scholar] [CrossRef]
  90. Jia, J.; Liu, Z.; Bechtel, A.; Strobl, S.A.; Sun, P. Tectonic and Climate Control of Oil Shale Deposition in the Upper Cretaceous Qingshankou Formation (Songliao Basin, NE China). Int. J. Earth Sci. 2013, 102, 1717–1734. [Google Scholar] [CrossRef]
  91. Liu, B.; Wang, H.; Fu, X.; Bai, Y.; Bai, L.; Jia, M.; He, B. Lithofacies and depositional setting of a highly prospective lacustrine shale oil succession from the Upper Cretaceous Qingshankou Formation in the Gulong sag, northern Songliao Basin, northeast China. AAPG Bull. 2019, 103, 405–432. [Google Scholar] [CrossRef] [Green Version]
  92. Hackley, P.C.; Cardott, B.J. Application of organic petrography in North American shale petroleum systems: A review. Int. J. Coal Geol. 2016, 163, 8–51. [Google Scholar] [CrossRef] [Green Version]
  93. Fishman, N.S.; Hackley, P.C.; Lowers, H.A.; Hill, R.J.; Egenhoff, S.O.; Eberl, D.D.; Blum, A.E. The nature of porosity in organic-rich mudstone of the upper Jurassic Kimmeridge clay formation, North sea, offshore United Kingdom. Int. J. Coal Geol. 2012, 103, 32–50. [Google Scholar] [CrossRef]
  94. Jarvie, D.M.; Hill, R.J.; Ruble, T.E.; Pollastro, R.M. Unconventional shale-gas systems: The Mississippian Barnett Shale of north-central Texas as one model for thermogenic shale-gas assessment. AAPG Bull. 2007, 91, 475–499. [Google Scholar] [CrossRef]
Figure 1. Geological map of the study area. (A) Location of the Songliao Basin in China and its structural units. (B) Detailed map showing the study area with existing wells.
Minerals 13 00385 g001
Figure 2. Regional seismic profile across the study area, showing the structural–stratigraphic characteristics of the basin; the section line (red line) is shown in Figure 1A (modified from Song et al. [54]).
Minerals 13 00385 g002
Figure 3. Stratigraphic column of the Cretaceous in the Songliao Basin showing sedimentary evolution (modified from Feng et al. [53]; Xu et al. [57]).
Minerals 13 00385 g003
Figure 4. XRD data showing the mineral composition of the FGSRs of the Qingshankou Formation. (A) Whole-rock mineral composition; (B) clay mineral composition. Note that I/S = mixed-layer illite/smectite, C/S = mixed-layer chlorite/smectite.
Minerals 13 00385 g004
Figure 5. Ternary diagram showing the mineralogical composition of the FGSRs in the Qingshankou Formation. Note that FMR = fine mixed sedimentary rock.
Minerals 13 00385 g005
Figure 6. Sedimentary structures of FGSRs of the Qingshankou Formation. (Abbreviations: CPL = cross-polarized light; PPL = plane-polarized light). (A) Laminated structure, composed of felsic mineral lamina and clay lamina, the felsic lamina exhibited weak cross-bedding (red dotted line), well X851, 2508.24 m, PPL; (B) laminated structure, showed clay lamina and felsic lamina, well X2HC, 2355.23 m, PPL; (C) laminated structure, showed felsic lamina and ostracod fragments lamina, the felsic lamina with erosional scour surface (red arrows), well X3HC, 2448.1 m, CPL; (D) laminated structure, showed clay lamina and ostracod fragments lamina, well X3HC, 2432.20 m, CPL; (E) layered structure, showed thick felsic lamina and ostracod fragments lamina, well X2HC, 2356.09 m, PPL; (F) layered structure, showed ostracod fragments mixed felsic minerals and clay minerals, well X3HC, 2355.2 m, PPL; (G) massive structure, massive argillaceous dolomite, well X8HC, 2448.25 m; (H) massive structure, thick layer of ostracod fragments, well X58, 2096.51 m, CPL.
Minerals 13 00385 g006
Figure 7. TOC and pyrolysis data showing the geochemical characteristics of FGSRs. (A) Histogram of the TOC values; (B) histogram of S1 values; (C) cross plot showing the relationship between TOC and S1; (D) cross plot showing the relationship between S1 and S2.
Minerals 13 00385 g007
Figure 8. (A) Triangle figure showing the maceral compositions of FGSRs. (B) Classification of kerogen types of the FGSRs according to the van Krevelen diagram [71]. (C) Histogram of the δ13C values.
Minerals 13 00385 g008
Figure 9. (A) Histogram showing the Ro values. (B) Histogram showing the Tmax values.
Minerals 13 00385 g009
Figure 10. The main lithofacies types of FGSRs in the Qingshankou Formation. (AC) O-R laminated SM, well X3HC, 2452.0 m; (DF) O-M laminated SM, well X2HC, 2327.35 m; (GI) O-R laminated SFMR, well X3HC, 2488.1 m; (JL) O-C layered SM, well X7, 2453.6 m; (MO) O-M massive AM, well X8HC, 2382.1 m; (PR) O-M massive CM, well X1, 2578.01 m.
Minerals 13 00385 g010
Figure 11. Pore types of the FGSRs in the Qingshankou Formation. (Abbreviations: Ch = chlorite; Q = quartz; Py = pyrite; F = feldspar; OM = organic matter; I/S = mixed-layer illite/smectite). (A) InterP pores between rigid grain and clay mineral, well X8HC, 2446.2 m; (B) interP pores between grain and chlorite, well X8HC, 2438.6 m; (C) interP pores between rigid grains, well X8HC, 2523.11 m; (D) intraP pores in pyrite, well X8HC, 2328.0 m; (E) intraP pores in chlorite, well X8HC, 2438.6 m; (F) intraP pores in dissolved feldspar, well X8HC, 2435.0 m; (G) OM pores, well X8HC; (H) OM pores, well X8HC, 2491.07 m; (I) OM pores, well X8HC, 2317.1 m; (J) microfractures, well X8HC, 2520.0 m; (K) microfractures, well X3HC, 2431.17 m; (L) microfractures, well X8HC, 2561.66 m.
Minerals 13 00385 g011
Figure 12. Histogram showing the percentages of different pore types.
Minerals 13 00385 g012
Figure 13. Hysteresis patterns and their corresponding pore shapes (modified from Sing [76]).
Minerals 13 00385 g013
Figure 14. Typical N2 adsorption and desorption isotherms of different lithofacies of FGSRs. (A) SM; (B) SFMR; (C) AFMR; (D) CM.
Minerals 13 00385 g014
Figure 15. Pore diameter distribution of different lithofacies of FGSRs. (A,B) SM lithofacies shales, (C,D) SFMR lithofacies shales, (E,F) AFMR lithofacies shales, and (G,H) CM lithofacies shales.
Minerals 13 00385 g015
Figure 16. Mercury intrusion and extrusion curves and pore size distribution of SM (A,B) and SFMR (C,D).
Minerals 13 00385 g016
Figure 17. Mercury intrusion and extrusion curves and pore size distribution of AFMR (A,B) and CM (C,D).
Minerals 13 00385 g017
Figure 18. Authigenic quartz in FGSRs. (Abbreviations: QA = authigenic micro-sized quartz; QO = quartz overgrowth; Q = quartz). (A) Authigenic micro-sized quartz in pores, well X8HC, 2333.6 m; (B) authigenic micro-sized quartz in pores, well X8HC, 2391.05 m; (C) quartz overgrowth, well X8HC, 2317.1 m; (D) silica filled in shells, well X3HC, 2445.2 m.
Minerals 13 00385 g018
Figure 19. Depositional environment of FGSRs in the Qingshankou Formation.
Minerals 13 00385 g019
Figure 20. Cross plots showing the correlation between pore volume and TOC as well as mineral content. (A) The relationship between TOC and pore volume; (B) The relationship between clay mineral content and pore volume; (C) The relationship between illite content and pore volume; (D) The relationship between I/S content and pore volume; (E) The relationship between quartz + feldspar mineral content and pore volume; (F) The relationship between carbonate mineral content and pore volume.
Minerals 13 00385 g020
Figure 21. Cross plots showing the correlation of TOC and mineral content as well as S1/TOC. (A) The relationship between TOC and clay mineral content; (B) The relationship between TOC and felsic mineral content; (C) The relationship between TOC and carbonate mineral content; (D) The relationship between TOC and OSI.
Minerals 13 00385 g021
Table 1. Mineralogical lithofacies classification principle of the FGSRs.
Mineralogical FaciesClassification Principles
Carbonate Minerals Content/%Quartz + Feldspar Content/%Clay Minerals Content/%Relative Content
Ⅰ–SM<50≥50< 50Vqf > Vca; Vqf > Vcl
Ⅱ–AM<50<50≥50Vcl > Vca; Vcl > Vqf
Ⅲ–CM≥50<50<50Vca > Vcl; Vca > Vqf
Ⅳ–SFMR<50<50<50Vqf > Vca; Vqf > Vcl
Ⅴ–AFMR<50<50<50Vcl > Vca; Vcl > Vqf
Ⅵ–CFMR<50<50<50Vca > Vcl; Vca > Vqf
Note: Vca = carbonate mineral content; Vcl = clay mineral content; Vqf = quartz and feldspar content; CM = calcareous mudstone; AM = argillaceous mudstone; SM = silty mudstone; CFMR = calcareous fine-grained mixed sedimentary rocks; AFMR = argillaceous fine-grained mixed sedimentary rocks; SFMR = silty fine-grained mixed sedimentary rocks.
Table 2. SSA and average adsorption pore diameter of different lithofacies of FGSRs in the Qingshankou Formation.
WellDepth (m)LayerLithofaciesBET
SSA (m2/g)
Micropore
Volume
(cm3/g)
Micropore
Volume
(cm3/g)
Micropore
Volume
(cm3/g)
Average Pore Diameter (nm)
X8HC2417.10K1qn2SM22.360.00120.03150.00916.85
X8HC2421.08K1qn2SM28.020.00130.03290.00836.25
X8HC2425.10K1qn2SM32.630.00180.03690.00996.19
X8HC2435.05K1qn2SM34.510.00090.04110.01166.85
X8HC2439.05K1qn2SM36.160.00180.04100.01096.16
X8HC2449.10K1qn2SM29.190.00130.03260.00685.79
X8HC2409.10K1qn2SM32.030.00100.03010.00795.47
X8HC2415.10K1qn2SM21.390.00050.02990.00776.37
X8HC2459.10K1qn2SM38.620.00200.03890.00535.20
X8HC2465.10K1qn2SM38.100.00230.04090.00815.68
X8HC2469.19K1qn2SM13.690.00030.03100.00617.04
X8HC2473.23K1qn1SM27.900.00150.03240.00646.00
X8HC2481.10K1qn1SM37.010.00180.04080.00755.63
X8HC2505.12K1qn1SM35.410.00180.03950.00956.05
X8HC2512.10K1qn1SM35.300.00210.03760.00665.72
Average30.820.00140.03580.00816.08
X8HC2487.10K1qn1SFMR26.090.00160.03210.01027.74
X8HC2520.10K1qn1SFMR34.400.00190.03720.00855.72
Average30.240.00180.03460.00936.73
X8HC2497.10K1qn1AFMR31.870.00170.03650.00836.06
X8HC2501.24K1qn1AFMR31.880.00090.03700.00666.38
Average31.880.00130.03670.00756.22
X8HC2455.10K1qn2CM2.130.00000.02910.00497.14
X8HC2491.10K1qn1CM30.440.00170.03340.00735.27
Average16.290.00090.03120.00616.21
Table 3. Pore-throat parameters of different lithofacies of FGSRs from mercury intrusion tests.
WellDepth
(m)
LithofaciesPermeability
(10−3μm2)
Porosity (%)Pore-Throat Radius (μm)Sorting Coefficient
Sp
Skewness
Skp
Maximum Mercury Saturation
(SHgmax) (%)
Displacement Pressure (mPa)
Maximum Value RaAverage
value Rp
Median
Value R50
X8HC2471.1SM0.028.140.040.010.0050.93−1.00046.7720.68
X8HC2473.23SM0.397.121.560.320.0042.24−0.99650.270.47
X8HC2477.1SM0.027.050.020.010.0060.66−0.39176.7348.23
X8HC2479.1SM0.017.690.020.010.0060.67−0.31575.3148.21
X8HC2505.12SM0.019.271.090.150.0041.86−0.91954.030.68
X8HC2512.1SM0.029.520.020.010.0040.63−0.90052.2948.23
X3HC2488.6SM0.017.600.050.010.0050.93−1.00038.8013.76
X3HC2490.5SM0.117.100.050.020.0051.14−1.00044.2013.77
X3HC2491.7SM0.016.900.050.010.0051.15−0.80458.6813.78
X3HC2493.45SM0.017.100.050.010.0051.08−0.82355.2413.76
Average0.06 7.75 0.29 0.05 0.0051.13−0.81555.23 22.16
X8HC2487.1SFMR0.387.811.550.280.0042.16−0.96352.620.47
X8HC2497.1SFMR0.038.060.020.010.0050.63−0.66261.6648.23
X8HC2501.24SFMR0.109.010.540.100.0041.56−1.00043.541.37
X8HC2510.1SFMR0.019.690.540.080.0051.60−0.89456.031.36
X8HC2516.1SFMR0.027.050.020.010.0050.64−0.51768.4948.23
X3HC2460SFMR0.017.000.050.010.0051.01−1.00038.7713.77
Average0.09 8.10 0.450.08 0.0051.26−0.83953.5218.90
X3HC2487.7AFMR0.017.000.040.010.0040.93−1.00044.7120.66
X3HC2476.87AFMR0.016.001.100.160.0051.87−1.00042.120.67
Average0.016.500.570.09 0.0051.4−1.00043.4110.67
X8HC2524.25CM2.637.351.090.170.0042.16−0.95252.860.68
X3HC2433.3CM0.218.301.570.200.0062.13−0.79661.100.47
Average1.427.831.330.190.0052.15−0.87456.980.57
Disclaimer/Publisher’s Note: The statements, opinions and data contained in all publications are solely those of the individual author(s) and contributor(s) and not of MDPI and/or the editor(s). MDPI and/or the editor(s) disclaim responsibility for any injury to people or property resulting from any ideas, methods, instructions or products referred to in the content.

