Article

Impacts of Surface Water on Windborne Lead Dispersion from the Zinc Plant Leach Residue in Kabwe, Zambia

1
Division of Sustainable Resources Engineering, Graduate School of Engineering, Hokkaido University, Sapporo 060-8628, Japan
2
International Cooperation Department, Japan Space Systems, Tokyo 105-0011, Japan
3
Division of Sustainable Resources Engineering, Faculty of Engineering, Hokkaido University, Sapporo 060-8628, Japan
4
Research Faculty of Agriculture, Hokkaido University, Sapporo 060-8589, Japan
5
Geology Department, School of Mines, The University of Zambia, Lusaka 32379, Zambia
6
Faculty of Veterinary Medicine, Hokkaido University, Kita 18, Nishi 9, Kita-ku, Sapporo 060-0818, Japan
*
Author to whom correspondence should be addressed.
Minerals 2022, 12(5), 535; https://doi.org/10.3390/min12050535
Submission received: 27 February 2022 / Revised: 18 April 2022 / Accepted: 22 April 2022 / Published: 25 April 2022
(This article belongs to the Special Issue Pollution and Remediation in Mining and Metallurgical Districts)

Abstract

:
Effects of the water content of ground surface on windborne lead (Pb) dispersion from the zinc (Zn) leach residue site at the Kabwe mine, Zambia, were simulated. The Pb-bearing Zn plant leach residue site was selected as the source of the dispersion, and water conditions of the surface of the source were evaluated by the modified normalized difference water index (MNDWI) under the actual weather conditions in the year 2019. The MNDWI was calculated based on Sentinel-2 datasets, which were acquired in the year 2019. The index was used for monitoring the surface condition of the source necessary for simulating Pb dispersion, because the higher surface water content reduces the intensity of windborne source. The results showed that the wind speeds and directions had huge impacts on Pb dispersion when the MNDWI had negative values, and that the dispersion was inhibited when the MNDWI had positive values. These indicate that the water content of the surface is sensitive to dispersion, and that MNDWI is an effective parameter that expresses the source strength.

1. Introduction

The mass of mine waste materials is eroded by winds, and it becomes the potential of air and soil pollutants [1]. Thus, wind is considered as one of the causes for toxic metal contamination from mine sites in the world. Lead (Pb)- and/or zinc (Zn)-bearing soils were reported to be dispersed by winds to about 1500 m away from the mine site and there was no significant difference in toxic element contents between topsoil and dust samples from the mine site at the Kushk Pb-Zn mine, Iran [2]. At the Kombat mine, Namibia, Mileusnić et al. revealed high contents of copper (Cu) and Pb in the tailing site (9086 mg/kg and 5589 mg/kg respectively) and agriculture field (150 mg/kg and 164 mg/kg, respectively) in the dry season, and they suggested that winds disperse the tailings predominantly to agricultural fields around the mine area [3]. Large amounts of fine-grained residual materials were processed and stacked through mining activities in Kabwe, Zambia. Ettler et al. collected soil samples around the Kabwe mine within 20 km to analyze them by atomic absorption spectrometry. They detected 758 mg/kg of Pb and 234 mg/kg of Zn, and they concluded that the contents were affected by wind flow patterns in Kabwe [4].
Dispersion and redispersion models have been constructed based on local weather factors, and mechanisms of toxic metal contamination have been discussed [5,6]. Authors established Pb-bearing tailings dispersion and redispersion models and applied for reproducing Pb dispersion from the Kabwe mine [7]. They used local weather conditions including wind direction and speed, solar radiation, barometric pressure, humidity and air temperature affecting Pb-bearing tailings dispersion and deposition from the dumping site. They concluded that wind was the primary cause to disperse Pb-bearing tailings and induce Pb contamination of soils in Kabwe. Water conditions of the surface of the source, which is the other sensitive factor of dispersion by winds, are not quantitatively evaluated although the effects of humidity and rainfalls were analyzed in the previous study [7].
The purpose of this study was to understand the impacts of water content of the ground surface on Pb dispersion by using Kabwe local weather data of the year 2019, the same as the previous study [7]. The modified normalized difference water index (MNDWI) by satellite images was selected to estimate the surface water conditions of the source, and the dispersion of Pb was simulated using the values of MNDWI in the models. Correlations between accumulated amounts dispersed and values of MNDWI were examined to understand the effects of water condition of the Pb-bearing Zn leach residue dispersion from the tailing site. In this study, Pb was selected as a target element for dispersion from the source, because Zn has high solubility, and so Zn is easily flushed with rainwater.

2. Materials and Methods

2.1. Study Site and Concept of Model

The lead-bearing Zn plant leach residue site in Kabwe, Zambia (Figure 1), was selected as the source of Pb dispersion. The site was recognized to have a cycle of covered and non-covered by water bodies throughout the year 2019 by satellite data observations. Thus, this site was suitable for analyzing the impacts of water condition on dispersion.
The area of the source was extracted by analyzing European optical satellite, named Sentinel-2. Four source points at the source site were selected for this study, because the source site was separated into four areas by ridges, and because different amounts of water bodies were recognized throughout the year 2019. Four source points were considered for fine Pb-bearing leach residue dispersion [8]. The height of the source was estimated at the same height of the source point, and it was calculated with Digital Elevation Model by Japanese synthetic aperture radar satellite, named PALSAR (PALSAR DEM), with 12.5 m spatial resolution [9].
Eight playgrounds as target and sampling points were selected. Mufalo et al. [10] characterized surface soils at eight playgrounds in Kabwe, because the soils are not disturbed by the land use. The measured results were compared with the simulated results of Pb dispersion in this study to verify the simulation model. Figure 1 also shows the locations of the source and playgrounds.

2.2. Normalized Difference Water Index

The normalized difference water index (NDWI) is a method of estimating open water features by using short-wave infrared bands of spectral sensors. The basic idea of NDWI is to use green and near-infrared bands of remote sensing in which water has strong absorption and low radiation in the range between visible and near-infrared wavelengths [6]. Various studies have been conducted with optical satellite data, and NDWI has been improved. Finally the modified normalized difference water index (MNDWI) was developed by its abilities to estimate water information and extract water bodies [11,12].
For estimating water features of the ground surface on Pb-bearing Zn plant leach residue site by MNDWI, Sentinel-2 datasets were used. Authors tried to download various satellite data, not only Sentinel-2 series, but also Landsat (American) and ASTER (Japanese), for every month of the year 2019, but some datasets were covered by clouds, and it was difficult to analyze the water conditions on the source site.
The European Space Agency (ESA) launched a constellation of spaceborne multispectral sensor satellites named Sentinel-2 A and Sentinel-2 B in 2015 and 2017, respectively, under the Copernicus Program on behalf of the European Committee. The Earth observations by the constellation of satellites are improved through high observation frequency and global coverage [13]. The bands of Sentinel-2 series and equation of MNDWI are shown in Table 1 and Equation (1).
M N D W I = B 3 B 11 B 3 + B 11
where B3 is the value of the radiation at 560 nm as the central wavelength, and B11 is the value of the radiation at 1610 nm as the central wavelength.
The resultant range of MNDWI is from −1.0 (dry) to 1.0 (wet).

2.3. Weather Data Collection

The same local weather data in Kabwe in the year 2019, which were collected and used for Pb dispersion simulation by the previous study [7], were used for this study. Six weather factors are required for simulation of Pb dispersion: wind direction and speed, solar radiation, barometric pressure, humidity, and air temperature [14]. Due to machine troubles and errors of the data collection system, the data of August 2019 were not collected and not used. Weather data on the dates were applied when satellite data were obtained.
Authors collected wind direction and speed at Green Park every one hour throughout the year 2019. Green Park is located about 900 m away from the Kabwe mine for monitoring toxic elements absorbed by plants. In addition, the authors collected solar radiation, barometric pressure, humidity, and air temperature at the test site of the University of Zambia, Lusaka. While values of wind speed and direction were used as parameters of Pb dispersion simulation directly, solar radiation, barometric pressure, humidity, and air temperature in Lusaka were applied for determining coefficients of horizontal and vertical dispersivities for Pb dispersion.

2.4. Simulation Models for Lead Dispersion

In this study, the target particle sizes for dispersion simulations were classified into 10, 15, 20, 25, 30, 35, 40, 45 and 50 µm by considering the bioavailability through respiratory systems. Mufalo et al. [10] measured the particle size distribution of collected soils and Zn plant leach residue, and they found that 50% of the collected soils had a diameter less than 50 µm. Also, Siciliano et al. [15] mentioned that slags less than 45 µm have risks of oral bio-accessibilities in human beings. Moreover, the particle sizes less than 10 µm are categorized as air pollution sources [16,17].
The authors applied three models of Pb dispersion depending on wind speed, which were constructed and used in the previous study [7]. The plume model was prepared when wind speed was over 1.0 m/s; the weak puff model was prepared when wind speed was between 0.4 m/s and 1.0 m/s; and the no-puff model was prepared when wind speed was less than 0.4 m/s [5,18,19]. The models are expressed by the following equations.
Plume model:
C = Q 2 π ( π / 8 ) R σ z u { e x p [ ( z H e ) 2 σ z 2 2 ] + e x p [ ( z + H e ) 2 σ z 2 2 ] } ,
where
C: Concentration (mg/m2)
Q: Source strength (estimated at 0.025 m3/s and 0.0025 m3/s for the dry and rainy seasons, respectively)
R: Distance from source (= (x2 + y2 + z2)1/2)
x: Downwind distance along wind direction (m)
y: Horizontal distance perpendicular to x (m)
z: Elevation at simulating point (m)
σz: Diffusion width (m)
u: Wind speed (m/s)
He: Elevation of source (m)
Weak puff model:
C = Q 2 π ( π / 8 ) γ { 1 η 2 e x p [ u 2 ( z H e ) 2 2 α 2 η 2 ] + 1 η + 2 e x p [ u 2 ( z + H e ) 2 2 α 2 η + 2 ] } ,
In this equation
η2 = x2 + y2 + (α22) × (z − He)2
η+2 = x2 + y2 + (α22) × (z + He)2
where
α: Dispersivity with respect to horizontal direction
γ: Dispersivity with respect to vertical direction
No puff model:
C = Q 2 π ( π / 8 ) R γ { 1 η 2 + 1 η + 2 } ,
The source strength (Q) is a key parameter to simulate Pb dispersion. Here, a total of 1 m3 of leach residue per one second was assumed to be dispersed. According to Siwamba et al. [20], the residue contained 6.19 wt % of Pb and 2.53 wt % of Zn. Thus, the finer fractions of the residue were assumed to be dispersed (0.0900 m3/s) as a source strength for the dry soils. In the previous study [7], humidity and rainfalls were factors affecting the source strength for the simulation. In this study, values of MNDWI were used to determine the source strength, as shown in Table 2. The source was assumed to be completely ponded when the MNDWI was 0.8 [21]. This means that the source strength was set at zero.
Redispersion was modeled depending on the particle sizes of the leach residue and wind speed at the deposited locations. In this study, the particle sizes were set between 10 µm and 50 µm, which are the same sizes of cedar pollens (mean diameter is 30 µm). Nakatani and Nakane [22] established and reproduced pollen re-transport behavior. Their re-transport model was applied for reproducing Pb redispersion in this study. The residues on the ground surface have five different forces: gravity, static friction force, drag force, Saffman lift force and adhesion force.
Redispersion:
R = P R × C 1 × [ F D F f + F s g ] ,
where
R: Redispersion (mg)
PR: Percentage of redispersion
C1: Amount of dispersed leach residue (mg/m2)
FD: Drag force (= 1 2 ρ a u 2 C D π d 2 4 )
ρa: Fluid density (1.2250 kg/m3, standard atmospheric density)
u: Wind speed (m/s)
CD: Drag coefficient (= 0.6, particle was estimated at an elliptical pillar)
d: Particle size (µm)
Ff: Friction force (= μ × N)
µ: Friction coefficient (estimated at 0.52)
N: Normal force (= density of slag (3.45, the average values between 3.3 and 3.6) × volume of particle)
FS: Saffman lift (= 6.46 × ( d 2 ) 2 u ρ a μ ))
g: Gravity (= density of slag × volume of particle)
Shapes of particles are considered for estimating drag force. The dispersed residues on the playgrounds have various shapes such as sphere, angled cube, cylinder, etc. Here, an elliptical pillar shape (its drag coefficient (CD) of 0.6) between sphere and angled cube was assumed.
At the playgrounds, various particle sizes and materials are mixed. Also, various events such as human activities and weather events occurred every moment throughout the year 2019. By referring to the previous studies [23,24], the friction coefficient (µ) was set at 0.52 with considerations of the environmental conditions in which particles were easily swirled, dispersed and flushed by human activities, winds and rainfalls immediately after dispersed residues touched down on the ground.

3. Results

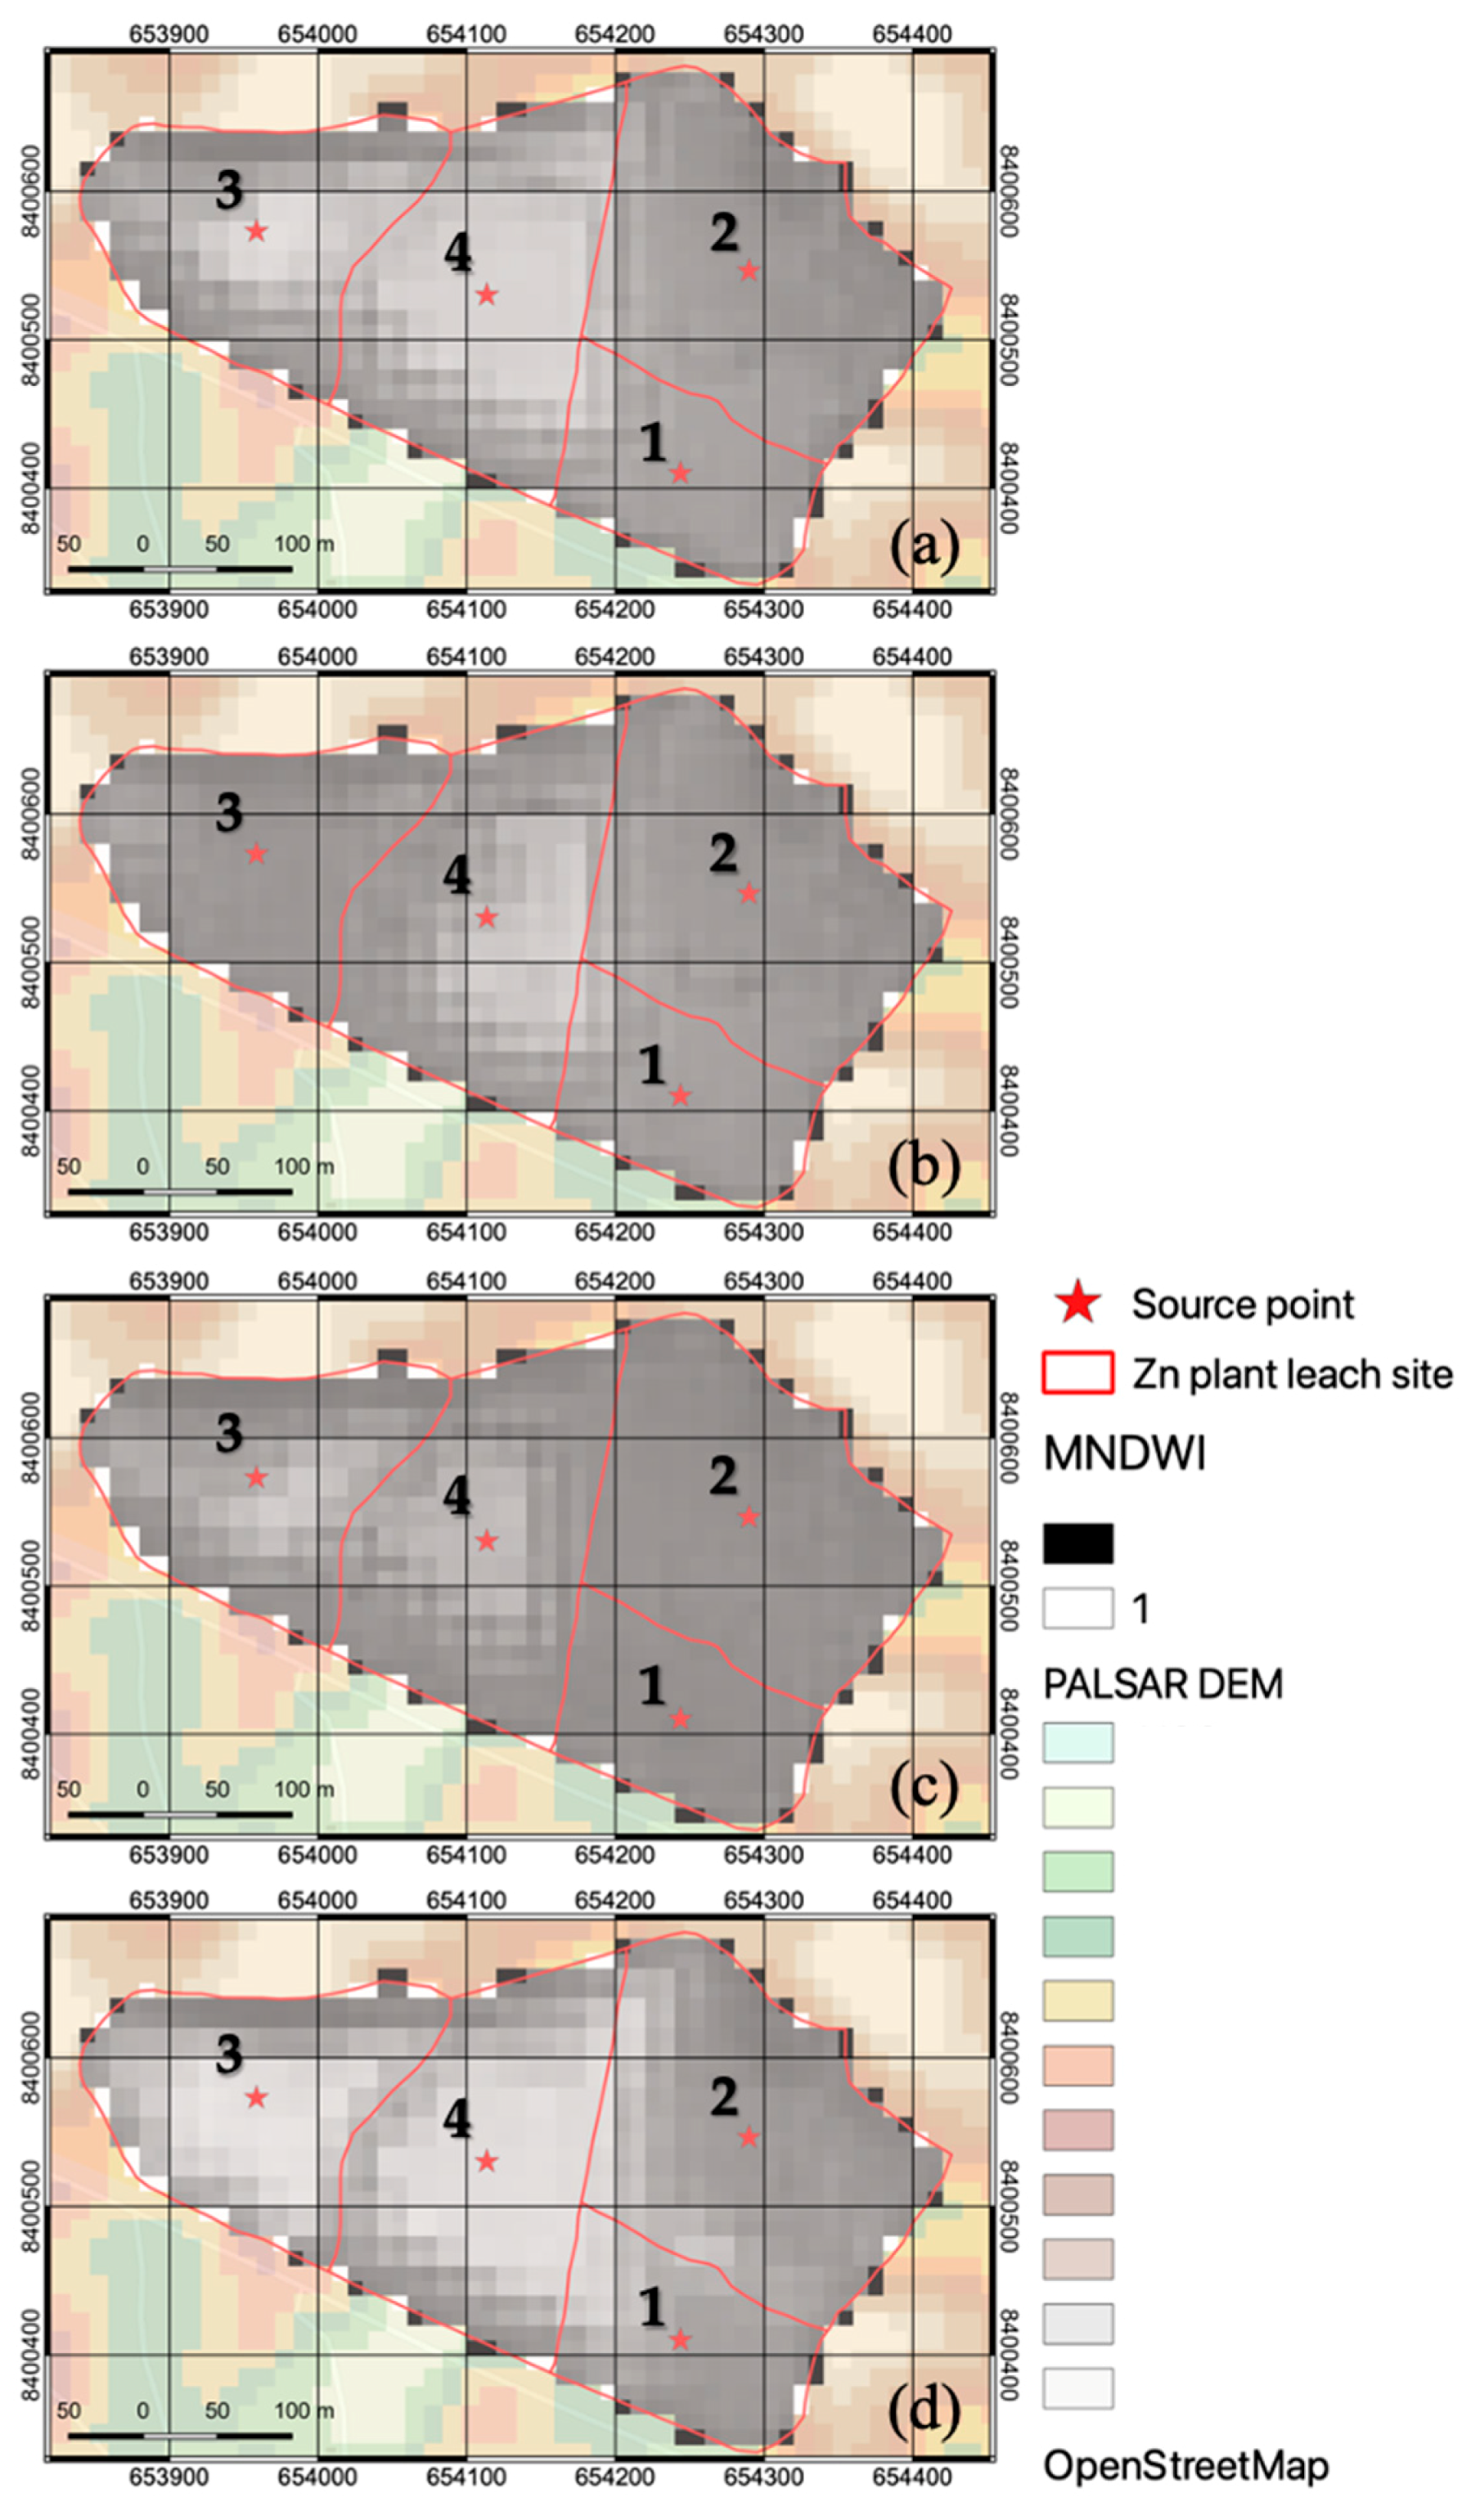
3.1. Modified Normalized Difference Water Index

The following Sentinel-2 datasets were collected and calculated for water feature estimations of the source site (Table 3). Level-1C is a product level of Sentinel-2, and the product is composed of ortho-images in Universal Transverse Mercator (UTM)/WGS 84 [25]. The satellite data, which were acquired on 18 August 2019, were not used, because the local weather data collection failed due to machine troubles. Also, Sentinel-2 datasets in January, February and October were not used, because they were covered by clouds, and they were difficult to identify and estimate the water conditions.
The satellite datasets were applied to calculating MNDWI, as listed in Table 3. For convenience, the Pb-bearing Zn plant leach residue site was divided by ridges into four, and defined as southeast side, #1, northeast, #2, westmost, #3, and the other, #4, as shown in Figure 2.
In the rainy season, water features were clearly observed on #3 and #4. The values of MNDWI of areas #1 (average value: −0.078) and #2 (average value: −0.090) were relatively lower than those of #3 (average value: 0.373) and #4 (average value: 0.470) throughout the season (Figure 2, Table 4). Table 4 also shows the values of source strength of areas #1 (average value: 0.0473 m3/s), #2 (average value: 0.0450 m3/s), #3 (average value: 0.0255 m3/s) and #4 (average value: 0.0203 m3/s) throughout the rainy season.
In the dry season, the values of MNDWI were negative and indicated as drier than in the rainy season (Figure 3, Table 5). The values of MNDWI of areas #3 (average value: 0.010) and #4 (average value: 0.015) were higher than the values in the same locations on 30 April 2019: −0.110 and −0.230, respectively. Table 5 also shows the values of source strength of areas #1 (average value: 0.0495 m3/s), #2 (average value: 0.0473 m3/s), #3 (average value: 0.0383 m3/s) and #4 (average value: 0.0405 m3/s) throughout the dry season.
The results indicate that the average value of source strength in the dry season was 1.30 times higher than the rainy season: it was 0.0439 m3/s in the dry season, and 0.338 m3/s in the rainy season. The values of source strength have impacts on the accumulated amounts dispersed and deposited directly through the dispersion and redispersion models. This means that the area is affected by rainfalls as well as leaching activities at the mine.

3.2. Weather Conditions on the Dates of Sentinel-2 Observations

Weather conditions, especially wind conditions, sensitively affect Pb dispersion. On all days of Sentinel-2 acquisition dates, weather and wind conditions were calm.
Figure 4 and Table 6 show weather conditions in the rainy season of 2019. In the rainy season, the average wind speeds were calm (between 0.81 m/s and 1.58 m/s), but the strong winds tended to blow from the east. On 31 March 2019, stronger winds (4.90 m/s) blew from the east, and winds blew from the west and east frequently (29.1% and 21.0% from the west and the east, respectively). On 30 April 2019, stronger winds (4.30 m/s) blew from the east frequently (29.1%). On 6 November 2019, stronger winds (4.50 m/s) blew from the east, and winds blew from the west and east frequently (29.1% and 45.8% from the west and east, respectively). On 16 December 2019, stronger winds (2.60 m/s) blew from the south frequently (33.3%).
Figure 5 and Table 7 show weather conditions in the dry season of 2019. In the dry season, the winds tended to blow from the west side frequently, and the strong winds tended to blow from the north and south sides. On 20 May 2019, the stronger wind (4.40 m/s) blew from the east. On 29 June 2019, the stronger wind (4.70 m/s) blew from the north-northwest. On 19 July 2019, stronger winds (2.70 m/s) blew from the southeast although winds blew from the west-northwest frequently (25.0%). On 7 September 2019, stronger wind (6.40 m/s) blew from the east-southeast, and winds blew from the west-northwest frequently (37.5%).

3.3. Impacts of Surface Water Condition on Dispersion

At the Pb-bearing Zn plant leach residue site, the accumulated amounts dispersed using MNDWI by Sentinel-2 were simulated. Figure 6 shows correlation between accumulated amounts dispersed and MNDWI values. Significant amounts of Pb were dispersed when the values of MNDWI were negative. The total accumulated amount dispersed was 9.959 mg/m2 when the values of MNDWI were negative. On the other hand, the total accumulated amount dispersed was 1.897 mg/m2 when the values of MNDWI were positive. The correlation between the accumulated amount dispersed and the values of MNDWI was inversely proportional.
The seasonal difference on Pb dispersion was compared. Accumulated amounts dispersed in the dry season (10.553 mg/m2) were relatively higher than those in the rainy season (0.975 mg/m2) when the values of MNDWI were negative.
In the rainy season, the accumulated amounts dispersed were low (1.588 mg/m2). The results agreed with results of the previous study, which indicated that low humidity and wet conditions by rainfalls had impacts on Pb dispersion [7]. Results on 19 July and 7 September 2019 showed that the accumulated amounts dispersed were negative in the dry season. This is due to the net effects of deposition and redispersion by winds in dry conditions. The results indicate that dry condition on the surface of the source is preferable to both dispersion and redispersion.
Figure 7 shows correlations between accumulated amounts dispersed and values of MNDWI in each separated area (area #1 to #4) of the source site.
At area #1, MNDWI indicated drier conditions on every Sentinel-2 observation date in 2019 (Figure 7a). On 19 July 2019, accumulated amounts dispersed (1.943 mg/m2) were higher than other dates, because the surface was dry and strong winds blew from the south. These two factors induced dispersion.
At area #2, MNDWI indicated dry conditions on every Sentinel-2 observation date in 2019 (Figure 7b). On 19 July 2019, accumulated amounts dispersed (1.965 mg/m2) were higher than other dates. It is because the surface was dry and strong winds blew from the south, which induced dispersion. Also, accumulated amounts dispersed on 7 September 2019 and 6 November 2019 were negative. These were due to the net effects of deposition and redispersion by winds from the west and northeast, respectively.
At area #3, MNDWI indicated that some water covered the surface of the area for some months of the year 2019 (Figure 7c). On 29 June 2019, accumulated amounts dispersed (1.404 mg/m2) were higher than the other Sentinel-2 observation dates. Strong and frequent winds blew from the southeast. This was the reason for the high amounts of dispersion. On 19 July 2019 and 7 September 2019, the values of MNDWI indicated drier surface of the area, but the accumulated amounts dispersed were negative: −0.070 mg/m2 and −0.032 mg/m2, respectively. These are due to the net effects of deposition and redispersion by winds and dry conditions. The results indicate that the surface was dry (MNDWI = −0.100), especially on 19 July 2019, with moderate winds from the south-southeast (0.625 m/s).
At area #4, MNDWI indicated some water on surface throughout the rainy season 2019 (Figure 7d). On 19 July 2019, accumulated amounts dispersed (2.155 mg/m2) were higher than the other dates. It is because the surface was dry and strong winds blew from the south.

4. Discussion

Impacts of water condition on the surface at the Pb-bearing Zn plant leach residue site under the local environment in Kabwe were evaluated by dispersion simulations and the values of MNDWI of Sentinel-2 data analysis. The impacts of wind conditions also affected the dispersion, although wind speeds were gentle and calm (less than 1.0 m/s) on Sentinel-2 observation dates throughout the year 2019.
Figure 8 shows the simulated amounts of dispersion and measured Pb contents of playground soils by Mufalo et al. [10] vs. distance from the source. Both the simulated amounts of deposition and measured Pb content decreased with distance from the source. This indicates that the dispersion model used here well expressed the Pb dispersion from the tailing site. This means that Pb contamination of soils is mainly caused by dispersion by winds from the dumping site.
NDWI (MNDWI used in this study) is a powerful method to monitor surface water conditions. Șerban et al. used the techniques monitoring surface water coverages of Nuntasi-Tunzla Lake on the Romanian Black Sea littoral for 55 years between 1965 and 2020 [26]. They used American satellites (Landsat series) and concluded that hydrological drought occurred on the lake by human activities and climate change.
MNDWI, which can observe quantitatively over many years, can be suitable for supporting the simulations of Pb dispersion from the mine site, especially in remote areas. This study indicates that MNDWI captured the surface properties of the source site by considering the local weather data in Kabwe throughout the year 2019. Utilizing the knowledge about MNDWI obtained in this study, impacts of windborne Pb dispersion in the future could be estimated by analyzing properties of the source site and performing dispersion simulation throughout the previous years.
Developing remediation plans around the mine sites could be discussed for determination of the sensitive areas to dispersion by evaluating impacts of the local wind direction and speed seasonal patterns through simulation of heavy metal dispersion. MNDWI is another indicator to monitor the waste site condition. Effective and economical remediation contributes to not only promoting sustainable mine development but also mitigating health risks of infants and children in Kabwe caused by heavy metal contamination.

5. Conclusions

For evaluation of dispersion phenomena and impacts of water condition of the Pb-bearing Zn plant leach residue site, where it was relatively covered with water throughout the year 2019, Pb dispersion using MNDWI was simulated under the actual and average weather conditions in the year 2019. The following results were found.
  • MNDWI was an effective indicator for monitoring the surface water condition of the source, and it is one of the parameters sensitive to Pb dispersion.
  • Water was an effective inhibiting factor of windborne Pb dispersion. Water on the Pb-bearing Zn plant leach residue site inhibited dispersion.
  • Wind speeds and directions had huge impacts on windborne Pb dispersion when the values of MNDWI were negative.
  • Lead dispersion was affected by the seasonal and complex local environmental conditions, including weather and water on the surface.
In-depth understanding of environmental conditions affecting toxic element dispersion is required to propose effective countermeasures against remediation of contaminated areas.

Author Contributions

Conceptualization, S.N. (Shinsaku Nakamura); methodology, S.N. (Shinsaku Nakamura) and T.I.; formal analysis, S.N. (Shinsaku Nakamura) and T.I.; writing—original draft preparation, S.N. (Shinsaku Nakamura); writing—review and editing, S.N. (Shinsaku Nakamura), T.I., Y.U., M.I. (Mayumi Ito), K.H., T.S., W.M., M.C., I.N., H.N., S.N. (Shouta Nakayama), and M.I.; supervision, S.N. (Shinsaku Nakamura) and T.I.; project administration, M.I. (Mayumi Ishizuka), S.N. (Shouta Nakayama) and H.N.; funding acquisition, M.I. (Mayumi Ishizuka), S.N. (Shouta Nakayama) and H.N. All authors have read and agreed to the published version of the manuscript.

Funding

The research was supported by JST/JICA SATREPS (Science and Technology Research Partnership for Sustainable Development; No. JPMJSA1501), aXis (Accelerating Social Implementation for SDGs Achievement: No. JPMJAS2001), JST AJ-CORE Project (M.I. (Mayumi Ishizuka)), JSPS CORE to CORE Program (M.I. (Mayumi Ishizuka)), Hokkaido University SOUSEI-TOKUTEI Specific Projects (M.I. (Mayumi Ishizuka)), JSPS Bilateral Open Partnership Joint Research Projects (JPJSBP120209902; S.N. (Shouta Nakayama)) and The Japan Prize Foundation (S.N. (Shouta Nakayama)), Grants-in-Aid for Scientific Research from the Ministry of Education, Culture, Sports, Science and Technology of Japan awarded to S.N. (Shouta Nakayama).

Data Availability Statement

Data are available on request to the authors.

Acknowledgments

The authors would like to acknowledge JST/JICA SATREPS (Science and Technology Research Partnership for Sustainable Development; No. JPMJSA1501), aXis (Accelerating Social Implementation for SDGs Achievement; No. JPMJAS2001), JST AJ-CORE Project (M.I. (Mayumi Ishizuka)), JSPS CORE to CORE Program (M.I. (Mayumi Ishizuka)), Hokkaido University SOUSEI-TOKUTEI Specific Projects (M.I. (Mayumi Ishizuka)), JSPS Bilateral Open Partnership Joint Research Projects (JPJSBP120209902; S.N. (Shouta Nakayama)) and The Japan Prize Foundation (S.N. (Shouta Nakayama)), Grants-in-Aid for Scientific Research from the Ministry of Education, Culture, Sports, Science and Technology of Japan awarded to S.N. (Shouta Nakayama).

Conflicts of Interest

The authors declare no conflict of interest.

References

  1. Etter, V. Soil contamination near non-ferrous metal smelters: A review. Appl. Geochem. 2016, 64, 56–74. [Google Scholar]
  2. Nriagu, J.O. A history of global metal pollution. Science 1996, 272, 223. [Google Scholar] [CrossRef]
  3. Mileusnić, M.; Mapani, B.S.; Kamona, A.F.; Ružičić, S.; Mapaure, I.; Chimwamurombe, P.M. Assessment of agricultural soil contamination by potentially toxic metals dispersed from improperly disposed tailings, Kombat mine, Namibia. J. Geochem. Explor. 2014, 144, 409–420. [Google Scholar] [CrossRef]
  4. Ettler, V.; Vítková, M.; Mihaljevicˇ, M.; Šebek, O.; Klementová, M.; Veselovský, F.; Vybíral, P.; Kříbek, B. Dust from Zambian smelters: Mineralogy and contaminant bioaccessibility. Environ. Geochem. Health 2014, 36, 919–933. [Google Scholar] [CrossRef] [PubMed]
  5. Ministry of Economy, Trade and Industry of Japan. Technical Manual of Ministry of Economy, Trade and Industry Low Rise Industrial Source Dispersion Model (METI-LIS) ver. 3.02. March 2012. Available online: https://www.jemai.or.jp/tech/meti-lis/detailobj-6117-attachment.pdf (accessed on 30 May 2019).
  6. McFeeters, S.K. The use of the normalized difference water index (DNWI) in the delineation of open water features. Int. J. Remote Sens. 1996, 17, 7. [Google Scholar] [CrossRef]
  7. Nakamura, S.; Igarashi, T.; Uchida, Y.; Ito, M.; Hirose, K.; Sato, T.; Mufalo, W.; Chirwa, M.; Nyambe, I.; Nakata, H.; et al. Evaluation of dispersion of lead-bearing mine wastes in Kabwe District, Zambia. Minerals 2021, 11, 901. [Google Scholar] [CrossRef]
  8. Japan Environmental Management Association for Industry, Ministry of Economy, Trade and Industry, Low Rise Industrial Source Dispersion MODEL. 2021. Available online: http://www.jemai.or.jp/tech/meti-lis/detailobj-6117-attachment.pdf (accessed on 28 October 2020).
  9. Alaska Satellite Facility. ASF Radiometrically Terrain Corrected ALOS PALSAR Products Product Guide. 2015. Available online: https://asf.alaska.edu/wp-content/uploads/2019/03/rtc_product_guide_v1.2.pdf (accessed on 14 December 2021).
  10. Mufalo, W.; Tangviroon, P.; Igarashi, T.; Ito, M.; Sato, T.; Chirwa, M.; Nyambe, I.; Nakata, H.; Nakayama, S.; Ishizuka, M. Solid-phse partitioning and leaching behavior of Pb and Zn from playground soils in Kabwe, Zambia. Toxics 2021, 9, 248. [Google Scholar] [CrossRef] [PubMed]
  11. Titolo, A. Use of time-series NDWI to monitor emerging archaeological sites: Case studies from Iraqi artificial reservoirs. Remote Sens. 2021, 13, 786. [Google Scholar] [CrossRef]
  12. Xu, H. Modification of normalized difference water index (NDWI) to enhance open water features in remotely sensed imaginary. Int. J. Remote Sens. 2006, 27, 3025–3033. [Google Scholar] [CrossRef]
  13. European Committee. Copernicus: Europe’s Eyes on Earth. Available online: https://www.copernicus.eu/en (accessed on 6 May 2020).
  14. Klingmuller, K.; Metzger, S.; Abdelkader, M.; Karydis, V.A.; Stenchikkov, G.L.; Pozzer, A.; Lelievbeld, J. Revised mineral dust emission in the atmospheric chemistry-climate model EMAC (MESSy 2.52 DU_Astithal KKDU2017 patch). Geosci. Model Dev. 2018, 11, 989–1008. [Google Scholar] [CrossRef] [Green Version]
  15. Siciliano, S.D.; James, K.; Zhang, G.; Schafer, A.N.; Peak, J.D. Adhesion and enrichment of metals on human hands from contaminated soil at an Arctic urbanbrownfield. Environ. Sci. Technol. 2009, 43, 6385–6390. [Google Scholar] [CrossRef] [PubMed]
  16. Tada, K.; Hazama, H.; Kobayashi, K.; Okamoto, S. Development and evaluation of a diffusion model for particle matter -Application to Kashima area. J. Japan Soc. Air Pollut. 1989, 24, 64–73. [Google Scholar]
  17. Matsusaka, S.; Masuda, H. Reentrainment phenomena of fine particles. J. Soc. Powder Technol. Jpn. 1992, 29, 530–538. [Google Scholar] [CrossRef] [Green Version]
  18. Sherman, C.A. A mass-consistent model for wind fields over complex terrain. J. Appl. Meteorol. 1978, 17, 312–319. [Google Scholar] [CrossRef] [Green Version]
  19. Fukuyama, T.; Izumi, K.; Utiyama, M. Dry deposition of atmospheric aerosols—A browse on recent papers. J. Aerosol Res. 2004, 19, 245–253. [Google Scholar]
  20. Silwamba, M.; Ito, M.; Fukushima, T.; Park, I.; Jeos, S.; Tabelin, C.B.; Hiroyoshi, N. Lead removal in zinc leach residues from Kabwe, Zambia by carrier-in-pulp method using zero-valent iron. OSF Prepr. 2020. [Google Scholar] [CrossRef]
  21. Bangira, T.; Alfieri, S.M.; Menenti, M.; van Niekerk, A. Comparing thresholding with machine learning classifiers for mapping complex water. Remote Sens. 2019, 11, 1351. [Google Scholar] [CrossRef] [Green Version]
  22. Nakatani, N.; Nakane, I. A study of pollen re-transportation in urban environment by using physical model and numerical simulation. Jpn. Soc. Comput. Methods Eng. 2017, 17, 171215. [Google Scholar]
  23. Fuller, D.D. Coefficient of Friction. Columbia University, 2-42—2-48. Available online: https://web.mit.edu/8.13/8.13c/references-fall/aip/aip-handbook-section2d.pdf (accessed on 6 May 2020).
  24. Nabeel, M.; Karasev, A.; Jönsson, P.G. Friction forces and mechanical dust generation in an iron ore pellet bed subjected to varied applied loads. ISIJ Int. 2017, 57, 656–664. [Google Scholar] [CrossRef] [Green Version]
  25. European Space Agency. Sentinel Online. Available online: https://sentinels.copernicus.eu/web/sentinel/user-guides/sentinel-2-msi/product-types/level-1c (accessed on 6 May 2020).
  26. Șerban, C.; Maftei, C.; Dobricǎ, G. Surface water change detection via water indices and predictive modeling using remote sensing imagery: A case study of Nuntasi-Tuzla Lake, Romania. Water 2022, 14, 556. [Google Scholar] [CrossRef]
Figure 1. Study site: (a) locations of Zambia and Kabwe; (b) locations of the source and playgrounds.
Minerals 12 00535 g001
Figure 2. Results of MNDWI in the rainy season: bright pixels indicate water of the surface, and dark pixels indicate dry surface. (a) MNDWI results on 31 March 2019; (b) MNDWI results on 30 April 2019; (c) MNDWI results on 6 November 2019; and (d) MNDWI results on 16 December 2019. Water bodies were observed in #3 and #4 throughout the rainy season.
Minerals 12 00535 g002
Figure 3. Results of NDWI in the dry season: bright pixels indicate water of the surface, and dark pixels indicate dry surface. (a) MNDWI results on 20 May 2019; (b) MNDWI results on 29 June 2019; (c) MNDWI results on 19 July 2019; and (d) MNDWI results on 7 September 2019.
Minerals 12 00535 g003
Figure 4. Wind speed and frequency of wind directions on Sentinel-2 observation dates in the rainy season: (a) a chart of 31 March 2019; (b) a chart of 30 April 2019; (c) a chart of 6 November 2019; and (d) a chart of 16 December 2019.
Minerals 12 00535 g004
Figure 5. Wind speed and frequency of wind directions on Sentinel-2 observation dates in the dry season: (a) a chart of 20 May 2019; (b) a chart of 29 June 2019; (c) a chart of 19 July 2019; and (d) a chart of 07 September 2019.
Minerals 12 00535 g005
Figure 6. Correlation between accumulated amount dispersed and values of MNDWI: Blue dots show the correlation in the rainy season; orange dots show the correlation in the dry season; amounts of Pb dispersion decreased with the value of MNDWI.
Minerals 12 00535 g006
Figure 7. Correlations between accumulated amounts dispersed from each area of the Pb-bearing Zn plant leach residue site and MNDWI: (a) correlation at #1; (b) correlation at #2; (c) correlation at #3; and (d) correlation at #4.
Minerals 12 00535 g007
Figure 8. Comparison between simulated results of dispersion of Pb-bearing Zn plant leach residues and measured Pb content of soils by Mufalo et al. [10]: orange dots show Pb dispersion with consideration of water condition on the surface of the source by MNDWI; and green dots show measured Pb content of soils by Mufalo et al. [10].
Minerals 12 00535 g008
Table 1. Band specification of Sentinel-2 series.
BandSpectral Resolution (m)Central Wavelength (nm)Band Width (nm)
B16044320
B21049065
B31056035
B41066530
B52070515
B62074015
B72078320
B810842115
B8A2086520
B96094520
B1060137520
B1120161020
B1220219020
Table 2. Relationship between MNDWI and source strength for dispersion simulations.
MNDWISource Strength (m3/s)
MNDWI = −1.00.0900
−0.1 < MNDWI ≤ −0.80.0810
−0.8 < MNDWI ≤ −0.60.0720
−0.6 < MNDWI ≤ −0.40.0630
−0.4 < MNDWI ≤ −0.20.0540
−0.2 <M NDWI ≤ 0.00.0450
0.0 < MNDWI ≤ 0.20.0360
0.2 < MNDWI ≤ 0.40.0270
0.4 < MNDWI ≤ 0.60.0180
0.6 < MNDWI ≤ 0.80.0090
0.8 < MNDWI ≤ 1.00.0000
Table 3. Collected satellite data product information.
Observation Date (Day-Month-Year)SatelliteProduct LevelNote
31 March 2019Sentinel-2 BLevel-1CRainy season
30 April 2019Sentinel-2 BLevel-1CRainy season
20 May 2019Sentinel-2 BLevel-1CDry season
29 June 2019Sentinel-2 BLevel-1CDry season
19 July 2019Sentinel-2 BLevel-1CDry season
18 August 2019Sentinel-2 BLevel-1CNo weather data
7 September 2019Sentinel-2 BLevel-1CDry season
6 November 2019Sentinel-2 BLevel-1CRainy season
16 December 2019Sentinel-2 BLevel-1CRainy season
Table 4. Values of MNDWI and source strength in the rainy season 2019.
Area31 March 201930 April 20196 November 201916 December 2019
MNDWISource Strength (m3/s)MNDWISource Strength (m3/s)MNDWISource Strength (m3/s)MNDWISource Strength (m3/s)
#1−0.030.0450−0.040.0450−0.240.05400.000.0450
#2−0.050.0450−0.090.0450−0.190.0450−0.030.0450
#30.700.0090−0.110.04500.250.02700.650.0090
#40.490.01800.230.02700.270.02700.650.0090
Table 5. Values of MNDWI and source strength in the dry season 2019.
Area20 May 201929 June 201919 July 20197 September 2019
MNDWISource Strength (m3/s)MNDWISource Strength (m3/s)MNDWISource Strength (m3/s)MNDWISource Strength (m3/s)
#1−0.070.0450−0.170.0450−0.200.0540−0.260.0540
#2−0.130.0450−0.170.0450−0.180.0450−0.200.0540
#30.270.02700.010.0360−0.100.0450−0.140.0450
#40.500.0180−0.170.0450−0.070.0450−0.200.0540
Table 6. Daily average values of weather data on Sentinel-2 observation dates in the rainy season: in practice, 24 h weather data per each Sentinel-2 observation date were applied to the simulation of leach residue dispersion.
DateMaximum Wind Speed (m/s)Average Wind Speed
(m/s)
Average
Solar
Radiation
(kW/m2)
Average Barometric Pressure
(hPa)
Average Humidity
(%)
Average Air
Temperature
(°C)
31 March 20194.901.332.82875.7855.1022.46
30 April 20194.301.582.53878.7663.6020.19
6 November 20194.501.442.23874.5040.9826.03
16 December 20192.600.812.82874.4068.5724.38
Table 7. Daily average values of weather data on Sentinel-2 observation dates in the dry season: 24-h weather data per each Sentinel-2 observation date were applied to the simulation of leach residue dispersion.
DateMaximum Wind Speed (m/s)Average Wind Speed
(m/s)
Average
Solar
Radiation
(kW/m2)
Average Barometric Pressure
(hPa)
Average Humidity
(%)
Average Air
Temperature
(°C)
20 May 20194.401.121.95877.6960.7420.21
29 June 20194.701.291.34879.8353.1116.00
19 July 20192.700.961.87879.0343.9517.07
7 September 20196.402.411.71883.0252.3317.85
Publisher’s Note: MDPI stays neutral with regard to jurisdictional claims in published maps and institutional affiliations.

