
Application of Spectroscopic Characteristics of White Mica in Porphyry Tungsten Deposits: A Case Study Involving the Shimensi Deposit in Northern Jiangxi
Abstract
:1. Introduction
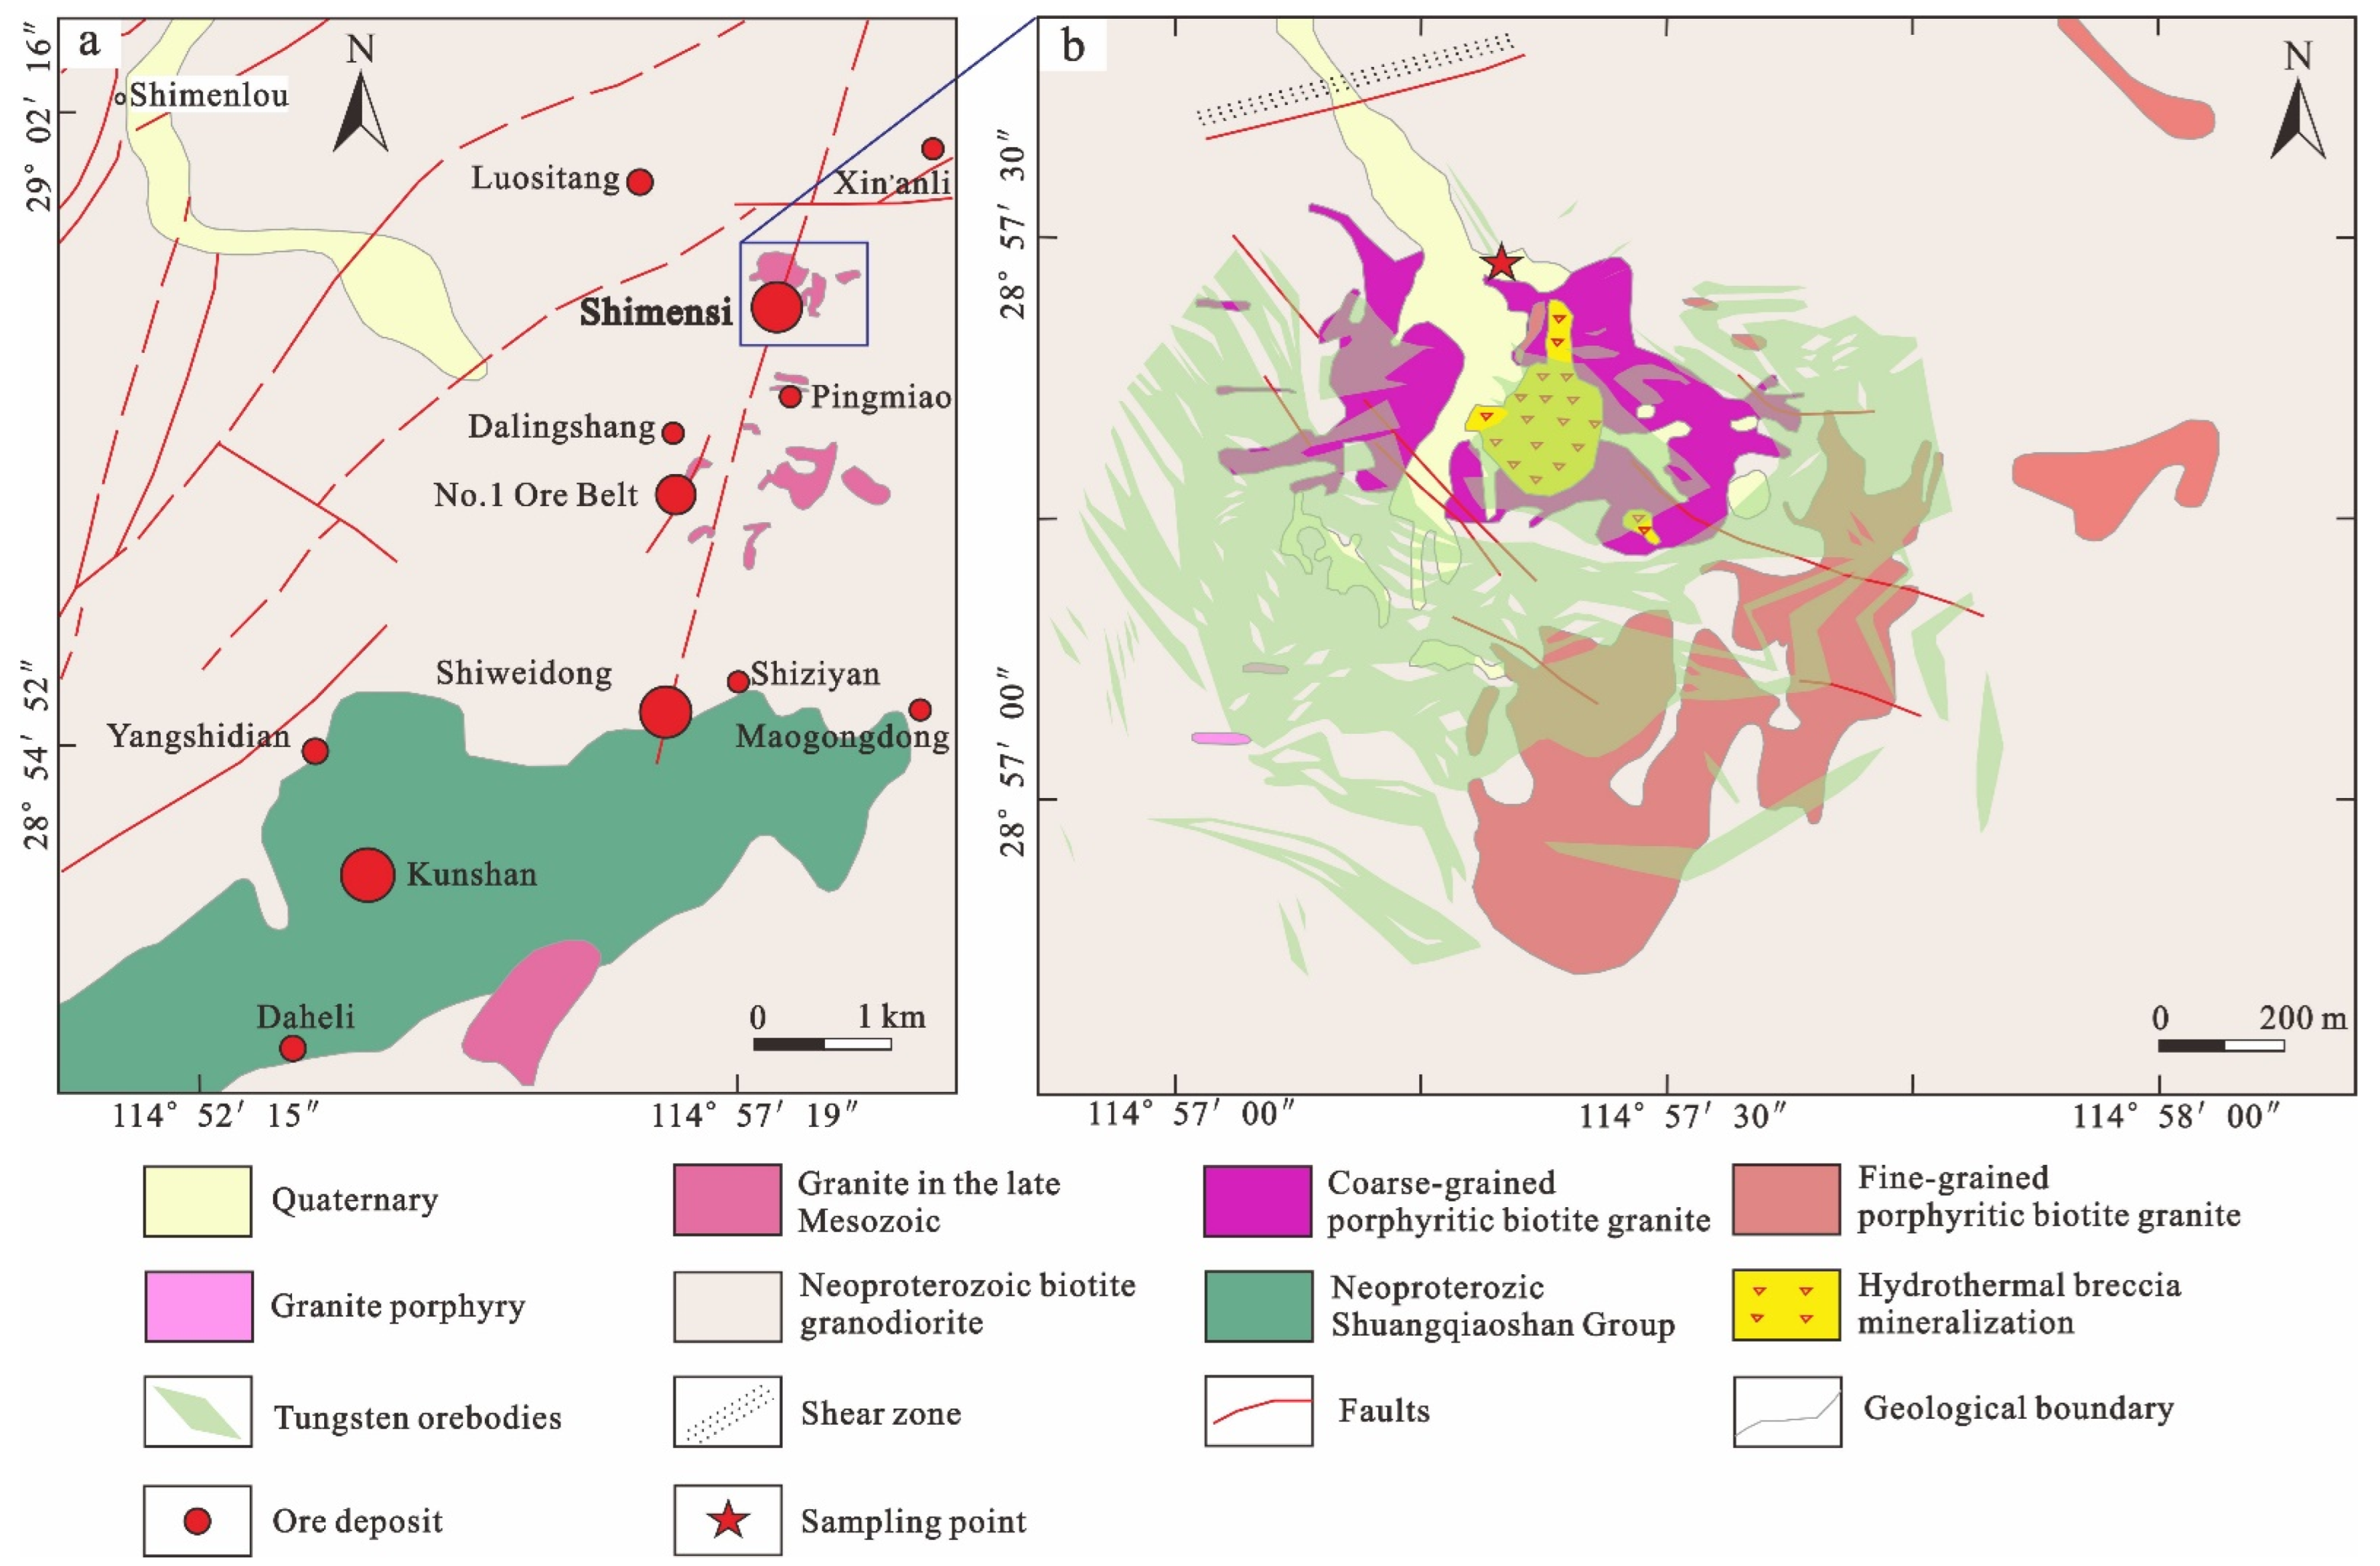
2. Regional and Deposit Geology
3. Sampling and Methods
3.1. Sampling
3.2. Shortwave Infrared Spectroscopy
3.3. Micro-Raman Spectroscopy
3.4. Electron Microprobe Analysis (EMPA)
3.5. Laser Ablation Inductively Coupled Plasma Mass Spectrometry (LA-ICP-MS)
4. Results
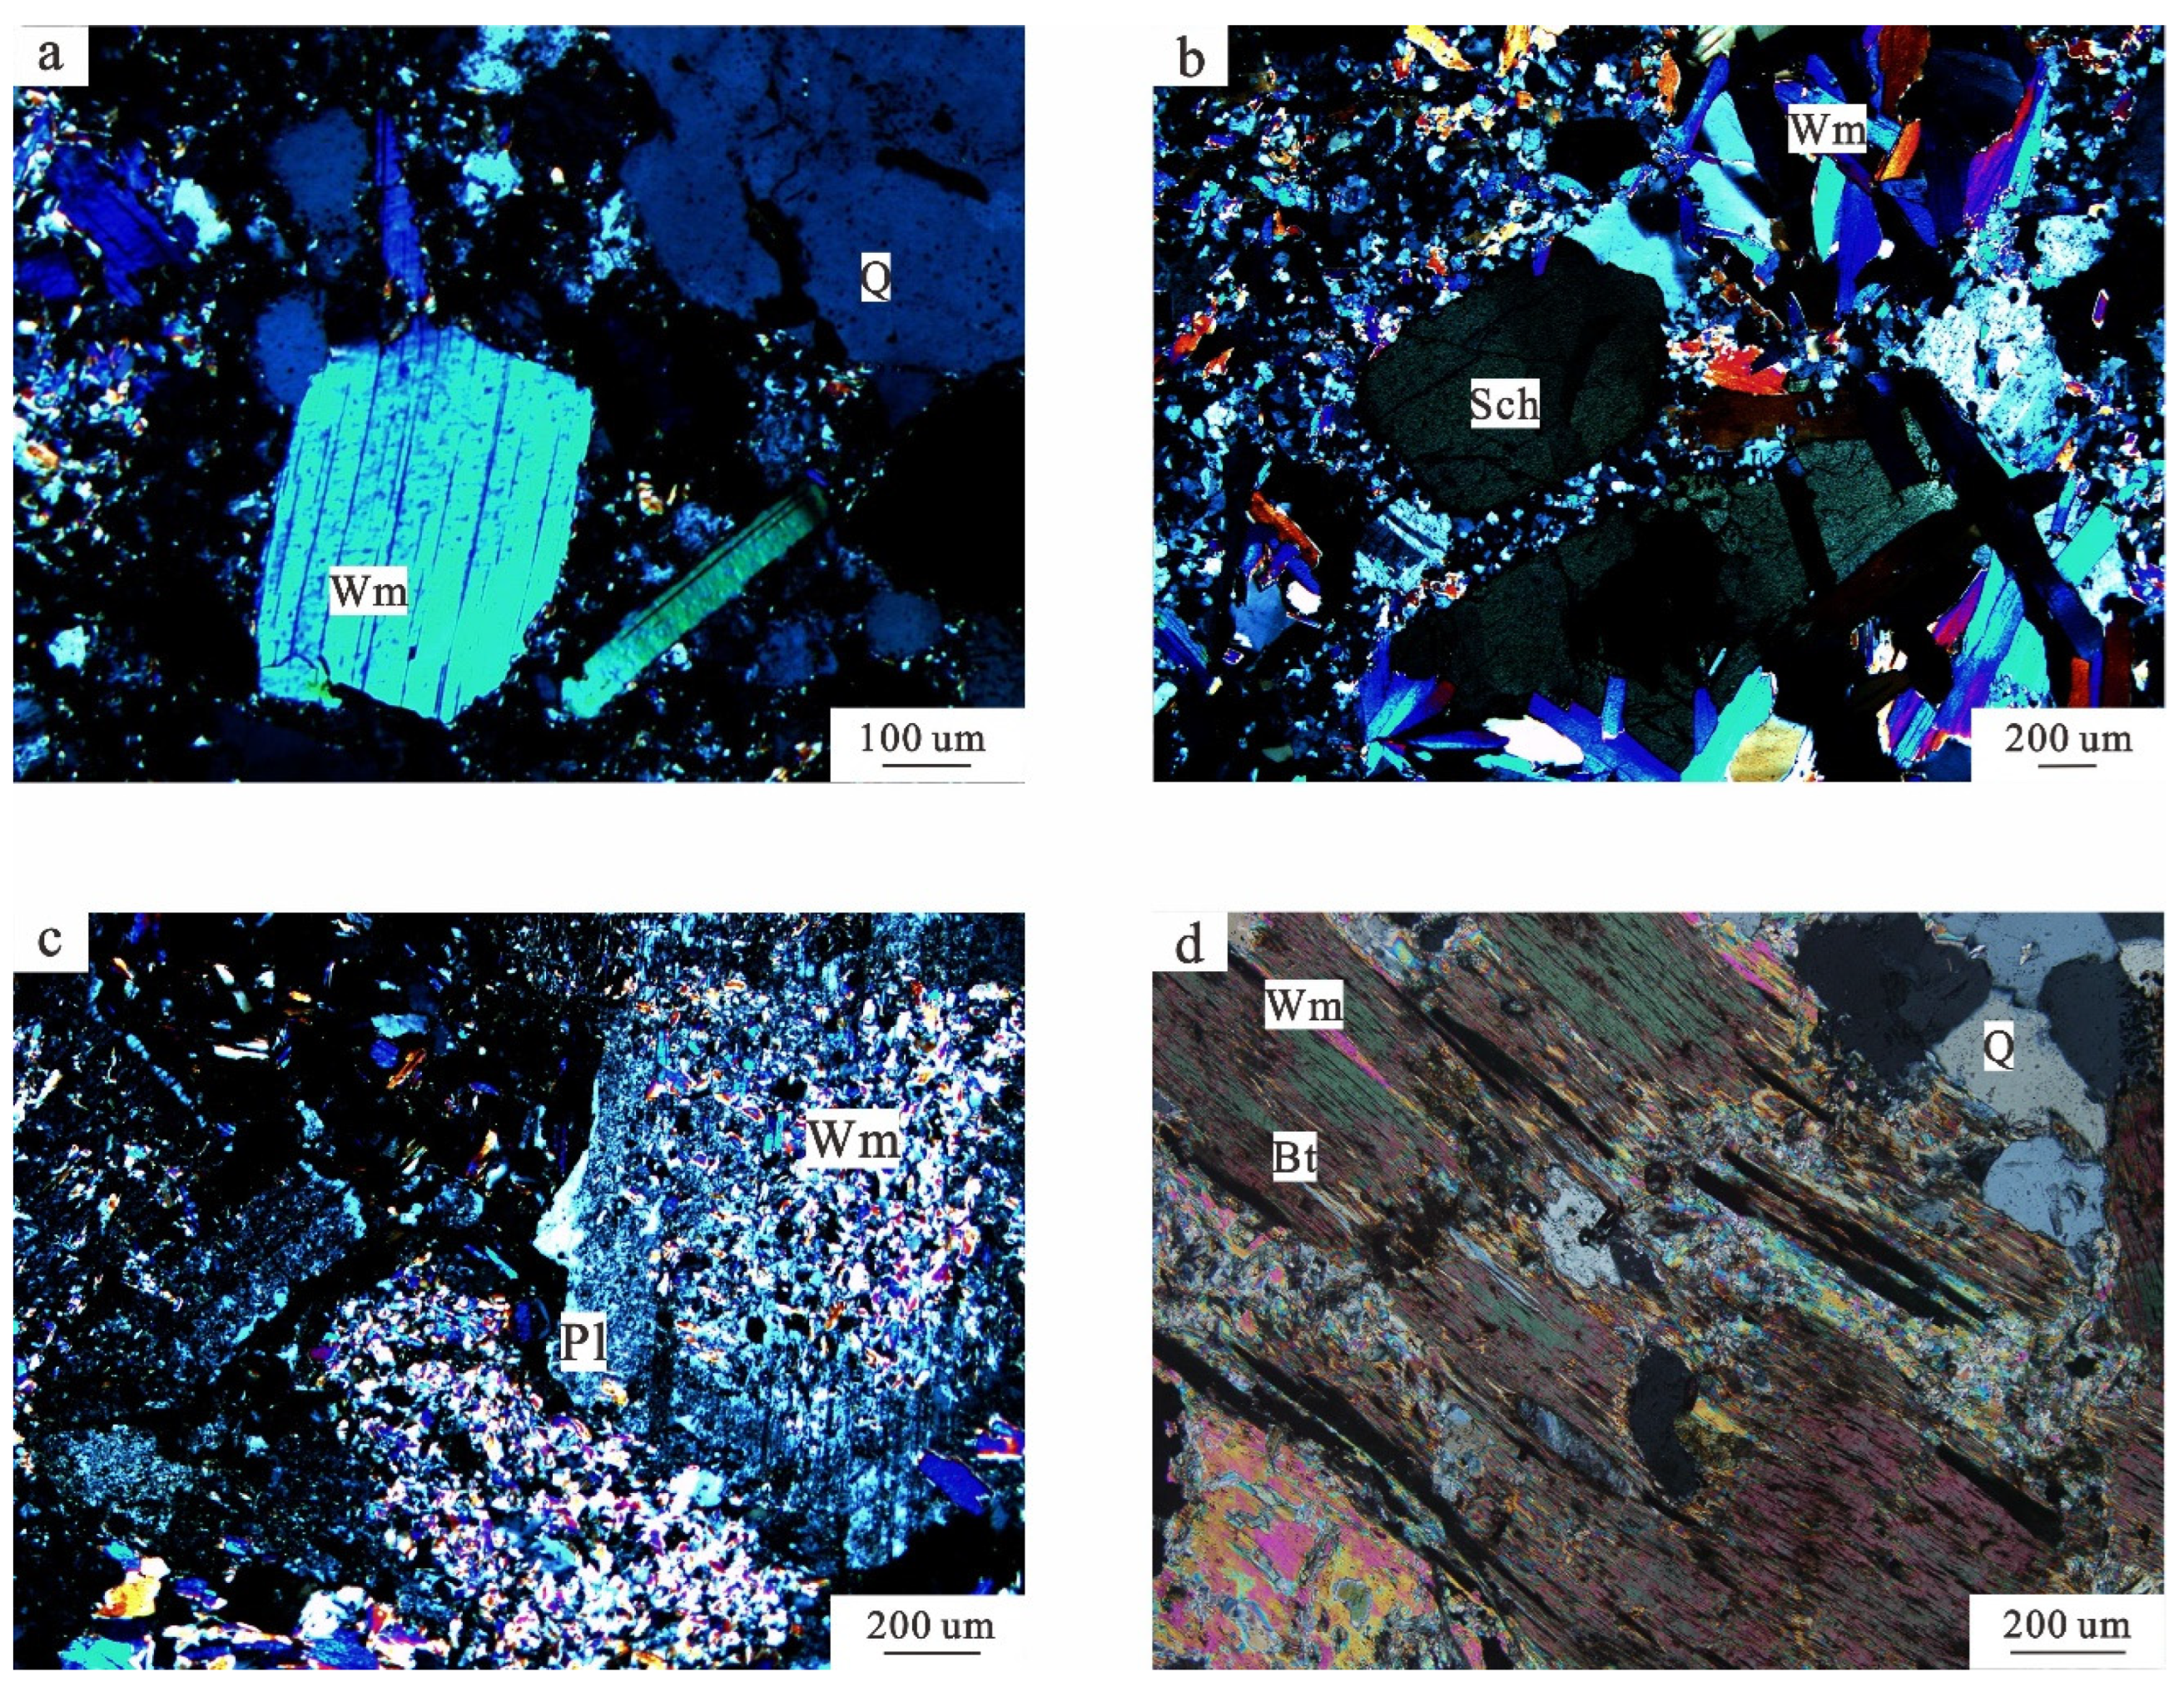
4.1. Mineral Characteristics
4.2. Spectral Characteristics
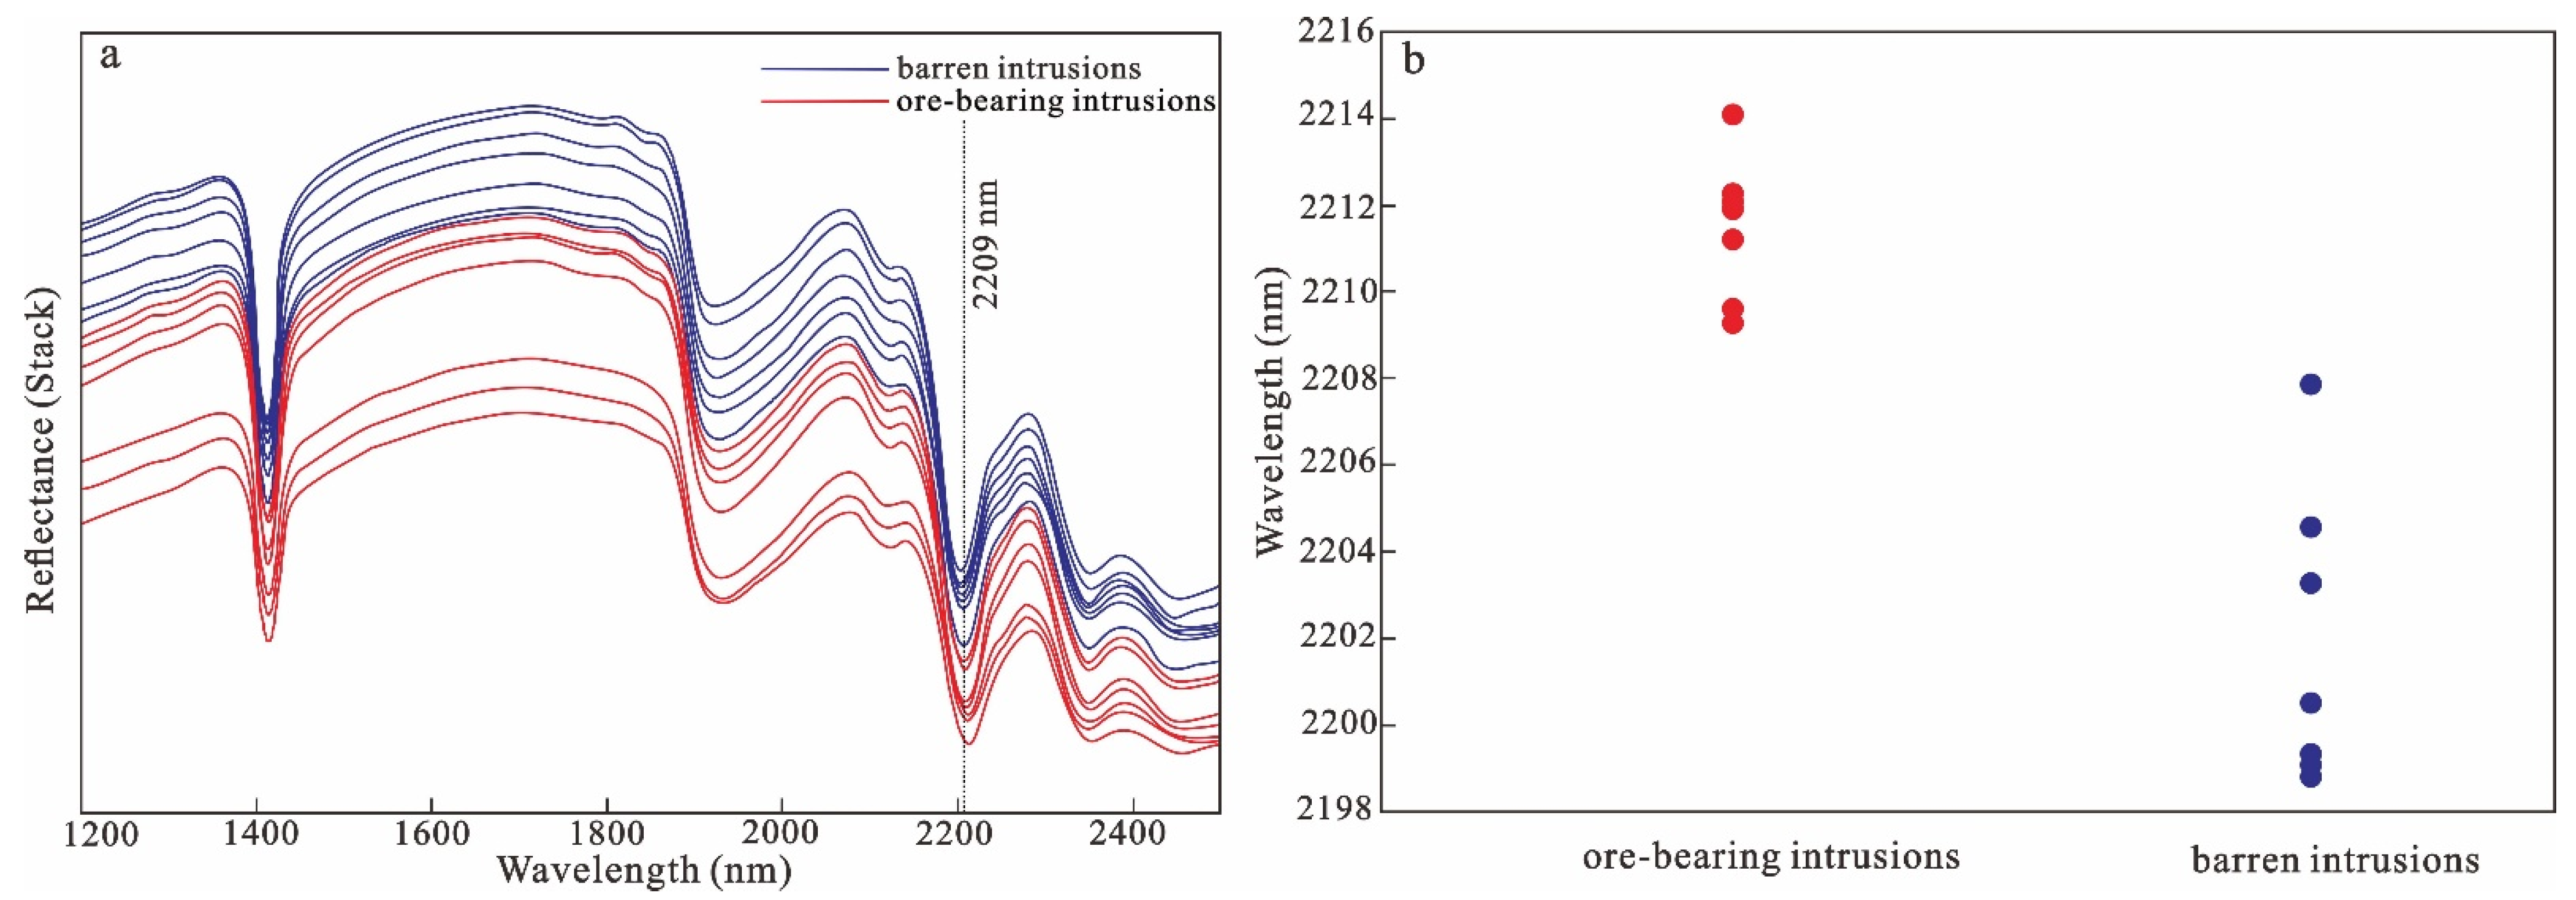
4.2.1. SWIR Spectra of White Mica
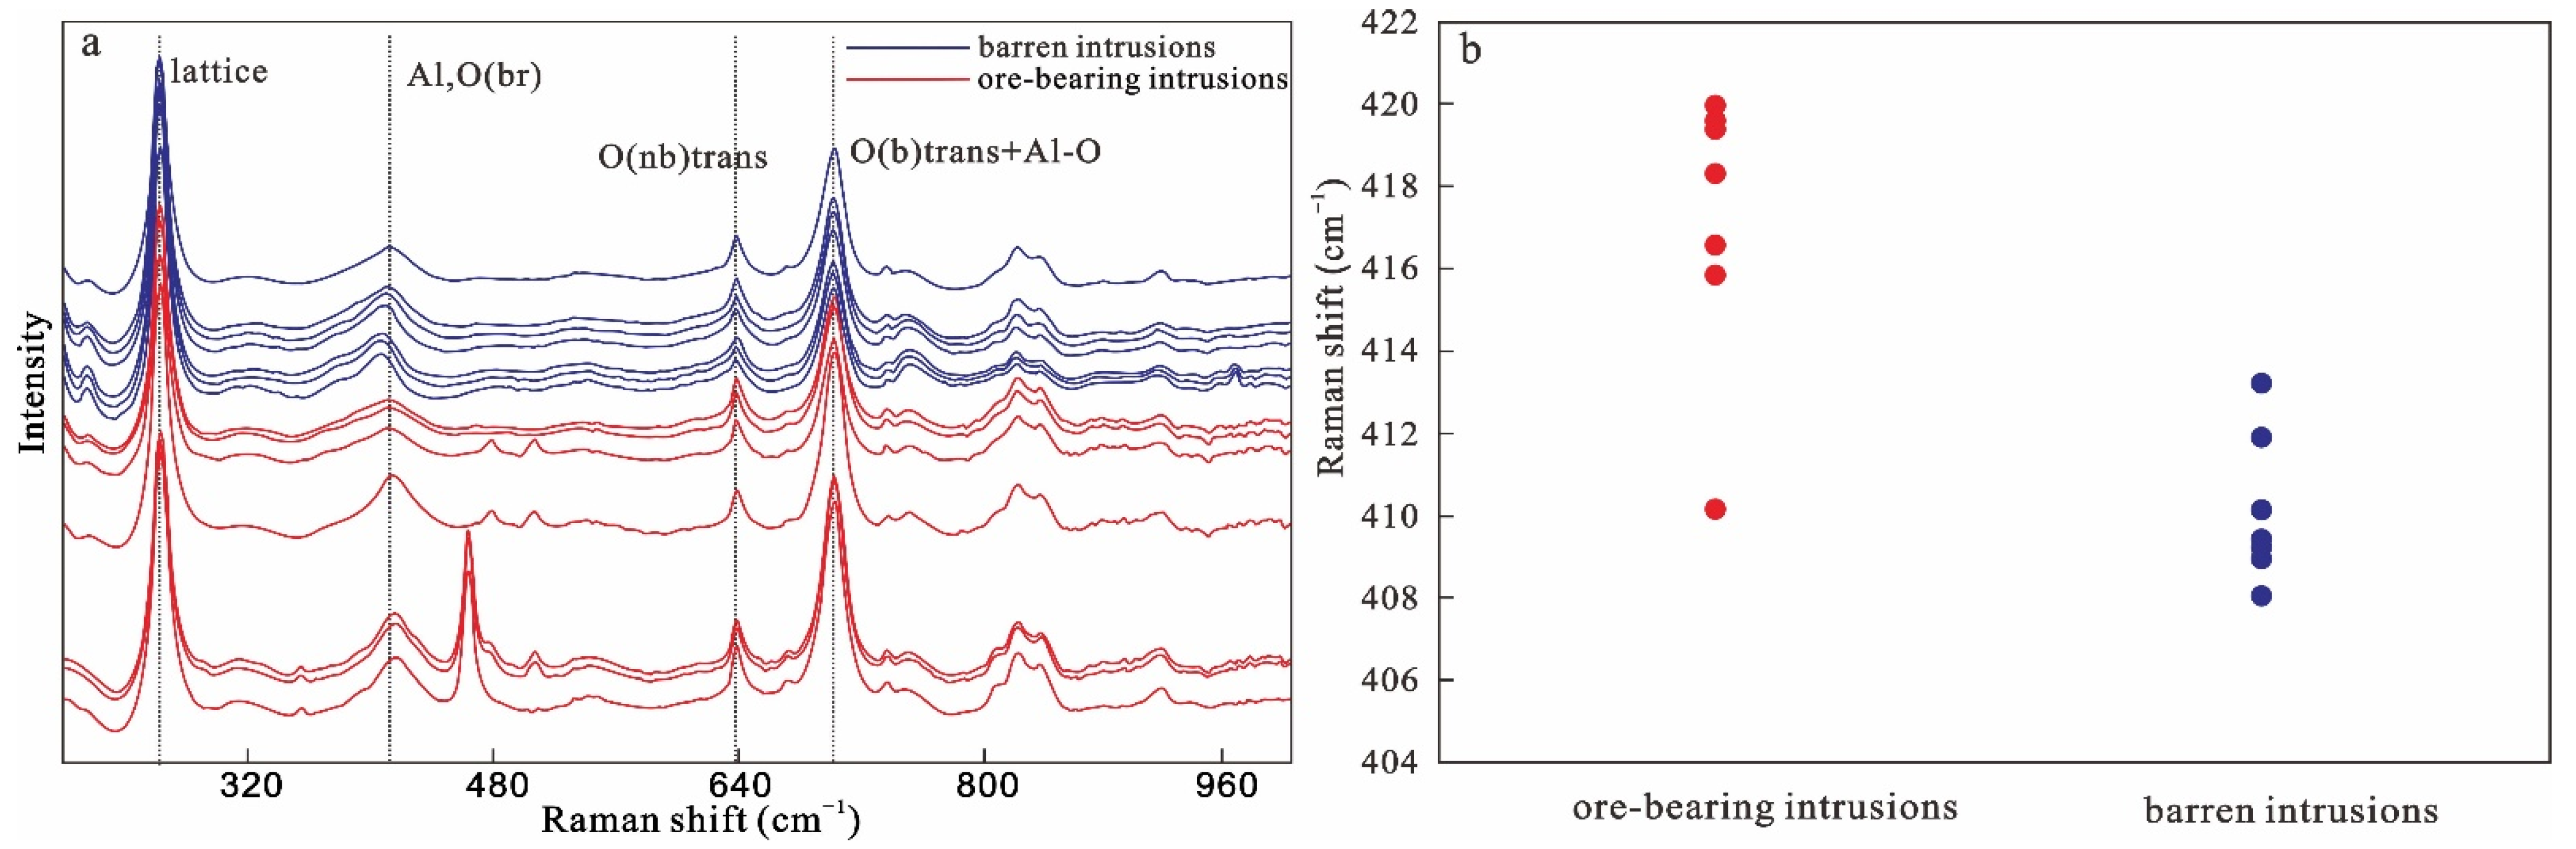
4.2.2. Raman Spectral Characteristics of White Mica
4.3. Geochemical Characteristics of White Mica
4.3.1. Major Elements
4.3.2. Trace Elements
5. Discussion
5.1. Relationship between SWIR Spectra, Micro-Raman Spectra, and the Chemistry Characteristic of White Mica
5.1.1. Relationship between Spectral Characteristics and the Chemistry of White Mica
5.1.2. Relationship between the SWIR Spectra and Micro-Raman Spectra of White Micas
5.2. Indicative Significance of the SWIR Characteristics of White Mica Shimensi Porphyry Tungsten Deposits
6. Conclusions
Author Contributions
Funding
Data Availability Statement
Acknowledgments
Conflicts of Interest
References
- Duke, E.F. Near infrared spectra of muscovite, Tschermak substitution, and metamorphic reaction progress: Implications for remote sensing. Geology 1994, 22, 621. [Google Scholar] [CrossRef]
- Zhao, Z.H.; Yan, S. Minerals and relevant metallogeny and exploration. Acta Petrol. Sin. 2019, 35, 31–68, (In Chinese with English abstract). [Google Scholar]
- Chukanov, N.V.; Shendrik, R.Y.; Vigasina, M.F.; Pekov, I.V.; Sapozhnikov, A.N.; Shcherbakov, V.D.; Varlamov, D.A. Crystal chemistry, isomorphism, and thermal conversions of extra-framework components in sodalite-group minerals. Minerals 2022, 12, 887. [Google Scholar] [CrossRef]
- Hamilton, V.E.; Christensen, P.R. Determining the modal mineralogy of mafic and ultramafic igneous rocks using thermal emission spectroscopy. J. Geophys. Res. 2000, 105, 9717–9733. [Google Scholar] [CrossRef]
- Carrino, T.A.; Crósta, A.P.; Toledo, C.L.B.; Silva, A.M. Unveiling the hydrothermal mineralogy of the Chapi Chiara gold prospect, Peru, through reflectance spectroscopy, geochemical and petrographic data. Ore Geol. Rev. 2015, 64, 299–315. [Google Scholar] [CrossRef]
- Lampinen, H.M.; Laukamp, C.; Occhipinti, S.A.; Hardy, L. Mineral footprints of the Paleoproterozoic sediment-hosted Abra Pb-Zn-Cu-Au deposit Capricorn Orogen, Western Australia. Ore Geol. Rev. 2019, 104, 436–461. [Google Scholar] [CrossRef]
- Laukamp, C.; LeGras, M.; Montenegro, V.; Windle, S.; McFarlane, A. Grandite-based resource characterization of the skarn-hosted Cu-Zn-Mo deposit of Antamina, Peru. Miner. Depos. 2021, 57, 107–128. [Google Scholar] [CrossRef]
- Ramakrishnan, D.; Bharti, R. Hyperspectral remote sensing and geological applications. Curr. Sci. 2015, 108, 879–891. [Google Scholar]
- Dai, J.J.; Zhao, L.X.; Jiang, Q.; Wang, H.Y.; Liu, T.Y. Review of thermal-infrared spectroscopy applied in geological ore exploration. Acta Geol. Sin. 2020, 94, 2520–2533, (In Chinese with English abstract). [Google Scholar]
- Wang, R.; Cudahy, T.; Laukamp, C.; Walshe, J.L.; Bath, A.; Mei, Y.; Young, C.; Roache, T.J.; Jenkins, A.; Roberts, M.; et al. White mica as a hyperspectral tool in exploration for the sunrise dam and Kanowna belle gold deposits, Western Australia. Econ. Geol. 2017, 112, 1153–1176. [Google Scholar] [CrossRef]
- Lypaczewski, P.; Rivard, B.; Gaillard, N.; Perrouty, S.; Piette-Lauzière, N.; Bérubé, C.L.; Linnen, R.L. Using hyperspectral imaging to vector towards mineralization at the Canadian Malartic gold deposit, Québec, Canada. Ore Geol. Rev. 2019, 111, 102945. [Google Scholar] [CrossRef]
- Xiao, B.; Chu, G.B.; Feng, Y.Z. Short-wave infrared (SWIR) spectral and geochemical characteristics of hydrothermal alteration minerals in the Laowangou Au deposit: Implications for ore genesis and vectoring. Ore Geol. Rev. 2021, 139, 104463. [Google Scholar] [CrossRef]
- Harraden, C.L.; McNulty, B.A.; Gregory, M.J.; Lang, J.R. Shortwave infrared spectral analysis of hydrothermal alteration associated with the Pebble porphyry copper-gold-molybdenum deposit, Iliamna, Alaska. Econ. Geol. 2013, 108, 483–494. [Google Scholar] [CrossRef]
- Zhou, Y.; Li, L.M.; Yang, K.; Xing, G.F.; Xiao, W.J.; Zhang, H.L.; Xiu, L.C.; Yao, Z.Y.; Xie, Z.J. Hydrothermal alteration characteristics of the Chating Cu-Au deposit in Xuancheng City, Anhui Province, China: Significance of sericite alteration for Cu-Au exploration. Ore Geol. Rev. 2020, 127, 103844. [Google Scholar] [CrossRef]
- Liu, J.; Li, W.C.; Zhou, Q.; Yang, F.C.; Jiang, X.J.; Zhang, S.Z.; Guo, X.R. Advances in the study of porphyry tungsten deposits. Geol. China 2021, 48, 732–748, (In Chinese with English abstract). [Google Scholar]
- Xiang, X.K.; Wang, P.; Zhan, G.N.; Sun, D.M.; Zhong, B.; Qian, Z.Y.; Tan, R. Geological characteristics of Shimensi tungsten polymetallic deposit in northern Jiangxi Province. Miner. Depos. 2013, 32, 1171–1187, (In Chinese with English abstract). [Google Scholar]
- Fan, X.K.; Zhang, Z.Y.; Hou, Z.Q.; Mavrogenes, J.; Pan, X.F.; Zhang, X.; Dai, J.L.; Wu, X.Y. Magmatic processes recorded in plagioclase and the geodynamic implications in the giant Shimensi W–Cu–Mo deposit, Dahutang ore field, South China. J. Asian Earth Sci. 2021, 212, 104734. [Google Scholar] [CrossRef]
- Gong, X.D. Ore-Forming Fluid Evolution and Ore Genesis of the Dahutang Tungsten Polymetallic Ore Field in Jiangxi Province, China; China University of Geosciences: Beijing, China, 2015; (In Chinese with English abstract). [Google Scholar]
- Zhang, Z.; Deng, Y.F.; Yao, J.M.; Zong, J.Y.; Chen, H.Y. An array based seismic image on the Dahutang deposit, South China: Insight into the mineralization. Phys. Earth Planet. Inter. 2021, 310, 106617. [Google Scholar] [CrossRef]
- Xu, G.F.; Li, Z.Y.; Yang, X.Y.; Liu, L. The role of Jiningian pluton in Yanshanian metallogenic events in the Dahutang tungsten deposit: Evidence from whole rock and zircon geochemistry. Minerals 2022, 12, 428. [Google Scholar] [CrossRef]
- Fan, X.K.; Hou, Z.Q.; Zhang, Z.Y.; Mavrogenes, J.; Pan, X.F.; Zhang, X.; Xiang, X.K. Metallogenic ages and sulfur sources of the giant Dahutang W–Cu–Mo ore field, South China: Constraints from muscovite 40Ar/39Ar dating and in situ sulfur isotope analyses. Ore Geol. Rev. 2021, 134, 104141. [Google Scholar] [CrossRef]
- Zhang, Z.Y.; Hou, Z.Q.; Peng, H.M.; Fan, X.K.; Wu, X.Y.; Dai, J.L. In situ oxygen isotope, trace element, and fluid inclusion evidence for a primary magmatic fluid origin for the shell-shaped pegmatoid zone within the giant Dahutang tungsten deposit, Jiangxi Province, South China. Ore Geol. Rev. 2019, 104, 540–560. [Google Scholar] [CrossRef]
- Li, X.Y.; Zhang, J.R.; Lai, C.K. Comparison of magma oxygen fugacity and zircon Hf isotopes between Xianglushan tungsten-bearing granite and late Yanshanian granites in Jiangxi Province, South China. Minerals 2020, 10, 106. [Google Scholar] [CrossRef]
- Wei, W.F.; Yan, B.; Shen, N.P.; Liu, L.; Zhang, Y.; Xiang, X.K. Muscovite 40Ar/39Ar age and H-O-S isotopes of the Shimensi tungsten deposit (northern Jiangxi Province, South China) and their metallogenic implications. Minerals 2017, 7, 162. [Google Scholar] [CrossRef]
- Fan, X.K.; Mavrogenes, J.; Hou, Z.Q.; Zhang, Z.Y.; Wu, X.Y.; Dai, J.L. Petrogenesis and metallogenic significance of multistage granites in Shimensi tungsten polymetallic deposit, Dahutang giant ore field, South China. Lithos 2019, 336–337, 326–344. [Google Scholar] [CrossRef]
- Peng, H.M.; Yuan, Q.; Li, Q.Y.; Liu, F.J.; Zhang, B.X.; Dan, X.H.; Zhang, Z.S.; Dong, X.F. Ore-controlling role of porphyraceous biotite granite in Shimensi tungsten deposit and its prospecting significance. Sci. Technol. Eng. 2016, 16, 135–142, (In Chinese with English abstract). [Google Scholar]
- Mao, J.W.; Wu, S.H.; Song, S.W.; Dai, P.; Xie, G.Q.; Su, Q.W.; Liu, P.; Wang, X.G.; Yu, Z.Z.; Chen, X.Y.; et al. The world-class Jiangnan tungsten belt: Geological characteristics, metallogeny, and ore deposit model. Chin. Sci. Bull. 2020, 65, 3746–3762, (In Chinese with English abstract). [Google Scholar] [CrossRef]
- Reed, W.P. Certificate of Analysis: Standard Reference Materials 610 and 611; National Institute of Standards and Technology: Gaithersburg, MD, USA, 1992. [Google Scholar]
- Liu, Y.S.; Hu, Z.C.; Gao, S.; Gunther, D.; Xu, J.; Gao, C.G.; Chen, H.H. In situ analysis of major and trace elements of anhydrous minerals by LA-ICP-MS without applying an internal standard. Chem. Geol. 2008, 257, 34–43. [Google Scholar] [CrossRef]
- Mckeown, D.A.; Bell, M.I.; Edgar, S.E. Vibrational analysis of the dioctahedral mica: 2M1muscovite. Am. Mineral. 1999, 84, 1041–1048. [Google Scholar] [CrossRef]
- Wang, A.; Freeman, J.J.; Jolliff, B.L. Understanding the Raman spectral features of phyllosilicates. J. Raman Spectrosc. 2015, 46, 829–845. [Google Scholar] [CrossRef]
- Sulák, M.; Kaindl, R.; Putiš, M.; Sitek, J.; Krenn, K.; Tóth, I. Chemical and spectroscopic characteristics of potassium white micas related to polystage evolution of the Central Western Carpathians orogenic wedge. Lithos 2009, 113, 709–730. [Google Scholar] [CrossRef]
- Zhou, Q.; Qin, K.; Tang, D.; Wang, C. A combined EMPA and LA-ICP-MS study of muscovite from pegmatites in the Chinese Altai, NW China: Implications for tracing rare-element mineralization type and ore-forming process. Minerals 2022, 12, 377. [Google Scholar] [CrossRef]
- Volker, M.; Anthony, E.W. A hyperspectral study (V-NIR-SWIR) of the Nechalacho REE-Nb-Zr deposit, Canada. J. Geochem. Explor. 2018, 188, 194–215. [Google Scholar]
- Carlos, A.; Graham, D.L. Raman spectroscopy coupled with reflectance spectroscopy as a tool for the characterization of key hydrothermal alteration minerals in epithermal Au–Ag systems: Utility and implications for mineral exploration. Appl. Spectrosc. 2021, 75, 1475–1496. [Google Scholar]
- Herrmann, W.; Blake, M.; Doyle, M.; Huston, D.; Kamprad, J.; Merry, N.; Pontual, S. Short wavelength infrared (SWIR) spectral analysis of hydrothermal alteration zones associated with base metal sulfide deposits at rosebery and western Tharsis, Tasmania, and Highway-Reward, Queensland. Econ. Geol. 2001, 96, 939–955. [Google Scholar] [CrossRef]
- Massonne, H.J.; Schreyer, W. Stability field of the high-pressure assemblage talc+ phengite and two new phengite barometers. Eur. J. Mineral. 1989, 1, 391–410. [Google Scholar] [CrossRef]
- Massonne, H.J.; Szpurka, Z. Thermodynamic properties of white micas on the basis of high-pressure experiments in the systems K2O-MgO-Al2O3-SiO2-H2O and K2O-FeO-Al2O3-SiO2-H2O. Lithos 1997, 41, 229–250. [Google Scholar] [CrossRef]
- Halley, S.; Dilles, J.H.; Tosdal, R.M. Footprints: Hydrothermal alteration and geochemical dispersion around porphyry copper deposits. SEG Discov. 2015, 100, 1–17. [Google Scholar] [CrossRef]
- Laakso, K.; Peter, J.M.; Rivard, B.; White, H.P. Short-wave infrared spectral and geochemical characteristics of hydrothermal alteration at the Archean Izok Lake Zn-Cu-Pb-Ag volcanogenic massive sulfide deposit, Nunavut, Canada: Application in exploration target vectoring. Econ. Geol. 2016, 111, 1223–1239. [Google Scholar] [CrossRef]
- Samani, P.; Prizomwala, S.P.; Rajawat, A.S. Assessing the mineral alteration in Ambaji–Deri region (northwestern India) using hyperspectral remote sensing. J. Indian Soc. Remote Sens. 2021, 49, 249–257. [Google Scholar] [CrossRef]
- Xue, Q.W.; Wang, R.; Liu, S.Y.; Shi, W.X.; Tong, X.S.; Li, Y.Y.; Sun, F. Significance of chlorite hyperspectral and geochemical characteristics in exploration: A case study of the giant Qulong porphyry Cu-Mo deposit in collisional orogen, Southern Tibet. Ore Geol. Rev. 2021, 134, 104156. [Google Scholar] [CrossRef]
- Squire, R.J.; Herrmann, W.; Pape, D.; Chalmers, D.I. Evolution of the Peak Hill high-sulfidation epithermal Au–Cu deposit, Eastern Australia. Miner. Depos. 2007, 42, 489–503. [Google Scholar] [CrossRef]
- Kruse, F.A.; Bedell, R.L.; Taranik, J.V.; Peppin, W.A.; Weatherbee, O.; Calvin, W.M. Mapping alteration minerals at prospect, outcrop and drill core scales using imaging spectrometry. Int. J. Remote Sens. 2012, 33, 1780–1798. [Google Scholar] [CrossRef] [PubMed]
- Mars, J.C. Mineral and lithologic mapping capability of WorldView 3 data at mountain Pass, California, Using true- and false-color composite images, band ratios, and logical operator algorithms. Econ. Geol. 2018, 113, 1587–1601. [Google Scholar] [CrossRef]
- Tian, J.; Zhang, Y.; Cheng, J.M.; Sun, S.Q.; Zhao, Y.J. Short wavelength infra-red (SWIR) characteristics of hydrothermal alteration minerals in skarn deposits: Example from the Jiguanzui Cu–Au deposit, Eastern China. Ore Geol. Rev. 2019, 106, 134–149. [Google Scholar] [CrossRef]
- Tappert, M.C.; Rivard, B.; Giles, D.; Tappert, R.; Mauger, A. The mineral chemistry, near-infrared, and mid-infrared reflectance spectroscopy of phengite from the Olympic Dam IOCG deposit, South Australia. Ore Geol. Rev. 2013, 53, 26–38. [Google Scholar] [CrossRef]
- Li, H.W.; Zhao, Z.; Chen, Z.Y.; Guo, N.X.; Gan, J.W.; Li, X.W.; Yin, Z. Genetic relationship between the two-period magmatism and W mineralization in the Dahutang ore-field, Jiangxi Province: Evidence from zircon geochemistry. Acta Petrol. Sin. 2021, 5, 1508–1530, (In Chinese with English abstract). [Google Scholar]


| Sample | Barren Intrusions | Ore-Bearing Intrusions | ||||||||||||
|---|---|---|---|---|---|---|---|---|---|---|---|---|---|---|
| S1 | S2 | S3 | S4 | S5 | S6 | S7 | S8 | S9 | S10 | S11 | S12 | S13 | S14 | |
| w(B)/% | ||||||||||||||
| SiO2 | 46.31 | 46.31 | 45.96 | 46.70 | 46.37 | 46.57 | 46.77 | 47.51 | 47.90 | 48.66 | 48.36 | 48.14 | 48.26 | 48.64 |
| TiO2 | 0.47 | - | 0.07 | 0.52 | 0.31 | 0.03 | 0.37 | 0.58 | 0.60 | 0.47 | 0.19 | 0.30 | 0.50 | 0.42 |
| Al2O3 | 36.27 | 36.25 | 36.24 | 35.53 | 35.60 | 37.49 | 34.82 | 31.49 | 30.93 | 3.00 | 32.17 | 32.48 | 30.58 | 32.79 |
| FeO | 1.17 | 0.71 | 1.37 | 1.48 | 2.00 | 1.19 | 1.47 | 2.90 | 2.63 | 2.88 | 2.60 | 3.01 | 2.51 | 2.22 |
| MnO | 0.02 | - | 0.07 | 0.09 | 0.07 | 0.05 | - | 0.04 | 0.05 | 0.08 | 0.13 | 0.09 | 0.07 | 0.09 |
| MgO | 0.54 | 0.47 | 0.42 | 0.54 | 0.60 | 0.13 | 0.85 | 1.84 | 1.85 | 2.72 | 1.61 | 1.41 | 2.39 | 1.16 |
| CaO | - | - | - | - | - | - | - | 0.01 | - | 0.03 | 0.01 | - | 0.01 | - |
| Na2O | 0.39 | 0.45 | 0.41 | 0.30 | 0.34 | 0.30 | 0.31 | 0.23 | 0.21 | 0.17 | 0.21 | 0.23 | 0.20 | 0.19 |
| K2O | 8.93 | 8.89 | 9.23 | 7.86 | 7.16 | 7.86 | 9.30 | 7.41 | 8.44 | 6.72 | 6.10 | 6.16 | 6.47 | 7.16 |
| P2O5 | 0.03 | 0.05 | - | 0.02 | 0.01 | 0.02 | 0.01 | - | - | - | 0.01 | - | - | - |
| CoO | 1.09 | 0.89 | 0.81 | 1.33 | 1.26 | 1.18 | 0.93 | 1.22 | 0.62 | 0.89 | 1.14 | 0.49 | 0.66 | 1.00 |
| Cl | 0.01 | 0.01 | 0.01 | - | - | - | - | - | - | 0.01 | - | 0.02 | 0.02 | 0.01 |
| F | 0.02 | 0.21 | 0.19 | 1.17 | 1.34 | 0.80 | 0.50 | 0.80 | 0.87 | 0.87 | 1.02 | 0.83 | 1.19 | 0.62 |
| Total | 95.25 | 94.24 | 94.78 | 95.54 | 95.06 | 95.62 | 95.33 | 94.03 | 94.10 | 93.50 | 93.55 | 93.16 | 92.86 | 94.30 |
| Number of ions on the basis of 11O | ||||||||||||||
| Si | 3.07 | 3.09 | 3.06 | 3.11 | 3.10 | 3.08 | 3.13 | 3.22 | 3.23 | 3.29 | 3.26 | 3.24 | 3.29 | 3.26 |
| Ti | 0.02 | 0.03 | 0.02 | 0.02 | 0.03 | 0.03 | 0.02 | 0.01 | 0.01 | 0.03 | 0.02 | |||
| Al | 2.83 | 2.85 | 2.85 | 2.80 | 2.80 | 2.92 | 2.75 | 2.52 | 2.46 | 2.39 | 2.56 | 2.58 | 2.46 | 2.59 |
| Fe | 0.06 | 0.04 | 0.08 | 0.08 | 0.11 | 0.07 | 0.08 | 0.16 | 0.15 | 0.16 | 0.15 | 0.17 | 0.14 | 0.12 |
| Mn | 0.01 | |||||||||||||
| Mg | 0.05 | 0.05 | 0.04 | 0.05 | 0.06 | 0.01 | 0.09 | 0.19 | 0.19 | 0.27 | 0.16 | 0.14 | 0.24 | 0.12 |
| Ca | ||||||||||||||
| Na | 0.05 | 0.06 | 0.05 | 0.04 | 0.04 | 0.04 | 0.04 | 0.03 | 0.03 | 0.02 | 0.03 | 0.03 | 0.03 | 0.02 |
| K | 0.75 | 0.76 | 0.78 | 0.67 | 0.61 | 0.66 | 0.79 | 0.64 | 0.73 | 0.58 | 0.52 | 0.53 | 0.56 | 0.61 |
| P | ||||||||||||||
| AlIV | 0.93 | 0.91 | 0.94 | 0.89 | 0.90 | 0.92 | 0.87 | 0.78 | 0.77 | 0.71 | 0.74 | 0.76 | 0.71 | 0.74 |
| AlVI | 1.90 | 1.94 | 1.91 | 1.91 | 1.90 | 2.00 | 1.88 | 1.74 | 1.69 | 1.68 | 1.82 | 1.82 | 1.75 | 1.84 |
| Sample | Barren Intrusions | Ore-Bearing Intrusions | ||||||||||||
|---|---|---|---|---|---|---|---|---|---|---|---|---|---|---|
| S1 | S2 | S3 | S4 | S5 | S6 | S7 | S8 | S9 | S10 | S11 | S12 | S13 | S14 | |
| La | - | 0.01 | - | - | - | 0.01 | - | - | - | - | 0.04 | - | - | 0.01 |
| Ce | - | - | - | 0.07 | 0.02 | - | 0.02 | 0.01 | 0.01 | - | 0.11 | 0.01 | - | 0.01 |
| Pr | - | - | - | - | - | - | - | - | - | - | 0.03 | - | - | 0.01 |
| Nd | - | - | - | - | - | 0.04 | - | - | - | - | 0.13 | - | - | - |
| Sm | - | - | - | - | - | - | - | - | - | - | - | 0.05 | - | 0.04 |
| Eu | 0.08 | 0.15 | 0.14 | 0.01 | 0.04 | 0.09 | 0.07 | 0.03 | 0.10 | 0.03 | 0.15 | 0.17 | 0.05 | 0.02 |
| Gd | 0.28 | 0.11 | 0.81 | 0.24 | 0.74 | 0.80 | 0.20 | 0.41 | 0.27 | 0.18 | 0.55 | 0.71 | 0.15 | 0.29 |
| Tb | - | - | - | - | - | - | - | - | - | - | - | - | - | - |
| Dy | - | - | - | 0.02 | - | - | - | - | - | - | 0.03 | - | - | 0.02 |
| Ho | 0.01 | - | - | - | - | - | 0.01 | - | - | - | 0.01 | - | - | - |
| Er | - | - | - | - | - | - | - | - | - | - | - | 0.03 | - | 0.02 |
| Tm | - | - | - | - | 0.01 | - | - | 0.01 | - | - | - | - | 0.00 | - |
| Yb | - | 0.03 | - | - | 0.02 | 0.05 | 0.02 | 0.02 | - | 0.03 | 0.05 | 0.04 | - | 0.02 |
| Lu | 0.01 | - | - | 0.01 | - | 0.02 | 0.01 | 0.03 | - | 0.01 | - | 0.01 | - | 0.03 |
| LREE | 0.08 | 0.17 | 0.14 | 0.08 | 0.06 | 0.14 | 0.09 | 0.04 | 0.11 | 0.03 | 0.46 | 0.22 | 0.05 | 0.09 |
| HREE | 0.29 | 0.14 | 0.81 | 0.27 | 0.77 | 0.86 | 0.24 | 0.47 | 0.27 | 0.21 | 0.63 | 0.80 | 0.16 | 0.37 |
| LREE/HREE | 0.27 | 1.22 | 0.17 | 0.29 | 0.08 | 0.16 | 0.37 | 0.09 | 0.42 | 0.13 | 0.73 | 0.28 | 0.34 | 0.23 |
| Rb | 214.44 | 196.75 | 234.16 | 1872.24 | 394.21 | 842.40 | 794.57 | 227.17 | 1300.56 | 1184.39 | 1412.60 | 1963.55 | 1702.36 | 284.04 |
| Ba | 1685.14 | 249.50 | 1364.43 | 546.13 | 1270.41 | 988.89 | 937.85 | 404.46 | 388.34 | 609.46 | 995.85 | 320.61 | 507.22 | 397.96 |
| Sr | 7.36 | 4.11 | 6.76 | 9.21 | 6.64 | 6.89 | 8.57 | 5.85 | 8.76 | 5.59 | 18.49 | 16.34 | 5.51 | 4.71 |
| Hf | 0.04 | 0.04 | 0.08 | 0.05 | 0.12 | 0.11 | 0.08 | 0.02 | 0.02 | 0.05 | 0.07 | 0.02 | 0.02 | 0.02 |
| Ta | 1.33 | 0.10 | 0.35 | 0.36 | 0.37 | 0.56 | 0.56 | 0.19 | 0.28 | 0.31 | 0.27 | 0.35 | 0.21 | 0.07 |
| W | 58.57 | 4.14 | 3.81 | 52.72 | 13.01 | 41.00 | 30.94 | 0.95 | 24.31 | 13.11 | 38.28 | 33.59 | 18.01 | 3.99 |
| Tl | 0.60 | 0.53 | 0.60 | 8.20 | 1.28 | 3.67 | 2.74 | 0.57 | 5.56 | 4.96 | 6.44 | 9.43 | 8.16 | 0.62 |
| Cs | 11.93 | 4.71 | 7.26 | 777.48 | 141.20 | 515.85 | 317.06 | 5.64 | 691.72 | 713.52 | 260.08 | 673.59 | 458.40 | 12.58 |
| Nb | 18.61 | 2.36 | 4.45 | 4.69 | 7.15 | 8.03 | 8.36 | 0.33 | 2.59 | 2.35 | 2.05 | 4.87 | 2.52 | 0.37 |
| V | 410.14 | 16.50 | 210.55 | 56.93 | 206.00 | 157.04 | 171.24 | 6.91 | 40.18 | 54.47 | 92.41 | 169.23 | 200.57 | 8.65 |
| Li | 165.38 | 188.24 | 197.73 | 1532.19 | 359.07 | 1189.04 | 631.15 | 260.58 | 204.12 | 389.80 | 1662.50 | 1626.17 | 1887.22 | 205.29 |
| Cr | 413.47 | - | - | - | 28.72 | 19.39 | 23.02 | 3.22 | 103.72 | 4.03 | - | 514.85 | 440.38 | 101.90 |
| Sc | 111.59 | 5.67 | 19.87 | 10.14 | 54.88 | 20.07 | 31.87 | 8.07 | 5.98 | 7.60 | 12.61 | 47.22 | 46.77 | 9.63 |
| Co | 1.41 | 1.79 | 2.63 | 8.27 | 2.58 | 2.46 | 2.07 | - | 0.34 | 0.32 | 1.69 | 2.90 | 1.44 | 1.01 |
| Ni | 2.55 | 3.57 | 4.97 | 11.92 | 8.84 | 7.79 | 4.92 | 0.80 | 0.61 | 0.59 | 1.56 | 6.23 | 1.60 | 1.87 |
| Cu | 0.78 | 0.76 | 0.61 | 0.44 | - | 0.25 | 0.63 | 0.57 | 0.84 | 1.50 | 0.41 | 0.48 | 0.48 | 3.13 |
| Zn | 11.85 | 12.81 | 15.34 | 116.73 | 26.52 | 94.43 | 48.77 | 18.58 | 43.03 | 39.78 | 70.50 | 114.59 | 98.60 | 21.37 |
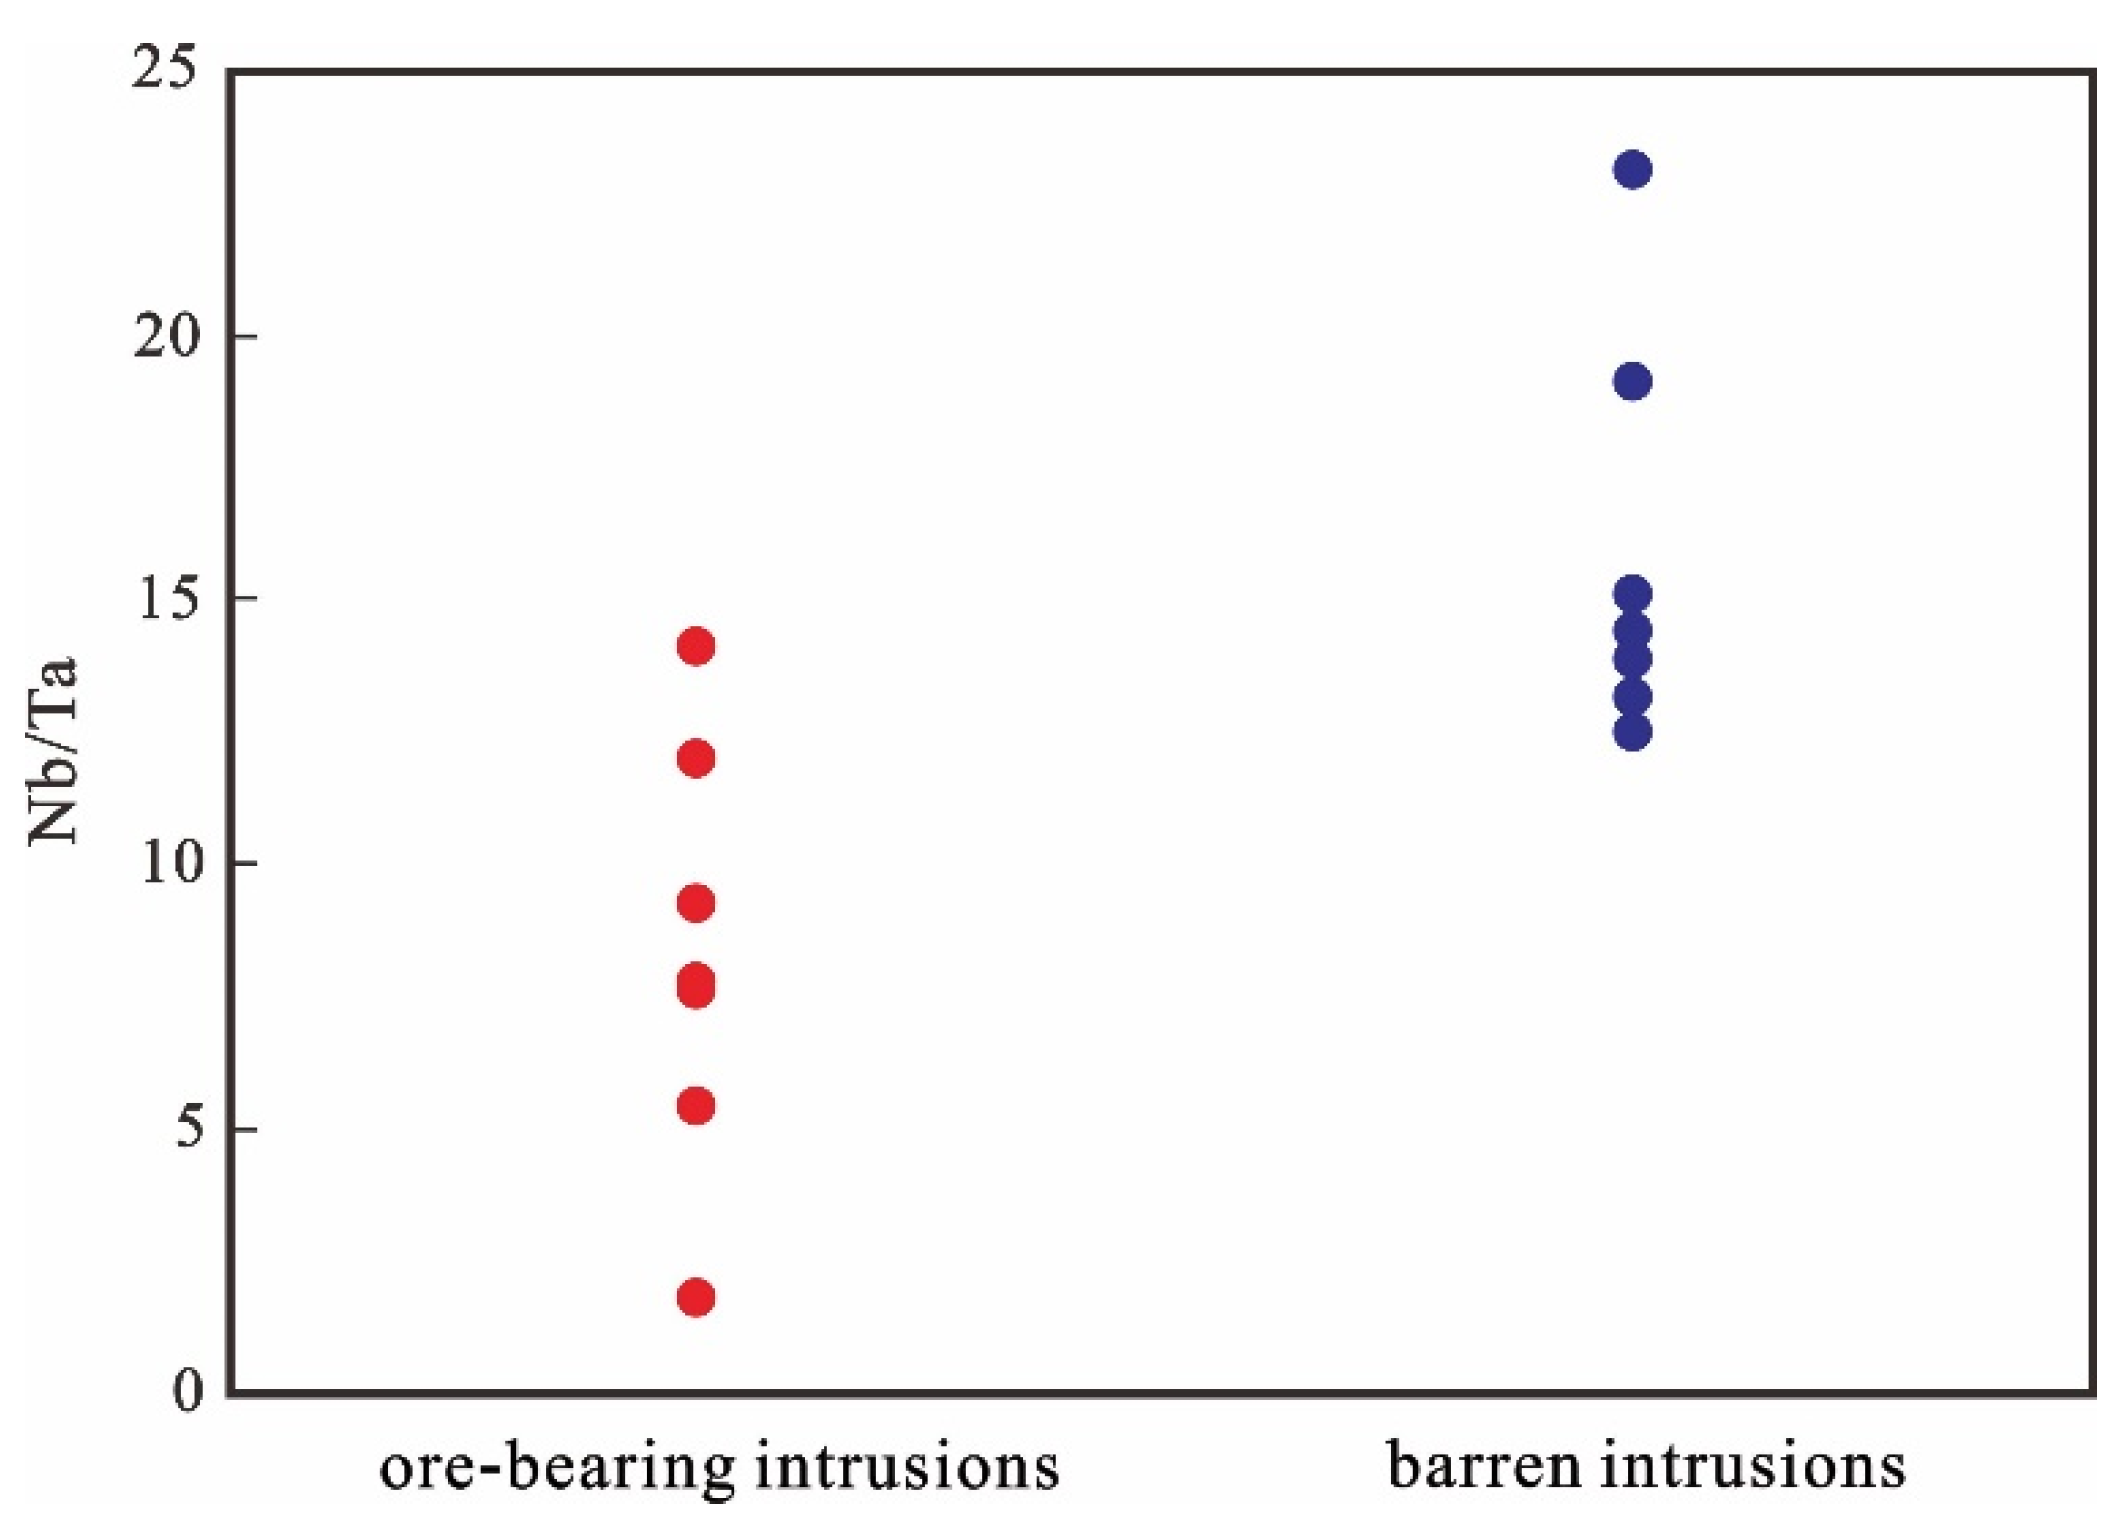
| Nb/Ta | 14.00 | 23.08 | 12.78 | 13.00 | 19.17 | 14.48 | 15.03 | 1.72 | 9.16 | 7.72 | 7.69 | 14.06 | 11.90 | 5.40 |
Disclaimer/Publisher’s Note: The statements, opinions and data contained in all publications are solely those of the individual author(s) and contributor(s) and not of MDPI and/or the editor(s). MDPI and/or the editor(s) disclaim responsibility for any injury to people or property resulting from any ideas, methods, instructions or products referred to in the content. |
© 2023 by the authors. Licensee MDPI, Basel, Switzerland. This article is an open access article distributed under the terms and conditions of the Creative Commons Attribution (CC BY) license (https://creativecommons.org/licenses/by/4.0/).
Share and Cite
Zhang, Z.; Dai, J.; Wang, X.; Hu, Z.; Wan, X.; Peng, B.; Fu, M. Application of Spectroscopic Characteristics of White Mica in Porphyry Tungsten Deposits: A Case Study Involving the Shimensi Deposit in Northern Jiangxi. Minerals 2023, 13, 256. https://doi.org/10.3390/min13020256
Zhang Z, Dai J, Wang X, Hu Z, Wan X, Peng B, Fu M. Application of Spectroscopic Characteristics of White Mica in Porphyry Tungsten Deposits: A Case Study Involving the Shimensi Deposit in Northern Jiangxi. Minerals. 2023; 13(2):256. https://doi.org/10.3390/min13020256
Chicago/Turabian StyleZhang, Zhongxue, Jingjing Dai, Xianguang Wang, Zhenghua Hu, Xin Wan, Bo Peng, and Minghai Fu. 2023. "Application of Spectroscopic Characteristics of White Mica in Porphyry Tungsten Deposits: A Case Study Involving the Shimensi Deposit in Northern Jiangxi" Minerals 13, no. 2: 256. https://doi.org/10.3390/min13020256