Article

Crustal Structures of the Qimantagh Metallogenic Belt in the Northern Tibetan Plateau from Magnetotelluric Data and Their Correlation to the Distribution of Mineral Deposits

1
Key Laboratory of Mineral Resources, Institute of Geology and Geophysics, Chinese Academy of Sciences, Beijing 100029, China
2
CAS Engineering Laboratory for Deep Resources Equipment and Technology, Institute of Geology and Geophysics, Chinese Academy of Sciences, Beijing 100029, China
3
Key Laboratory of Metallogenic Prediction of Nonferrous Metals and Geological Environment Monitoring, Ministry of Education, School of Geosciences and Info-Physics, Central South University, Changsha 410083, China
4
Xi’an Geophysical and Geochemical Exploration Corporation, Bureau of Geological Exploration for Nonferrous Metals in Northwest China, Xi’an 710068, China
*
Author to whom correspondence should be addressed.
Minerals 2023, 13(2), 225; https://doi.org/10.3390/min13020225
Submission received: 13 December 2022 / Revised: 30 January 2023 / Accepted: 31 January 2023 / Published: 4 February 2023
(This article belongs to the Special Issue Feature Papers in Mineral Exploration Methods and Applications 2022)

Abstract

:
Crustal structure and fluid or melt originating in the deep crust and mantle are critical in regional magmatic mineral systems. However, the crustal structure and the processes that entrain and focus fluids from a deep-source region to a metallogenic belt remain relatively undisclosed. We present a magnetotelluric (MT) study of the eastern Qimantagh Metallogenic Belt (QMB) in the northern Tibetan Plateau. Data from 33 MT stations in two sections and 7 dispersed stations are acquired using a surface electromagnetic prospecting (SEP) system in frequency band ranges from 320 Hz to 0.00034 Hz. Data are converted by Bostick conversion and two-dimensional (2D) nonlinear conjugate gradient inversion. Our MT results reveal the geoelectrical crustal structure of the QMB, which consists of a southern low-resistivity domain that reflects the Kumukuri rift, a high-resistivity middle domain that represents the southern QMB in the central Kunlun belt, and a northern low-resistivity domain that covers the northern QMB and southwestern Qaidam block. We present a comprehensive tectonic and geophysical model of QMB based on the MT interpretation and geological analysis. We infer the high-resistivity domain as a reflection of a rigid crust and detached lithospheric mantle, this belt separate the QMB into northern and southern QMB. Most of the mineral deposits are found in the northern low-resistivity domain of QMB. Our study and findings provide an understanding of the tectonic evolution of the northern Tibetan Plateau, the crustal structure that controls the temporal and spatial distribution of magmatic rocks, and the geological signature associated with mineral deposits.

1. Introduction

Crustal and lithospheric structures are critical in the formation of large-scale mineral systems [1,2,3,4,5,6]. The crustal structure and architecture contain complex records of the Earth’s evolution, provide pathways for fluid or melt originating in the deep crust and mantle, and make space for fractional crystallization assimilation and contamination [7,8,9,10,11,12]. These structures control the formation of the mineral deposit [2]. Plate tectonics cause lithospheric thinning or thickening and then produce different tectonic environments such as divergent, convergent, or transform margins and intraplate settings [5]. Mineral deposits with different histories are spatially and genetically associated with plate boundaries, paleocrustal boundaries, or intraplate processes [5,13]. Fluids or melts that are derived from the deep lithosphere often characterize regional-class mineral systems [3,4]. Debate continues about metal sources and the pathways for the metal-enriched fluids or melts from the deep crust and upper mantle [1,2,3,4].
Geophysical studies yield important signatures for linking the crustal architecture to regional metallogenic belt settings and the ore-forming processes. Due to the limited capability for examining the deep crust, geophysical studies offer a potential tool to ascertain the role of the whole crust architecture [8]. Geophysical approaches, such as satellite gravity, airborne gravity and magnetics, passive seismic, and seismic reflection and refraction studies, magnetotelluric (MT) have been employed to determine how crustal structure and composition controlled the locations of different mineral systems [1,2,5,8,14,15,16,17]. Among them, MT studies are more widely used to study the crustal architecture in metallogenic belts because they yield conductivity data, which are more sensitive to heat, fluid or melt interactions, and metal contents that are closely linked with mineral deposits. A typical case study is the MT program across the Olympic Dam and Gawler Craton, where MT revealed a low-resistivity region (less than 100 Ω m) throughout the crust and narrow low-resistivity pathways; the result of whole-crust imaging reveals the crust and mantle sources and the emplacement pathways of the deep mineral system [2,3].
The Qimantagh area serves as a window to the crustal evolution in the northern Qaidam Basin and Tibetan Plateau (QTB) and is a potentially important metallogenic belt in China [18]. Qimantagh Orogen geologically connects Qaidam Basin and the QTB, forming the northern part (Figure 1a) of QTB. It provides important insights for understanding the tectonic evolution of the Proto- and Paleo-Tethys Oceans and the uplift history of the QTB [11,18]. Many skarn, hydrothermal, and porphyry-type deposits have been discovered in the Qimantagh Metallogenic Belt (QMB), as part of the western East Kunlun metallogenic belt, in the past several ten years. Large-scale copper–nickel deposits and iron deposits have been found as well. Progress is focused on the mineralogy, lithology, and economic geology of the QMB, as well as the tectonics and the origin of the deposits [11,18,19,20,21,22]. However, very few geophysical studies with great penetration have been carried out in this metallogenic belt; geophysical understanding of the deep mineral system remains very poor.
In this paper, we firstly present a comprehensive review of the major aspects of the QMB geodynamic setting and its adjacent areas. We then introduce the geological setting and data acquisition and processing. We show the MT results in terms of typical curves, pseudosections, and 2D conversions. Finally, the crustal structure and correlation between the distribution of mineral deposits and the crustal electrical structure of the QMB are discussed. We found the three geoelctrical domain crustal and upper mantle lithosphere structure in QMB; these potentially controlled the temporal and spatial distribution of mineral deposits in the QMB.

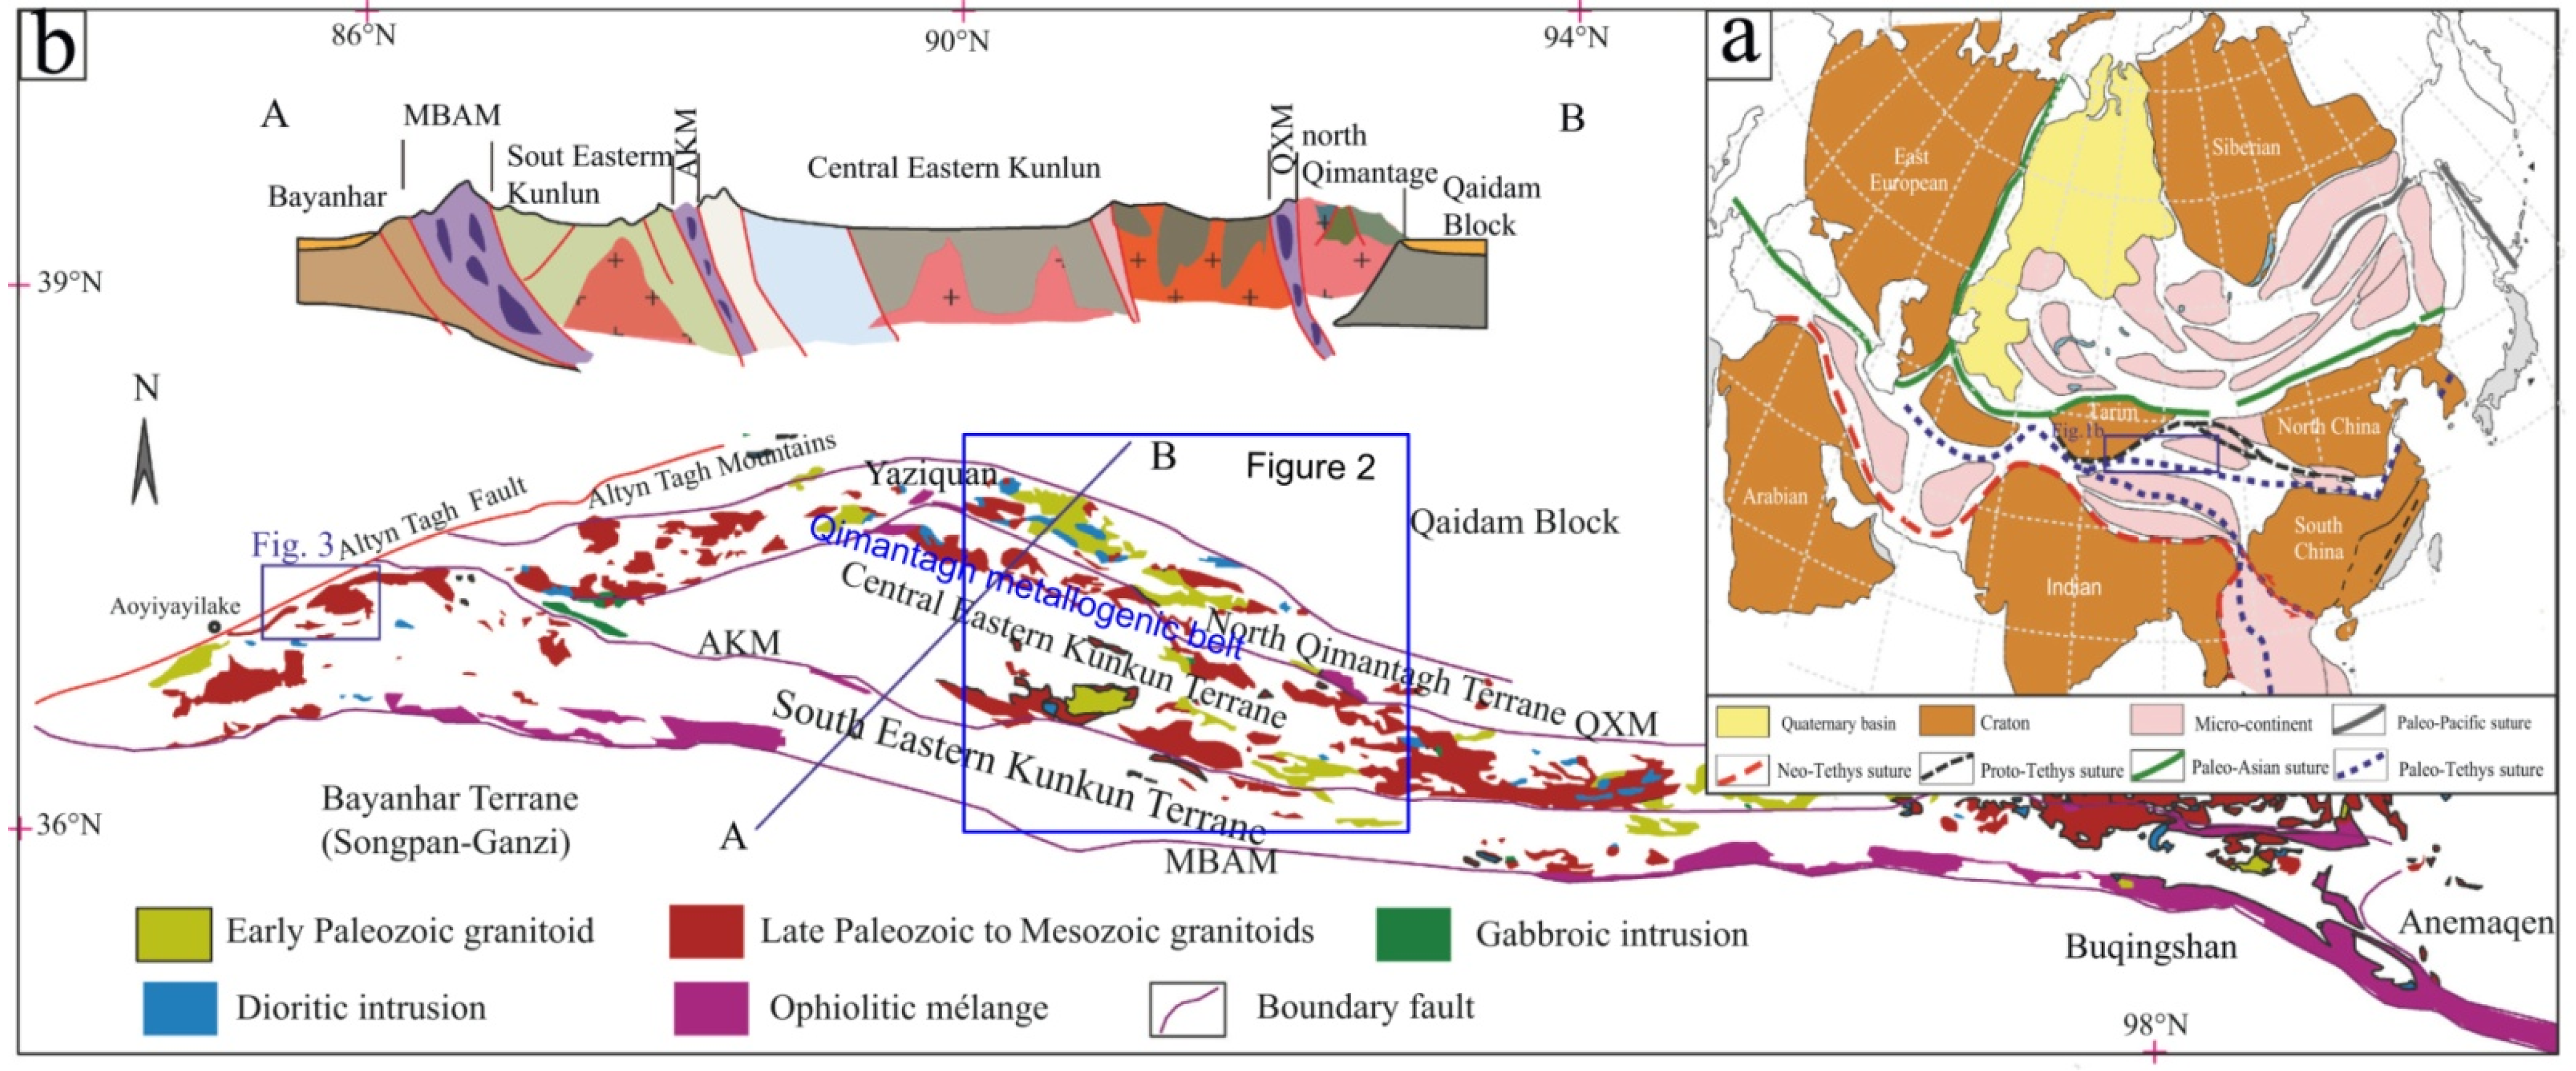
2. Geological Setting

The Qimantagh Orogen is located in the western portion of the East Kunlun Orogen (EKO; Figure 1a). In turn, the EKO is located in the northeastern Tibetan Plateau. The EKO serves as the northwestern segment of the Central China Orogenic Belt (Figure 1b), which extends from east to west in central China and was formed by the closure of the Proto-Tethys and Paleo-Tethys Oceans [23,24,25]. The QMB contains ore-bearing districts along the Qimantagh Orogen and its vicinity (Figure 1b) and records the crustal evolution in the northern Tibetan Plateau [18]. The EKO is tectonically divided into the North Qimantagh Belt, the Central Kunlun Belt, the South Kunlun Belt, and the Bayan Har Terrane (Figure 1b) by the Qimantagh–Xiangride ophiolitic mélange zone (QXM), the Aqikekulehu-Kunzhong mélange zone (AKM), and the Muztagh-Buqingshan-Anemaqen mélange zone (MBAM). Comprehensive studies based on geological, geochemical, and geochronological data have been reported [10,11], but the tectonic setting and subduction of the Proto-Tethys Ocean are complex and remain controversial [26].
Archean to Cenozoic strata are exposed in the Qimantagh area. The crystalline Precambrian basement of the Qimantagh area is the Jinshuikou Group [27,28]. Unconformably overlain are the Ordovician-Silurian Tanjianshan Group, Silurian Baiganhu and Yaziquan formations, Devonian Maoniushan Formation, Carboniferous Shiguaizi Formation, and Triassic Elashan Formation [29]. The basement of the Jinshuikou Group comprises a suite of gneiss, granitic gneiss, marble amphibolite, mica-quartz schist, carbonate, and chert [27,29,30]. The Tanjianshan Group strata are exposed in the northern and southern margins of the Qaidam Basin; they are a volcanic-sedimentary succession comprising metasandstone, sericite, feldspar, schist, chlorite, sandstone and siltstone, volcanic breccia and tuff, dolomite limestone, dolomite-bearing silty limestone, and silty limestone [12,29]. The Silurian to Triassic strata are composed of thickly layered lithic siltstone, argillaceous siltstone, tuffaceous feldspathic quartz fine sandstone, silty mudstone, sericite-quartz schist, thinly layered siltstone, and silty slate. A volcanic-sedimentary assemblage containing ophiolite mélange, molasse sediments, marine clastic carbonate sedimentary sequence, and pyroclastic rocks interbedded with volcanic lavas develops in this section [27,29,30]. The QMB is north to the Qaidam block and south to the Kumukuri basin (Figure 2a). Qaidam block consists of Mesozoic to Cenozoic sedimentary cover overlying the Precambrian basement, and the Mesozoic–Cenozoic sedimentary formations are exposed in the Kumukuri basin [26,31,32].
Magmatic rocks of various types and ages, ranging from Proterozoic to Triassic, are spread over the Qimantagh area. The evident tectonic-magmatic activities are the Caledonian and Variscan-Indosinian (Figure 2b). The Qimantagh area represents an Early Paleozoic magmatic arc that underwent multiple extensive magmatic events [18,30,31]. The magmatism can be divided into Proterozoic, Early Paleozoic, Late Paleozoic, and Early Mesozoic stages. More than 90% of the granitoids in the QMB formed during the Paleozoic (450–390 Ma) and Early Mesozoic (260–220 Ma) syn- to post-collisional stages [18,33]. The Neoproterozoic granitic gneisses occur widely in this region, which might be in response to the assembly of the global supercontinent Rodinia from different blocks [11]. Late Paleozoic granitoids are widely exposed in the Qimantagh area; they are accompanied by Early Paleozoic granitoids in the North Qimantagh metallogenic belt, indicating a collisional environment [34]. Early Mesozoic granitoids are restricted to the south Qimantagh, suggesting a transition stage from subduction to collision with slab breakoff. Two series of ultramafic-mafic rocks are recognized in the South and North Qimantagh belts, respectively [26]. Debates continue on the origin of the ultramafic-mafic rocks in the North Qimantagh Belt (QXM); some researchers consider them to be fragments of ophiolites formed in a mid-ocean ridge or island-arc environment [11,26]. The AKM and QXM (Figure 1) represent the main remnant of the Proto-Tethys oceanic lithosphere, which stretches along the central Eastern Kunlun Fault [11,34].
Figure 2. Regional topography and geological map of the Qimantagh Metallogenic Belt. (a) Regional topography and field layout of magnetotelluric (MT) stations; (b) regional geological map [30]. 1. Neogene sediments, 2. Triassic Elashan Formation, 3. Carboniferous Shiguaizi Formation, 4. Devonian Maoniushan Formation, 5. Silurian Yaziquan Formation, 6. Silurian Baiganhu Formation, 7. Ordovician Tanjianshan Group, 8. >1050 Ma Jinshuikou Group, 9. Mesozoic granite, 10. Late Paleozoic granite, 11. Early Paleozoic granite, 12. Observed fault, 13. Inferred fault, 14. MT station and its number, 15. iron deposit, 16. tungsten–tin deposit, 17. copper deposit, 18. iron–polymetallic deposit, 19. copper–nickel deposit [30]. References cited in the figure: [34,35].
Minerals 13 00225 g002

3. Data and Methods

MT data are employed to study the crustal structure of the QMB. The MT method is a natural-source electromagnetic sounding approach for sensing the electrical conductivity of the Earth’s interior that finds application in a variety of contexts [36]. The natural source of MT results from the interactions of the solar wind with the magnetosphere and the ionosphere and magnetic storm activity, mainly in equatorial regions [37]. MT field operation measures the orthogonal electric and magnetic fields. Frequency-based impedance results, which correspond to the distribution of subsurface electrical conductivity, can therefore be acquired from the amplitude, phase, and directional relationships between surface electric and magnetic fields [38,39]. Tensor apparent resistivity and phase are derived from the complex cross-spectral by robust cross-spectral analysis [38]. We carried out MT studies in the QMB and adjacent areas. Data were acquired from 40 MT stations, among which 33 are along two sections (Line 3 and Line 5 in Figure 2). Line 3 has 16 stations, and Line 5 has 17 stations. The two sections cross at station 5110. Data from a station approximately 400 km away from the working area were used for magnetic reference. Surface electromagnetic prospecting (SEP) systems with broadband receivers [40] and a highly sensitive magnetic sensors are used for data acquisition. Detailed field observations and an introduction to SEP are present in Di et al. [41].
Almost all of the MT data are of very good quality because most stations are set in the QMB, where there is almost no cultural electromagnetic and vibration noise apart from very few stations close to a mining district and an operating oil field. The observed MT time series is firstly converted into an impedance result from which the resistivity and phase could be derived; the impedance data are rotated to the strike angle. We have also tested the result of data rotated to the direction of average profile direction (northeast with 62 degree) using data from Line 5. We then carried out processing that included topographic correction, static shifts, and noise correction using spatial filtering based on electromagnetic array profiling (EMAP) filtering [42,43,44]. A detailed processing of how EMAP works on static correction is described in reference [43]. The filtering effect is controlled to a specific window width using a filter constant. TM-mode data (usually the upper curve) are used for 2D conversion. We conducted a Bostick conversion [42,43,44] and nonlinear conjugate gradient inversion (NLCG) based on the algorithm of Rodi and Mackie [45] to find a suitable method for data inversion. The NLCG code we used was modified by Hu Z. from a geophysical prospecting company. The noise floors are 5% for both resistivity and phase. A total iteration of 60 we set for inversion; Line 3 stopped at the iteration of 53 with a root mean square (RMS) of 3.78%, and the result of an iteration of 10 with an RMS of 5.60% is used as a comparison to the Bostick conversion. A comparison of different iterations is shown in Figure A1. Line 5 stopped at the iteration of 55 with an RMS of 4.34%, and we show the result of the iteration of 10 with an RMS of 5.70%. Some stations are of a skin depth of less than 100 km based on the Bostick conversion result; the deep portion without penetration was blanked.
Data conversion or inversion is the main origin of non-uniqueness; whether this approach achieves the most accurate yields when compared to the real geological model remains an ongoing debate. Calderón-Moctezuma et al. [46] discussed the approximation closer to the classical sounding and indicated that 1D models were never proved to be inferior to 2 or 3D models. A processing procedure based on 1D inversion and 2D imaging was proposed and tested by several data sets, Calderón-Moctezuma et al. [46] concluded that the ideal or classical MT sounding is the closest approximation possible. Aside from the purely academic curiosity of how an MT survey would have looked, it is better to realize the practical feature of the MT method as a detector of good conductors [46]. Our practice in a great many case studies in near-surface MT/AMT exploration has also verified that 1D inversion (or Bostick conversion) and 2D imaging are a very practical way of approaching the geology revealed by drilling, mining, or field geological surveys [38,43]. Based on a comparison of the conversion to the observed results (the pseudosections of Lines 3 and 5 are shown in Figure A2), we choose a Bostick conversion with spatial filtering as the data processing method for this study.

4. Results

4.1. Typical Curves

The apparent resistivity and phase curve are the fundamental information derived from MT observations for studying the subsurface geoelectrical structure. The curve type reflects the resistivity (or conductivity) beneath the survey station and its vicinity. Figure 3 shows the typical apparent resistivity versus frequency curve in the QMB, demonstrating the typical geoelectrical structure (resistivity varies with frequency, with lower frequencies having greater penetration or depth) of the study area. They could generally be divided into four types. Type 1 is shown by 5000R and 5060R (Number is the station number, R means the result of rotation to the strike angle). This type is characterized by very high resistivity from the whole frequency band. The upper curve (Rxy) shape is K-type (Low–High–Low) and the lower curve shape is K–Q-type (High–Low). The second type (Type 2) is shown by 5030R, 5100R, 9001R, and 3140R; data of this type have moderate resistivity in the whole frequency band. The upper curve (Rxy) shapes are H–K type (High–Low–High); the lower curve shapes are Q (9001R and 3140R) or K (5030R and 5100R) types. Data from station 5140R have low resistivity and feature minor variations with decreasing frequency (Type 3). Data from station 5150 have low resistivity that decreases with decreasing frequency; the upper and lower curves are both Q type (Type 4). Data of Type 1 are always from mountain areas where magmatic rock or limestone is widely developed. Data of Type 2 generally correspond to the rift basin where the deposit layers are relatively thin. Data of type 3 and type 4 are from the Qaidam block; the lower resistivity data represent the thick deposit layers in the basin. The results of seven stations not consist in Lines 3 and 5 are shown in Figure A3.

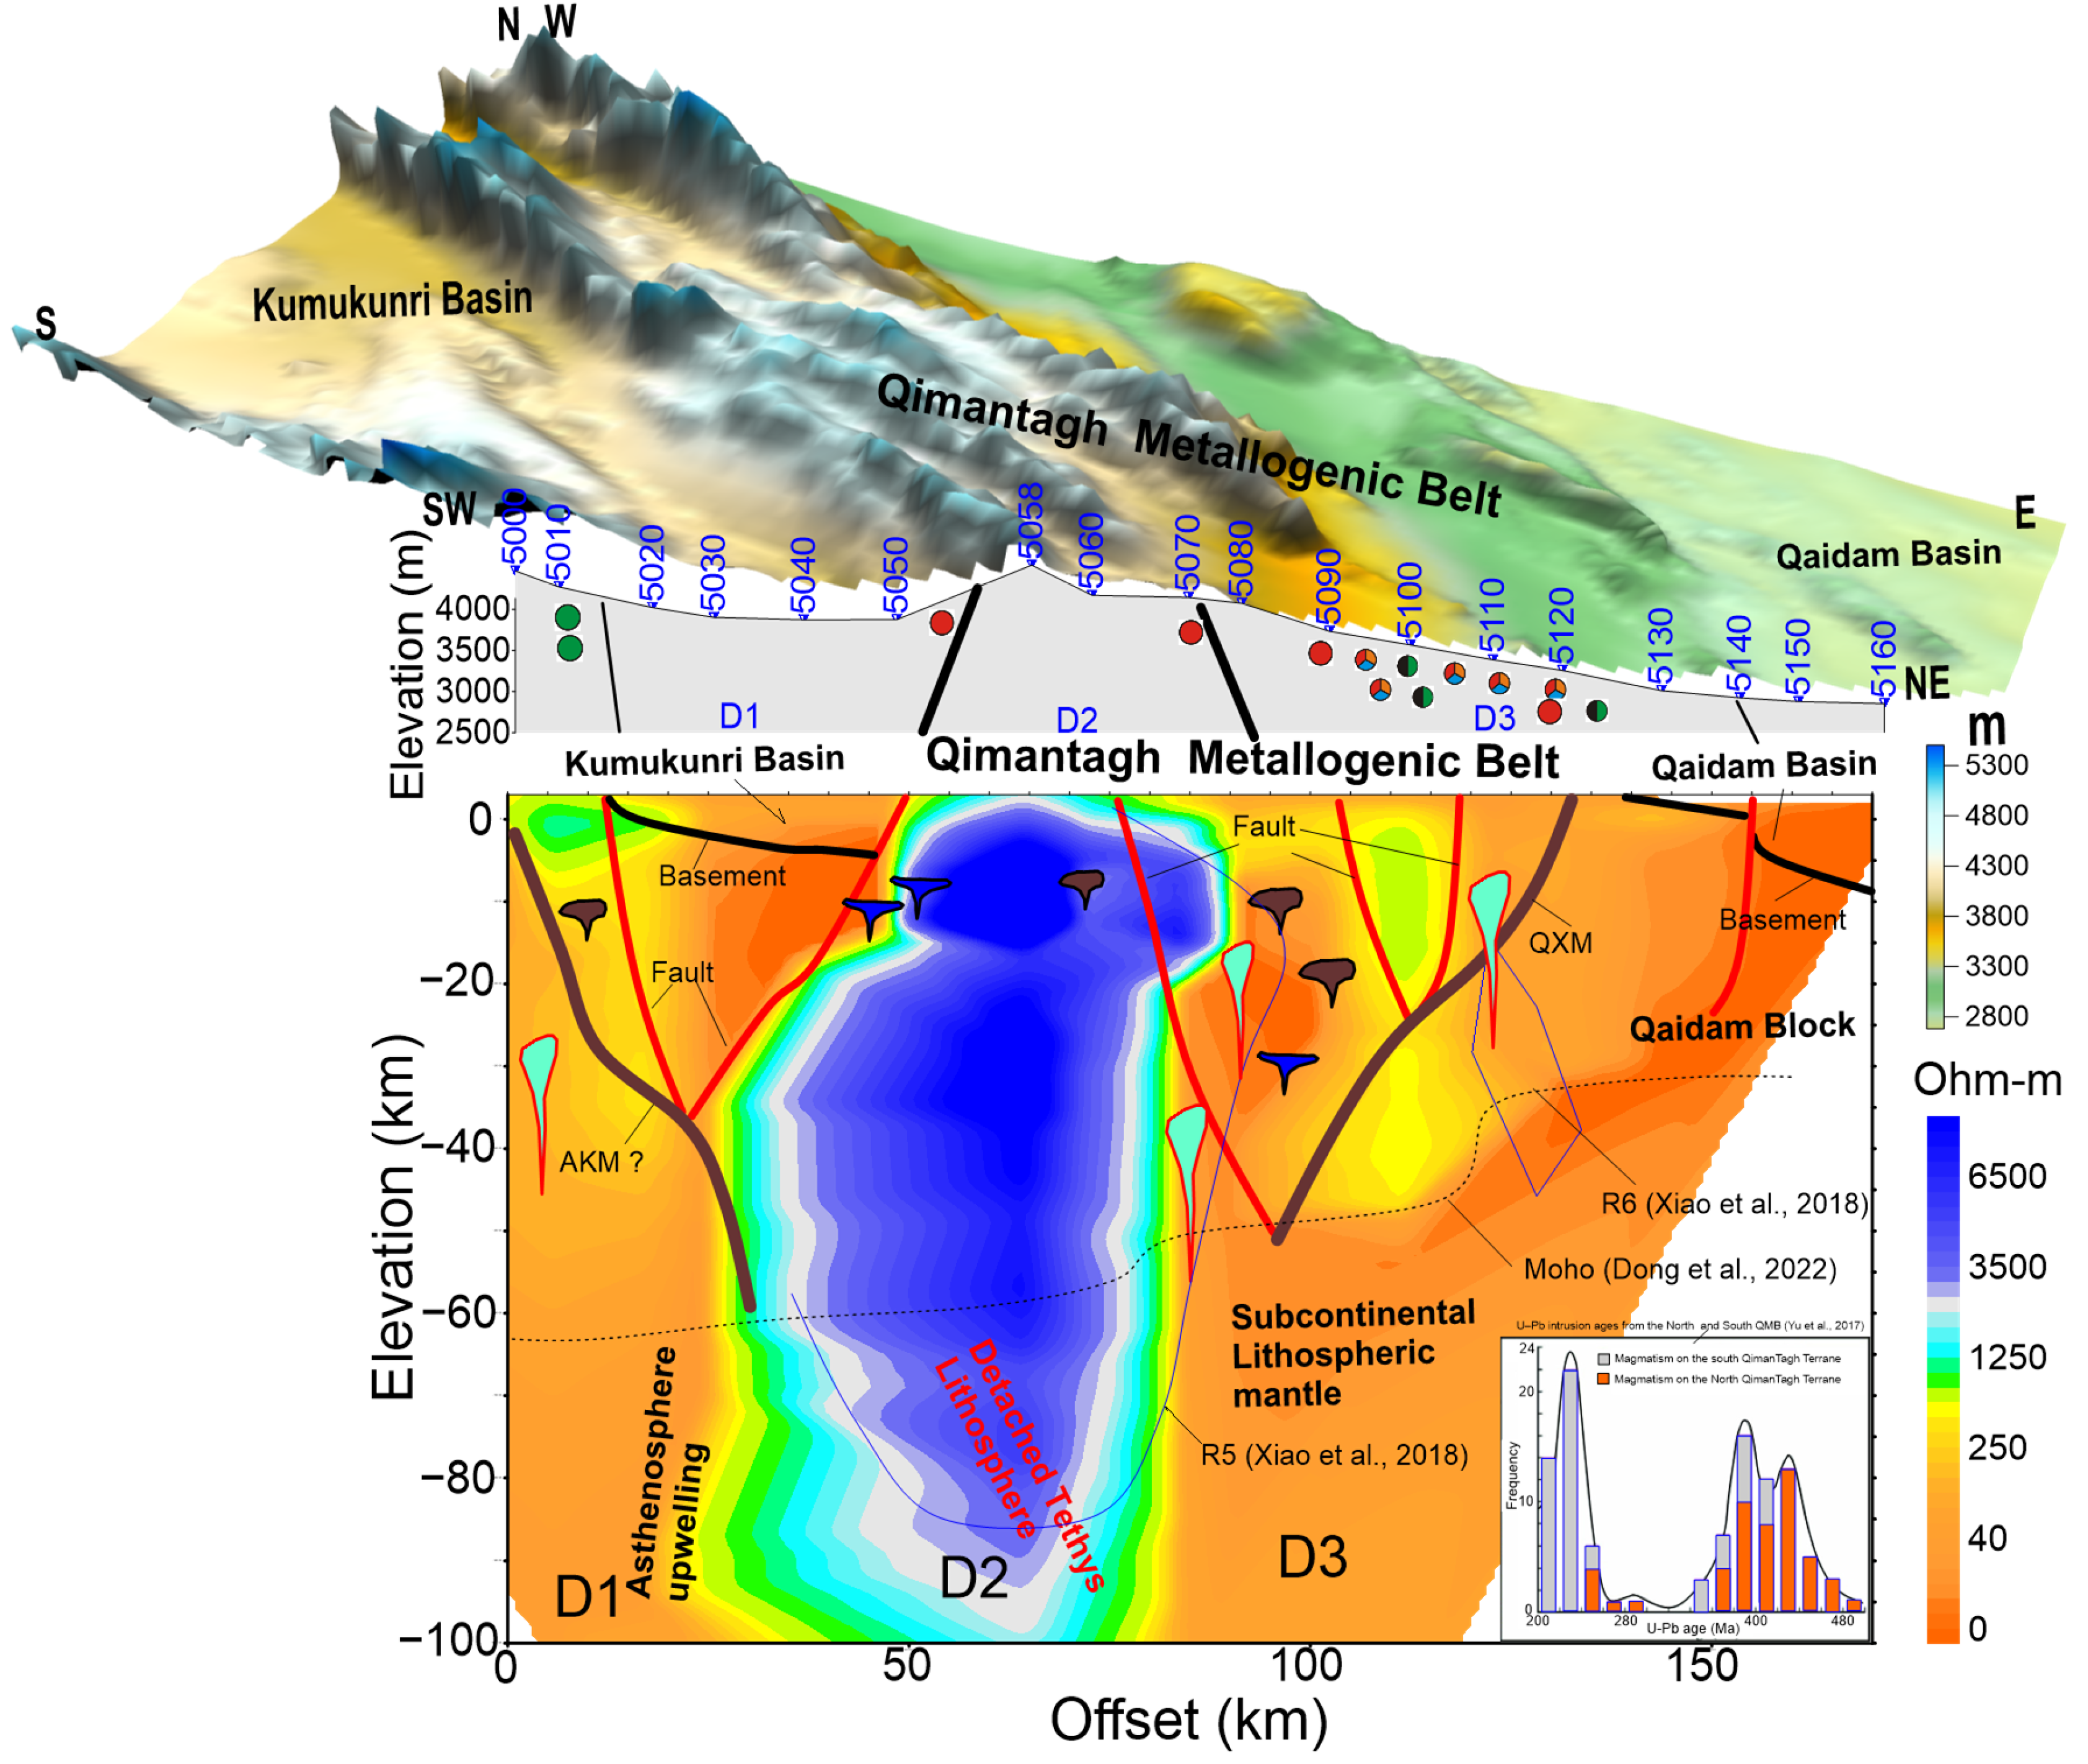
4.2. Two-Dimensional (2D) Conversion Results

The pseudosections, which manifest at the apparent resistivity and phase versus frequency (Figure A2a,b in Appendix A), are converted to resistivity versus depth sections by conversion or inversion. The 2D MT conversion (or inversion) profile directly characterizes the crustal geoelectrical structure, from which we can directly obtain the resistivity value and its variation character in a lateral and vertical sense. The 2D imaging results based on the Bostick conversion and the EMAP filtering and 2D inversion results of Line 3 and Line 5 are shown in Figure 4.
Line 3: Line 3 trends from southeast to northwest with 16 MT stations (Station 3030 to 3180). The location of the stations is shown in Figure 2. Figure 4a shows the result of the semiquantitative inversion derived from the Bostick conversion with EMAP filtering. Figure 4b shows the results of 2D NLCG inversion. Two remarkable high-resistivity anomalies (R1 and R2) and three low-resistivity belts (C1, C2, and C3) develop in this section, as Figure 4a shows. R1 develops beneath the ridge of Qimantagh mountains; this anomaly is approximately 40 km wide and is covered by more than three MT stations; it features a high-resistivity dyke from the near-surface down to more than 100 km. R2 has a width of approximately 30 km; it is characterized as a resistant dyke as to R1. The resistivity of R1 and R2 ranges from 2000 Ω m to more than 8000 Ω m. The conductive anomaly belt C1 lies between R1 and R2; its resistivity ranges from several Ω m to 600 Ω m. Anomaly belt C2 has moderate to low resistivity that ranges from 100 Ω m to 800 Ω m. This belt developed to the northwest of R2 and covered 50 km in Line 3 from stations 3100 to 3150. The most conductive belt C3 is located at the northwestern end of Line 3 from stations 3160 to 3180 with a resistivity of less than 70 Ω m. R1 and R2 are connected into one anomaly in the NLCG inversion results shown in Figure 5b; C1 lies beneath this anomaly with a burial depth of more than 40 km. C2 and C3 in the inversion results are more obvious than those of the Bostick inversion. C1 is an obvious anomaly in the pseudosection and the Bostick conversion result (Figure 4a), but it features as high resistivity as the result of NLGG (Figure 4b); this might be due to the spatial filtering conducted before NLGG inversion.
Figure 4. Resistivity conversion results of magnetotelluric (MT) sections Line 3 and Line 5 down to 100 km shows the crustal and upper lithosphere geoelectrical views of the Qimantagh Metallogenic Belt QMB. (a) and (c) show the result of Bostick conversion with electromagnetic array profiling (EMAP) filter. (b) and (d) are the result of nonlinear conjugate gradient inversion (NLCG). The blank area in the figures means limited penetration of less than 100 km (the high conductivity of the subsurface of the MT method has a limited depth of penetration).
Minerals 13 00225 g004
Line 5: Line 5 trends from southwest to northeast with 17 MT stations (5000 to 5170); it crosses Line 3 at station 5110. Figure 4c shows the result of Bostick conversion and Figure 4d shows the result of 2D NLCG inversion. The geoelectrical structure of this section is divided into three domains: a high-resistivity domain (D2), a southern low-resistivity domain (D1), and a northern low-resistivity domain (D3, this domain has two anomalies, C1 and C5). R1 develops beneath the ridge of Qimantagh mountain, similar to Line 3, but this anomaly has clear north and south boundaries in Line 5 from stations 5050 to 5080. The resistivity of R1 and R2 ranges from 1500 Ω m to more than 7000 Ω m. A relatively high-resistivity belt (R3) develops in the southwestern end of Line 5; this belt covers two MT stations (5000 to 5010) and features resistivity of 300 Ω m to 1000 Ω m. The conductive anomaly belt C4 lies between R1 and R4; it has low resistivity from the surface to more than 100 km depth and a very conductive zone at depths of 10 km to 20 km. The northern low-resistivity domain consists of C1 and C5. C1 in this section has similar resistivity values to C1 in Line 3. C5 has a very low resistivity of less than 20 Ω m.
Figure 5 shows the conversion result of Line 5 as a comparison of different rotations. The data used for Bostick conversion are rotated to a fixed angle along with the average line direction of Line 5 as 62 degrees. Figure 5a shows the Bostick conversion result of data along the profile (Rxy); 5b shows those of the orthogonal Ryx. The conversion result shows a very close geoelectrical structure was revealed by the result of data that rotated to a strike angle as shown in Figure 4c. Both of them show a three-domain structure with two relatively low resistivity domains and a high-resistivity domain at the corresponding stations. Results of orthogonal directions (Rxy and Ryx, or TM and TE) also show a similar geoelectrical structure. This means that the approximate one-dimensional geoelectrical structure in the section, drop the area shows in the blue rectangle, after it was rotated to the profile direction of Line 5.
Figure 5. Resistivity conversion results of magnetotelluric (MT) sections Line 5 with a rotation of 62 degrees. (a) is the result of Rxy; (b) is those of Ryx.
Minerals 13 00225 g005

5. Discussion

The QMB has experienced very complex geological processes from the Proto-and Paleo-Tethys evolution to the Tibetan Plateau uplift, which are the subject of ongoing debate [11,34,35,47,48]. A discussion on the evolution of the North Tibetan Plateau is out of the scope of this study; we only discuss the general observation on the crustal structure and their correlation to the distribution of minerals system with respect to our MT observations.

5.1. Crustal Structure of the QMB

A detailed tectonic architecture of QMB and East Kunlun Orogen has been discussed in publications [10,11,12,34]. However, most of the studies are based on surface geological surveys and geochemical analysis, conceptional models are used for discussing the tectonic architecture and the evolution of QMB. The QMB is the western part of the East Kunlun Orogen, which represents a subduction accretionary orogen between the Qaidam and Qiangtang Blocks as a consequence of the closure of the Kunlun Ocean [10,11]. As shown in Figure 4, the crustal electrical structures across the QMB are different among the Central Kunlun Belt, North Qimantagh (Kunlun) Belt, and Qaidam block. The Central Kunlun Belt could be subdivided into the Kumukuri Rift Belt and South Qimantagh Belt [30,34]. The boundaries of each belt are large-scale faults [34] marked as F1 to F5 in Figure 2. Based on the converted resistivity model, the crustal electrical structure is divided into three domains (Figure 4c,d) from south to north: a low-resistivity southern domain (D1), a high-resistivity middle domain (D2), and a low-resistivity northern domain (D3). Apart from domain D1, the geoelectrical structure of the QMB revealed by section Line 5 is very similar to the 2D inversion result of Xiao et al. [35]; both show a high-resistivity domain (R1 and R2 in this study, R5 in Xiao et al. [35]) and a low-resistivity domain (D3). The boundaries between the three domains are correlated to large-scale faults (F3 and F4 in Figure 2) revealed by precious geological studies and surveys [34].
D1 reflects the Kumukuri rift belt, a remarkably low-resistivity anomaly (C4) developed in this domain at depths of 10 km to 20 km, which indicates an active or hot basement of the Kumukuri basin. This low-resistivity basement has also been reported by Liu et al. [48], who revealed a low-resistivity anomaly (5 km to >15 km in depth) in the western part of the Kumukuri Basin by MT. D2 is located in the South Qimantagh Belt; this domain is characterized by very high resistivity from the subsurface to more than 90 km in depth, indicating a rigid crust and lithospheric mantle. The upper part of this rigid belt is considered the reflection of the metamorphic formation and granite [11,30,33,34], and the rigid lower part in the upper mantle is referred to as the reflection of the detached lithosphere. Why a detached lithosphere greater than 200 Ma could remain highly resistant needs further study. Both the northern and southern boundaries are very cliffy; a northward subduction from the south and southward from the north subduction model is more reasonable for understanding the formation of this high-dipping belt. Wang et al. [11] present a carton showing the evolution of the Paleo-Tethys Ocean; in this model, they indicate a southward subducted Paleo-Asian Ocean and double-sided (south and north) subduction of the Paleo-Tethys Ocean in this area.
D3 covers the North Qimantagh Belt and the Qaidam Block. Low resistivity of less than 100 Ω m is widely developed in this domain, except for a relatively high-resistivity belt (R2). Sources of the very low-resistivity layer in the Qaidam Basin are conferred as clay minerals, saturated zones with high permeability and porosity, and saline brine in the basin sedimentary strata [32]. At greater depths, the low resistivity might reflect a fault system or processes related to the Paleo-Tethys evolution to the uplift of the Tibetan Plateau that affected the crustal resistivity structure of the Qaidam block [32,35]. This low-resistivity anomaly belt most probably serves as a pathway to send the heat and mantle material to the basin or rift belt, resulting in high heat flow along the North Kunlun Fault (F5 in Figure 2). The resistivity of the Northern Qimantagh Belt (Stations 5080–5130) is higher than those in the Qaidam block and lower than those of the southern Qimantagh Belt, and a high-resistivity belt (R2, stations 3080 to 3090 in Line 3) develops in this domain. This belt is cut by a fault trending from west to east that does not extend to the coverage area of Line 5 (Figure 2). The cause of this high-resistivity belt is variously attributed to a high-resistivity metamorphic formation and granite [34]. Low-resistivity anomalies in this domain may reflect the effects of asthenospheric upwelling, deep fluid pathways, and possibly materials related to ore-deposit formation [11,21].

5.2. Correlations between the Distribution of Mineral Deposits and the Crustal Electrical Structure

The MT results correlate with temporal and spatial distributions of tectonic magmatic rock [6]. MT observation in this study covers three tectonic magmatic rock belts and two tectonic magmatic cycles (Figure 2 and Figure 6). The three tectonic magmatic rock belts include the Northern Qimantagh tectonic magmatic rock belt between fault F4 and hidden fault F5, the Southern Qimantagh tectonic magmatic rock belt between fault F4 and F3, and the Kunzhong tectonic magmatic rock belt between F3 and F2 [10,11,34]. Although the Adatan fault (F4) serves as the boundary between the Northern and Southern Qimantagh belts, the location of this fault is not clear in the previous studies due to the complex surface condition and poor geophysical study [11,33,34]. Our MT study revealed pronounced resistivity variations from stations 3050 to 3060 in Line 3 and from stations 5070 to 5090 in Line 5 (Figure 4c); these transfer zones are interpreted as reflections of the F4 segment that separates the North and South Qimantagh belts. Similarly, we interpreted segments of F3 and F5 (Figure 2, shown as solid red lines) based on the resistivity rough change in the converted result (Figure 4 and Figure 6). Tectonic magmatic activities in the QBM are concentrated in two cycles: Caledonian (Ordovician to Devonian) and Hercynian to Indosinian (Permian to Jurassic) [11,30,34]. The Caledonian cycle could be subdivided into four magmatic stages: Ordovician to Early Silurian, Late Silurian to Early Devonian, Early to Middle Devonian, and Late Devonian [34]. Reviews of the intrusion uranium lead isotope (U-Pb) ages indicate the temporal difference of magmatic activities from the Northern and Southern Qimantagh belts. Magmatism is spatially accompanied by the Early Paleozoic granitoids in the North Qimantagh belt (MT domain, D3); however, Early Mesozoic granitoids are restricted to the South Qimantagh belt (MT domain, D2) and largely trend along the NWW direction south of the Adatan thrust fault [16].
The QMB is also an important metallogenic belt in China. More than 100 ore deposits, occurrences, and mineralization outcrops, including iron, copper, lead, zinc, molybdenum, tungsten, tin, cobalt, bismuth, gold, silver, nickel, and cadmium have been found in the QMB [30,34]. The temporal and spatial distributions of mineral deposits are controlled by tectonic magmatism [27,28,29,30,32,33,34]. The crustal electrical structure based on MT observation reflects the tectonics and magmatism of the QMB and then correlates to the distribution of mineral deposits. Figure 6 shows a comprehensive metallogenic electromagnetism model for understanding the correlation between the distribution of mineral deposits and the crustal electrical structure. Many studies have reviewed and discussed the geological observations and conception of the QMB [18,30,34]. Most of the known iron, copper, lead, zinc, molybdenum, and cobalt deposits are located in the North Qimantagh belt [28,29,30,34]. In this belt, the crust is generally characterized as having relatively low resistivity, except R2 in Line 03. Several low-resistivity belts connect the crust to the deep lithosphere (Figure 4, Figure 5 and Figure 6). These low-resistivity belts are inferred as reflections of the residual or active magmatic pathways for transferring mantle material to the upper crust; some terminate at the mineral deposit system. Another mineral system is developed in the south end of Line 5 with a relatively high-resistivity surface layer and low-resistivity lower crust and upper mantle. The deposits in this area are copper deposits, including porphyry and skarn-type copper deposits. Almost no deposits have been found in the high-resistivity MT domain D2; this domain acts as a boundary in the Central Kunlun Belt. Its origin, significance, and relation to the QMB mineral system need further study. The geochemical analysis results show that many of the Qimantagh deposits have mantle-derived sulfur and lead isotopes, indicating the crust-mantle mixed source of the mineral systems [27,34]. MT studies in the Olympic Dam Proterozoic iron oxide (Cu–U–Au–rare earth element) deposit in South Australia, in the Ailaoshan gold belt on the southeastern margin of Tibet present the vertical conductor across the Moho, the uppermost mantle and lowest crust were interpreted as a deep source system and pathways of the mineral system [2,3,49,50].
Figure 6. Comprehensive tectonic and geophysical model for understanding the distribution of mineral deposits and the crustal electrical structure of QMB. The geological interpretation is referenced from [10,11,33,34]. References cited in the figure: [23,35].
Minerals 13 00225 g006

6. Conclusions

We conducted an MT study at 40 stations in the QMB to study the geoelectrical structure of the crust and upper lithospheric mantle and their correlations to mineral deposit distribution. The geoelectrical structure up to 100 km in depth is revealed by the MT conversion results. The QMB complex consists of three resistivity domains: a low-resistivity southern domain, a high-resistivity middle domain, and a low- to moderate-resistivity northern domain. Most of the known deposits are found in the northern low resistivity domain, which covers the Northern Qimantagh Belt. The high-resistivity belt is referred to as a reflection of a rigid crust and lithospheric mantle; a northward subduction from the south and southward from the north subduction model, which might indicate the double-sided (south and north) subduction of the Paleo-Tethys Ocean and the southward subducted Paleo-Asian Ocean, are reasonable for understanding the formation of this high-dipping belt. The southern low-resistivity domain reflects the Central Kunlun Belt. Our results correlate with the geoelectrical structure and the temporal and spatial distribution of tectonic magmatism; these potentially controlled the mineral deposit distributions in the QMB.

Author Contributions

Conceptualization, Q.D. and L.H.; methodology, L.H.; validation, Q.D., L.H., Z.W., G.X., W.G. and J.L.; formal analysis, Q.D. and L.H.; investigation, J.L., W.G. and L.H.; resources, Q.D. and L.H.; data curation, Z.W.; writing—original draft preparation, L.H. and Q.D.; writing—review and editing, Q.D., Z.W., G.X. and W.G.; visualization, L.H.; project administration, Q.D. and Z.W.; funding acquisition, Q.D. All authors have read and agreed to the published version of the manuscript.

Funding

This research was funded by the Second Tibetan Plateau Scientific Expedition and Research Program (STEP) (2019QZKK0801), the Key Research Program of the Chinese Academy of Sciences (ZDRW-ZS-2020-4).

Data Availability Statement

The data used to support the findings of this study are available from the corresponding author upon request.

Acknowledgments

Great thanks to anonymous reviewers for their insightful comments, which have greatly improved the manuscript. We would like to thank Hu Zuzhi; Denghai, Bai; Xin, Li; Dongsen, Wang; Linbo, Zhang; Wengang, Yang for their help and effort in survey design, data processing, and field operation.

Conflicts of Interest

The authors declare no conflict of interest.

Appendix A

Figure A1. NLGG inversion result with different iterations. (a) is the result of 1 iteration, (bd) is those of 11, 31, and 53, respectively.
Minerals 13 00225 g0a1
Figure A2. Pseudosections of apparent resistivity (a,c) and phase (b,d) versus frequency for Line 3 and Line 5.
Minerals 13 00225 g0a2
Figure A3. Apparent resistivity curves of seven magnetotelluric (MT) stations that are not on Lines 3 and 5. The locations of these stations are shown in Figure 2.
Minerals 13 00225 g0a3

References

  1. Wannamaker, P.E.; Doerner, W.M. Crustal structure of the Ruby Mountains and southern Carlin Trend region, Nevada, from magnetotelluric data. Ore Geol. Rev. 2002, 21, 185–210. [Google Scholar] [CrossRef]
  2. Heinson, G.S.; Direen, N.G.; Gill, R.M. Magnetotelluric evidence for a deep-crustal mineralizing system beneath the Olympic Dam iron oxide copper-gold deposit, southern Australia. Geology 2006, 34, 573. [Google Scholar] [CrossRef]
  3. Heinson, G.; Didana, Y.; Soeffky, P.; Thiel, S.; Wise, T. The crustal geophysical signature of a world-class magmatic mineral system. Sci. Rep. 2018, 8, 10608. [Google Scholar] [CrossRef] [PubMed]
  4. Blewett, R.S.; Henson, P.A.; Roy, I.G.; Champion, D.C.; Cassidy, K.F. Scale-integrated architecture of a world-class gold mineral system: The Archaean eastern Yilgarn Craton, Western Australia. Precambrian Res. 2010, 183, 230–250. [Google Scholar] [CrossRef]
  5. Huston, D.L.; Mernagh, T.P.; Hagemann, S.G.; Doublier, M.P.; Fiorentini, M.; Champion, D.C.; Lynton Jaques, A.; Czarnota, K.; Cayley, R.; Skirrow, R.; et al. Tectono-metallogenic systems—The place of mineral systems within tectonic evolution, with an emphasis on Australian examples. Ore Geol. Rev. 2016, 76, 168–210. [Google Scholar] [CrossRef]
  6. Groves, D.I.; Santosh, M.; Zhang, L. A scale-integrated exploration model for orogenic gold deposits based on a mineral system approach. Geosci. Front. 2020, 11, 719–738. [Google Scholar] [CrossRef]
  7. Hou, Z.; Wang, T. Isotopic mapping and deep material probing (II): Imaging crustal architecture and its control on mineral systems. Earth Sci. Front. 2018, 25, 20–41. [Google Scholar]
  8. Motta, J.G.; Souza Filho, C.R.; Carranza, E.J.M.; Braitenberg, C. Archean crust and metallogenic zones in the Amazonian Craton sensed by satellite gravity data. Sci. Rep. 2019, 9, 2565. [Google Scholar] [CrossRef]
  9. Zhai, M.; Zhu, X.; Zhou, Y.; Zhao, L.; Zhou, L. Continental crustal evolution and synchronous metallogeny through time in the North China Craton. J. Asian Earth Sci. 2020, 194, 104169. [Google Scholar] [CrossRef]
  10. Dong, Y.; Sun, S.; Santosh, M.; Zhao, J.; Sun, J.; He, D.; Yang, L.; Shi, X.; Hui, B.; Zhang, G.; et al. Central China orogenic belt and amalgamation of East Asian continents. Gondwana Res. 2021, 100, 131–194. [Google Scholar] [CrossRef]
  11. Wang, P.; Zhao, G.; Liu, Q.; Yao, J.; Han, Y. Evolution of the Paleo-Tethys Ocean in Eastern Kunlun, North Tibetan Plateau: From continental rift-drift to final closure. Lithos 2022, 422–423, 106717. [Google Scholar] [CrossRef]
  12. Wu, Y.; Liu, C.; Liu, Y.; Gong, H.; Awan, R.S.; Li, G.; Zang, Q. Geochemical characteristics and the organic matter enrichment of the Upper Ordovician Tanjianshan Group, Qaidam Basin, China. J. Pet. Sci. Eng. 2022, 208, 109383. [Google Scholar] [CrossRef]
  13. Pirajno, F.; Santosh, M. Rifting intraplate magmatism, mineral systems and mantle dynamics in central-east Eurasia: An overview. Ore Geol. Rev. 2014, 63, 265–295. [Google Scholar] [CrossRef]
  14. Snyder, D.B. Imaging Archaean-age whole mineral systems. Precambrian Res. 2013, 229, 125–132. [Google Scholar] [CrossRef]
  15. Zhang, K.; Lü, Q.; Lan, X.; Guo, D.; Wang, Q.; Yan, J.; Zhao, J. Magnetotelluric evidence for crustal decoupling: Insights into tectonic controls on the magmatic mineral system in the Nanling–Xuancheng area, SE China. Ore Geol. Rev. 2021, 131, 104045. [Google Scholar] [CrossRef]
  16. Comeau, M.J.; Becken, M.; Kuvshinov, A.V.; Demberel, S. Crustal architecture of a metallogenic belt and ophiolite belt: Implications for mineral genesis and emplacement from 3-D electrical resistivity models (Bayankhongor area, Mongolia). Earth Planets Space 2021, 73, 82. [Google Scholar] [CrossRef]
  17. Comeau, M.J.; Becken, M.; Kuvshinov, A.V. Imaging the Whole-Lithosphere Architecture of a Mineral System—Geophysical Signatures of the Sources and Pathways of Ore-Forming Fluids. Geochem. Geophys. Geosyst. 2022, 23, e2022GC010379. [Google Scholar] [CrossRef]
  18. Yu, M.; Feng, C.Y.; Santosh, M.; Mao, J.W.; Zhu, Y.F.; Zhao, Y.M.; Li, D.X.; Li, B. The Qiman Tagh Orogen as a window to the crustal evolution in northern Qinghai-Tibet Plateau. Earth Sci. Rev. 2017, 167, 103–123. [Google Scholar] [CrossRef]
  19. Li, W.; Neubauer, F.; Liu, Y.; Genser, J.; Ren, S.; Han, G.; Liang, C. Paleozoic evolution of the Qimantagh magmatic arcs, Eastern Kunlun Mountains: Constraints from zircon dating of granitoids and modern river sands. J. Asian Earth Sci. 2013, 77, 183–202. [Google Scholar] [CrossRef]
  20. Yao, L.; Lü, Z.; Zhao, C.; Pang, Z.; Yu, X.; Yang, T.; Li, Y.; Liu, P.; Zhang, P.; Zhang, M. Zircon U–Pb geochronological, trace element, and Hf isotopic constraints on the genesis of the Fe and Cu skarn deposits in the Qiman Tagh area, Qinghai Province, Eastern Kunlun Orogen, China. Ore Geol. Rev. 2017, 91, 387–403. [Google Scholar] [CrossRef]
  21. Zhong, S.; Feng, C.; Seltmann, R.; Dolgopolova, A.; Andersen, J.C.Ø.; Li, D.; Yu, M. Sources of fluids and metals and evolution models of skarn deposits in the Qimantagh metallogenic belt: A case study from the Weibao deposit, East Kunlun Mountains, northern Tibetan Plateau. Ore Geol. Rev. 2018, 93, 19–37. [Google Scholar] [CrossRef]
  22. Huang, K.; Wu, L.; Zhang, J.; Zhang, Y.; Xiao, A.; Lin, X.; Wang, L.; Chen, H. Structural coupling between the Qiman Tagh and the Qaidam Basin, northern Tibetan Plateau: A perspective from the Yingxiong Range by integrating field mapping, seismic imaging, and analogue modeling. Tectonics 2020, 39, e2020TC006287. [Google Scholar] [CrossRef]
  23. Dong, Y.; Sun, S.; Santosh, M.; Hui, B.; Sun, J.; Zhang, F.; Cheng, B.; Yang, Z.; Shi, X.; He, D.; et al. Cross Orogenic Belts in Central China: Implications for the tectonic and paleogeographic evolution of the East Asian continental collage. Gondwana Res. 2022, 109, 18–88. [Google Scholar] [CrossRef]
  24. Dong, Y.; He, D.; Sun, S.; Liu, X.; Zhou, X.; Zhang, F.; Yang, Z.; Cheng, B.; Zhao, G.; Li, J.; et al. Subduction and accretionary tectonics of the East Kunlun orogen, western segment of the Central China Orogenic System. Earth Sci. Rev. 2018, 186, 231–261. [Google Scholar] [CrossRef]
  25. Liang, H.; Gao, R.; Xue, S. Lithospheric electrical structure and its implications for the evolution of the middle Qinling Orogenic Belt, Central China: Constraints from 3-D magnetotelluric imaging. Tectonophysics 2022, 832, 229359. [Google Scholar] [CrossRef]
  26. Wen, T.; Dong, J.; Wang, C.; Song, S. Two ophiolite belts in the East Kunlun Orogenic Belt record evolution from the Proto-Tethys to Paleo-Tethys Oceans. Int. Geol. Rev. 2022, 1–20. [Google Scholar] [CrossRef]
  27. Lai, J.Q.; Huang, M.; Wang, W.J.; Song, W.B.; Lei, Y.B.; Kong, D.B. Study of Mineralization of Typical Polymetallic Deposits of Qimantagh Metallogenic Belt in Qinghai Province; Press of Central South University: Changsha, China, 2015; pp. 1–30. [Google Scholar]
  28. Yi, L.W.; Gu, X.P.; Lu, A.H.; Liu, J.P.; Lei, H.; Wang, Z.L.; Cui, Y.; Shen, C. Major and trace elements of magnetite from the Qimantag metallogenic belt: Insights into evolution of ore–forming fluids. Acta Geol. Sin. Engl. Ed. 2015, 89, 1226–1243. [Google Scholar]
  29. Zheng, Z.; Chen, Y.J.; Deng, X.H.; Yue, S.W.; Chen, H.J.; Wang, Q.F. Fluid evolution of the Qiman Tagh W-Sn ore belt, East Kunlun Orogen, NW China. Ore Geol. Rev. 2018, 95, 280–291. [Google Scholar] [CrossRef]
  30. Deng, X.H.; Chen, Y.J.; Bagas, L.; Zhou, H.Y.; Zheng, Z.; Yue, S.W.; Chen, H.J.; Li, H.M.; Tu, J.R.; Cui, Y.R. Cassiterite U-Pb geochronology of the Kekekaerde W-Sn deposit in the Baiganhu ore field, East Kunlun Orogen, NW China: Timing and tectonic setting of mineralization. Ore Geol. Rev. 2018, 100, 534–544. [Google Scholar] [CrossRef]
  31. Li, M.; Fang, X.; Wang, J.; Song, Y.; Yang, Y.; Zhang, W.; Liu, X. Evaporite minerals of the lower 538.5 m sediments in a long core from the Western Qaidam Basin, Tibet. Quat. Int. 2013, 298, 123–133. [Google Scholar] [CrossRef]
  32. Cheng, F.; Jolivet, M.; Guo, Z.; Wang, L.; Zhang, C.; Li, X. Cenozoic evolution of the Qaidam basin and implications for the growth of the northern Tibetan plateau: A review. Earth Sci. Rev. 2021, 220, 103730. [Google Scholar] [CrossRef]
  33. Zhong, S.; Li, S.; Feng, C.; Liu, Y.; Santosh, M.; He, S.; Qu, H.; Liu, G.; Seltmann, R.; Lai, Z.; et al. Porphyry copper and skarn fertility of the northern Qinghai-Tibet Plateau collisional granitoids. Earth Sci. Rev. 2021, 214, 103524. [Google Scholar] [CrossRef]
  34. Wang, B.Z. The Study and Investigation on the Assembly and Coupling Petrotectonic Assemblage During Paleozoic-Mesozoic Period at Qimantage Geological Corridor Domain. Ph.D. Thesis, China University of Geology, Beijing, China, 2011. (In Chinese with English abstract). [Google Scholar]
  35. Xiao, Q.; Yu, G.; Shao, G.; Li, M.; Wang, J. Lateral rheology differences in the lithosphere and dynamics as revealed by magnetotelluric imaging at the Northern Tibetan Plateau. J. Geophys. Res. Solid Earth 2018, 123, 7266–7284. [Google Scholar] [CrossRef]
  36. Booker, J.R. The Magnetotelluric Phase Tensor: A Critical Review. Surv. Geophys. 2013, 35, 7–40. [Google Scholar] [CrossRef]
  37. Jóźwiak, W.; Nowożyński, K.; Mazur, S.; Jeż, M. Deep Electrical Resistivity Structure of the European Lithosphere in Poland Derived from 3-D Inversion of Magnetotelluric Data. Surv. Geophys. 2022, 43, 1563–1586. [Google Scholar] [CrossRef]
  38. He, L.; Chen, L.; Dorji; He, Z.; Wang, X.; Xiao, B.; Xu, L.; Zhao, X.; Xi, X.; Chen, R.; et al. Mapping chromite deposits with audio magnetotellurics in the Luobusa ophiolite of southern Tibet. Geophysics 2018, 83, B47–B57. [Google Scholar] [CrossRef]
  39. Garcia, X.; Julià, J.; Nemocón, A.M.; Neukirch, M. Lithospheric thinning under the Araripe Basin (NE Brazil) from a long-period magnetotelluric survey: Constraints for tectonic inversion. Gondwana Res. 2019, 68, 174–184. [Google Scholar] [CrossRef]
  40. Di, Q.; Fu, C.; An, Z.G.; Xu, C.; Wang, Y.; Wang, Z. Field testing of the surface electromagnetic prospecting system. Appl. Geophys. 2017, 14, 449–458. [Google Scholar] [CrossRef]
  41. Di, Q.; Xue, G.; Wang, Z.; He, L.; Pei, R.; Zhang, T.; Fang, G. Lithospheric structures across the Qiman Tagh and western Qaidam Basin revealed by magnetotelluric data collected using a self-developed SEP system. Sci. China Earth Sci. 2021, 64, 1813–1820. [Google Scholar] [CrossRef]
  42. Bostick, F.X. A simple almost exact method of MT analysis, Workshop on electrical methods in geothermal exploration. US Geol. Surv. 1977, 359, 174–183. [Google Scholar]
  43. Wang, X.; He, L.; Chen, L.; Xu, L.; Li, J.; Lei, X.; Wei, D. Mapping deeply buried karst cavities using controlled-source audio magnetotellurics: A case history of a tunnel investigation in southwest China. Geophysics 2017, 82, EN1–EN11. [Google Scholar] [CrossRef]
  44. Torres-Verdin, C.; Bostick, F.X. Principles of spatial surface electric field filtering in magnetotellurics: Electromagnetic array profiling (EMAP). Geophysics 1992, 57, 603–622. [Google Scholar] [CrossRef]
  45. Rodi, W.; Mackie, R.L. Nonlinear conjugate gradients algorithm for 2-D magnetotelluric inversion. Geophysics 2001, 66, 174–187. [Google Scholar] [CrossRef]
  46. Calderón-Moctezuma, A.; Gomez-Treviño, E.; Yutsis, V.; Guevara-Betancourt, R.; Gómez-Ávila, M. How close can we get to the classical magnetotelluric sounding? J. Appl. Geophys. 2022, 203, 104665. [Google Scholar] [CrossRef]
  47. Yu, M. Metallogenic Mechanism of the Galinge Polymetallic Iron Skarn Deposit, Qiman Tagh Mountains, Qinghai Province; Springer: Singapore, 2019; pp. 235–248. [Google Scholar]
  48. Liu, B.; Wang, W.; Yao, B.; Wang, Z.; Chen, H. Analysis and study of characteristics of 2d electrical structure in kumukuli basin in Xinjiang. Chin. J. Eng. Geophys. 2014, 11, 1–6, (In Chinese with English abstract). [Google Scholar]
  49. Hou, Z.; Wang, Q.; Zhang, H.; Yu, N.; Wang, R.; Groves, D.; Zheng, Y.; Han, S.; Gao, L.; Yang, L. Lithosphere architecture characterized by crust-mantle decoupling controls the formation of orogenic gold deposits. Natl. Sci. Rev. 2022, 2022, nwac257. [Google Scholar] [CrossRef]
  50. Yu, N.; Wang, E.; Wang, X.; Kong, W.; Li, D.; Li, R. The Influence of the Ailaoshan-Red River Shear Zone on the Mineralization of the Beiya Deposit on the Southeastern Margin of the Tibetan Plateau Revealed by a 3-D Magnetotelluric Survey. J. Geophys. Res. Solid Earth 2022, 127, e2021JB022923. [Google Scholar] [CrossRef]
Figure 1. Tectonic setting of the East Kunlun Oregon and Qimantagh Metallogenic Belt [10,11]. (a) shows the location, (b) is tectonic map showing tectonic division, ophiolite, subduction- and collision-related metamorphic and magmatic units; inset section A-B is the schematic section of main tectonic units across the East Kunlun Orogen. QXM: Qimantagh–Xiangride mélange zone, AKM: Aqikekulehu–Kunzhong mélange zone, MBAM: Muztagh–Buqingshan–Anemaqen ophiolitic mélange zone [10].
Minerals 13 00225 g001
Figure 3. Typical apparent resistivity curves of the study area. Detailed captions are in the text.
Minerals 13 00225 g003
Disclaimer/Publisher’s Note: The statements, opinions and data contained in all publications are solely those of the individual author(s) and contributor(s) and not of MDPI and/or the editor(s). MDPI and/or the editor(s) disclaim responsibility for any injury to people or property resulting from any ideas, methods, instructions or products referred to in the content.

