
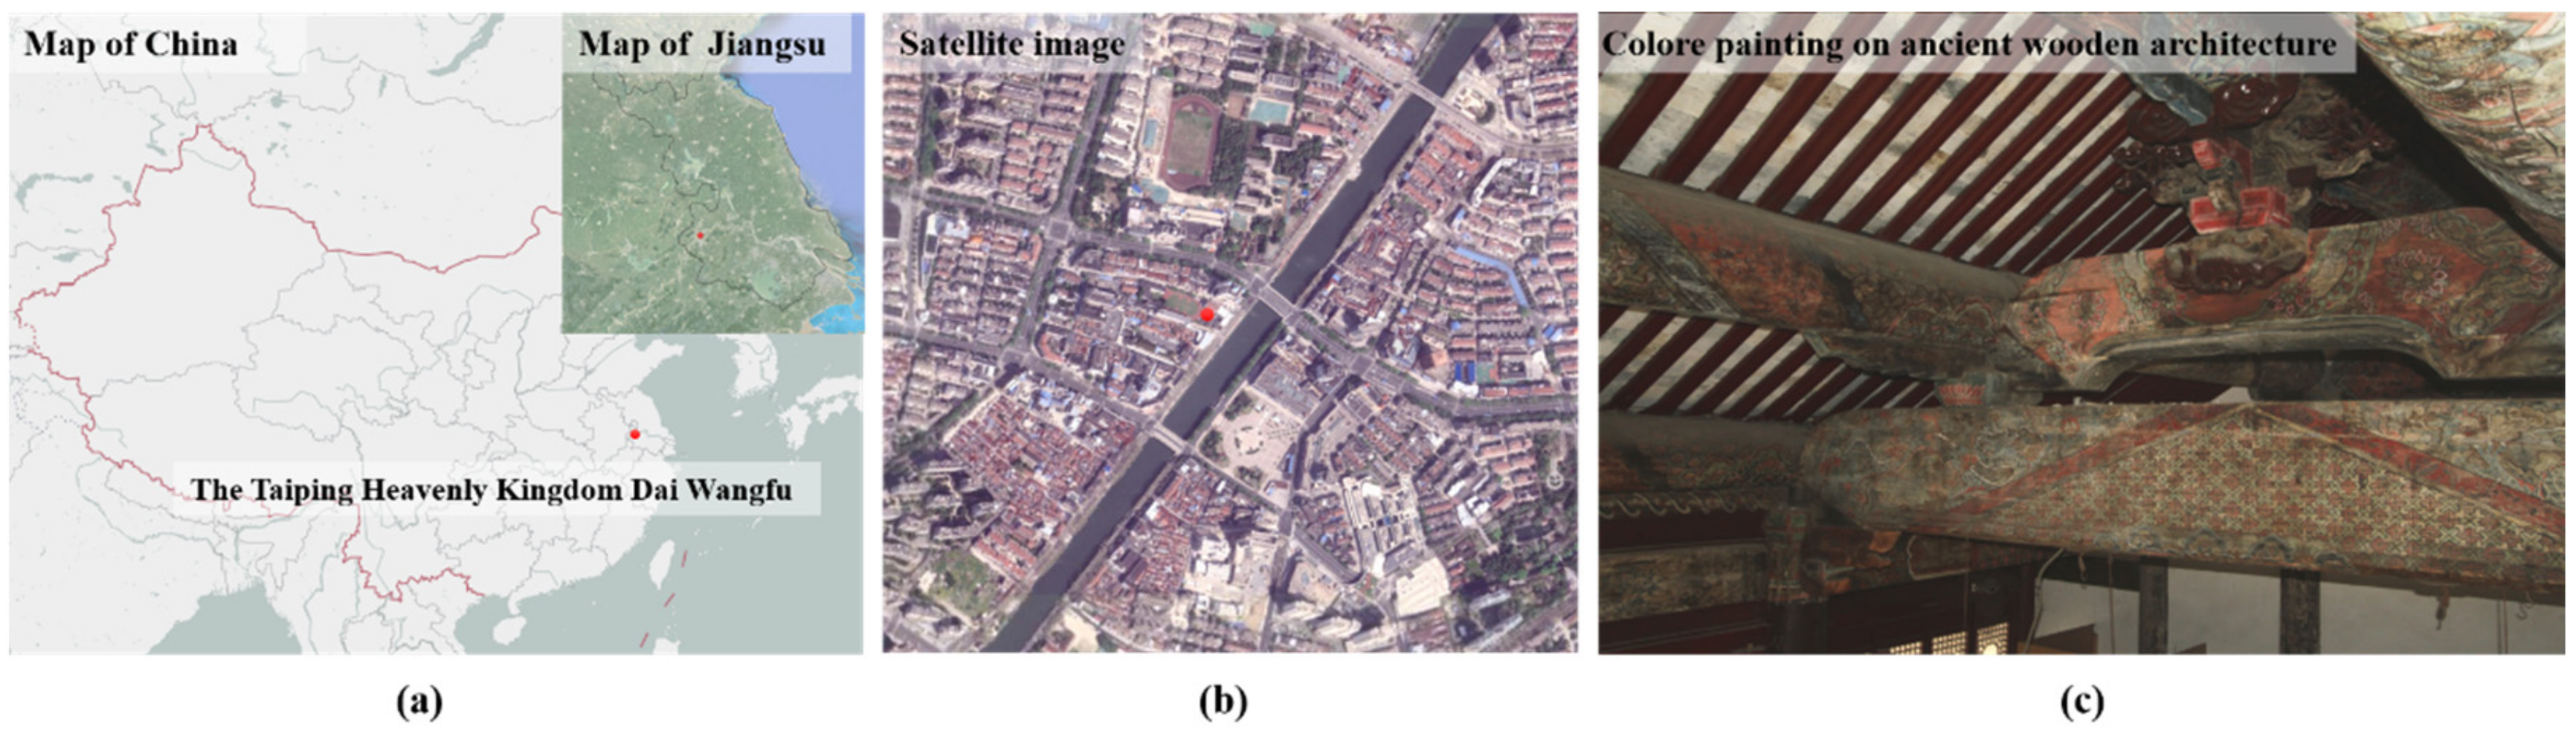
Spectroscopic Investigation of a Color Painting on an Ancient Wooden Architecture from the Taiping Heavenly Kingdom Prince Dai’s Mansion in Jiangsu, China
 and
and 
Abstract
:1. Introduction

| Color | Date (Century) | Pigments | Sample | Techniques | Literature |
|---|---|---|---|---|---|
| Red | 9th | Cinnabar (HgS) | Foguang Temple Hall | SEM-EDX, Raman, FI-IR | Fu et al. (2015) [20] |
| 15th | Longju Temple | SEM-EDS, Raman | Chen et al. (2019) [18] | ||
| 16th | Dagaoxuan Temple | SEM-EDS, Raman, PLM | Lei et al. (2017) [21] | ||
| 16th | Yanxi Hall | SEM-EDS, Raman | Liu et al. (2018) [22] | ||
| 9th | Red lead (Pb3O4) | Foguang Temple Hall | SEM-EDX, Raman, FI-IR | Fu et al. (2015) [20] | |
| 18th | Altar of Agriculture | Raman, ED-XRF | Li et al. (2021) [23] | ||
| 16th | Hematite (α-Fe2O3) | Dagaoxuan Temple | SEM-EDS, Raman, PLM | Lei et al. (2017) [21] | |
| 16th | Yanxi Hall | SEM-EDS, Raman | Liu et al. (2018) [22] | ||
| Green | 15th | Emerald [Cu(CH3COO)·3Cu(AsO2)2] | building in the Jiangxue Palace | EDX, Raman, PLM | Fu et al. (2020) [24] |
| 15th | Wuying Hall of the Imperial Palace | EDX, m-RS | Shen et al. (2006) [25] | ||
| 16th | Dagaoxuan Temple | SEM-EDS, Raman, PLM | Lei et al. (2017) [21] | ||
| 19th | Summer Palace | SEM-EDS, XRD | Ma et al. (2019) [26] | ||
| 9th | Atacamite [Cu2(OH)3Cl] | Foguang Temple Hall | SEM-EDX, Raman, FI-IR | Fu et al. (2015) [20] | |
| 15th | Longju Temple | SEM-EDS, Raman | Chen et al. (2019) [18] | ||
| 16th | Yanxi Hall | SEM-EDS, Raman | Liu et al. (2018) [22] | ||
| 18th | Altar of Agriculture | Raman, ED-XRF | Li et al. (2021) [23] | ||
| White | 15th | Lead white [2PbCO3·Pb(OH)2] | building in the Jiangxue Palace | SEM-EDS, Raman, PLM | Fu et al. (2020) [24] |
| 18th | Altar of Agriculture | Raman, ED-XRF | Li et al. (2021) [23] | ||
| 15th | Chalk (CaCO3) | Wuying Hall of the Imperial Palace | EDX, m-RS | Shen et al. (2006) [25] | |
| 16th | Hydrocerussite [2PbCO3·Pb(OH)2·H2O] | Dagaoxuan Temple | SEM-EDS, Raman, PLM | Lei et al. (2017) [21] | |
| 16th | Gypsum (CaSO4) | Dagaoxuan Temple | SEM-EDS, Raman, PLM | Lei et al. (2017) [21] | |
| 9th | Kaolinite [Al2Si2O5(OH)4] | Foguang Temple Hall | SEM-EDX, Raman, FI-IR | Fu et al. (2015) [20] | |
| Blue | 15th | Ultramarine [(Na,Ca)8(AlSiO4)6(SCl)2] | Wuying Hall of the Imperial Palace | EDX, m-RS | Shen et al. (2006) [25] |
| 16th | Dagaoxuan Temple | SEM-EDS, Raman, PLM | Lei et al. (2017) [21] | ||
| 16th | Yanxi Hall | SEM-EDS, Raman | Liu et al. (2018) [22] | ||
| 19th | Summer Palace | SEM-EDS, EDS, XRD | Ma et al. (2019) [26] | ||
| 9th | Azurite [2CuCO3.Cu(OH)3] | Foguang Temple Hall | SEM-EDX, Raman, FI-IR | Fu et al. (2015) [20] | |
| 15th | Longju Temple | SEM-EDS, Raman | Chen et al. (2019) [18] | ||
| 16th | Yanxi Hall | SEM-EDS, Raman | Liu et al. (2018) [22] | ||
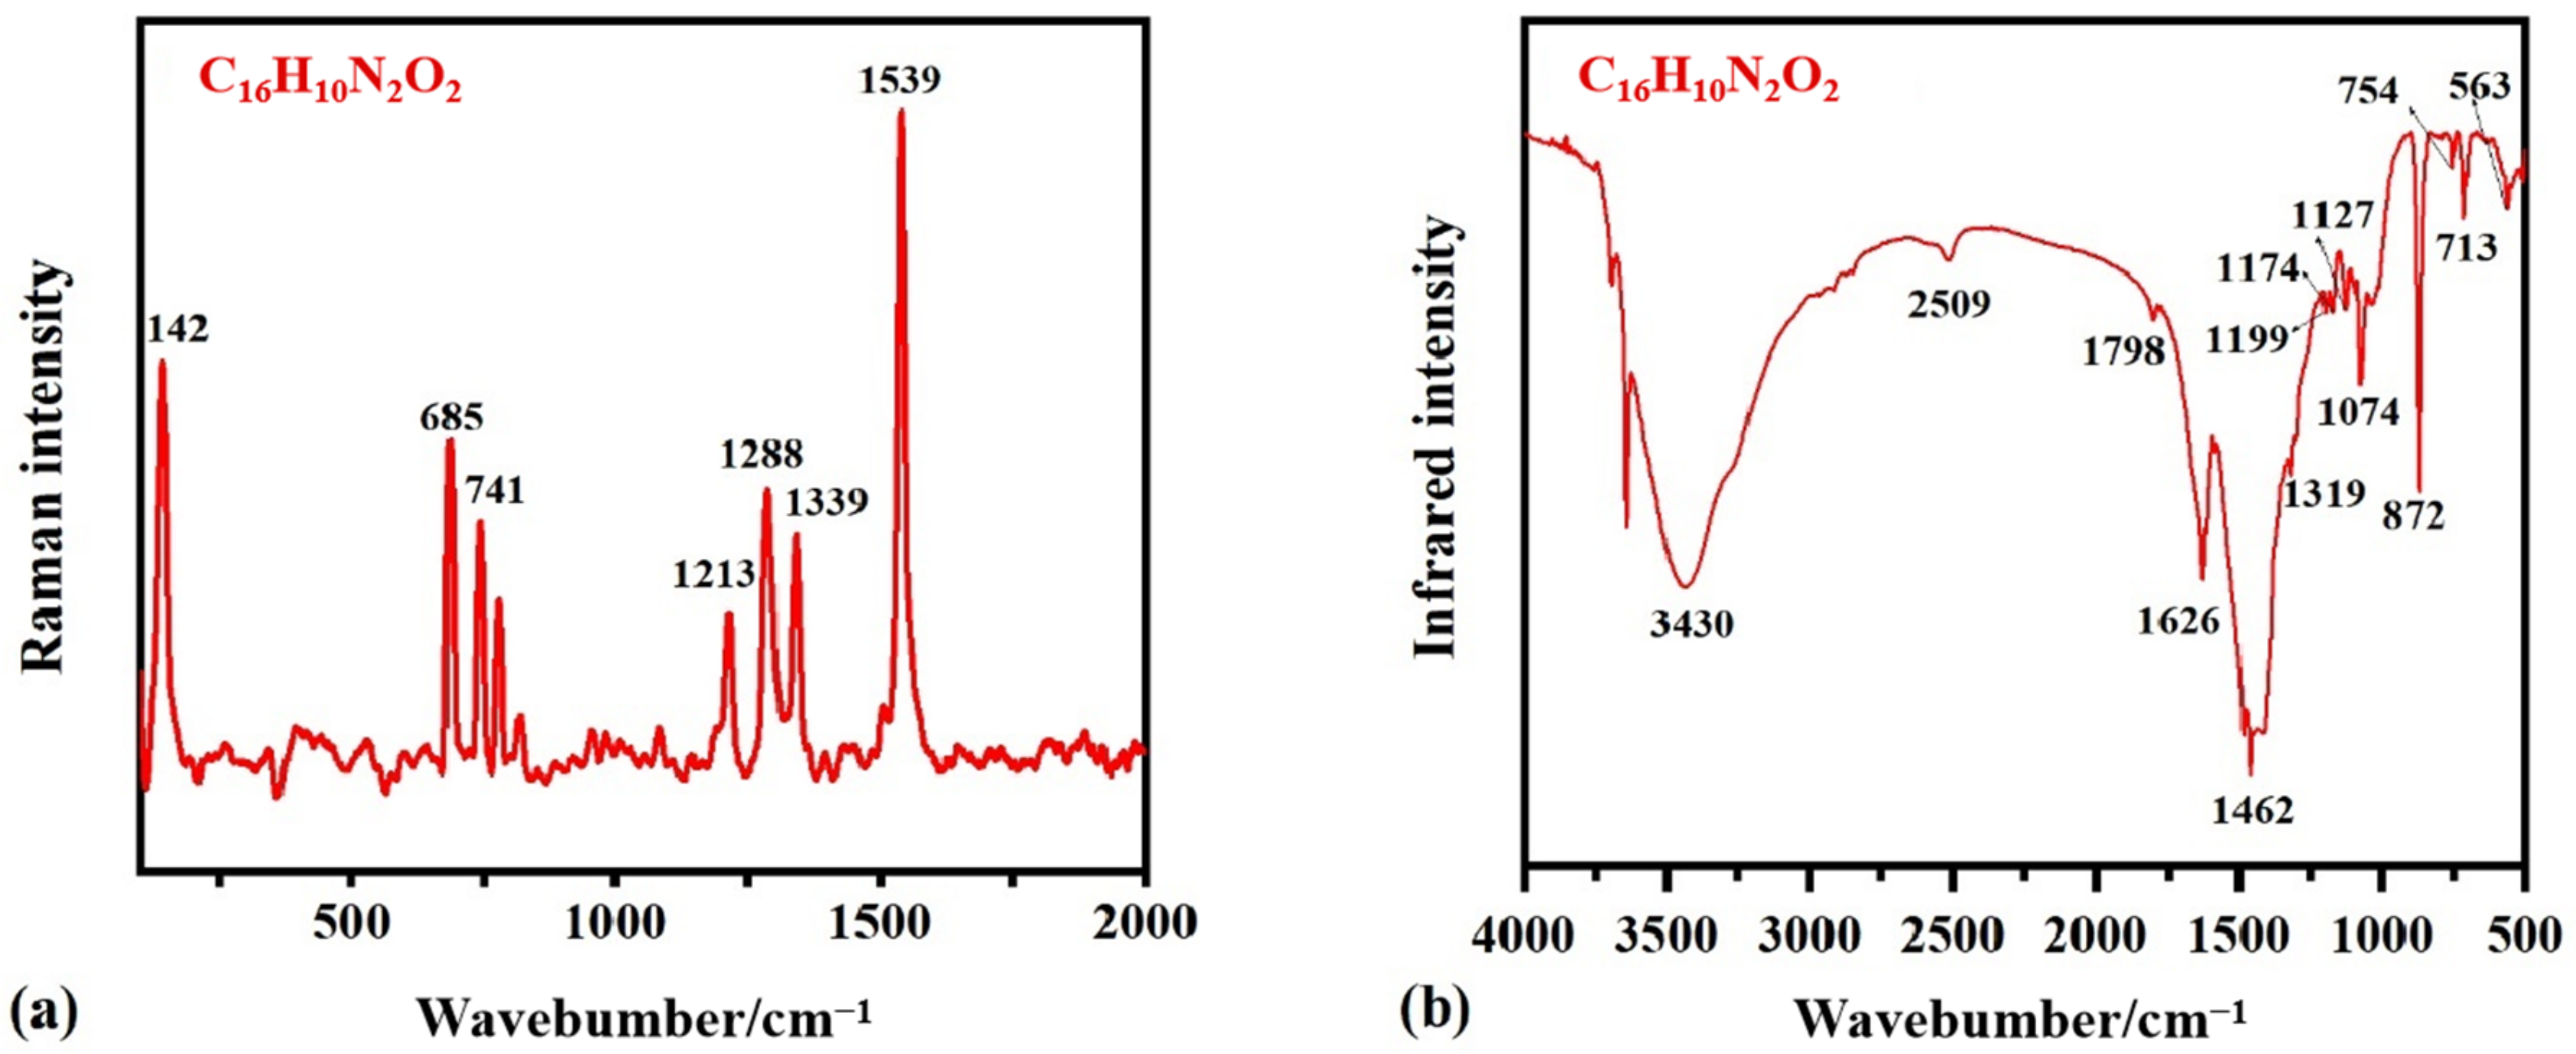
| 18th | Indigo [C16H10N2O2] | Altar of Agriculture | Raman, ED-XRF | Li et al. (2021) [23] | |
| 18th | Temple of Confucius | Raman | Li (2015) [27] | ||
| Black | 15th | Graphite (C) | Wuying Hall of the Imperial Palace | EDX, m-RS | Shen et al. (2006) [25] |
| 15th | Longju temple | SEM-EDS, Raman | Chen et al. (2019) [18] | ||
| 16th | Dagaoxuan Temple | SEM-EDS, Raman, PLM | Lei et al. (2017) [21] | ||
| 18th | Altar of Agriculture | Raman, ED-XRF | Li et al. (2021) [23] | ||
| Yellow | 18th | Litharge (γ-PbO) | Altar of Agriculture | Raman, ED-XRF | Li et al. (2021) [23] |
| 16th | Chrome (PbCrO4) | Dagaoxuan Temple | SEM-EDS, Raman, PLM | Lei et al. (2017) [21] | |
| 18th | Altar of Agriculture | Raman, ED-XRF | Li et al. (2021) [23] | ||
| 16th | Realgar (As4S4) | Dagaoxuan Temple | SEM-EDS, Raman, PLM | Lei et al. (2017) [21] | |
| 16th | Orpiment (As2S3) | Dagaoxuan Temple | SEM-EDS, Raman, PLM | Lei et al. (2017) [21] |
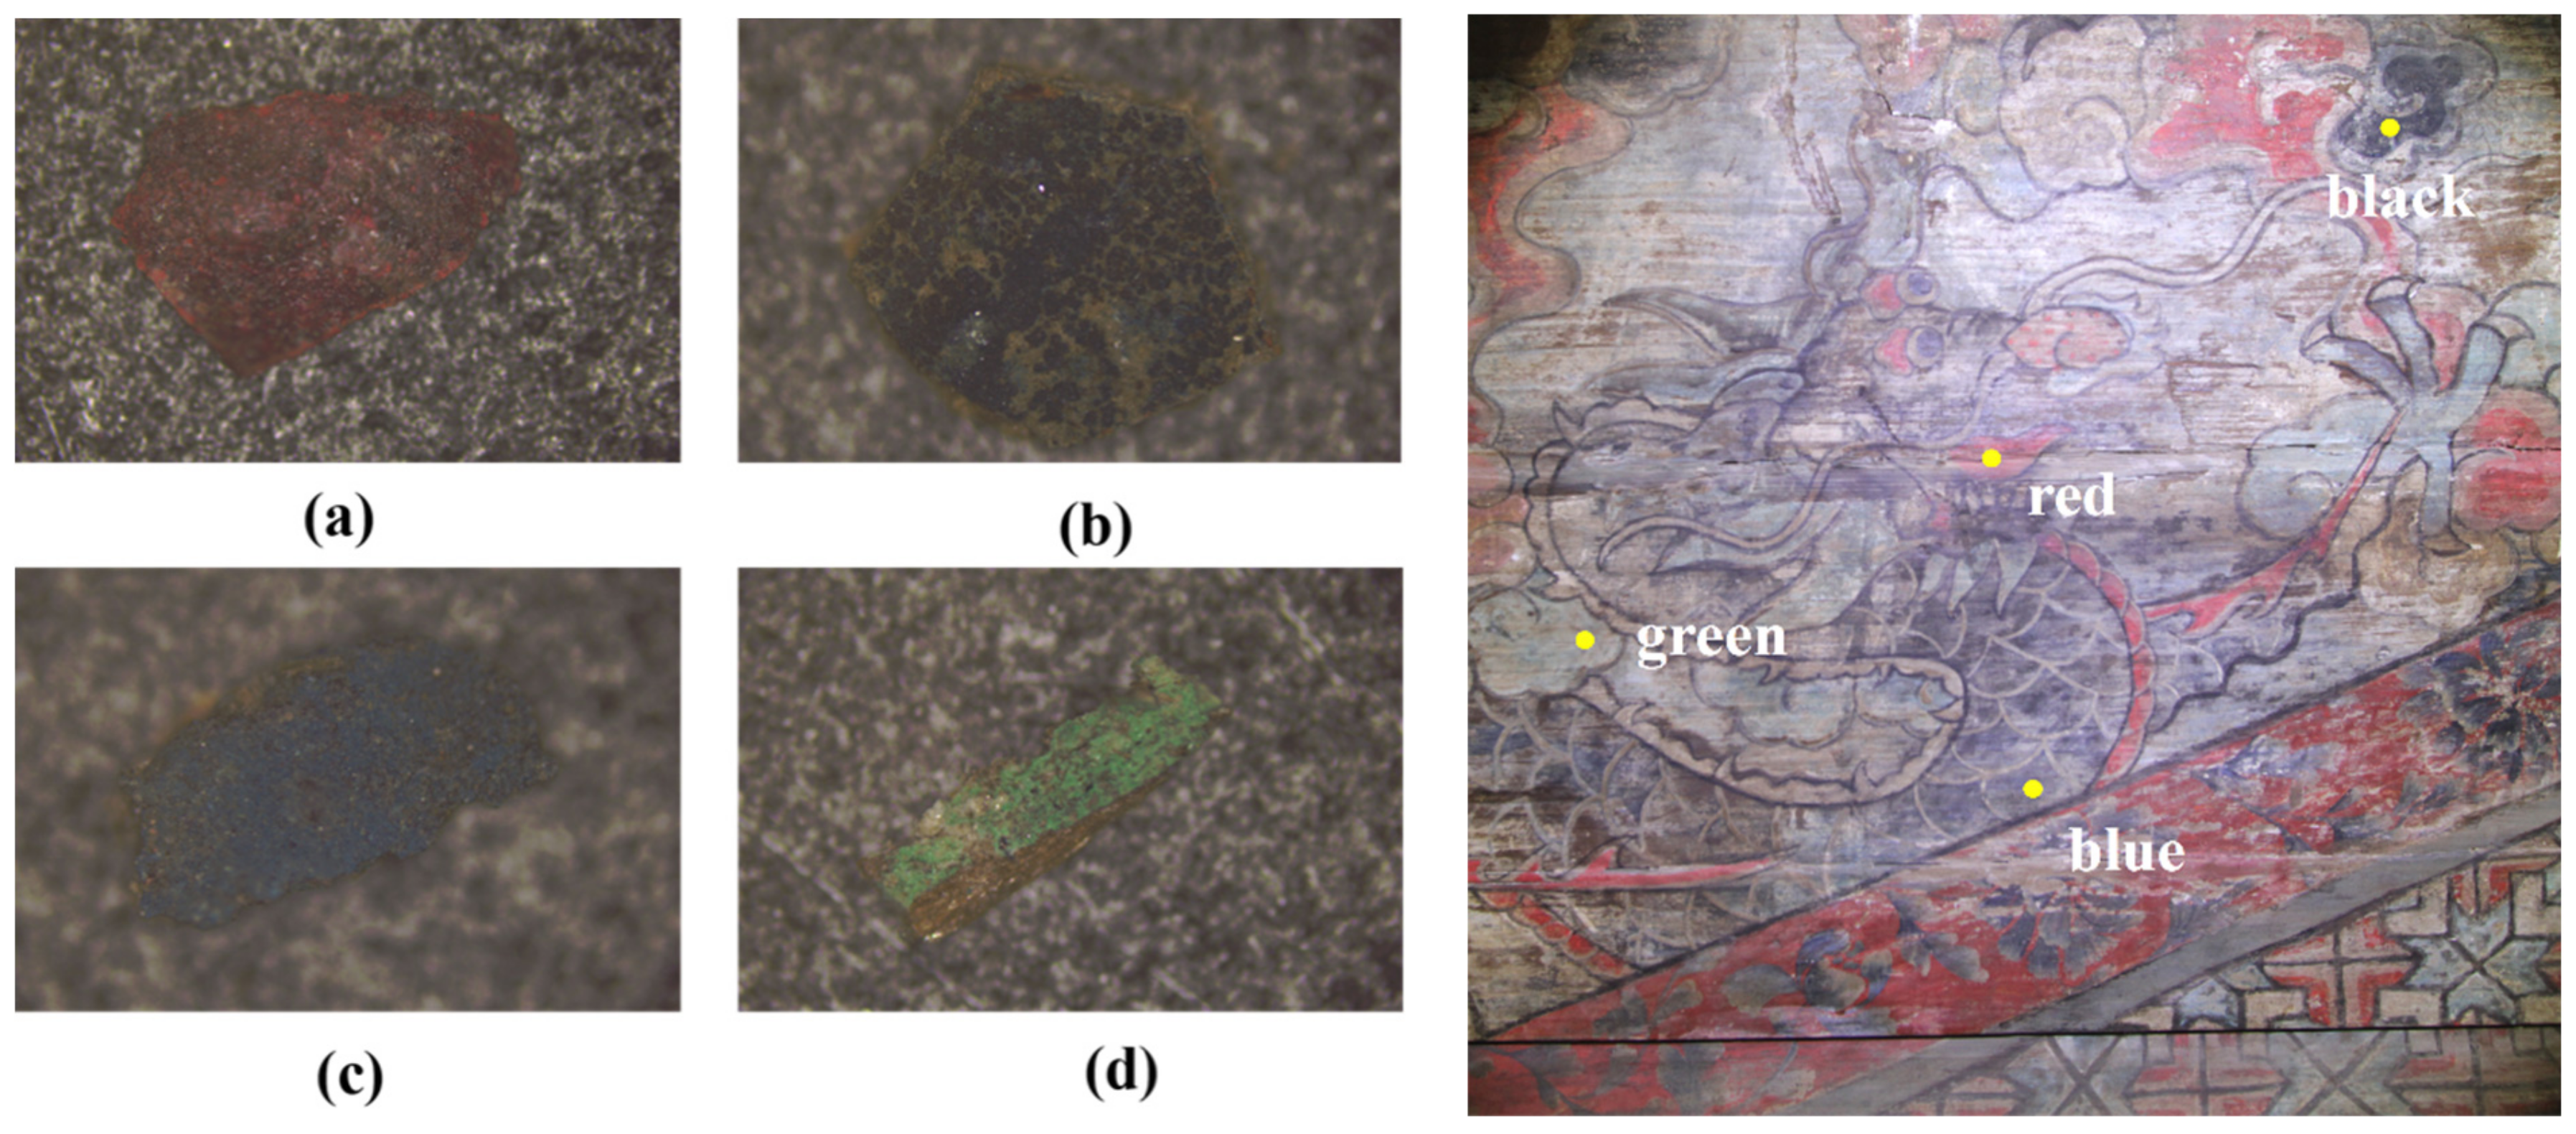
2. Materials
3. Experimental Methods and Instrumentation
3.1. Energy Dispersive Spectrometry (EDS)
3.2. Micro-Raman Spectroscopy (m-RS)
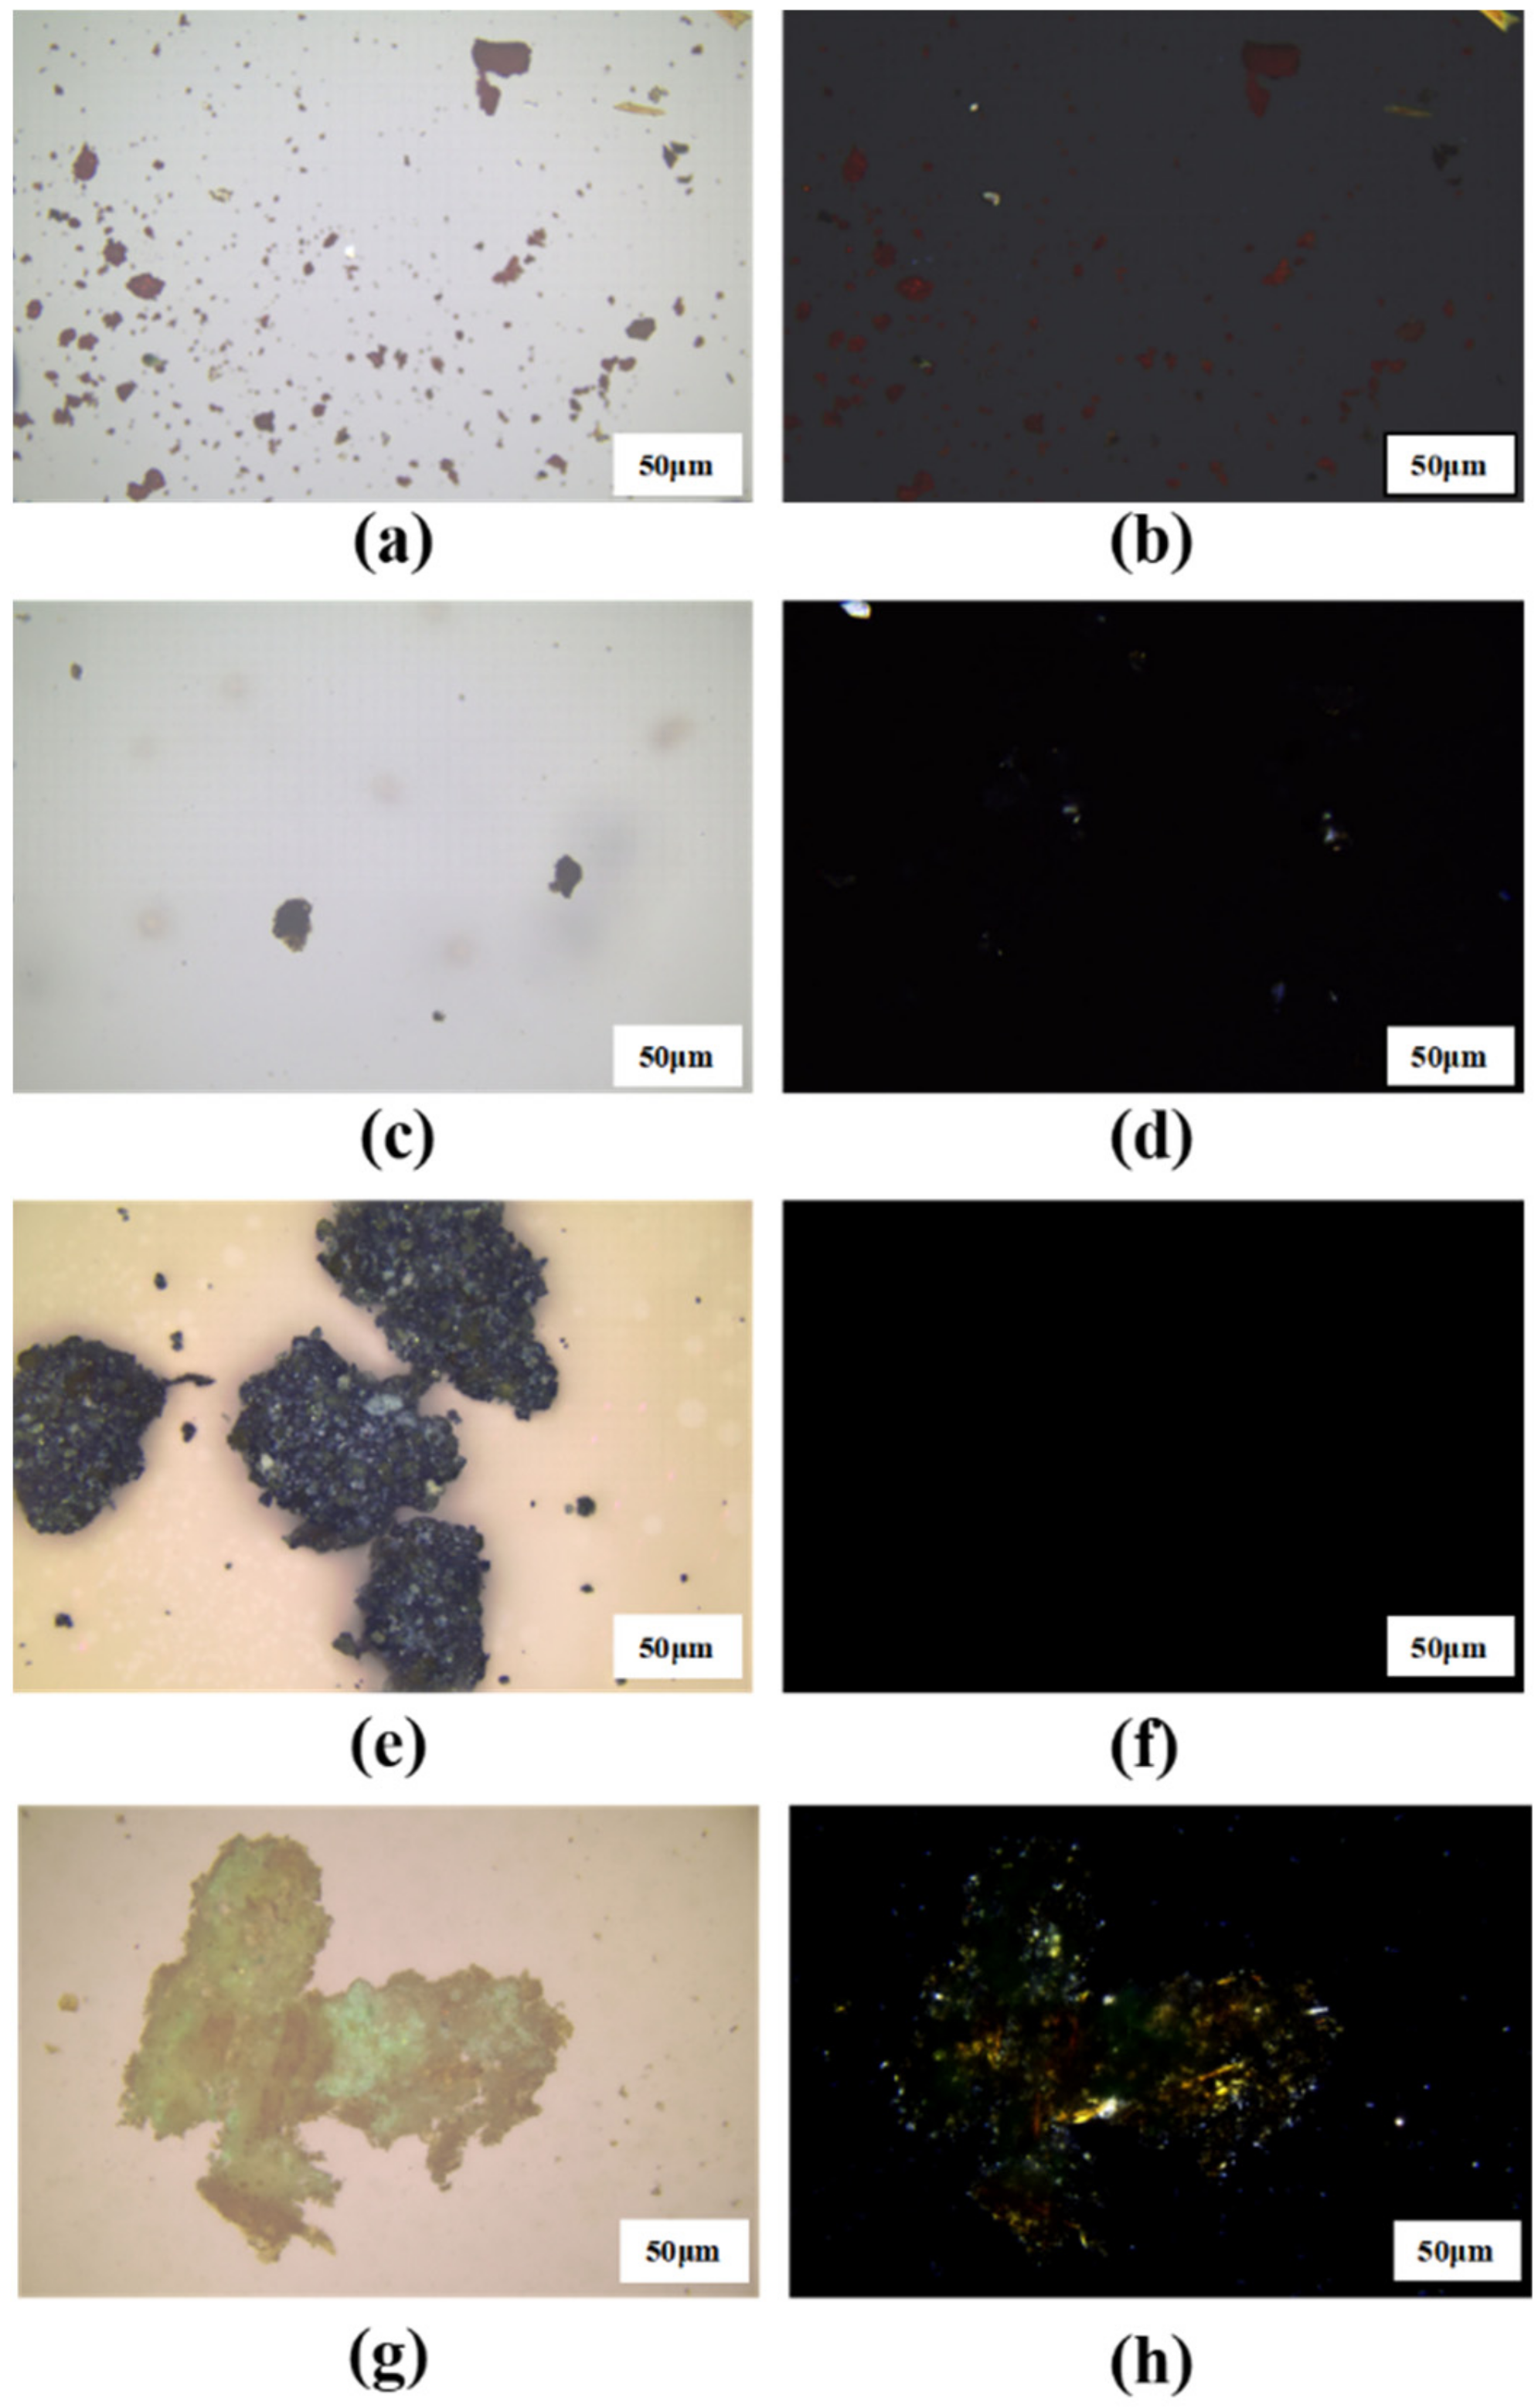
3.3. Polarized Light Microscopy (PLM)
3.4. Fourier-Transform Infrared Spectroscopy (FT-IR)
3.5. Pyrolysis-Gas Chromatography/Mass Spectrometry (Py-GC/MS)
4. Results and Discussion
4.1. Pigments
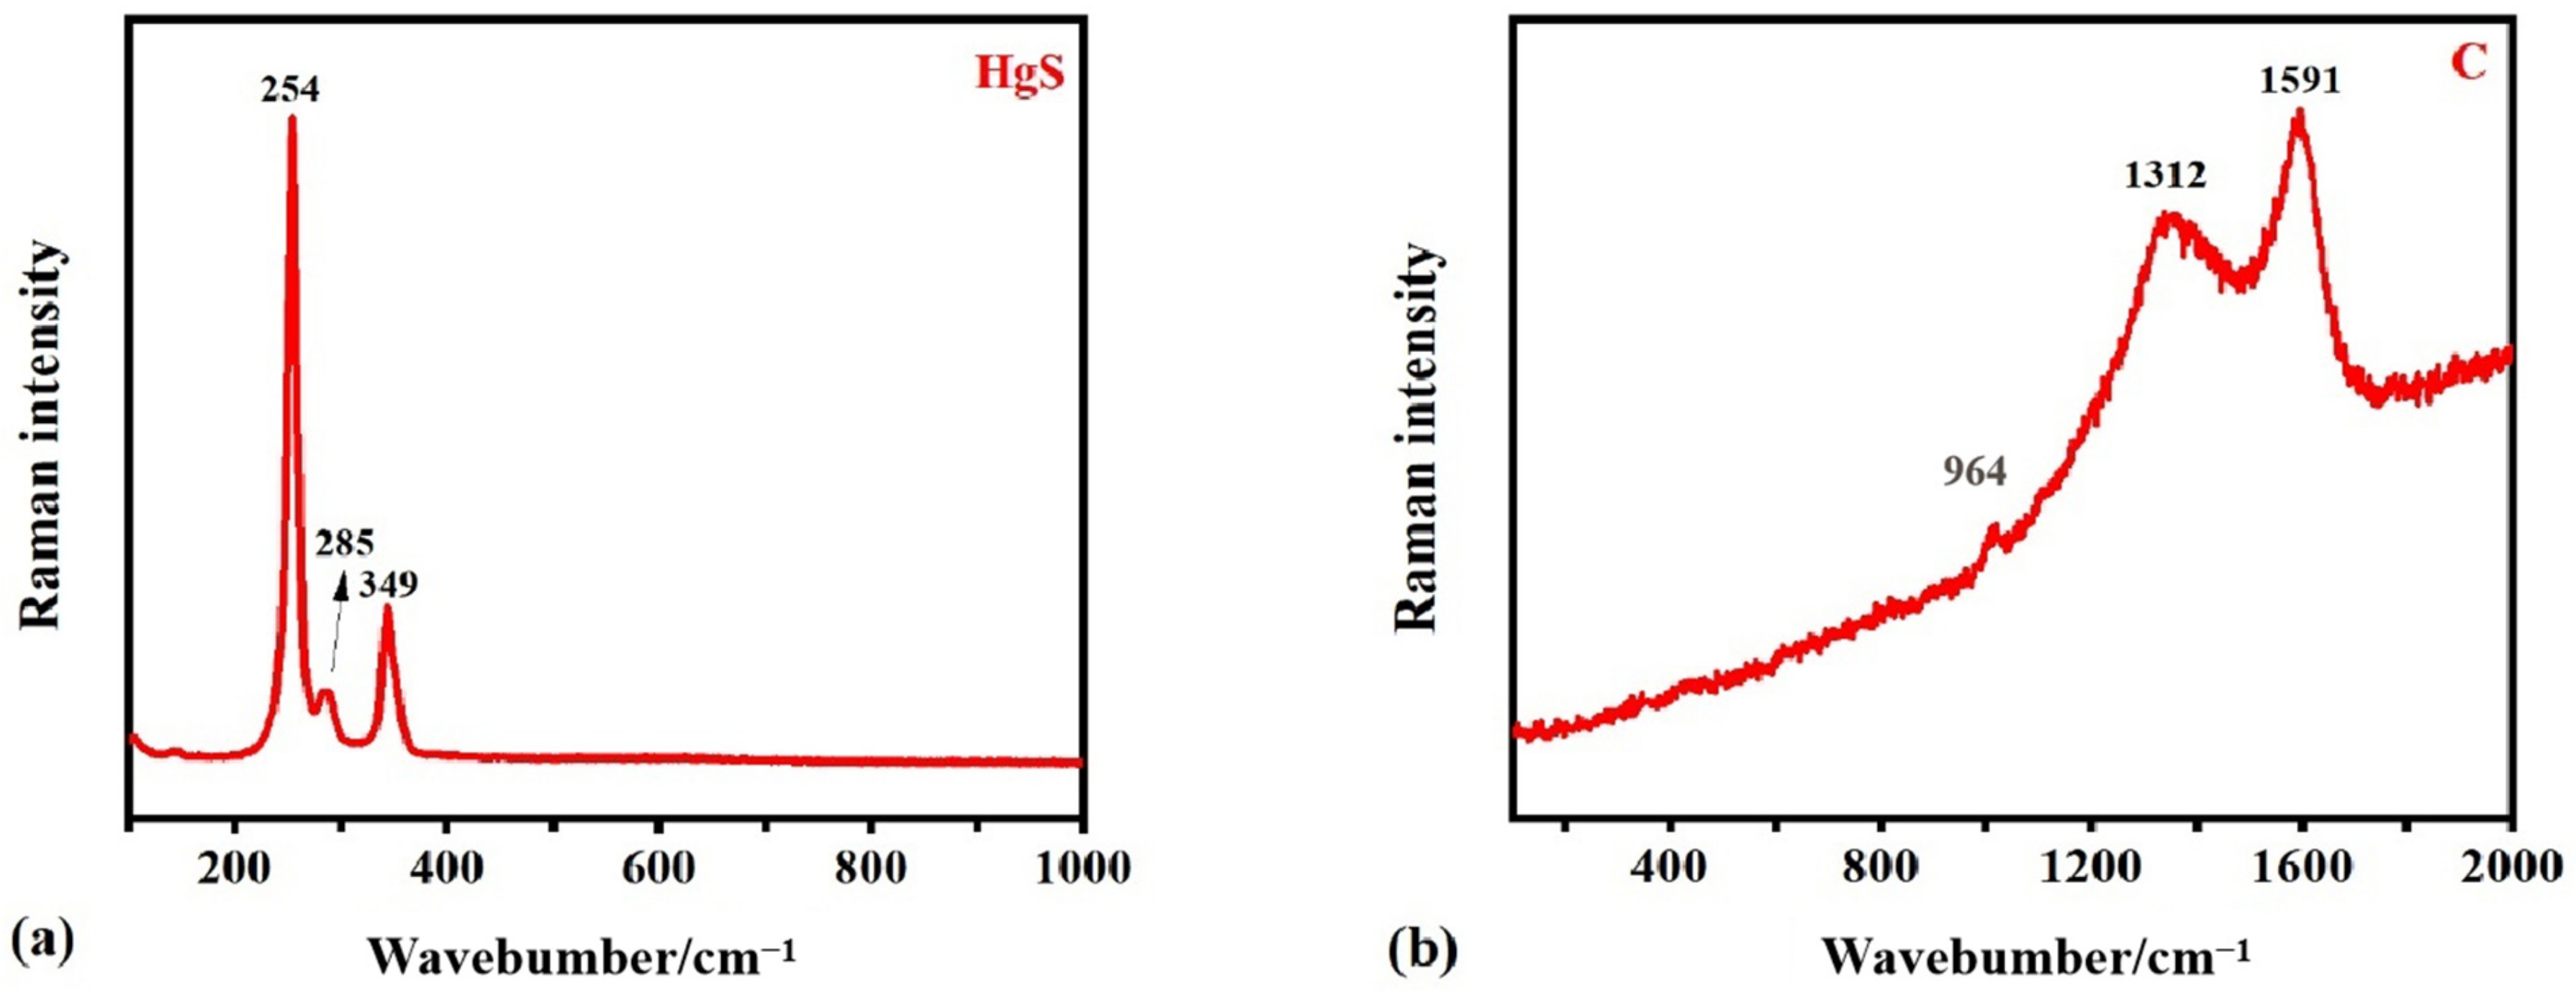
4.1.1. Red
4.1.2. Black
4.1.3. Blue
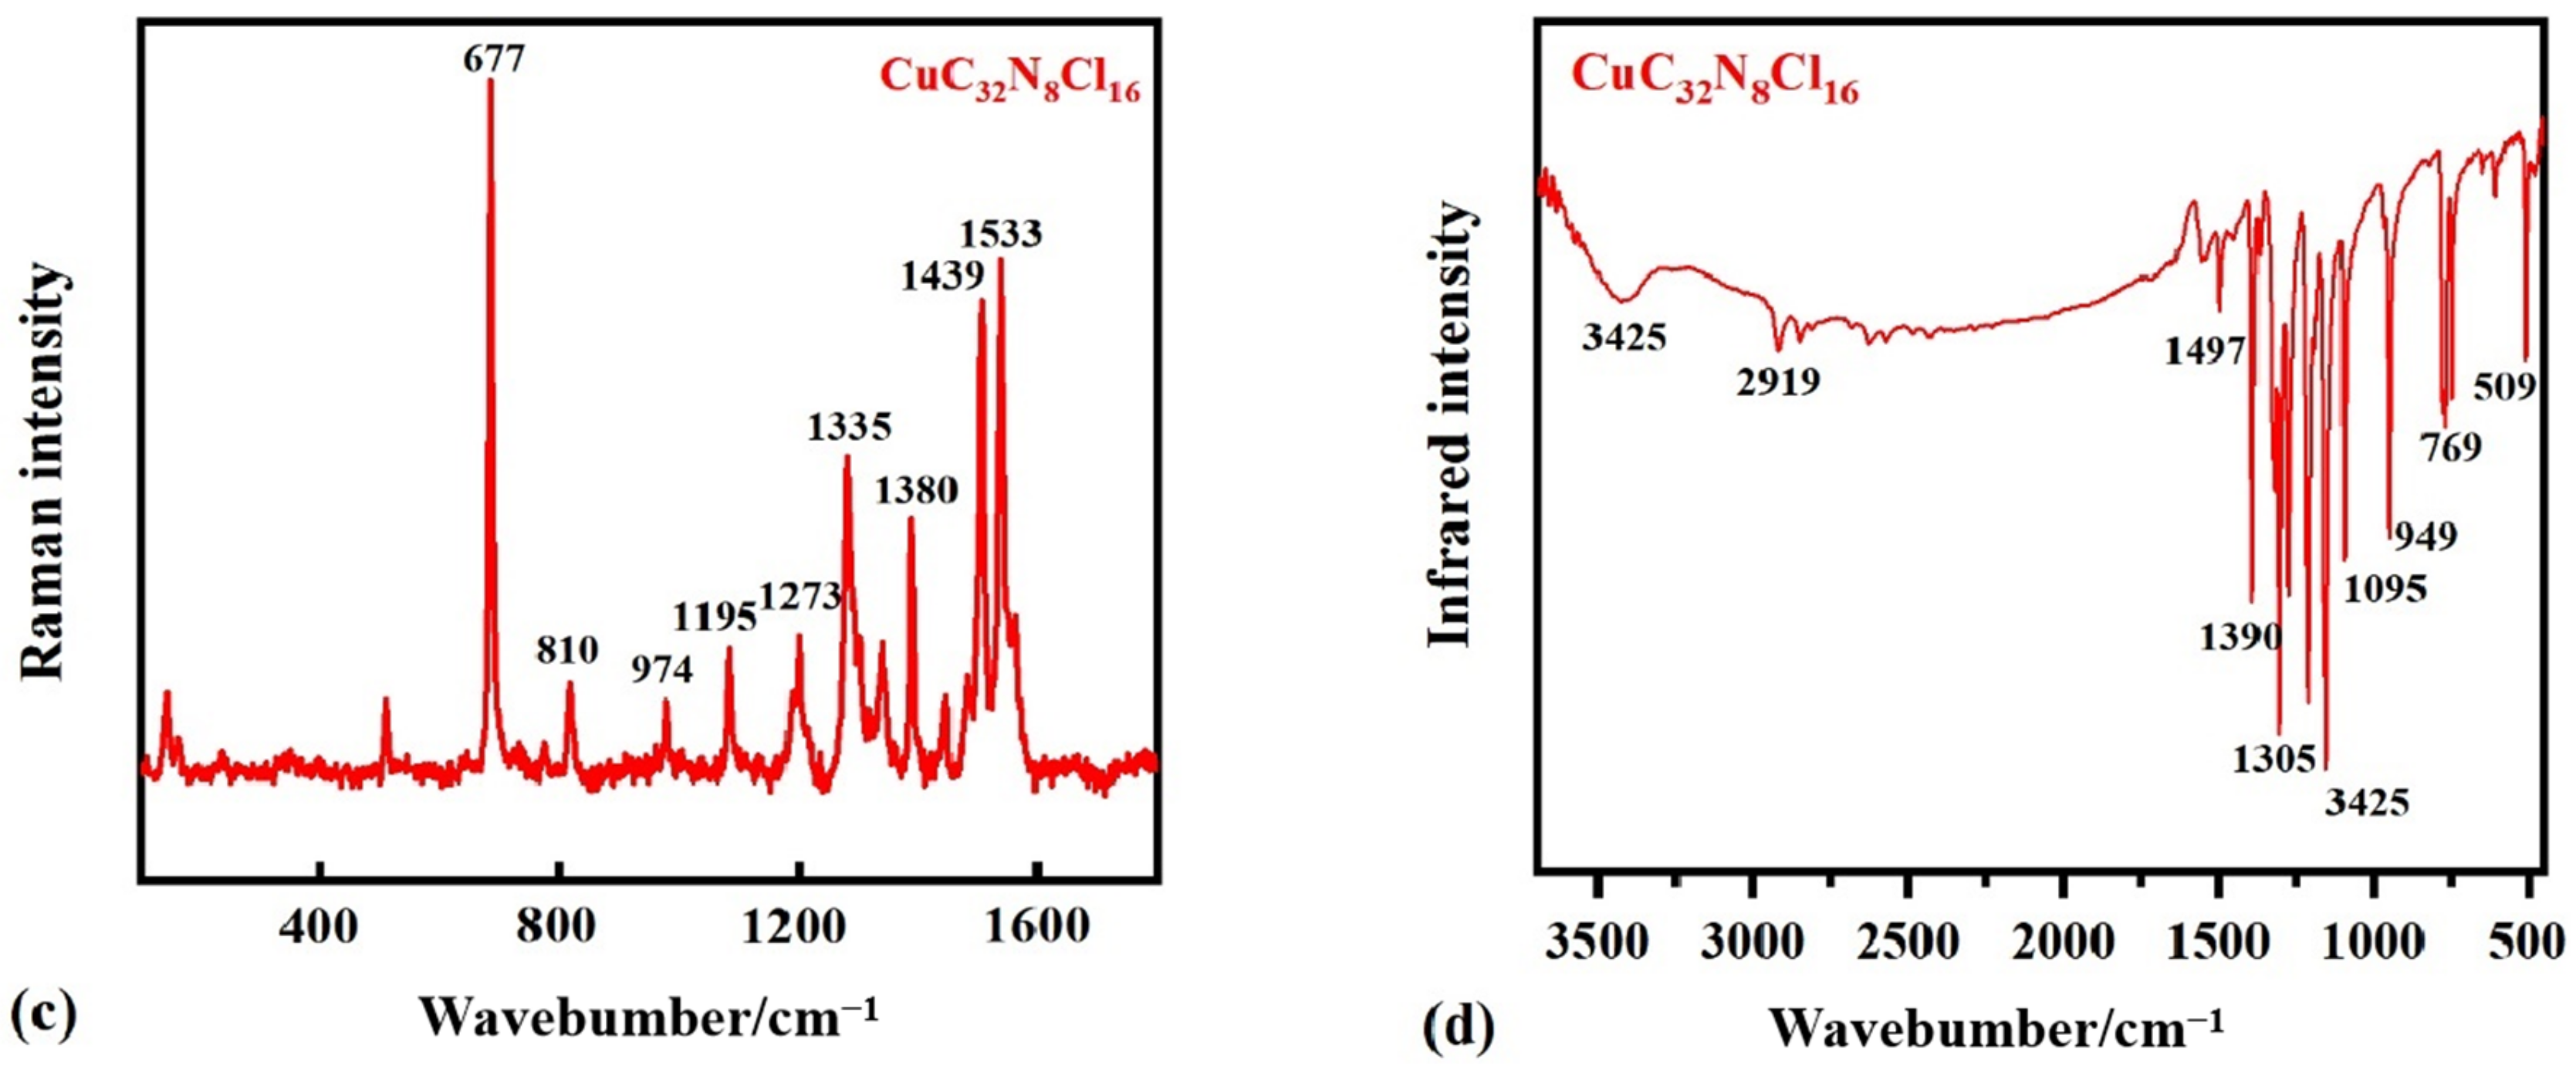
4.1.4. Green
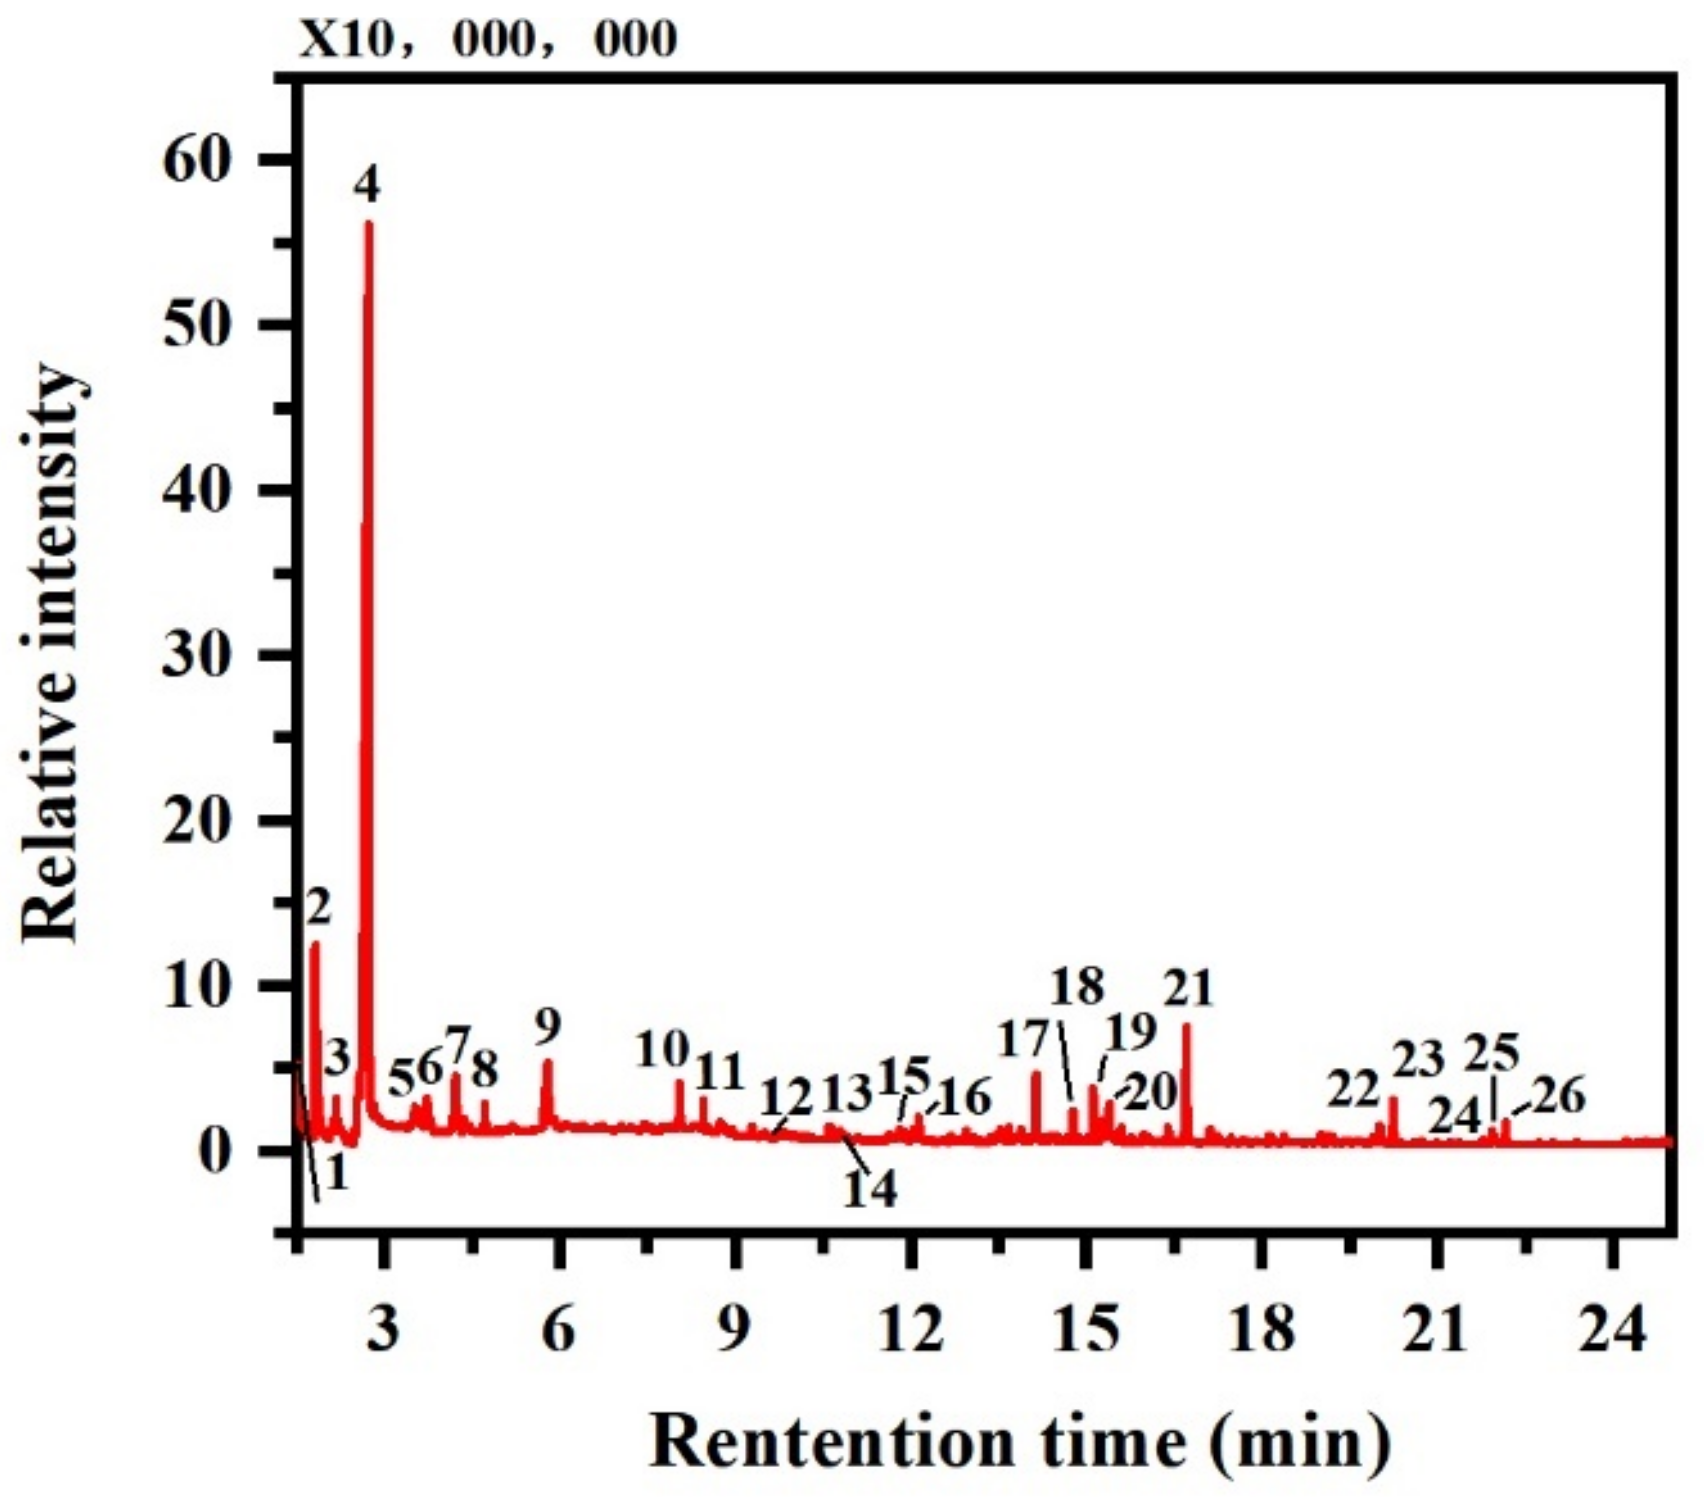
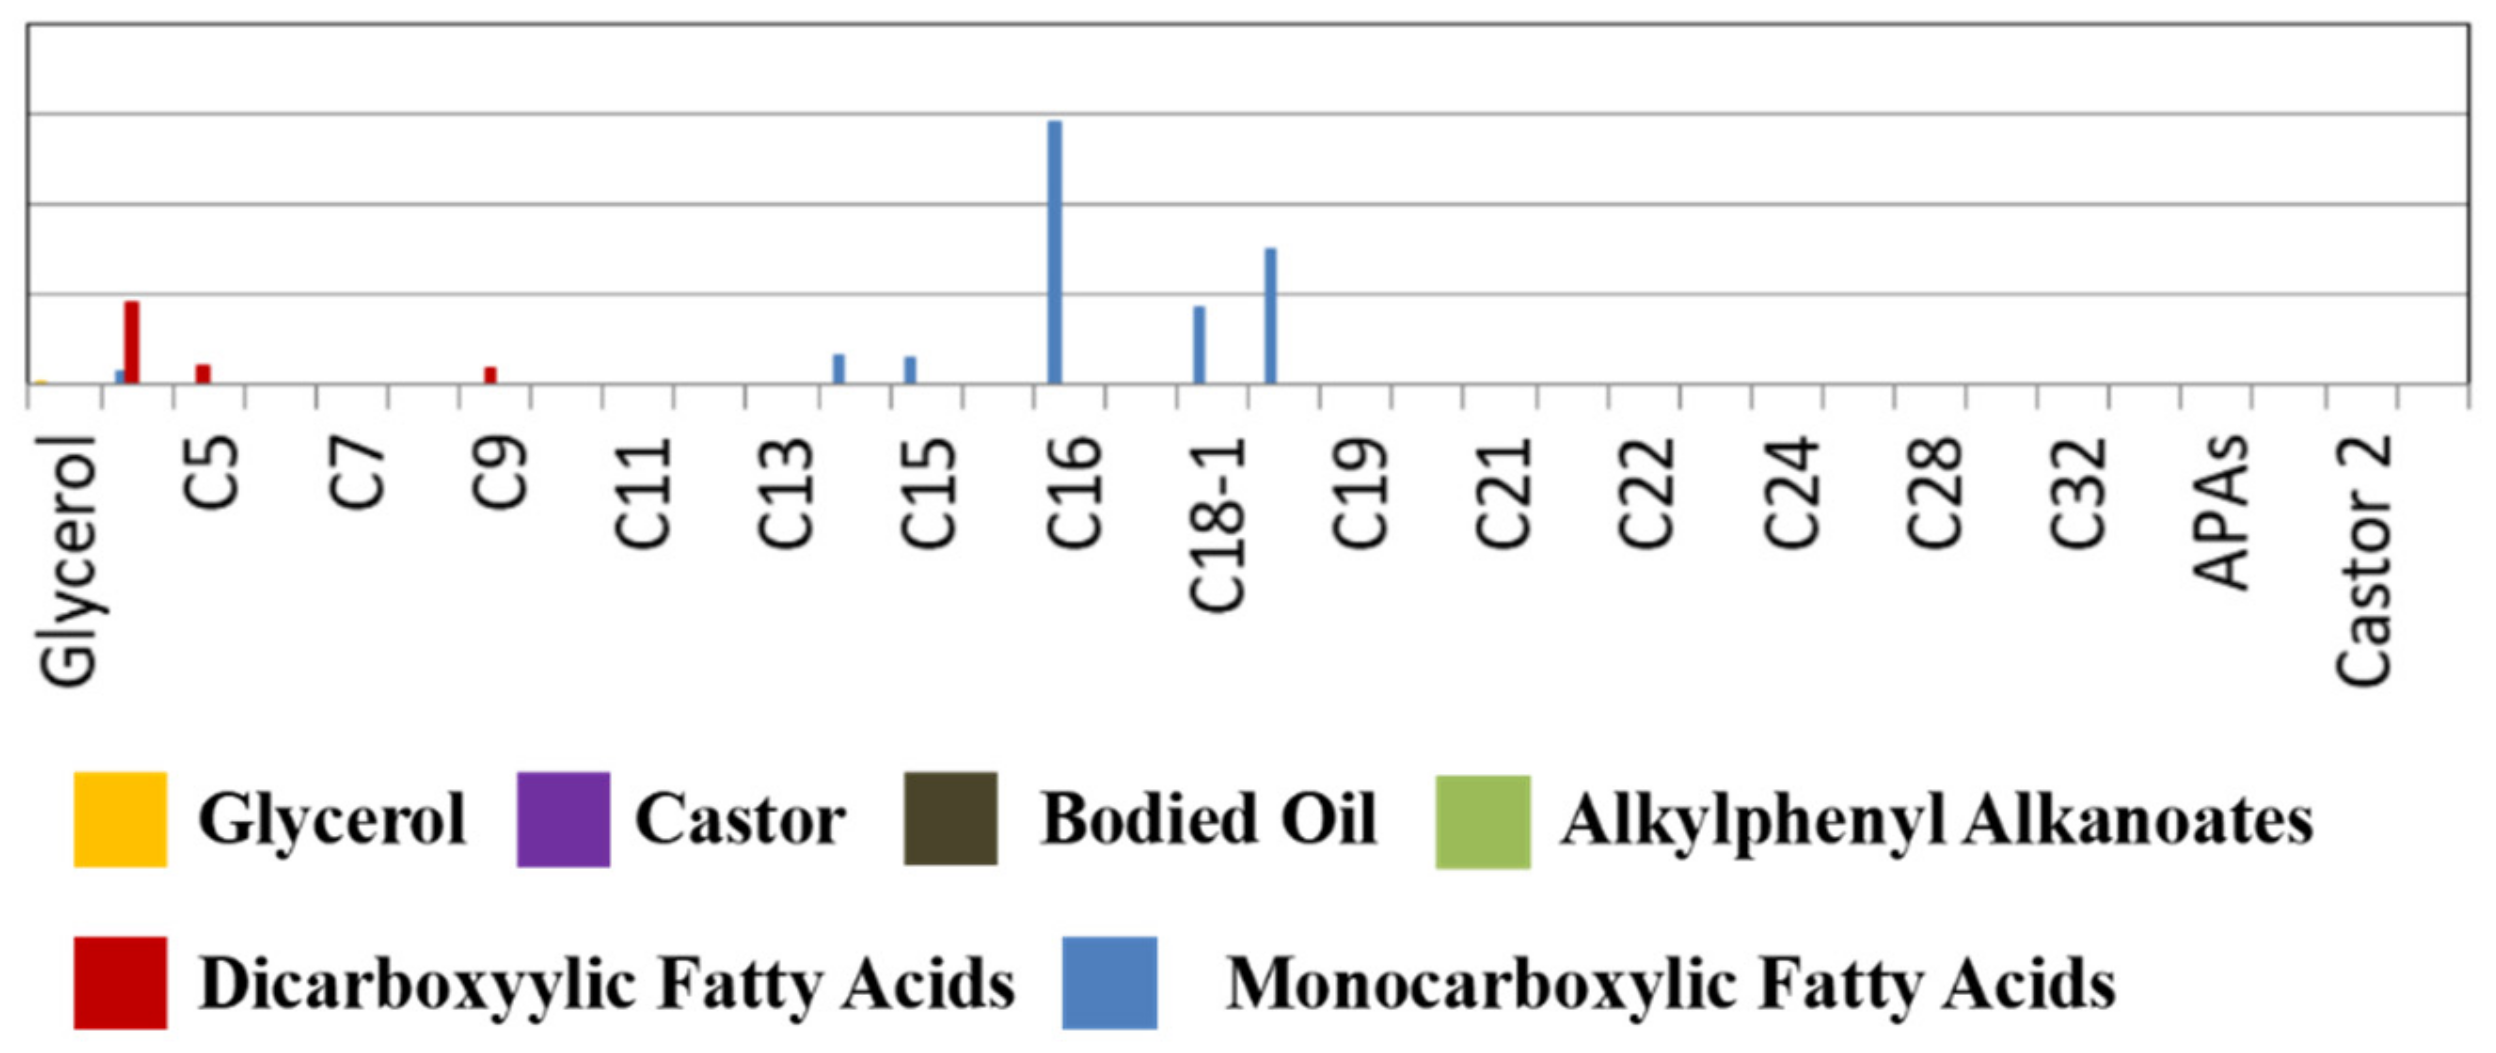
4.2. Adhesive
5. Conclusions
Author Contributions
Funding
Acknowledgments
Conflicts of Interest
References
- Zhou, W.; Wang, L. Production techniques of paintings and colored drawings of ancient architecture. Sci. Conserv. Archaeol. 2010, 22, 1–9. [Google Scholar]
- Guo, L. A Brief Analysis of the Decorative Art Features of Lacquered Coffin Painting in Mawangdui. Master’s Thesis, Nanjing University of the Arts, Nanjing, China, 2010. [Google Scholar]
- Liu, J.-H.; Ke, W.; Hwang, M.-C.; Chen, K.Y. Micro-Raman spectroscopy of Shang oracle bone inscriptions. J. Archaeol. Sci. Rep. 2021, 37, 102910. [Google Scholar] [CrossRef]
- Mahmoud, H.H.M.; El-Badry, A. Physicochemical characterization of building and painting materials from the Ptolemaic Osirian catacombs of Karnak temples, Upper Egypt. Eur. Phys. J. Plus 2020, 135, 741. [Google Scholar] [CrossRef]
- Kawahito, M.; Urakawa, H.; Ueda, M.; Kajiwara, K. Color in cloth dyed with natural indigo and synthetic indigo. Sen. I Gakkaishi 2002, 58, 122–128. [Google Scholar] [CrossRef]
- Abel, A. The history of dyes and pigments: From natural dyes to high performance pigments. In Colour Design: Theories and Applications, 2nd ed.; Woodhead Publishing Limited: Cambridge, UK, 2017. [Google Scholar]
- Richhariya, G.; Kumar, A. Fabrication and characterization of mixed dye: Natural and synthetic organic dye. Opt. Mater. 2018, 79, 296–301. [Google Scholar] [CrossRef]
- Fu, P.; Teri, G.-L.; Li, J.; Li, J.-X.; Li, Y.-H.; Yang, H. Investigation of ancient architectural painting from the Taidong Tomb in the Western Qing tombs, Hebei, China. Coatings 2020, 10, 688. [Google Scholar] [CrossRef]
- Go, I.; Mun, S.; Lee, J.; Jeong, H. A case study on Hoeamsa Temple, Korea: Technical examination and identification of pigments and paper unearthed from the temple site. Herit. Sci. 2022, 10, 20. [Google Scholar] [CrossRef]
- Klisinska-Kopacz, A. Non-destructive characterization of 17th century painted silk banner by the combined use of Raman and XRF portable systems. J. Raman Spectrosc. 2015, 46, 317–321. [Google Scholar] [CrossRef]
- Wang, X.; Zhen, G.; Hao, X.Y.; Tong, T.; Ni, F.F.; Wang, Z.; Jia, J.; Li, L.; Tong, H. Spectroscopic investigation and comprehensive analysis of the polychrome clay sculpture of Hua Yan Temple of the Liao Dynasty. Spectrochim. Acta Part A Mol. Biomol. Spectrosc. 2020, 240, 118574. [Google Scholar] [CrossRef]
- Gard, F.S.; Santos, D.M.; Daizo, M.B.; Freire, E.; Reinoso, M.; Halac, E.B. Pigments analysis of an Egyptian cartonnage by means of XPS and Raman spectroscopy. Appl. Phys. A Mater. Sci. Process. 2020, 126, 218. [Google Scholar] [CrossRef]
- Cerrato, E.J.; Cosano, D.; Esquivel, D.; Otero, R.; Jimémez-Sanchidrián, C.; Ruiz, J.R. A multi-analytical study of a wall painting in the Satyr domus in Córdoba, Spain. Spectrochim. Acta Part A Mol. Biomol. Spectrosc. 2020, 232, 118148. [Google Scholar] [CrossRef] [PubMed]
- Dawson, P. The vibrational spectrum of α-mercuric sulphide. Spectrochim. Acta Part A Mol. Spectrosc. 1972, 28, 2305–2310. [Google Scholar] [CrossRef]
- Wang, X.; Zhen, G.; Hao, X.; Zhou, P.; Wang, Z.; Jia, J.; Gao, Y.; Dong, S.; Tong, H. Micro-Raman, XRD and THM-Py-GC/MS analysis to characterize the materials used in the Eleven-Faced Guanyin of the Du Le Temple of the Liao Dynasty, China. Microchem. J. 2021, 171, 106828. [Google Scholar] [CrossRef]
- Kurouski, D.; Zaleski, S.; Casadio, F.; Van Duyne, R.P.; Shah, N.C. Tip-enhanced Raman spectroscopy (TERS) for in situ identification of indigo and iron gall ink on paper. J. Am. Chem. Soc. 2014, 136, 8677–8684. [Google Scholar] [CrossRef] [PubMed]
- Orsini, S.; Parlanti, F.; Bonaduce, I. Analytical pyrolysis of proteins in samples from artistic and archaeological objects. J. Anal. Appl. Pyrolysis 2017, 124, 643–657. [Google Scholar] [CrossRef]
- Chen, E.; Zhang, B.; Zhao, F.; Wang, C. Pigments and binding media of polychrome relics from the central hall of Longju temple in Sichuan, China. Herit. Sci. 2019, 7, 45. [Google Scholar] [CrossRef]
- Hao, X.; Schilling, M.R.; Wang, X.; Khanjian, H.; Heginbotham, A.; Han, J.; Auffret, S.; Wu, X.; Fang, B.; Tong, H. Use of THM-PY-GC/MS technique to characterize complex, multilayered Chinese lacquer. J. Anal. Appl. Pyrolysis 2019, 140, 339–348. [Google Scholar] [CrossRef]
- Fu, J.; Bai, X.; Huang, F. Study on making materials and technology of color painting in East Hall of Foguang Temple. J. Chin. Antiq. 2015, 129, 73–77. [Google Scholar]
- Lei, Z.; Wu, W.; Shang, G.; Wu, Y.; Wang, J. Study on colored pattern pigments of a royal Taoist temple beside the Forbidden City (Beijing, China). Vib. Spectrosc. 2017, 92, 234–244. [Google Scholar] [CrossRef]
- Liu, L.; Zhang, B.; Yang, H. The Analysis of the colored paintings from the Tanxi Hall in the Forbidden City. Spectrosc. Spectr. Anal. 2018, 38, 68–77. [Google Scholar]
- Li, Y.; Wang, F.P.; Ma, J.J.; He, K.; Zhang, M. Study on the pigments of Chinese architectural colored drawings in the Altar of Agriculture (Beijing, China) by portable Raman spectroscopy and ED-XRF spectrometers. Vib. Spectrosc. 2021, 116, 103291. [Google Scholar] [CrossRef]
- Fu, P.; Teri, G.; Li, J.; Huo, Y.; Yang, H.; Li, Y. Analysis of an ancient architectural painting from the Jiangxue palace in the imperial museum, Beijing, China. Anal. Lett. 2021, 54, 684–697. [Google Scholar] [CrossRef]
- Shen, A.G.; Wang, X.H.; Xie, W.; Shen, J.; Li, H.Y.; Liu, Z.A.; Hu, J.M. Pigment identification of colored drawings from Wuying Hall of the Imperial Palace by micro-Raman spectroscopy and energy dispersive X-ray spectroscopy. J. Raman Spectrosc. 2006, 37, 230–234. [Google Scholar] [CrossRef]
- Ma, Z.; Wang, L.; Yan, J.; Zhou, W.; Pitthard, V.; Bayerova, T.; Krist, G. Chromatographic, microscopic, and spectroscopic characterization of a wooden architectural painting from the Summer Palace, Beijing, China. Anal. Lett. 2019, 52, 1670–1680. [Google Scholar] [CrossRef]
- Jing, L. The Composition of pigments of decorative paintings on ancient building of Qufu’s Temple of Confucius. China Cult. Herit. Sci. Res. 2014, 4, 86–89. [Google Scholar]
- Cosano, D.; Esquivel, D.; Costa, C.M.; Jimenez-Sanchidrian, C.; Ruiz, J.R. Identification of pigments in the Annunciation sculptural group (Cordoba, Spain) by micro-Raman spectroscopy. Spectrochim. Acta Part A Mol. Biomol. Spectrosc. 2019, 214, 139–145. [Google Scholar] [CrossRef]
- Lei, Y.; Wang, S. Material analysis of the wall paintings in Xialu Temple, Tibet Autonomous Region, China. Stud. Conserv. 2014, 59, 314–327. [Google Scholar] [CrossRef]
- Piovesan, R.; Siddall, R.; Mazzoli, C.; Nodari, L. The Temple of Venus (Pompeii): A study of the pigments and painting techniques. J. Archaeol. Sci. 2011, 38, 2633–2643. [Google Scholar] [CrossRef]
- Mahmoud, H.M.; Hussein, M.; Brania, A. Pigments and plasters from the Roman temple of Deir El-Hagar, Dakhla Oasis, Egypt: Vibrational spectroscopic characterization. Rend. Lincei-Sci. Fis. E Nat. 2019, 30, 735–746. [Google Scholar] [CrossRef]
- Tong, Y.; Cai, Y.; Wang, X.; Li, Z.; Nevin, A.; Ma, Q. Polychrome arhat figures dated from the Song Dynasty (960–1279 CE) at the Lingyan Temple, Changqing, Shandong, China. Herit. Sci. 2021, 9, 117. [Google Scholar] [CrossRef]
- Li, J.Z.; Zha, J.R.; Pan, X.X.; Zhao, T.; Li, J.F.; Guo, H. A study of Song Dynasty polychrome statue-making techniques and materials in the Sage Mother Hall of the Jinci Temple, Shanxi, China. Crystals 2022, 12, 1003. [Google Scholar] [CrossRef]
- Wang, F.; Xia, Y.; Liu, J. Analysis of pigments of painted cultural relics unearthed from the burial pits of Han Tombs in Xiangshan, Qingzhou, Shandong. Emperor Qinshihuang’s Mausol. Site Mus. 2013, 458–466. [Google Scholar]
- Liu, J.-H.; He, Y.; Ke, W.; Hwang, M.-c.; Chen, K.Y. Cinnabar use in Anyang of bronze age China: Study with micro-raman spectroscopy and X-ray fluorescence. J. Archaeol. Sci. Rep. 2022, 43, 103460. [Google Scholar] [CrossRef]
- Han, J. External Alchemy and Science of TCM Formula in SongDynasty. Stud. Hist. Nat. Sci. 2008, 107, 337–352. [Google Scholar]
- Zhu, T.; Chen, J.; Hui, R.; Gong, L.; Zhang, W.-H.; Zhang, Y. Spectroscopic Characterization of the Architectural Painting from the Cizhong Catholic Church of Yunnan Province, China. Anal. Lett. 2013, 46, 2253–2264. [Google Scholar] [CrossRef]
- van der Weerd, J.; Smith, G.D.; Firtha, S.; Clarka, R.J.H. Identification of black pigments on prehistoric Southwest American potsherds by infrared and Raman microscopy. J. Archaeol. Sci. 2004, 31, 1429–1437. [Google Scholar] [CrossRef]
- Teri, G.; Fu, P.; Han, K.; Li, J.; Li, Y.; Jia, Z.; Wang, Y.; Li, Y. Color Paintings of Taiping Heavenly Kingdom Royal Residence: An Analytical Study. Coatings 2022, 12, 1880. [Google Scholar] [CrossRef]
- Schwan, J.; Ulrich, S.; Batori, V.; Ehrhardt, H.; Silva, S.R.P. Raman spectroscopy on amorphous carbon films. J. Appl. Phys. 1996, 80, 440–447. [Google Scholar] [CrossRef]
- Chenhui, Y. The aesthetic value of black in contemporary oil painting. Univ. Educ. 2021, 137, 139–142. [Google Scholar]
- Tatsch, E.; Schrader, B. Near-infrared Fourier transform Raman spectroscopy of indigoids. J. Raman Spectrosc. 1995, 26, 467–473. [Google Scholar] [CrossRef]
- Ju, Z.; Sun, J.; Liu, Y.P. Molecular structures and spectral properties of natural indigo and indirubin: Experimental and DFT studies. Molecules 2019, 24, 3831. [Google Scholar] [CrossRef]
- Tomkinson, J.; Bacci, M.; Picollo, M.; Colognesi, D. The vibrational spectroscopy of indigo: A reassessment. Vib. Spectrosc. 2009, 50, 268–276. [Google Scholar] [CrossRef]
- Splitstoser, J.C.; Dillehay, T.D.; Wouters, J.; Claro, A. Early pre-Hispanic use of indigo blue in Peru. Sci. Adv. 2016, 2, e1501623. [Google Scholar] [CrossRef]
- He, Q. Analysis and identification of blue vegetable dyes on a group of ancient silk fabrics. Sci. Conserv. Archaeol. 2012, 24, 8. [Google Scholar]
- de Agredos-Pascual, M.L.V.; Roldan-Garcia, C.; Murcia-Mascaros, S.; Barber, D.J.; Sanchez, M.G.J.; Faugere, B.; Darras, V. Multianalytical characterization of pigments from funerary artefacts belongs to the Chupicuaro Culture (Western Mexico): Oldest Maya blue and cinnabar identified in Pre-Columbian Mesoamerica. Microchem. J. 2019, 150, 104101. [Google Scholar] [CrossRef]
- Pascual, M.; Carbo, M.T.D.; Carbo, A.D. Characterization of Maya Blue pigment in pre-classic and classic monumental architecture of the ancient pre-Columbian city of Calakmul (Campeche, Mexico). J. Cult. Herit. 2011, 12, 140–148. [Google Scholar] [CrossRef]
- Ion, R.; Ion, M.; Niculescu, V.; Dumitriu, I.; Fierascu, R.; Florea, G.; Bercu, C.; Serban, S. Spectral analysis of original and restaurated ancient paper from Romanian gospel. Rom. J. Phys. 2008, 53, 781–791. [Google Scholar]
- Tawiah, B.; Asinyo, B.K.; Badoe, W.; Zhang, L.; Fu, S. Phthalocyanine green aluminum pigment prepared by inorganic acid radical/radical polymerization for waterborne textile applications. Int. J. Ind. Chem. 2017, 8, 17–28. [Google Scholar] [CrossRef]
- Moorthy, J.; Eddington, D.T.; Beebe, D.J. Microsystem Engineering for Lab-on-a-Chip Devices. By Oliver Geschke, Henning Klank and Pieter Tellemann. Angew. Chem. Int. Ed. 2004, 116, 43. [Google Scholar] [CrossRef]
- Zhan, W.; Ling, H.; Tie-bao, Z. Several points about appraising the frescos of the Taiping Heavenly Kingdom. Southeast Cult. 2009, 91–97. [Google Scholar]
- Chaplin, T.D.; Clark, R.J.; Singer, B.W. Early 20th C Russian painting? Raman identification of modern pigments on a pastel supposedly Painted by the renowned artist Natalia Goncharova. J. Raman Spectrosc. 2014, 45, 1322–1325. [Google Scholar] [CrossRef]
- Dallongeville, S.; Garnier, N.; Rolando, C.; Tokarski, C. Proteins in art, archaeology, and paleontology: From detection to identification. Chem. Rev. 2016, 116, 72–79. [Google Scholar] [CrossRef] [PubMed]
- Chiavari, G.; Galletti, G.C. Pyrolysis—Gas chromatography/mass spectrometry of amino acids. J. Anal. Appl. Pyrolysis 1992, 24, 123–137. [Google Scholar] [CrossRef]
- Calvano, C.; Rigante, E.; Picca, R.; Cataldi, T.; Sabbatini, L. An easily transferable protocol for in-situ quasi-non-invasive analysis of protein binders in works of art. Talanta 2020, 215, 120882. [Google Scholar] [CrossRef] [PubMed]
- Wang, N.; Zhang, T.; Min, J.; Li, G.; Ding, Y.; Liu, J.; Gu, A.; Kang, B.; Li, Y.; Lei, Y. Analytical investigation into materials and technique: Carved lacquer decorated panel from Fuwangge in the Forbidden City of Qianlong Period, Qing Dynasty. J. Archaeol. Sci. Rep. 2018, 17, 529–537. [Google Scholar] [CrossRef]
- Wang, N.; He, L.; Zhao, X.; Simon, S. Comparative analysis of eastern and western drying-oil binding media used in polychromic artworks by pyrolysis-gas chromatography/mass spectrometry under the influence of pigments. Microchem. J. 2015, 123, 201–210. [Google Scholar] [CrossRef]
- He, L.; Chiavari, G. Pyrolysis gas chromatography-mass spectrometry was applied to the analysis of oil adhesives in ancient murals. J. Xi’an Jiaotong Univ. 2006, 40, 1134–1138. [Google Scholar]
- Peifan, Q.; Deqi, Y.; Qi, M.; Aijun, S.; Jingqi, S.; Zengjun, Z.; Jianwe, H. Study and restoration of the Yi Ma Wu Hui layer of the ancient coating on the Putuo Zongcheng Temple. Int. J. Archit. Herit. 2021, 15, 1707–1721. [Google Scholar] [CrossRef]


| Sample | Color | Experimental Methods | Elements |
|---|---|---|---|
| 1 | Red | EDS, m-RS, PLM, Py-GC/MS | Hg (50.20%), N (32.8%), P (10.24%), Ca (3.09%), C (1.98%) |
| 2 | Black | EDS, m-RS, PLM | C (65.56%), P (14.16%), Fe (9.57%), Ca (9.23%), K (1.98%) |
| 3 | Blue | EDS, m-RS, PLM, FT-IR | N (35.47%), O (27.42%), Ca (27.29%), C (9.3%), Si (0.5%) |
| 4 | Green | EDS, m-RS, PLM, FT-IR | N (55.13%), Cl (17.19%), P (12.09%), Ca (5.91%), Cu (4.91%) |
| Peak Number | Retention Time (min) | Area (%) | Compound |
|---|---|---|---|
| 1 | 1.5363 | 0.18 | Furan, 3-methyl- |
| 2 | 1.8173 | 26.97 | Methylamine, N, N-dimethyl |
| 3 | 2.1037 | 0.30 | Benzene |
| 4 | 2.816 | 0.77 | Acetic acid |
| 5 | 3.3073 | 0.48 | 1H-Pyrrole, 1-methyl- |
| 6 | 3.5067 | 0.45 | Pyridine |
| 7 | 3.543 | 0.13 | Propanoic acid, 2-methoxy-, methyl ester |
| 8 | 4.717 | 2.56 | Cyclotrisiloxane, hexamethyl |
| 9 | 5.5797 | 0.07 | Dimethyl sulfate |
| 10 | 7.8797 | 0.01 | Valine |
| 11 | 8.495 | 0.14 | 3-Methylanisole |
| 12 | 9.9147 | 0.25 | Alanine |
| 13 | 10.237 | 0.18 | Glue marker (fish glue 108/139) |
| 14 | 10.755 | 0.02 | glycine (glue, egg white) |
| 15 | 11.7573 | 0.17 | Protein |
| 16 | 12.113 | 0.05 | phenol formaldehyde resin (TMAH) |
| 17 | 14.1283 | 6.27 | Schellmannose |
| 18 | 14.8763 | 0.19 | 1,2,3,4-Tetramethoxybenzene |
| 19 | 15.0867 | 0.05 | Diarylide, RI = 2338 |
| 20 | 15.3487 | 0.85 | Benzaldehyde, 3,4-dimethoxy |
| 21 | 16.823 | 0.12 | orsellinic acid, 2,4-di-O-methyl, methyl ester |
| 22 | 20.0143 | 1.28 | hexadecenoic acid, methyl ester. FA-C16:1 |
| 23 | 20.2363 | 3.59 | Hexadecanoic acid, methyl ester |
| 24 | 21.7787 | 0.59 | Benzene, 1,1′-(1-methylethylidene) bis [4-methoxy-] |
| 25 | 21.9367 | 0.90 | 9-Octadecenoic acid (Z)-, methyl ester |
| 26 | 22.16 | 1.74 | Octadecanoic acid, methyl ester |
Disclaimer/Publisher’s Note: The statements, opinions and data contained in all publications are solely those of the individual author(s) and contributor(s) and not of MDPI and/or the editor(s). MDPI and/or the editor(s) disclaim responsibility for any injury to people or property resulting from any ideas, methods, instructions or products referred to in the content. |
© 2023 by the authors. Licensee MDPI, Basel, Switzerland. This article is an open access article distributed under the terms and conditions of the Creative Commons Attribution (CC BY) license (https://creativecommons.org/licenses/by/4.0/).
Share and Cite
Han, K.; Yang, H.; Teri, G.; Hu, S.; Li, J.; Li, Y.; Ma, E.; Tian, Y.; Fu, P.; Luo, Y.; et al. Spectroscopic Investigation of a Color Painting on an Ancient Wooden Architecture from the Taiping Heavenly Kingdom Prince Dai’s Mansion in Jiangsu, China. Minerals 2023, 13, 224. https://doi.org/10.3390/min13020224
Han K, Yang H, Teri G, Hu S, Li J, Li Y, Ma E, Tian Y, Fu P, Luo Y, et al. Spectroscopic Investigation of a Color Painting on an Ancient Wooden Architecture from the Taiping Heavenly Kingdom Prince Dai’s Mansion in Jiangsu, China. Minerals. 2023; 13(2):224. https://doi.org/10.3390/min13020224
Chicago/Turabian StyleHan, Kezhu, Hong Yang, Gele Teri, Shanshuang Hu, Jiaxin Li, Yanli Li, Ersudai Ma, Yuxiao Tian, Peng Fu, Yujia Luo, and et al. 2023. "Spectroscopic Investigation of a Color Painting on an Ancient Wooden Architecture from the Taiping Heavenly Kingdom Prince Dai’s Mansion in Jiangsu, China" Minerals 13, no. 2: 224. https://doi.org/10.3390/min13020224