Article

Trace Element Composition of Molybdenite: Deposit Type Discrimination and Limitations

1
State Key Laboratory of Ore Deposit Geochemistry, Institute of Geochemistry, Chinese Academy of Sciences, Guiyang 550081, China
2
College of Earth and Planetary Science, University of Chinese Academy of Sciences, Beijing 100049, China
*
Author to whom correspondence should be addressed.
Minerals 2023, 13(1), 114; https://doi.org/10.3390/min13010114
Submission received: 19 December 2022 / Revised: 27 December 2022 / Accepted: 9 January 2023 / Published: 11 January 2023
(This article belongs to the Special Issue Magmatic-Hydrothermal Fe Deposits and Affiliated Critical Metals)

Abstract

:
Molybdenite is a common sulfide hosting many trace elements. Trace elements in molybdenite from individual deposits have been widely used to constrain the source and conditions of ore-forming fluids. However, the relationship between the trace element composition of molybdenite and deposit types has not been well investigated from a large dataset. Here, simple statistics and partial least squares–discriminant analysis (PLS-DA) were used to determine whether different types of deposits can be distinguished by trace elements in molybdenite and what factors control the variations in trace element composition based on published laser ablation ICP–MS data. Molybdenite from porphyry deposits is separated from that from quartz veins, greisen Sn–W, granite vein Mo, and granodiorite Mo deposits. The former is characterized by relatively high Re, Cu, Ag, Se, Pb, Bi, and Te contents, whereas the latter has higher Ni, Co, Sn, Sb and W contents. Molybdenite from the quartz vein Au ± W deposits (Au-dominated), and porphyry Cu–Au–Mo (moderate Au) are separated from other deposits without gold due to positive correlations with Au, Sb, Te, Pb, and Bi for the former. Assemblages of Au–Sb–Te–Pb–Bi in molybdenite are thus useful to discriminate as to whether deposits contain gold and the degree of gold mineralization. Higher oxygen fugacity is responsible for the relative enrichment of W in molybdenite from greisen Sn–W deposits, whereas lower oxygen fugacity results in the relative enrichment of Re in molybdenite from porphyry Cu ± Mo ± Au and Mo ± Cu ± Au deposits. There are some limitations to using molybdenite as an indicator mineral because of the complex occurrences of elements in molybdenite, large compositional variations within a specific deposit type, and an imbalanced dataset. To develop molybdenite as an indicator mineral tool, further work should be carried out to overcome these limitations. This study provides an attempt to classify deposit types using molybdenite trace elements and has important implications for ore genesis research and mineral exploration.

1. Introduction

Molybdenite is one of the main metal minerals in porphyry, quartz vein, and skarn deposits [1,2,3,4,5,6] and hosts important economic resources of Mo and Re [7,8,9]. The molybdenite Re–Os isotope system has been widely used to constrain the ore-forming age because of its high Re and absence of common Os [10,11,12,13,14]. Rhenium in molybdenite ranges from ppb to thousands of ppm in different geological environments [15,16,17,18,19]. In addition to Re, molybdenite also hosts other elements, such as Bi, W, Pb, Te, Ag, Cu, Au, Zn, and Sn [20,21,22,23,24]. There are two molybdenite polytypes, hexagonal (2H) and rhombohedral (3R). Some studies have shown that 3R molybdenite has higher contents of impurities such as Re, W, Sn, and Bi than 2H molybdenite [25,26,27]. Although trace elements of metal sulfides such as pyrite and sphalerite have been successfully applied to fingerprint mineralization [28,29,30], the application of trace elements in molybdenite as a geochemical tool is limited [20,31].
Identification of the origin of molybdenite is important in ore genesis research and mineral exploration. Previous studies have linked the trace element geochemistry of molybdenite with deposit types. Pašava et al. (2016) [21] investigated the trace element composition of molybdenite from greisen-, gold-, base metal-, and “barren granite”-related deposits and one porphyry Cu–Mo (Au) deposit. The variation in the trace element composition of molybdenite from a specific mineralization type is due to the presence of nano- to micron-scale mineral inclusions. Huang et al. (2014) [6] analyzed trace elements in molybdenite from 57 molybdenum deposits in China using ICP-MS and suggested that the various geochemical characteristics of molybdenite from different types of mineralization resulted from variations in physiochemical conditions and sources of ore-forming fluids. Some studies have linked the Re content in molybdenite with the source of ore-forming materials in the deposits [10,32,33,34,35], where a higher Re content (>100 ppm) indicates a mantle-dominated source and a lower Re content (<10 ppm) indicates a crust-dominated source [3,17,36,37]. These studies have demonstrated that trace elements in molybdenite have the ability to constrain the source and conditions of ore-forming fluids. Based on this, it is expected that trace elements in molybdenite can be used to distinguish different types of deposits. However, little work has been carried out to classify the deposit types based on molybdenite trace elements due to limited data.
In this paper, the published laser ablation–inductively coupled plasma–mass spectrometry (LA–ICP–MS) trace element data of molybdenite from different deposit types are summarized. These data are investigated by partial least squares–discriminant analysis (PLS-DA) to determine whether different types of deposits can be distinguished by trace elements in molybdenite and what factors control the variations in trace element composition. The limitations of molybdenite as an indicator mineral to classify deposit types are also illustrated.

2. Data and Analytical Methods

2.1. Data Preparation

We collected LA–ICP–MS trace element data for molybdenite from a total of 28 deposits worldwide (Figure 1). These deposits are distributed in China, the United States, Western Australia, the Czech Republic, Uzbekistan, Russia, and Iran. The LA–ICP–MS data included 542 analyses, initially divided into 17 deposit types, including granite vein Mo, granodiorite Mo, greisen Sn–W, pegmatite vein Mo, porphyry Cu, porphyry Cu–Au–Mo, porphyry Cu–Mo, porphyry Cu–Mo–Au, porphyry Mo, porphyry Mo-Cu–Au, quartz vein Au, quartz vein Au–W, quartz vein Mo–Au, quartz vein Sn–W, quartz vein Sn–W–Li, skarn Fe–Cu–As, and volcanogenic Zn–Cu–Ba–Pb. To better distinguish the deposit types and to examine the effect of the new classification scheme on the results of PLS-DA, some deposit types were further combined based on host rocks and metal types, resulting in 10 deposit types. Granite vein Mo and granodiorite Mo are combined as granite/granodiorite-related Mo. Copper-dominated porphyry deposits, including porphyry Cu, porphyry Cu–Au–Mo, porphyry Cu–Mo, and porphyry Cu–Mo–Au, are combined as porphyry Cu ± Mo ± Au deposits. Molybdenum-dominated deposits such as porphyry Mo and porphyry Mo–Cu–Au are combined as porphyry Mo ± Cu ± Au deposits. Quartz vein Au and quartz vein Au–W are combined as quartz vein Au ± W, whereas quartz vein Sn–W and quartz vein Sn–W–Li are combined as quartz vein Sn–W ± Li. Finally, these 10 deposit types include granite/granodiorite-related Mo, greisen Sn–W, pegmatite vein Mo, porphyry Cu ± Mo ± Au, porphyry Mo ± Cu ± Au, quartz vein Au ± W, quartz vein Mo–Au, quartz vein Sn–W ± Li, skarn Fe–Cu–As, and volcanogenic Zn–Cu–Ba–Pb. Detailed information on the collected deposits is shown in Supplementary Materials Table S1.

2.2. Statistical Methods

To better identify the geochemical features of molybdenite from a specific deposit type, the LA–ICP–MS data were investigated by the multivariate statistical method PLS-DA. The data preparation procedure is similar to that described in Huang et al. (2019a) [38]. The proportions of the censored LA–ICP–MS data are shown in Table S2. Elements with censored values ≤ 40% were used for the PLS-DA. Based on this rule, 13 elements, including Co, Ni, Cu, Zn, As, Se, Ag, Sn, Sb, Te, W, Re, Au, Pb, and Bi, can be used in the PLS-DA. The rob-composition package in R software was used to impute the data. The imputed data were transformed by the centered logarithm ratio method to eliminate false correlation of the concentration data.
Generally, PLS-DA results can be interpreted using four kinds of graphs [39]. They are loading and weight biplots (e.g., first and second components, qw*1–qw*2), score plots (t1t2), score contribution plots, and variable importance on projection (VIP)- cumulative plots [40]. The loading biplots show the relationship between elements and between elements and defined deposit types, whereas the score plots show the distribution of all individual analyses or samples. Score contribution plots describe the compositional feature of a specific group compared to the mean composition of the studied dataset. The positive or negative score contribution of an element indicates relative content enrichment or depletion. The VIP cumulative plot shows the importance of each element in the classification. The VIP value of an element larger than 1 indicates that this element is the most important in the classification. A VIP value between 0.8 and 1 of an element means it is moderately important [41].

3. Results

3.1. Chemical Composition of Molybdenite

In general, the content variation of elements in molybdenite from different deposit types is wide. The Co, As, Ag, W, and Sn contents range from 10−2 to 104 ppm, the Cu, Zn, Se, and Te contents range from 10−1 to 104 ppm, the Ni content ranges from 10−2 to 103 ppm, the Sb and Au contents range from 10−3 to 103 ppm, the Re and Bi contents range from 10−3 to 104 ppm, and the Pb content ranges from 10−2 to 105 ppm (Figure 2).
As shown in the box and whisker plot (Figure 2), molybdenite from the quartz vein Mo–Au and skarn Fe–Cu–As deposits has a relatively high median Ag content, whereas that from the pegmatite vein Mo deposits has a relatively low median Ag content (Figure 2a). Molybdenites from the porphyry Mo deposits have the lowest median Ni contents, whereas those from the other deposits contain similar median Ni contents (Figure 2b). Molybdenite from porphyry Cu shows high median Cu and Zn contents (Figure 2c,d). The median content of Se in molybdenite from the porphyry Mo and quartz vein Au–W deposits is relatively low (Figure 2e). Tellurium is relatively enriched in molybdenite from porphyry Cu–Au–Mo, porphyry Mo–Cu–Au, quartz vein Au, and quartz vein Mo–Au deposits and is depleted in molybdenite from greisen Sn–W deposits (Figure 2f). The quartz vein Au–W has a relatively low median W content (Figure 2g). The median Au content is relatively high in molybdenite from the porphyry Cu–Au–Mo and quartz vein Au deposits (Figure 2h). The median content of Re is the highest in molybdenite from the porphyry Cu deposits (Figure 2i), whereas the median content of Pb is the highest in molybdenite from the skarn Fe–Cu–As deposits (Figure 2j). Molybdenite from the porphyry Cu–Au–Mo and quartz vein Au shows relatively high median Bi contents (Figure 2k). Molybdenite from the quartz vein Au–W deposits has relatively low median Re, Pb, and Bi contents. The differences in the median Co, As, and Sn contents of molybdenite from the studied deposit types are not obvious (Figure 2l–n). The median content of Sb in molybdenite from granodiorite Mo and quartz vein Au deposits is relatively high (Figure 2o).

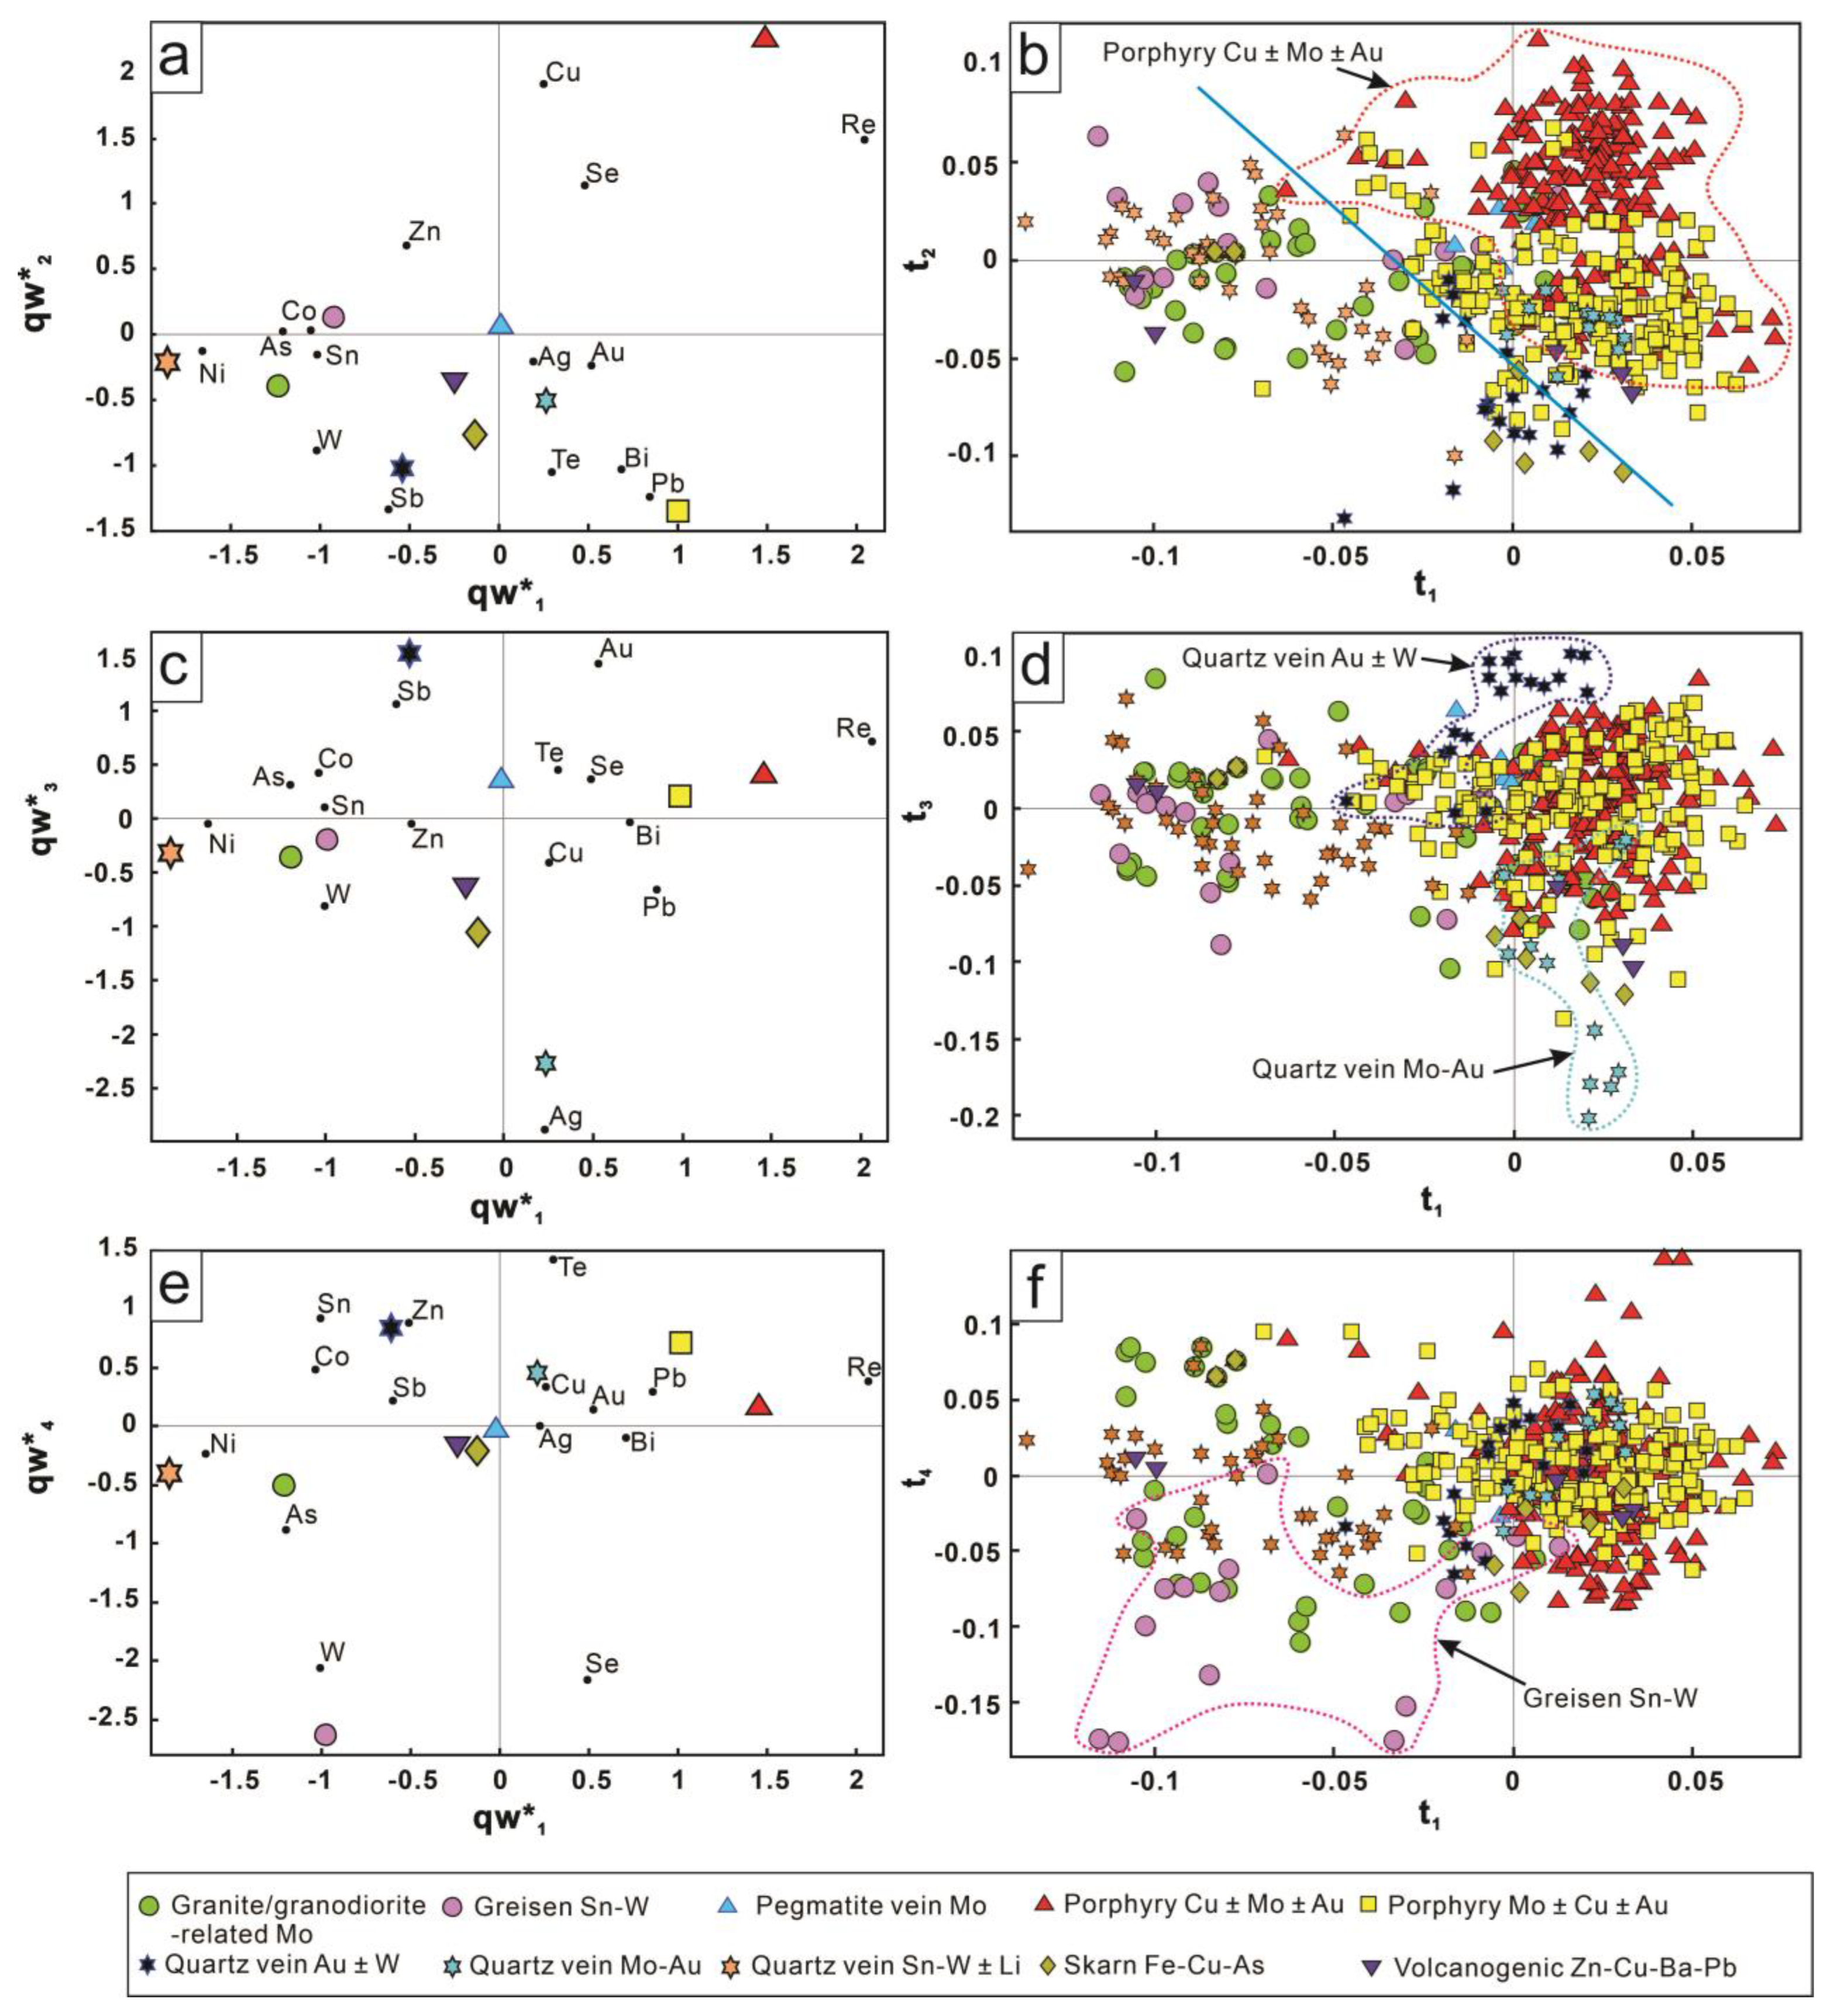
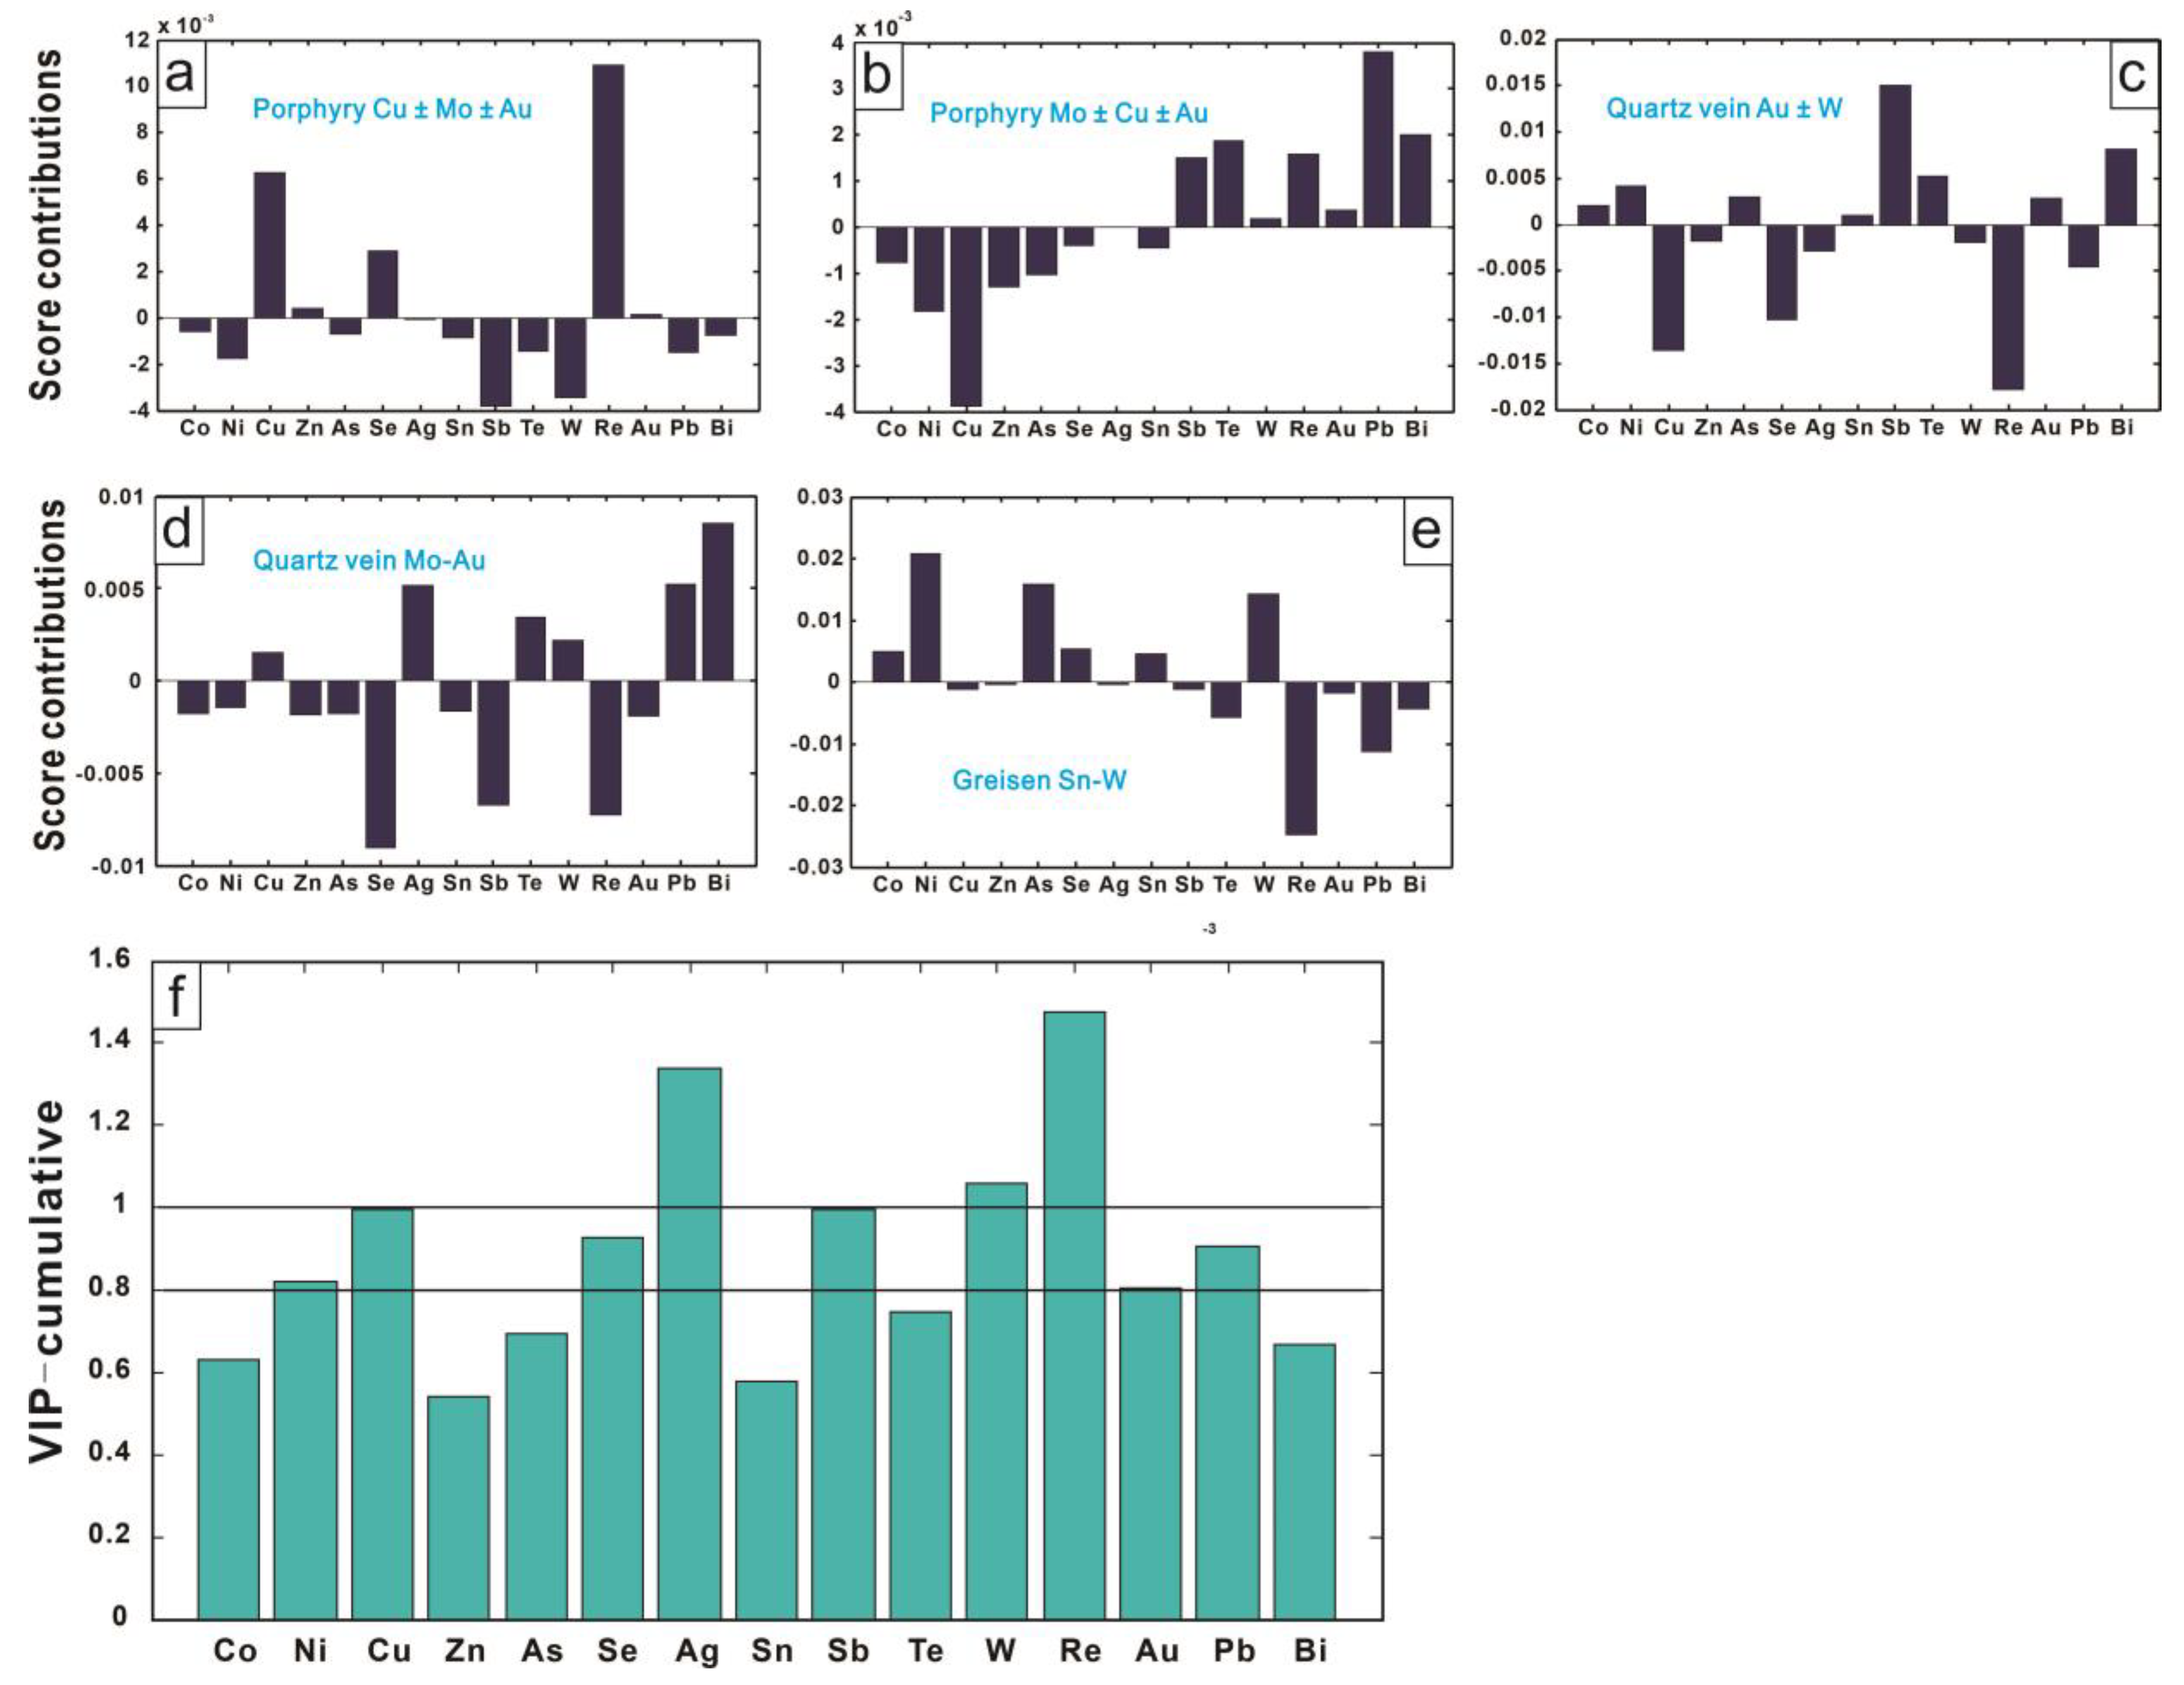
3.2. PLS-DA Results of Molybdenite from Different Deposit Types

Figure 3 and Figure 4 show the PLS-DA results, which indicated the relationship between elements in molybdenite and 17 deposit types, as well as the score contribution and the cumulative VIP results. In the t1t2 plot, two groups can be defined (Figure 3a,b). Molybdenite from porphyry deposits is roughly separated from that from quartz veins, greisen Sn–W, granite vein Mo, and granodiorite Mo deposits. The former is positively correlated with Re, Cu, Ag, Se, Pb, Bi, and Te, and the latter is positively correlated with Ni, Co, Sn, Sb, and W. Molybdenite from pegmatite vein Mo, skarn Fe–Cu–As, and volcanogenic Zn–Cu–Ba–Pb deposits cannot be discriminated in the t1t2 plot. Molybdenite from quartz vein Au deposits is separated from other types of quartz vein deposits because of its positive correlation with Sb, Te, Au, and Bi (Figure 3a,b and Figure 4a). Despite overlapping, molybdenite from the porphyry Cu–Mo deposits plots on the negative side of t3 due to correlations with Cu, Se, W, and Re (Figure 3c,d and Figure 4b). In the plot of t1t4, molybdenite from the porphyry Cu–Au–Mo deposits is separated due to its positive correlation with Te, Re, Au, Pb, and Bi (Figure 3e,f and Figure 4c). It is worth noting that molybdenite from the porphyry Cu–Au–Mo deposits (moderate Au) is separated from the porphyry Mo–Cu–Au (minor Au) and the porphyry Cu–Mo–Au (minor Au) deposits due to a positive correlation with Au for the former (Figure 3e,f and Figure 4d,e). The VIP-cumulative plot indicates that Zn, Se, Ag, Re, and Au are the most important discriminant elements and Cu, As, Sb, Te, W, and Bi are moderately important (Figure 4f).
Figure 5 and Figure 6 are the PLS-DA results grouped by 10 deposit types. In the t1t2 plot, two groups can be defined (Figure 5a,b). Molybdenite from porphyry deposits is separated from that from quartz veins, granite/granodiorite Mo, and greisen Sn–W deposits. The former is positively correlated with Re, Cu, Se, Ag, Au, Pb, Bi, and Te, and the latter is positively correlated with Ni, Co, Sn, Sb, and W (Figure 5a,b). Similar to the results in Figure 3a,b, molybdenite from pegmatite vein Mo, skarn Fe–Cu–As, and volcanogenic Zn–Cu–Ba–Pb deposits cannot be separated from other deposits in the t1t2 plot. Molybdenite from porphyry Cu ± Mo ± Au deposits can be separated from other types of deposits with slight overlap due to the positive contributions of Cu, Se, and Re (Figure 5a,b and Figure 6a). Molybdenite from porphyry Cu ± Mo ± Au (Cu-dominated) and porphyry Mo ± Cu ± Au (Mo-dominated) deposits cannot be discriminated in the t1–t2 plot because both are positively correlated with Re (Figure 5a,b and Figure 6a,b). However, in terms of mean composition, molybdenite from the Cu-dominated porphyry deposits has higher Cu and Se contents (Figure 6a), whereas molybdenite from the Mo-dominated porphyry deposits shows relative enrichment of Sb, Te, Pb, and Bi (Figure 6b). In the t1t3 space, molybdenite from the quartz vein Au ± W deposits can be discriminated from the quartz vein Mo–Au deposits (Figure 5c,d) due to the positive contributions of Se, Sb, Te, Au, and Bi for the former (Figure 6c) and positive contributions of Cu, Ag, and Pb for the latter (Figure 6d). Molybdenite from the greisen Sn–W deposits plots in the negative t1 and t4 regions because of the covariation of Ni, As, Se, and W (Figure 5e,f and Figure 6e). The VIP-cumulative plot indicates that Ag, W, and Re are the most important and Ni, Cu, Se, Sb, and Pb are moderately important discriminant elements in the classification (Figure 6f).

4. Discussion

4.1. Discrimination between Different Types of Deposits

The PLS-DA results based on seventeen deposit types and ten deposit types identify the geochemical features of molybdenite from different types of deposits. In general, porphyry deposits can be separated from quartz vein and granite/granodiorite-related Mo deposits based on the chemistry of molybdenite (Figure 3a,b and Figure 5a,b). However, pegmatite vein Mo, skarn Fe–Cu–As, and volcanogenic Zn–Cu–Ba–Pb deposits cannot be separated from other types of deposits (Figure 3 and Figure 5). Molybdenite from porphyry Mo ± Cu ± Au deposits cannot be distinguished from that from porphyry Cu ± Mo ± Au deposits (Figure 5), indicating that a similar ore-forming environment is responsible for Mo-dominated and Cu-dominated porphyry deposits.
Molybdenite from the porphyry Cu–Au–Mo deposits (moderate Au) is separated from the porphyry Mo–Cu–Au (minor Au) and porphyry Cu–Mo–Au (minor Au) deposits because there is higher Au in molybdenite from the porphyry deposits with moderate Au (Figure 3e,f and Figure 4d,e). Similarly, higher Au separates molybdenite of the quartz vein Au ± W (Au-dominated) deposits from molybdenite of the quartz vein Mo–Au (minor Au) deposits (Figure 5c,d). These results suggest that differences in the composition of ore-forming fluids such as gold content can be reflected by molybdenite chemistry. Therefore, molybdenite is useful to discriminate whether deposits contain gold and the degree of gold mineralization.
The common characteristics of molybdenite from the quartz vein Au, porphyry Cu-Au–Mo and quartz vein Au ± W deposits are positive in correlation with Te, Au, and Bi (Figure 4a,c and Figure 5c) and relative enrichment of these elements compared to other deposits without gold (Figure 2f,h,k). Conversely, molybdenite from the porphyry Cu–Mo and greisen Sn–W deposits is characterized by negative contributions of Sb, Te, Au, Pb, and Bi (Figure 4b and Figure 5e). This indicates that molybdenite from Au-bearing deposits not only has higher Au but also elements with similar geochemical behavior, such as Sb, Te, Pb, and Bi. This is consistent with the fact that Au, Ag, Bi, Pb, and other elements in telluride minerals exist as trace minerals associated with gold [42]. Due to the close genetic relationship between Te and Bi minerals and natural gold, Te and Bi minerals play important roles in gold transportation and precipitation [28,43,44,45,46,47]. Enrichment of Au by Te, Ag, Se, and Bi in hydrothermal fluids is considered to be responsible for the formation of gold deposits and quartz–cassiterite vein deposits [45,48,49,50,51,52,53]. Therefore, the element assemblage of Bi–Te–Au–Ag–Cu–Pb in molybdenite is an important index for identifying deposits containing gold.
Molybdenite from greisen Sn–W deposits is characterized by positive contributions of Ni, As, and W and negative contributions of Cu, Se, and Re, in contrast to that from porphyry Cu ± Mo ± Au and Mo ± Cu ± Au deposits (Figure 5e,f and Figure 6e). This is consistent with the fact that the Re concentration of molybdenite decreases from porphyry Cu–Mo and Mo deposits to porphyry Sn and W deposits [54]. The relative enrichment of W in molybdenite from greisen Sn–W deposits and the relative enrichment of Re in molybdenite from porphyry Cu ± Mo ± Au and Mo ± Cu ± Au deposits indicate that trace elements in molybdenite from porphyry deposits can reflect the features of ore-forming elements. Oxygen fugacity (ƒO2) is a key factor for the formation of porphyry deposits, and most subduction-related porphyry Cu deposits are considered to be related to relatively oxidized parental magmas [55,56,57,58]. Under more oxidizing conditions, insoluble Mo4+ and Re4+ are oxidized to more soluble and mobilized Mo6+ and Re6+ [15,18,59,60,61,62], resulting in the formation of Re-rich molybdenite in porphyry Cu deposits. Based on the ionic radius of Mo4+ being close to that of W4+, W could homogeneously be incorporated into the molybdenite lattice. However, a lack of W4+ in molybdenite formed under high oxidation conditions due to tungsten crystallization at relatively low oxygen fugacity [63,64,65,66]. Therefore, oxygen fugacity controls the differences in the chemical composition of molybdenite from Cu–Mo-dominated and Sn–W-dominated deposits.

4.2. Limitations of Using Molybdenite to Classify Deposit Types

As discussed above, only some deposit types can be distinguished by the chemistry of molybdenite. The PLS-DA results in Figure 3 and Figure 5 can only be used to identify the characteristic features of molybdenite from a specific type but cannot be used for direct discrimination of molybdenite with unknown origins. There are possible factors that affect the classification results: (1) the occurrence of elements in molybdenite, (2) large variations in the chemical composition of molybdenite within a specific deposit type, and (3) data imbalance.
Understanding the occurrence of elements in molybdenite is important to discuss trace element variations. The ionic radius of Mo4+ is 0.65 Å, close to 0.63 Å for Re4+ and 0.66 Å for W4+ [15]. Consequently, Re and W could be homogeneously incorporated into the molybdenite lattice [67]. However, higher W concentrations are also likely associated with various proportions of nano- to micron-scale inclusions of W-bearing minerals in the molybdenites [66]. Selenium and Te can be incorporated into the molybdenite lattice by substitution of S [20,68,69]. However, a high Se content can also be due to Se-rich mineral inclusions in molybdenite [21,23]. The anomalous concentration of Te (≥30 ppm) is nano- to micron inclusions, as confirmed by SEM–BSE microimaging [21]. Shafiei et al. (2021) [24] found that a high concentration of Te is associated with the highest concentrations of Pb and Bi, which was interpreted as nano- to micron inclusions of Te–Bi–Pb-bearing mineral phases in molybdenite. The other trace elements (Ag, Pb, Bi, Au, Cu, Zn, and Sn) most likely occur as subnano impurities identified by SEM and LA–ICP–MS time-resolved depth profiles [18,21,24]. Because the occurrence of an element will affect its geochemical composition in minerals [21,22], excluding the effect of mineral inclusion is necessary. Some mineral inclusions at the micron scale can be detected and identified by LA–ICP–MS or SEM. However, nanometer mineral inclusions in molybdenite are difficult to detect by these techniques. Therefore, more work should be completed to characterize the occurrence of trace elements in molybdenite by higher resolution techniques such as transmission electron microscopy.
There are large variations in the chemical composition of molybdenite from the same type of deposit, such as porphyry Cu–Au–Mo, porphyry Mo–Cu–Au, and porphyry Cu–Mo–Au. In addition, the characteristics of trace elements in molybdenite are obviously different even in the same metal deposits, such as granite vein Mo, granodiorite Mo, pegmatite vein Mo, and porphyry Mo. These results indicate that the composition of the host rocks possibly affects the composition of ore-forming fluids. Therefore, more factors, such as the type of host rocks, should be considered to better classify molybdenite with different origins.
In addition to internal factors related to deposit genesis, data and statistical methods are also important external factors in the classification of deposit types. There is a small amount of trace element data in molybdenite from the pegmatite vein Mo, skarn Fe–Cu–As, and volcanogenic Zn, Cu–Ba–Pb deposits, which may result in indiscrimination of these deposits. However, internal factors, such as molybdenite occurring as a minor mineral in these deposit types, may also play a role. Because molybdenite in these deposit types is not as abundant as in Mo-dominated deposits, molybdenite may not well reflect the information of ore-forming fluids. Therefore, we need to add more trace element data for molybdenite from these deposit types in future work to better use molybdenite to classify the deposit types.

5. Conclusions

Molybdenite from porphyry deposits is separated from quartz vein, greisen Sn–W, granite vein Mo, and granodiorite Mo deposits, because of relatively high Re, Cu, Ag, Se, Pb, Bi, and Te contents for the former, and higher Ni, Co, Sn, Sb, and W contents for the latter. Molybdenite from gold-bearing deposits such as quartz vein Au ± W and porphyry Cu–Au–Mo is separated from other deposits without gold such as porphyry Cu–Mo and greisen Sn–W deposits because of higher Au, Sb, Te, Pb, and Bi contents for the former. Element groups of Au–Sb–Te–Pb–Bi are sensitive indices to distinguish deposits with or without gold and the degree of gold mineralization. Molybdenite from greisen Sn–W deposits with relative enrichment of W and porphyry Cu ± Mo ± Au and Mo ± Cu ± Au deposits with relative enrichment of Re can be discriminated due to the higher oxygen fugacity for the latter. Although some deposit types can be discriminated by molybdenite chemistry, limitations such as complex occurrences of elements, large chemical variations within a specific deposit type, and imbalanced datasets should be overcome to better use molybdenite as an indicator mineral.

Supplementary Materials

The following supporting information can be downloaded at: https://www.mdpi.com/article/10.3390/min13010114/s1. Table S1: Summary of basic information on molybdenite samples from different deposit types and Table S2: Summary of censored LA–ICP–MS trace element data for molybdenite.

Author Contributions

X.H. conceived and coordinated this contribution. The data collection and analysis were carried out by M.T., X.H., Y.M. and H.T. supplied guidance and insight. The paper was written by M.T., with contributions from X.H., Y.M. and H.T. All authors have read and agreed to the published version of the manuscript.

Funding

X.H. acknowledges funding from the National Natural Science Foundation of China (42173070), CAS Hundred Talents Program and the Field Frontier Key Project of State Key Laboratory of Ore Deposit Geochemistry (202101).

Data Availability Statement

Not applicable.

Acknowledgments

The authors are very grateful to the editors and reviewers for the work completed.

Conflicts of Interest

The authors declare no conflict of interest.

References

  1. Terada, K.; Osaki, S.; Ishihara, S.; Kiba, T. Distribution of rhenium in molybdenites from Japan. Geochem. J. 1971, 4, 123–141. [Google Scholar] [CrossRef]
  2. Jensen, E.P.; Barton, M.D. Gold deposits related to alkaline magmatism. Rev. Econ. Geol. 2000, 13, 279–314. [Google Scholar]
  3. Berzina, A.N.; Sotnikov, V.I.; Economou-Eliopoulos, M.; Eliopoulos, D.G. Distribution of rhenium in molybdenite from porphyry Cu–Mo and Mo–Cu deposits of Russia (Siberia) and Mongolia. Ore Geol. Rev. 2005, 26, 91–113. [Google Scholar] [CrossRef]
  4. Stein, H.J. Low-rhenium molybdenite by metamorphism in northern Sweden: Recognition, genesis, and global implications. Lithos 2006, 87, 300–327. [Google Scholar] [CrossRef]
  5. Mao, Z.; Cheng, Y.; Liu, J.; Yuan, S.; Wu, S.; Xiang, X.; Luo, X. Geology and molybdenite Re–Os age of the Dahutang granite-related veinlets-disseminated tungsten ore field in the Jiangxin Province, China. Ore Geol. Rev. 2013, 53, 422–433. [Google Scholar] [CrossRef]
  6. Huang, F.; Wang, D.H.; Chen, Y.C.; Wang, C.H.; Tang, J.X.; Chen, Z.H.; Wang, L.Q.; Liu, S.B.; Li, K.J.; Zhang, C.Q.; et al. Trace elements characteristics of molybdenites from endogenous molybdenum deposits in China. Miner. Deps. 2014, 33, 1193–1212, (In Chinese with English abstract). [Google Scholar]
  7. Fleischer, M. The geochemistry of rhenium, with special reference to its occurrence in molybdenite. Econ. Geol. 1959, 54, 1406–1413. [Google Scholar] [CrossRef]
  8. Sarp, H.; Bertrand, J.; Deferne, J.; Liebich, B.W. A complex rhenium-rich titanium and iron oxide of the crichtonite-senaite group. Neues Jahrb. Miner. 1981, 10, 433–442. [Google Scholar]
  9. Mitchell, R.H.; Gilles Laflamme, J.H.; Cabri, L.J. Rhenium sulphide from the Coldwell complex, northwestern Ontario, Canada. Mineral. Mag. 1989, 53, 635–637. [Google Scholar] [CrossRef]
  10. Stein, H.; Markey, R.; Morgan, J.; Selby, D.; Creaser, R.; Behn, M.; Mine, B.; Alumina, W. Re-Os Dating of Boddington Molybdenite, SW Yilgarn: Two Au Mineralization Events. AGSO-Geosci. Aust. Rec. 2001, 37, 469–471. [Google Scholar]
  11. Stein, H.J.; Markey, R.J.; Morgan, J.W.; Hannah, J.L.; Scherstén, A. The remarkable Re-Os chronometer in molybdenite: How and why it works. Terra Nova 2001, 13, 479–486. [Google Scholar] [CrossRef]
  12. Barra, F.; Ruiz, J.; Mathur, R.; Titley, S. A Re–Os study of sulfide minerals from the Bagdad porphyry Cu–Mo deposit, northern Arizona, USA. Miner. Deposita. 2003, 38, 585–596. [Google Scholar] [CrossRef]
  13. Selby, D.; Creaser, R.A. Re-Os Geochronology and Systematics in Molybdenite from the Endako Porphyry Molybdenum Deposit, British Columbia, Canada. Econ. Geol. 2001, 96, 197–204. [Google Scholar] [CrossRef]
  14. Selby, D.; Creaser, R.A. Macroscale NTIMS and microscale LA-MC-ICP-MS Re-Os isotopic analysis of molybdenite: Testing spatial restrictions for reliable Re-Os age determinations, and implications for the decoupling of Re and Os within molybdenite. Geochim. Cosmochim. Acta 2004, 68, 3897–3908. [Google Scholar] [CrossRef]
  15. Stein, H.; Scherstén, A.; Hannah, J.; Markey, R. Subgrain-scale decoupling of Re and 187Os and assessment of laser ablation ICP-MS spot dating in molybdenite. Geochim. Cosmochim. Acta 2003, 67, 3673–3686. [Google Scholar] [CrossRef]
  16. Aminzadeh, B.; Shahabpour, J.; Maghami, M. Variation of Rhenium Contents in Molybdenites from the Sar Cheshmeh Porphyry Cu-Mo Deposit in Iran. Resour. Geol. 2011, 61, 290–295. [Google Scholar] [CrossRef]
  17. Voudouris, P.; Melfos, V.; Spry, P.; Bindi, L.; Moritz, R.; Ortelli, M.; Kartal, T. Extremely Re-Rich Molybdenite from Porphyry Cu-Mo-Au Prospects in Northeastern Greece: Mode of Occurrence, Causes of Enrichment, and Implications for Gold Exploration. Minerals 2013, 3, 165–191. [Google Scholar] [CrossRef]
  18. Golden, J.; McMillan, M.; Downs, R.T.; Hystad, G.; Goldstein, I.; Stein, H.J.; Zimmerman, A.; Sverjensky, D.A.; Armstrong, J.T.; Hazen, R.M. Rhenium variations in molybdenite (MoS2): Evidence for progressive subsurface oxidation. Earth Planet. Sci. Lett. 2013, 366, 1–5. [Google Scholar] [CrossRef]
  19. Rathkopf, C.; Mazdab, F.; Barton, I.; Barton, M.D. Grain-scale and deposit-scale heterogeneity of Re distribution in molybdenite at the Bagdad porphyry Cu-Mo deposit, Arizona. J. Geochem. Explor. 2017, 178, 45–54. [Google Scholar] [CrossRef]
  20. Ciobanu, C.L.; Cook, N.J.; Kelson, C.R.; Guerin, R.; Kalleske, N.; Danyushevsky, L. Trace element heterogeneity in molybdenite fingerprints stages of mineralization. Chem. Geol. 2013, 347, 175–189. [Google Scholar] [CrossRef]
  21. Pasava, J.; Svojtka, M.; Veselovsky, F.; Durisova, J.; Ackerman, L.; Pour, O.; Drabek, M.; Halodova, P.; Haluzova, E. Laser ablation ICPMS study of trace element chemistry in molybdenite coupled with scanning electron microscopy (SEM)-An important tool for identification of different types of mineralization. Ore Geol. Rev. 2016, 72, 874–895. [Google Scholar] [CrossRef]
  22. Ren, Z.; Zhou, T.; Hollings, P.; White, N.C.; Wang, F.-Y.; Yuan, F. Trace element geochemistry of molybdenite from the Shapinggou super-large porphyry Mo deposit, China. Ore Geol. Rev. 2018, 95, 1049–1065. [Google Scholar] [CrossRef]
  23. Plotinskaya, O.Y.; Abramova, V.D.; Groznova, E.O.; Tessalina, S.G.; Seltmann, R.; Spratt, J. Trace-element geochemistry of molybdenite from porphyry Cu deposits of the Birgilda-Tomino ore cluster (South Urals, Russia). Miner. Mag. 2018, 82, S281–S306. [Google Scholar] [CrossRef] [Green Version]
  24. Shafiei Bafti, B.; Svojtka, M.; Abdolahi, M. Geochemistry of Rhenium and Other Trace Elements in Molybdenite, Sar Cheshmeh Porphyry Cu-Mo Deposit, Iran. Acta Geol. Sin.-Engl. Ed. 2021, 95, 1217–1235. [Google Scholar] [CrossRef]
  25. Newberry, R.J. Polytypism in molybdenite (I): A non-equilibrium impurity-induced phenomenon. Am. Mineral. 1979, 64, 758–767. [Google Scholar]
  26. Newberry, R.J. Polytypism in molybdenite (II); Relationships between polytypism, ore deposition/alteration stages and rhenium contents. Am. Mineral. 1979, 64, 768–775. [Google Scholar]
  27. McCandless, T.E.; Ruiz, J.; Campbell, A.R. Rhenium behavior in molybdenite in hypogene and near-surface environments: Implications for Re-Os geochronometry. Geochim. Cosmochim. Acta 1993, 57, 889–905. [Google Scholar] [CrossRef]
  28. Cook, N.J.; Ciobanu, C.L.; Mao, J. Textural control on gold distribution in As-free pyrite from the Dongping, Huangtuliang and Hougou gold deposits, North China Craton (Hebei Province, China). Chem. Geol. 2009, 264, 101–121. [Google Scholar] [CrossRef]
  29. Maslennikov, V.V.; Maslennikova, S.P.; Large, R.R.; Danyushevsky, L.V. Study of Trace Element Zonation in Vent Chimneys from the Silurian Yaman-Kasy Volcanic-Hosted Massive Sulfide Deposit (Southern Urals, Russia) Using Laser Ablation-Inductively Coupled Plasma-Mass Spectrometry (LA-ICPMS). Econ. Geol. 2009, 104, 1111–1141. [Google Scholar] [CrossRef]
  30. Reich, M.; Palacios, C.; Barra, F.; Chryssoulis, S. “Invisible” silver in chalcopyrite and bornite from the Mantos Blancos Cu deposit, northern Chile. Eur. J. Mineral. 2013, 25, 453–460. [Google Scholar] [CrossRef]
  31. Norman, M.; Bennett, V.; Blevin, P.; McCulloch, M. New Re-Os ages of molybdenite from granite-related deposits of Eastern Australia using an improved multi-collector ICP-MS technique. In Geological Society of Australia Abstracts; Geological Society of Australia: Hornsby, Australia, 2004; pp. 129–132. [Google Scholar]
  32. Mao, J.; Zhang, Z.; Zhang, Z.; Du, A. Re-Os isotopic dating of molybdenites in the Xiaoliugou W (Mo) deposit in the northern Qilian mountains and its geological significance. Geochim. Cosmochim. Acta 1999, 63, 1815–1818. [Google Scholar]
  33. Sun, W.; Bennett, V.C.; Kamenetsky, V.S. The mechanism of Re enrichment in arc magmas: Evidence from Lau Basin basaltic glasses and primitive melt inclusions. Earth Planet. Sci. Lett. 2004, 222, 101–114. [Google Scholar] [CrossRef]
  34. Sinclair, D.W.; Jonasson, I.R.; Kirkham, R.V.; Soregaroli, A.E. Rhenium and Other Platinum-Group Metals in Porphyry Deposits; Open File 6181; Geological Survey of Canada: Ottawa, ON, Canada, 2009. [Google Scholar]
  35. Blevin, P.L. The primacy of magma compositions in determining the Re and W contents of molybdenite. In Proceedings of the 24th International Applied Geochemistry Symposium, Fredericton, NB, Canada, 1–4 June 2009; pp. 119–122. [Google Scholar]
  36. Mao, J.; Wang, Y.; Lehmann, B.; Yu, J.; Du, A.; Mei, Y.; Li, Y.; Zang, W.; Stein, H.J.; Zhou, T. Molybdenite Re–Os and albite 40Ar/39Ar dating of Cu–Au–Mo and magnetite porphyry systems in the Yangtze River valley and metallogenic implications. Ore Geol. Rev. 2006, 29, 307–324. [Google Scholar] [CrossRef]
  37. Voudouris, P.C.; Melfos, V.; Spry, P.G.; Bindi, L.; Kartal, T.; Arikas, K.; Moritz, R.; Ortelli, M. Rhenium-rich molybdenite and rheniite in the Pagoni Rachi Mo-Cu-Te-Ag-Au prospect, northern Greece: Implications for the re geochemistry of porphyry-style Cu-Mo and Mo mineralization. Can. Mineral. 2009, 47, 1013–1036. [Google Scholar] [CrossRef]
  38. Huang, X.-W.; Sappin, A.-A.; Boutroy, É.; Beaudoin, G.; Makvandi, S. Trace element composition of igneous and hydrothermal magnetite from porphyry deposits: Relationship to deposit subtypes and magmatic affinity. Econ. Geol. 2019, 114, 917–952. [Google Scholar] [CrossRef]
  39. Makvandi, S.; Ghasemzadeh-Barvarz, M.; Beaudoin, G.; Grunsky, E.C.; McClenaghan, M.B.; Duchesne, C.; Boutroy, E. Partial least squares-discriminant analysis of trace element compositions of magnetite from various VMS deposit subtypes: Application to mineral exploration. Ore Geol. Rev. 2016, 78, 388–408. [Google Scholar] [CrossRef]
  40. Huang, X.-W.; Boutroy, É.; Makvandi, S.; Beaudoin, G.; Corriveau, L.; De Toni, A.F. Trace element composition of iron oxides from IOCG and IOA deposits: Relationship to hydrothermal alteration and deposit subtypes. Miner. Depos. 2019, 54, 525–552. [Google Scholar] [CrossRef]
  41. Eriksson, L.; Byrne, T.; Johansson, E.; Trygg, J.; Vikström, C. Multi-and Megavariate Data Analysis Basic Principles and Applications; MKS Umetrics AB: Stortorget, Sweden, 2013; pp. 1–521. [Google Scholar]
  42. Yin, C.; Liu, J.; Carranza, E.J.M.; Zhai, D.; Guo, Y. Mineralogical constraints on the genesis of the Dahu quartz vein-style Au-Mo deposit, Xiaoqinling gold district, China: Implications for phase relationships and physicochemical conditions. Ore Geol. Rev. 2019, 113, 103–107. [Google Scholar] [CrossRef]
  43. Cook, N.J.; Ciobanu, C.L.; Spry, P.G.; Voudouris, P. Understanding gold-(silver)-telluride-(selenide) mineral deposits. Epis. J. Int. Geosci. 2009, 32, 249–263. [Google Scholar] [CrossRef] [Green Version]
  44. Ciobanu, C.L.; Cook, N.; Pring, A. Bismuth tellurides as gold scavengers. In Mineral Deposit Research; Mao, J.W., Bierlein, F.P., Eds.; Meeting the Global Challenge Springer: Berlin/Heidelberg, Germany; New York, NY, USA, 2005; pp. 1383–1386. [Google Scholar]
  45. Ciobanu, C.L.; Cook, N.J.; Spry, P.G. Preface—Special Issue: Telluride and selenide minerals in gold deposits—How and why? Mineral. Petrol. 2006, 87, 163–169. [Google Scholar] [CrossRef]
  46. Tooth, B.; Ciobanu, C.L.; Green, L.; O’Neill, B.; Brugger, J. Bi-melt formation and gold scavenging from hydrothermal fluids: An experimental study. Geochim. Cosmochim. Acta 2011, 75, 5423–5443. [Google Scholar] [CrossRef]
  47. Hastie, E.C.G.; Kontak, D.J.; Lafrance, B. Gold Remobilization: Insights from Gold Deposits in the Archean Swayze Greenstone Belt, Abitibi Subprovince, Canada. Econ. Geol. 2020, 115, 241–277. [Google Scholar] [CrossRef]
  48. Douglas, N.; Mavrogenes, J.; Hack, A.; England, R. The Liquid Bismuth Collector Model: An Alternative Gold Deposition Mechanism. In Understanding Planet Earth; Searching for a Sustainable Future; on the Starting Blocks of the This Millennium Australian Geological Convention Abstract; Skilbeck, C.G., Hubble, T.C.T., Eds.; Geological Society of Australia: Hornsby, Australia, 2000; Volume 59, p. 135. [Google Scholar]
  49. Cook, N.J.; Ciobanu, C.L. Tellurides in Au deposits: Implications for modelling. In Mineral Deposit Research: Meeting the Global Challenge; Mao, J.W., Bierlein, F.P., Eds.; Springer: Berlin/Heidelberg, Germany; New York, NY, USA, 2005; pp. 1387–1390. [Google Scholar]
  50. Voudouris, P.C. Conditions of formation of the Mavrokoryfi high-sulfidation epithermal Cu–Ag–Au–Te mineralization (Petrota Graben, NE Greece). Mineral. Petrol. 2011, 101, 97–113. [Google Scholar] [CrossRef]
  51. Cockerton, A.B.D.; Tomkins, A.G. Insights into the Liquid Bismuth Collector Model Through Analysis of the Bi-Au Stormont Skarn Prospect, Northwest Tasmania. Econ. Geol. 2012, 107, 667–682. [Google Scholar] [CrossRef]
  52. Guimarães, F.S.; Cabral, A.R.; Lehmann, B.; Rios, F.J.; Ávila, M.A.B.; Castro, M.P.; Queiroga, G.N. Bismuth-melt trails trapped in cassiterite–quartz veins. Terra Nova 2019, 31, 358–365. [Google Scholar] [CrossRef]
  53. Jian, W.; Mao, J.; Lehmann, B.; Cook, N.J.; Xie, G.; Liu, P.; Duan, C.; Alles, J.; Niu, Z. Au-Ag-Te–rich melt inclusions in hydrothermal gold-quartz veins, xiaoqinling lode gold district, Central China. Econ. Geol. 2021, 116, 1239–1248. [Google Scholar] [CrossRef]
  54. Barton, I.F.; Rathkopf, C.A.; Barton, M.D. Rhenium in Molybdenite: A Database Approach to Identifying Geochemical Controls on the Distribution of a Critical Element. Min. Metall. Explor. 2020, 37, 21–37. [Google Scholar] [CrossRef]
  55. Chambefort, I.; Dilles, J.H.; Kent, A.J.R. Anhydrite-bearing andesite and dacite as a source for sulfur in magmatic-hydrothermal mineral deposits. Geology 2008, 36, 719–722. [Google Scholar] [CrossRef]
  56. Richards, J.P. Magmatic to hydrothermal metal fluxes in convergent and collided margins. Ore Geol. Rev. 2011, 40, 1–26. [Google Scholar] [CrossRef]
  57. Richards, J.P. The oxidation state, and sulfur and Cu contents of arc magmas: Implications for metallogeny. Lithos 2015, 233, 27–45. [Google Scholar] [CrossRef]
  58. Grondahl, C.; Zajacz, Z. Magmatic controls on the genesis of porphyry Cu–Mo–Au deposits: The Bingham Canyon example. Earth Planet. Sci. Lett. 2017, 480, 53–65. [Google Scholar] [CrossRef]
  59. Crusius, J.; Calvert, S.; Pedersen, T.; Sage, D. Rhenium and molybdenum enrichments in sediments as indicators of oxic, suboxic and sulfidic conditions of deposition. Earth Planet. Sci. Lett. 1996, 145, 65–78. [Google Scholar] [CrossRef]
  60. Algeo, T.J.; Lyons, T.W. Mo-total organic carbon covariation in modern anoxic marine environments: Implications for analysis of paleoredox and paleohydrographic conditions. Paleooceanography 2006, 21, PA1016. [Google Scholar] [CrossRef]
  61. Miller, C.A.; Peucker-Ehrenbrink, B.; Walker, B.D.; Marcantonio, F. Re-assessing the surface cycling of molybdenum and rhenium. Geochim. Cosmochim. Acta 2011, 75, 7146–7179. [Google Scholar] [CrossRef]
  62. Grabezhev, A.I.; Voudouris, P.C. Rhenium distribution in molybdenite from the vosnesensk porphyry Cu ± (Mo, Au) deposit (Southern Urals, Russia). Can. Mineral. 2014, 52, 671–686. [Google Scholar] [CrossRef]
  63. Barkov, A.Y.; Laajoki, K.V.; Men’shikov, Y.P.; Alapieti, T.T.; Sivonen, S.J. First terrestrial occurrence of titanium-rich pyrrhotite, marcasite and pyrite in a fenitized xenolith from the Khibina alkaline complex, Russia. Can. Mineral. 1997, 35, 875–885. [Google Scholar]
  64. Barkov, A.Y.; Martin, R.F.; Men’shikov, Y.P.; Savchenko, Y.E.; Thibault, Y.; Laajoki, K.V.O. Edgarite, FeNb3S6, first natural niobium-rich sulfide from the Khibina alkaline complex, Russian Far North: Evidence for chalcophile behavior of Nb in a fenite. Contrib. Mineral. Petrol. 2000, 138, 229–236. [Google Scholar] [CrossRef]
  65. Barkov, A.Y.; Martin, R.F.; Poirier, G.; Men’shikov, Y.P. Zoned tungstenoan molybdenite from a fenitized megaxenolith in the khibina alkaline complex, kola peninsula, RUSSIA. Can. Mineral. 2000, 38, 1377–1385. [Google Scholar] [CrossRef]
  66. Pašava, J.; Veselovský, F.; Drábek, M.; Svojtka, M.; Pour, O.; Klomínský, J.; Škoda, R.; Ďurišová, J.; Ackerman, L.; Halodová, P.; et al. Molybdenite-tungstenite association in the tungsten-bearing topaz greisen at Vítkov (Krkonoše-Jizera Crystalline Complex, Bohemian Massif): Indication of changes in physico-chemical conditions in mineralizing system. J. Geosci. 2015, 60, 149–161. [Google Scholar] [CrossRef]
  67. Frondel, J.W.; Wickman, F.E. Molybdenite polytypes in theory and occurrence. II. Some naturally-occurring polytypes of molybdenite. Am. Mineral. 1970, 55, 1857–1875. [Google Scholar]
  68. Drábek, M.; Drábková, E.; Kvaček, M. Distribution of Rhenium, tungsten and selenium in molybdebnites of the Bohemian Massif. Věstník Ústředního Ust. Geol. 1993, 68, 11–17. [Google Scholar]
  69. Povarennykh, A.S. Crystal Chemical Classification of Minerals; Plenum Press: New York, NY, USA; London, UK, 1972; p. 766. [Google Scholar]
Figure 1. Distribution of the molybdenite samples from different deposits. The physical map of the world is from M. Colpron (Geological Survey of Canada, Ottawa, ON, Canada).
Minerals 13 00114 g001
Figure 2. Multi-element box and whisker plots for LA–ICP–MS trace element data (ppm) of molybdenite from seventeen deposit types. See detailed explanation in text.
Minerals 13 00114 g002
Figure 3. PLS-DA results of LA–ICP–MS data of molybdenite from seventeen deposit types. Plots of qw*1 vs. qw*2 ((a), first and second loadings), qw*1 vs. qw*3 ((c), first and third loadings), and qw*1 vs. qw*4 ((e), first and fourth loadings) showing correlations between elements and deposit types. Plots of t1 vs. t2 ((b), first and second scores), t1 vs. t3 ((d), first and third scores), and t1 vs. t4 ((f), first and fourth scores) showing the distribution of individual analyses of molybdenite in the latent variable space defined by qw*1–qw*2 in (a), qw*1–qw*3 in (c), and qw*1–qw*4 in (e), respectively.
Minerals 13 00114 g003
Figure 4. Score contribution (ae) and VIP-cumulative plot (f) corresponding to PLS-DA results in Figure 3.
Minerals 13 00114 g004
Figure 5. PLS-DA results of LA–ICP–MS data of molybdenite from ten deposit types. Plots of qw*1 vs. qw*2 ((a), first and second loadings), qw*1 vs. qw*3 ((c), first and third loadings), and qw*1 vs. qw*4 ((e), first and fourth loadings) showing correlations between elements and deposit types. Plots of t1 vs. t2 ((b), first and second scores), t1 vs. t3 ((d), first and third scores), and t1 vs. t4 ((f), first and fourth scores) showing the distribution of individual analyses of molybdenite in the latent variable space defined by qw*1–qw*2 in (a), qw*1–qw*3 in (c), and qw*1–qw*4 in (e) respectively.
Minerals 13 00114 g005
Figure 6. Score contribution (ae) and VIP-cumulative plot (f) corresponding to PLS-DA results in Figure 5.
Minerals 13 00114 g006
Disclaimer/Publisher’s Note: The statements, opinions and data contained in all publications are solely those of the individual author(s) and contributor(s) and not of MDPI and/or the editor(s). MDPI and/or the editor(s) disclaim responsibility for any injury to people or property resulting from any ideas, methods, instructions or products referred to in the content.

