Article

Three-Dimensional Mineral Prospectivity Modeling for Delineation of Deep-Seated Skarn-Type Mineralization in Xuancheng–Magushan Area, China

1
Ore Deposit and Exploration Centre (ODEC), School of Resources and Environmental Engineering, Hefei University of Technology, Hefei 230009, China
2
Anhui Province Engineering Research Center for Mineral Resources and Mine Environments, Hefei 230009, China
*
Author to whom correspondence should be addressed.
Minerals 2022, 12(9), 1174; https://doi.org/10.3390/min12091174
Submission received: 31 July 2022 / Revised: 10 September 2022 / Accepted: 11 September 2022 / Published: 18 September 2022
(This article belongs to the Special Issue 3D/4D Geological Modeling for Mineral Exploration)

Abstract

:
The Middle–Lower Yangtze River Metallogenic Belt is an important copper and iron polymetallic metallogenic belt in China. Today’s economic development is inseparable from the support of metal mineral resources. With the continuous exploitation of shallow and easily identifiable mines in China, the prospecting work of deep and hidden mines is very important. Mineral prospectivity modeling (MPM) is an important means to improve the efficiency of mineral exploration. With the increase in resource demands and exploration difficulty, the traditional 2DMPM is often difficult to use to reflect the information of deep mineral deposits. More large-scale deposits are needed to carry out 3DMPM research. With the rise of artificial intelligence, the combination of machine learning and geological big data has become a hot issue in the field of 3DMPM. In this paper, a case study of 3DMPM is carried out based on the Xuancheng–Magushan area’s actual data. Two machine learning methods, the random forest and the logistic regression, are selected for comparison. The results show that the 3DMPM based on random forest method performs better than the logistic regression method. It can better characterize the corresponding relationship between the geological structure combination and the metallogenic distribution, and the accuracy in the test set reaches 96.63%. This means that the random forest model could provide more effective and accurate support for integrating predictive data during 3DMPM. Finally, five prospecting targets with good metallogenic potential are delineated in the deep area of the Xuancheng–Magushan area for future exploration.

1. Introduction

A huge prospecting potential is in concealed and deep mines, especially in the so-called “Second depth space” (500 m–2000 m); there are very likely to be abundant mineral resources there [1,2]. At present, some domestic and foreign examples of deep mineral exploration have proved the views of experts and scholars [3,4]. Although a series of deep mine exploration results show the prospecting potential of concealed and deep mines, there are also many problems, such as difficulty in exploration and imperfect exploration methods [5,6,7]. Therefore, more reasonable and effective technology is needed at this stage to adapt to the prospecting work in the large-scale Quaternary strata coverage area and the lower-cost method to find hidden and deep mines.
In recent years, with the development of computer technology and the support of geophysical methods, 3D modeling technology can fully integrate multivariate and multidimensional data to accurately depict deep geological structures [8,9,10,11]. At present, the wide application of artificial intelligence, especially machine learning technology, can provide a new way to process massive geological big data. Compared with traditional methods, machine learning often has higher prediction accuracy, especially for geological data with massive and high-dimensional characteristics, which can effectively explore the complex nonlinear relationship between ore-control characteristics and ore-forming mechanisms. At present, machine learning methods include the probabilistic neural network, the support vector machine, the random forest, adaptive learning, the restricted Boltzmann machine, etc.; most of them have been applied and developed in the field of 2DMPM. Oh et al. [12] analyzed the potential of hydrothermal gold–silver mineral deposits in the Taebaeksan mineralized district, Korea, and the Artificial neural network (ANN) method and selected factors related to the occurrence of gold and silver minerals as ore-control factors, including magnetic anomaly geophysical data, geological and fault structure geological data, geochemical data, etc. Good results have been achieved [12]. Xiong et al. [13] identified multiple geochemical anomalies related to Fe polymetallic mineralization in the southwestern Fujian district (China) by using the limited Boltzmann machine. The research shows that most of the known skarn-type iron deposits are located in geochemical anomaly areas, which can provide reference for further exploration [13]. In order to effectively delineate favorable exploration targets for Cu-Au mineralization in the Moalleman District, NE Iran, Ghezelbash et al. [14] integrated several effective evidence layers such as geochemistry, geology, structure, and hydrothermal alteration in the study area; used SVM with radial basis function kernel to predict mineralization; and delineated the metallogenic prospect area [14]. However, the above methods are only based on two-dimensional geological data for prediction, which cannot fully characterize the multiple geological characteristics and may be difficult to make fine prediction of deep mines and hidden mines. The combination of 3D technology and artificial intelligence is beneficial to more fully excavate and integrate 3D prediction information and achieve more accurate positioning and quantitative predictions of deeply hidden ore bodies [15,16,17,18].
Compared with other mineralized areas in the Middle-Lower Yangtze River Metallogenic Belt, the Quaternary strata in the Xuancheng–Magushan area within the Middle-Lower Yangtze River Metallogenic Belt have a large coverage area and shallow geological exploration. The deep geological structure is not yet clear. It is difficult to describe the deep geological structure in this area in detail, which seriously affects the research of deep ore prospecting and prediction there [19]. Aiming at the Xuancheng–Magushan area, this paper firstly builds a 3D geological model that can accurately describe the deep geological structure with the support of geophysical methods and geological data. Based on this, two machine learning methods, the logistic regression model and the random forest model, were used to predict skarn deposits in the study area in three dimensions. Then, we divide the training set and the test set according to the data, the former trains the model, and the latter evaluates the performance of the model. The optimal results were selected to delineate the prospecting. Finally, the target area is expected to provide a new prospecting direction for further deep prospecting and exploration work in this area.

2. Methods

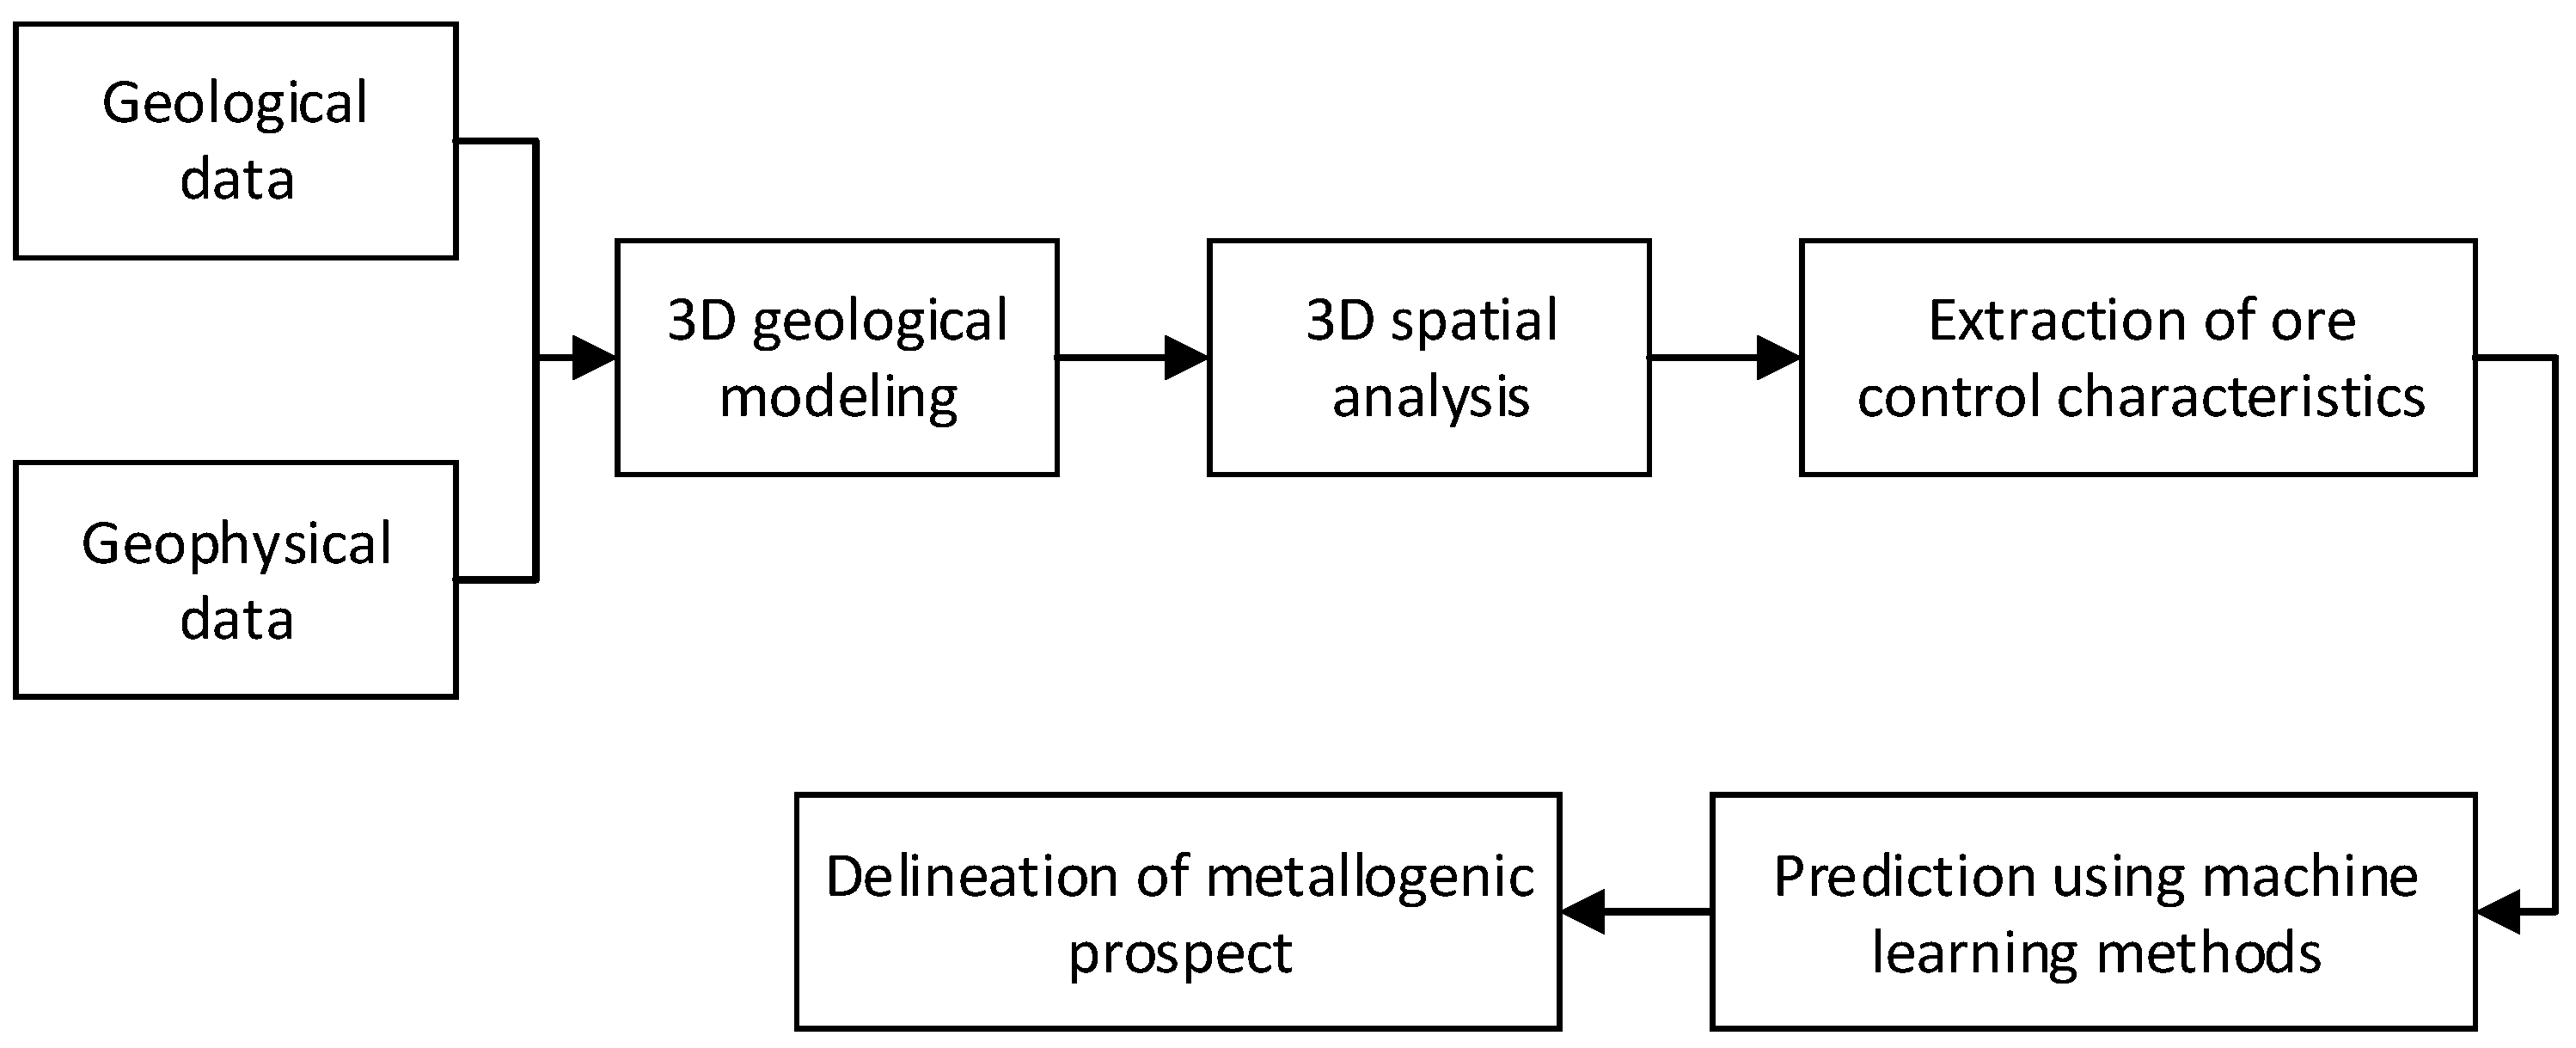
2.1. 3D Mineral Prospectivity Modeling

In recent years, the MPM has become an important means of prospecting and exploration. It can guide on-site prospecting work, thereby reducing the risk of prospecting. With the development of computer technology, a quantitative-based MPM method system has been put forward at home and abroad, which promotes the development of MPMfrom qualitative to quantitative and can more accurately delineate the metallogenic target area [20,21,22,23,24]. However, the above-mentioned quantitative MPM methods are mainly oriented towards the traditional two-dimensional prediction, which mostly uses two-dimensional geological data. However, the deep metal mineral resources have experienced multiple periods of geological evolution, resulting in weak surface indication information and complex geological structures. It is difficult to indicate prospecting work with traditional prediction methods based on two-dimensional geological data [25]. As deep ores and hidden ores have become the focus of prospecting in recent years, the research on the quantitative prediction of mineralization has moved from “two-dimensional” to “three-dimensional” [26].
The rise of artificial intelligence also provides a new way to process and mine massive geological data contained in 3D models [27]. Machine learning simulates human learning behavior through computers. It utilizes its nonlinear learning ability to characterize potential complex geological features by continuously training models and fitting parameters. In recent years, many scholars have begun to try to carry out 3DMPM research, including using the evidence weight model, the logistic regression model, the random forest model, and the artificial neural network model [28,29,30,31]. The above methods have shown good research potential in the field of 3DMPM. They can effectively process massive multi-dimensional geological data and have become an important development trend in this field.
In this paper, 3D geological modeling, 3D spatial analysis and 3DMPM based on machine learning are integrated. First, a 3D geological model is established based on geological data, and then a variety of 3D spatial analysis methods are used to analyze the 3D geological model and relevant metallogenic indicative characteristics, so as to obtain quantitative ore control and indicative characteristic information. Then, the prediction method based on machine learning is used to predict the mineralization of the deep edge of the mining area, and its effect is evaluated. Finally, the prediction results are used to divide the metallogenic prospective area, to realize the positioning and quantitative prediction of the hidden ore bodies at the deep edge of the known deposits. The forecast flow chart is shown in Figure 1.

2.2. Logistic Regression Algorithm

Logistic regression is a representative algorithm in machine learning. This algorithm has been applied in many fields such as medicine, biology, and geology [32,33,34]. It can calculate the correlation between the independent input variable and the dependent variable through the regression principle and calculate the specific probability value of the dependent variable belonging to a certain category according to the existing state of the independent variable. As a multivariate nonlinear regression model, it can better fit the nonlinear relationship between various ore-controlling characteristics and metallogenic facts [35,36]. In this paper, metallogenic facts are used as the dependent variable, and various ore -controlling factors related to the metallogenic mechanism are used as the independent variables. The logistic regression method calculates the probability of ore bodies’ existence in the corresponding blocks.
P ( Z ) = 1 ( 1 + e Z )
Z = α + β i x j
In the above formulas: P ( Z ) is the favorable degree of mineralization, x i is the i-th ore control or indicator element, ( i = 1, 2, …, n), α is a constant, β i is a regression factor, that is, each control contribution of ore elements to the existence of ore bodies. It can be determined by fitting with the maximum likelihood estimation method. Each parameter is optimally solved using the gradient descent method.

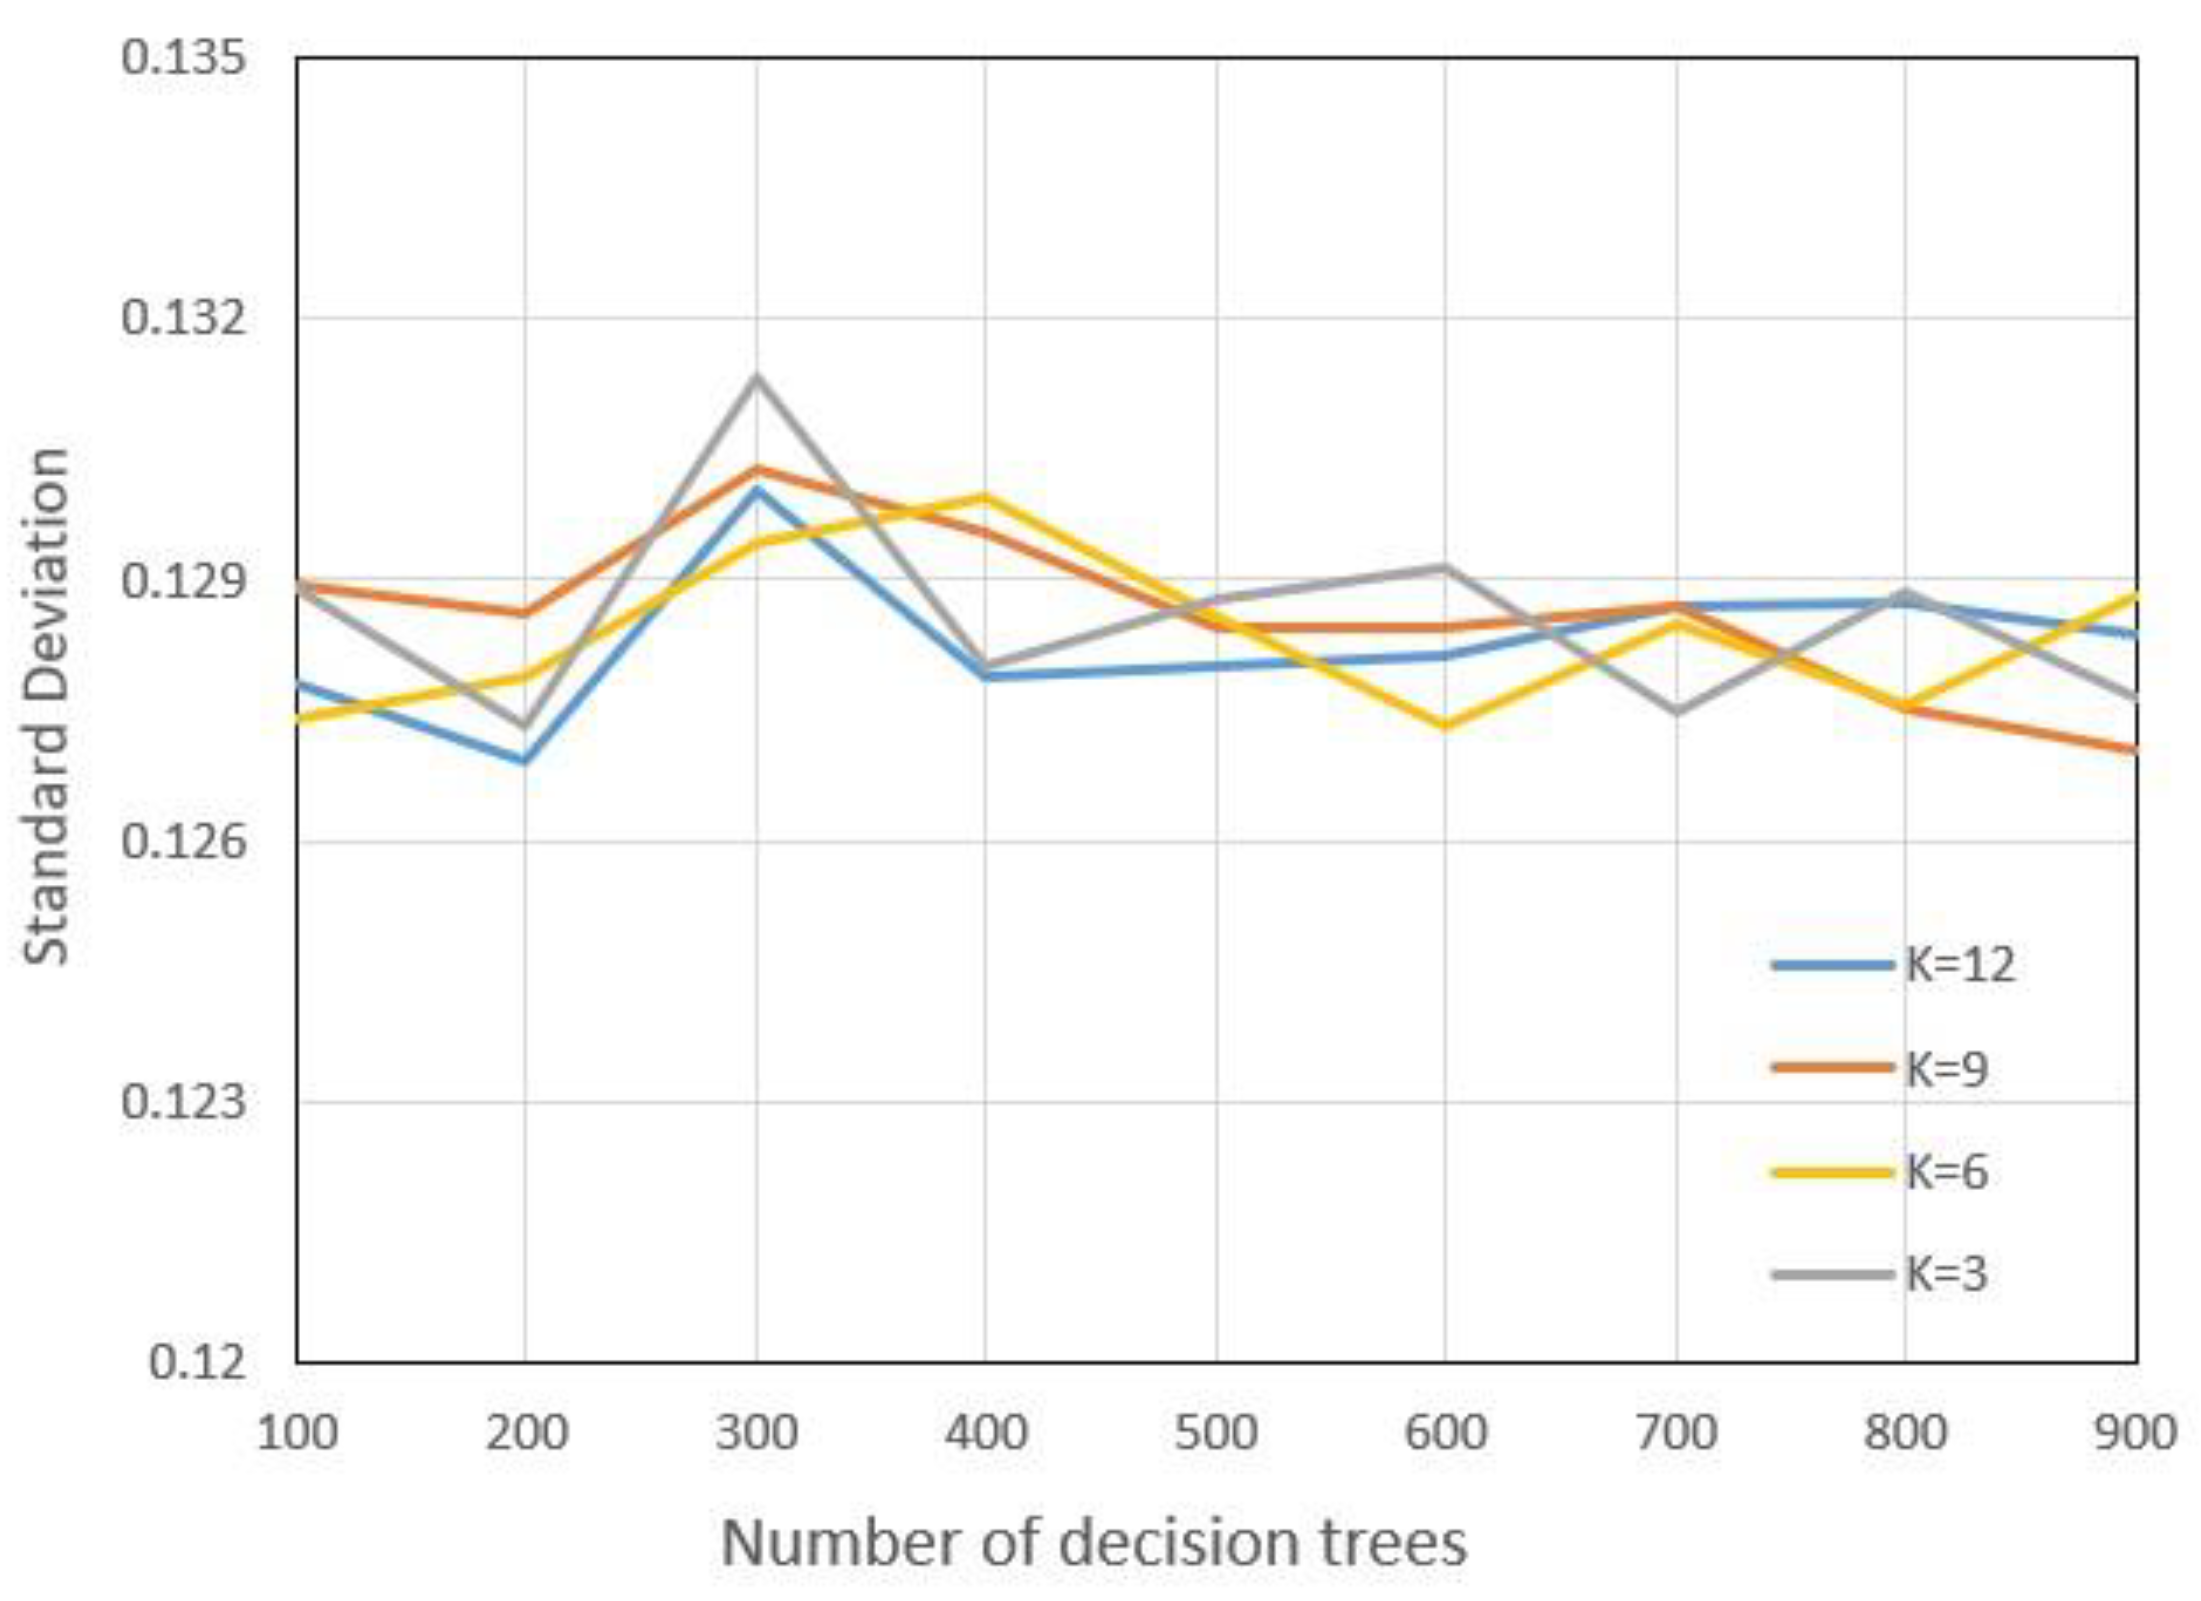
2.3. Random Forest Algorithm

In the ensemble learning model [37,38], first proposed by Leo Breiman, the essence of the random forest is a classifier or regression model composed of multiple unrelated decision trees: i.e., determine the category and, if it is a regression scenario, take the average of the solution parameters as the final result. The algorithm has two important randomness characteristics. The first point is to randomize the samples. By performing multiple random extractions with replacements from the total data set, multiple subsets of the same number of data samples are obtained as training sets to reduce the phenomenon of overfitting. The second point is to randomize the features. For each decision tree, a different subset of features is extracted from the feature set for learning. In this way, the robustness of the feature selection can be enhanced, so that the user does not need to deliberately filter the features. At the same time, the important indicators of all of the features of the model’s results can be obtained.
Each decision tree in the random forest selects the feature that can maximize the information gained in the feature subset as the current split node. Multiple regression decision trees constitute the random forest regression algorithm. Based on the idea of ensemble learning, the mean value of the decision tree is taken as the prediction result, namely
h ¯ ( x ) = 1 T t = 1 T h ( x , θ t ) ,
where h ¯ ( x ) is the model prediction result; is h ( x , θ t ) the output x based on x sum, is the independent θ t variable, θ t is the independent and identically distributed random vector, and T is the number of regression decision trees.

3. Case Study Area and Data

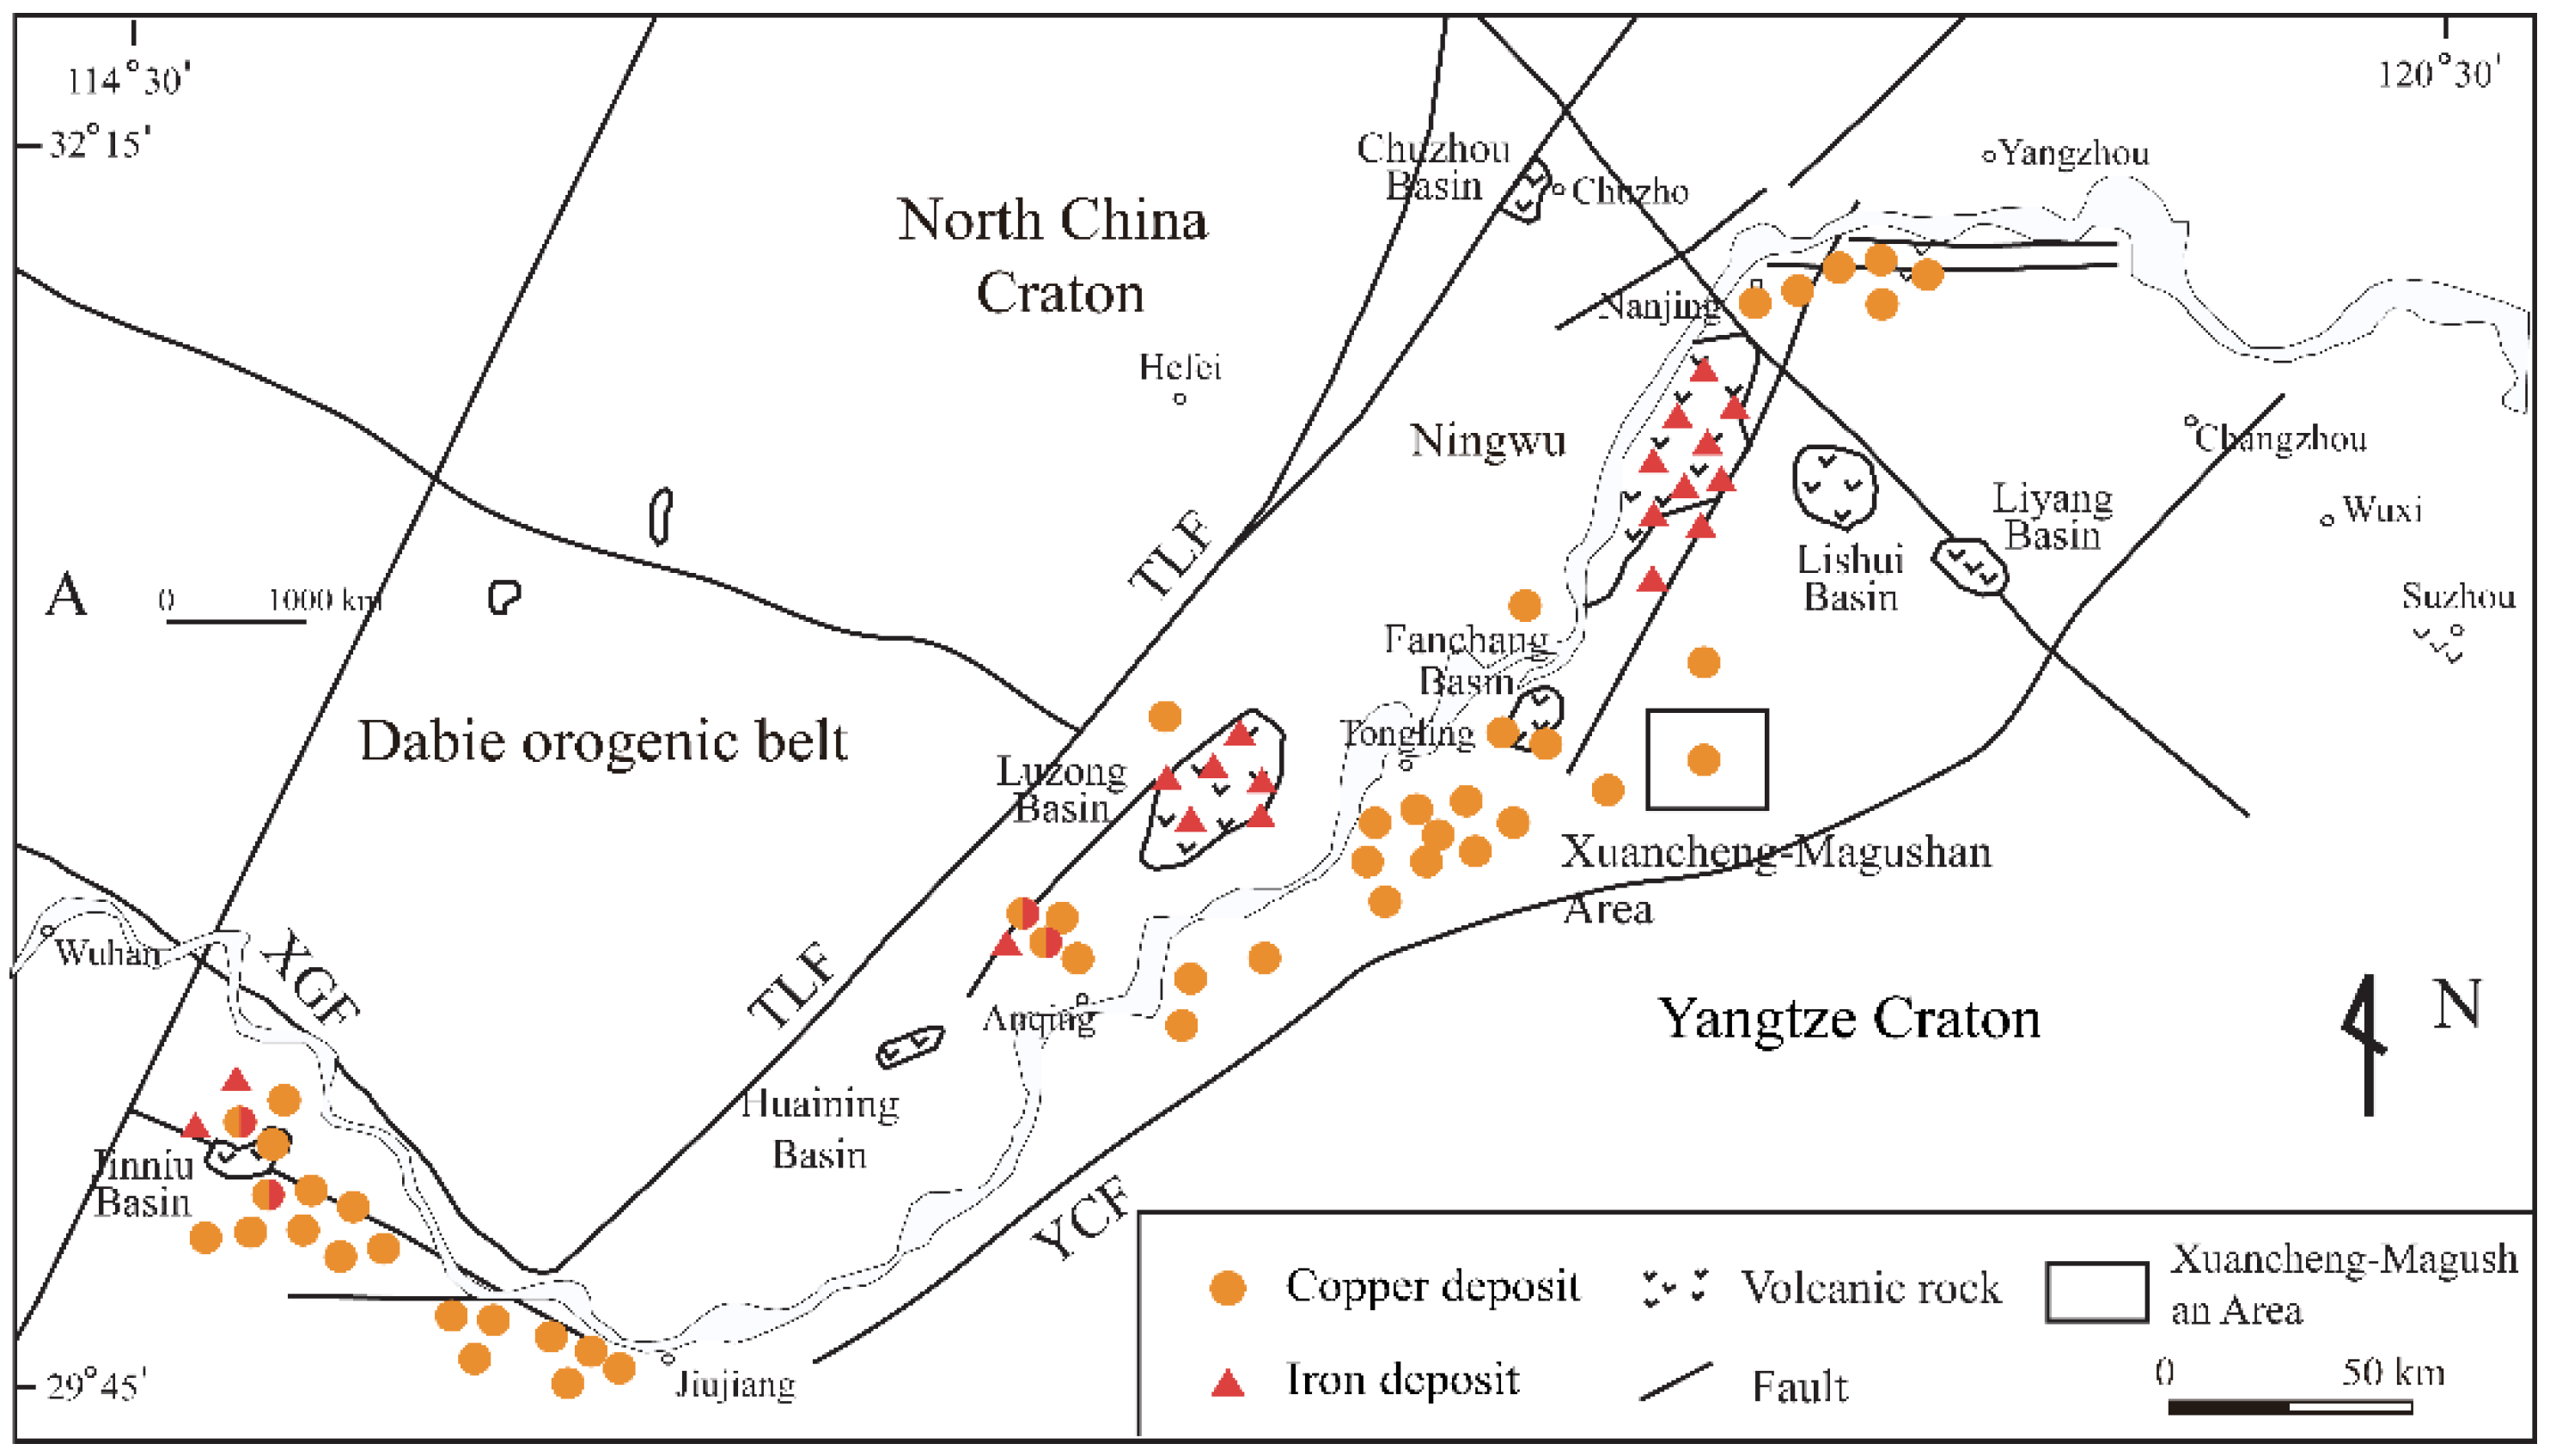
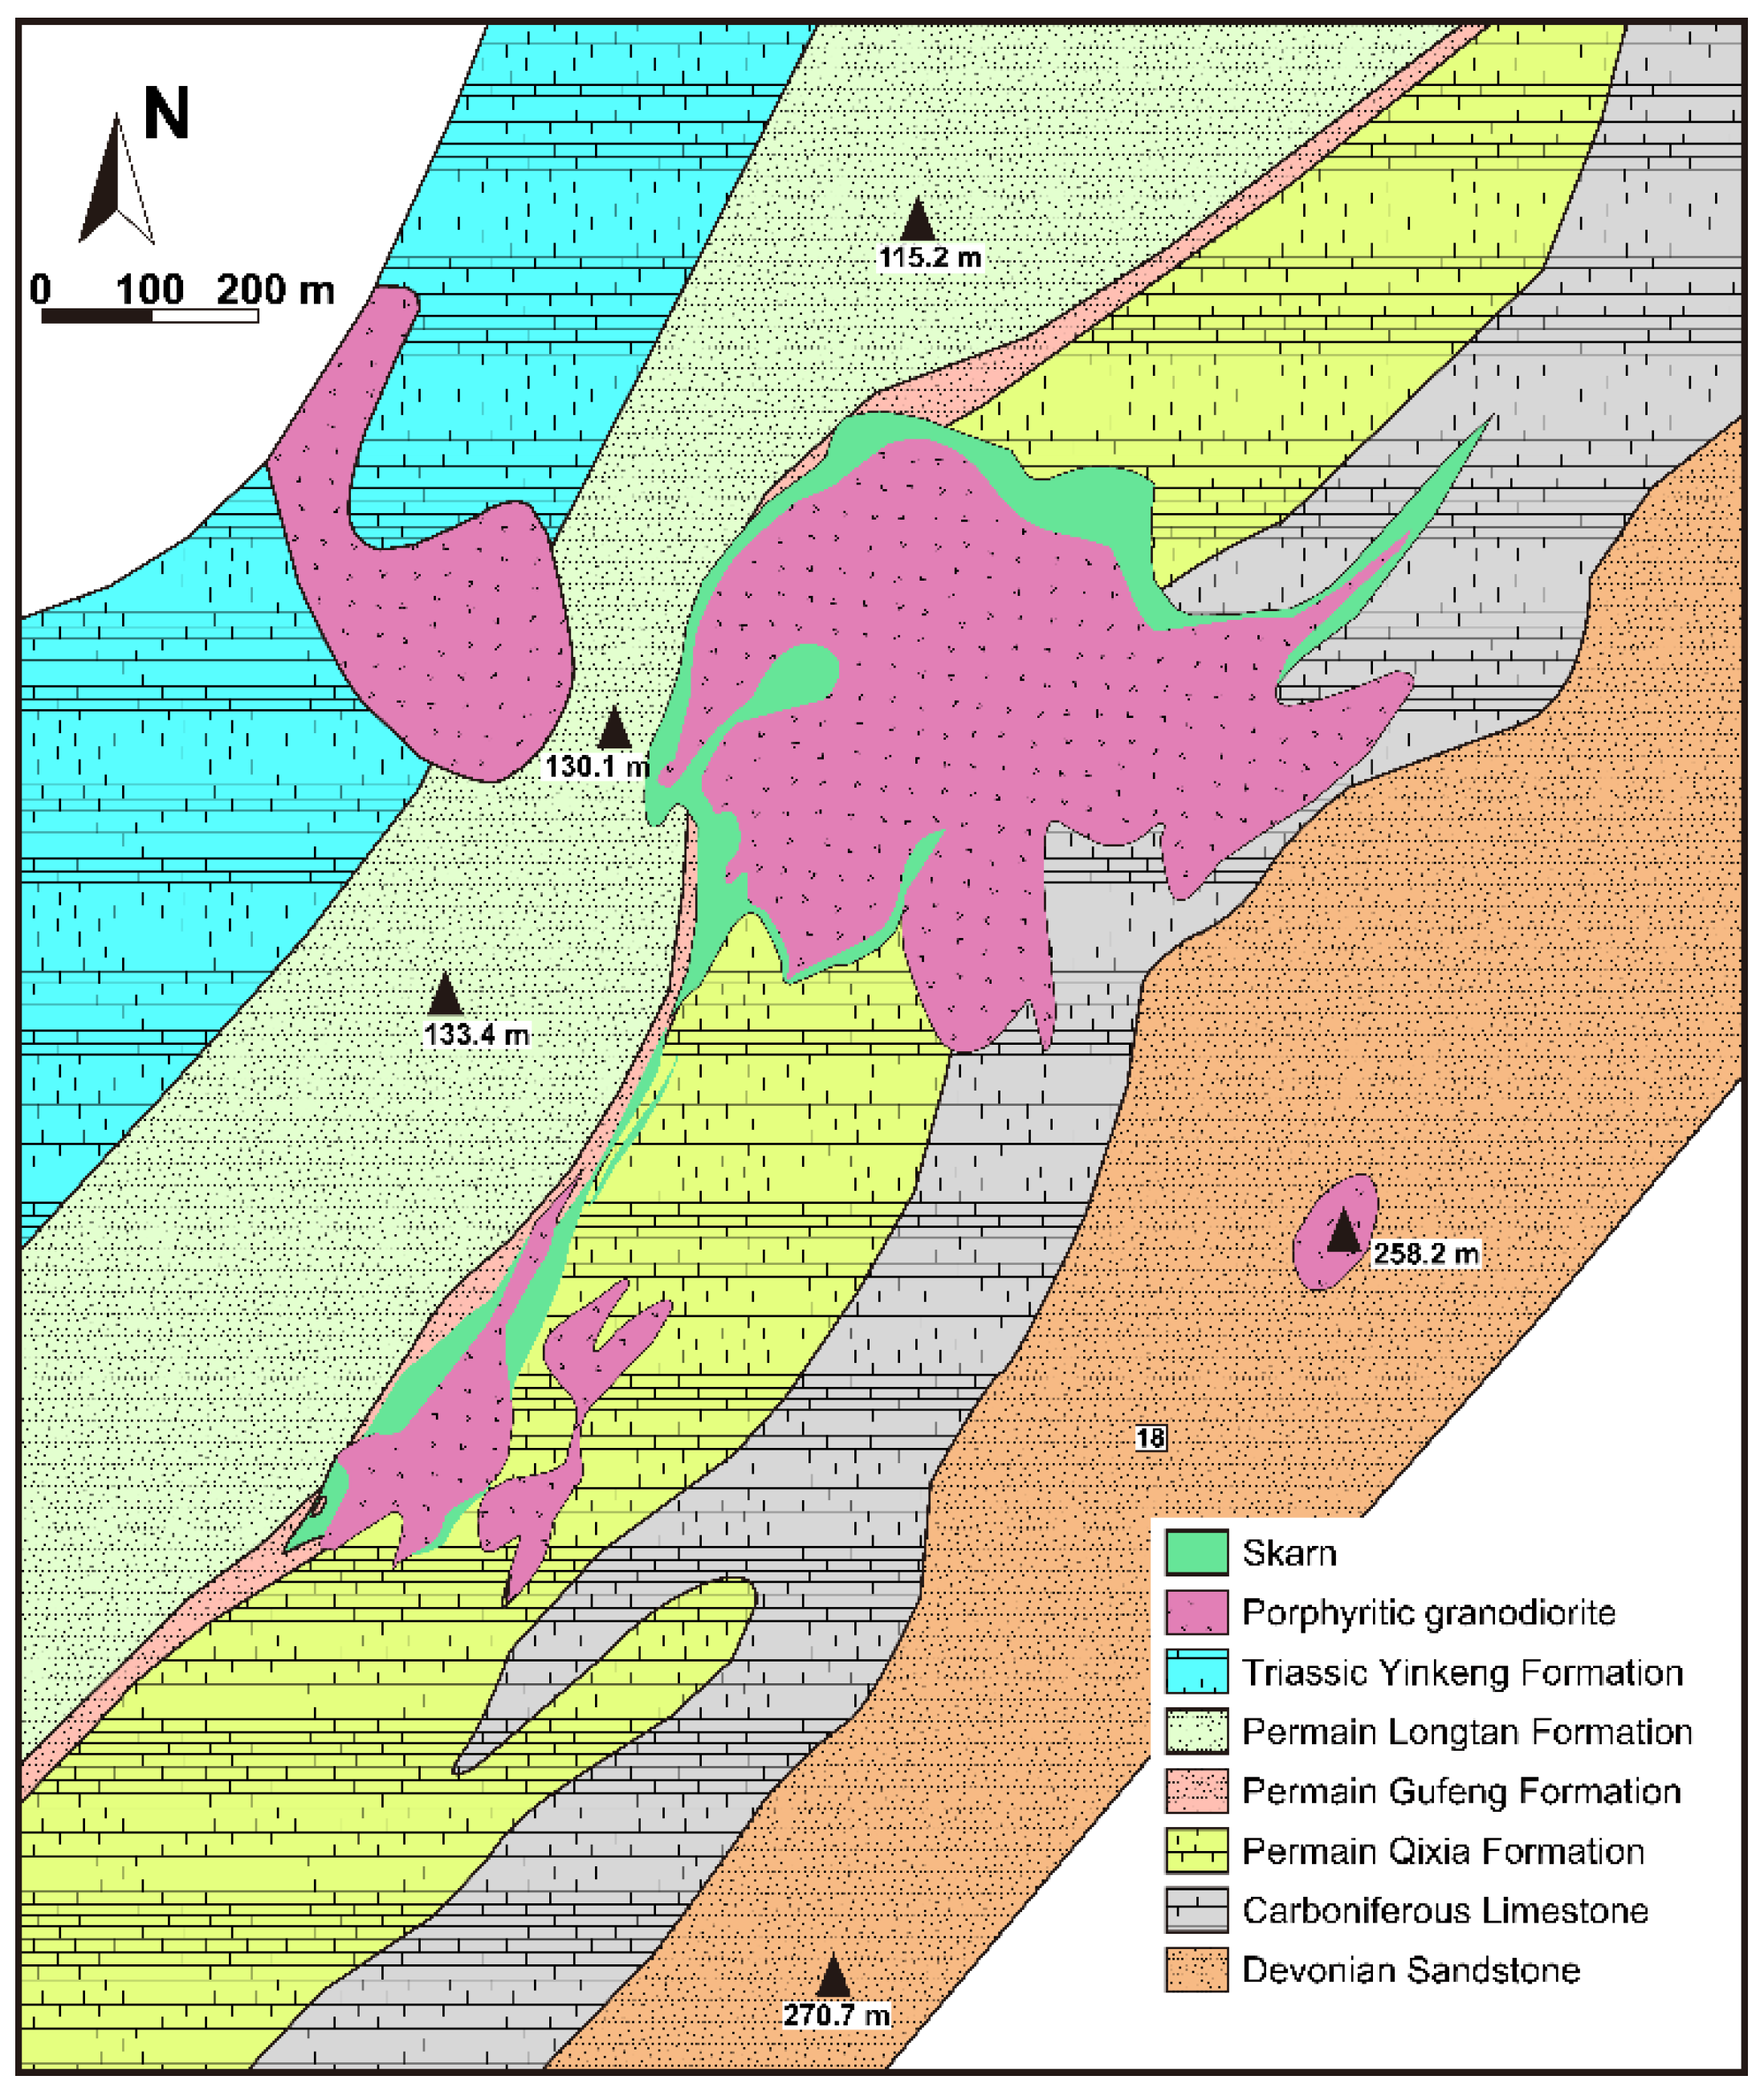
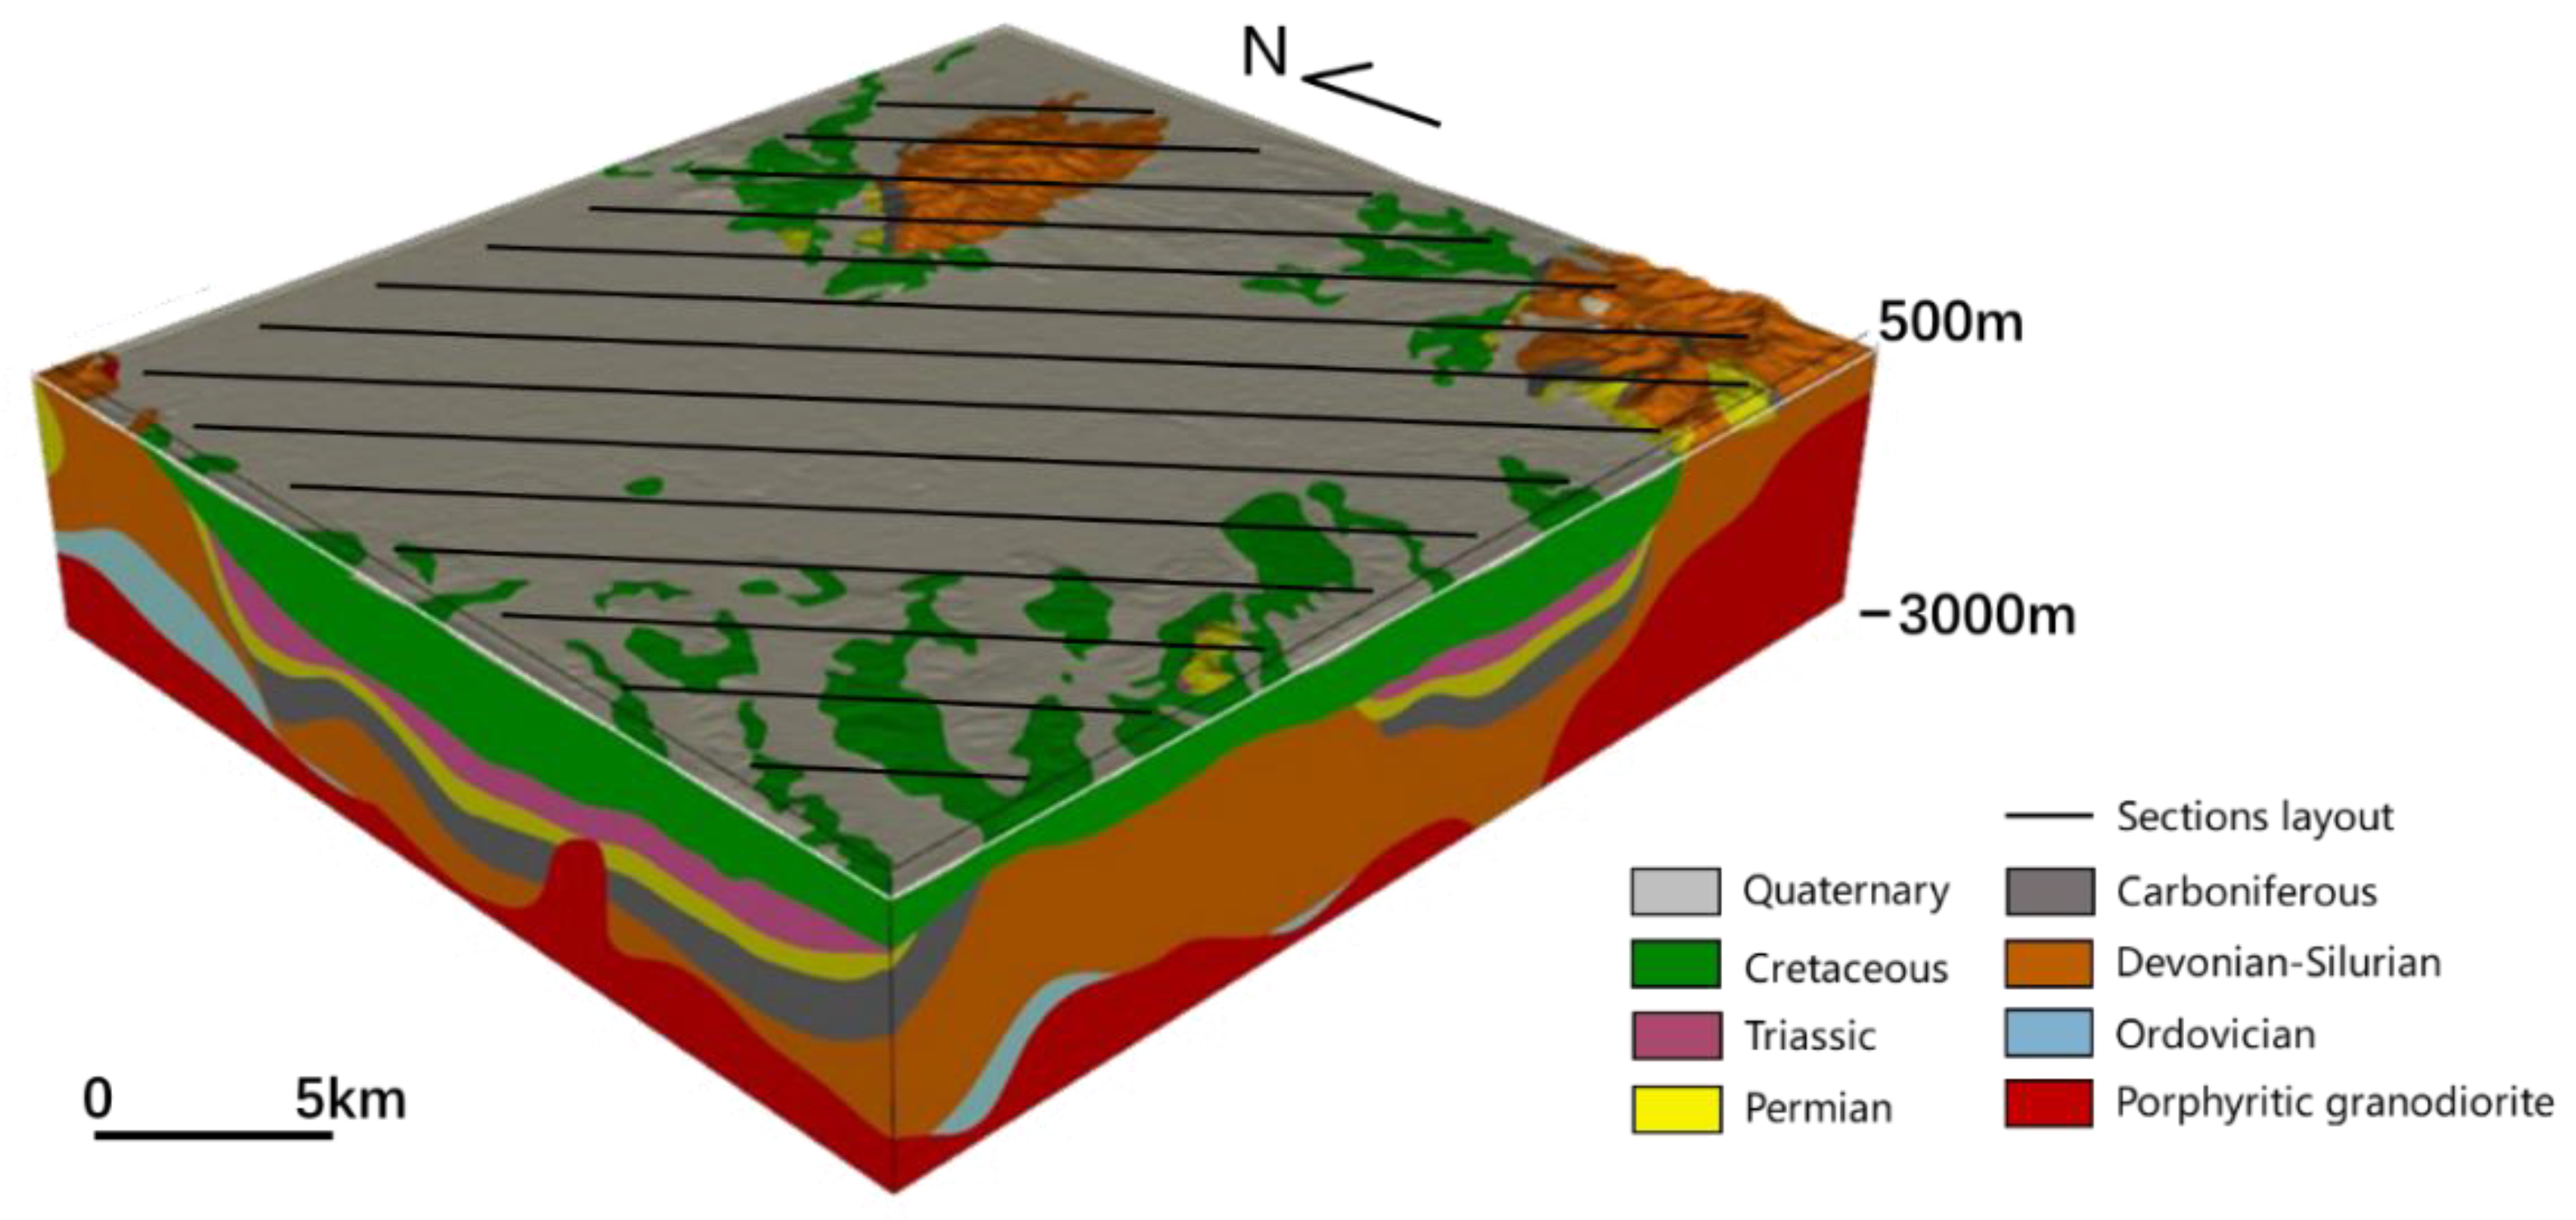
3.1. Geological Background
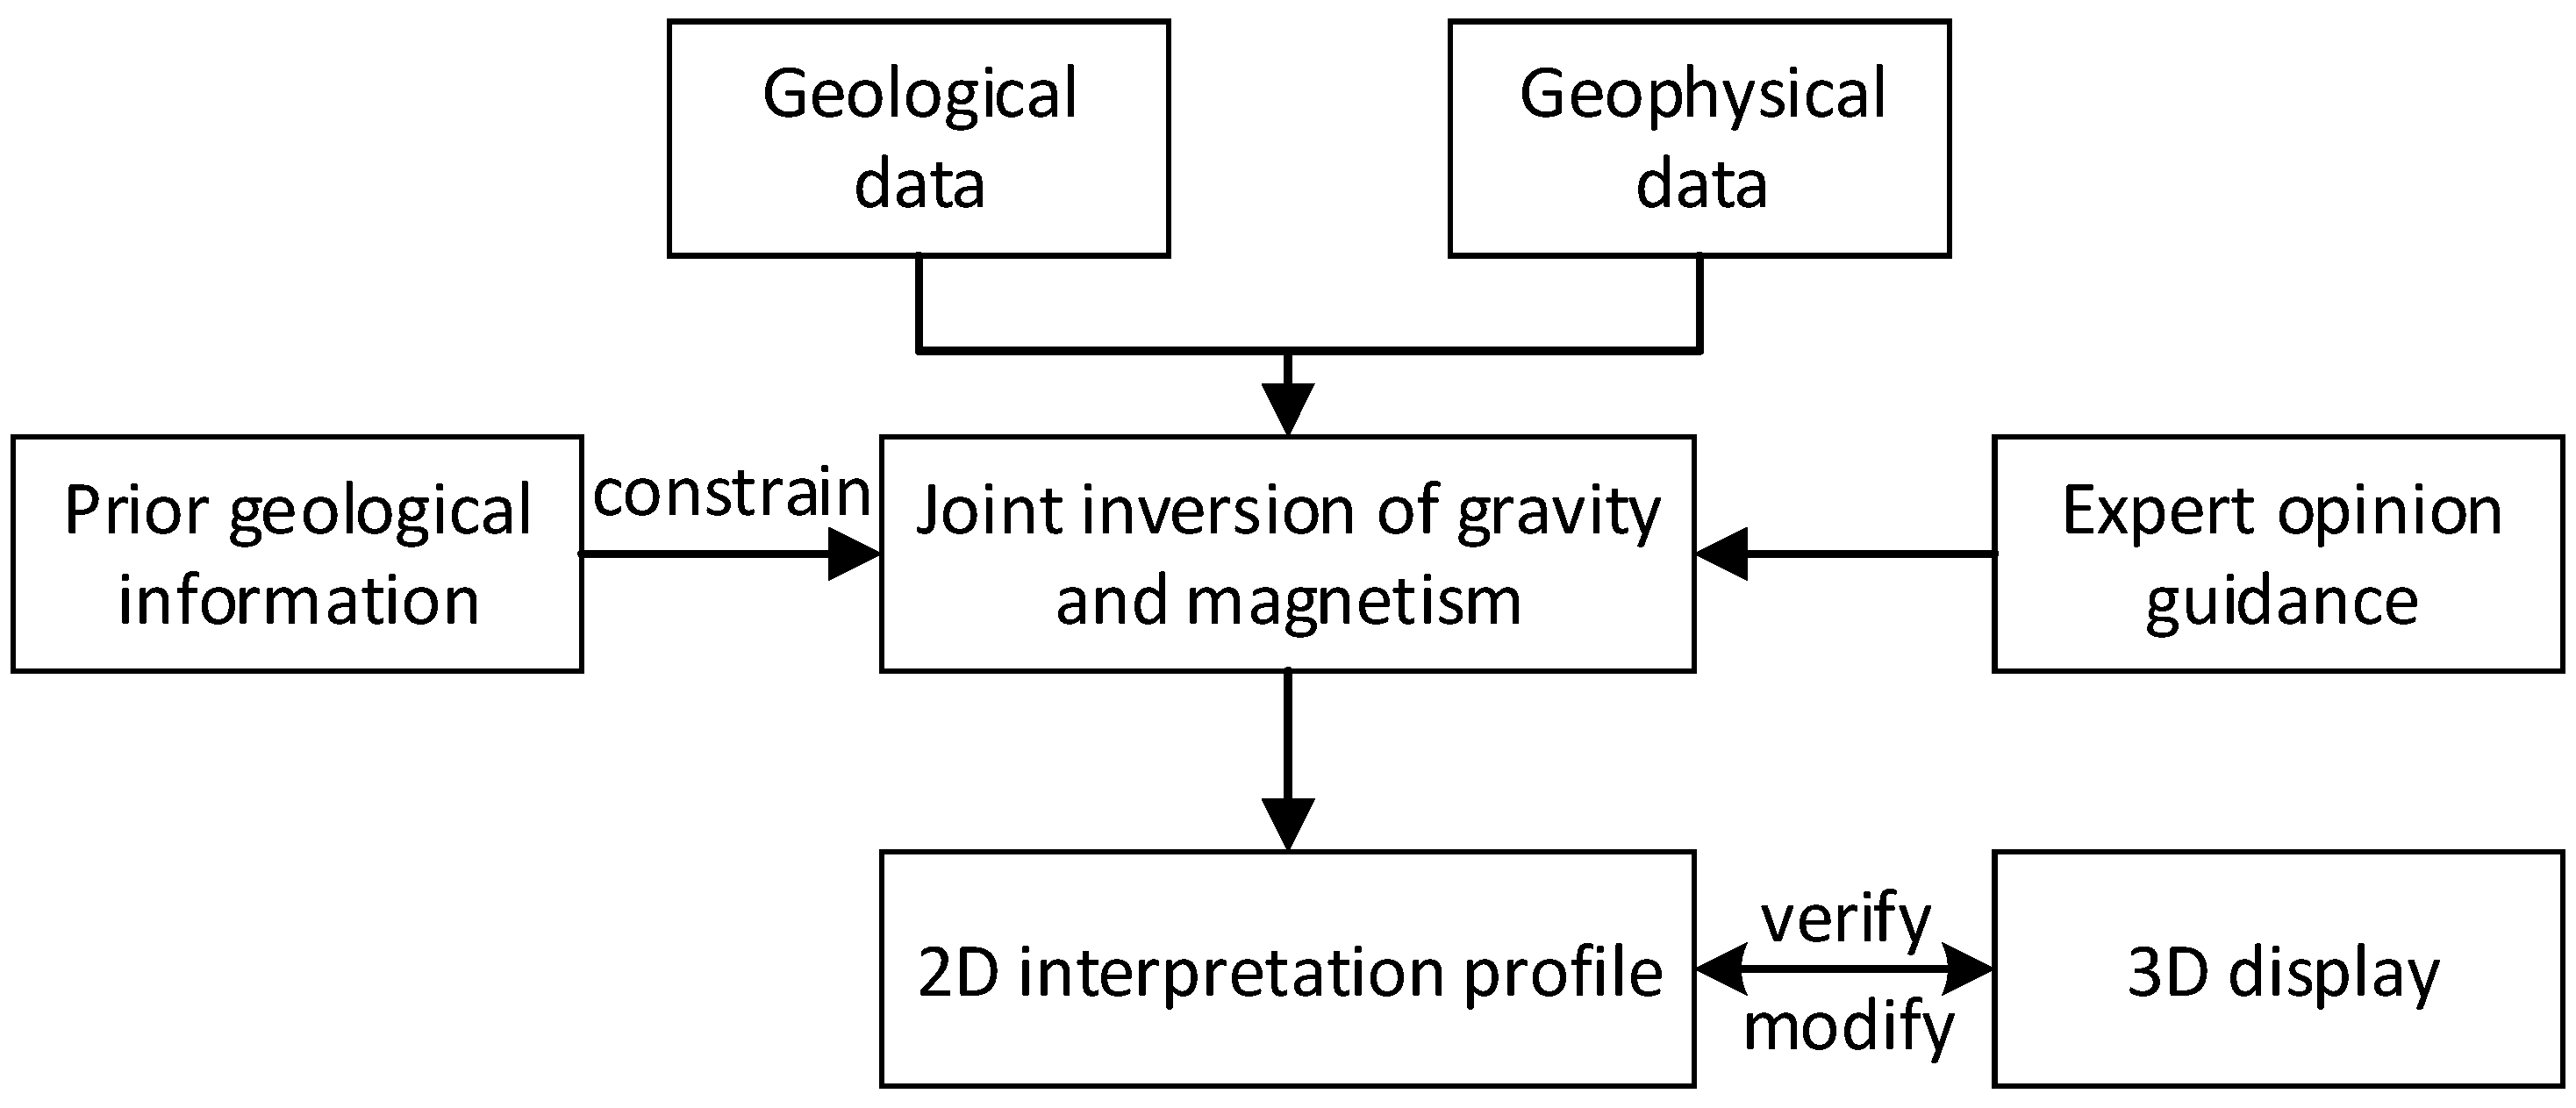
The stratigraphic area of the study area belongs to the Changzhou–Xuancheng stratigraphic community in the Jiangnan stratigraphic subdivision of the Yangtze stratigraphic area (Figure 2). Neritic and littoral clastic rocks dominate the Silurian and Devonian strata, the Permian early and middle Triassic strata are dominated by carbonate rocks, and subsequent continental by clastic rock and pyroclastic rock series. The accumulated total thickness reaches more than 3000 m [39,40].
The structure of the study area is complex, and numerous faults have developed. The faults are mainly concentrated in the vicinity of Magushan and the southeastern part of the area. The magmatic rock activity in the area is strong, consisting of mid-acid intrusions in the late Yanshan period.
The deposits of Magushan Cu-Mo, Xishishan Au-Pb, Beishan Cu-Mo and Fenghuangshan Cu-Mo have been discovered in the study area. Among them, the Magushan Cu-Mo deposit (Figure 3) is a typical skarn deposit in the area, with a large scale and a relatively high degree of research [44].

3.2. Database

In previous studies [43], 2D geological profiles covering the whole area were first established in the Magushan ore field, and these geological profiles were interpreted using the gravity and magnetic joint inversion method. Combined with prior geological constraints and based on the collected regional physical property data, the joint inversion of gravity and magnetic fields finally obtains a 2D profile that can show the thickness, depth, extension direction, hidden rock mass shape, and geological structure of each layer in the region. After the gravity and magnetic joint inversion, a set of verification methods based on the 3D visualization function of the profile is used to verify the rationality of the interpreted profile, and the unreasonable parts in the profile are modified. The whole process of gravity and magnetic inversion interpretation and profile verification and modification is shown in Figure 4. Then, based on the two-dimensional geological profile, geological map, borehole, and other geological information interpreted by gravity and magnetic joint inversion, a 3D geological model of the Magushan ore field with a depth of 3km is established. The 3D geological model can realize the 3D visualization of each geological body in the region and can better display the geological information of the study area, such as the thickness and depth of the strata, the shape of the hidden rock mass, and the geological structure in the region. After completing the 3D geological model, the study further uses the geophysical forward modeling method to verify the rationality of the 3D geological model and modify and improve the 3D geological model. The modeling results are shown in Figure 5. The relevant modeling results will provide an important data basis for 3DMPM research.

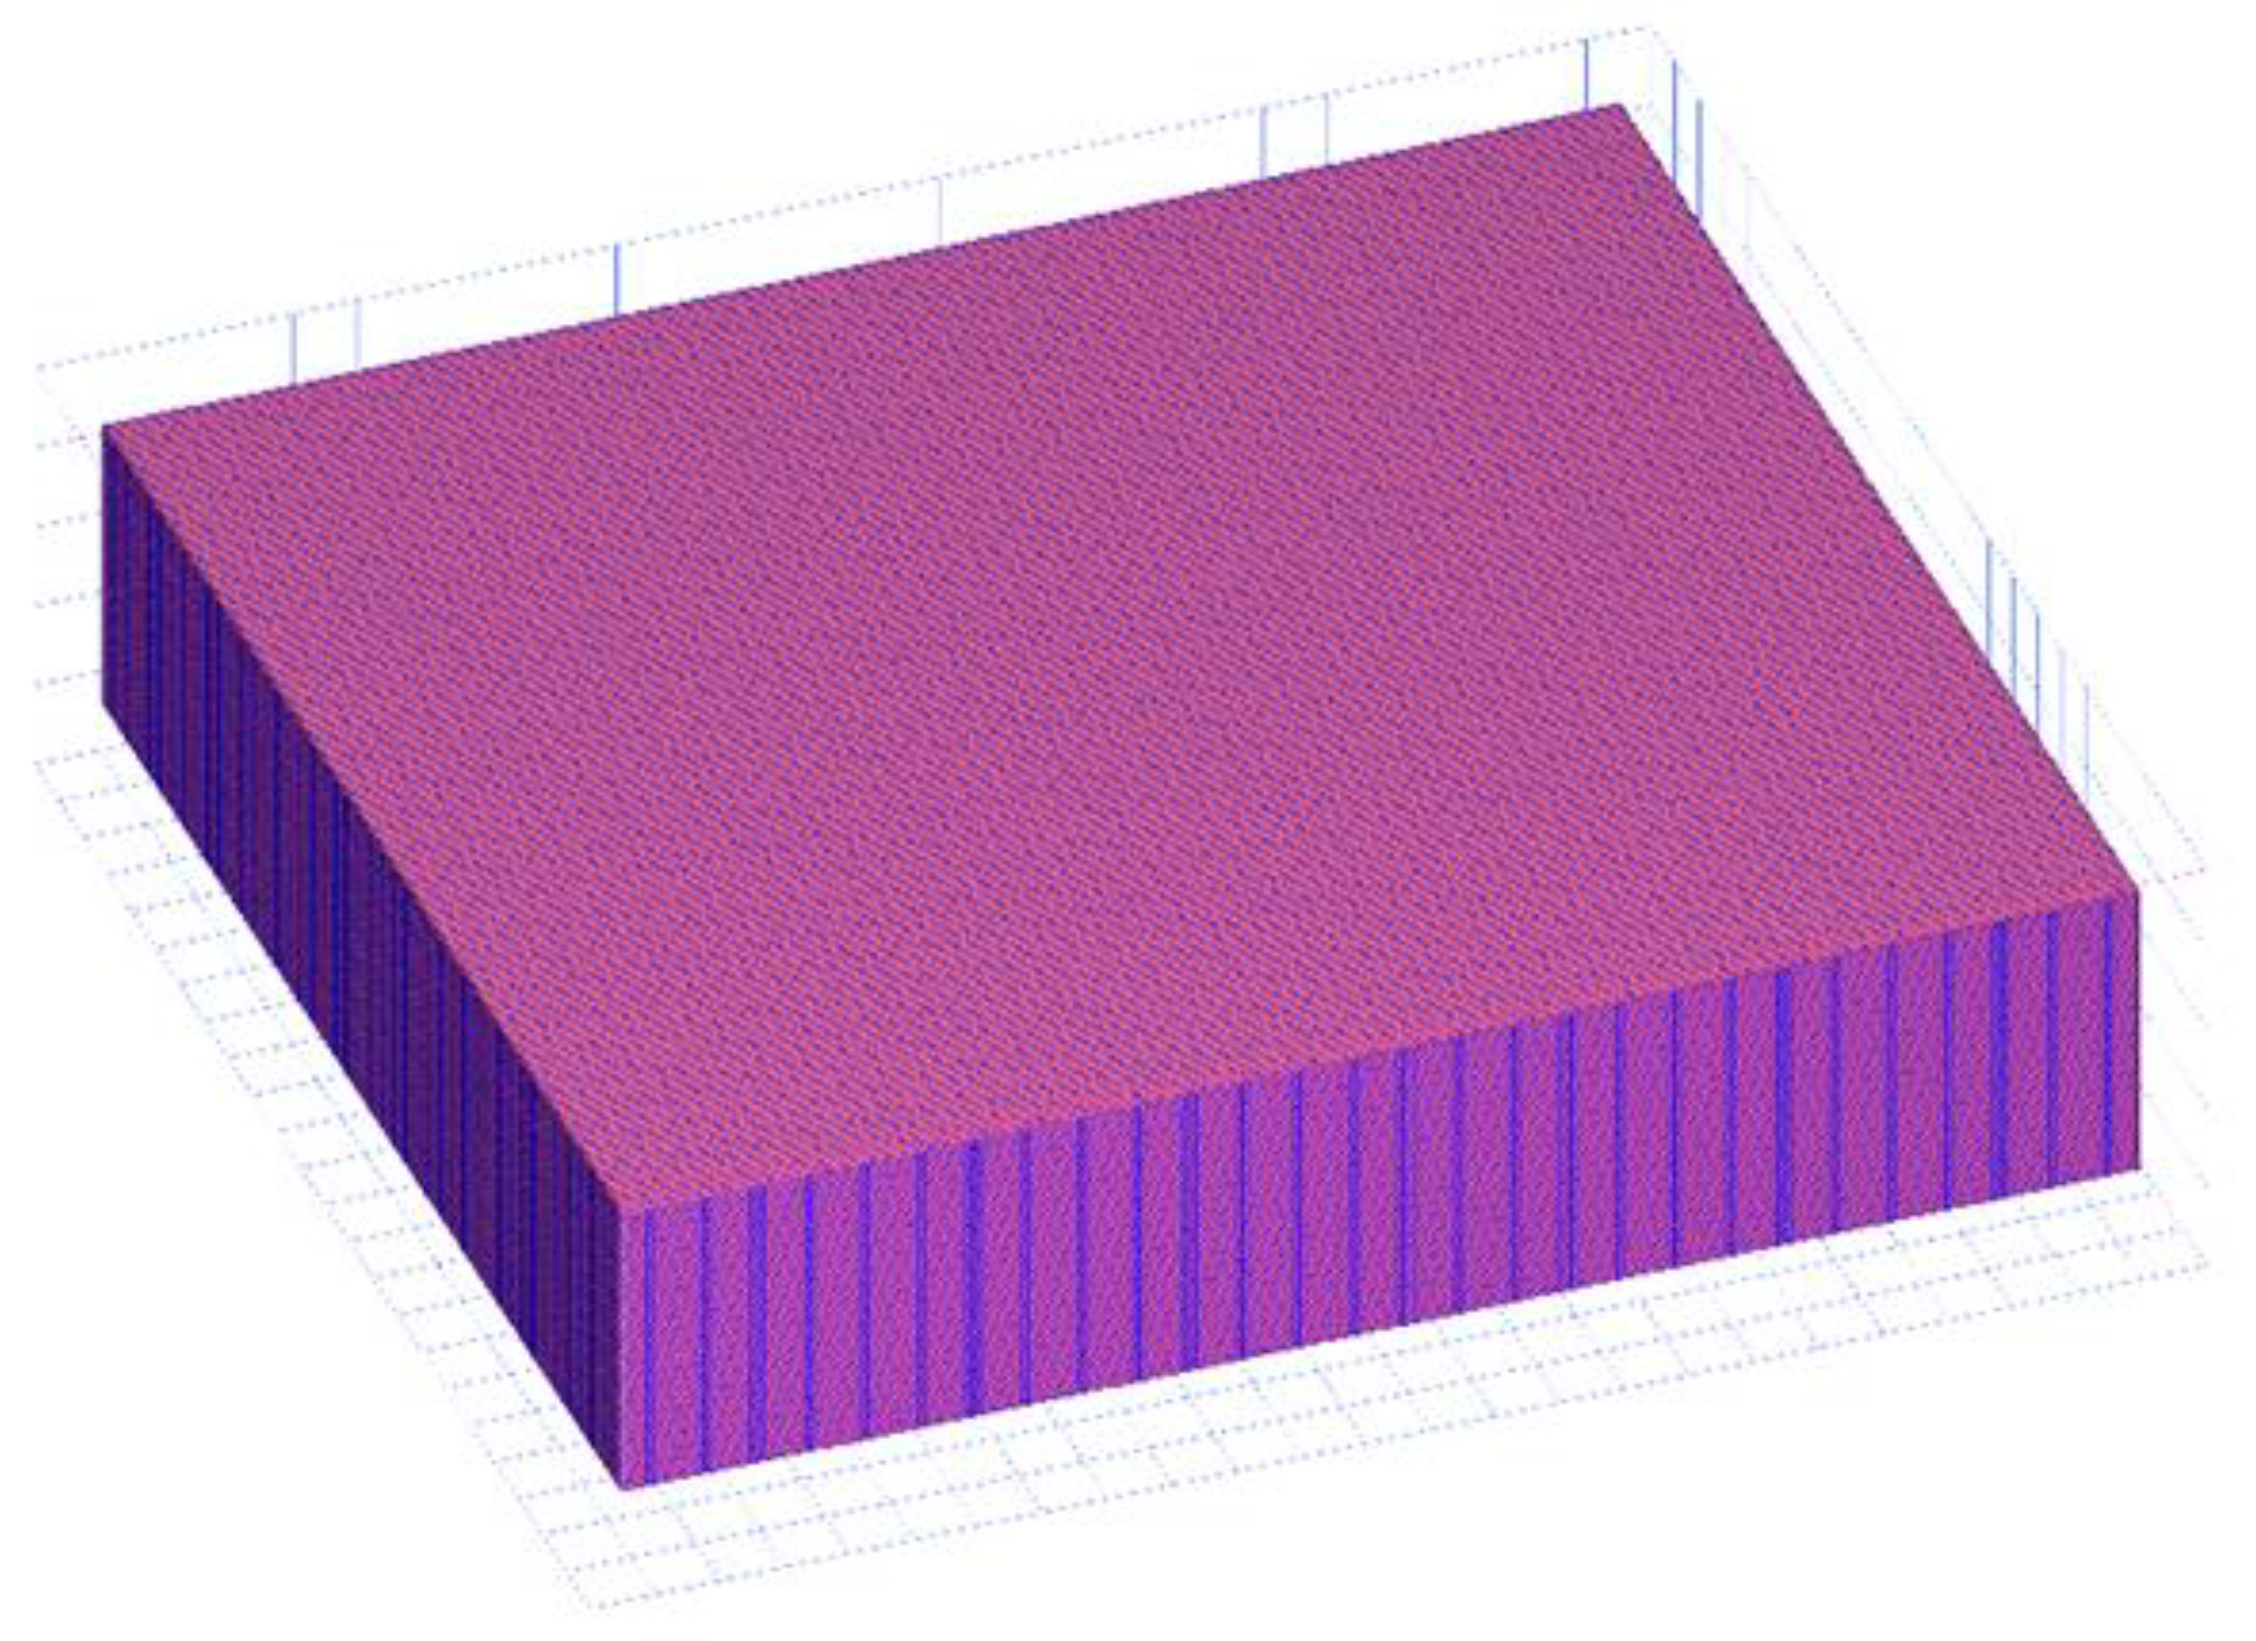
3.3. 3D Prospectivity Modeling Model and 3D Prediction Data Set Construction

The 3DMPM method is mainly based on expert experience, the metallogenic model, and the exploration model summarized by the predecessors to obtain the MPM model. Various spatial analysis methods are used to analyze the deep 3D geological model and related metallogenic indicative features and obtain quantitative results. Based on this information, prediction information is constructed. Finally, the metallogenic favorable degree is calculated. The prospecting target area is delineated for the position with the high metallogenic favorable degree. Thus, it provides a new quantitative prediction support for ore prospecting on the deep edge of the mining area.
We took the skarn type deposit represented by Magushan Cu-Mo deposit in the study area as the research object. Firstly, according to the geological and metallogenic characteristics of the Magushan skarn Cu-Mo deposit [43], the metallogenic law and prospecting signs of the skarn copper deposit in the study area were summarized. A 3DMPM model was constructed. It includes prediction elements such as the Carboniferous stratigraphic contact surface, the Permian stratigraphic contact surface, the Triassic stratigraphic contact surface, the rock mass contact zone, and the diorite uplift position.
After that, combined with the 3DMPM model in the study area, the 3D geological model was further analyzed in 3D space. The 3D prediction elements were extracted. The 3D geological body surface extraction method is mainly used for the Triassic stratigraphic contact surface, and rock mass contact zone are extracted, respectively; the 3D geological structure surface analysis function extracts the uplift position of the diorite rock mass. The analysis and extraction methods are shown in Table 1:
Based on the constructed 3D block model of the Xuancheng–Magushan area, this paper constructs the sample data period. The parameters of the 3D model are defined as shown in Table 2. The predicted depth is in the shallow space range of −3000 m. A single predicted cubic unit is defined as 100 m × 100 m × 25 m. The predicted space has 7.0735 million cubic units (Figure 6).
Based on the geological and metallogenic characteristics of the Magushan skarn Cu-Mo deposit, this study summarizes the metallogenic regularity and prospecting markers of the skarn copper deposit in the study area. Prediction factors include the stratigraphic contact surface, the Triassic stratigraphic contact surface, the rock mass contact zone, and the diorite uplift position. A sample dataset for MPM was constructed by combining the metallogenic facts. In order to verify the generalization ability of the prediction model in the study area, a north–south division was made according to the known ore body locations. The south is used as a training area for the model to learn nonlinear ore-controlling characteristics, and the north is used as a test area to test the model’s performance. There are 730 known ore body unit blocks in the study area, all of which are used as positive sample units, of which 614 were placed in the training set, and 116 were placed in the test set. To ensure a balance of positive and negative samples, 1500 non-ore body units around the known ore body were selected as negative samples. Of these, 1200 were put into the training set, and 300 were put into the test set.

4. Prospectivity Modeling Process and Results

4.1. Predictive Model Building

In order to fully explore the nonlinear relationship between the 3D ore-controlling factors and the ore-forming facts, based on the sample data set established above, this paper selects two machine learning methods, logical regression and random forest, to carry out 3D ore-forming predictions in the deep part of the mining area.
In addition to the support of a large number of effective datasets, the machine learning model also needs to set the model’s parameters for the current dataset, which is an important factor in determining the model’s performance. The random forest algorithm includes the two most important parameters: the number of decision trees M and the number of attributes K in the randomly selected attribute set. In this paper, the sampling dataset will be used to determine the appropriate number of decision trees and attributes of the random forest classification model using cross-validation. Due to the regression model adopted in this paper, after obtaining the error estimates of the results of each cross-validation set, the standard deviation is taken as the evaluation standard to evaluate the consistency of the model on different data sets (Figure 7).
According to the results, this paper uses logistic regression and random forest (M = 200, K = 12) methods to carry out a 3DMPM on the deep edge of the Xuancheng–Magushan area and obtains the distribution map of favorable areas (Figure 8).

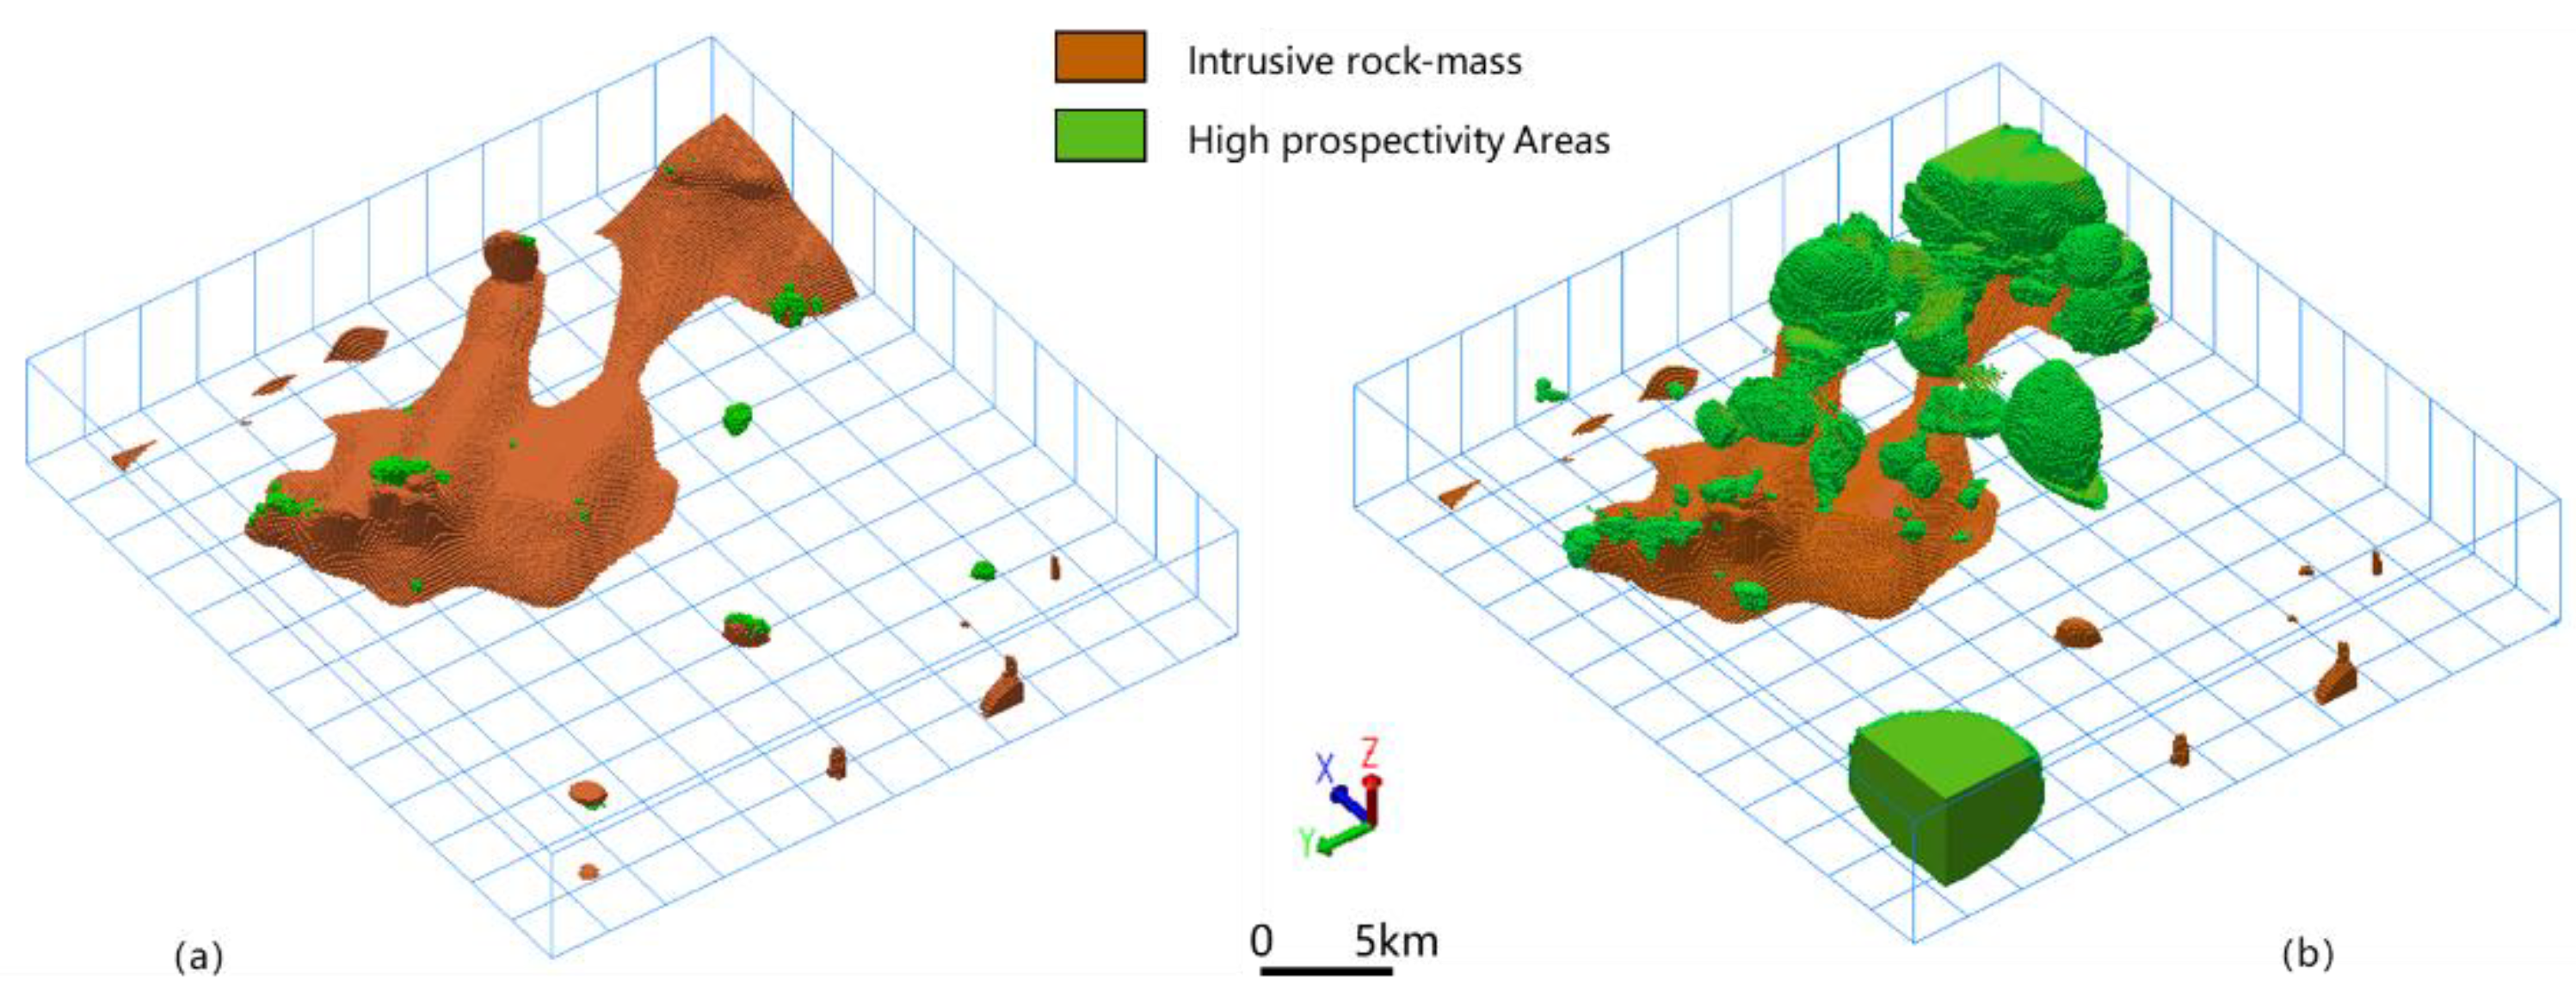
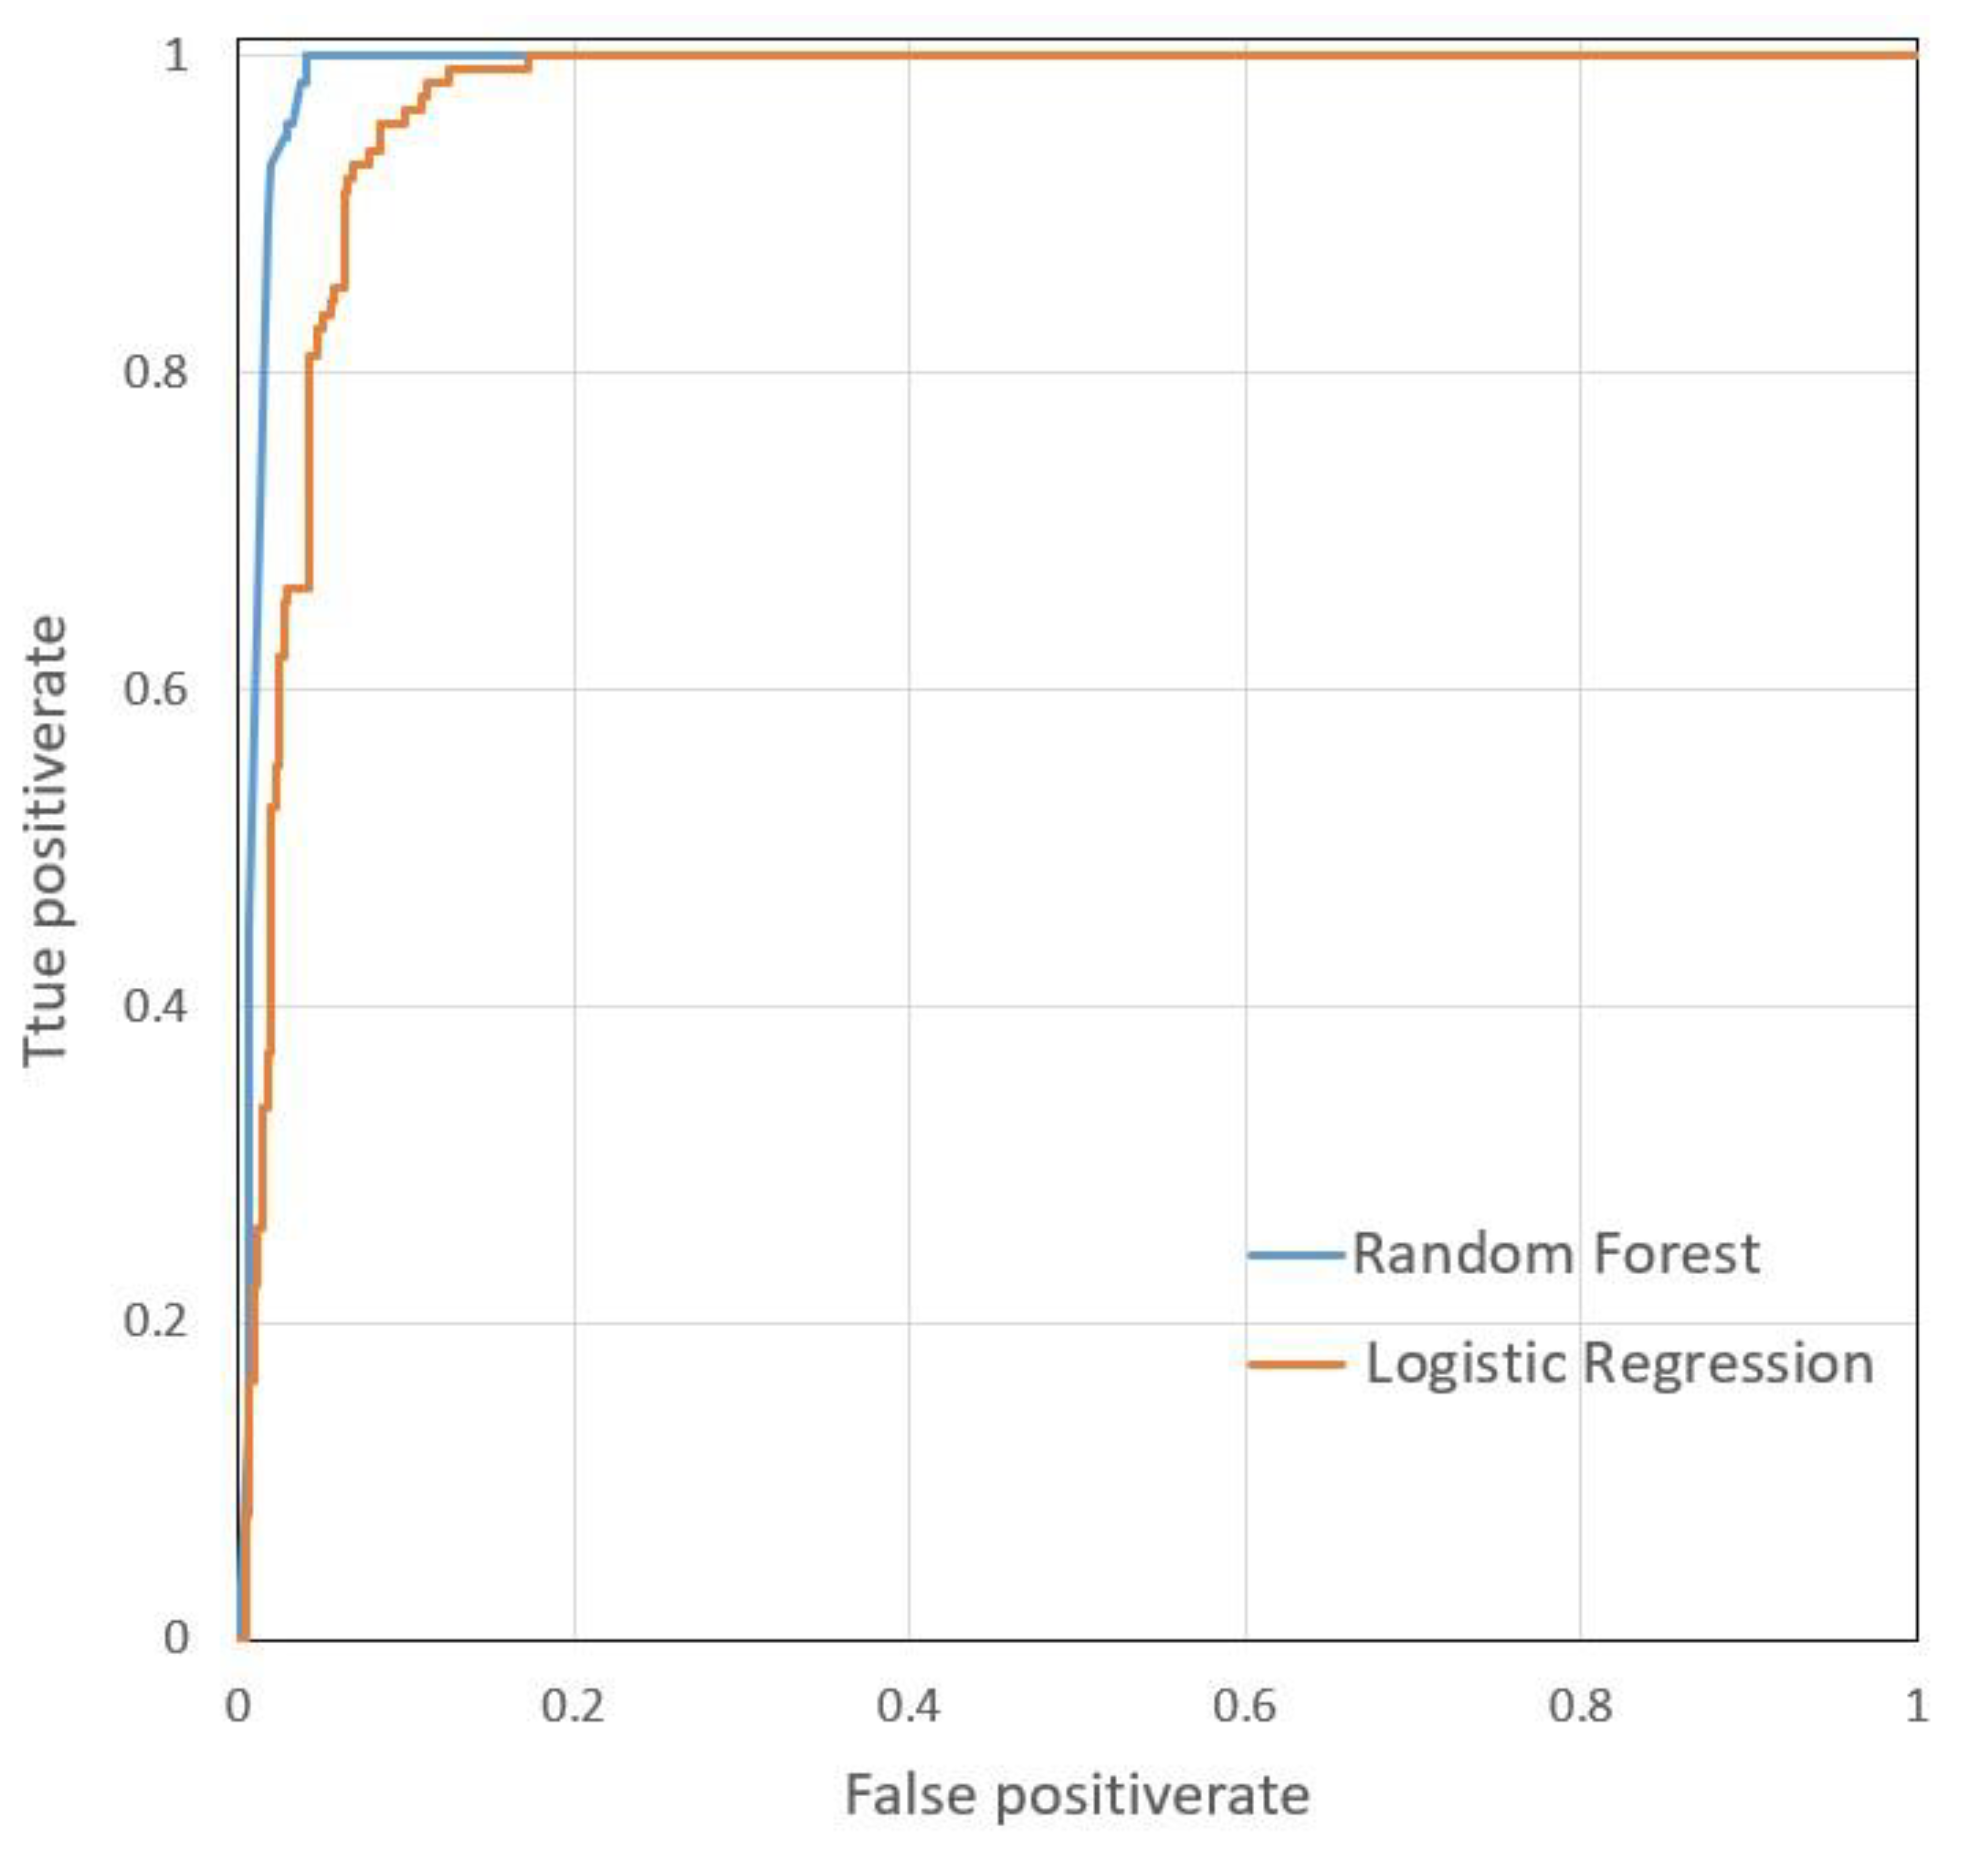
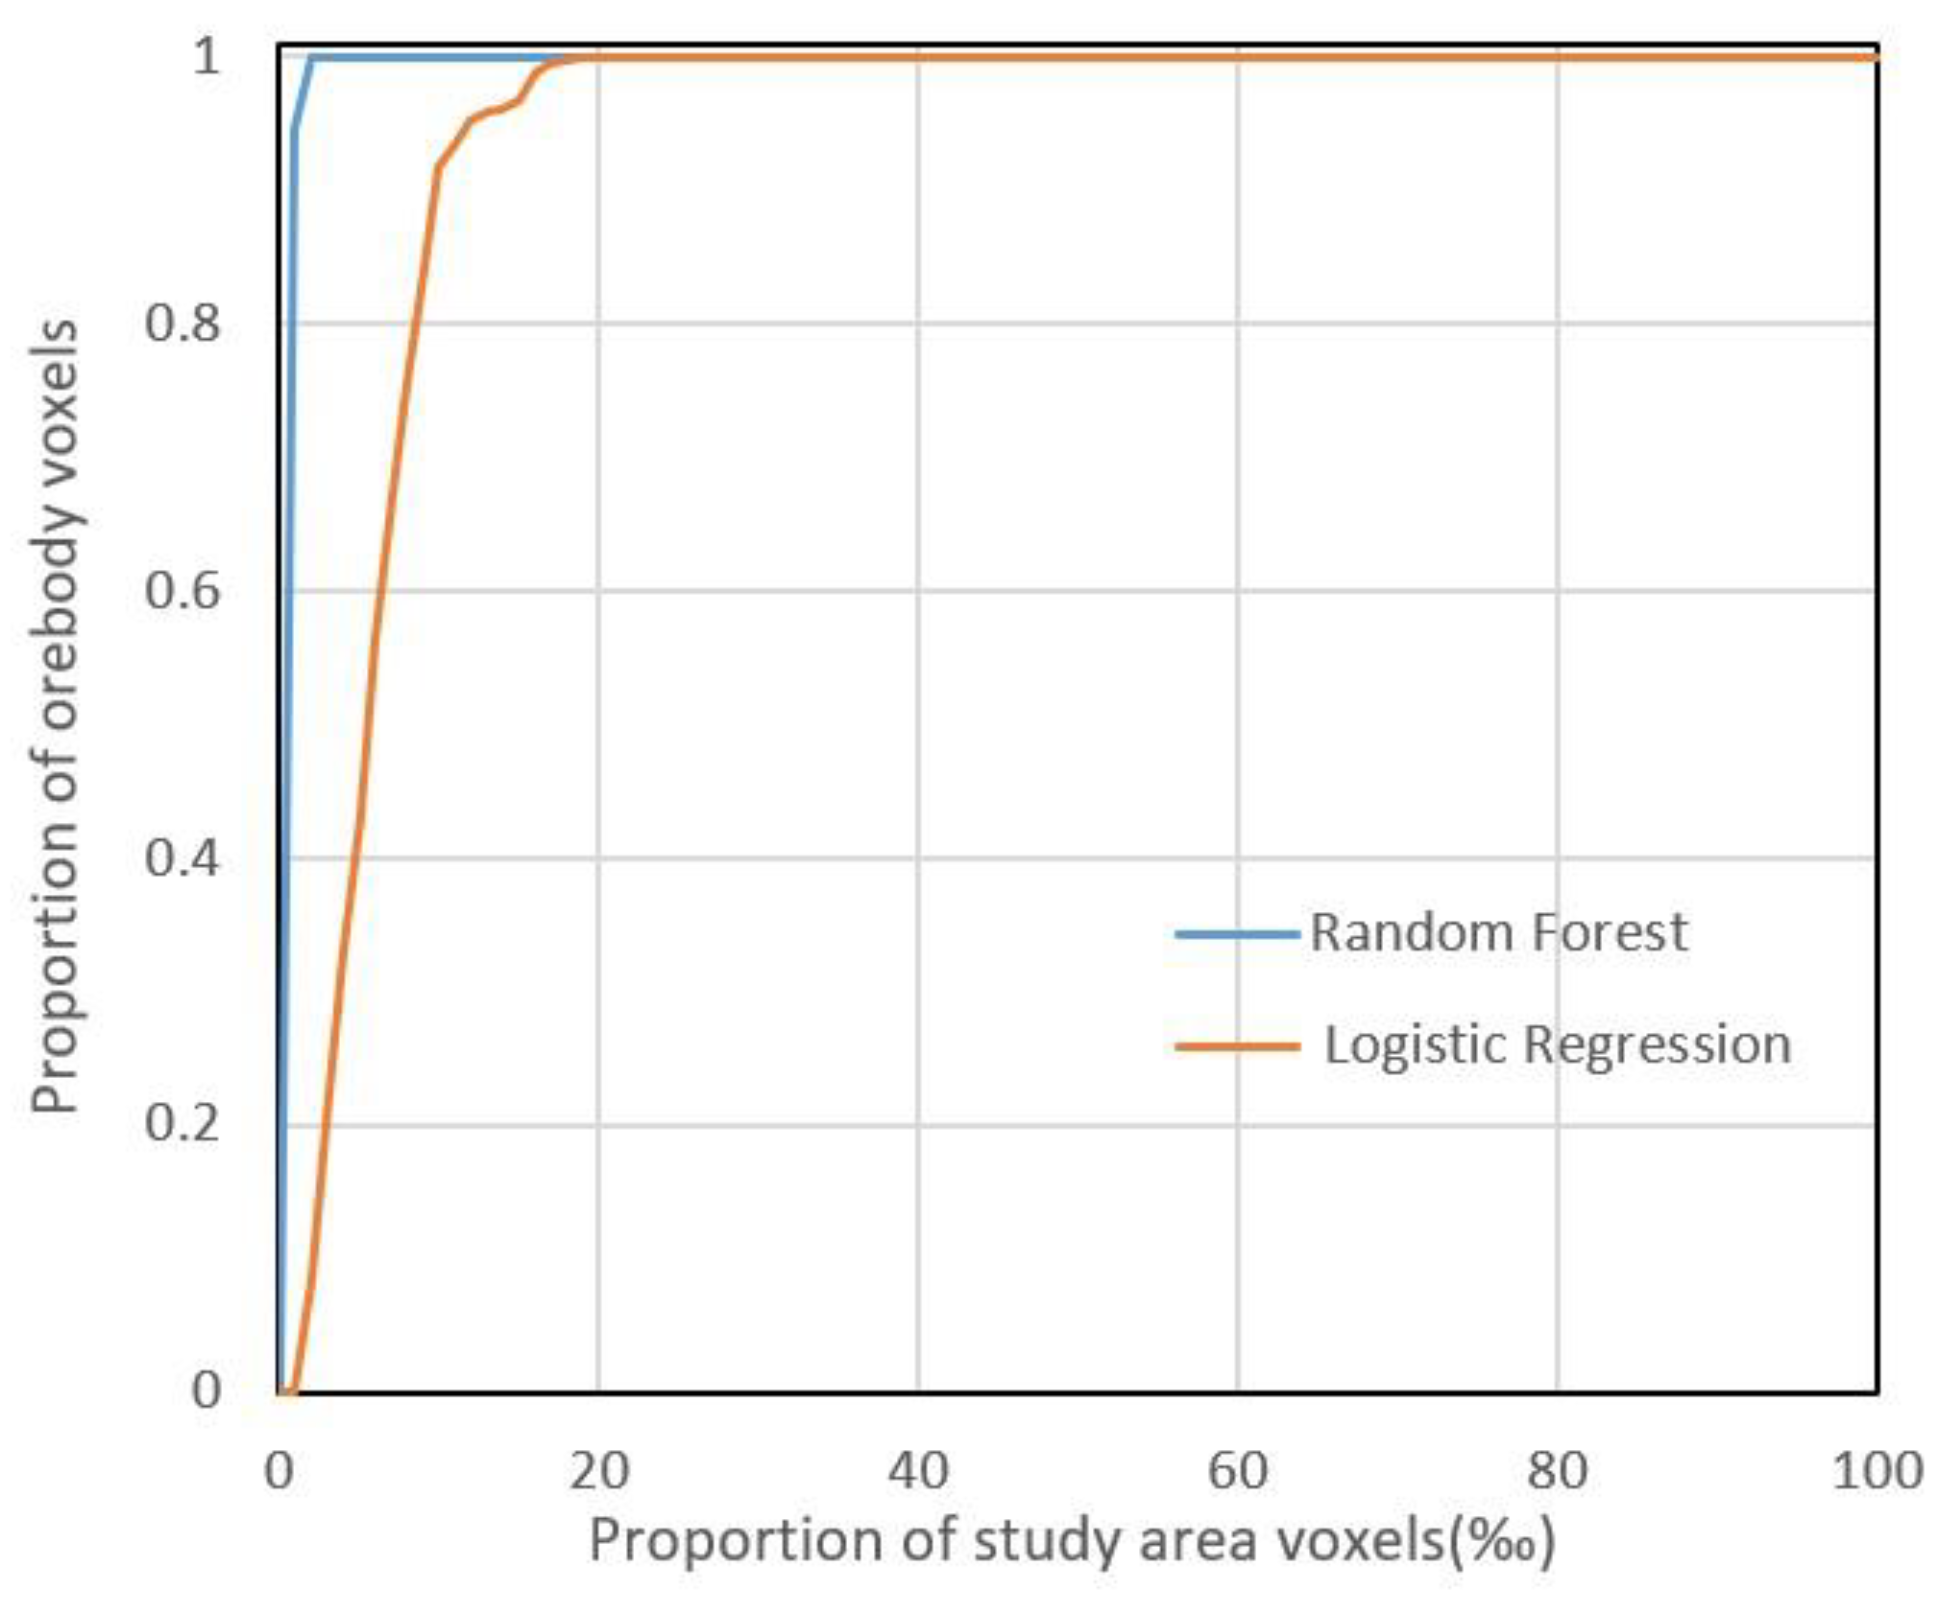
4.2. Model Performance Analysis

The confusion matrix is a standard format for expressing the accuracy evaluation. It is often used in binary classification scenarios. Each column of the matrix represents the prediction of the sample, and each row of the matrix represents the real situation of the sample. To more intuitively express the quality of the model’s performance, we extend three metrics from the matrix: precision, recall, and specificity. The trained model is used in the test set divided above to test the performance of the model. According to the results, the blocks with favorable degrees of mineralization greater than 0.5 predicted in the test set are selected as favorable units for mineralization. Finally, we compare the real value and the predicted value of each block in the test set and use these three prediction indicators to compare the model (Table 3).
Comparing the three performance indicators, it can be concluded that the random forest model performs better than the logistic regression model, which can effectively distinguish non-ore body units in the case of predicting more known ore bodies in the test set and has a good generalization ability.
The ROC curve is also often used in the performance evaluation of the two-class network [46]. It can indicate the ability to identify the sample at a certain threshold. The vertical and horizontal coordinates of the points on the curve represent the true positive rate (TPR) and the false positive rate (FPR) of the output results under different thresholds, respectively. The ROC curve indicates the percentage of true positive units in the known mineralization units in the different positive prediction ranges of the model. The area under the curve is called the AUC value. The larger the AUC value, the better the model effect. This paper compares the ROC curves of the two models (Figure 9) and finds that the image of the MPM method based on the random forest is more inclined to the upper left corner than the logistic regression model. The AUC values of the two models are 0.989 and 0.969, indicating the random forest model has better performance and more reliable results.
The performance of the two models was further quantitatively evaluated by plotting the capture efficiency curves [47,48] (Figure 10). First, the predicted metallogenic favorableness of all blocks is sorted in descending order. Then various thresholds are set according to the sorting results to reclassify the unit blocks in the study area. Finally, the capture efficiency is calculated by counting the number of known ore body units in different sections. The calculation process of the capture efficiency is to perform the statistical calculation on all blocks in the study area. From the capture efficiency curve, it can be obtained that the blocks in the top 4‰ of the metallogenic favorable degree predicted by the random forest model in the study area can cover all the known ore bodies. In the logistic regression model results, only the blocks in the top 20‰ of the favorable degree of mineralization in the study area can cover all known ore bodies. It can be shown that the random forest can contain more known ore body units in the block unit with high posterior probability and can screen out the metallogenic prospect area more finely.

5. Discussion

After analyzing the indicators of the logistic regression model and the random forest model, it can be seen that the prediction results of the random forest model are better. The accuracy of the random forest model in the test set is 96.63%, which is higher than that of the logistic regression model by 6.005%, i.e., 10.35% higher in recall and 4.34% higher in specificity, indicating that random forest can better characterize the characteristics of the mineral control in the study area. At the same time, compared with logistic regression, the random forest model can better identify ore body characteristics and can cover more known ore body units in the same number of block units with high metallogenic favorable degrees. By comparing the distributions and shapes of favorable areas predicted by the two methods, it can be seen that the random forest can constrain the specific locations of the prospectivity targets more finely, thereby effectively improving the efficiency of prospecting and exploration.
In this paper, the prediction results of random forest are used to delineate the metallogenic target area, and the unit block with a metallogenic favorable degree greater than 0.5 is selected as the potential metallogenic unit.
According to the prediction results, there are 7652 favorable areas in the study area, accounting for 1.08 % of the whole study area, including 96.71 % of the known ore bodies. Therefore, the random forest model can not only effectively identify the known ore bodies, but also screen out Blocks with greater metallogenic potential. Then five metallogenic potential areas are divided (Figure 11).
The five metallogenic prospective areas classified in this paper all have high metallogenic potential. The No. I and No. II target areas are located in the prospecting area of Magushan. The burial depth of the No. I target area is about −900 m~−1200 m, and the burial depth of the No. II target area is about −1500 m~−2000 m. The target area is located in the middle of the high gravity anomaly in Magushan as a whole, with a trend near east–west, and the isolines on the north and south sides change rapidly; in terms of the aeromagnetization pole anomaly, the Magushan anomaly clearly shows a high magnetic anomaly, with a trend near the pear-shaped distribution in the north and the south: the contour changes smoothly, the gradient changes rapidly on the north side, and extends to the south, showing the subsidence direction of the concealed rock mass. The measurement anomalies of 1:200,000 water system sediments show that Cu, Hg, and W are anomalous in the vicinity of the Magushan deposit. The No. III target area is located on the surface of the high-density body, and the burial depth is about −2100 m~−2800 m. The No. IV target area is generally controlled by structural forms, such as the uplift and depression of the rock mass, and the buried depth is about −1100 m~−1500m. The No. V target area is located at the intersection of the faults, and there are certain magnetic anomalies on the surface of this area, and the burial depth is about −2100 m~−2900 m. Therefore, the five prospectivity targets classified in this paper can be the priority exploration targets for future mineral exploration in this area.

6. Conclusions

(1) The 3DMPM is an important tool for deep targets delineation for future exploration. This paper delineates five prospectivity targets with good mineralization potentials in the deep area of the Xuancheng–Magushan area, which can be used for future exploration.
(2) In the Xuancheng–Magushan area, the favorable areas divided by the random forest model contain 96.71% of known ore bodies and only account for 1.08% of the study area, which can show that the random forest model can perform better than the logistic regression model in the 3DMPM using the dataset of the study area. It means that the random forest model could provide more effective and accurate support for integrating predictive data during the 3DMPM.

Author Contributions

Conceptualization, F.M., X.L. and F.Y.; Methodology, F.M. and X.L.; Software, X.L.; Validation, X.L. and Y.C.; Formal Analysis, F.M., Y.C. and R.Y.; Data Curation, Y.C. and R.Y.; Writing—Original Draft Preparation, F.M.; Writing-Review & Editing, F.M., X.L. and F.Y.; Visualization, Y.C. and R.Y.; Supervision, X.L. and F.Y.; Project Administration, F.Y. All authors have read and agreed to the published version of the manuscript.

Funding

This research was funded by [National Natural Science Foundation of China] grant number [42072321], [National Natural Science Foundation of China] grant number [41820104007] and [National Key R&D Program of China] grant number [2016YFC0600209].

Data Availability Statement

Data not available due to legal restrictions.

Conflicts of Interest

The authors declare no conflict of interest.

References

  1. Teng, J.W.; Yang, L.Q.; Liu, H.C.; Yan, Y.F.; Yang, H.; Zhang, H.S.; Zhang, Y.Q.; Tian, Y. Geodynamical responses for formation and concentration of metall minerals in the second deep space of lithosphere. Chin. J. Geophys. 2009, 52, 1734–1756, (In Chinese with English Abstract). [Google Scholar]
  2. Yan, J.Y.; Teng, J.W.; Lv, Q.T. Geophysical Exploration and Application of Deep Metal Mineral Resources. Prog. Geophys. 2008, 23, 871–891, (In Chinese with English Abstract). [Google Scholar]
  3. Heinson, G.S.; Direen, N.G.; Gill, R.M. Magnetotelluric evidence for a deep-crustal mineralizing system beneath the Olympic Dam iron oxide copper-gold deposit, southern Australia. Geology 2006, 34, 573–576. [Google Scholar] [CrossRef]
  4. Hu, X.Y.; Li, X.H.; Yuan, F.; Alison, O.; Simon, M.J.; Li, Y.; Dai, W.Q.; Zhou, T.F. Numerical modeling of ore-forming processes within the Chating Cu-Au porphyry-type deposit, China: Implications for the longevity of hydrothermal systems and potential uses in mineral exploration. Ore Geol. Rev. 2020, 116, 103230. [Google Scholar] [CrossRef]
  5. Liu, L.M.; Peng, S. Key strategies for predictive exploration in mature environment: Model innovation, exploration technology optimization and information integration. J. Cent. South Univ. Technol. (Engl. Ed.) 2005, 12, 186–191. [Google Scholar] [CrossRef]
  6. Niu, S.Y.; Wang, B.D.; Sun, A.Q.; Chen, C.; Wang, Z.L.; Ma, B.J.; Wang, W.S.; Jiang, X.P.; Zhao, Y.L.; Gao, Y.C.; et al. Analysis of the ore-controlling structure of the Shihu gold deposit, Hebei Province and deep-seated ore-prospecting prediction. Chin. J. Geochem. 2009, 28, 386–396. [Google Scholar] [CrossRef]
  7. Zhai, Y.S.; Deng, J.; Wang, J.P.; Peng, R.M.; Liu, J.J.; Yang, L.Q. Researches on deep ore prospecting. Miner. Depos. 2004, 23, 142–149, (In Chinese with English Abstract). [Google Scholar]
  8. Li, X.Y.; Yuan, Y.; Zhang, M.M.; Jia, C.; Jowitt, S.M.; Ord, A.; Zhou, T.F.; Dai, W.Q. 3D computational simulation-based mineral prospectivity modeling for exploration for concealed Fe–Cu skarn-type mineralization within the Yueshan orefield, Anqing district, Anhui Province, China. Ore Geol. Rev. 2018, 105, 1–17. [Google Scholar] [CrossRef]
  9. Payne, C.E.; Cunningham, F.; Peters, K.J.; Nielsen, S.; Puccioni, E.; Wildman, C.; Partington, G.A. From 2D to 3D: Prospectivity modelling in the Taupo volcanic zone, New Zealand. Ore Geol. Rev. 2015, 71, 558–577. [Google Scholar] [CrossRef]
  10. Nielsen, S.H.; Cunningham, F.; Hay, R.; Partington, G.; Stokes, M. 3D prospectivity modelling of orogenic gold in the Marymia Inlier, Western Australia. Ore Geol. Rev. 2015, 71, 578–591. [Google Scholar] [CrossRef]
  11. Xiao, K.Y.; Li, N.; Sun, L.; Zhou, W.; Li, Y. Large Scale 3D Mineral Prediction Methods and Channels Based on 3D Information Technology. J. Geol. 2012, 36, 229–236. (In Chinese) [Google Scholar]
  12. Oh, H.J.; Lee, S. Application of artificial neural network for gold-silver deposits potential mapping: A case study of Koreal. Nat. Resour. Res. 2010, 19, 103–124. [Google Scholar] [CrossRef]
  13. Xiong, Y.H.; Zuo, R.G. Recognition of geochemical anomalies using a deep autoencoder network. Comput. Geosci. 2016, 86, 75–82. [Google Scholar] [CrossRef]
  14. Ghezelbash, R.; Maghsoudi, A.; Bigdeli, A.; Carranza, E.J.M. Regional-Scale Mineral Prospectivity Mapping: Support Vector Machines and an Improved Data-Driven Multi-criteria Decision-Making Technique. Nat. Resour. Res. 2021, 30, 1977–2005. [Google Scholar] [CrossRef]
  15. Abedi, M.; Norouzi, G.H. Integration of various geophysical data with geological and geochemical data to determine additional drilling for copper exploration. J. Appl. Geophys. 2012, 83, 35–45. [Google Scholar] [CrossRef]
  16. Leite, E.P.; de Souza Filho, C.R. Artificial neural networks applied to mineral potential mapping for copper-gold mineralizations in the Carajás Mineral Province, Brazil. Geophys. Prospect. 2019, 57, 1049–1065. [Google Scholar] [CrossRef]
  17. Li, X.L.; Li, L.H.; Zhang, B.L.; Guo, Q.J. Hybrid self-adaptive learning based particle swarm optimization and support vector regression model for grade estimation. Neurocomputing 2013, 118, 179–190. [Google Scholar] [CrossRef]
  18. Zuo, R.G.; Carranza, E. Support vector machine: A tool for mapping mineral prospectivity. Comput. Geosci. 2011, 37, 1967–1975. [Google Scholar] [CrossRef]
  19. Bian, Y.C. On the origin of Magushan Cu–Mo deposit in South Anhui. J. Geol. 1995, 19, 17–20, (In Chinese with English Abstract). [Google Scholar]
  20. Xiao, K.Y.; Ding, J.H.; Liu, R. The discussion of three-part form of non-fuel mineralresource assessment. Ceological Rev. 2006, 52, 793–798, (In Chinese with English Abstract). [Google Scholar]
  21. Zhao, P.D. Three Component quantitative resource prediction and assessment: Theory and practice of digital mineral prospecting. Earth Sci.-J. China Univ. Geosci. 2002, 27, 482–489, (In Chinese with English Abstract). [Google Scholar]
  22. Agterberg, F.P. Multivariate prediction equations in geology. J. Int. Assoc. Math. Geol. 1970, 2, 319–324. [Google Scholar] [CrossRef]
  23. Agterberg, F.P.; Bonham-Carter, G.F.; Cheng, Q.; Wright, D.F. Weights of evidence modeling and weighted logistic regression for mineral potential mapping. In Computers in Geology-25 Years of Progress; Davis, J.C., Herzfeld, U.C., Eds.; Oxford University Press: New York, NY, USA, 1993; pp. 13–32. [Google Scholar]
  24. Wang, S.C. The New Development of Theory and Method of Synthetic Information Mineral Resources Prognosis. Geol. Bull. China 2010, 29, 1399–1403, (In Chinese with English Abstract). [Google Scholar]
  25. Zhao, P.D. Quantitative Mineral Prediction and Deep Mineral Exploration. Earth Sci. Front. 2007, 14, 309–318, (In Chinese with English Abstract). [Google Scholar]
  26. Yuan, F.; Li, X.H.; Zhang, M.M.; Zhou, T.F.; Gao, D.M.; Hong, D.L.; Liu, X.M.; Wang, Q.N.; Zhu, J.B. Three Dimension Prospectivity Modelling Based on Integrated Geoinformation for Prediction of Buried Ore Bodies. Acta Geol. Sin. 2014, 88, 630–643, (In Chinese with English Abstract). [Google Scholar]
  27. Caté, A.; Perozzi, L.; Gloaguen, E.; Blouin, M. Machine learning as a tool for geologists. Lead. Edge 2017, 36, 215. [Google Scholar] [CrossRef]
  28. Li, X.H.; Yuan, F.; Zhang, M.M.; Jia, C.; Jowitt, S.M.; Ord, A.; Zheng, T.K.; Hu, X.Y.; Li, Y. Three-dimensional mineral prospectivity modeling for targeting of concealed mineralization within the Zhonggu iron orefield, Ningwu Basin, China. Ore Geol. Rev. 2015, 71, 633–654. [Google Scholar] [CrossRef]
  29. Sun, T.; Chen, F.; Zhong, L.X.; Liu, W.M.; Wang, Y. GIS-basedmineral prospectivity mapping using machine learning methods: Acase study from Tongling ore district, eastern China. Ore Geol. Rev. 2019, 109, 26–49. [Google Scholar] [CrossRef]
  30. Tao, J.T.; Yuan, F.; Zhang, N.N.; Chang, J.Y. Three-Dimensional Prospectivity Modeling of Honghai Volcanogenic Massive Sulfide Cu–Zn Deposit, Eastern Tianshan, Northwestern China Using Weights of Evidence and Fuzzy Logic. Math. Geosci. 2021, 53, 131–162. [Google Scholar] [CrossRef]
  31. Xiang, J.; Xiao, K.Y.; Carranza, E.J.M.; Chen, J.P.; Li, S. 3D Mineral Prospectivity Mapping with Random Forests: A Case Study of Tongling, Anhui, China. Nat. Resour. Res. 2020, 29, 395–414. [Google Scholar] [CrossRef]
  32. Mokhtari, A.R. Hydrothermal alteration mapping through multivariate logistic regression analysis of lithogeochemical data. J. Geochem. Explor. 2014, 145, 207–212. [Google Scholar] [CrossRef]
  33. Marian, F.; Piotr, C.; Sławomir, B.; Bogusław, R.; Mirosław, K. Logistic Regression Model for Determination of the Age of Brown Hare (Lepus europaeus Pall.) Based on Body Weight. Animals 2022, 12, 529. [Google Scholar]
  34. Yuko, K.; Koichi, S.; Takeshi, I.; Koichi, T.; Tetsuya, T. Predictors for development of palbociclib-induced neutropenia in breast cancer patients as determined by ordered logistic regression analysis. Sci. Rep. 2021, 11, 20055. [Google Scholar]
  35. Carranza, E.J.M.; Hale, M. Logistic Regression for Geologically Constrained Mapping of Gold Potential, Baguio District, Philippines. Explor. Min. Geol. 2001, 10, 165–175. [Google Scholar] [CrossRef]
  36. Xiong, Y.H.; Zuo, R.G. GIS-based rare events logistic regression for mineral prospectivity mapping. Comput. Geosci. 2018, 111, 18–25. [Google Scholar] [CrossRef]
  37. Breiman, L. Bagging predictors. Mach. Learn. 1996, 24, 123–140. [Google Scholar] [CrossRef]
  38. Ho, T.K. The random subspace method for constructing decision forests. IEEE Trans. Pattern Anal. Mach. Intell. 1998, 20, 832–844. [Google Scholar]
  39. Hu, X.Y.; Li, X.Y.; Yuan, F.; Ord, A.; Jowitt, S.M.; Li, Y.; Dai, W.Q.; Ye, R.; Zhou, T.F. Numerical Simulation Based Targeting of the Magushan Skarn Cu–Mo Deposit, Middle-Lower Yangtze Metallogenic Belt, China. Minerals 2019, 9, 588. [Google Scholar] [CrossRef]
  40. Zhou, T.F.; Fan, Y.; Yuan, F. Advances on petrogenesis and metallogenic study of the mineralization belt of the Middle and Lower Reaches of the Yangtze River area. Acta Petrol. Sin. 2008, 24, 1665–1678, (In Chinese with English Abstract). [Google Scholar]
  41. Chang, Y.F.; Liu, X.P.; Wu, Y.C. The Cu-Fe Metallogenic Belt in the Middle-Lower Reaches of Yangtze River; Geological Publish House: Beijing, China, 1991; p. 379. (In Chinese) [Google Scholar]
  42. Mao, J.W.; Xie, G.Q.; Duan, C.; Pirajno, F.; Ishiyama, D.; Chen, Y.C. A tectono-genetic model for porphyry–skarn–stratabound Cu–Au–Mo–Fe and magnetite–apatite deposits along the Middle–Lower Yangtze River Valley, Eastern China. Ore Geol. Rev. 2011, 43, 294–314. [Google Scholar] [CrossRef]
  43. Ye, R. 3D Geological Modeling and Mineral Prospectivity Modeling of Magushan Ore Field in Nanling-Xuancheng Ore Concentration Area. Ph.D. Thesis, Hefei University of Technology, Hefei, China, 2020. (In Chinese with English Abstract). [Google Scholar]
  44. Hong, D.J.; Huang, Z.Z.; Chan, S.W.; Wang, X.H. Geological characteristics and exploration directions of the Cu-polymetallic ore deposits in the Magushan-Qiaomaishanareas in Xuancheng, Anhui Province. East China Geol. 2017, 38, 28–36, (In Chinese with English Abstract). [Google Scholar]
  45. Hu, X.Y.; Li, X.Y.; Yuan, F.; Jowitt, S.M.; Ord, A.; Ye, R.; Li, Y.; Dai, W.Q.; Li, X.L. 3D Numerical Simulation-Based Targeting of Skarn Type Mineralization within the Xuancheng-Magushan Orefield, Middle-Lower Yangtze Metallogenic Belt, China. Lithosphere 2020, 1, 8351536. [Google Scholar] [CrossRef]
  46. Zhang, Z.J.; Zuo, R.G.; Xiong, Y.H. A comparative study of fuzzy weights of evidence and random forests for mapping mineral prospectivity for skarn-type Fe deposits in the southwestern Fujian metallogenic belt, China. Sci. China (Earth Sci.) 2016, 59, 556–572. [Google Scholar] [CrossRef]
  47. Fabbri, A.G.; Chung, C. On blind tests and spatial prediction models. Nat. Resour. Res. 2008, 17, 107–118. [Google Scholar] [CrossRef]
  48. Porwal, A.; Gonzalez-Alvarez, I.; Markwitz, V.; McCuaig, T.; Mamuse, A. Weights-of evidence and logistic regression modelling of magmatic nickel sulfide prospectivity in the Yilgarn Craton, Western Australia. Ore Geol. Rev. 2010, 38, 184–196. [Google Scholar] [CrossRef]
Figure 1. Workflow of three-dimension prospectivity mapping.
Minerals 12 01174 g001
Figure 2. The location of Xuancheng–Magushan Area, volcanic basins, and ore concentration areas (OCAs) within the middle and lower Yangtze River Metallogenic Belt as well as the location of major settlements, faults, and major tectonic features. (Modified from Chang et al. [41], Mao et al. [42], and Ye. [43]).
Minerals 12 01174 g002
Figure 3. Geological map of Magushan Cu-Mo deposit. (Modified from Bian. [19], Ye. [43], and Hong et al. [44]).
Minerals 12 01174 g003
Figure 4. Gravity and magnetic inversion interpretation and profile-verification flow chart.
Minerals 12 01174 g004
Figure 5. 3D model of the Xuancheng–Magushan Area. (Modified from Ye. [43] and Hu et al. [45]).
Minerals 12 01174 g005
Figure 6. Block model of Xuancheng–Magushan Area.
Minerals 12 01174 g006
Figure 7. Standard Deviation maps of random forest algorithm under different parameters.
Minerals 12 01174 g007
Figure 8. Distribution map of favorable areas, (a) Random forest model results; (b) Logistic regression model results.
Minerals 12 01174 g008
Figure 9. Comparison of ROC curves.
Minerals 12 01174 g009
Figure 10. Capture efficiency curves.
Minerals 12 01174 g010
Figure 11. Delineation of prospecting target areas.
Minerals 12 01174 g011
Table 1. 3DMPM model and analysis and extraction method of ore control and indicator elements. (Modified from Ye [43]).
Classification Exploration CriteriaSpatial Analysis Methods
StrataCarboniferous stratigraphic contact surface distance field3D geological body surface extraction function
3D Distance Field Analysis
Permian stratigraphic contact surface distance field3D geological body surface extraction function
3D Distance Field Analysis
Triassic stratigraphic contact surface distance field3D geological body surface extraction function
3D Distance Field Analysis
IntrusionsRock mass contact zone distance field3D geological body surface extraction function
3D Distance Field Analysis
StructuresDistance field of diorite uplift location3D Mathematical Morphological Methods
3D Distance Field Analysis
Table 2. Definition of spatial parameters for 3DMPM in Xuancheng–Magushan Area.
ParameterValue (m)
North-south extent (x axis)23,500
East-west extent (y axis)21,500
Vertical extent (z axis)500~−3000
X axis block size100
Y axis block size100
Z axis block size25
Table 3. Comparison of performance indicators.
Models AccuracyRecallSpeciality
Logistic regression 90.625%83.62%93.33%
Random forest 96.63%93.97%97.67%
Publisher’s Note: MDPI stays neutral with regard to jurisdictional claims in published maps and institutional affiliations.

