Article

Application of the Response Surface Methodology to Optimise the Leaching Process and Recovery of Rare Earth Elements from Discard and Run of Mine Coal

by
Harrar Hamza
,
Orevaoghene Eterigho-Ikelegbe
,
Abdulsalam Jibril
and
Samson Oluwaseyi Bada
*
DSI-NRF SARChI Clean Coal Technology Research Group, School of Chemical and Metallurgical Engineering, Faculty of Engineering and the Built Environment, University of the Witwatersrand, Private Bag X3, Wits 2050, Johannesburg 2006, South Africa
*
Author to whom correspondence should be addressed.
Minerals 2022, 12(8), 938; https://doi.org/10.3390/min12080938
Submission received: 18 June 2022 / Revised: 10 July 2022 / Accepted: 13 July 2022 / Published: 26 July 2022
(This article belongs to the Special Issue Rare Earth Metals and PGM: Beneficiation, Recovery and Quantification)

Abstract

:
The supply shortage of rare earth elements (REEs) for use in numerous high-tech applications has become an incentive for the prospecting of REEs from coal and coal discard. In this study, an optimised leaching process for the recovery of REEs from coal using the Design Expert (DOE) is reported. Response surface methodology (RSM) was used to investigate the effect and to determine the optimal leaching parameters for the two non-calcined coal samples. An optimised REE leaching recovery of 18.95% and 41.35% was obtained for the non-calcined Run-of-Mine (ROM) coal and discard coal, respectively. This optimised recovery was obtained as the HCl concentration increased from 0.5 M to 2 M, leaching temperature increased from 30 °C to 50 °C, whilst the solid:liquid ratio decreased from 40 g/L to 10 g/L. Statistical analysis indicated that the leaching parameters studied were important and controlled the REE leaching recovery model. Optimisation results also indicate that the calcined coals at 700 °C have the highest leaching recovery of 94.73% (ROM) and 98.17% (discard), respectively. Calcination also increased the concentration of REEs in the ROM sample from 225 ppm to 347 ppm and discarded the sample from 245 ppm to 363 ppm at 700 °C. Given the effect of the lixiviants investigated, the leaching efficiency of HClO4 for REE recovery was significantly lower than HCl and HNO3 under optimal leaching conditions. The discard coal used in this study had a significantly higher potential for REE recovery than ROM coal because it had a higher REE abundance and greater recovery.

1. Introduction

Historically, only chemists and scientists have been aware of rare earth elements (REE). However, at the beginning of the 21st century, REEs gained more recognition because of their intrinsic and specialised properties [1,2]. Today, REEs are well-sorted after elements due to their rapid surge in demand globally [3,4]. REEs are key components in hybrid vehicles, fluorescent and LED lights, actuators, solar panels, wind turbines, military equipment, smartphones, catalysts, and medical and agricultural equipment [5,6,7]. REEs are the 15 elements of the lanthanide series, plus yttrium and scandium, according to the International Union of Pure and Applied Chemistry (IUPAC) [8]. Geochemically, REEs are classified based on their atomic numbers into light REEs (LREEs): La, Ce, Pr, Nd, Sm, Sc (atomic number range 57–64) and heavy REEs (HREEs): Eu, Gd, Tb, Dy, Ho, Er, Tm Yb, Lu, Y (atomic number range 65–71) [3,4,9].
REEs are not “rare,” as the name suggests, but rather originate throughout the Earth’s crust in non-mineable low concentrations [10,11]. The three primary sources of REEs currently mined are conventional ion adsorbed clay ores, phosphate ores (xenotime and monazite minerals), and carbonate ores, such as bastnaesite minerals [7,10,12,13]. Ion-adsorbed ores are mined exclusively in China, which hosts about 50% of the world’s REE crude ores. China also accounted for about 71% of the world’s REE production in 2018 [14]. As China continues to impose different restrictions since 2010 on the export of REE, it has limited the global supply of these critical metals [2,6]. As a result, many researchers have suggested exploring alternative REE-based secondary minerals for REE extraction [3,15,16].
According to the literature, the total reserves of REEs in coal sources are estimated globally to be over 50 million tons, i.e., about 50% of the available conventional REE-bearing mineral reserves [9,17]. As a result, run-of-mine (ROM) coal, discard coal, and coal by-products, such as fly ash, have gained considerable interest as a promising source for REE extraction [9,18,19,20]. According to [21,22], the global average REE concentration in coal is estimated to be 46 ppm, whereas [23] reported an average REE concentration of 68.5 ppm. Ref. [3,24] also reported average REE concentrations of 101 ppm and 116 ppm in Chinese and Turkish coals, respectively. The differences in the concentration of REEs in world coals arise because of variations in coal geochemistry due to the environmental factors prevailing during its formation [9]. In addition, different coalfields and even different strata within a coalfield vary in REE concentrations [3,4,25]. This was also noted in some tests conducted on South African coal from different coalfields. The study conducted by Wagner and Matiane [26] on coal obtained from the Witbank Highveld coalfield resulted in total REE concentrations ranging from 111.62 ppm to 149 ppm. A recent study conducted by Harrar et al. [27] on Waterberg coalfield coal resulted in total REE ranges from 225 to 245 ppm for ROM coal and discard coal, respectively. REEs have also been recovered from coal fly ash (CFA) [28], acid mine drainage, and the discarding of coal stockpiles [18,19]. However, REEs in CFA require aggressive leaching conditions for recovery at a fine particle size of less than 10 µm [18,29]. This would significantly increase the cost of REE recovery and tender the process non-feasible [18].
The varying distribution of REEs in coal may be understood as an outcome of the heterogeneous characteristics and nature of coal [3,4,9,25]. The roof and floor of coal seams have been reported to contain elevated quantities of REEs, as these strata comprise highly inorganic minerals [3]. A study conducted by Luttrell et al. [30] showed that this section contained high ash tailing particles, which increased significantly in REEs as the ash content of the coal increased. Reid [18] reported that the bulk of REEs in coal (75%) is in the mineral matter rather than in the organic fraction of coal. Given that South Africa produces approximately 60 million tonnes of coal discarded annually [31,32], this mineral-rich resource could be a promising future source for REE recovery.
To recover REEs effectively from both conventional and secondary ores, it is necessary to understand the forms and associations of REEs with their mineralised minerals. Understanding REE-bearing minerals provides information on beneficiation techniques for optimum recovery. As the literature has shown, the recovery of REEs by physical separation techniques alone is ineffective for the removal of gangue materials associated with REEs [15,33]. For effective physical separation, a high degree of beneficiation and ultrafine milling (<37 µm) is required, resulting in an energy- and cost-intensive liberation step [9,10,15,34]. To overcome the challenges associated with the physical separation of REEs, a hydrometallurgical extraction process is used. This involves acid leaching, alkaline decomposition or roasting, and oxidation, followed by leaching [4,9,20]. With the variation in the types of bonds and mineral associations in coal, it is expected that the acid concentration needed to maximise REE recovery will differ.
In this study, ROM and discard coal above 50% ash (coal shale) from one of the nineteen coalfields in South Africa was utilised. Calcination was used as a pre-treatment method for these samples to improve the recovery of REEs from the samples. According to the literature, dehydroxylation of kaolinite, muscovite, and illite occurred while calcining or roasting at a specific temperature, resulting in the Al-OH bonds breaking and the subsequent degradation of the crystal structure of kaolinite. According to XRD analysis of the two samples, the samples contained kaolinite, muscovite, etc. [27]. Based on this information, both samples were calcined at various temperatures, resulting in a higher concentration and recovery of REEs in the respective samples. To the authors’ knowledge, this is the first study on South African coal that uses this approach to enhance REE recovery, as well as coal characterised for the first time using a Tescan Integrated Mineral Analyzer (TIMA). The Design of Expert was also used to obtain optimum leaching conditions and REE recovery models for the leaching of REEs from the two coals (non-calcined coals). The leaching temperature, acid concentration (HCl), and solid:liquid ratio were optimised using response surface methodology (RSM) to improve REE recovery from these coals. Furthermore, the coal samples were then subjected to HNO3 and HClO4 leaching under the optimised leaching parameters to determine the best acid lixiviate to improve their REE recovery. Subsequently, the calcined samples obtained at different temperatures were leached using optimised leaching conditions to improve the percentage of REE recovery from both coals.

2. Materials and Methods

2.1. Materials

The two medium-rank C bituminous, high ash coals used in this study are a sample of run-of-mine (ROM) coal and discard coal from the Waterberg coalfield. These coals are referred to as RC1 and DC1, respectively. DC1 is the washed product obtained from RC1, and both coals have an ash content above 50% [27]. The as-received coal samples “DC1 and RC1” were dried under normal atmospheric conditions before sampling through the coning and quartering technique. Thereafter, the sub-samples were crushed, milled, and screened to −1 mm, with a representative split removed. The other half was milled to −212 µm. Consequently, another representative split was removed, and the remainder was milled to −106 µm following the ASTM D-2013 standard. The remainder containing 90% passing −106 µm was calcined prior to leaching, with the data presented. Samples for the petrographic and other physicochemical analyses were obtained, as reported by Harrar et al. [27].

2.2. Analytical Techniques and Calcination Procedure

The size distribution (PSD) of the samples (RC1 and DC1) was determined using a Malvern Mastersizer 2000 with Hydro 2000 MU dispersion. Inductively Coupled Plasma Mass Spectrometry (ICP-MS) was used to determine the concentration of the REEs in the as-received samples and subsequent leachate samples to ascertain the extent of REEs recovered (Harrar et al., 2022). The calcination test for both RC1 and DC1 was conducted in a muffle furnace at 500 °C, 600 °C, 700 °C, and 800 °C under a static environment. Each coal sample was calcined for two hours at the respective target temperature and at a heating rate of 10 °C/min.

2.3. Experimental Design for the Leaching of Non-Calcined and Calcined Samples

2.3.1. Varying Concentration, Solid: Liquid Ratio, and Temperature for Non-Calcined Samples (RC1 and DC1)

In this phase, HCl (37%) was first used as a leaching agent because it is relatively inexpensive to HNO3 and to determine the optimal leaching conditions based on the % REE leaching recovery. The Design-Expert software (version 13) from Stat-Ease, Inc. was used for the experimental design. The process parameters were modelled using response surface methodology (RSM) with a Box-Behnken Design (BBD). Three independent variables of acid concentration, pulp density (solid: liquid ratio), and leaching temperature, leading to 15 leaching runs, were generated (Table 1). The leaching temperature, HCl concentration, and solid:liquid ratio were varied, coupled with a leaching time of 3 h (180 min) and a stirring speed of 530 rpm, which were kept constant. The two coal samples (−106 µm) were investigated to determine the optimum leaching parameters required to enhance REE recovery. After the 15 experimental BBD tests, the experimental percentage of REE recovery attained was displayed via the RSM. The RSM gathers mathematical, experimental, and statistical data for modelling. Then, using analysis of variance (ANOVA), the significance and suitability of the variables can be verified [35,36]. With the linear model developed from the DOE, the effect of the relationships between the three factors and their direct effect on the percentage of REE recovery was determined. Finally, the desirability function was used to derive optimal leaching parameters to increase REE recovery from ROM coal (RC1) and discard coal (DC1).

Leaching and Recovery of REE

The leaching test procedure used in this study was similar to that used by Yang [11]. 10 to 40 g of the RC1 and DC1 coals were mixed with the prepared leachate solution to obtain a 1-L leaching slurry, stirred at a speed of 530 rpm. Subsequently, 15 mL of the slurry was drawn with a 0.45 µm microfilter plunger syringe to separate the suspended solids from the leachate. The leachate samples collected for both samples (non-calcined and calcined) were then subjected to ICP-MS analysis to determine the REE content of the analysed sample.
The percentage leaching recovery of the REEs was determined according to Equation (1).
%   L e a c h i n g   R e c o v e r y   o f   R E E s = m R E E l e a c h a t e m R E E c o n c e n t r a t e × 100
where m R E E l e a c h a t e and m R E E c o n c e n t r a t e represents the mass of REEs in the lixiviant and the mass of REEs in the original sample, respectively. Reordering Equation (1) resulted in Equation (2):
%   L e a c h i n g   R e c o v e r y   o f   R E E s = C L × V L C R S × M R S
where CL represents the total rare earth element (TREE)/elemental concentration in the leachate in µg/mL and VL, the volume of leachate in ml. C R S is the REE/elemental concentration in µg/g of the initial raw sample and M R S is the weight of the coal sample added to the leachate in grams. The optimal leaching conditions attained from the DOE based on the percentage of REEs recovered were implemented for the optimisation tests on the RC1 and DC1 coals. Consequently, the optimal leaching parameters determined from the DOE were also employed in Stage 2 of the leaching experiments, the only difference being the change in the lixiviate used.

Stage 2: Leaching of Non-Calcined Samples under DOE Optimal Conditions and Different Lixiviants

HCLO4 and HNO3 of 70% and 69% grade, respectively, were utilised in this stage of the leaching experiments on both coals (RC1 and DC1) based on the optimal REE recovery conditions from Stage 1 (DOE). Data from this step were used to derive the best acid to enhance REE recovery under optimal leaching conditions and were likewise used for the calcined leaching test.

Stage 3: Leaching of Calcined Samples under DOE Optimal Conditions

The calcined DC1 and RC1 were leached under the optimal parameters (ideal acid concentration, optimum solid:liquid ratio, and best leaching temperature) attained from Stage 1, and the best acid lixiviate obtained from Stage 2. In Stage 2, critical information regarding the optimal calcination temperature required for an improvement in REE recovery and leaching percentage was provided.

3. Results and Discussion

3.1. Particle Size Distribution and REE Contents of the Non-Calcined and Calcined Samples

REE recovery during acid leaching is known to be significantly higher at less than 40 µm particle size, but the cost of milling to this fine size can render a leaching process non-feasible [10]. Zhang and Honaker [37] recommended that a size fraction of −106 µm may reduce milling costs and the recovery of REEs. In this study, about 91% of the RC1 particles and 94% of the DC1 are noted to pass −106 µm size fraction. The quantitative data of the REEs in both RC1 and DC1 are presented in a recent publication by Harrar et al. [27]. The ICP-MS results for both non-calcined samples show TREE content of 225 ppm and 245 ppm for RC1 and DC1, respectively. This is significantly greater than the TREE content of 121 ppm for coals reported from the Witbank and Highveld coalfields by Wagner and Matiane [26]. In addition, both samples were well above the cut-off grade of 130 ppm for REEs in coal, as stipulated by Zhang et al. [9] and Dai and Finkelman [38]. The data obtained from the calcined samples at 500 °C, 600 °C, 700 °C, and 800 °C are presented in Table 2. As the calcination temperature increased from 500 °C to 800 °C the TREEs content increased significantly. This trend is due to the degradation and removal of the coal’s volatile matter and carbon structure [39], subsequently increasing the REE concentrations in calcined RC1 and DC1. The highest concentration of TREEs was obtained at a calcination temperature of 800 °C, with RC1 and DC1 concentrations of 362.29 ppm and 390.70 ppm, respectively. At these four temperatures, the calcined DC1 subsequently had a higher TREE concentration than the calcined RC1. The TREEs achieved from the calcined RC1 and DC1 were greater than those of the raw RC1 and DC1, as reported by Harrar et al. [27].

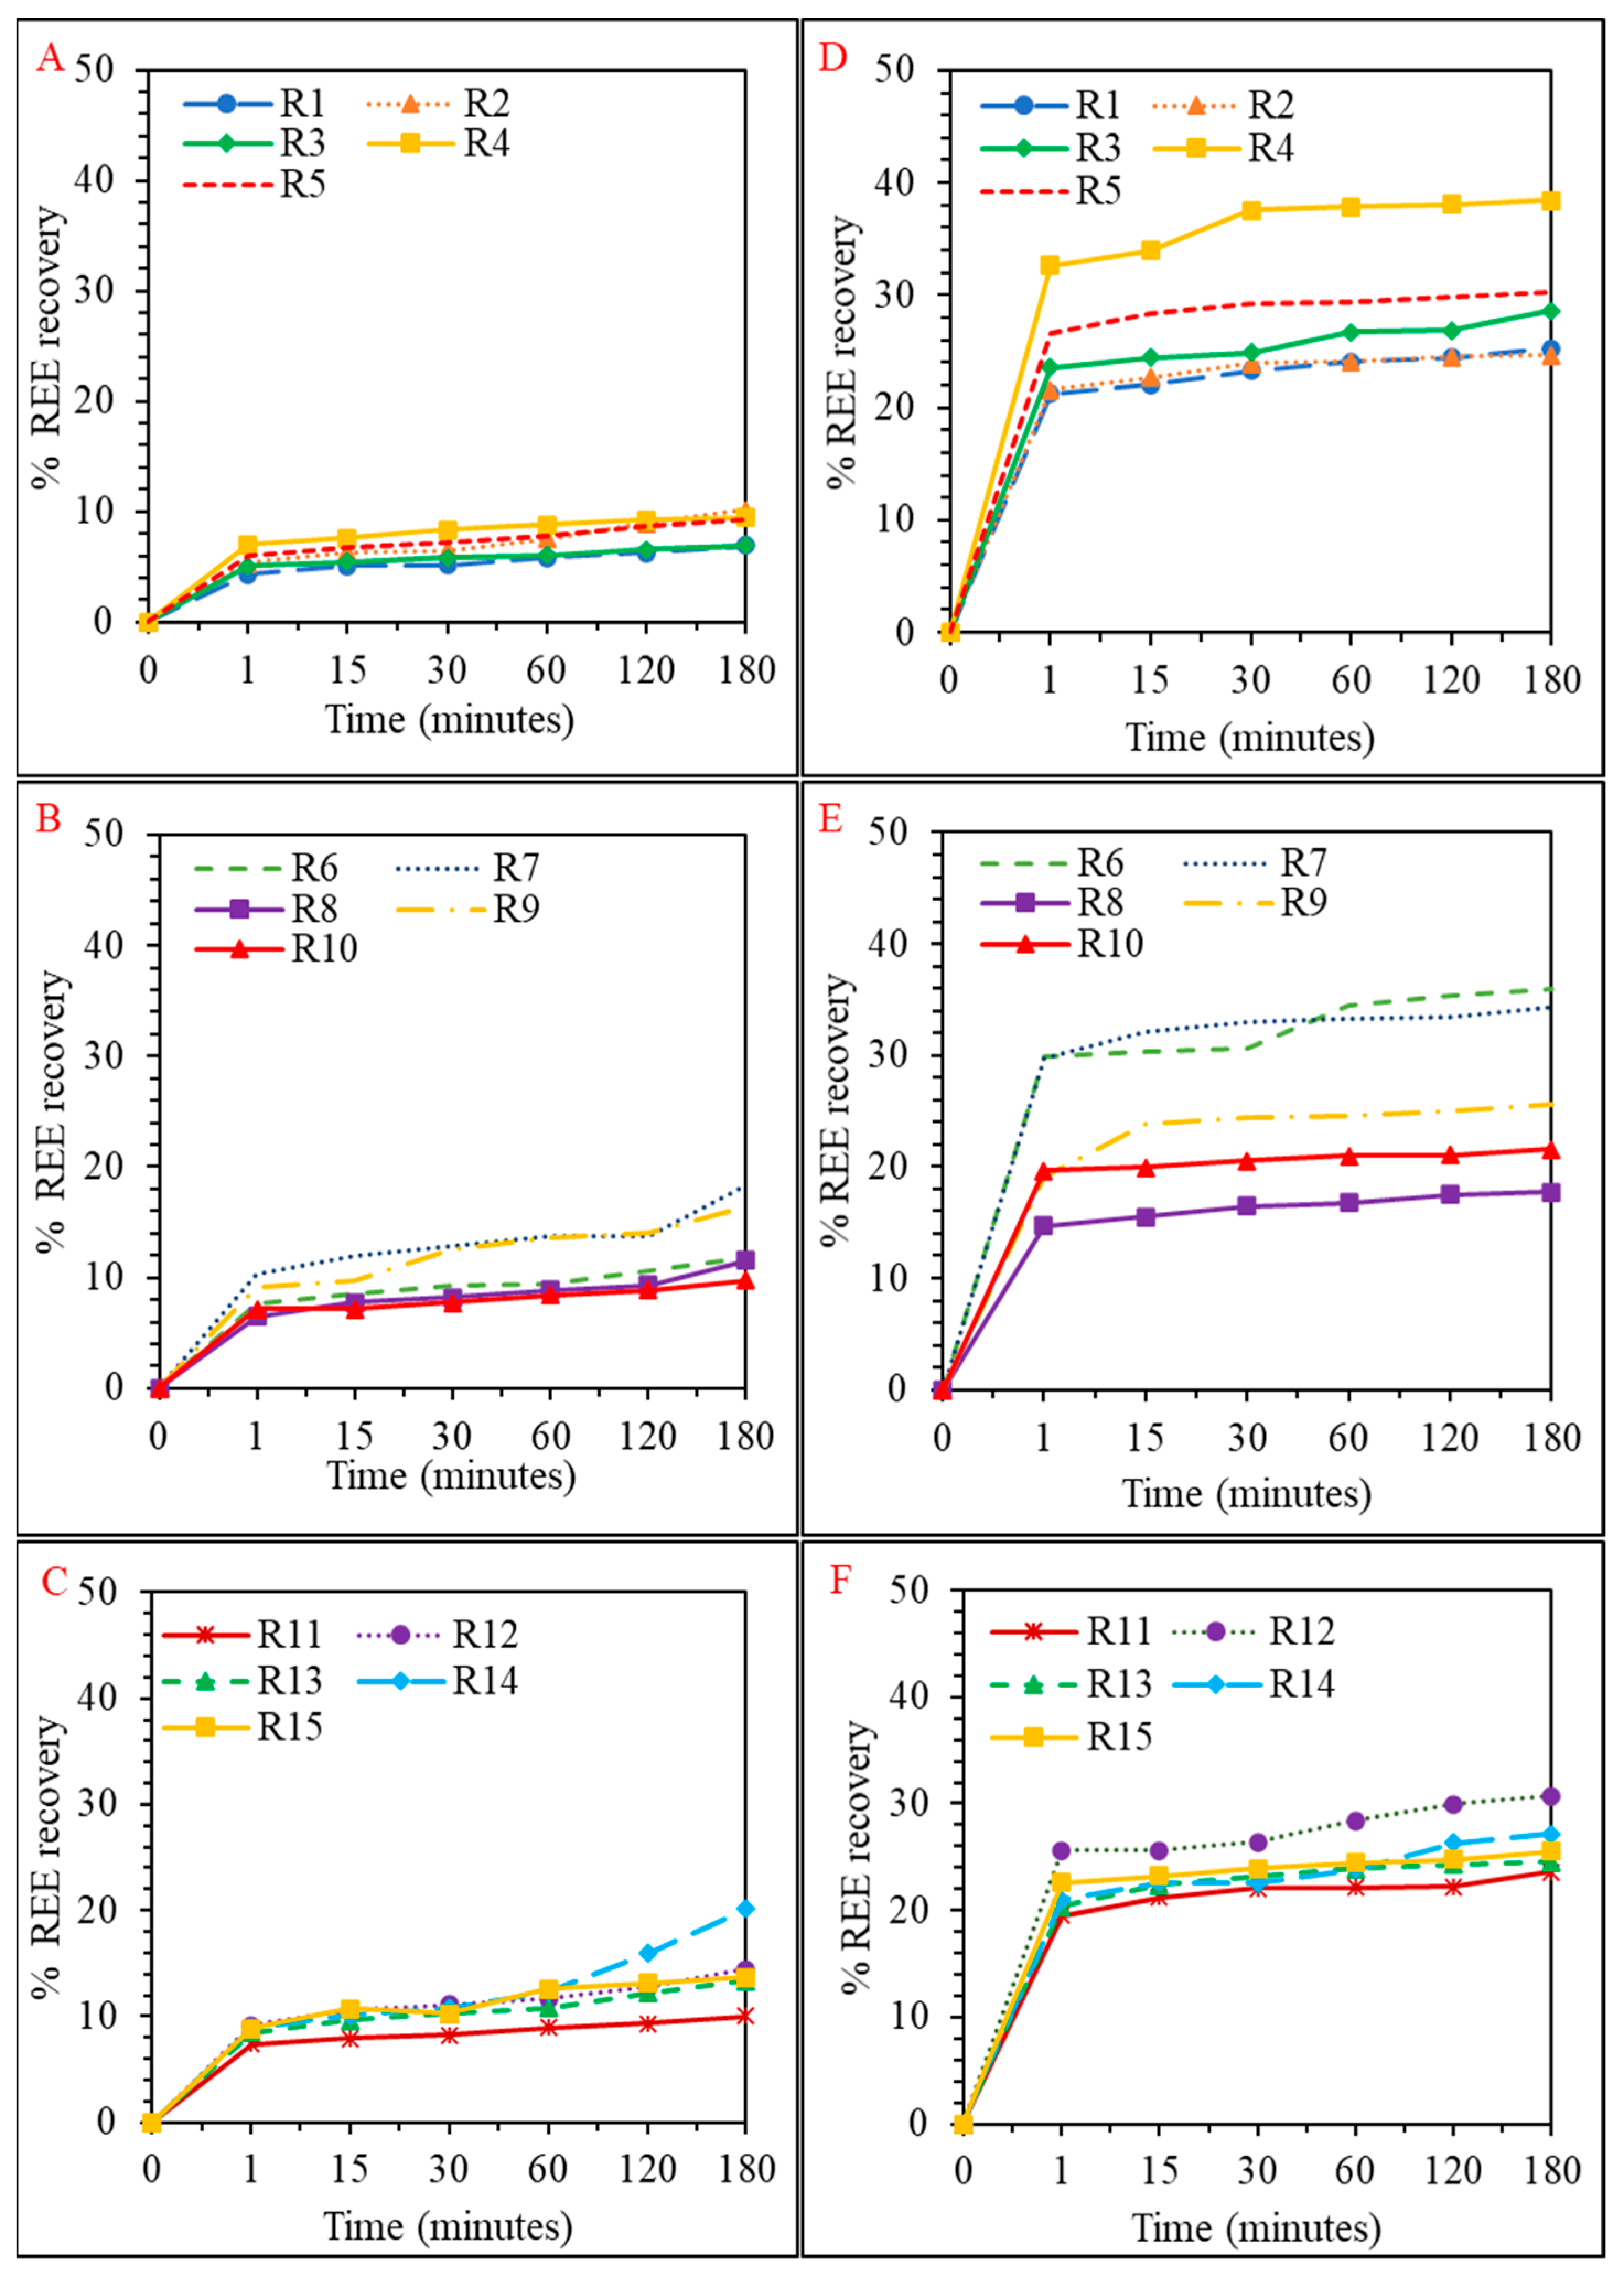
3.2. Stage 1 of the Box-Behnken (DOE) Experimental Leaching Runs for Non-Calcined Samples

RC1 and DC1 were subjected to 15 leaching runs each (30 runs in total), as shown in Table 1. The simultaneous variations in concentration, temperature, and solid:liquid ratio enabled the DOE to produce optimal leaching conditions. The percentage of REE recovery observed for the 15 lixiviate experimental runs (R1–R15) for RC1 and DC1 coals are shown in Figure 1.
From Figure 1A–C, R14 (REE recovery 21%), R7 (REE recovery 18.4%), and R9 (REE recovery 16.4%) reflect a promising REE recovery potential for RC1 coal. It was observed that the REE recovery occurred instantaneously at one minute, thereafter, gradually increasing to a minimum until the end of the test. The high recovery noted for these three runs may be attributed to the high HCl concentration (≥1.25 M) and high leaching temperature (>40 °C) to which the RC1 coal was subjected. For the DC1 sample (Figure 1D–F), leaching runs R4, R6, and R7 presented an overall percentage REE recovery of 38.4%, 35.9%, and 34.3%, respectively. These tests were carried out using a low solid: liquid ratio (≤25 g/L), a high leaching temperature (>40 °C), and HCl concentration ≥ 1.25 M. The maximum REE recovery from DC1 coal (38.4%) was higher than from RC1 (21%). This recovery is similar to the result obtained by Yang et al. [40], where 50% of REEs were recovered from coal middling.
The lower REE recovery noted for RC1, which possesses a higher carbon content [27], might be due to the carbon interaction with HCl, leading to chemically induced activation of carbon molecules. This type of interaction could lead to an increase in the porosity of the carbon fraction in the sample, thereby resulting in more reactive re-adsorption sites for REEs. The increase in the REE leaching efficiency of DC1 coal might be due to its lower total carbon encapsulating the REE-bearing minerals [41]. Consequently, allowing for more interaction between the REE-bearing minerals and the leachate leads to higher REE recovery. The outcome of this study is consistent with the findings of [42,43,44]. The leaching mechanism of the REE-bearing minerals in the two coal samples was presented and explained in a study conducted by Harrar et al. [27]. The authors illustrated that the low REEs obtained from both RC1 and DC1 were due to the REEs being dispersed in the kaolinite matrices of the coals. According to [45], kaolinite subjected to HCl leaching cannot be completely dissociated under mildly acidic conditions of 2 M and 75 °C.

3.2.1. Optimisation of the REE Leaching Recovery from DC1 and RC1 Coal

The actual experimental responses in Figure 1 and the predicted responses of the % REEs recovered from the effect of the three leaching factors are displayed in Table 3 (RC1) and Table 4 (DC1). The % REE leaching recovery after three hours was recorded in the DOE to create a confined area for the RSM and to develop empirical equations. The development of empirical equations 3 to 6 provided the predicted % of REE recovery. It was observed from the combined effect of these factors that REE recovery improved with an increase in temperature and HCl concentration. This is consistent with a study carried out by Yang [11], which also showed an increase in REE recovery due to an increase in acid concentration and temperature. Both tables also indicate the closeness of the experimental and predicted % REE leaching recovery. The relative similarities between the data further verify the model’s suitability [36,46].

Suitability and Adequacy of the Model (ANOVA)

The adequacy of the fitted linear model (Equations (3) and (4)) was studied by analysing the ANOVA results and the fit summary presented in Table 5 and Table 6. The model’s suitability was assessed on DOE using the F-value, p-value (ANOVA), and R2 values (Table 5 and Table 6). The significance of the linear model was examined using probability (p-value). The p-value indicates whether the model terms (concentration, solid:liquid ratio, and temperature) are significant or not significant in terms of their influence on the REE leaching recovery [47]. A p value < 0.0500 illustrates that the model terms are significant, while values > 0.1000 indicate that the model terms are insignificant [48,49]. Using equation 3 for RC1, the three leaching factors of A-HCl concentration, B-solid:liquid ratio, and C-temperature were found to be significant in the linear models, as can be seen from the p-values in Table 5. Likewise, using equation 4, the same conclusion can be made for DC1 (Table 6). Correspondingly, the linear models of equations 3 and 4 derived from DOE to predict the % REE leaching recovery show p-values of 0.0147 and 0.0001 for RC1 and DC1. Consequently, the linear model for the % REE recovery and its factors is significant and suitable for the experimental data [36].
The F-values (lack of fit) of 22.81 (DC1) and 5.52 (RC1) indicate that the linear model is significant, with only a 0.01% (DC1) and 1.47% (RC1) chance that an F-value this large could have occurred due to noise [35,48,50]. The p-value and F-value are 0.99 and 0.11, respectively, for RC1 and 0.9714 and 0.6043, respectively, for DC1. Hence, this indicates an insignificant lack of fit [50]. An insignificant lack of fit is essential and important for a linear model that fits experimental data [50]. The R2 value for the RC1 and DC1 linear models of % REE recovery are 0.8910 and 0.9133, respectively. This confirms a very good linear equation model [46]. Adjusted R2 values of 0.88 (RC1) and 0.89 (DC1) are within a satisfactory range, with predicted R2 values of 0.87 (RC1) and 0.87 (DC1). The difference between the adjusted and predicted R2 values was less than 0.02 for both samples and was within an acceptable range [48,51]. “Adequate Precision” is a value used to measure the signal-to-noise ratio. A ratio greater than four is desirable for the model to navigate within the design space [48]. Hence, the “Adequate Precision” values of 6.93 (RC1) and 14.67 (DC1) show that the model attained is satisfactory and suitable for predicting the % REE recovery.
Coded Equations:
%   REE   leaching   recovery   ( RC 1 ) = 11.95 + 1.79 A 1.63 B + 3.46 C
%   REE   leaching   recovery   ( DC 1 ) = 31.47 + 2.22 A 4.28 B + 3.26 C  
Actual Equations:
%   REE   leaching   recovery   ( RC 1 ) = 2.14 + 2.38 A 1.08 B + 0.35 C
%   REE   leaching   recovery   ( DC 1 ) = 21.87 + 2.97 A 0.28 B + 0.33 C  

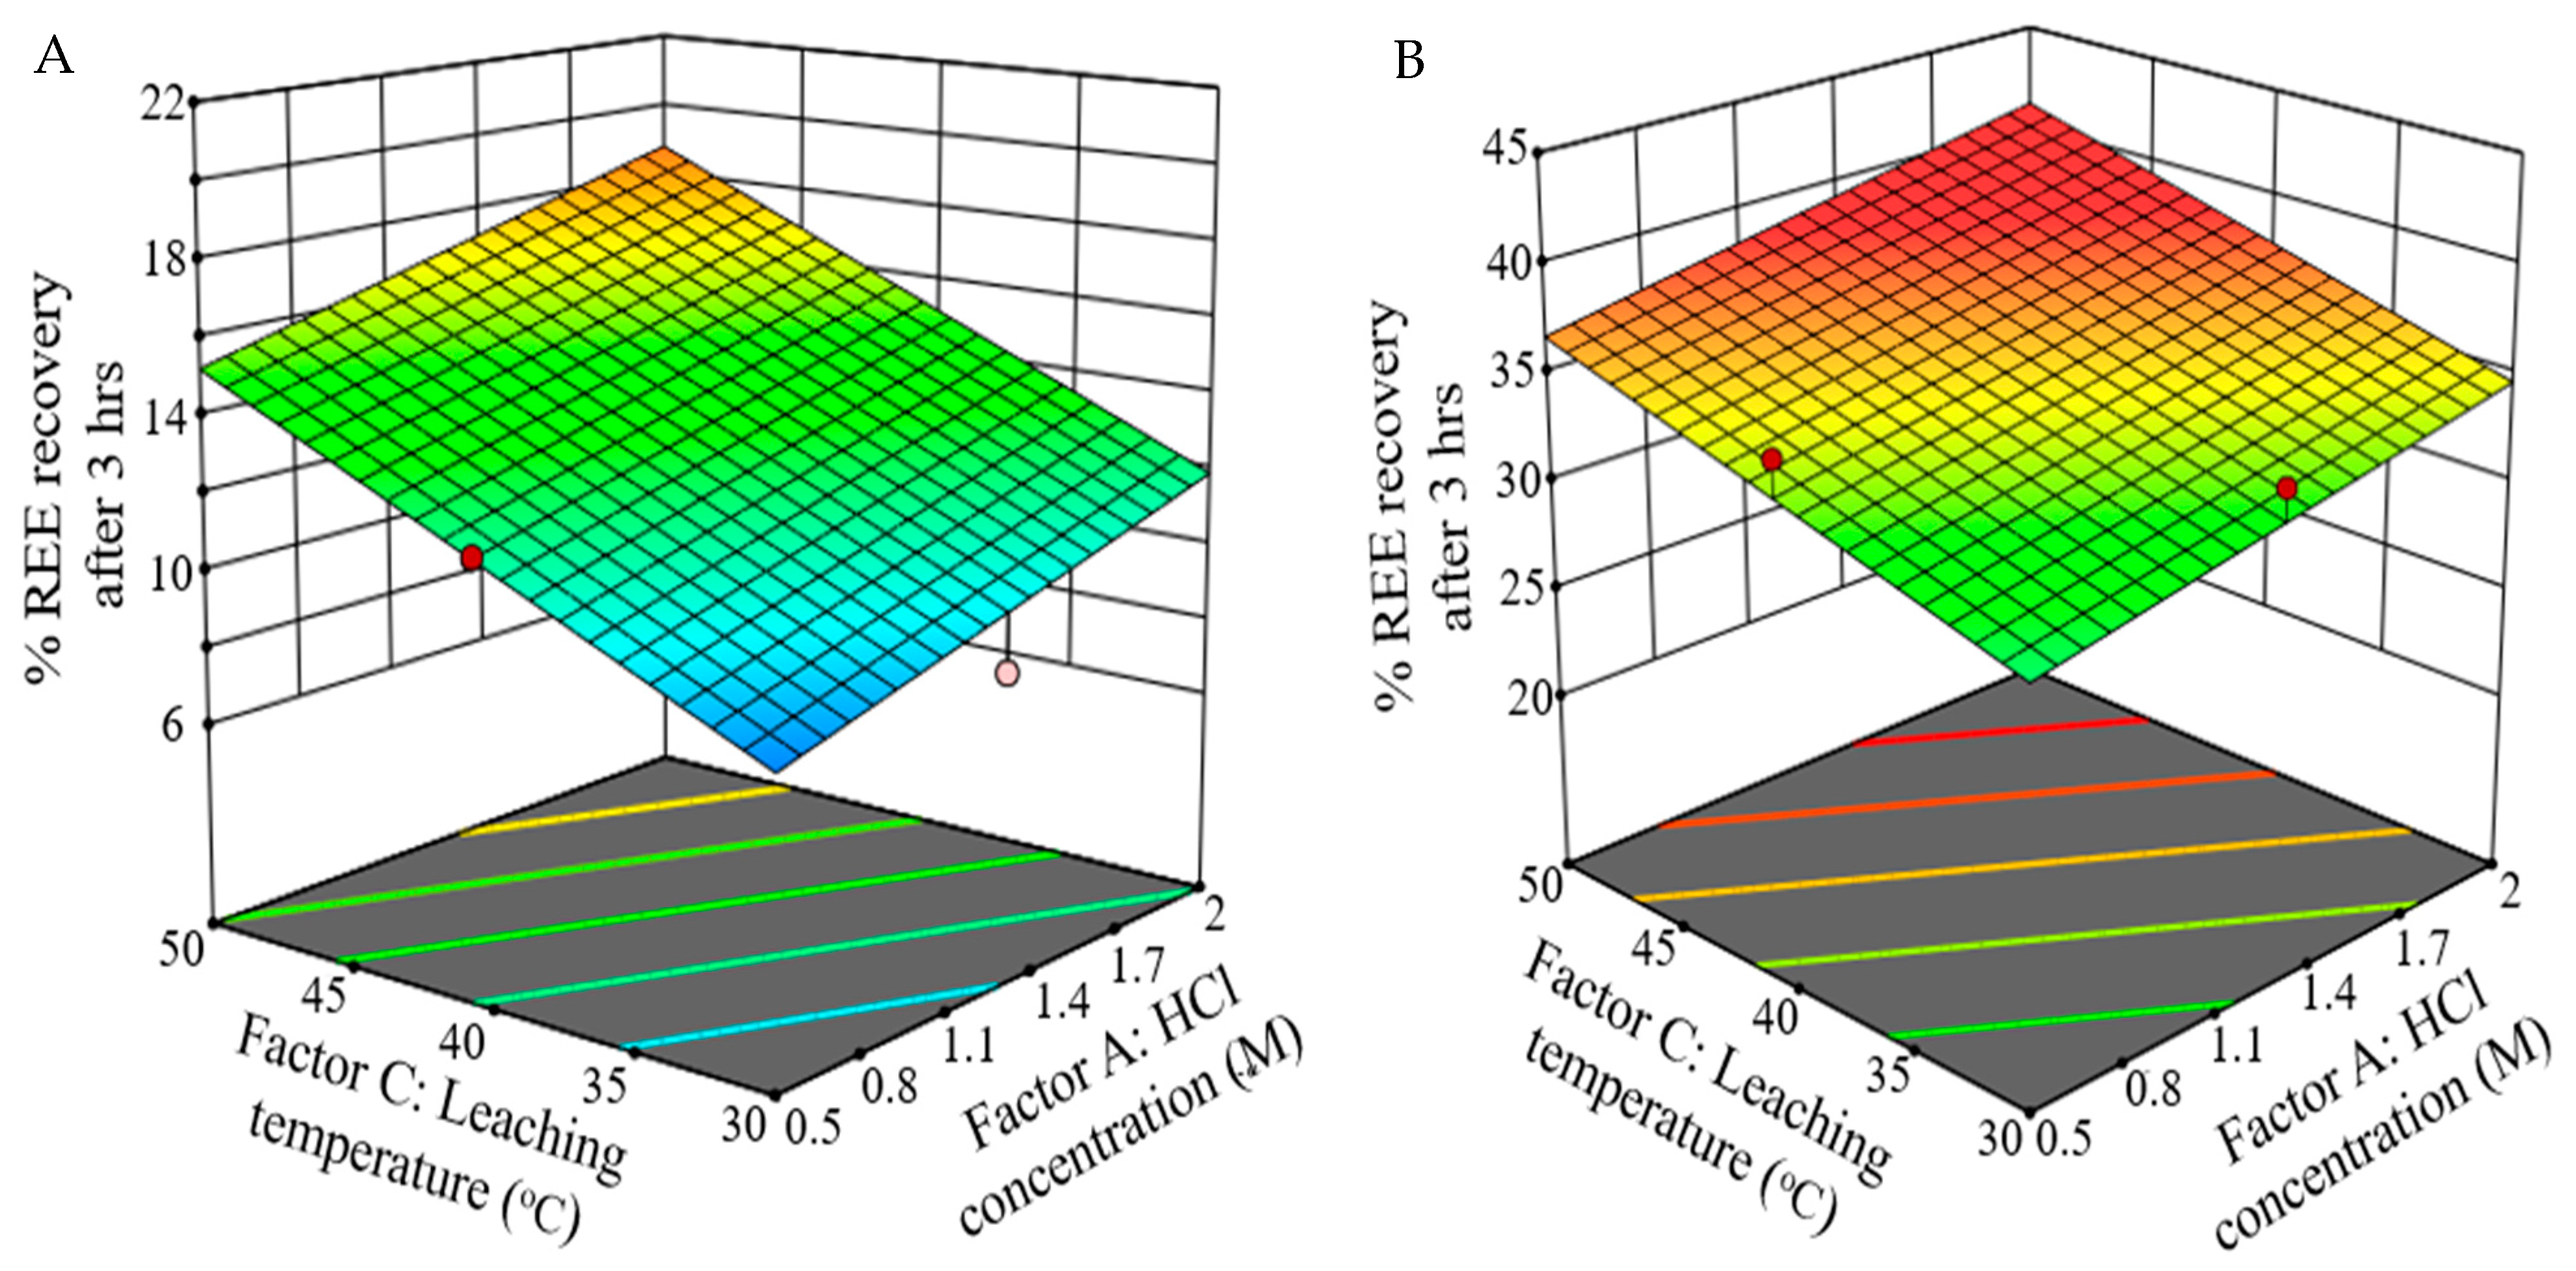
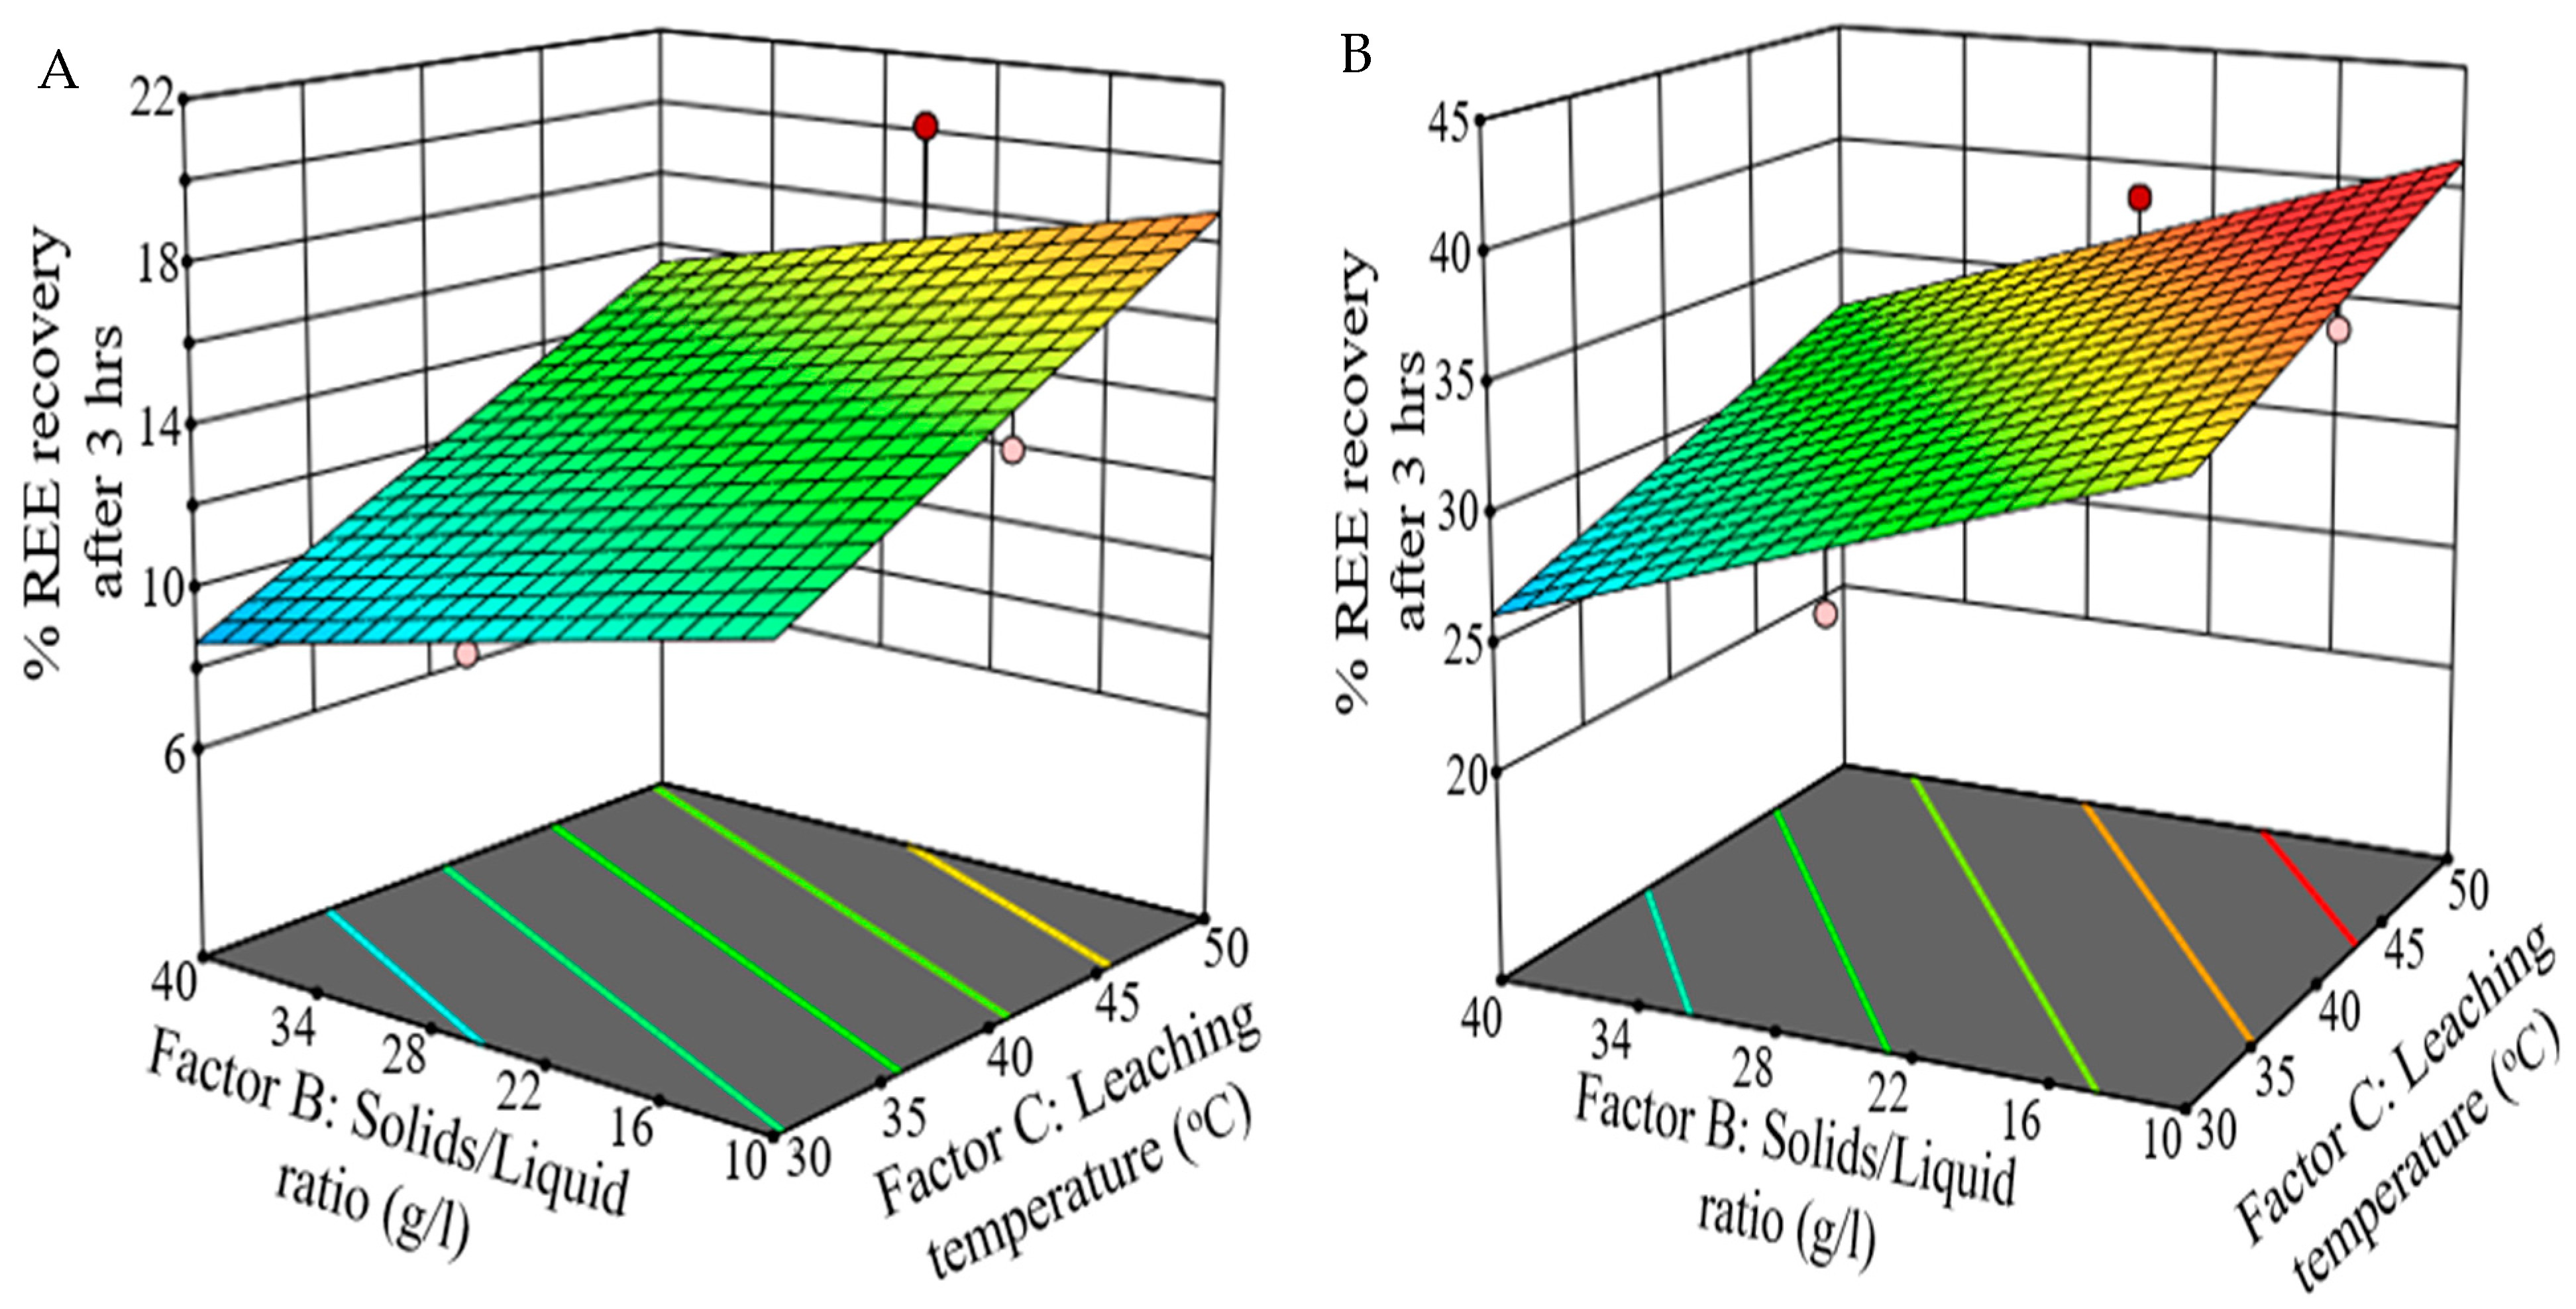
Response Surface Methodology Plots for the Interactions between the Leaching Factors and the % REE Leaching Recovery

The interactions between HCl concentration (factor A), solid:liquid ratio (factor B), and leaching temperature (factor C) were studied to understand the simultaneous relationships between them. This study demonstrated the influence of these factors on the percentage of REE leaching recovery by engaging RSM on DOE to obtain 3D response surfaces. The optimal and best conditions are indicated in the dark red converging area, representing the highest % REE leaching recovery [46]. The RSM 3D plots for RC1 and DC1 (Figure 2A,B) were designed based on the actual model equations 5 and 6 for the % REE leaching recovery. The % REE leaching recovery improved with increased temperature and HCl concentration (Figure 2A,B). Several studies have also shown that REE recovery increases with increased temperatures and acid concentrations [11,50]. For both coal samples, an increase in HCl concentration increased the % REE leaching recovery. According to [11,52], an increase in acid load would result in an increase in hydronium ions in solution, which would result in a decrease in pH to near zero. At low pH values, REEs form cations that are easily dissolved in the lixiviate solutions by attaching to chlorine anions.
The 3D surface plots from the simultaneous effects of leaching temperatures between 30 °C to 50 °C and solid:liquid ratios ranging from 10 g/L to 40 g/L on the % REE leaching recovery are depicted in Figure 3A,B, respectively. The HCl concentration for these tests was kept at 2 M, and it is evident that the % REE leaching recovery increased as the leaching temperature increased to 50 °C. At a leaching temperature of 50 °C and pulp density of 10 g/L, the % REE leaching recovery reached a maximum of 18.8% and 40% for RC1 and DC1, respectively (Figure 3). Several studies on REE leaching recovery from coal and different REE-based ores have indicated that REE recovery increased with an increase in leaching temperature and a decrease in solid:liquid ratio [11,47,50,53,54].
Figure 4A,B depicts the relationship between the solid:liquid ratio at 10 g/L to 40 g/L and HCl concentration ranging between 0.5 M to 2 M at a constant temperature of 50 °C. From the 3D surface plots (Figure 4), it was observed that an increase in REE recovery was due to an increase in acid concentration and a decrease in pulp density. This observation was similar to that reported by Chi et al. [53], Cao et al. [54], Amine et al. [47], and Yang (2019) [11] on the influence of acid concentration and pulp density on REE recovery.
The development of the 3D surface response models provided valuable information on the optimisation and % REE leaching recovery of the two coal samples. Therefore, it may be concluded that HCl concentrations of 2 M, 50 °C, and a low pulp density (10 g/L) are noted as the best operating parameters to enhance REE recovery.

Desirability Function for Optimal Leaching Parameters

The determination of the optimal leaching conditions for REE recovery was carried out using DOE, as shown in Table 7. To obtain the optimal leaching conditions of factors A-HCl concentration, B-solid:liquid ratio, and C-leachate temperature, a desirability function was employed to maximise the % REE leaching recovery. Table 7 illustrates the parameter settings for the desired target response.
The desirability function operates in an interval of [0, 1], with 1 conforming to the maximum satisfaction and 0 indicating an unacceptable or undesirable response [47]. Table 8 illustrates that the optimal leaching solutions with solution 1 selected for RC1 and DC1 as the % REE leaching recovery were highest in this design space. Additionally, solution 1 for RC1 and DC1 manifested desirability of 0.90 and 1.00, respectively. This indicates that the optimal runs provided maximum satisfaction. In conclusion, the optimum leaching process conditions for RC1 and DC1 correspond to an HCl concentration of 2 M, with a solid:liquid ratio of 10 g/L and a leaching temperature of 50 °C.
The predicted optimised % REE leaching recovery model (Equations (3) and (4)) and conditions were within a 95% confidence level (Table 9). Moreover, the point prediction provided a standard deviation of 2.93 (RC1) and 1.99 (DC1). This implies that the predicted and experimental % REE leaching recovery from the optimised leaching conditions (Table 9) will not deviate by more than 3% for either sample. The predicted % REE leaching recovery mean and median for RC1 and DC1 were 18.82 and 41.04, respectively (Table 9). These values were close to the expected REE recovery percentage for the optimised leaching conditions, illustrating the model’s accuracy in the optimised leaching conditions.
Based on the model’s validity, RC1 and DC1 were subjected to leaching under the optimal conditions achieved (HCl concentration of 2 M, with a solid:liquid ratio of 10 g/L and a leaching temperature of 50 °C). Under these conditions, the experimental % REE leaching recoveries for RC1 and DC1 were 18.95% and 41.53%, respectively. These REE recovery values are close to the predicted % REE recovery (Table 3 and Table 4). The percentage of absolute error (POAE) was determined using Equation (7).
P O A E = E x p e r i m e n t a l   %   R E E   r e c o v e r y P r e d i c t e d   %   R E E   r e c o v e r y E x p e r i m e n t a l   %   R E E   r e c o v e r y × 100
The error percentages for RC1 and DC1 were 0.74% and 1.25%, respectively. According to [55], the standard accepted POAE should not be greater than 2.5% to 5%, depending on the type of experiment conducted. Therefore, the POAE achieved shows that the optimised results and solutions are satisfactory and agree with the experimental results.

3.3. Percentage Recovery of REE under Optimal HCl Leaching Conditions for RC1 and DC1 Coals

The optimal leaching conditions were verified by subjecting RC1 and DC1 to leaching under the optimal parameters (HCl concentration of 2 M, solid:liquid ratio of 10 g/L, and leaching temperature of 50 °C). RC1 exhibited an REE leaching recovery of 18.95%, and DC1 achieved a leaching recovery of 41.35%, as depicted in Figure 5. The recovery of the REEs in both samples can be seen to occur instantaneously within the first minute and then gradually increases over three hours, with only an increase of 5% (DC1) to 10% (RC1). Studies on REE leaching from coal and other minerals are well aligned with the REE recovery reported in this study [37,40,42,52]. In some studies, the recovery of REEs was higher, as most of these studies were conducted at a particle size below 10 µm [11]. However, it was observed that, within a one- to ten-minute period, REEs were leached into the lixiviate instantaneously (Figure 5). The optimal leaching conditions predicted by the model (Equations (3) and (4)) were validated, as the model predicted % REE leaching recovery close to the optimal experimental REE leaching recovery.
Under the same optimal leaching conditions, the results obtained for the % HREE and % LREE recovery for the DC1 and RC1 coals are depicted in Figure 6A,B, respectively. 77% of HREE were recovered from DC1, while RC1 manifested a % HREE recovery of 21.03% (Figure 6A). The % LREE recovery for RC1 and DC1 was 14% and 32%, respectively (Figure 6). The higher HREE recovery indicates that the HREEs dissolve more rapidly under optimal leachate conditions within the first minute. However, the LREEs display a slow dissolution in solution in the first 15 minutes, but over time, the LREEs typically increase in solution. The results of the higher extraction efficiency of HREEs suggest that they form weak ion-adsorbed bonding complexes with organic or inorganic minerals within coal [56]. In addition, more HREEs were released into the leachate from the DC1 coal, which contains a higher ash content relative to the RC1 coal, as reported by Harrar et al. [27]. This may be because the carbon fraction of RC1 (high carbon) uses more acid, leaving less HCl acid to react with the REEs in the coal. The low recovery noted in the LREEs could be because they are strongly attached to the insoluble high minerals, such as silicates, kaolinite, pyrite, magnetite, and zircon, present in the coal utilised [27]. These minerals require more contact time, more aggressive leaching concentrations, and higher temperatures to solubilise the REE-bearing minerals within [41]. In retrospect, HREEs were dispersed and weakly adsorbed to organic matrices or weakly adsorbed to clayey mineral sites, whereas the LREEs formed more stable, strongly nested bonds with the mineral fraction, as illustrated by their slower REE recovery over time. The high HREE recovery of 77% from DC1 implies that discarding coal is a promising potential source of economic gain, as no prior mining is required.

3.4. Stage 2 Effect of Different Lixiviants on Percentage REE Recovery under Optimal Leaching Parameters

Leaching experiments were conducted at the optimal leaching parameters of 2 M acid, 50 °C, and a solid:liquid ratio of 10 g/L with nitric acid and perchloric acid. The percentage of REEs recovered from both acids was compared to that of the HCl leaching process. Both RC1 and DC1 were subjected to HNO3 and HClO4 leaching at 2 M. After three hours of leaching, 15.9% of the REEs were recovered using the nitric acid lixiviate, while the perchloric acid only achieved a 7.08% REE recovery from RC1 (Figure 7). The HNO3 and HClO4 leaching applied to DC1 exhibited REE recovery of 42.57% and 22.39%, respectively (Figure 7). Thus, nitric acid was more effective than perchloric acid in leaching REE.
The order of proton activity, HClO4 > HNO3 > HCl [52], implies that HClO4 should have produced a greater recovery of REE. Nonetheless, perchlorate (ClO4-) ions have a lower association/ability to bind to REE cations [57]. This is the reason for the decrease in the percentage of REE recovery during HClO4 leaching. The increase in REE recovery with HCl or HNO3 leaching is due to the stronger bonding abilities of the NO3- and Cl- ions, even though they exhibit lower proton activity [57]. REE cation recovery requires a composite effect of the H3O+ hydronium ion, leading to the acidity and solubilisation of the REE-bearing minerals, along with the influence of the anions’ (Cl-, NO3-) bonding ability to recover the REEs [57]. This indicates why HNO3 and HCl exhibited similar REE recoveries of 42.57% and 41.35% for DC1, and 15.9% and 18.95% for RC1, respectively. Therefore, it may be concluded that HNO3 and HCl behaved similarly in the leaching tests for both coal samples.
Figure 8 presents the % HREEs and % LREEs leaching recovery from DC1 and RC1 under HNO3 and HClO4. HNO3 leaching resulted in a recovery of 93.5% HREEs and 20.78% LREEs from DC1. HClO4 achieved 71.23% HREE recovery and 10.84% LREE recovery from DC1. Nitric acid resulted in an HREE recovery of 38.69% and an LREE recovery of 10.51% from RC1 (Figure 8). The perchloric acid leaching results from RC1 were 16.15% HREE recovery and 4.97% LREE recovery. The higher recovery in HREEs noted in both samples might be a result of the weak ion bonding of the HREEs with the organic matrices and clay minerals, thus being released instantaneously into the leachate solution [56]. The lower recovery of LREEs could be due to their association with less acid-soluble REE minerals. Thus, the recovery of the LREEs progressively improved (Figure 8B) as the minerals slowly decomposed. Laudal et al. [41] suggested that leachate contact time with raw coal should be increased to 24 h to maximise LREE recovery. Overall, the % LREEs and % HREEs recovery was higher from DC1 (in the perchloric and nitric acid leachates) than from RC1, which correlates well with the HCl leaching results. Therefore, HCl was used in the subsequent optimised leaching test for the REEs of the calcined samples due to its higher REE recoveries and cost effectiveness relative to the HNO3 and HClO4 lixiviates.

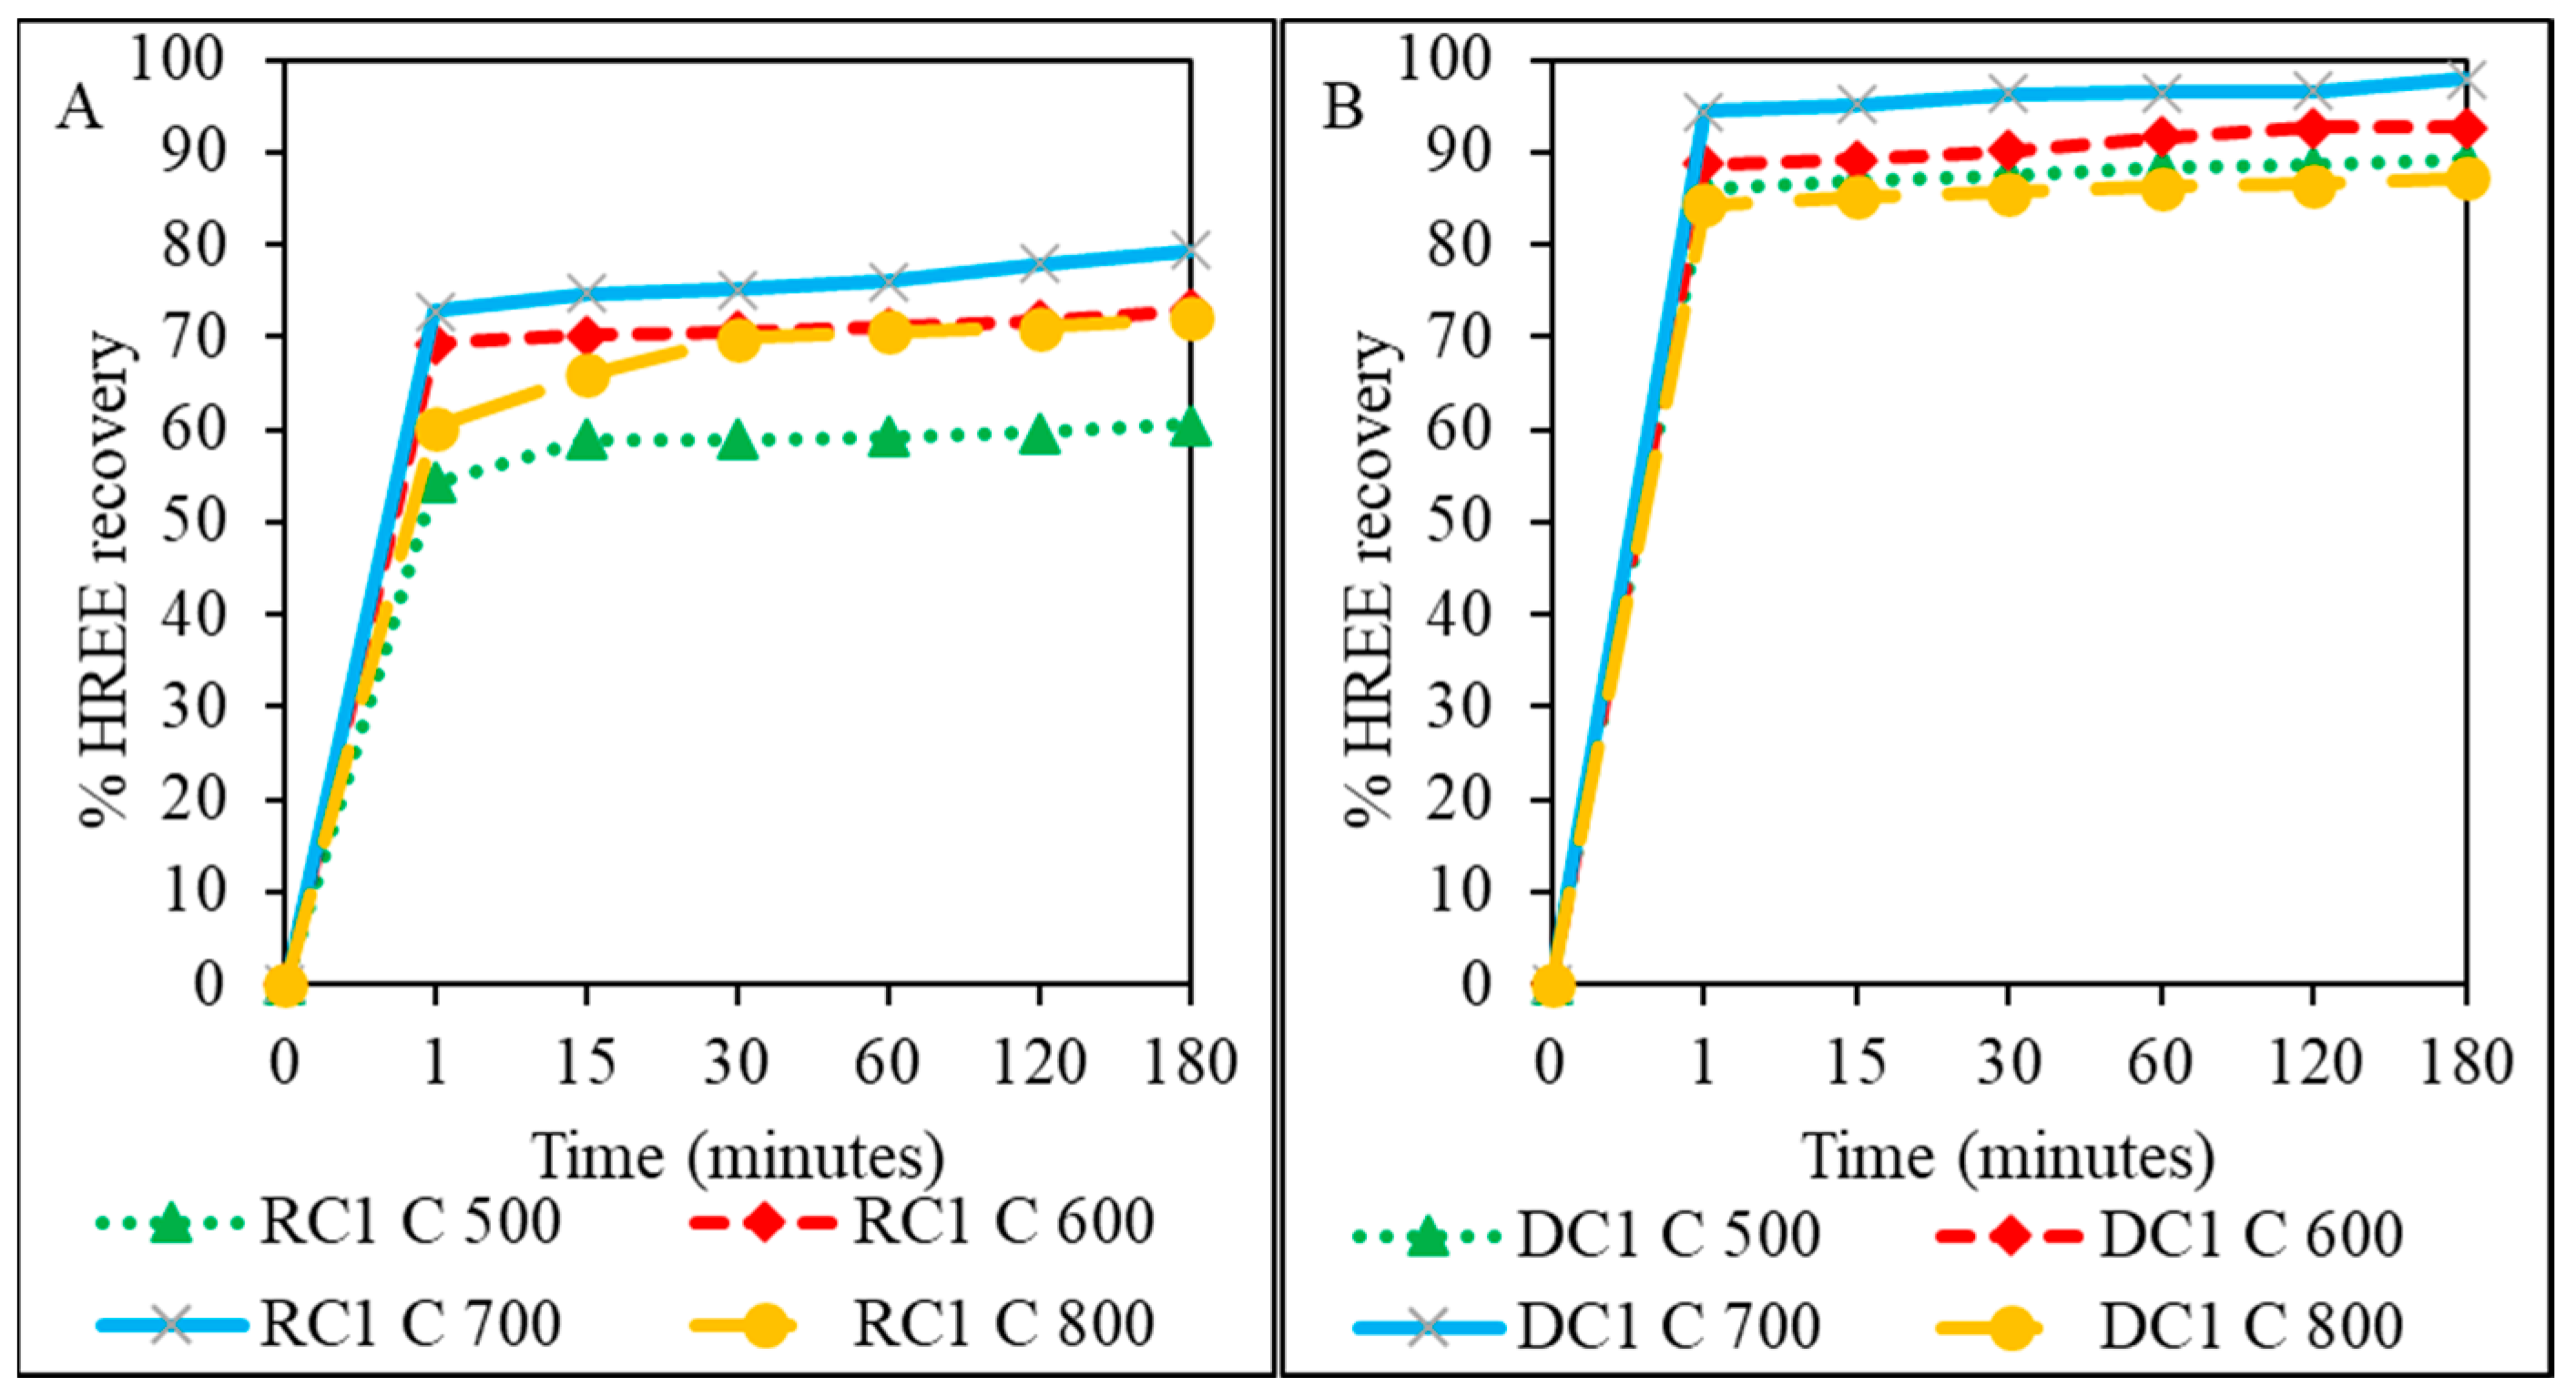
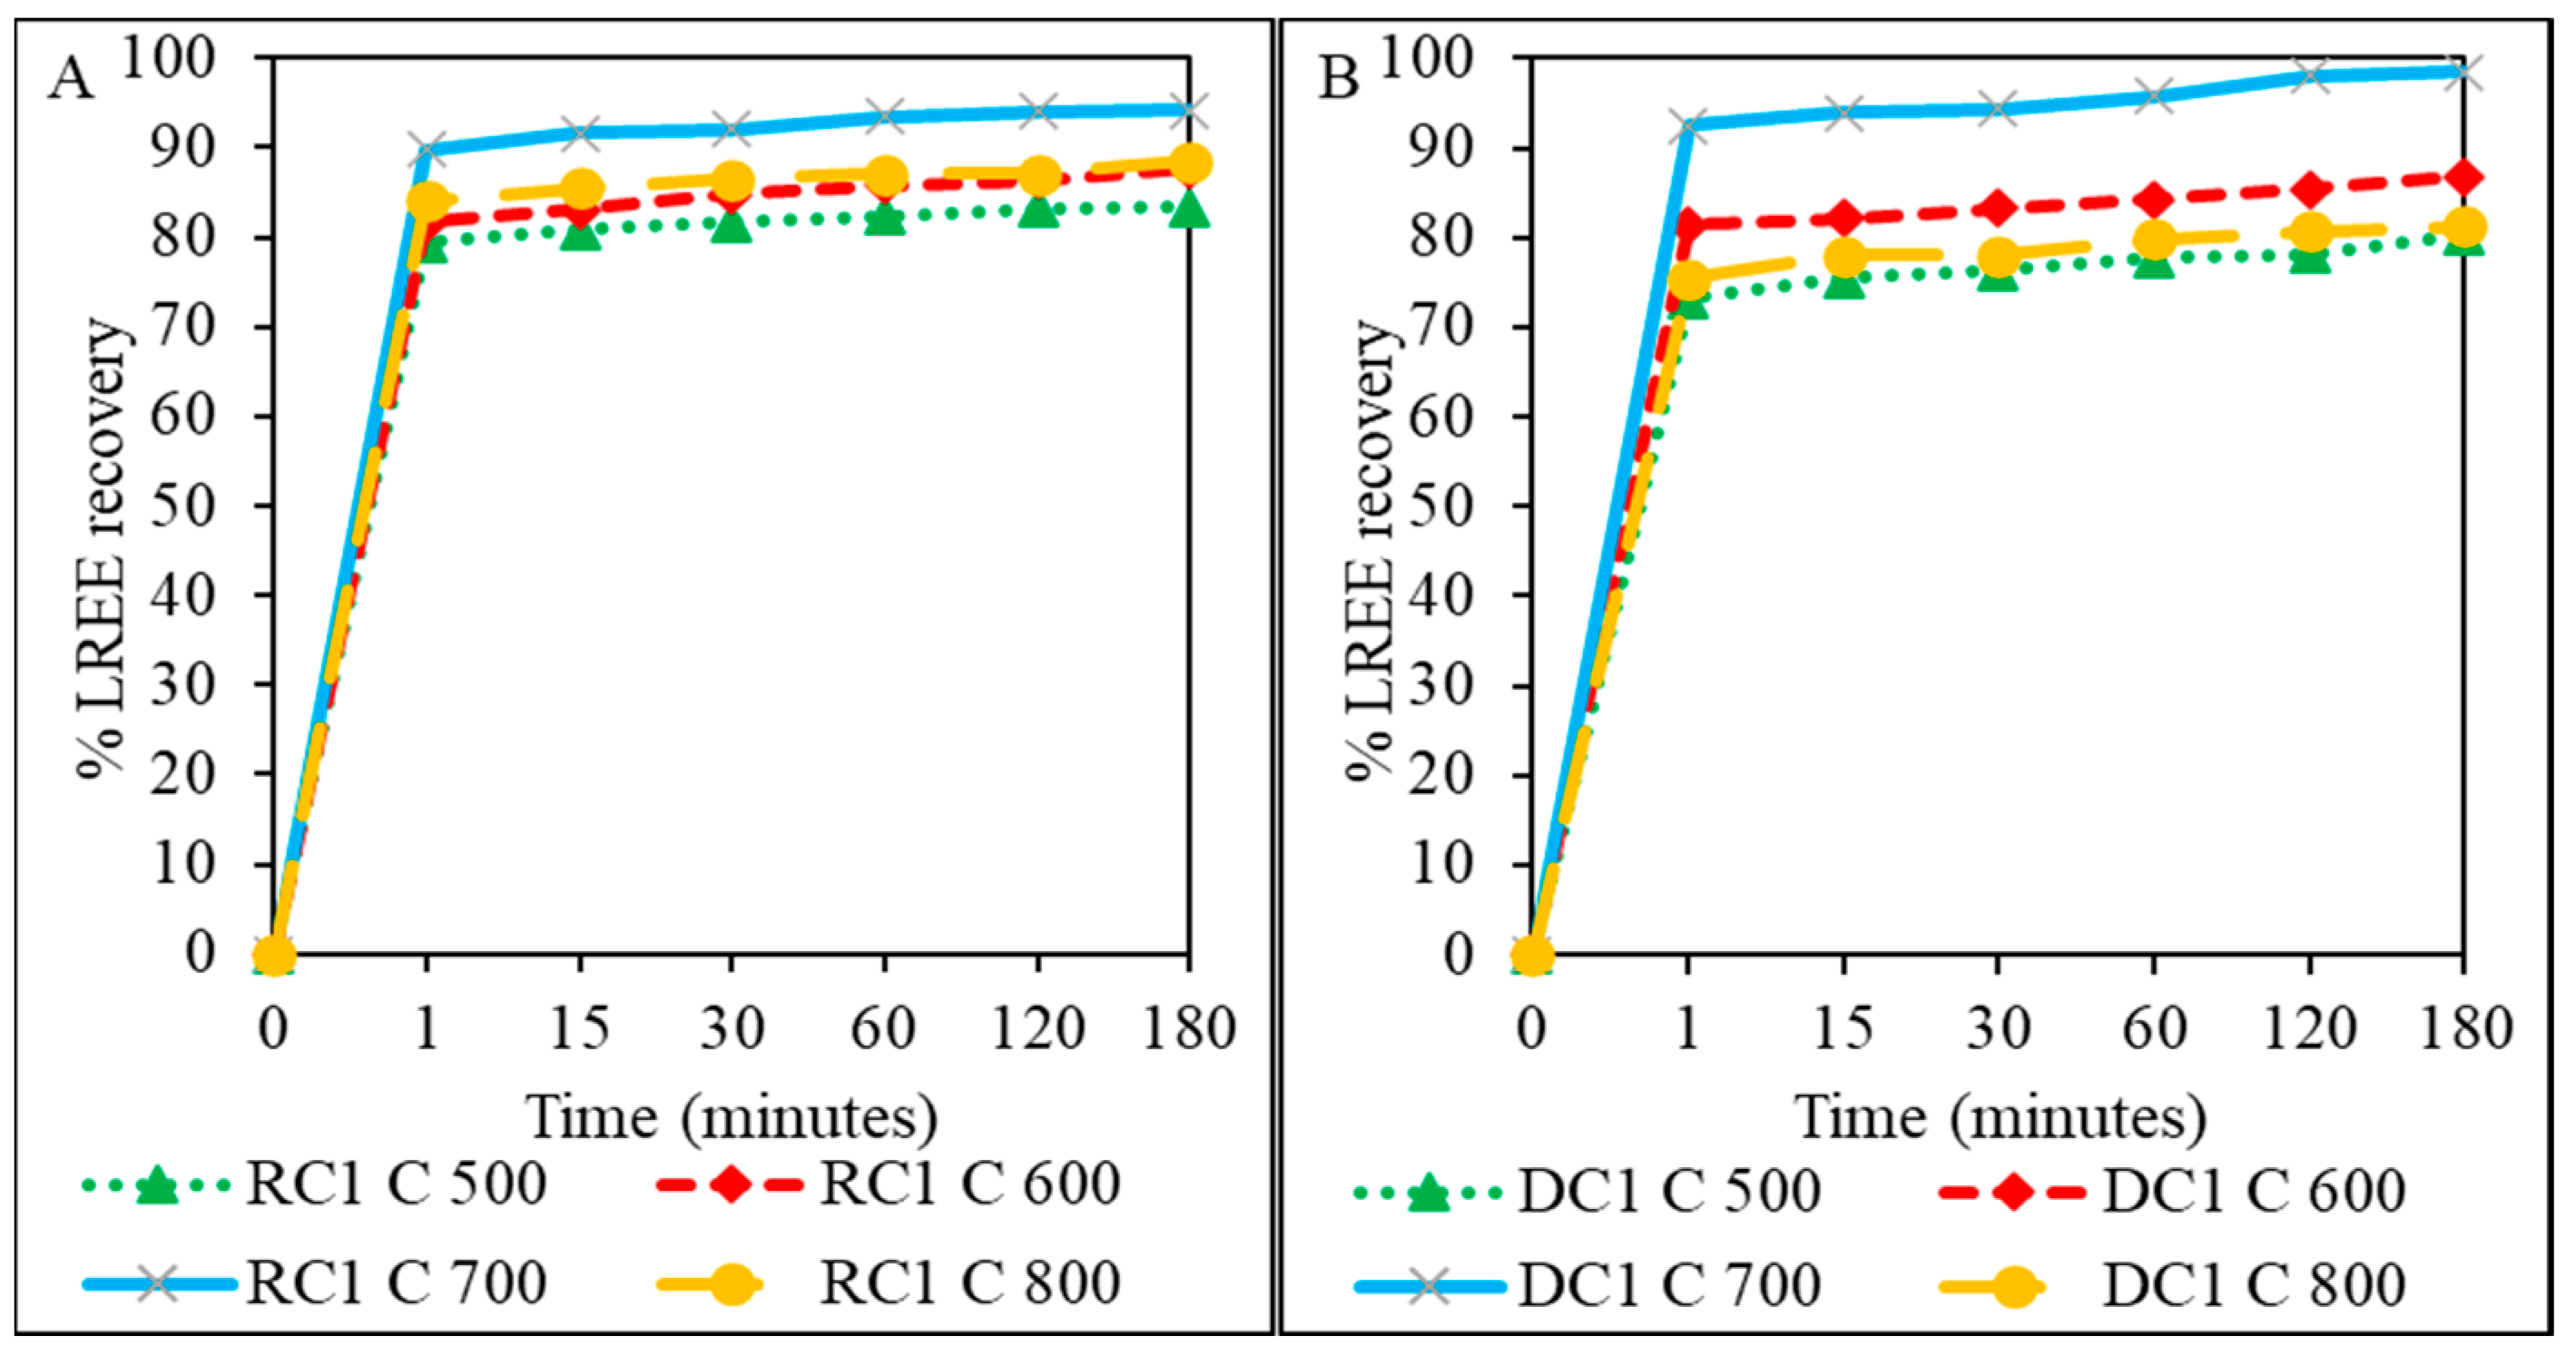
3.5. The Influence of Calcination Pre-Treatment on Subsequent % HREEs and % LREEs Leaching Recovery

The percentage of HREEs and LREEs leaching recovery of thermally treated RC1 and DC1 at 500 °C to 800 °C is presented (Figure 9 and Figure 10). In Figure 9A,B, the raw RC1 subjected to optimised leaching conditions resulted in HREE and LREE recovery of 21.03% and 14.04%, respectively. Subsequently, RC1 calcinated at 500 °C, 600 °C, 700 °C and 800 °C resulted in 60.55%, 72.91%, 79.35%, and 72.04% HREE leaching recovery, respectively (Figure 9A). In order of the same calcination temperatures, the LREE recovery for RC1 was 83.31%, 87.62%, 94.24%, and 88.56% (Figure 10A).
According to Figure 9A,B, raw DC1 subjected to the optimal leaching conditions resulted in 77.37% HREE recovery and 32.50% LREE recovery. Upon calcination at 500 °C, 600 °C, 700 °C and 800 °C the % HREE leaching recovery increased to 89.08%, 92.69%, 97.9%, and 87.31%, respectively (Figure 9B). The % LREE leaching recovery also increased to 80.25%, 86.82%, 98.49%, and 81.27% for the same calcination temperatures, respectively (Figure 10B). The best calcination temperature for improving the % HREE and % LREE leaching recovery was 700 °C (Figure 9 and Figure 10). At this temperature, the % HREE leaching recovery for RC1 and DC1 increased to 79.35% and 97.9%, respectively. The high recovery of HREEs observed in the two calcined samples at 700 ºC is due to the removal of carbon in the samples, leading to the formation of HREE oxides. The ease of the solubility of the oxides in the leachate improved the overall % HREE leaching recovery by 58% for RC1 and 20.53% for DC1.
As for the LREEs, the increase noted in the % LREE recovery of the two calcined samples at 700 °C can be attributed to the degradation of the kaolinite layer structure, resulting in the liberation of previously encapsulated LREE minerals [37]. The low LREE recovery from both non-calcined raw samples could be attributed to the LREEs being associated and distributed with non-soluble minerals [41]. These minerals include silicates, kaolinite, pyrite, magnetite, and zircon, which are present in raw RC1 and DC1 coals [27]. This suggests that the decomposition of the LREE-bearing minerals into oxides, which are more soluble during acid leaching, enhanced the % LREE recovery [58]. It can also be observed that at the calcination temperature of 800 °C, the % REE leaching recovery decreased by more than 7% for both coal samples. This is similar to the findings of [37,39,58]. According to [39], at a calcination temperature above 800 °C, the surface area and pore volume of kaolinite decreases, resulting in a decrease in leachate-REE interactions.

4. Conclusions

This article reports on an optimised leaching process for the recovery of REEs from ROM coal and discard coal. In addition, the study also provided an in-depth understanding of how the optimal leaching parameters and lixiviates affected REE recovery. Key findings revealed that the % REE leaching recovery improved as the HCl concentration increased to 2 M, leaching temperature to 50 °C, and solid: liquid ratio decreased to 10 g/L. Statistical analysis showed that the three leaching factors—concentration, temperature, and solid/liquid ratio are significant and were noted to regulate the % REE leaching recovery model. The REE leaching recovery under the optimal parameters for the raw RC1 and DC1 coal samples was 18.95% and 41.35%, respectively. The % HREE leaching recovery for both coal samples was found to be greater than the % LREE leaching recovery. This suggests the HREEs are weakly ion-adsorbed onto clay minerals and carbon matrices, while the LREEs form stronger bonds with non-acid-soluble minerals. The leaching efficiency of HClO4 for REE recovery was significantly lower than that of HCl and HNO3. HNO3 and HCl leaching showed a similar % REE recovery of approximately 41% for DC1. The concentration of REEs in RC1 and DC1 improved significantly as calcination temperatures increased from 500 °C to 800 °C. At 700 °C, the REE concentration is 347 ppm (RC1) and 363 ppm (DC1). At 800 °C, the REE concentration increased to 362 ppm (RC1) and 390 ppm (DC1).
In summary, the coal discard used in this study could be a potential source for the extraction of REEs. The extraction of these critical elements from this waste could avert the legacy of ruins left behind by the mining houses, while serving as a source of future economic benefits to the mining houses.

Author Contributions

H.H.: Conceptualisation, Methodology and Interpretation of analytical techniques, Data curation and analysis, Formal analysis, Writing—original draft, Writing—review & editing. O.E.-I.: Assist with data curation and Application of analytical techniques. A.J.: Application of design expert, Interpretation, Supervision, and Writing—review. S.O.B.: Conceptualisation, Methodology, Funding acquisition, Resources, Supervision, Writing—review & final editing. All authors have read and agreed to the published version of the manuscript.

Funding

This research and the APC was funded by the Department of Science and Innovation National Research Foundation (DSI-NRF) South African Research Chairs Initiative (SARChI) Clean Coal Technology Grant (Grant No: 86421).

Acknowledgments

The authors like to acknowledge Rosemary Falcon for the in-depth discussions on coal and would like to thank Phillip Pieterse (University of Johannesburg) for providing a critical understanding of the ICP-MS results and the behaviours of REEs.

Conflicts of Interest

The authors declare they have no known competing financial interests or personal relationships that could have appeared to influence the work reported in this paper.

References

  1. Long, K.R.; Van Gosen, B.S.; Foley, N.K.; Cordier, D. The Principal Rare Earth Elements Deposits of the United States—A Summary of Domestic Deposits and a Global Perspective. Available online: https://pubs.usgs.gov/sir/2010/5220/ (accessed on 10 May 2022).
  2. Van Gosen, B.S.; Verplanck, P.L.; Seal, R.R., II; Long, K.R.; Gambogi, J. Critical Mineral Resources of the United States-Economic and Environmental Geology and Prospects for Future Supply. Available online: https://pubs.usgs.gov/pp/1802/o/pp1802o.pdf (accessed on 17 May 2022).
  3. Seredin, V.V.; Dai, S. Coal deposits as potential alternative sources for lanthanides and yttrium. Int. J. Coal Geol. 2012, 94, 67–93. [Google Scholar] [CrossRef]
  4. Eterigho-Ikelegbe, O.; Harrar, H.; Bada, S. Rare earth elements from coal and coal discard—A review. Miner. Eng. 2021, 173, 107187. [Google Scholar] [CrossRef]
  5. Goonan, T.G. Rare Earth Elements-End Use and Recyclability Scientific Investigations. Available online: https://pubs.usgs.gov/sir/2011/5094/pdf/sir2011-5094.pdf (accessed on 17 May 2022).
  6. Humphries, M. Rare Earth Elements: The Global Supply Chain. Available online: https://sgp.fas.org/crs/natsec/R41347.pdf (accessed on 19 May 2022).
  7. Dushyantha, N.; Batapola, N.; Ilankoon, I.M.S.K.; Rohitha, S.; Premasiri, R.; Abeysinghe, B.; Ratnayake, N.; Dissanayake, K. The story of rare earth elements (REEs): Occurrences, global distribution, genesis, geology, mineralogy and global production. Ore Geol. Rev. 2020, 122, 103521. [Google Scholar] [CrossRef]
  8. Connelly, N.G. Nomenclature of Inorganic Chemistry—IUPAC Recommendations 2005. Chem. Int. 2005, 27, 25–26. [Google Scholar] [CrossRef]
  9. Zhang, W.; Rezaee, M.; Bhagavatula, A.; Li, Y.; Groppo, J.; Honaker, R. A review of the occurrence and promising recovery methods of rare earth elements from coal and coal by-products. Int. J. Coal Prep. Util. 2015, 35, 295–330. [Google Scholar] [CrossRef]
  10. Jordens, A.; Cheng, Y.P.; Waters, K.E. A review of the beneficiation of rare earth element bearing minerals. Miner. Eng. 2013, 41, 97–114. [Google Scholar] [CrossRef]
  11. Yang, X. Leaching Characteristics of Rare Earth Elements from Bituminous Coal-Based Sources. Ph.D. Dissertation, University of Kentucky, Lexington, KY, USA, 2019. [Google Scholar]
  12. Pandey, B.D. Rare metals extraction from non-ferrous resources in India: Present status and prospects of R&D. In Proceedings of the 15th International Conference on Non -Ferrous Metals, Hotel Oberol Grand, Kolkata, India, 8–9 July 2011. [Google Scholar]
  13. Kumari, A.; Panda, R.; Jha, M.K.; Kumar, J.R.; Lee, J.Y. Process development to Recover rare earth metals from monazite mineral: A review. Miner. Eng. 2015, 79, 102–115. [Google Scholar] [CrossRef]
  14. Shen, Y.; Moomy, R.; Eggert, R.G. China’s public policies toward rare earths, 1975–2018. Miner. Econ. 2020, 33, 127–151. [Google Scholar] [CrossRef] [Green Version]
  15. Honaker, R.; Groppo, J.; Bhagavatula, A.; Rezaee, M.; Zhang, W. Recovery of Rare Earth Minerals and Elements from Coal and Coal Byproducts. In Proceedings of the International Coal Preparation Conference, Louisville, KY, USA, 28 June–1 July 2016. [Google Scholar]
  16. Dushyantha, N.; Hemalal, P.V.A.; Jayawardena, C.L.; Ratnayake, A.S.; Ratnayake, N. Application of geochemical techniques for prospecting unconventional phosphate sources: A case study of the lake sediments in Eppawala area Sri Lanka. J. Geochem. Explor. 2019, 201, 113–124. [Google Scholar] [CrossRef]
  17. Honaker, R.; Groppo, J. Rare Earth Element Production from Coal. Available online: https://pem.engr.uky.edu/sites/pem/files/Honaker.pdf (accessed on 28 March 2022).
  18. Reid, I. Non-Energy Uses of Coal. Available online: https://www.sustainable-carbon.org/report/non-energy-uses-of-coal-report-ccc291/ (accessed on 15 March 2022).
  19. Zhang, W.; Honaker, R.Q. Rare earth elements recovery using staged precipitation from a leachate generated from coarse coal refuse. Int. J. Coal Geol. 2018, 195, 189–199. [Google Scholar] [CrossRef]
  20. Zhang, W.; Noble, A.; Yang, X.; Honaker, R. A comprehensive review of rare earth elements recovery from coal-related materials. Minerals 2020, 10, 451. [Google Scholar] [CrossRef]
  21. Seredin, V.V. Rare earth element-bearing coals from the Russian Far East deposits. Int. J. Coal Geol. 1996, 30, 101–129. [Google Scholar] [CrossRef]
  22. Zheng, L.; Liu, G.; Chou, C.-L.; Qi, C.; Zhang, Y. Geochemistry of rare earth elements in Permian coals from the Huaibei Coalfield. China. J. Asian Earth Sci. 2007, 31, 167–176. [Google Scholar] [CrossRef]
  23. Ketris, M.P.; Yudovich, Y.E. Estimations of Clarkes for Carbonaceous biolithes: World averages for trace element contents in black shales and coals. Int. J. Coal Geol. 2009, 78, 135–148. [Google Scholar] [CrossRef]
  24. Karayigit, A.I.; Gayer, R.A.; Querol, X.; Onacak, T. Contents of major and trace elements in feed coals from Turkish coal-fired power plants. Int. J. Coal Geol. 2000, 44, 169–184. [Google Scholar] [CrossRef]
  25. Faure, K. Mineralogy and Geochemistry of the Carbonaceous Mudstones, and Coal Petrogenesis of the Grootegeluk Formation in the Waterberg Coalfield, South Africa. Ph.D. Dissertation, University of Cape Town, Cape Town, South Africa, 1993. [Google Scholar]
  26. Wagner, N.J.; Matiane, A. Rare earth elements in select Main Karoo Basin (South Africa) coal and coal ash samples. Int. J. Coal Geol. 2018, 196, 82–92. [Google Scholar] [CrossRef]
  27. Harrar, H.; Eterigho-Ikelegbe, O.; Modiga, A.; Bada, S. Mineralogy and distribution of rare earth elements in the Waterberg coalfield high ash coals. Miner. Eng. 2022, 183, 107611. [Google Scholar] [CrossRef]
  28. Kolker, A.; Scott, C.; Hower, J.C.; Vazquez, J.A.; Lopano, C.L.; Dai, S. Distribution of rare earth elements in coal combustion fly ash, determined by SHRIMP-RG ion microprobe. Int. J. Coal Geol. 2017, 184, 1–10. [Google Scholar] [CrossRef]
  29. Huang, Q.; Noble, A.; Herbst, J.; Honaker, R. Liberation and release of rare earth minerals from Middle Kittanning, Fire Clay, and West Kentucky No. 13 coal sources. Powder Technol. 2018, 332, 42–252. [Google Scholar] [CrossRef] [Green Version]
  30. Luttrell, G.; Kiser, M.J.; Yoon, R.H.; Bhagavatula, A.; Rezaee, M.; Honaker, R.Q. Rare earth element concentrations in product streams of coal preparation plants in the eastern United States. In Proceedings of the Society for Mining, Metallurgy and Exploration Annual Meeting, Phoenix, AZ, USA, 21–24 February 2016. [Google Scholar]
  31. Mills, S.J. Coal Use in the New Economies of China, India and South Africa. Available online: https://usea.org/sites/default/files/012010_Coal%20use%20in%20the%20new%20economies%20of%20China%2C%20India%20and%20South%20Africa_ccc161.pdf (accessed on 12 March 2022).
  32. Wood, L. South Africa Coal Mining Report 2019 including Coal Testing and Laboratories, CISION PR Newswire. Available online: https://www.prnewswire.com/news-releases/south-africa-coal-mining-report-2019-including-coal-testing-and-laboratories-300945607.html (accessed on 25 November 2021).
  33. Kiser, M.J. New Methodologies for the Characterization and Separation of Rare Earth Elements Present in Coal. Ph.D. Dissertation, Virginia Polytechnic Institute and State University, Blacksburg, VA, USA, 2015. [Google Scholar]
  34. Gao, L.; Chen, Y. A study on the rare earth ore containing scandium by high gradient magnetic separation. J. Rare Earths 2010, 28, 622–626. [Google Scholar] [CrossRef]
  35. Alaoui, A.; El Kacemi, K.; El Ass, K.; Kitane, S. Application of Box-Behnken design to determine the optimal conditions of reductive leaching of MnO2 from manganese mine tailings. Russ. J. Non-Ferr. 2015, 56, 134–141. [Google Scholar] [CrossRef]
  36. Abdulsalam, J.; Mulopo, J.; Bada, S.; Oboirien, B.; Falcon, R. Experimental evaluation of activated carbon derived from South Africa discard coal for natural gas storage. Int. J. Coal Sci. Technol. 2019, 6, 459–477. [Google Scholar] [CrossRef] [Green Version]
  37. Zhang, W.; Honaker, R. Characterization and recovery of rare earth elements and other critical metals (Co, Cr, Li, Mn, Sr, and V) from the calcination products of a coal refuse sample. Fuel 2020, 267, 117236. [Google Scholar] [CrossRef]
  38. Dai, S.; Finkelman, R.B. Coal as a promising source of critical elements: Progress and future prospects. Int. J. Coal Geol. 2018, 186, 155–164. [Google Scholar] [CrossRef]
  39. Zhang, W.; Honaker, R. Calcination pretreatment effects on acid leaching characteristics of rare earth elements from middlings and coarse refuse material associated with a bituminous coal source. Fuel 2019, 249, 130–145. [Google Scholar] [CrossRef]
  40. Yang, X.; Werner, J.; Honaker, R.Q. Leaching of rare Earth elements from an Illinois basin coal source. J. Rare Earths 2019, 37, 312–321. [Google Scholar] [CrossRef]
  41. Laudal, D.A.; Benson, S.A.; Addleman, R.S.; Palo, D. Leaching behavior of rare earth elements in Fort Union lignite coals of North America. Int. J. Coal Geol. 2018, 191, 112–124. [Google Scholar] [CrossRef] [Green Version]
  42. Kim, R.; Cho, H.; Han, K.N.; Kim, K.; Mun, M. Optimization of acid leaching of rare-earth elements from mongolian apatite-based ore. Minerals 2016, 6, 63. [Google Scholar] [CrossRef] [Green Version]
  43. Chen, S.; Feng, Z.; Wang, M.; Zhao, L.; Yu, Z.; Xia, C.; Huang, X. Leaching kinetic study of sulfuric acid roasted mixed-type rare earth concentrate for reducing the solid-waste production and chemical consumption. J. Clean. Prod. 2020, 260, 120989. [Google Scholar] [CrossRef]
  44. Yang, X.; Honaker, R. Leaching kinetics of rare earth elements from fire clay seam coal. Minerals 2020, 10, 491. [Google Scholar] [CrossRef]
  45. Colina, F.G.; Esplugas, S.; Costa, J. High temperature reaction of kaolin with inorganic acids. Br. Ceram. Trans. 2001, 100, 203–206. [Google Scholar] [CrossRef]
  46. Teimouri, S. Feasibility Study on the Use of Imidazolium-Based Ionic Liquids in the Extraction of Gold. Master’s Thesis, University of the Witwatersrand, Johannesburg, South Africa, 2020. [Google Scholar]
  47. Amine, M.; Asafar, F.; Bilali, L.; Nadifiyine, M. Hydrochloric Acid Leaching Study of Rare Earth Elements from Moroccan Phosphate. J. Chem. 2019, 2019, 1–6. [Google Scholar] [CrossRef] [Green Version]
  48. Whitcomb, P. Exciting New Features in Design-Expert-V11 and Beyond. Presented by Pat Whitcomb Founder and Principle. In Proceedings of the Stat-Ease European User Conference, Munich, Germany, 4–6 June 2018. [Google Scholar]
  49. Ji, B.; Zhang, W. Rare earth elements (REEs) recovery and porous silica preparation from kaolinite. Powder Technol. 2021, 391, 522–531. [Google Scholar] [CrossRef]
  50. Mashaba, P.M.; Abdulsalam, J.; Bada, S.O. Application of the response surface methodology to optimize the characteristics of weathered discard coals using the W/O HIP emulsion technique. Int. J. Coal Prep. Util. 2022, 1–16. [Google Scholar] [CrossRef]
  51. Bandara, A.M.T.S.; Senanayake, G. Leachability of rare-earth, calcium and minor metal ions from natural Fluorapatite in perchloric, hydrochloric, nitric and phosphoric acid solutions: Effect of proton activity and anion participation. Hydrometallurgy 2015, 153, 179–189. [Google Scholar] [CrossRef]
  52. Li, M.; Zhang, X.W.; Liu, Z.G.; Wang, M.T.; Liu, J.; Yang, J.P. Mixed rare earth Mixed rare earth concentrates leaching with HCl-AlCl3 solution. Rare Met. 2013, 32, 312–317. [Google Scholar] [CrossRef] [Green Version]
  53. Cao, S.; Zhou, C.; Pan, J.; Liu, C.; Tang, M.; Ji, W.; Hu, T.; Zhang, N. Study on influence factors of leaching of rare earth elements from coal fly ash. Energy Fuels 2018, 32, 8000–8005. [Google Scholar] [CrossRef]
  54. Ernest, Z. What Percent Error is Too High?|Socratic. Available online: https://socratic.org/questions/what-percent-error-is-too-high (accessed on 5 December 2021).
  55. Laudal, D.A. Evaluation of Rare Earth Element Extraction from North Dakota Coal-Related Feed Stocks. Ph.D. Dissertation, University of North Dakota, Grand Forks, ND, USA, 2017. [Google Scholar]
  56. Bandara, A.M.T.S.; Senanayake, G. Dissolution of calcium, phosphate, fluoride and rare earth elements (REEs) from a disc of natural fluorapatite mineral (FAP) in perchloric, hydrochloric, nitric, sulphuric and phosphoric acid solutions: A kinetic model and comparative batch leaching of major and minor elements from FAP and RE-FAP concentrate. Hydrometallurgy 2019, 184, 218–236. [Google Scholar]
  57. Honaker, R.Q.; Zhang, W.; Werner, J. Acid Leaching of Rare Earth Elements from Coal and Coal Ash: Implications for Using Fluidized Bed Combustion to Assist in the Recovery of Critical Materials. Energy Fuels 2019, 33, 5971–5980. [Google Scholar] [CrossRef]
  58. Zhang, W.; Honaker, R. Enhanced leachability of rare earth elements from calcined products of bituminous coals. Miner. Eng. 2019, 142, 105935. [Google Scholar] [CrossRef]
Figure 1. The % REE recovery of RC1 (AC) and DC1 (DF) after leaching according to the DOE test matrix.
Minerals 12 00938 g001
Figure 2. 3D surface plots of the relationship between temperature, HCl concentration, and their impact on the % REE leaching recovery for RC1 (A) and DC1 (B).
Minerals 12 00938 g002
Figure 3. 3D surface plots of the relationship between leaching temperature, pulp density (solid:liquid ratio), and their impact on the % REE leaching recovery for RC1 (A) and DC1 (B) coals.
Minerals 12 00938 g003
Figure 4. 3D surface plots of the relationship between leachate concentration, pulp density (solid: liquid ratio), and their impact on the % REE leaching recovery for RC1 (A) and DC1 (B).
Minerals 12 00938 g004
Figure 5. RC1 and DC1 % REE leaching recovery under the optimised leaching parameters (HCl concentration of 2 M, solid:liquid ratio of 10 g/L, leaching temperature of 50 °C, D90 = −106 µm, stirrer speed 550 rpm).
Minerals 12 00938 g005
Figure 6. RC1 and DC1 % HREEs (A) and % LREEs (B) leaching recovery under the optimised leaching parameters (HCl concentration of 2 M, solid:liquid ratio of 10 g/L, leaching temperature of 50 °C, D90 = −106 µm, stirrer speed 550 rpm).
Minerals 12 00938 g006
Figure 7. RC1 and DC1 % REE leaching recovery under the optimised leaching parameters (HClO4/HNO3 concentration of 2 M, solid: liquid of 10 g/L, leaching temperature of 50 °C, D90 = −106 µm, stirrer speed 550 rpm).
Minerals 12 00938 g007
Figure 8. RC1 and DC1 % HREEs (A) and % LREEs (B) leaching recovery under the optimised leaching parameters (HClO4/HNO3 concentration of 2 M, solid:liquid ratio of 10 g/L, leaching temperature of 50 °C, D90 = −106 µm, stirrer speed 550 rpm).
Minerals 12 00938 g008
Figure 9. Calcined RC1 (A) and DC1 (B) % HREE leaching recovery under the optimised leaching parameters of (HCl concentration of 2 M, solid:liquid ratio of 10 g/L, leaching temperature of 50 °C, D90 = −106 µm, stirrer speed 550 rpm).
Minerals 12 00938 g009
Figure 10. Calcined RC1 (A) and DC1 (B) % LREE leaching recovery under the optimised leaching parameters of (HCl concentration of 2 M, solid:liquid ratio of 10 g/L, leaching temperature of 50 °C, D90 = −106 µm, stirrer speed 550 rpm).
Minerals 12 00938 g010
Table 1. Experimental design matrix (from DOE) for the leaching of RC1 and DC1.
RunFactor 1 A: HCl Concentration (M)Factor 2 B: Solid/Liquid (g/L)Factor 3 C: Temperature (°C)
10.52530
21.254050
31.254030
41.251030
51.252540
60.51040
71.252540
824040
91.251050
100.54040
1122530
1221040
130.52550
1422550
151.252540
Table 2. ICP-MS results for individual REE contents and the TREEs, outlook coefficient (Coutlook), and REE ratios for the calcined coal samples.
REE Native Elements (Concentration in ppm)RC1
500 °C
DC1
500 °C
RC1
600 °C
DC1
600 °C
RC1
700 °C
DC1
700 °C
RC1
800 °C
DC1
800 °C
La 55.9360.8859.7066.5564.6669.8567.4775.14
Ce 117.28130.10125.20142.21135.59149.27141.49160.56
Pr 12.4113.5713.2514.8314.3515.5614.9716.74
Nd47.8550.5451.0955.2455.3357.9857.7362.37
Sm 8.699.239.2810.0910.0510.5910.4911.39
Eu 1.581.431.691.561.831.641.911.76
Gd 7.046.577.527.198.147.548.508.11
Tb 0.970.891.030.971.121.021.171.09
Dy 5.074.785.415.235.865.496.125.90
Ho 0.890.850.950.931.030.971.071.05
Er 2.302.212.462.422.662.542.782.73
Tm 0.260.290.280.320.300.340.320.36
Yb 1.651.931.762.111.902.221.992.38
Lu 0.260.200.280.220.300.230.320.25
Sc 14.7513.2415.7514.4817.0615.1917.8016.34
Y 23.2919.9024.8721.7526.9322.8328.1024.56
∑TREEs300.29316.59320.58346.04347.19363.22362.29390.70
∑HREEs56.5350.9160.3455.6565.3558.4168.2062.83
∑LREEs243.76265.77260.24290.50281.83304.92294.09327.99
∑CREEs156.12153.87169.01168.18180.50176.53188.35189.89
∑UCREEs78.5790.1789.7798.5597.22103.45101.44111.28
Coutlook1.981.701.881.701.851.701.851.70
LREEs:HREEs4.315.214.315.214.315.214.315.21
% CREEs35.9632.5038.3935.5341.5837.2943.3840.11
% UCREEs37.2936.7339.8140.1543.1242.1544.9945.34
Table 3. Experimental vs. predicted % REE leaching recovery from RC1.
RunFactor 1 A: HCl Concentration (M)Factor 2 B: S:L (g/L)Factor 3 C: Temperature (°C) Experimental REE
Recovery %
Predicted REE
Recovery %
10.525306.926.71
21.25405010.113.78
31.2540306.916.87
41.2510308.5910.12
51.2525407.1811.95
60.5104011.8411.79
71.25254018.3411.95
82404011.5612.11
91.25105016.4617.03
100.540409.768.54
11225309.9910.28
122104014.4415.36
130.5255013.3313.62
142255020.1617.19
151.25254013.6611.95
S:L: solid:liquid ratio.
Table 4. Experimental vs. predicated % REE leaching recovery from DC1.
RunFactor 1 A: HCl Concentration (M)Factor 2 B: S/L (g/L)Factor 3 C: Temperature (°C) Experimental REE Recovery %Predicted REE
Recovery %
10.5253024.5525.99
21.25405032.1030.44
31.25403026.4323.93
41.25103034.3232.49
51.25254030.3231.47
60.5104035.2433.52
71.25254034.3331.47
82404028.3929.41
91.25105038.3239.00
100.5404024.3124.96
112253028.1430.44
122104037.2337.97
130.5255030.3932.50
142255038.5936.95
151.25254032.0431.47
S:L: solid:liquid ratio.
Table 5. ANOVA table of the % REE recovery for RC1 with respect to the various leaching factors.
SourceSum of SquaresMean SquareF-ValueRemarkSourceSum of Squares
Model (% REE recovery)142.1847.395.52SignificantModel (% REE recovery)142.18
A-Concentration25.5625.562.98SignificantA-Concentration25.56
B-Solid:liquid ratio21.1321.132.46SignificantB-Solid:liquid ratio21.13
C-Temperature95.595.511.13SignificantC-Temperature95.5
Residual94.398.58 Residual94.39
Lack of Fit31.583.510.11Not SignificantLack of Fit31.58
Pure Error62.8131.41 Pure Error62.81
Cor Total236.57 Cor Total236.57
R20.891 R20.891
Adjusted R20.8822 Adjusted R20.8822
Predicted R20.8749 Predicted R20.8749
Adequate Precision6.9313 Adequate Precision6.9313
Table 6. ANOVA table of the % REE recovery for DC1 with respect to the various leaching factors.
SourceSum of SquaresdfMean SquareF-Valuep-ValueRemark
Model (% REE recovery)270.95390.3222.810.0001Significant
A-Concentration39.60139.6010.000.0090Significant
B-Solid:liquid ratio146.571146.5737.020.0001Significant
C-Temperature84.77184.7721.410.0007Significant
Residual43.56113.96
Lack of Fit35.4593.940.970.6043Not significant
Pure Error8.1124.05
Cor Total314.5014
R20.9133
Adjusted R20.8937
Predicted R20.8744
Adequate Precision14.6668
Table 7. Leaching parameter settings for the optimised response of RC1 and DC1.
Parameter ConstraintsGoalLower LimitUpper Limit
A: Concentration (M)is in range0.52
B: Solid:liquid ratio (g/L)is in range1040
C: Temperature (°C)is in range3050
% REE leaching recovery after 3 hmaximise6.9120.16
Table 8. Leaching conditions of the optimised solution for RC1 and DC1.
SolutionA: HCl Concentration (M)B: Solid:Liquid Ratio (g/L)C: Temperature (°C)% REE Leaching Recovery (3 h)DesirabilityRemark
(RC1) 12.0010.0050.0018.810.90
(RC1) 22.0010.0050.0018.810.90
(RC1) 32.0010.1250.0018.800.89
(DC1) 12.0010.0050.0041.011.00
(DC1) 21.9810.1649.7341.031.00
(DC1) 31.9910.1049.9741.141.00
Table 9. Point prediction table for the optimised selected solutions.
Solution 1 ResponsePredicted MeanPredicted MedianStd Dev95% Cl Low
for Mean
95% Cl High for Mean
RC1 % REE leaching
recovery after 3 hrs
18.8218.822.9314.5323.10
DC1 % REE leaching
recovery after 3 hrs
41.0441.041.9938.1643.91
Std Dev: Standard Deviation; Cl: Confidence level.
Publisher’s Note: MDPI stays neutral with regard to jurisdictional claims in published maps and institutional affiliations.

