Article

Modeling the Effect of Mineral Particles of Mixture of Sandy Soil on Its Physical–Mechanical Properties Based on the Triangular Nomogram

1
Institute of Cold Regions Science and Engineering, School of Civil Engineering, Northeast China Observatory and Research Station of Permafrost Geo-Environment of the Ministry of Education, Northeast Forestry University, Harbin 150040, China
2
Department of Engineering and Ecological Geology, Geological Faculty, Lomonosov Moscow State University, 119234 Moscow, Russia
3
Melnikov Permafrost Institute, Siberian Branch, Russian Academy of Science, 677010 Yakutsk, Russia
4
China Railway Qinghai-Tibet Group Co., Ltd., Xining 810007, China
*
Author to whom correspondence should be addressed.
These authors contributed equally to this work and should be considered co-first authors.
Minerals 2022, 12(2), 135; https://doi.org/10.3390/min12020135
Submission received: 21 December 2021 / Revised: 17 January 2022 / Accepted: 20 January 2022 / Published: 24 January 2022

Abstract

:
Soil is regarded as a multi-component, multi-phase (solid, liquid and gaseous) dynamic system. The solid component, especially soil mineral particles, has a significant influence on the properties of soil, including its physical, physical–chemical and physical–mechanical properties. By studying the literature, we know that the majority of studies have explained the influence of mineral particles on the physical and physical–mechanical properties of soil bino–mixtures (sand–silt, sand–clay, coarse sand, etc.) through two-dimensional figures. Obviously, for multi-component soil, these two-dimensional figures are not sufficient and should be improved in order to show the influence of soil particles more comprehensively. Therefore, in this paper, we applied a new model—the triangular nomogram—to describe and analyze the change in the inter-friction angle of soil mixtures under different particle size distributions. Through the obtained result, we found that the triangular nomogram is an effective model that can be used to analyze and simulate the properties of soil mixtures.

1. Introduction

Soil is a multi-component, multi-phase (solid, liquid and gaseous) dynamic system [1]. Soil’s solid component can be regarded as its skeleton, and it occupies a pivotal position in the study of soil science. From a microscopic point of view, the solid component is usually composed of many different mineral particles of varying sizes. According to existing research, the composition [2,3,4], size [5,6,7,8] and morphology [9,10,11,12,13] of mineral particles significantly influence the physical–chemical, physical and physical–mechanical properties of soil. Therefore, the influence of mineral particles on soil properties is undoubtedly a significant scientific research topic. Additionally, one of the most important research directions is to explore the relationship between soil particle size distribution and its properties, especially physical [14,15,16,17,18,19] and physical–mechanical properties [20,21,22,23,24,25,26,27], something that has drawn widespread attention from many Chinese and international scholars.
In the 1930s, Soviet scholars V.V. Okhotin and N.N. Ivanov [28] preliminarily analyzed and studied the effects of the particle size and content of the filler in the soil on its maximum dry density and strength through a number of experiments. Later, based on their results, scholars such as Birulya [29], Ivanov and Goncharova [30] put forward and developed the concept of optimal graded soil and developed different methods that can help determine the ratio of each particle component in optimal graded soil [31,32].
At the beginning of the twenty-first century, with the rapid development of industry, an immense amount of industrial waste and garbage was produced. With this background, many scholars [33,34,35,36,37] advocated adding industrial and construction waste, such as coal, cinder, sludge, ash and tire rubber, to the soil. This way, soil properties could be improved to satisfy the requirements of engineering construction, and, at the same time, the environment could be protected to a certain extent.
In recent years, with the development of aerospace technology, human exploration of outer space and planets has reached a new level. Therefore, research on the properties of soil on lunar and Martian surfaces, which provided reference for the subsequent landing of space probes, holds great significance. With this background, various scholars [38,39,40,41,42,43,44], including those from America, China and Russia, based on their analysis of both lunar soil and mineral rocks on the earth, have simulated and prepared similar soil with the same gradation and mineral composition as lunar soil and, at the same time, measured its physical and physical–mechanical properties.
In summary, analyses of the particle size distribution of the soil and its impact on soil properties not only represent important scientific research projects but also play an important role in engineering practice.
In the early stages of the research, the particle composition of soil samples is studied and analyzed in order to procure the base and foundation needed for subsequent research on soil properties. Usually, we use the triangle chart, particle size curve and grading parameters [45,46,47,48] to describe the particle distribution of the soil as much as possible and then find and establish the relationship between the properties and particle component of the soil.
By studying the literature, we know that the majority of studies have attempted to explain the influence of mineral particles on the physical and physical–mechanical properties of soil bino-mixtures (sand–silt, sand–clay, coarse sand, etc.) through two-dimensional figures. Usually, traditional two-dimensional figures can present the influence of only one type of soil particle or one component of the soil. Obviously, with multi-component soil, traditional two-dimensional figures face some limitations and have to be improved in order to show the influence of the soil particles more comprehensively.
Thus, it is clear that comprehensively showing the change regulates of soil properties under different soil particle size distributions through figures is still insufficient, and it is an important problem that we need to solve. In other words, we need a new model that can effectively and comprehensively explain the internal relationship between soil properties and the particle size distribution and identify the change regulates of soil properties under different soil particle size distributions at the same time.
By studying the literature, we know that nomograms are graphs that can solve the evaluation problem of complex functions through graphical calculation. The general form of a nomogram represents the variables of an equation containing three or more variables with a ruler and then connects all known variables through isolines so that unknown variables can be identified. Based on this, this paper was mainly committed to exploring a new model to present the internal relationship between soil particle size distribution and its properties by improving the traditional triangular chart and applying it to analyzing the change regulates of the properties of soil multi-mixtures under different particle size distributions.

2. Material

2.1. Original Material

In the research process, high-purity artificial dolomite particles with particle sizes of 4–2 mm, 2–1 mm, 1–0.5 mm, 0.5–0.25 mm, 0.25–0.1 mm and 0.06–0.03 mm were selected as the original particle components of graded sand and prepared for the experiment. In the experiment, the original particle components were mixed according to their different mass ratios. Thus, we could obtain particle mixtures with different particle size distributions and take them as experimental samples.

2.2. Preparation of the Soil Samples

As mentioned above, soil particle components with a size of 4–2 mm were regarded as skeleton particles. According to the principle, the diameter ratios of adjacent components in our research were determined as D = 1/2, 1/4 and 1/8, and the other two different particle components were selected as fillers. Thus, according to the different mass ratios, there were 3 types of soil particle mixtures, and each type contained 16 different soil particle mixtures (Table 1).

3. Research Method

3.1. Experimental Method

In order to exclude the influence of liquid on the experimental results, all the test samples were maintained in a drying state. First of all, we measured the maximum dry density of each sample three times in accordance with the method recorded in the teaching material of MSU “Laboratory work on soil science” [49] and took the arithmetic average of the three experimental results as the final experimental value. Then, we subjected these test samples to the direct shear test with a DSJ-3 instrument (State key laboratory of frozen soil engineering, Lan Zhou, China, Figure 1) under the obtained maximum dry density of the sample and obtained the maximum internal friction angle for each sample under its maximum dry density.

3.2. Analysis Method

In our study, the physical–mechanical properties of the samples were affected by the content of different particle components. In other words, there were two or more variables in the function that described the physical–mechanical properties of the samples. In this case, the traditional two-dimensional chart could not satisfy the research requirement. Therefore, we used the triangular nomogram to analyze the influence of the particle size distribution on soil properties. In the triangular nomogram, the three sidelines mean the mass content of three different particle components in the sample, which are arranged counterclockwise (Figure 2a).
Based on this, we can consider assigning specific values that reflect soil properties to points in the nomogram, such as porosity, compression modulus and internal friction angle. In this way, the points in the triangular nomogram can be regarded as soils with specific particle size distributions and properties. Thus, connecting the points with the same value by isolines, the triangular nomogram reflects the change regulates of soil properties under different particle size distributions. For example, Figure 2b shows the change in the maximum dry density of soil mixtures under different particle size distributions (Figure 2b).
The isolines can be plotted by hand or a program such as Origin. However, in order to exclude the impact of human factors, we preferred to use a program to plot the isolines. With the help of the function “Ternary Graphs” in Origin, we plotted the isolines automatically in accordance with the inputted data.

4. Result and Discussions

4.1. Result

As mentioned above, the influence of mineral particles on the physical–mechanical properties of soil bino-mixtures has been studied sufficiently. Our results once more verify the results obtained by researchers previously, showing that when there is only one filler in the soil mixture, the physical–mechanical properties of the obtained soil mixture are significantly affected by the mass content of the filler and diameter ratio of the soil particles in the mixture during the process, when different fillers are gradually added to the skeleton particles (Figure 3a).
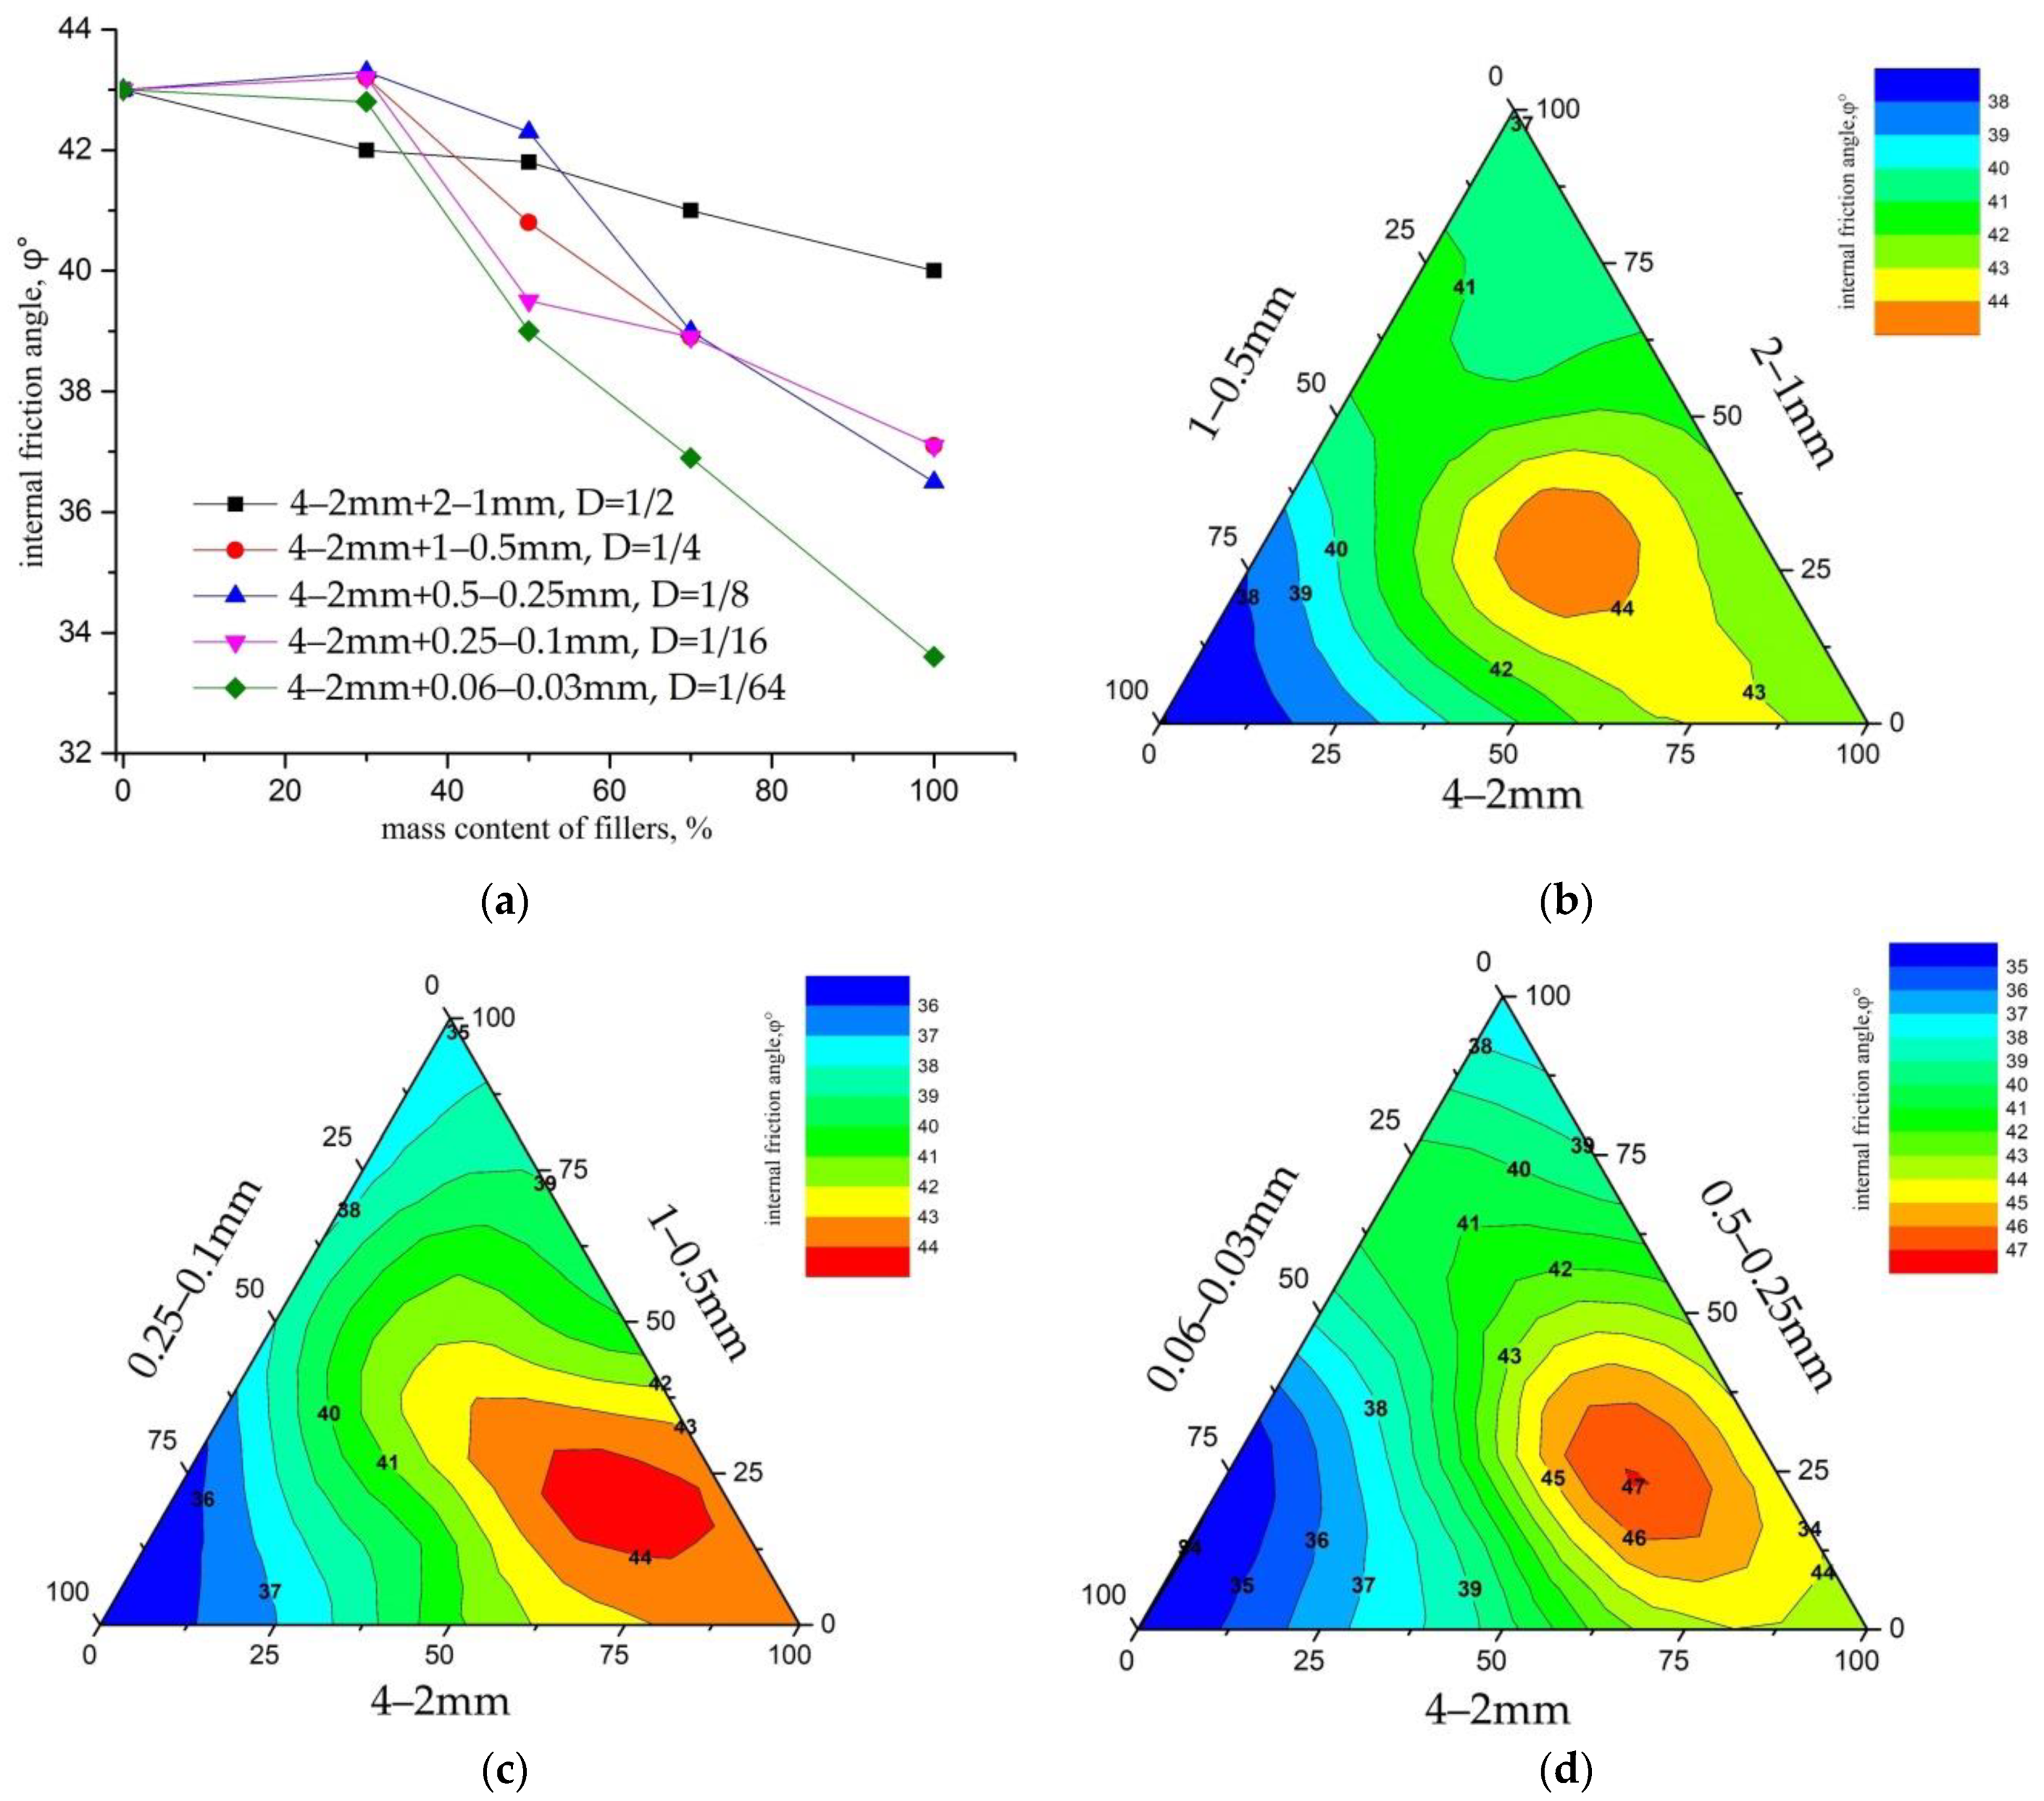
  • When the mass content of the filler was equal to or less than 30%, the values of the maximum internal friction angle of the soil mixture changed little; however, when the mass content of the filler exceeded 30%, the maximum internal friction angle of the soil mixture gradually decreased with the increase in the mass content.
  • As the mass content of the filler changed, the void ratio of soil mixtures changed at the same time. Especially when the mass content of the filler exceeded 30%, the void ratio of soil mixtures gradually decreased with the increase in the mass content, as confirmed previously [50,51,52,53]. In this way, the strength of soil bino-mixtures decreased at the same time.
  • The physical–mechanical properties of the soil mixture were significantly affected by the particle diameter ratio. The smaller the particle diameter ratio, the more sensitive the properties of the soil mixture were to the filler, and the greater the slope of the curve.
When the soil mixtures contained two types of fillers, through the obtained triangular nomogram (Figure 3b–d), we found that the isolines had developed ellipse-like closed curves: the value of the isolines increased gradually from outside to inside, and the extreme value area was located in the center of the triangle to the right.
Besides that, in the obtained triangular nomogram, we also found a region in which was located the extreme value of the internal friction angle of the soil mixture. When the mass content of the skeleton particles was about 70%, the internal friction angle of the soil mixture had a maximum value that was affected by the particle diameter ratio (D). When the value of the particle diameter ratio (D) decreased from 1/2 to 1/8, the maximum internal friction angle increased from 44 to 47. When the mass content of skeleton particles was less than 70%, the strength of the soil mixture reduced with the decrease in the mass content of the skeleton particles.

4.2. Discussions

Through our experiments, we found that the shear strength of a soil mixture is mainly determined by its skeleton particles. When the mass content of the skeleton particles is more than 70%, the structure of the soil mixture is mainly composed of skeleton particles, and the pores among the skeleton particles are partly filled with fillers (Figure 4a). In this case, the shear strength of the soil mixture mainly depends on the mechanical friction and occlusal force between the skeleton particles, meaning its strength is close to the shear strength of the skeleton particles.
When the mass content of the skeleton particles is close to 70%, although the structure of the soil mixture is still mainly composed of skeleton particles, the pores among the particles are fully filled with fillers (Figure 4b). In this case, the movement of skeleton particles in the shearing process has to overcome not only the mechanical friction and occlusal force between the skeleton particles, but also the above-mentioned forces between the skeleton particles and fillers and the forces between the particles of the fillers themselves. The additional resistance leads to improvement in the shear strength of the soil mixture to a certain extent.
When observing particle movement through high-density samples, we must pay attention to the influence of the particle morphology. Images (Figure 5) obtained through SEM showed that the shape of soil particles with a diameter of 4–2 mm was more rounded compared to other original particles (especially those with a diameter of 0.06–0.03 mm), which had a sharper surface. Besides that, the shape of soil particles with a diameter less than 1 mm had obvious artificial fractures and mineral cleavages.
At the same time, we applied the shape parameter of soil particles RW (particle roundness) to quantitatively describe the influence of the particle morphology. RW (particle roundness) means the ratio of the average curvature radius of each inflection point in the plan projection of the soil particle (   r i / n ) to the maximum inscribed circle radius inside the plan projection of the soil particle (R) (Figure 6), which reflects the sharpness of each corner [54]. Its mathematical formula is as follows:
R W =   r i / n R
where RW—the particle roundness; ri—the radius of the inscribed circle at the inflection point where the curvature radius of the particle contour is less than or equal to the maximum inscribed circle radius R; n—the number of inflection points; R—the maximum inscribed circle radius of particles.
Obviously, the value of particle roundness (RW) changes from 0 to 1, and the closer to 1, the closer the shape of the soil particle to a circle.
In Figure 7, we can see that the values of roundness for soil particles with diameters of 4–2 mm, 2–1 mm and 0.06–0.03 mm changed in a relatively small range, and the average values of particle roundness were essentially in agreement with its median. At the same time, the values of roundness for soil particles with diameters of 1–0.5 mm, 0.5–0.25 mm and 0.25–0.1 mm were distributed unevenly and changed in a relatively large range. The average values of particle roundness were less than the median. In general, we found that the average value of particle roundness gradually decreased with a decrease in particle size.
Therefore, when the pores among skeleton particles were fully filled with fillers, the irregularity of the particle shape played a role in hindering the mutual movement of soil particles. Because the movement of soil particles needed to overcome more bite force, the shear strength of the soil mixture increased. Besides that, as soil particles with a diameter of 0.06–0.03 mm possessed the worst roundness, the maximum internal friction angle of the soil mixture composed of original soil particles with diameters of 4–2 mm, 0.5–0.25 mm and 0.06–0.03 mm was slightly larger (φ = 47°) than that of the other two types of soil mixtures (Figure 3d).
When the mass content of the skeleton particles was less than 70%, the structure of the soil mixture gradually changed from a single structure dominated by skeleton particles to a multi-structure dominated by the interaction between the skeleton particles and fillers (Figure 4c). In this process, with the increase in the mass content of fillers, the skeleton particles were gradually surrounded by finer particles, as if they were “floating” in the mass of finer particles. In this case, the major type of contact between soil particles gradually transformed from the single type into the multi-type, i.e., contact between the skeleton particles and fillers and contact between the fillers. As the particles of fillers are smaller than the skeleton particles, the contact area between particles in this case (skeleton–filler, filler–filler) decreased compared with the contact between skeleton particles. Therefore, this weakened the friction and bite force between the soil particles to some extent. In this case, we found that the shear strength of the soil mixture was significantly reduced as compared with the previous value. Additionally, the smaller the particle size of fillers, the more obviously the shear strength of the soil mixture decreased.
When the mass content of the skeleton particles was less than 30%, the soil mixture was mainly composed of fillers. At this point, the structure of the soil mixture was mainly dominated by fillers (Figure 4d), and the type of contact primarily became the contact between filling particles. In this case, the shear strength of the soil mixture mainly depended on the friction and bite force between filler particles, and certainly, its values were close to the shear strength of the fillers.

5. Conclusions

In our research, the change in physical–mechanical properties of soil mixtures under different particle size distributions was presented well by the triangular nomogram. When the mass content of the skeleton particles was more than 70%, the shear strength of the soil mixture was close to the values of the skeleton particles. At the same time, the irregular shape of the particles increased the shear strength of the soil mixture to some extent. As the content of the filler increased gradually (as the mass content of the skeleton particles became less than 70%), the particle structure composition of the soil particles gradually changed, and the contact between single aggregate particles gradually turned into that between aggregate particles and filler particles and between pure filler particles. In the process, the shear strength of the graded sand gradually decreased and eventually tended towards the shear strength of the filler (as the mass content of the skeleton particles became less than 30%).
In summary, the improved triangular nomogram provided us with a new train of thought to present the influence of mineral particles on the properties of soil. Through the analysis of the change regulation of the maximum internal friction angle of the soil mixture by using a triangular nomogram, we found that the improved triangular nomogram is an effective model and method that can be used to analyze and simulate the properties of soil multi-mixtures. In the case of multiple variables, we can use the triangular nomogram or even its three-dimensional model to analyze and describe the change regulation of soil properties under different factors.

Author Contributions

Conceptualization, V.K.; methodology, V.K., S.Z.; software, S.Z.; validation, V.K., S.Z. and Z.Z.; formal analysis, S.Z.; investigation, S.Z.; resources, V.K. and Z.Z.; data curation, S.Z.; writing—original draft preparation, S.Z.; writing—review and editing, V.K., Z.Z. and A.M.; visualization, S.Z.; supervision, Z.Z.; project administration, Z.Z.; funding acquisition, Z.Z., Y.L. and T.D. All authors have read and agreed to the published version of the manuscript.

Funding

This research was funded by the following research grants: (a) the National Natural Science Foundation of China (NSFC) (41771078, 42011530083), (b) SAFEA: High-End Foreign Experts Project (G2021131003L), (c) Russian Foundation for Basic Research: RFBR-NSFC project (20-55-53006), (d) Qinghai-Tibet Group Corporation Science and Technology Research and Development Plan (QZ2021-G03).

Data Availability Statement

Not applicable.

Conflicts of Interest

The authors declare no conflict of interest.

References

  1. Trofimov, V.T.; Korolev, V.A.; Voznesensky, E.A.; Golodkovskaya, G.A.; Vasilchuk, Y.K.; Ziangirov, R.S. Soil Science, 6th ed.; Trofimov, V.T., Ed.; Publishing House of Moscow State University: Moscow, Russia, 2005; 1024p. (In Russian) [Google Scholar]
  2. Wang, J.; Mo, H.H.; Liu, S.Z.; Wang, Y.-Z.; Jiang, F.-H. Effect of Mineral Composition on Macroscopic and Microscopic Consolidation Properties of Soft Soil. Soil Mech. Found. Eng. 2014, 50, 232–237. [Google Scholar] [CrossRef]
  3. Lu, L.C.; Zhang, Z.; Feng, W.J.; Du, W.; Liu, B.H.; Chen, C.L. Research on variability of freezing-thawing cycle on basic physical and mechanics properties of clay minerals. Hydrogeol. Eng. Geol. 2017, 44, 118–123. [Google Scholar]
  4. Hongchun, X. Experimental research on the effects of mineral composition on soil mechanical characteristics. China Coal 2015, 41, 56–61. [Google Scholar]
  5. Hao, C.; Xuan, W.; Jiasheng, Z.; Zhaoyi, W. Effects of Particle Size on Shear Behavior of Interface between Coarse-grained Soil and Concrete. J. Basic Sci. Eng. 2018, 26, 145–153. [Google Scholar] [CrossRef]
  6. Ibrahim, H.M.; Alghamdi, A.G. Effect of the Particle Size of Clinoptilolite Zeolite on Water Content and Soil Water Storage in a Loamy Sand Soil. Water 2021, 13, 607. [Google Scholar] [CrossRef]
  7. Xie, Z.; Wang, Y.; Cheng, G.; Malhi, S.S.; Vera, C.L.; Guo, Z.; Zhang, Y. Particle-size effects on soil temperature, evaporation, water use efficiency and watermelon yield in fields mulched with gravel and sand in semi-arid Loess plateau of northwest China. Agric. Water Manag. 2010, 97, 917–923. [Google Scholar] [CrossRef]
  8. Feng, H.; Chen, J.; Zheng, X.; Xue, J.; Miao, C.; Du, Q.; Xu, Y. Effect of Sand Mulches of Different Particle Sizes on Soil Evaporation during the Freeze–Thaw Period. Water 2018, 10, 536. [Google Scholar] [CrossRef] [Green Version]
  9. Waddell, H. Volume, Shape and roundness of rock particles. J. Geol. 1932, 40, 443–451. [Google Scholar] [CrossRef]
  10. Shi, X.S.; Liu, K.; Yin, J. Effect of Initial Density, Particle Shape, and Confining Stress on the Critical State Behavior of Weathered Gap-Graded Granular Soils. J. Geotech. Geoenviron. Eng. 2020, 147, 04020160. [Google Scholar] [CrossRef]
  11. Altuhafi, F.N.; Coop, M.R.; Georgiannou, V.N. Effect of particle shape on the mechanical behavior of natural sands. J. Geotech. Geoenviron. Eng. 2016, 142, 04016071. [Google Scholar] [CrossRef]
  12. Xiao, Y.; Stuedlein, A.W.; Ran, J.; Evans, T.M.; Cheng, L.; Liu, H.; van Paassen, L.A.; Chu, J. Effect of particle shape on strength and stiffness of biocemented glass beads. J. Geotech. Geoenviron. Eng. 2019, 145, 06019016. [Google Scholar] [CrossRef]
  13. Qiu, E.; Zhong, C.; Wan, X.; Lu, J.; Chen, H.M.; Pirhadi, N.; Wang, Z.; Chen, Q. Study on thermal conductivity model of saline soil based on particle morphology. Heat Mass Transf. 2021, 57, 2029–2043. [Google Scholar] [CrossRef]
  14. Goldstein, M.N. Mechanical Properties of Soils: The Main Components of Soil and Their Interaction; Stroyizdat: Moscow, Russia, 1973; 375p. (In Russian) [Google Scholar]
  15. Belkhatir, M.; Arab, A.; Della, N.; Missoum, H.; Schanz, T. Influence of inter-granular void ratio on monotonic and cyclic undrained shear response of sandy soils. Comptes Rendus Mec. 2010, 338, 290–303. [Google Scholar] [CrossRef]
  16. Fragaszy, R.J.; Su, W.; Siddiqi, F.H. Effects of oversize particles on the density of clean granular soils. Geotech. Test. J. 1990, 13, 106–114. [Google Scholar] [CrossRef]
  17. Salgado, R.; Bandini, P.; Karim, A. Shear strength and stiffness of silty sand. J. Geotech. Geoenviron. Eng. 2000, 126, 451–462. [Google Scholar] [CrossRef]
  18. Vallejo, L.E.; Mawby, R. Porosity influence on the shear strength of granular material–clay mixtures. Eng. Geol. 2000, 58, 125–136. [Google Scholar] [CrossRef]
  19. Vallejo, L.E. Interpretation of the limits in shear strength inbinary granular mixtures. Can. Geotech. J. 2001, 38, 1098–1104. [Google Scholar] [CrossRef]
  20. Ni, Q.; Tan, T.S.; Dasari, G.R.; Hight, D.W. Contribution of fines to the compressive strength of mixed soils. Geotechnique 2004, 54, 561–569. [Google Scholar] [CrossRef]
  21. Ter-Martirosyan, Z.G.; Mirnyi, A.Y. Effect of Nonhomogeneity of Soils on their Mechanical Properties. Soil Mech. Found. Eng. 2014, 50, 223–231. [Google Scholar] [CrossRef]
  22. Ibrahim, K.M.H.I. Effect of percentage of low plastic fines on the unsaturated shear strength of compacted gravel soil. Ain Shams Eng. J. 2015, 6, 413–419. [Google Scholar] [CrossRef] [Green Version]
  23. Marsal, R.J.; Fuentes de la Rosa, A. Mechanical properties of rock fill–soil mixtures. In Proceedings of the 12th International Congress on Large Dams, Mexico City, Mexico, 29 March–2 April 1976; Volume 1, pp. 179–209. [Google Scholar]
  24. Naeini, S.A.; Baziar, M.H. Effect of fines content on steady-state strength of mixed and layered samples of a sand. Soil Dyn. Earthq. Eng. 2004, 24, 181–187. [Google Scholar] [CrossRef]
  25. Thevanayagam, S.; Mohan, S. Inter-granular state variables and stress-strain behaviour of silty sands. Geotechnique 2000, 50, 1–23. [Google Scholar] [CrossRef]
  26. Xenaki, V.C.; Athanasopoulos, G.A. Liquefaction resistance of sand-silt mixtures: An experimental investigation of the effect of fines. Soil Dyn. Earthq. Eng. 2003, 23, 1–12. [Google Scholar] [CrossRef]
  27. Ogbonnaya, I. The Combined Effect of Particle Size Distribution and Relative Density on the Large Strain Behavior of Sandy Soils. Geotech. Geol. Eng. 2017, 36, 1037–1048. [Google Scholar]
  28. Ivanov, N.N.; Okhotin, V.V. Soil Science of Road and Soil Mechanics; OGIZ Gostransizdat: Leningrad, Russia, 1934; 387p. (In Russian) [Google Scholar]
  29. Birulya, A.K. Roads Made of Local Materials; Publishing house Avtotransizdat: Moscow, Russia, 1955; 140p. (In Russian) [Google Scholar]
  30. Goncharova, L.V. Fundamentals of Artificial Soil Melioration; Publishing House of Moscow State University: Moscow, Russia, 1973; 376p. (In Russian) [Google Scholar]
  31. Bannik, G.I. Technical Melioration of Soils; Publishing house Vishcha shkola: Moscow, Russia, 1976; 303p. (In Russian) [Google Scholar]
  32. Voronkevich, S.D. Technical Melioration of Rocks; Publishing House of Moscow State University: Moscow, Russia, 1981; pp. 3–78. (In Russian) [Google Scholar]
  33. AlAdhamii Rana, A.J.; Fattah Mohammed, Y.; Kadhim Yasser, M. Geotechnical Properties of Clayey Soil Improved by Sewage Sludge Ash. J. Air Waste Manag. Assoc. 2022, 72, 34–47. [Google Scholar] [CrossRef]
  34. Habibi, A.A.; Fallah Tafti, M.; Narani, S.; Abbaspour, M. Effects of waste tire textile fibres on geotechnical properties of compacted lime-stabilized low plastic clays. Int. J. Geotech. Eng. 2021, 15, 1118–1134. [Google Scholar] [CrossRef]
  35. Cetin, H.; Fener, M.; Gunaydin, O. Geotechnical properties of tire-cohesive clayey soil mixtures as a fill material. Eng. Geol. 2006, 88, 110–120. [Google Scholar] [CrossRef]
  36. Ogorodnikova, E.N. Secondary Resources for the Road Industry—Ash of Thermal Power Station and Slags of Ferrous Metallurgy; RUDN University: Moscow, Russia, 2013. (In Russian) [Google Scholar]
  37. Ogorodnikova, E.N. Technogenic Soils; RUDN: Moscow, Russia, 2017; 636p. (In Russian) [Google Scholar]
  38. He, C.; Zeng, X.; Wilkinson, A. Geotechnical properties of GRC-3 lunar simulant. J. Aero. Eng. 2013, 26, 528–534. [Google Scholar] [CrossRef]
  39. Slyuta, E.N.; Grishakina, E.A.; Makovchuk, V.Y.; Agapkin, I.A. Lunar soil-analogue VI-75 for large-scale experiments. Acta Astronaut. 2021, 187, 447–457. [Google Scholar] [CrossRef]
  40. Korolev, V.A. Modeling the particle size distribution of lunar soils. Eng. Geol. 2016, 5, 40–50. [Google Scholar]
  41. Carrier, W.D., III; Asce, F. Particle size distribution of lunar soil. J. Geotech. Geoenviron. Eng. 2003, 129, 956–959. [Google Scholar] [CrossRef]
  42. Carrier, W.D., III; Olhoeft, G.R.; Mendell, W. Physical Properties of the Lunar Surface. In Lunar Sourcebook; Heiken, G., Vaniman, D., French, B.M., Eds.; Cambridge University Press: Cambridge, UK, 1991; pp. 475–594. [Google Scholar]
  43. Carrier, W.D., III; Mitchell, J.K.; Mahmood, A. The relative density of lunar soil. In Proceedings of the 4th Lunar Science Conference, Houston, TX, USA, 5–8 March 1973; pp. 2403–2411. [Google Scholar]
  44. Atsagortsyan, Z.A.; Akopyan, G.G.; Sarkisov, R.R.; Cherkasov, I.I.; Shvarev, V.V. To the creation of an analogue of lunar soil. In Modern Ideas about the Moon; Nauka: Moscow, Russia, 1972; pp. 113–116. [Google Scholar]
  45. Guo, W.L.; Zhu, J.G.; Wen, Y.F. Unified description for four grading scale methods for coarse aggregate. Chin. J. Geotech. Eng. 2016, 38, 1473–1480. [Google Scholar] [CrossRef]
  46. Zhu, J.G.; Guo, W.L.; Wang, Y.L.; Wen, Y.F. Equation for soil gradation curve and its applicability. Chin. J. Geotech. Eng. 2015, 37, 1931–1936. [Google Scholar] [CrossRef]
  47. Zhu, J.G.; Weng, H.Y.; Wu, X.M.; Liu, H.L. Experimental study of compact density of scaled coarse-grained soil. Rock Soil Mech. 2010, 31, 2394–2399. [Google Scholar]
  48. Zuo, Y.-Z.; Wei, Z.; Pan, J.-j.; Zhao, N. Effects of gradation scale method on maximum dry density of coarse-grained soil. Rock Soil Mech. 2015, 36, 418–422. [Google Scholar] [CrossRef]
  49. Trofimov, V.T. Laboratory Work on Soil Science: A Teaching Material, 3rd ed.; Trofimov, V.T., Korolev, V.A., Eds.; “KDU” University Book: Moscow, Russia, 2017; 656p, ISBN 978-5-91304-724-3. [Google Scholar]
  50. Chang, C.S.; Deng, Y. A particle packing model for sand–silt mixtures with the effect of dual-skeleton. Granul. Matter 2017, 19, 80. [Google Scholar] [CrossRef]
  51. Yilmaz, Y. A study on the limit void ratio characteristics of medium to fine mixed graded sands. Eng. Geol. 2009, 104, 290–294. [Google Scholar] [CrossRef]
  52. Chang, C.S.; Wang, J.Y.; Ge, L. Modeling of minimum void ratio for sand–silt mixtures. Eng. Geol. 2015, 196, 293–304. [Google Scholar] [CrossRef]
  53. Bahari, B.; Kim, T.H.; Hwang, W. Nonlinear estimation model of minimum void ratio for sand–silt mixtures. Mar. Georesour. Geotechnol. 2019, 39, 176–187. [Google Scholar] [CrossRef]
  54. Yun, Q.; Zhang, Z.; Ming, J.; Fu, X.; Zhou, C.; Melnikov, A. Experimental study on morphometric changes of sand particles under freezing-thawing cycles. J. Glaciol. Geocryol. 2020, 42, 205–215. [Google Scholar] [CrossRef]
Figure 1. Equipment for direct shear test (DSJ-3). 1: strain meter; 2: shear box; 3: control panel.
Minerals 12 00135 g001
Figure 2. (a) Model of triangular nomogram for analysis: distribution of original particle components and soil mixtures in the triangular nomogram; (b) Model of triangular nomogram for analysis: change in maximum dry density of soil mixtures under different particle size distributions.
Minerals 12 00135 g002
Figure 3. (a) Changes in the maximum internal friction angle of soil bino–mixtures under different particle size distributions; (b) Changes in the maximum internal friction angle of soil mixtures composed of fractions: 4–2 mm, 2–1 mm, 1–0.5 mm; (c) Changes in the maximum internal friction angle of soil mixtures composed of fractions: 4–2 mm, 1–0.5 mm, 0.25–0.1 mm; (d) Changes in the maximum internal friction angle of soil mixtures composed of fractions: 4–2 mm, 0.5–0.25 mm, 0.06–0.03 mm.
Minerals 12 00135 g003
Figure 4. Change in the contact between soil particles under different particle size distributions. (a): mass content of the skeleton particle > 70%; (b): mass content of the skeleton particle = 70%; (c): 30% < mass content of the skeleton particle < 70% (d): mass content of the skeleton particle < 30%.
Minerals 12 00135 g004
Figure 5. Images of soil particles with different sizes by SEM: (a) 4–2 mm; (b) 2–1 mm; (c) 1–0.5 mm; (d) 0.5–0.25 mm; (e) 0.25–0.1 mm; (f) 0.06–0.03 mm.
Minerals 12 00135 g005aMinerals 12 00135 g005b
Figure 6. Sketch of the maximum inscribed circle and inflection points; Figure 7 change in the particle roundness under different particle sizes.
Minerals 12 00135 g006
Figure 7. Change in the particle roundness under different particle sizes.
Minerals 12 00135 g007
Table 1. Type of soil mixtures and mass ratio of each component in the soil mixture.
Type I (D = 1/2), %Type II (D = 1/4), %Type III (D = 1/8), %
4–2 mm2–1 mm1–0.5 mm4–2 mm1–0.5 mm0.5–0.25 mm4–2 mm0.5–0.25 mm0.06–0.03 mm
1703007030070300
2505005050050500
3307003070030700
4700307003070030
5500505005050050
6300703007030070
7070300703007030
8050500505005050
9030700307003070
10602020602020602020
11403030403030403030
12404515404515404515
13401545401545401545
14204040204040204040
15202060202060202060
16206020206020206020
Publisher’s Note: MDPI stays neutral with regard to jurisdictional claims in published maps and institutional affiliations.

