Article

Application of Numerical Simulation Methods in Solving Complex Mining Engineering Problems in Dingxi Mine, China

School of Resources and Safety Engineering, Central South University, Changsha 410083, China
*
Author to whom correspondence should be addressed.
Minerals 2022, 12(2), 123; https://doi.org/10.3390/min12020123
Submission received: 12 December 2021 / Revised: 13 January 2022 / Accepted: 19 January 2022 / Published: 21 January 2022
(This article belongs to the Special Issue Backfilling Materials for Underground Mining, Volume II)

Abstract

:
In the mining industry, with numerical simulation analysis of stope roof stability, stope exposed area computation, and pillar buckling collapse simulation, backfill body creep damage mechanism research is becoming the most popular method in the field of backfill mining techniques. In this paper, we first summarized and analyzed the current application status and the existing problems of numerical simulation for solving mining engineering technical problems; then, based on the practical engineering problems of mining phosphate rock resources under high and steep rock slopes (HSRS), we carried out a true-3D numerical simulation study for different underground mining methods, to determine the appropriate mining method. Therefore, this paper, taking Dingxi Mine in China as an example, highlights the advantages of the backfill mining method with a high and steep slope; meanwhile, it also points out how to improve the accuracy of a numerical simulation and make it more consistent with the actual situation of the mining engineering application site. This paper only serves as a guide, in order to start a conversation, and we hope many more experts and scholars will become interested and engaged in this field of research.

1. Introduction

Today, with the soaring demand for mineral resources, ore bodies that are easy to mine or with good deposit conditions are gradually becoming exhausted [1,2], while ore bodies with poor mining and deposit conditions, are also gradually starting to be mined. Some of these ore bodies are located under high and steep rock slopes (HSRS), and mining operations and production in these areas might reduce the stability of the slopes and cause collapses that could threaten the safety of nearby residents. To name only a few, on the 9 October 1963, a devastating landslide occurred in the Southern Alps of Italy, called the Vaiont landslide [3]. The total volume of the landslide was about 3 × 10⁸ m3, resulting in more than 1900 deaths; another example is from 5 June 2009, when a large-scale landslide occurred in Jiweishan, an iron ore township, Wulong County, Chongqing City, China [4,5], resulting in 10 deaths, 64 missing, and 8 injured.
In the past, research on the direction of mining slopes paid more attention to artificial slopes, for instance, open-pit mine slopes [2], while neglecting to research original mining slopes (natural mining slopes). There has been almost no direct research reference on mining such deposits under HSRS; therefore, based on the experience of artificial slopes, the first prerequisite for mining beneath HSRS is to ensure the stability and safety of the slope. There is no doubt that the caving mining method should be excluded first, among the three major underground mining methods (open-stope method, caving method, and backfill method), due to surface subsidence not being allowed. For the open-stope mining method, the open stope is supported by pillars and left in the mining process. Nevertheless, no goaf will be left by the backfill mining method. In general, the backfill mining method has the following advantages over the open-stope mining method:
(1)
Eliminate mined-out area hazards and prevent surface collapse;
(2)
Reduce tailings or phosphogypsum emissions to protect the environment;
(3)
Replace pillars with backfill and effectively recover resources;
(4)
Reduce the temperature underground and reduce rockburst, etc. [6,7,8].
Thus, the backfill mining method is widely used in various complex mining conditions; for example, China has advocated this mining method under these ‘three mining conditions’: mining ore bodies under water, railways, and roads and buildings [7,9]. Accordingly, at the stage of a feasibility study, it is indispensable to research mining methods and prove the feasibility of safe mining for mineral resources. However, due to the complexity of the mining process and HSRS shape, it is difficult to simulate the 3D state of HSRS with a physical model. Hence, numerical simulation using a computer is one of the most economical and effective ways for studying such problems.
Mining engineering software includes SURPAC, DATAMINE, MICROMINE, DIMINE, and 3DMINE. Since the application of the finite element method (FEM) in rock mechanics in the 1960s, the finite difference method (FDM), boundary element method (BEM), discrete element method (DEM), discontinuous deformation analysis method (DDA), and numerical manifold method (NMM) have been developed for numerical analysis [10,11,12]. Numerical simulation analysis can tackle the complex boundary conditions, non-uniformity, and anisotropy of materials, as well as effectively simulate the relationship between stress and strain of materials, and analyze the velocity field, the displacement field, and stress field distribution of the research object, as well as the range of the plastic zone.
As an example, Zou et al. [13] used a method coupling MIDAS and FLAC3D to establish a 3D model of a waste dump; simulated the stress, displacement, and plastic zone distribution; and calculated the factor of safety (FOS). Tao et al. [14] used the Fish language in 3DEC to establish a large deformation numerical analysis mechanical model of an NPR anchor cable. Khanal et al. [15] analyzed the subsidence and stress of different possible mining layouts, to assess potential options for multi-seam mining strategies. The research of Li et al. [16] realized the reproduction of the stress–strain change process of the Ji-guan-ling slope under the impact of mining operations and gravity. Yang et al. [17] analyzed the stress, strain, and FOS of the No. III sliding mass under natural and heavy rain conditions in Luoshan mine using FLAC3D, as well as the landslide stability influence of goaves.
However, there are some problems in directly referring to these simulation methods to research mining under HSRS: (1) there is no dynamic mining process, usually only a simulation of a certain limited state of slopes; (2) some models are too simplistic, such as being simplified into a 2D model or pseudo-3D model (obtained by stretching a 2D profile). These simplified treatments cannot fully characterize the actual shape of the slope and the impact of mining activities, which may lead to a large difference between the simulation results and the actual situation. Therefore, based on FDM, this paper implemented a true-3D numerical simulation study for different underground mining methods under HSRS at Dingxi Mine, China.
In particular, limit methods based on analytical formulae have received a lot of attention for similar problems in the past few years, especially from the researchers Fraldi et al. [18,19] and Guarracino et al. [20,21], whose research has been very enlightening to us.
Therefore, this can provide research notions and directions for mines with similar mining conditions under HSRS.
Therefore, this paper, taking Dingxi Mine as an example, highlights the advantages of the backfill mining method, by comparing the advantages and disadvantages of various mining methods for a high and steep slope.

2. Engineering Background and Modeling

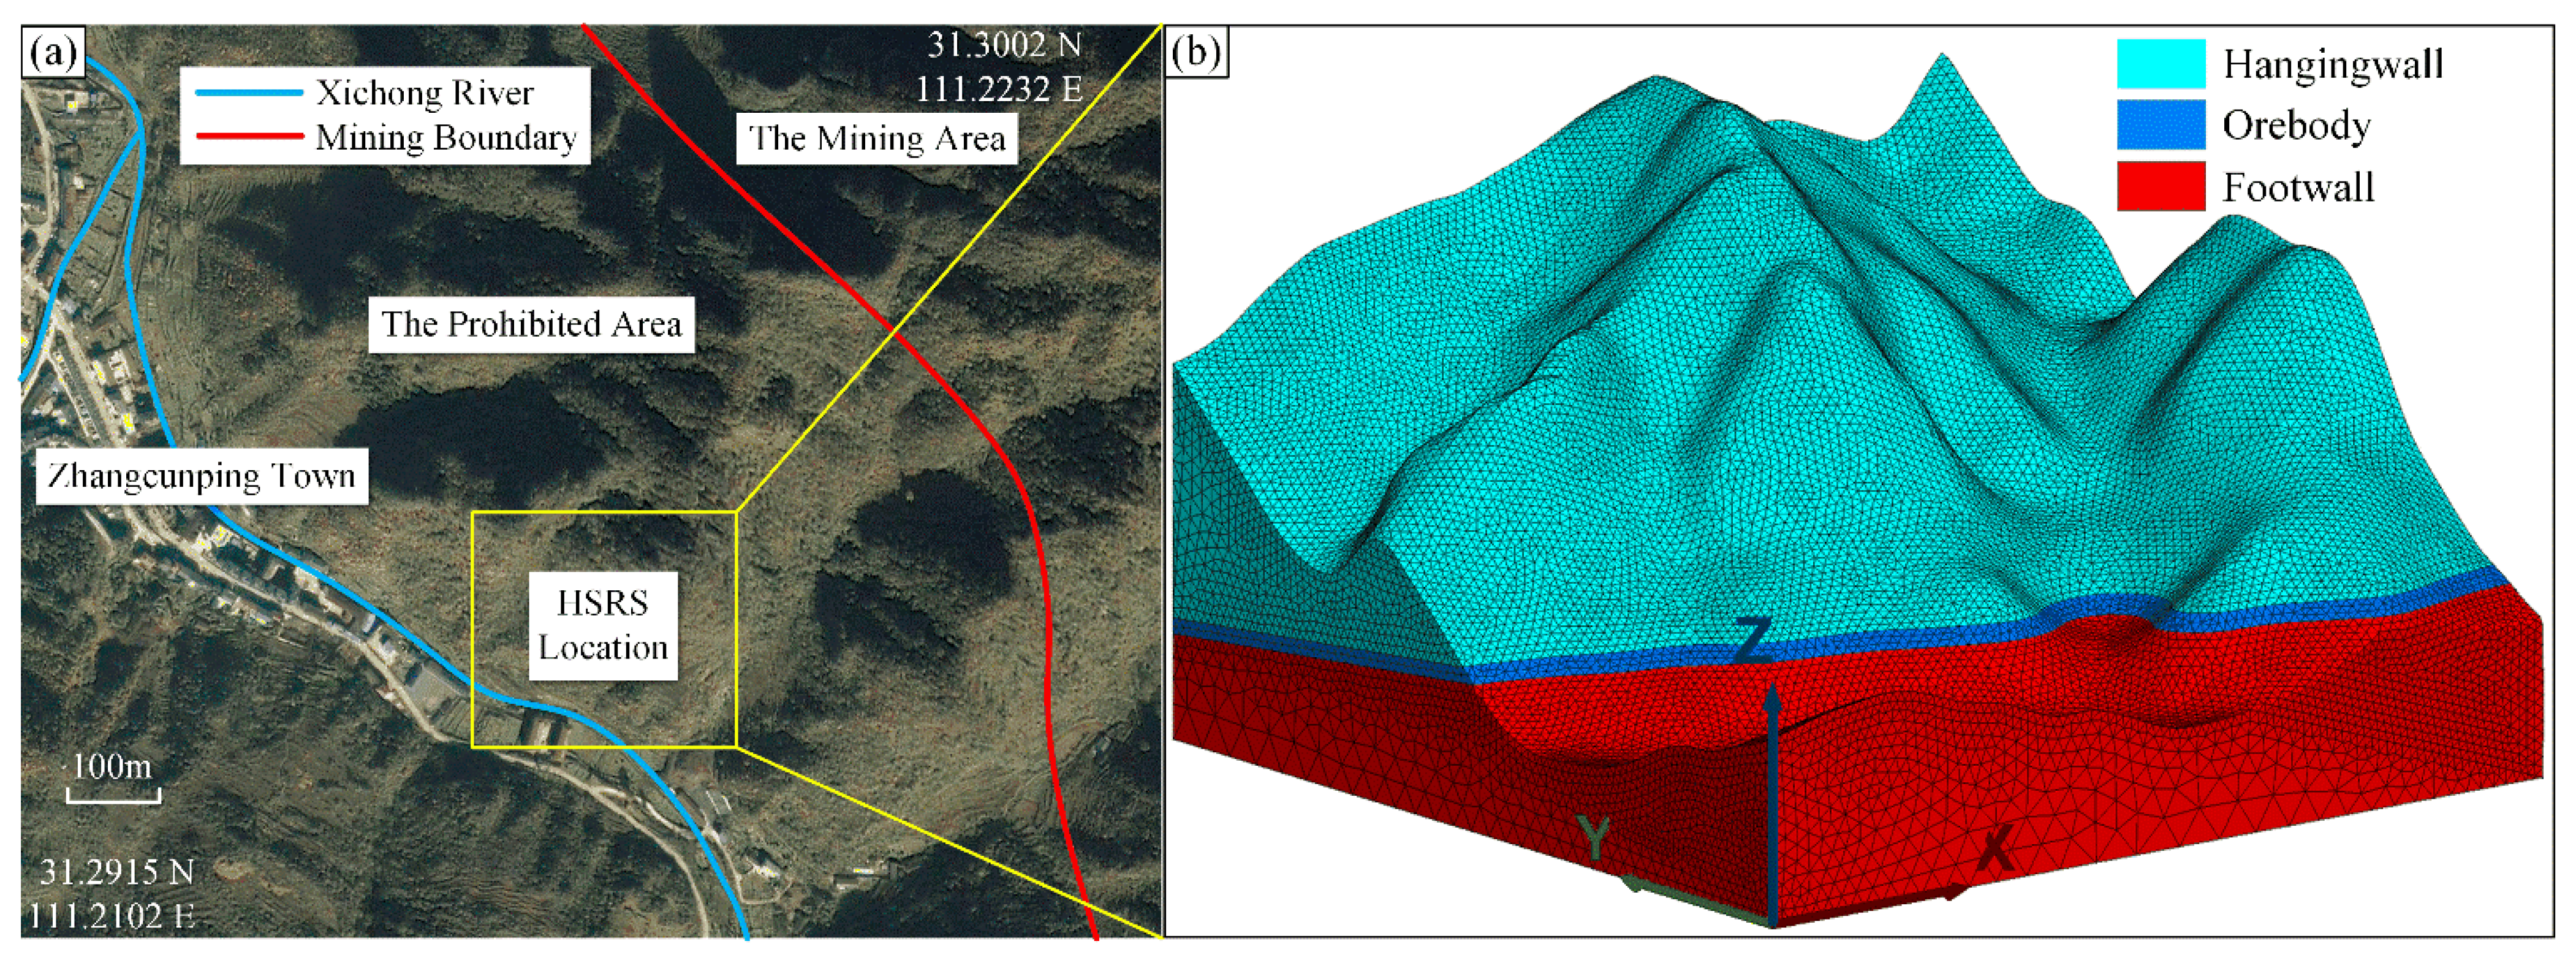
2.1. Engineering Background

Dingxi Mine is located in Zhangcunping Town, Yichang City, Hubei Province, China. The steep and high mountains that surround Zhangcunping Town form several HSRS, threatening nearby residents. Dingxi Mine used to adopt the open-stope method for mining. Therefore, to ensure the safety of nearby residents, nearly 6.3 million tons of high-grade phosphate ore near Zhangcunping Town was designated a prohibited area, shortening the service life of Dingxi mine and affecting the economic benefits. Subsequently, the mine plans to select appropriate mining methods to safely recover this part of the ore. To verify the feasibility of safe mining, the stability and reliability of a 2D section were previously studied for a typical HSRS, and the results demonstrated that the stability and safety of the HSRS could be ensured under backfill mining [22]. In order to more closely reflect the situation of the HSRS, a true-3D model was used to simulate and analyze the HSRS with different underground mining methods. Due to the large number of HSRS in the restricted area, the slope which best reflects the slope instability was selected for analysis: a typical fundamental HSRS located in the southeast (just 200 m away from the residential area, Figure 1a).

2.2. Modeling and Methodology

On the basis of the results of the geotechnical investigation, 14 layers of gently inclined rock and ore, from top to bottom, were found in the HSRS. Based on the real topography and stratigraphic information, a true-3D mesh model of the HSRS was successfully established, using RHINO (version 5.0, Robert McNeel & Associates, Seattle, Washington, DC, USA) and FLAC3D (version 5.0, Itasca Consulting Group, Inc., Minneapolis, MN, USA) coupling modeling methods (Figure 1). To facilitate the calculation and analysis, the following simplifications were made: the roof rock strata were simplified as ‘Hangingwall’; the floor rock strata were simplified as ‘Footwall’; and the thickness (10 m) and the dip angle (5°) of the orebody (named ‘Orebody’) remained unchanged throughout the model. As the orebody will be superseded by the cemented backfill after being mined, it was cut into 26 individual tunnels, for simulation of the subsequent excavation (Figure 2).
The final model that emerged is shown in Figure 1b. The size of the undersurface of the model is 600 m × 600 m, and the model is composed of 1,174,962 tetrahedral meshes. Based on FDM, an elastic–plastic material model was chosen and the Mohr–Coulomb yield criterion was used to judge the material failure in FLAC3D software. The shear failure surface was simplified as a linear failure surface, that is:
f s = σ 1 σ 3 N ϕ + 2 c N ϕ
f t = σ 3 σ 1
where σ1 is the maximum principal stress; σ3 is the minimum principal stress; c is cohesion; φ is internal friction angle; Nφ = (1 + sinφ)/(1 − sinφ). When fs = 0, shear failure occurs; when ft = 0, tensile failure occurs.

3. Determination of Calculation Parameters for the Model

3.1. Calculation Parameters for Rock Mass

In this paper, rock mass calculation parameters were obtained based on Hoek–Brown strength criteria [23,24]:
σ 1 = σ 3 + ( m b σ c σ 3 + s σ c 2 ) a
where σc is the uniaxial compressive strength of rock; mb, s, and a are Hoek–Brown constants of rock mass, which can be described as:
m b = m i e ( G S I 100 28 14 D )
s = e ( G S I 100 9 3 D )
a = 1 2 + 1 6 ( e G S I 15 e 20 3 )
where GSI is geological strength index; mi is rock material constant; and D is a factor that depends on the degree to which the rock mass has been disturbed by blasting or stress relaxation.
In order to obtain the σc and Hoek–Brown constants, site investigation, laboratory tests, and engineering experience were employed [12,17,25,26], which were determined by combining the information from Formula (3) to Formula (6), and Table 1 and Table 2:
These parameters are shown in Table 1. The ‘Hangingwall’ represents the roof rock strata (dolomite), the ‘Orebody’ represents the rock samples of the orebody (phosphorite), and the ‘Footwall’ represents the floor rock strata (shale). Eventually, the calculation parameters of the model could be calculated based on Hoek–Brown strength criteria (Table 2).

3.2. Calculation Parameters for Backfill

In China’s Kaiyang Phosphate Mine and other mines [27,28], there have been precedents for the application of backfill aggregate for the backfill mining method. Dingxi mine also plans to use a phosphogypsum cemented backfill. Therefore, in order to determine the calculation parameters, a variety of backfill laboratory tests were carried out [29]. The test process included the following steps (Figure 3): (a) phosphogypsum sampling; (b) backfill slurry preparation, with different ratios of cement, tailings, and phosphogypsum; (c) casting molding (mold size: 7.07 × 7.07 × 7.07 cm3); (d) test block formation; (e) test block maintenance; and (f) laboratory tests (compression load test).
In the course of the testing, it was found that the strength of the backfill test block containing only cement and phosphogypsum (mass proportion: cement 8.57%, phosphogypsum 51.43%, water 40.00%; 56 d uniaxial compressive strength: 1.79 MPa) was too low and only suitable for 3rd and 4th steps of backfill, and it could not meet the strength requirements of the 1st and 2nd steps backfill. Therefore, when gravity beneficiation tailings with a larger overall particle size were mixed into backfill slurry (mass proportion: cement 10.00%, phosphogypsum 36.00%, water 30.00%, gravity beneficiation tailings 24.00%), the 56d uniaxial compressive strength reached 2.48 MPa, which meets the backfill strength requirements for the 1st and 2nd steps. Finally, the other calculation parameters for two kinds of backfill with different components were measured.
The calculation parameters of the model are shown in Table 2.

4. Numerical Simulation Schemes in FLAC3D

Hypothetically, provided that the model boundary is large enough, the influence of the boundary periphery on the model can be ignored. Thus, we used the FIX command to limit the displacement of the bottom and side surfaces of the model to 0. When the maximum unbalanced force is less than 1.0 × 10⁻⁵ N, the model reaches an equilibrium state, to obtain the initial equilibrium state.
In order to judge the safety and stability of the HSRS under mining conditions, a comparative analysis of numerical simulation was carried out of the backfill mining method and the open-stope mining method. Then, the four-step interchanging tunnel backfill mining method (FITBMM) and the all-round mining of the open-stope method (AMM) were selected. Consequently, the mining process and structural parameters of the two methods will be introduced separately.

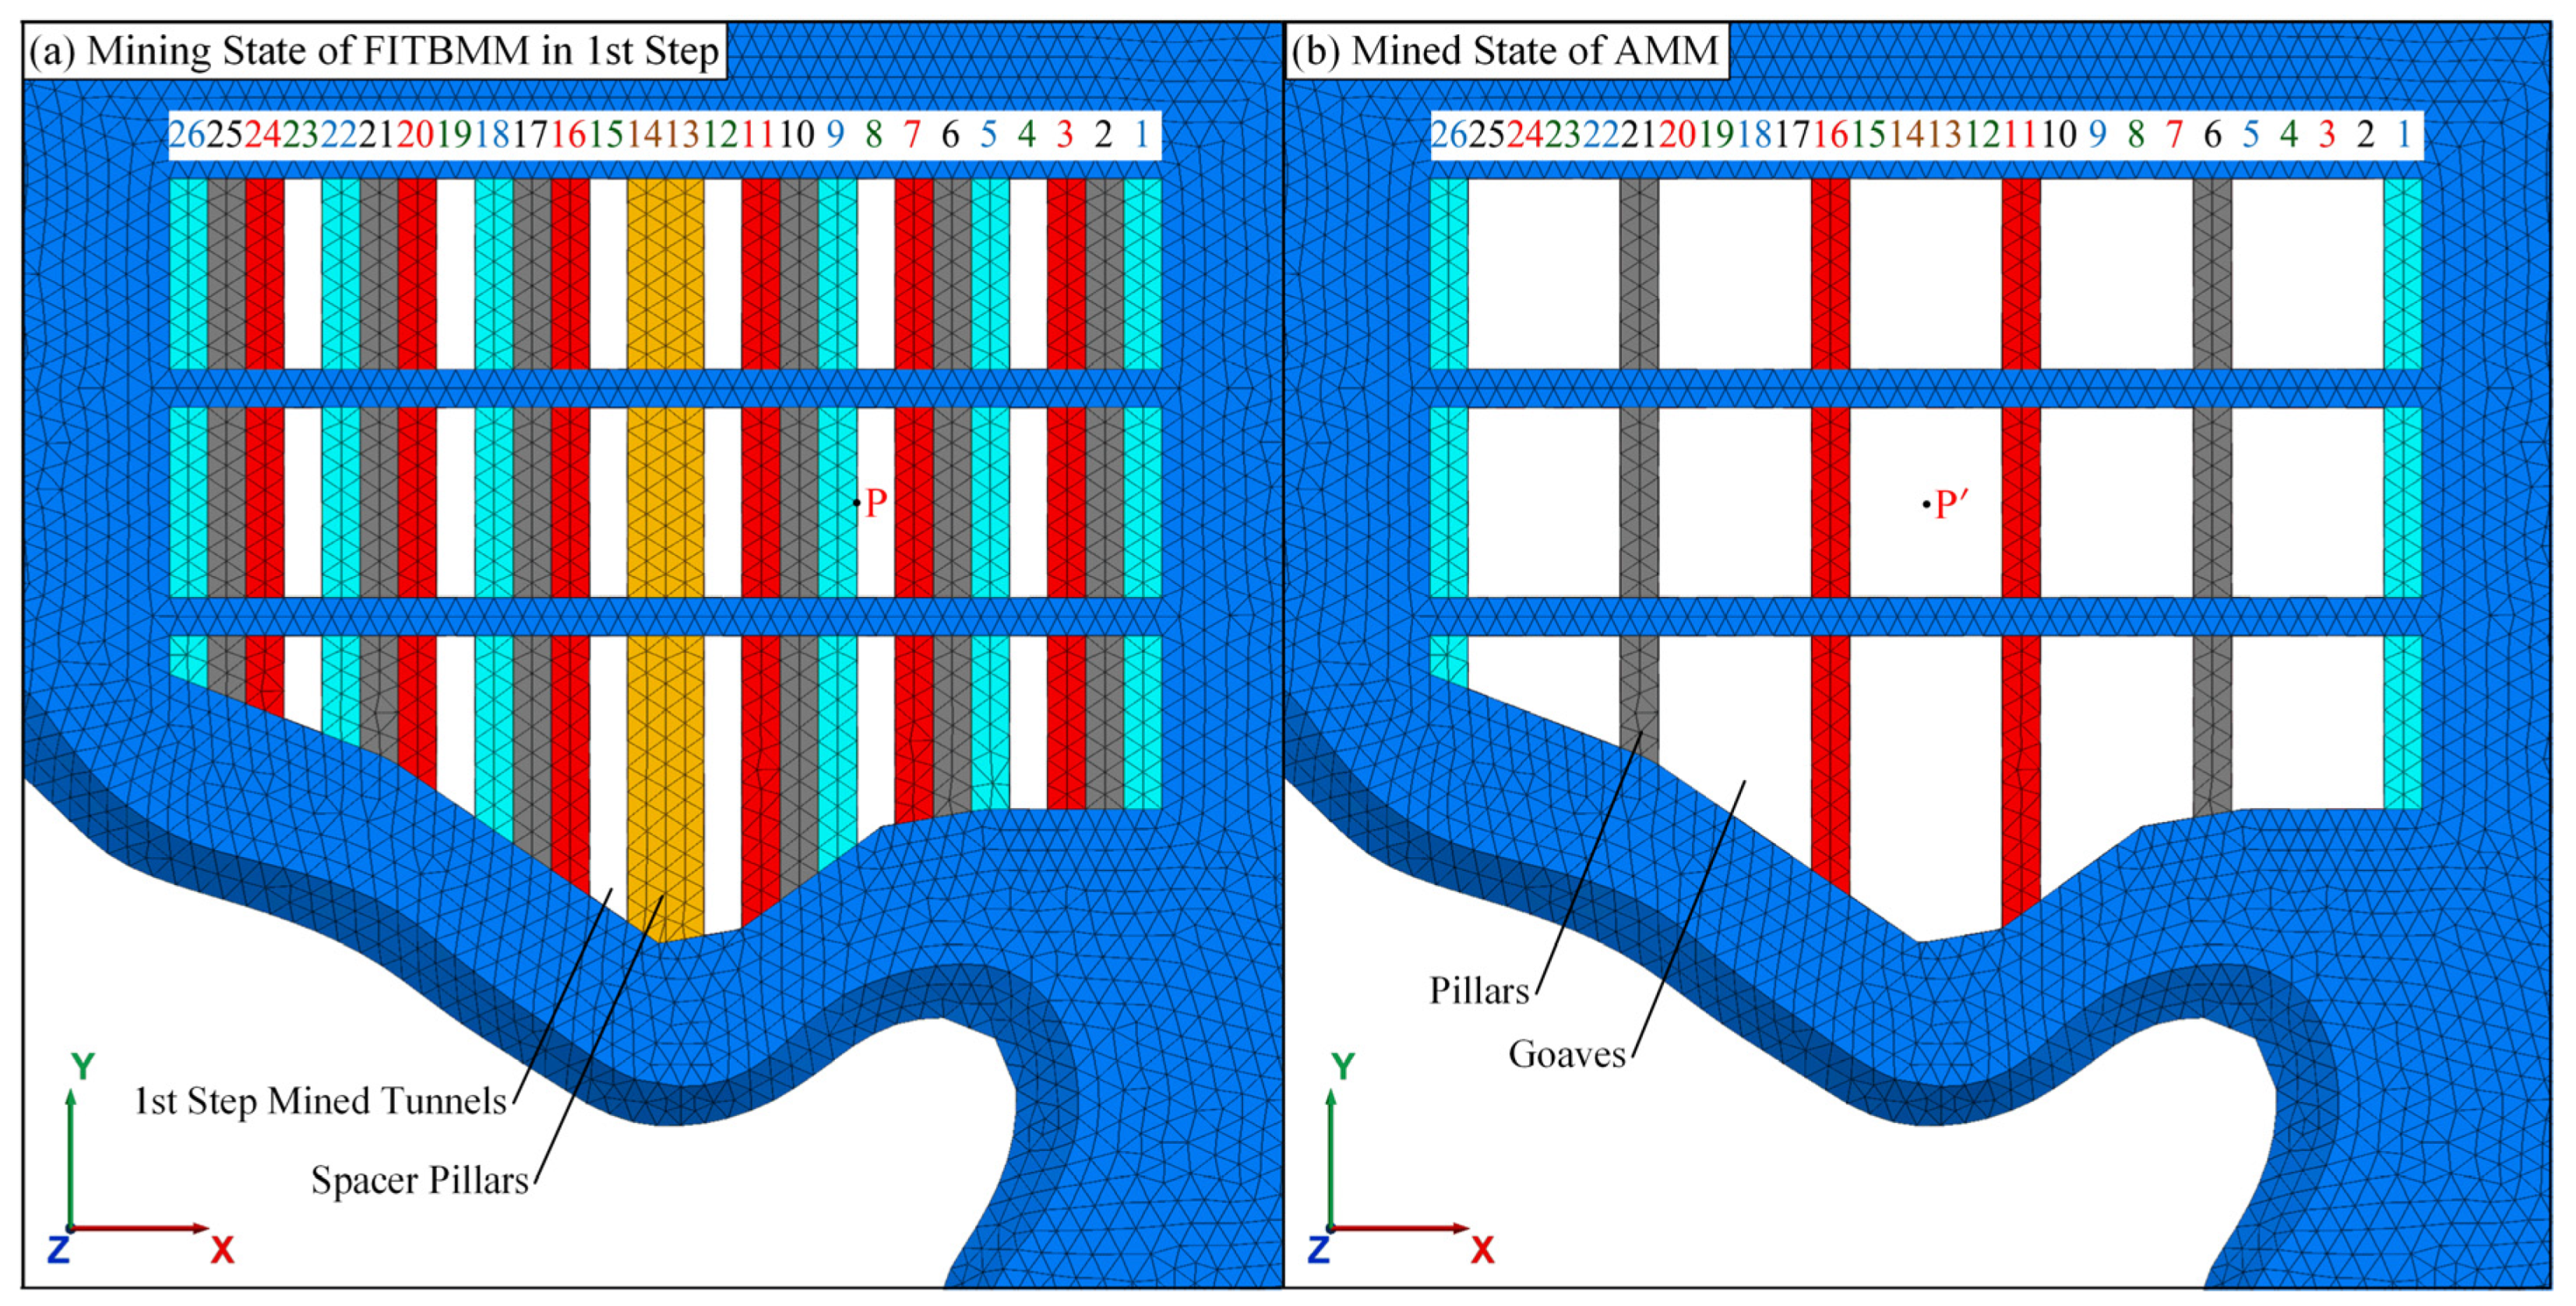
4.1. Numerical Simulation Scheme for FITBMM

FITBMM divides the gently inclined orebody into panels using spacer pillars. In order to diminish the exposed area of the stope roof, mining tunnels are adopted in panels. The stoping sequence is called ‘mining one every three’, which is carried out in a four-step dynamic mining process (Figure 4). The 1st and 2nd steps of the mining tunnels are performed under the protection of the original rock of the orebody. After the 1st and 2nd steps of mining, high-strength cemented backfilling is carried out to form the artificial backfill pillars. With the 3rd and 4th steps of mining, the walls of the tunnels become artificial backfill pillars. Only low-strength cemented backfilling is needed after the 3rd and 4th steps of mining, which can save backfill costs.
A view of the ‘Orebody’ (mining area) from the Z direction, when the ‘Hangingwall’ and ‘Footwall’ are hidden, is shown in Figure 2. The simulation scheme has been simplified to a certain extent: the 50-m safety pillars are kept on the inner side of the slope surface; the width of all the mining tunnels is 10 m; and the length of mining tunnels is 50 m, except near the slope surface. In tunnels 01–26, tunnels 13 and 14 are used as spacer pillars of the panel, with a width of 20 m, and will not be mined. In addition, tunnels 04, 08, 12, 15, 19, and 23 are 1st step mining tunnels; tunnels 02, 06, 10, 17, 21, and 25 are 2nd step mining tunnels; tunnels 03, 07, 11, 16, 20, and 24 are 3rd step mining tunnels; and tunnels 01, 05, 09, 18, 22, and 26 are 4th step mining tunnels. Shown in Figure 2a is the mining state when the 1st step mining tunnels have been mined.
FITBMM requires backfilling after each step of tunnel mining, so as to minimize roof exposure time. Hence, after each excavation step in FLAC3D, only 100 iteration calculation steps were taken, based on the initial equilibrium state. Then backfill the tunnels and calculate 100 steps. Then start the next excavation step. After four-step mining and backfilling, the final equilibrium state is solved by the SOLVE command, until the maximum unbalanced force is less than 1.0 × 10⁻⁵ N.

4.2. Numerical Simulation Scheme for AMM

As shown in Figure 2b, compared to the previous model, the model remains unchanged. In tunnels 01–26, 01, 06, 11, 16, 21, and 26 are used as pillars for non-mining, while the rest are all mined and become goaves. This means that the width of rooms is 40 m, the length of rooms is 50 m (except for the difference near the slope surface), and the width of pillars is 10 m.
Under the initial equilibrium state, after the required excavation, the final equilibrium state of the HSRS for the AMM can be simulated using the SOLVE command, until the maximum unbalanced force is less than 1.0 × 10⁻⁵ N.

4.3. Z-Displacement Monitoring Points

In order to more intuitively observe and compare the influence of these two mining processes on the surface and stope roof, five surface displacement monitoring points (points P1–P5, Figure 5) were set in the section where Tunnel 14 is located, and two roof displacement monitoring points were also set on the roof of each stope for the two mining methods (point P for the FITBMM, Figure 2a; point P’ for the AMM, Figure 2b and Figure 5). These seven displacement monitoring points recorded the Z-displacement of the two mining methods, from the initial equilibrium state at the beginning of mining, to the final equilibrium state after mining.

5. Numerical Simulation Analysis Results

As shown in Section 4.1, FITBMM is a dynamic mining process. In order to fully present a state change of the model for the entire mining process, diagrams of the initial state (before mining), four intermediate states (states in 4 mining steps), and the final state (equilibrium state after final backfilling) are given. These results include contour diagrams of the maximum principal stress, minimum principal stress, and Z-displacement, which are, respectively, given in the form of an XY plane where the ‘Orebody’ is located, and the section where the typical mining tunnels are located. Moreover, the Z-displacement curves of the monitoring points and the results of the plastic zone of the mining area are also given. The plastic zone results are revealed by viewing the mining area from below, and with the ‘Footwall’ is hidden. From these results, the following laws and conclusions could be obtained.

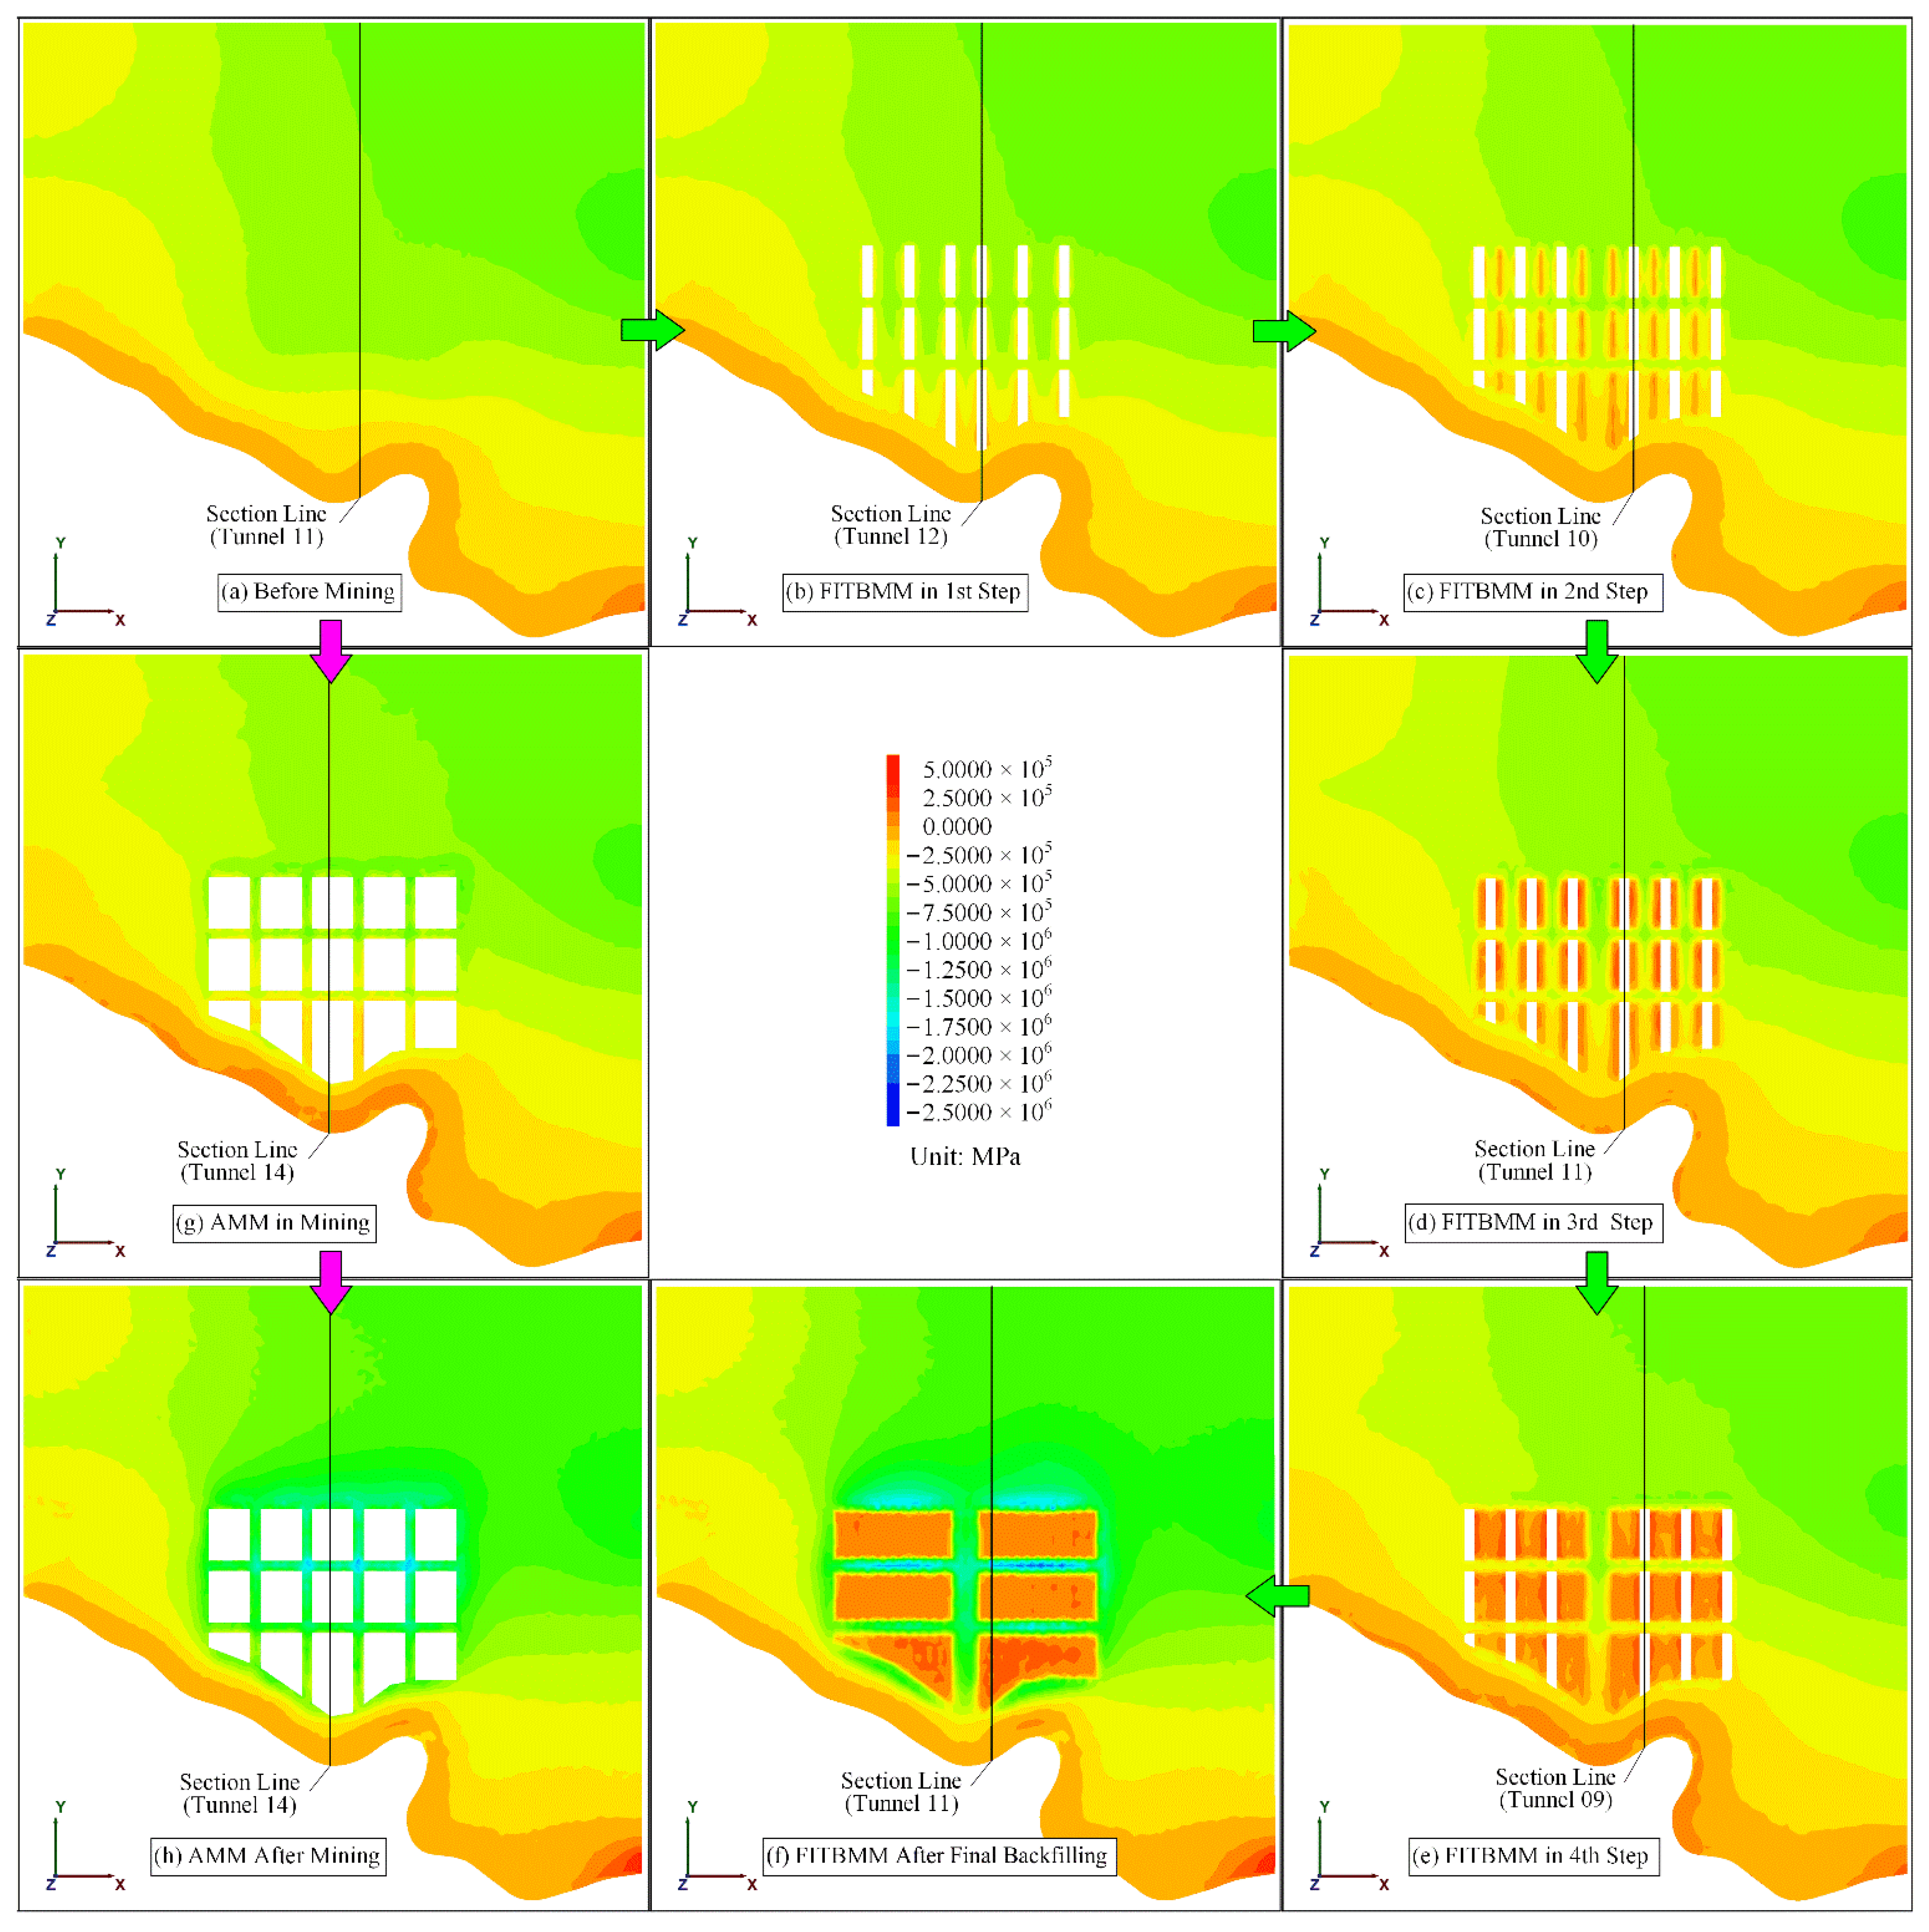
5.1. Maximum Principal Stress Results and Discussion

The maximum principal stress contours of FITBMM and AMM are shown in Figure 6 and Figure 7, and the results show that:
(1)
The changes of the maximum principal stress in the intermediate states of the two methods are not obvious; especially during the course of each mining step of FITBMM, the changes of the representative sections are not significant (Figure 6b), which reveals that the cemented backfill on both sides of the tunnels played a positive role.
(2)
The tensile stress is generally concentrated in the middle of the roof and floor (Figure 7); the tensile stress concentration phenomenon in the intermediate state of AMM is more obvious than that of FITBMM, and this is due to the supporting effect of the cemented backfill on the roof, and the lateral confinement effect on the sidewalls (Figure 7b).
(3)
In the final state, the maximum principal stress of the areas where the backfill is located is indeed higher than that of the pillars, forming a unique phenomenon of ‘stress reduction skylights of backfill’ (Figure 6f).
We compared the maximum principal stress values of the roof and floor of the representative sections in Figure 7, and the results are shown in Figure 8, which show that:
(1)
The maximum principal stress values of the roof and floor of FITBMM are similar in the 1st and 2nd steps (0.25 MPa and 0.22 MPa), while the 3rd and 4th steps are similar (0.37 MPa and 0.35 MPa); however, the values of the 3rd and 4th steps are slightly larger than those of the 1st and 2nd steps, because there are pillars on both sides of the tunnels in the 1st and 2nd steps, and cemented backfill in the 3rd and 4th steps; the value of the final state of FITBMM is 0.33 MPa.
(2)
The maximum principal stress values of the roof and floor of AMM in the intermediate and final states are 0.34 MPa and 0.35 MPa, respectively; the changes of the maximum principal stress values of the two methods as the mining progresses are not obvious, and their values are similar.

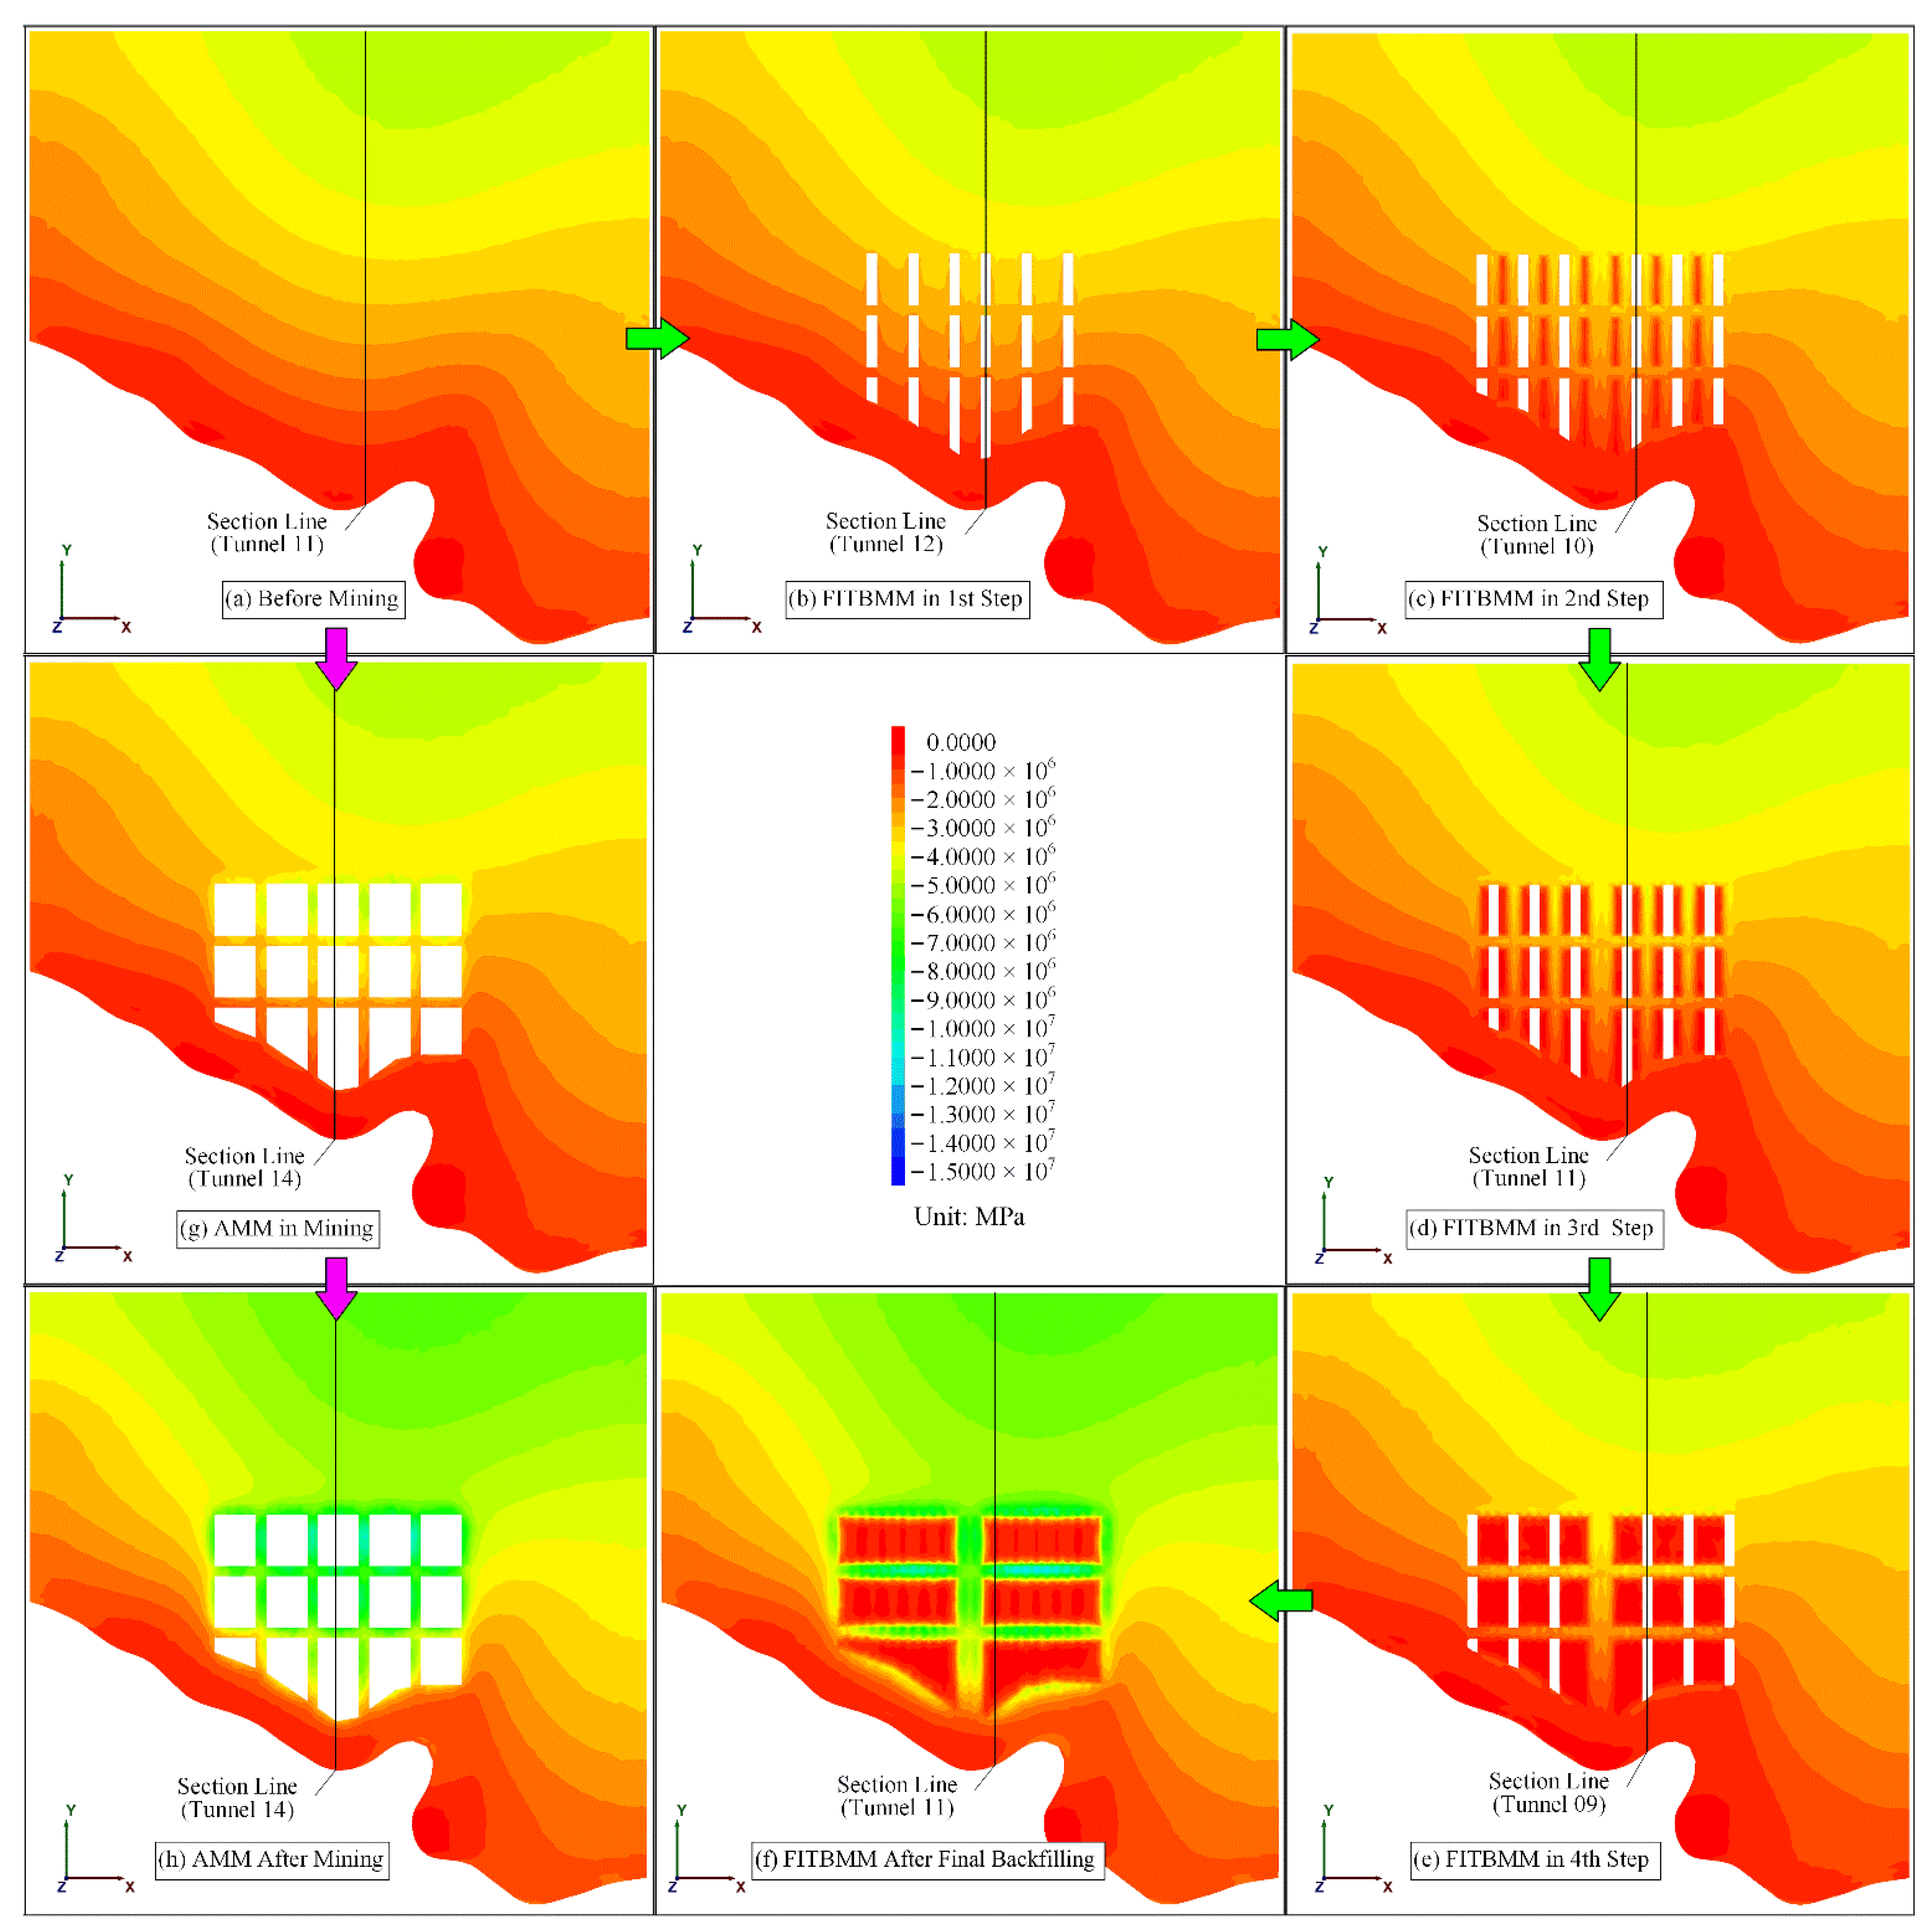
5.2. Minimum Principal Stress Results and Discussion

The minimum principal stress contours of FITBMM and AMM are shown in Figure 9 and Figure 10, and the results show that:
(1)
In the initial state, the higher the slope height of the model, the greater the compressive stress at the bottom; and the distribution of the minimum principal stress is layered (Figure 9a and Figure 10a).
(2)
Similarly to the maximum principal stress, during each mining step of FITBMM, due to the effect of the cemented backfill on both sides of the tunnels, the changes of the minimum principal stress distribution of the representative sections are not obvious (Figure 9b–e and Figure 10b–e); but the compressive stress concentration phenomenon has already emerged, with the pillars in the intermediate state of AMM (Figure 9g and Figure 10g).
(3)
In the final states of the two methods, the layered minimum principal stress distribution has been disrupted, and the minimum principal stress value in the area where the pillars are located is significantly reduced, which illustrates that the compressive stress is concentrated on the pillars (Figure 9h,f and Figure 10h,f).
(4)
In the final state, the minimum principal stress of the backfill is much higher than that of the pillars, and the ‘backfill stress skylight’ phenomenon is more obvious (Figure 9f).
The minimum principal stress values of the pillars on the representative sections are compared in Figure 10, and the results are shown in Figure 11, showing that:
(1)
The absolute value of the maximum principal stress of the pillars on the representative sections of the two methods gradually increases as the mining progresses; the increase of FITBMM in the four intermediate states is relatively gentle (from 3.10 MPa to 3.27 MPa, 3.47 MPa, 3.70 MPa, and 4.00 MPa), while the AMM increases rapidly (from 3.10 MPa to 6.50 MPa); the absolute value of the maximum principal stress in the final states of the two methods is much higher than that of the intermediate states (13.66 MPa for AMM and 11.79 MPa for FITBMM).
(2)
The absolute value of the maximum principal stress of AMM is greater than that of FITBMM, which indicates that the pillar compression of AMM is more significant, which is consistent with the conclusions obtained from the maximum principal stress contours.

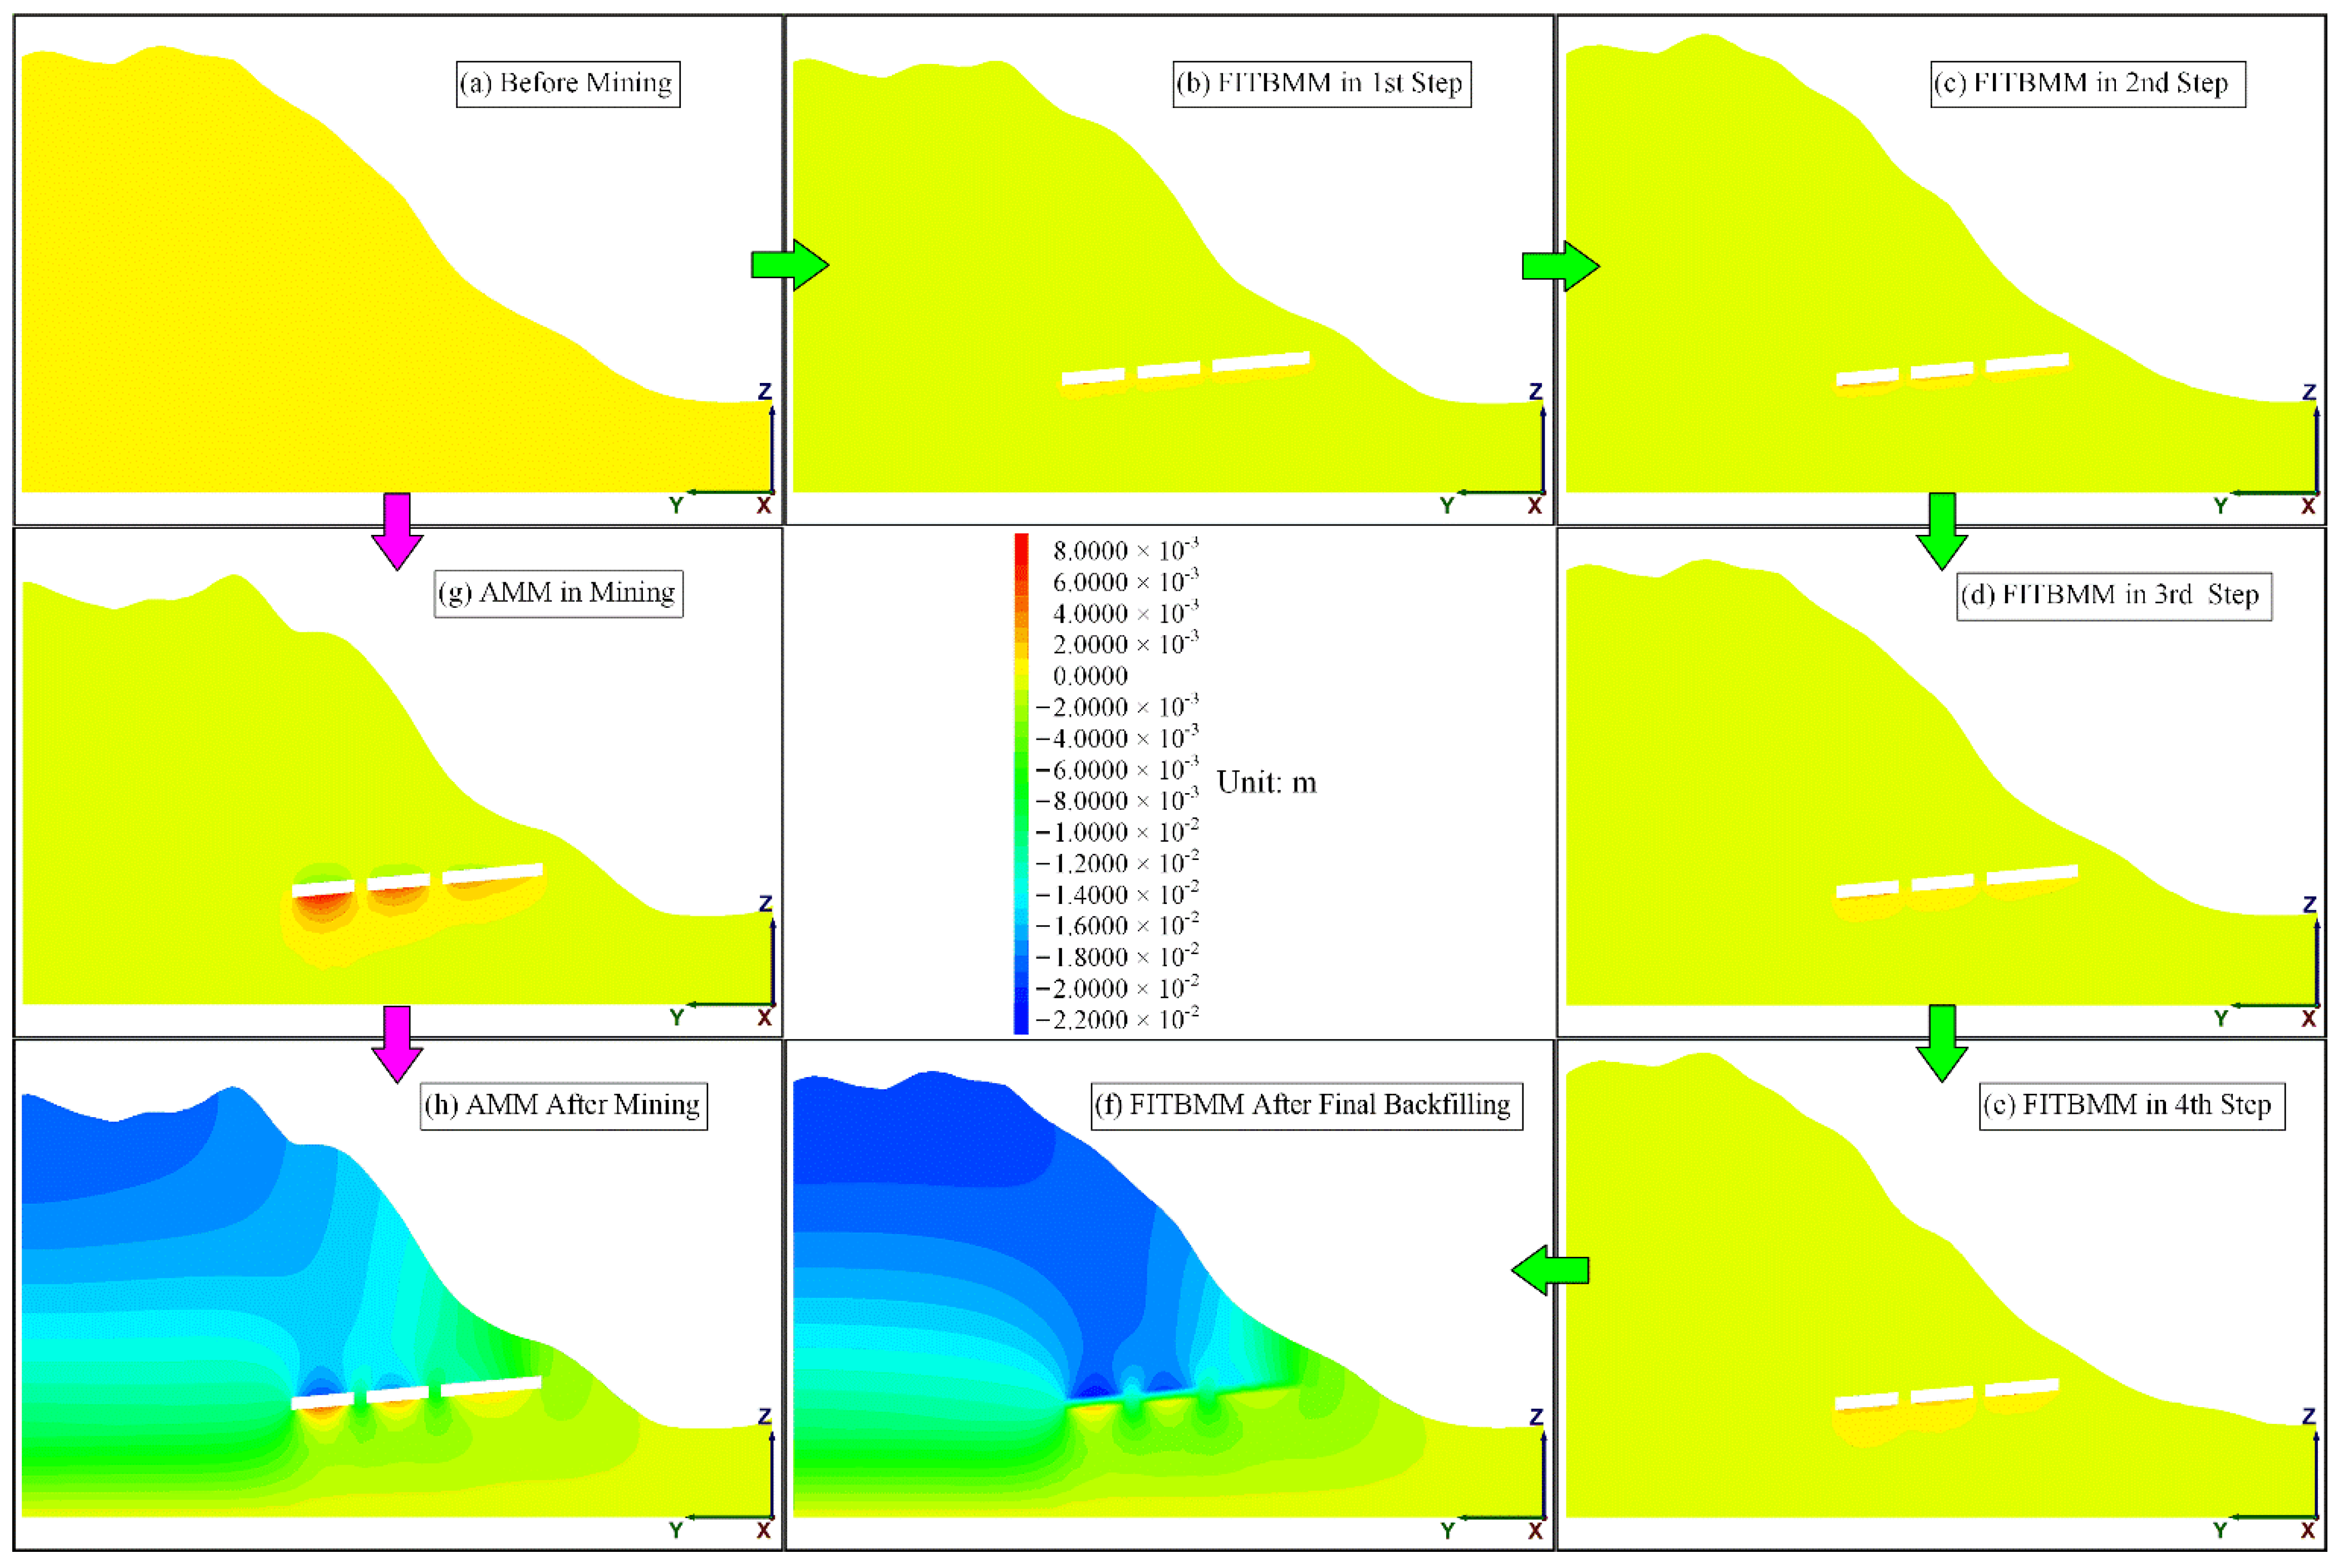
5.3. Z-Displacement Results and Discussion

The Z-displacement contours of the FITBMM and AMM on representative sections are shown in Figure 12, and the results show that:
(1)
Z-displacement first appears on the roof and floor of the stope, which is manifested as roof convergence and floor heave, and the middle of the roof and floor have the most significant displacement in the AMM intermediate state (Figure 12b–e,g).
(2)
In the final state (Figure 12h,f), the Z-displacement field gradually radiates upward and downward from the roof and floor; and the absolute value of the displacement keeps increasing, but the roof convergence of FITBMM is more obvious.
The displacement curves obtained from the seven displacement monitoring points are shown in Figure 13, and the results show that:
(1)
The convergence values of the surface and roof generally increase as the mining progresses; the convergence values rebound after reaching the maximum and finally tend toward a fixed value; the higher the monitoring point is located on the slope, the greater the convergence value.
(2)
The convergence values of the roof of FITBMM and AMM (P and P’) are greater than that of the surface (P1~P5), and the maximum convergence values of these two mining methods (2.08 cm for FITBMM and 1.64 cm for AMM) are within the safe allowable range.
(3)
The convergence values of the monitoring points located on the roof and surface of the FITBMM are greater than those of the AMM, which seems to be contrary to engineering experience. After analysis, the reasons for this may be: the FITBMM only keeps the north–south spacer pillar in the middle of the panel, while the AMM keeps four north–south spacer pillars evenly, that is, the overall mining width of the FITBMM (120 m × 50 m) is wider than that of the AMM (40 m × 50 m); moreover, the elastic modulus of the backfill is small, and it is prone to deformation, which has a limited inhibitory effect on roof convergence.

5.4. Plastic Zone Results and Discussion

The plastic zones of FITBMM and AMM are shown in Figure 14, and the results show that:
(1)
In each state, the pillars and backfill of the two methods have no failure units.
(2)
For FITBMM, tensile failure units appear on the roof of the tunnels in the four intermediate states; among these, the roof failure units of the 1st and 2nd steps are sporadic, and the plastic zone is not interconnected (Figure 14b,c); in the 3rd and 4th steps, a part of the roof has formed failure units, which has the risk of partial roof collapse (Figure 14d,e). For AMM, whether in the intermediate state or the final state, there is a large range of tensile failure units on the roof (Figure 14g,h).
(3)
These results show that the roof failure of the AMM is fairly serious, while the FITBMM is much better.

6. Conclusions

In this paper, based on the Dingxi mine plan to recover phosphate rock resources under HSRS, a numerical simulation study for different underground mining methods was carried out, to evaluate the problem of whether the FITBMM or AMM could be used for safe mining, and the following research results were obtained:
  • Regarding the stress distribution, the stress performance of different parts with the same mining conditions is obviously affected by the shape of the model. This shows the necessity of using a true-3D model to simulate mining orebodies under HSRS.
  • As mining progresses, the compressive stress gradually concentrates on the pillars, while the tensile stress generally concentrates on the middle of the roof and floor. This is the reason for the floor heave and roof convergence, and this also indicates that there may be a risk of roof collapse.
  • As for the FITBMM, because the backfill has a supporting and lateral confinement effect on the roof and the pillar, respectively, the partial stress of the pillar is transferred. Therefore, the area where the backfill is located presents a unique phenomenon of ‘stress reduction skylights of backfill’. Therefore, the roof failure of AMM is much more serious than for FITBMM. At the same time, the results show that the backfill mining method can effectively limit the surface deformation.
  • The stope structure parameters of the two mining methods involved in the comparison were not the same. The FITBMM keeps fewer pillars, and the ore recovery rate is higher (79.99% for FITBMM and 68.22% for AMM); moreover, the simulation results are superior to the AMM, which further demonstrates the advantage of the backfill mining method in mining such orebodies under HSRS. Therefore, FITBMM meets the requirements for the safe recovery of phosphate rock resources under HSRS.
  • In view of the risk of partial roof collapse in the 3rd and 4th steps of FITBMM, it is suggested that the width of the mining tunnel should be appropriately reduced during the actual mining, and a subsequent numerical simulation analysis should be carried out based on the reduced width of the mining tunnel.
This paper, taking Dingxi Mine in China as an example, highlights the advantages of the backfill mining method, by comparing the advantages and disadvantages of various mining methods with a high and steep slope. Finally, this paper can also serve as a guide and start a conversation, and we hope many more experts and scholars will become interested and engage in researching this field.

Author Contributions

Conceptualization, S.L.; validation, Q.Z.; investigation, X.W.; resources, B.H.; writing—original draft preparation, B.H.; writing—review and editing, H.Y., S.L. and H.W.; visualization, Q.Z.; supervision, X.W.; project administration, S.L.; funding acquisition, S.L. All authors have read and agreed to the published version of the manuscript.

Funding

This research was funded by the Natural Science Foundation of Hunan Province (Grant No. 2021JJ40745) and the National Natural Science Foundation of China (Grant No. 51804337).

Acknowledgments

First of all, authors give thanks for the financial support from the Natural Science Foundation of Hunan Province (Grant No. 2021JJ40745) and the Natural Science Foundation of China (Grant No. 51804337); Second, the authors express their gratitude to the Chinese experts in the research field of the backfill mining method for their efforts in the development of China’s mining industry; Finally, the authors express sincere thanks to Central South University.

Conflicts of Interest

The authors declare no conflict of interest.

References

  1. Wang, P.; Zhao, J.; Chugh, Y.P.; Wang, Z. A Novel Longwall Mining Layout Approach for Extraction of Deep Coal Deposits. Minerals 2017, 7, 60. [Google Scholar] [CrossRef] [Green Version]
  2. Qiu, X.Y.; Chen, J.Y.; Shi, X.Z.; Zhang, S.; Zhou, J.; Chen, X. Deformation prediction and analysis of underground mining during stacking of dry gangue in open-pit based on response surface methodology. J. Cent. South Univ. 2018, 25, 406–417. [Google Scholar] [CrossRef]
  3. del Ventisette, C.; Gigli, G.; Bonini, M.; Corti, G.; Montanari, D.; Santoro, S.; Sani, F.; Fanti, R.; Casagli, N. Insights from analogue modelling into the deformation mechanism of the Vaiont landslide. Geomorphology 2015, 228, 52–59. [Google Scholar] [CrossRef] [Green Version]
  4. Zhang, M.; Wu, L.Z.; Zhang, J.C.; Li, L.P. The 2009 Jiweishan rock avalanche, Wulong, China: Deposit characteristics and implications for its fragmentation. Landslides 2019, 16, 893–906. [Google Scholar] [CrossRef]
  5. Xu, T.; Xu, Q.; Deng, M.L.; Ma, T.H.; Yang, T.H.; Tang, C.A. A numerical analysis of rock creep-induced slide: A case study from Jiweishan Mountain, China. Environ. Earth Sci. 2014, 72, 2111–2128. [Google Scholar] [CrossRef]
  6. Edraki, M.; Baumgartl, T.; Manlapig, E.; Bradshaw, D.; Franks, D.M.; Moran, C.J. Designing mine tailings for better environmental, social and economic outcomes: A review of alternative approaches. J. Clean. Prod. 2014, 84, 411–420. [Google Scholar] [CrossRef]
  7. Pu, H.; Zhang, J. Research on protecting the safety of buildings by using backfill mining with solid. Procedia Environ. Sci. 2012, 12, 191–198. [Google Scholar]
  8. Yin, S.H.; Shao, Y.J.; Wu, A.X.; Wang, H.J.; Liu, X.H.; Wang, Y. A systematic review of paste technology in metal mines for cleaner production in China. J. Clean. Prod. 2020, 247, 21. [Google Scholar] [CrossRef]
  9. Dong, Y.; Shi, J.; Chen, Z.; Liu, G.; Li, L. Study on the Technology of Roadway Mining with Paste-like Backfill under Highway and Its Application. In Proceedings of the 2016 International Conference on Civil, Transportation and Environment, Guangzhou, China, 30–31 January 2016; Volume 78, pp. 1066–1070. [Google Scholar]
  10. Cao, P. Computational Rock Mechanics; Central South University Press: Changsha, China, 2015. [Google Scholar]
  11. Jing, L. A review of techniques, advances and outstanding issues in numerical modelling for rock mechanics and rock engineering. Int. J. Rock Mech. Min. Sci. 2003, 40, 283–353. [Google Scholar]
  12. He, L.; An, X.M.; Ma, G.W.; Zhao, Z.Y. Development of three-dimensional numerical manifold method for jointed rock slope stability analysis. Int. J. Rock Mech. Min. Sci. 2013, 64, 22–35. [Google Scholar] [CrossRef]
  13. Zou, P.; Zhao, X.; Meng, Z.; Li, A.; Liu, Z.; Hu, W. Sample Rocks Tests and Slope Stability Analysis of a Mine Waste Dump. Adv. Civ. Eng. 2018, 2018, 6835709. [Google Scholar] [CrossRef] [Green Version]
  14. Tao, Z.G.; Han, W.S.; Li, M.N.; Zheng, X.H. Numerical Simulation Analysis of Layered Slope Landslide Mechanism in Open Pit Mine. In Proceedings of the GeoShanghai 2018 International Conference: Rock Mechanics and Rock Engineering, Shanghai, China, 27–30 May 2018; Springer: Singapore, 2018. [Google Scholar]
  15. Khanal, M.; Adhikary, D.; Jayasundara, C.; Balusu, R. Numerical Study of Mine Site Specific Multiseam Mining and Its Impact on Surface Subsidence and Chain Pillar Stress. Geotech. Geol. Eng. 2016, 34, 217–235. [Google Scholar] [CrossRef]
  16. Li, Z.B.; Feng, G.Z.; Wang, W.P. Processes and behaviors of block topple avalanches resulting from carbonate slope failures due to underground mining. Environ. Earth Sci. 2016, 75, 26. [Google Scholar]
  17. Yang, X.J.; Hou, D.G.; Tao, Z.G.; Peng, Y.Y.; Shi, H.Y. Stability and remote real-time monitoring of the slope slide body in the Luoshan mining area. Int. J. Min. Sci. Technol. 2015, 25, 761–765. [Google Scholar] [CrossRef]
  18. Fraldi, M.; Cavuoto, R.; Cutolo, A.; Guarracino, F. Stability of tunnels according to depth and variability of rock mass parameters. Int. J. Rock Mech. Min. Sci. 2019, 119, 222–229. [Google Scholar] [CrossRef]
  19. Fraldi, M.; Guarracino, F. Limit analysis of collapse mechanisms in cavities and tunnels according to the Hoek–Brown failure criterion. Int. J. Rock Mech. Min. Sci. 2009, 46, 665–673. [Google Scholar] [CrossRef]
  20. Fraldi, M.; Gesualdo, A.; Guarracino, F. Influence of actual plastic hinge placement on the behavior of ductile frames. J. Zhejiang Univ. Sci. A 2014, 15, 482–495. [Google Scholar] [CrossRef]
  21. Guarracino, F. Remarks on the stability analysis of some thin-walled structures in the elastic-plastic range. Thin-Walled Struct. 2019, 138, 208–214. [Google Scholar] [CrossRef]
  22. Hu, B.Y.; Wang, X.M.; Li, S.; Zhao, J.W.; M, N. Eugenie, Stability Analysis and Confidence Level Evaluation of Backfill Mining under High and Steep Rock Slopes. Adv. Civ. Eng. 2018, 2018, 12. [Google Scholar]
  23. Brady, B.H.G.; Brown, E.T. Rock Mechanics for Underground Mining, 3rd ed.; Kluwer Academic Publishers: New York, USA, 2006. [Google Scholar]
  24. Morelli, G.L. Alternative Quantification of the Geological Strength Index Chart for Jointed Rocks. Geotech. Geol. Eng. 2017, 35, 2803–2816. [Google Scholar] [CrossRef]
  25. Tang, J.X.; Dai, Z.Y.; Wang, Y.L.; Zhang, L. Fracture Failure of Consequent Bedding Rock Slopes After Underground Mining in Mountainous Area. Rock Mech. Rock Eng. 2019, 52, 2853–2870. [Google Scholar] [CrossRef]
  26. Liu, Z.X.; Tang, Z.X.; Wang, W.H.; Sun, J.J.; Peng, K. New algorithm of mine slope reliability based on limiting state hyper-plane and its engineering application. J. Cent. South Univ. 2015, 22, 317–322. [Google Scholar] [CrossRef]
  27. Li, X.B.; Zhou, Z.L.; Zhao, G.Y.; Liu, Z.X. Utilization of phosphogypsum for backfilling, way to relieve its environmental impact. Gospod. Surowcami Miner.-Miner. Resour. Manag. 2008, 24, 225–232. [Google Scholar]
  28. Rong, K.W.; Lan, W.T.; Li, H.Y. Industrial Experiment of Goaf Filling Using the Filling Materials Based on Hemihydrate Phosphogypsum. Minerals 2020, 10, 324. [Google Scholar] [CrossRef] [Green Version]
  29. Li, X.B.; Zhou, Y.N.; Zhu, Q.Q.; Zhou, S.T.; Min, C.D.; Shi, Y. Slurry Preparation Effects on the Cemented Phosphogypsum Backfill through an Orthogonal Experiment. Minerals 2019, 9, 31. [Google Scholar] [CrossRef] [Green Version]
Figure 1. (Source elaborated by authors) The HSRS location and true-3D model. (a) the location of HSRS and prohibited area; (b) the true-3D model of HSRS.
Minerals 12 00123 g001
Figure 2. (Source elaborated by authors) The ‘Orebody’ (mining area) viewed from the—Z direction, when the ‘Hangingwall’ and ‘Footwall’ are hidden: (a) the mining state of the FITBMM when the 1st step tunnels have been mined; (b) the mined state of the AMM when all rooms have been mined. Point P for the FITBMM, point P’ for the AMM.
Minerals 12 00123 g002
Figure 3. (Source elaborated by authors) Test process photos: (a) phosphogypsum sampling; (b) backfill slurry preparation; (c) casting mold; (d) test blocks formation; (e) test block maintenance; (f) laboratory tests.
Minerals 12 00123 g003
Figure 4. (Source elaborated by authors) Schematic diagram of the dynamic mining process of FITBMM. 1—Connection rise entries; 2—Haulage drifts; 3—Backfill blocking walls; 4—Spacer pillars of the panel; 5—1st step mining tunnels; 6—2nd step mining tunnels; 7—3rd step mining tunnels; 8—4th step mining tunnels; 9—1st step backfill; 10—2nd step backfill; 11—3rd step backfill.
Minerals 12 00123 g004
Figure 5. (Source elaborated by authors) Location diagram of the Z-displacement monitoring points. P1–P5: five surface displacement monitoring points, point P’ for the AMM.
Minerals 12 00123 g005
Figure 6. (Source elaborated by authors) The maximum principal stress contours of the ‘Orebody’ viewed from the Z direction, when ‘Hangingwall’ and ‘Footwall’ are hidden: (a) before mining; FITBMM: (b) when the 1st step tunnels have been mined, (c) when the 2nd step tunnels have been mined, (d) when the 3rd step tunnels have been mined, (e) when the 4th step tunnels have been mined, (f) equilibrium state after final backfilling; AMM: (g) when all rooms have been mined, (h) equilibrium state after mining.
Minerals 12 00123 g006
Figure 7. (Source elaborated by authors) The maximum principal stress contours of representative sections at different model positions, viewed from the X direction (all states are the same as Figure 6).
Minerals 12 00123 g007
Figure 8. (Source elaborated by authors) The maximum principal stress of the roof and floor of FITBMM and AMM on representative sections.
Minerals 12 00123 g008
Figure 9. (Source elaborated by authors) The minimum principal stress contours of the ‘Orebody’ viewed from the Z direction, when the ‘Hangingwall’ and ‘Footwall’ are hidden (all states are the same as in Figure 6).
Minerals 12 00123 g009
Figure 10. (Source elaborated by authors) The minimum principal stress contours of representative sections at different model positions viewed from the X direction (all states are the same as in Figure 6).
Minerals 12 00123 g010
Figure 11. (Source elaborated by authors) The minimum principal stress of the pillars of FITBMM and AMM on representative sections.
Minerals 12 00123 g011
Figure 12. (Source elaborated by authors) The Z-displacement contours of representative sections at different model positions, viewed from the X direction (all states are the same as in Figure 6).
Minerals 12 00123 g012
Figure 13. (Source elaborated by authors) Z-displacement curves of the monitoring points.
Minerals 12 00123 g013
Figure 14. (Source elaborated by authors) The plastic zone distribution of FITBMM and AMM viewed from below, when the ‘Footwall’ is hidden (all states are the same as Figure 6).
Minerals 12 00123 g014
Table 1. Hoek–Brown constants of rock mass.
MaterialsGSImiDmbsaσc (MPa)
Hangingwall6590.052.4970.01920.50255.00
Orebody6890.052.7870.02690.50261.63
Footwall6070.101.5560.01010.50330.00
Table 2. The calculation parameters of the model.
MaterialsElastic Modulus
(×103 MPa)
Compressive Strength
(MPa)
Tensile Strength
(MPa)
Poisson’s RatioVolume–Weight
(×103 N·m−3)
Cohesion
(MPa)
Internal Friction Angle (°)
Hangingwall17.1512.7360.4220.3027.273.40733.70
Orebody21.5715.4670.5950.2628.744.06334.57
Footwall9.255.3800.1940.3126.931.56129.76
1st and 2nd
step backfill
0.342.4800.4100.2519.221.01046.22
3rd and 4th
step backfill
0.101.7900.1900.2819.130.58040.78
Publisher’s Note: MDPI stays neutral with regard to jurisdictional claims in published maps and institutional affiliations.

