Article

Design and Application of a Rock Porosity Measurement Apparatus under High Isostatic Pressure

1
Key Laboratory of High-Temperature and High-Pressure Study of the Earth’s Interior, Institute of Geochemistry, Chinese Academy of Sciences, Guiyang 550081, China
2
College of Earth and Planetary Sciences, University of Chinese Academy of Sciences, Beijing 100049, China
*
Author to whom correspondence should be addressed.
Minerals 2022, 12(2), 127; https://doi.org/10.3390/min12020127
Submission received: 16 December 2021 / Revised: 14 January 2022 / Accepted: 20 January 2022 / Published: 21 January 2022
(This article belongs to the Special Issue High-Pressure Physical and Chemical Behaviors of Minerals and Rocks)

Abstract

:
Rock porosity is a key physical parameter at room temperature and pressure that plays an important role in evaluating reserves of oil and natural gas. Research on rock porosity spans over a hundred years. However, in situ porosity under a high isostatic pressure has not been adequately explored, and the experimental conditions for measuring porosity remain unclear. To investigate the feasibility of porosity measurement under a high isostatic pressure and the optimal choice of experimental conditions for this, we design an experimental apparatus that can achieve isostatic pressure up to 200 MPa to fit the relationship between the void volume of a given sample and the drop in gas pressure in an empty standard chamber. The effect of experimental parameters, such as the initial gas pressure at the inlet, the time needed for the gas to reach equilibrium, and the time needed for vacuuming, on the porosity experiment was examined. A series of porosity experiments under different isostatic pressures of up to 200 MPa were carried out with this apparatus. The results quantitatively verify the degree to which porosity is related to isostatic pressure.

1. Introduction

Porosity is an essential parameter in the study of reservoir physics and solid earth physics because it provides empirical support for the evaluation of reserves of oil and natural gas as well as the interpretation of anomalies in the velocities of crustal waves [1,2,3]. In general, it is described as the ratio of the volume of voids in a given sample to the total volume of the sample, and is usually expressed as a percentage [4,5].
To obtain the porosity of reservoirs, some porosity-logging methods have been proposed, these methods evaluate porosity based on empirical data, such as continuous or interval velocity logging [6,7,8], Neutron logging [9], Density logging [10], and nuclear magnetic resonance (NMR) well logging [11]. However, geological structures are complex, and logging methods measure porosity fluctuations significantly and exhibit large errors. To better calibrate the logging analysis or investigate rock porosity more precisely, laboratory techniques for measuring porosity have been developed. The relevant methods are divided into two categories, one is the direct observation method, including X-ray computed tomography (CT) [12,13], core porosity measurement using gamma rays [14], and thin sections analysis [15]. The other is the experimental method, including mercury intrusion porosimetry (MIP) [16], the pressure/mass method [17], and the gas expansion method [18,19,20].
The direct observation methods could intuitively obtain the texture of interconnected and isolated rock voids. Unfortunately, only the type of interconnected voids was of value to our practical application. The information of isolated rock voids may interfere with the accuracy of interconnected pore statistics. Consequently, the experimental method has been commonly adopted to evaluate rock porosity. The MIP occurs through the injection of mercury into rock pores, which can be used to roughly estimate the porosity of rocks. However, rock voids in different reservoirs are different by genesis, pore morphology, and size. Rocks generally cannot be wetted by mercury. In order to inject mercury into the rock pore, the external pressure is applied. This operation often results in damage to the sample [18,21]. By contrast, the gas expansion method, which is based on Boyle’s law, has been adopted as a more popular method for measuring porosity [22]. The measurement gas medium of this method usually includes air, nitrogen, argon, or helium. All of these gas mediums have a lower viscosity than that of liquid, and can enter certain fine pores that liquid is unable to penetrate [23,24].
Although it has been studied extensively at room temperature and ambient pressure, rock porosity at high confining pressure (equal on all sides) has not been adequately explored in research. In general, with the increase in confining pressure, rock voids decrease, some of them even close completely, which leads to the decrease in rock porosity
However, the existing experimental conditions under room temperature and ambient pressure cannot reflect the state of rock pores under high confining pressure. In addition, the existing experimental equipment had difficulty meeting the experimental requirements. Due to the thin wall thickness of the core holder and its poor sealing performance at high confining pressures, the core holder can hardly perform effectively at high confining pressures [25,26]. The available high-pressure pressurization device has difficulty providing the target confining pressure. Attempts have been made to determine rock porosity under confining pressures and temperature [27,28], the confining pressure generally used is not more than 90 MPa. Furthermore, due to the separated axial and radial pressures, the confining pressure belongs to non-isostatic pressure [29]. Thus, it is essential to solve the pressure resistance and the sealing performance of the core holder under high confining pressure in order to be able to measure rock porosity at a high confining pressure. We propose that the confining pressure on the sample in the experiment is isostatic pressure.
In this paper, we first built a porosity measurement device that was used for 200 MPa confining pressure by taking the autoclave in the laboratory as a sample holder. We also tested the porosity of sandstone at different confining pressures of up to 200 MPa. Meanwhile, some experimental parameters were preliminarily explored in the proposed apparatus.

2. Principle of Experiment

The common reservoir rocks include limestone, dolomite, sandstone, and shale, all of which consist of a matrix and a void. There are two types of void space, both interconnected and isolated. The effective porosity includes only voids that are interconnected [30]. The porosity measured by the proposed apparatus is the effective porosity. It is defined as
Ø e f f = V i v V b
where Ø e f f is the effective porosity, and V i v and V b are the volume of the interconnected void and the bulk volume, respectively.
Based on the gas expansion method, we built a measuring porosity platform on the autoclave in the laboratory, as shown in Figure 1. The principle of porosity measurement is Boyle’s law. If the gas pressure was low enough and the temperature was not too low, then Boyle’s law was approximately followed. This law is not dependent on the type of gas. In this apparatus, argon was used as test medium.
We defined the empty volume between needle valve 2 and needle valve 3 as the standard chamber, and between needle valve 2, needle valve 4, and the autoclave as the sample chamber. The connections between needle valves and other devices are through some capillary tubes with an inner diameter of 1/32 inch and an outer diameter of 1/16 inch. The empty volume of the standard chamber is composed of capillary pore volume, valve passage volume, and the inner void volume of pressure sensor. In addition, the empty volume of the sample chamber is composed of capillary pore volume, valve passage volume, the volume of autoclave plug hole, and sample pore volume. Owing to the small and irregular volume of the standard and sample chambers of this platform, the empty volumes of the two parts could not be measured by the direct method. Therefore, we used the system calibration method to avoid measuring the empty volume. The bulk volume of the rock was calculated by the volumetric formula, and its diameter and height were measured with a caliper.
Compared with previous devices, a vacuum pump was added, which was manufactured by Zhejiang Value Mechanical & Electrical Products Co., Ltd. (Taizhou, China), with an ultimate vacuum pressure of 2 × 10⁻¹ Pa. Meanwhile, the automatic pressurized pump supported the confining pressure of the sample instead of the hydraulic oil pump, whose nominal pressure was 30,000 psi (≈207 MPa). In addition, high-precision digital pressure sensor, manufactured by Xi‘an Holder Instrument Co., Ltd. (Xi’an, China), with an accuracy class of ±0.1% F-S., was a part of the platform.

3. Experimental Section
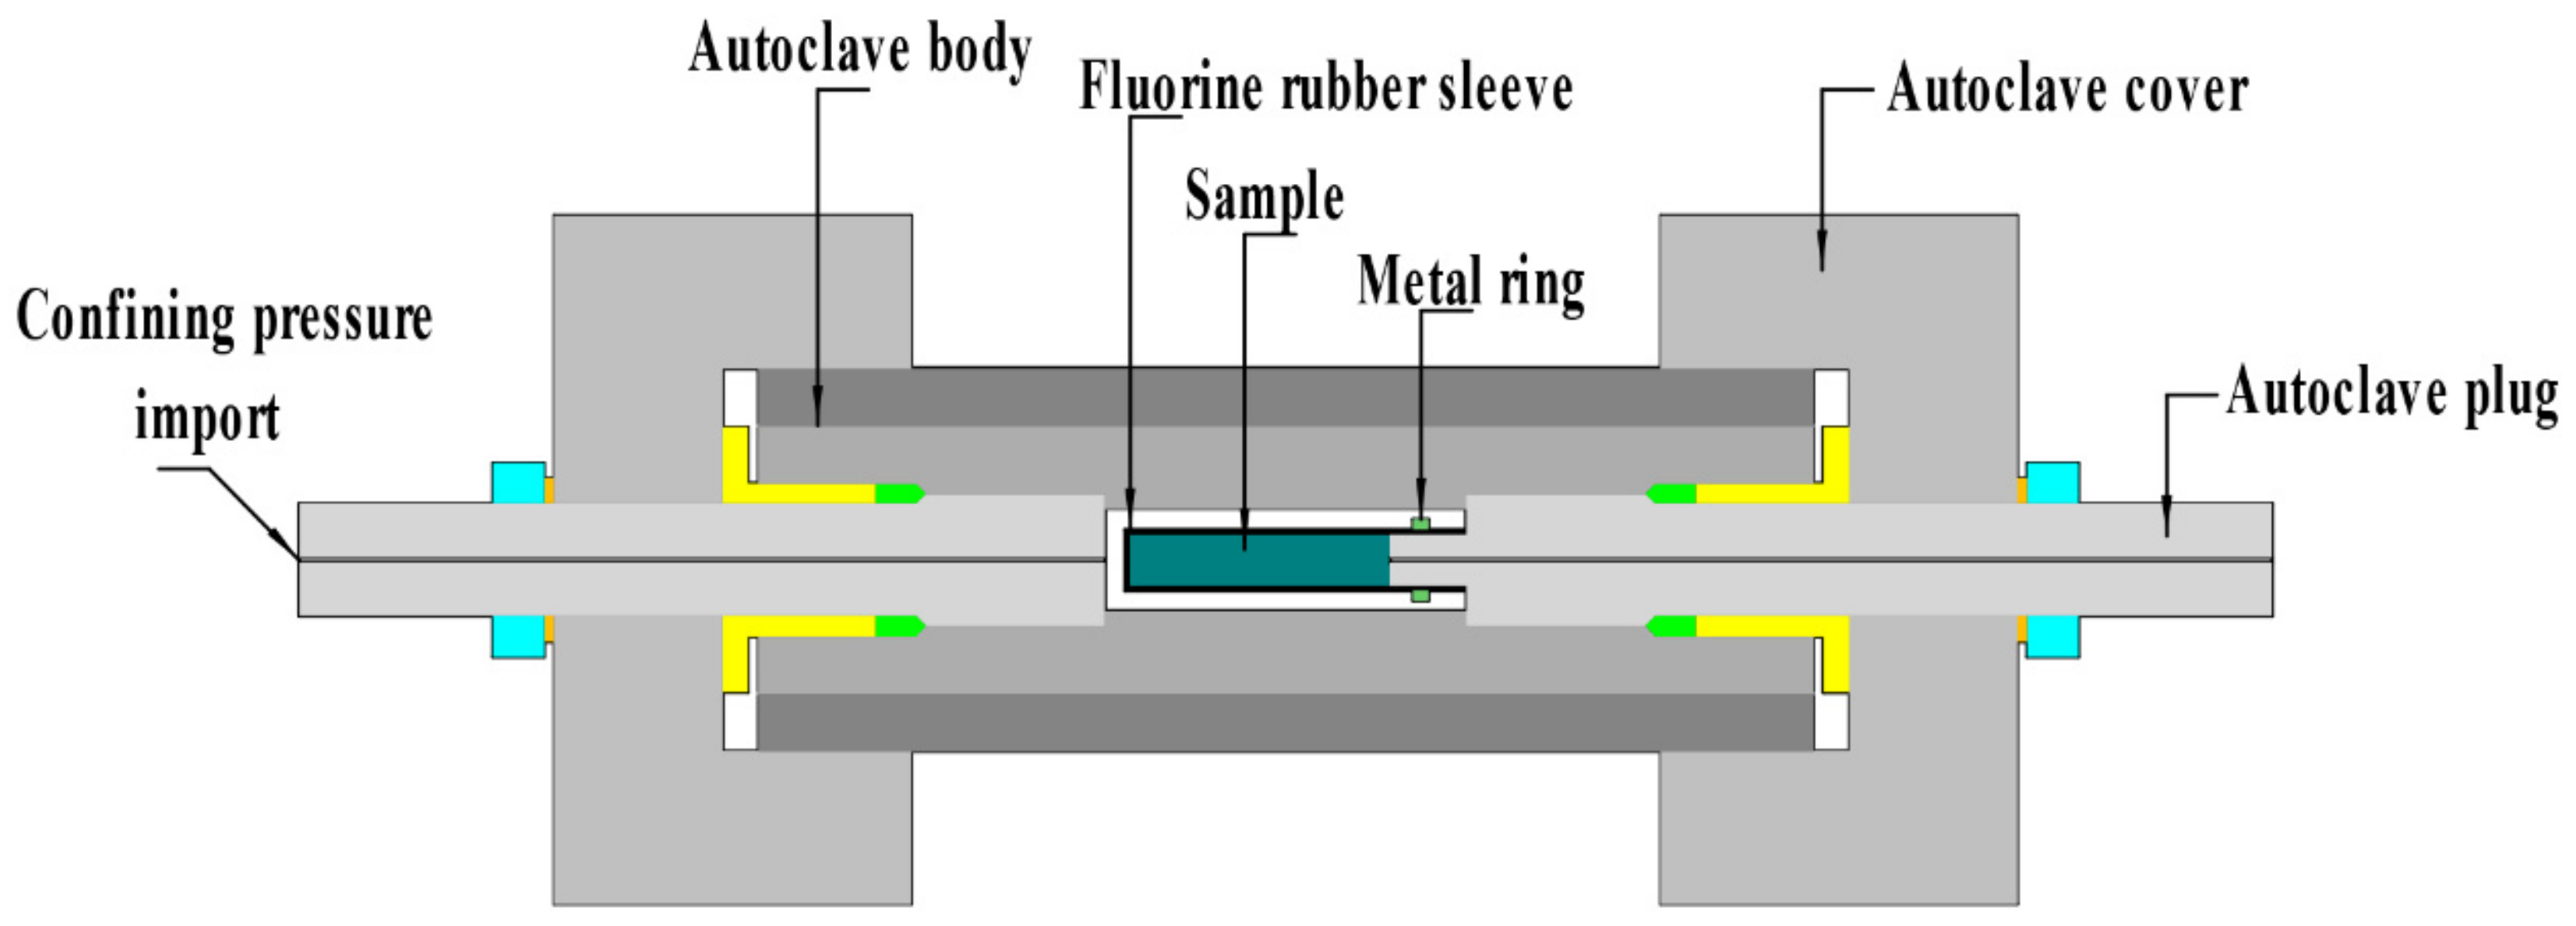
3.1. Sample Holder

As shown in Figure 2, the autoclave was used as the sample holder, which was crucial to the proposed porosity measurement apparatus. Due to the requirement for permeability measurements, on the side of the sample holder used by other investigators a port was opened for pressurizing confining pressure. The opened port would reduce its strength, therefore, the sample holder only withstood 90 MPa [31,32]. The proposed porosity measurement apparatus was only used for measuring porosity, thus, the side of the sample holder that did not open a port met our requirements. The apparatus consists of double metal thick-walled cylinders, the material of the inner cylinder is TC11 (tensile strength ≥1030 MPa, yield strength ≥900 MPa), the material of the outer cylinder is SUS 321 (tensile strength ≥550 MPa, yield strength ≥220 MPa). The safety factor was selected as 2.5, and the autoclave could withstand at least 400 MPa of pressure after a strength check.
The sample holder was mainly composed of an autoclave, two autoclave plugs with center hole, a fluorine rubber sleeve, a 304 stainless steel-ring, and metal/rock sample. The sample was wrapped with a fluorine rubber sleeve, and then connected to the end of the autoclave plug by the fluorine rubber sleeve. The connection between fluorine rubber sleeve and the end of the autoclave plug was tightened with a 304 stainless steel-ring. The sample holder could protect the sample from water immersion at a confining pressure of 200 MPa. The fluorine rubber sleeve was approximately 1 mm thick, and soft enough to conform to sample sides at low isostatic pressure [29]. The elastic modulus of the rubber sleeve was very small. Thus, in order to achieve a tight fit between the sample and the rubber sleeve, the initial isostatic pressure was set to 1 MPa.

3.2. Calibration of Equipment

A total of eleven 304 stainless steel cylindrical samples, each with a diameter of 10 mm and a height of 25 mm, were selected as the set of calibration samples. Different cylindrical samples contained different center-bored volumes, as shown in Figure 3a. The theoretical porosity of these samples was set to 0, 1%, 2%, 3%, 4%, 5%, 6%, 7%, 8%, 9%, and 10%. However, their practical porosity after processing is shown in Table 1.
The porosity measurement apparatus was placed into a thermostatically controlled room, whose temperature was kept at 25 °C (±0.5 °C). The calibration of designed apparatus was performed as follows:
(1)
One calibration sample was placed inside the fluorine rubber sleeve each time, assembling the entire platform.
(2)
Needle valve 2 was closed and Needle valve 4 was opened at the same time. To make the fluorine rubber sleeve tightly fit the surface of sample, the sample chamber was vacuumed.
(3)
To keep the sample under confining pressure of 1 MPa, pure water was pumped to pressurize the sample holder through an automatic pressure manual pump.
(4)
To eliminate the vacuum of sample chamber, especially in sample, the sample chamber was injected with a certain amount of argon and kept for a while.
(5)
To keep the initial pressure conditions consistent, argon, at a constant pressure of 180 kPa (±0.03 kPa), was pumped into the standard chamber.
(6)
In order that the initial pressure of sample chamber was equal to atmospheric pressure, the top outlet of Four-way valve was opened.
(7)
A few minutes later, the top outlet of Four-way valve was closed. For removing air from sample chamber, the sample chamber was vacuumed again. Meanwhile, the vacuuming time was set to 75 s so that the vacuum pressure of the sample chamber was consistent in each experiment.
(8)
To flow argon into the sample chamber, Needle valve 4 was closed and then Needle valve 2 was opened. The value of equilibrium pressure was recorded when the gas pressure reached equilibrium states.
(9)
In order to reduce the measurement error, the calibration experiment was repeated three times. The drop in gas pressure was calculated by averaging the three equilibrium pressures.
The graph between the drop in gas pressure and pore volume is shown in Figure 4. The fitting function y = 0.00005 x 2 + 0.0409 x + 46.597 was thus obtained.
Under high isostatic pressure, the experimental confining pressure of our device went up to 200 MPa. We assumed that the elastic modulus of the rock grain was sufficiently large and that the change in its bulk volume could be ignored. Only the change in the volume of the rock void when the change in confining pressure was considered. Therefore, this fitting function is also applicable under high isostatic pressure.

3.3. Testing of Equipment

To verify the calibration, copper samples with voids of different sizes, as shown in Figure 3b, were used for testing. Their basic sizes and theoretical voids are shown in Table 2. The deviation in the test volume of the sample was less than 3.31 mm3, and the corresponding porosity deviation was 0.41%. The porosity deviation was less than 0.5%, which is the maximal deviation that a common commercial measuring instrument for porosity is permitted.

4. Results and Discussion

As shown in Figure 3c, two cylindrical samples of sandstones were processed for the measurement experiment with the proposed apparatus. The basic dimensions of the sandstones are shown in Table 3.
The sandstones used in the laboratory were sourced from Lai Shui County in Hebei Province, China. The sandstones were cored and processed to an appropriate size, and oven-dried at 42 °C (±1 °C) for 20 h. Before porosity testing, the permeability of the sandstones was first tested by the pressure drop method, and these results are as shown in Figure 5. Although the permeability of the two sandstones exhibited some differences, permeability measurements indicated that effective porosity can be adequately measured by the designed apparatus. The isostatic pressure increased from 1 MPa to 200 MPa, and the porosity of the sandstones was then measured. as shown in Figure 6.
In general, hydrostatic volumetric compaction is exponentially related to stress, which also means that porosity is exponentially related to stress [33]. According to the fitted power function, the fitting functions of sandstone 1 and sandstone 2 were obtained as y = 0.0541 × x−0.326, R2 = 0.9891, and y =0.0565 × x−0.312, R2 = 0.9716, respectively. To reach a porosity of 0.5%, 1.49 GPa of pressure was required for sandstone 1 and 2.37 GPa for sandstone 2. These results indicate obvious differences in the porosity of different sandstones, where this decreases markedly with increasing hydrostatic pressure. From a previous study, we know that narrow cracks are first closed in sandstone and that the closure pressure is very low. However, when the cavities of porous quartz sandstone achieve an aspect ratio of 1/10, its closure pressure increases significantly up to 10 GPa [34].
Some experimental parameters were not discussed in detail in a previous study [35], which easily caused systemic error. Therefore, these parameters deserved to be considered for the proposed apparatus, such as the time needed for vacuuming, choosing the initial gas pressure, and selection of the gas pressure equilibrium time.

4.1. Time Needed for Vacuuming

In each experiment, there are two vacuums. To verify sample tightness before calibrating the sample, the sample chamber was vacuumed in advance of the supply confining pressure, which could form self-sealing and reduce the clearance error between the sample and fluorine rubber sleeve. In addition, the sample chamber was vacuumed before measuring porosity, which could reduce the interference of air inside the sample chamber.
To reduce the error caused by vacuum gauges, we did not add it to the system in the actual measurements. The vacuum pressure was determined by controlling the time needed for vacuuming. The vacuum gauge was mounted on top of the sample chamber—the error was ±0.5% F-S, and the sample chamber was vacuumed. The initial pressure was nearly 86.88 kPa at atmospheric pressure. After three repetitions of vacuuming, the vacuum pressure at different times was approximately the same, and was less than 1 kPa after more than 75 s. Meanwhile, the vacuum pressure can increase by approximately 0.52 kPa in 30 s or 0.73 kPa in 60 s. However, the operation time is usually less than 5 s; that is, the operation has little effect on the experimental results. Furthermore, the longer the time needed for vacuuming was, the smaller the vacuum degree could reach. To significantly improve measurement accuracy, we chose 75 s as the time needed for vacuuming.

4.2. Choosing Initial Gas Pressure

According to Boyle’s law of gases, the lower the gas pressure is, the closer a gas is to an ideal gas. We used a high-precision digital pressure sensor with a measuring range of 0–200 kPa, consistent with the experimental requirements. To determine an appropriate initial pressure, 120 kPa,150 kPa, and 180 kPa were selected as candidate initial pressures to observe gas changes after pressure equilibrium had been reached. As shown in Figure 7, the linear fitting functions were, y = 0.005x + 127.36, y = 0.008x + 107.14, and y = 0.027x + 87.67, respectively. When the initial gas pressure was 180 kPa, the magnitude of the pressure change over time was small after equilibrium in gas pressure had been reached, that is, the slope was the smallest. We infer that this result was caused by ambient temperature interference. To reduce this interference, we chose 180 kPa as the initial gas pressure.

4.3. Selection of the Gas Pressure Equilibrium Time

Compared to the metal sample, the rock sample including many micropores and pore canals that were extremely tortuous, thus, the time that gas pressure reached equilibrium was long in the rock sample porosity testing, which would also influence the measurement accuracy of rock porosity. Moreover, the gas pressure was also influenced by the ambient temperature. Therefore, the choice of gas pressure equilibrium time was important. To maximize the measurement accuracy of rock porosity, we selected the time within 1 min of when there was a drop of 0.2 kPa, and this was considered as the gas pressure equilibrium time. The gas pressure equilibrium time was generally more than 25 min unless the gas pressure stopped falling before then.

5. Conclusions

The rock porosity measuring apparatus that took the autoclave as the sample holder was built, which can achieve porosity determination under a high isostatic pressure of up to 200 MPa. The measurement error of the proposed apparatus after calibration achieved the same level as similar instruments. Furthermore, the porosity of sandstones under high isostatic pressures only had a small variation of less than 0.5%. Finally, a series of experiments were conducted to investigate the effects of experimental conditions on porosity measurements under different confining pressures. The main conclusions are as follows: (1) Increasing the initial gas pressure helps reduce the effect of ambient temperature on the porosity measurement results. (2) At the beginning of gas equilibrium, the pressure drop was quick but slowed down thereafter. In general, the gas pressure reached equilibrium in 25 min or sooner.
However, the temperature of the Earth’s interior also influences the porosity of rocks, and should be considered in future work. Moreover, the other physical properties of rocks in the interior of the crust need to be examined.

Author Contributions

Conceptualization and methodology, H.L.; investigation, L.L.; preparation of experimental samples, L.L.; design and construction of experimental apparatus, H.L., L.L., H.Z., S.L. (Sen Lin) and S.L. (Shengbin Li); experimental analysis, H.L., L.L. and H.Z.; plotting, L.L.; writing—original draft preparation, L.L.; writing—review and editing, H.L., L.L., H.Z., S.L. (Sen Lin) and S.L. (Shengbin Li). All authors have read and agreed to the published version of the manuscript.

Funding

This study was supported by the Major State Research Development Program of China (Grant No. 2016YFC0601101), the National Natural Science Foundation of China (Grant No. 41827802), and the Science and Technology Foundation Project in Guizhou Province ([2019]1316).

Data Availability Statement

The data that support the findings of this study are available from the corresponding author upon reasonable request.

Acknowledgments

We thank Senior Engineer Shuangming Shan for providing the rock samples, and three anonymous reviewers and the editor for their helpful comments and suggestions.

Conflicts of Interest

The authors declare no conflict of interest.

References

  1. Lebedev, E.; Ryzhenko, B.; Dorfman, A.; Zebrin, S.; Sokolova, N.; Burkhardt, H.; Morig, R.; Wulff, A. Influence of fluids on the elastic properties of sandstone at high pressure and temperature. Geophys. Res. Lett. 1996, 23, 3115–3118. [Google Scholar] [CrossRef]
  2. Pan, L.; Jones, S.; Wang, X.; Guan, W.; Li, L. Re-evaluation of the porosity measurements under different confining pressures: A better appraisal of reservoir porosity. AAPG Bull. 2019, 103, 515–526. [Google Scholar] [CrossRef] [Green Version]
  3. Liu, S.; Wang, H.; Xu, W.; Xiang, Z. The influence of water saturation and confining pressure to gas porosity and permeability of sandstone. Environ. Earth Sci. 2019, 78, 182. [Google Scholar] [CrossRef]
  4. Beranek, L. Acoustic impedance of porous materials. J. Acoust. Soc. Am. 1942, 13, 248–260. [Google Scholar] [CrossRef]
  5. Stumpf, F. Porosity-measurement apparatus. Am. J. Phys. 1960, 28, 503–504. [Google Scholar] [CrossRef]
  6. Wyllie, M.; Gregory, A.; Gardner, L. Elastic wave velocities in heterogeneous and porous media. Geophysics 1956, 21, 41–70. [Google Scholar] [CrossRef]
  7. Kassab, M.; Weller, A. Porosity estimation from compressional wave velocity: A study based on Egyptian sandstone formations. J. Pet. Sci. Eng. 2011, 78, 310–315. [Google Scholar] [CrossRef]
  8. Domenico, S. Sandstone and limestone porosity determination from shear and compressional wave velocity. Geophysics 1984, 49, 637. [Google Scholar] [CrossRef]
  9. Ge, Y.; Wu, W.; Wang, R.; Fu, X.; He, L. Thermal neutron cross section logging based on compensated neutron logging. Appl. Radiat. Isot. 2020, 166, 109317. [Google Scholar] [CrossRef]
  10. Yu, H.; Sun, J.; Wang, J.; Gardner, R. Accuracy and borehole influences in pulsed neutron gamma density logging while drilling. Appl. Radiat. Isot. 2011, 69, 1313–1317. [Google Scholar] [CrossRef]
  11. Mitchell, J.; Fordham, E. Contributed review: Nuclear magnetic resonance core analysis at 0.3 T. Rev. Sci. Instrum. 2014, 85, 111502. [Google Scholar] [CrossRef]
  12. Withjack, E. Computed tomography for rock-property determination and fluid-flow visualization. SPE Form. Eval. 1988, 3, 696–704. [Google Scholar] [CrossRef]
  13. Jin, J.; Kim, J.; Lee, J.; Oh, Y. Correlative multiple porosimetries for reservoir sandstones with adoption of a new reference-sample-guided computed-tomographic method. Sci. Rep. 2016, 6, 30250. [Google Scholar] [CrossRef]
  14. Bodwadkar, S.; Reis, J. Porosity measurements of core samples using gamma-ray attenuation. Nucl. Geophys. 1994, 8, 61–78. [Google Scholar]
  15. Iscan, A.; Kok, M. Porosity and permeability determinations in sandstone and limestone rocks using thin section analysis approach. Energy Sources Part A-Recovery Util. Environ. Eff. 2009, 31, 568–575. [Google Scholar] [CrossRef]
  16. Vanbrakel, J.; Modry, S.; Svata, M. Mercury porosimetry—State of the art. Powder Technol. 1981, 29, 1–12. [Google Scholar] [CrossRef]
  17. Salissou, Y.; Panneton, R. Pressure/mass method to measure open porosity of porous solids. J. Appl. Phys. 2007, 101, 142–143. [Google Scholar] [CrossRef] [Green Version]
  18. Washburn, E.; Bunting, E. Determination of porosity by the method of gas expansion. J. Am. Ceram. Soc. 1922, 5, 112–129. [Google Scholar] [CrossRef]
  19. Diamond, S. Mercury porosimetry: An inappropriate method for the measurement of pore size distributions in cement-based materials. Cem. Concr. Res. 2000, 30, 1517–1525. [Google Scholar] [CrossRef]
  20. Leclaire, P.; Umnova, O.; Horoshenkov, K.; Maillet, L. Porosity measurement by comparison of air volumes. Rev. Sci. Instrum. 2003, 74, 1366–1370. [Google Scholar] [CrossRef] [Green Version]
  21. Giesche, H. Mercury porosimetry: A general (practical) overview. Part. Part. Syst. Charact. 2006, 23, 9–19. [Google Scholar] [CrossRef]
  22. Richmond, J.; Peterson, J.; Herschel, W. An improved volumenometer. J. Am. Ceram. Soc. 1943, 26, 127–131. [Google Scholar] [CrossRef]
  23. Kampmeyer, P. The temperature dependence of viscosity for water and mercury. J. Appl. Phys. 1952, 23, 99–102. [Google Scholar] [CrossRef]
  24. Rigby, M.; Smith, E. Viscosities of inert gases. Trans. Faraday Soc. 1966, 62, 54–58. [Google Scholar] [CrossRef]
  25. Watanabe, N.; Ishibashi, T.; Tsuchiya, N.; Ohsaki, Y.; Tamagawa, T.; Tsuchiya, Y.; Okabe, H.; Ito, H. Geologic core holder with a CFR PEEK body for the X-ray CT-based numerical analysis of fracture flow under confining pressure. Rock Mech. Rock Eng. 2013, 46, 413–418. [Google Scholar] [CrossRef]
  26. Shakerian, M.; Marica, F.; Afrough, A.; Goora, F.; Li, M.; Vashaee, S.; Balcom, B. A high-pressure metallic core holder for magnetic resonance based on Hastelloy-C. Rev. Sci. Instrum. 2017, 88, 123703. [Google Scholar] [CrossRef]
  27. Wang, H.; Chen, Y.; You, L.; Cai, M. The development of multi-parameters measurement instrument uesd for high tempreature and high presure core. J. Southwest Pet. Inst. Nat. Sci. Ed. 2007, 29, 138–140. [Google Scholar]
  28. Zhang, K.; Chen, Y.; Xu, H. High temperature and high pressure rock gas porosity automatic test system. Petrol. Tub. Goods Instr. 1995, 9, 79–85. [Google Scholar]
  29. Keelan, D. Automated core measurement system for enhanced core data at overburden conditions. In Proceedings of the Society of Petroleum Engineers SPE Rocky Mountain Regional Meeting, Billings, MT, USA, 19–21 May 1986. [Google Scholar] [CrossRef]
  30. Dotson, B.; Slobod, R.; Mccreery, P.; Spurlock, J. Porosity-measurement comparisons by five laboratories. J. Pet. Technol. 1951, 3, 341–346. [Google Scholar] [CrossRef]
  31. Chen, X.; Caratini, G.; Davy, C.; Troadec, D.; Skoczylas, F. Coupled transport and poro-mechanical properties of a heat-treated mortar under confinement. Cem. Concr. Res. 2013, 49, 10–20. [Google Scholar] [CrossRef]
  32. Pei, Y.; Agostini, F.; Skoczylas, F. The effects of high temperature heating on the gas permeability and porosity of a cementitious material. Cem. Concr. Res. 2017, 95, 141–151. [Google Scholar] [CrossRef]
  33. Teeuw, D. Prediction of formation compaction from laboratory compressibility data. Soc. Petrol. Eng. J. 1971, 11, 263–271. [Google Scholar] [CrossRef]
  34. Walsh, J. Effect of cracks on compressibility of rock. J. Geophys. Res. 1965, 70, 381–389. [Google Scholar] [CrossRef]
  35. Tamari, S. Optimum design of the constant-volume gas pycnometer for determining the volume of solid particles. Meas. Sci. Technol. 2004, 15, 549–558. [Google Scholar] [CrossRef]
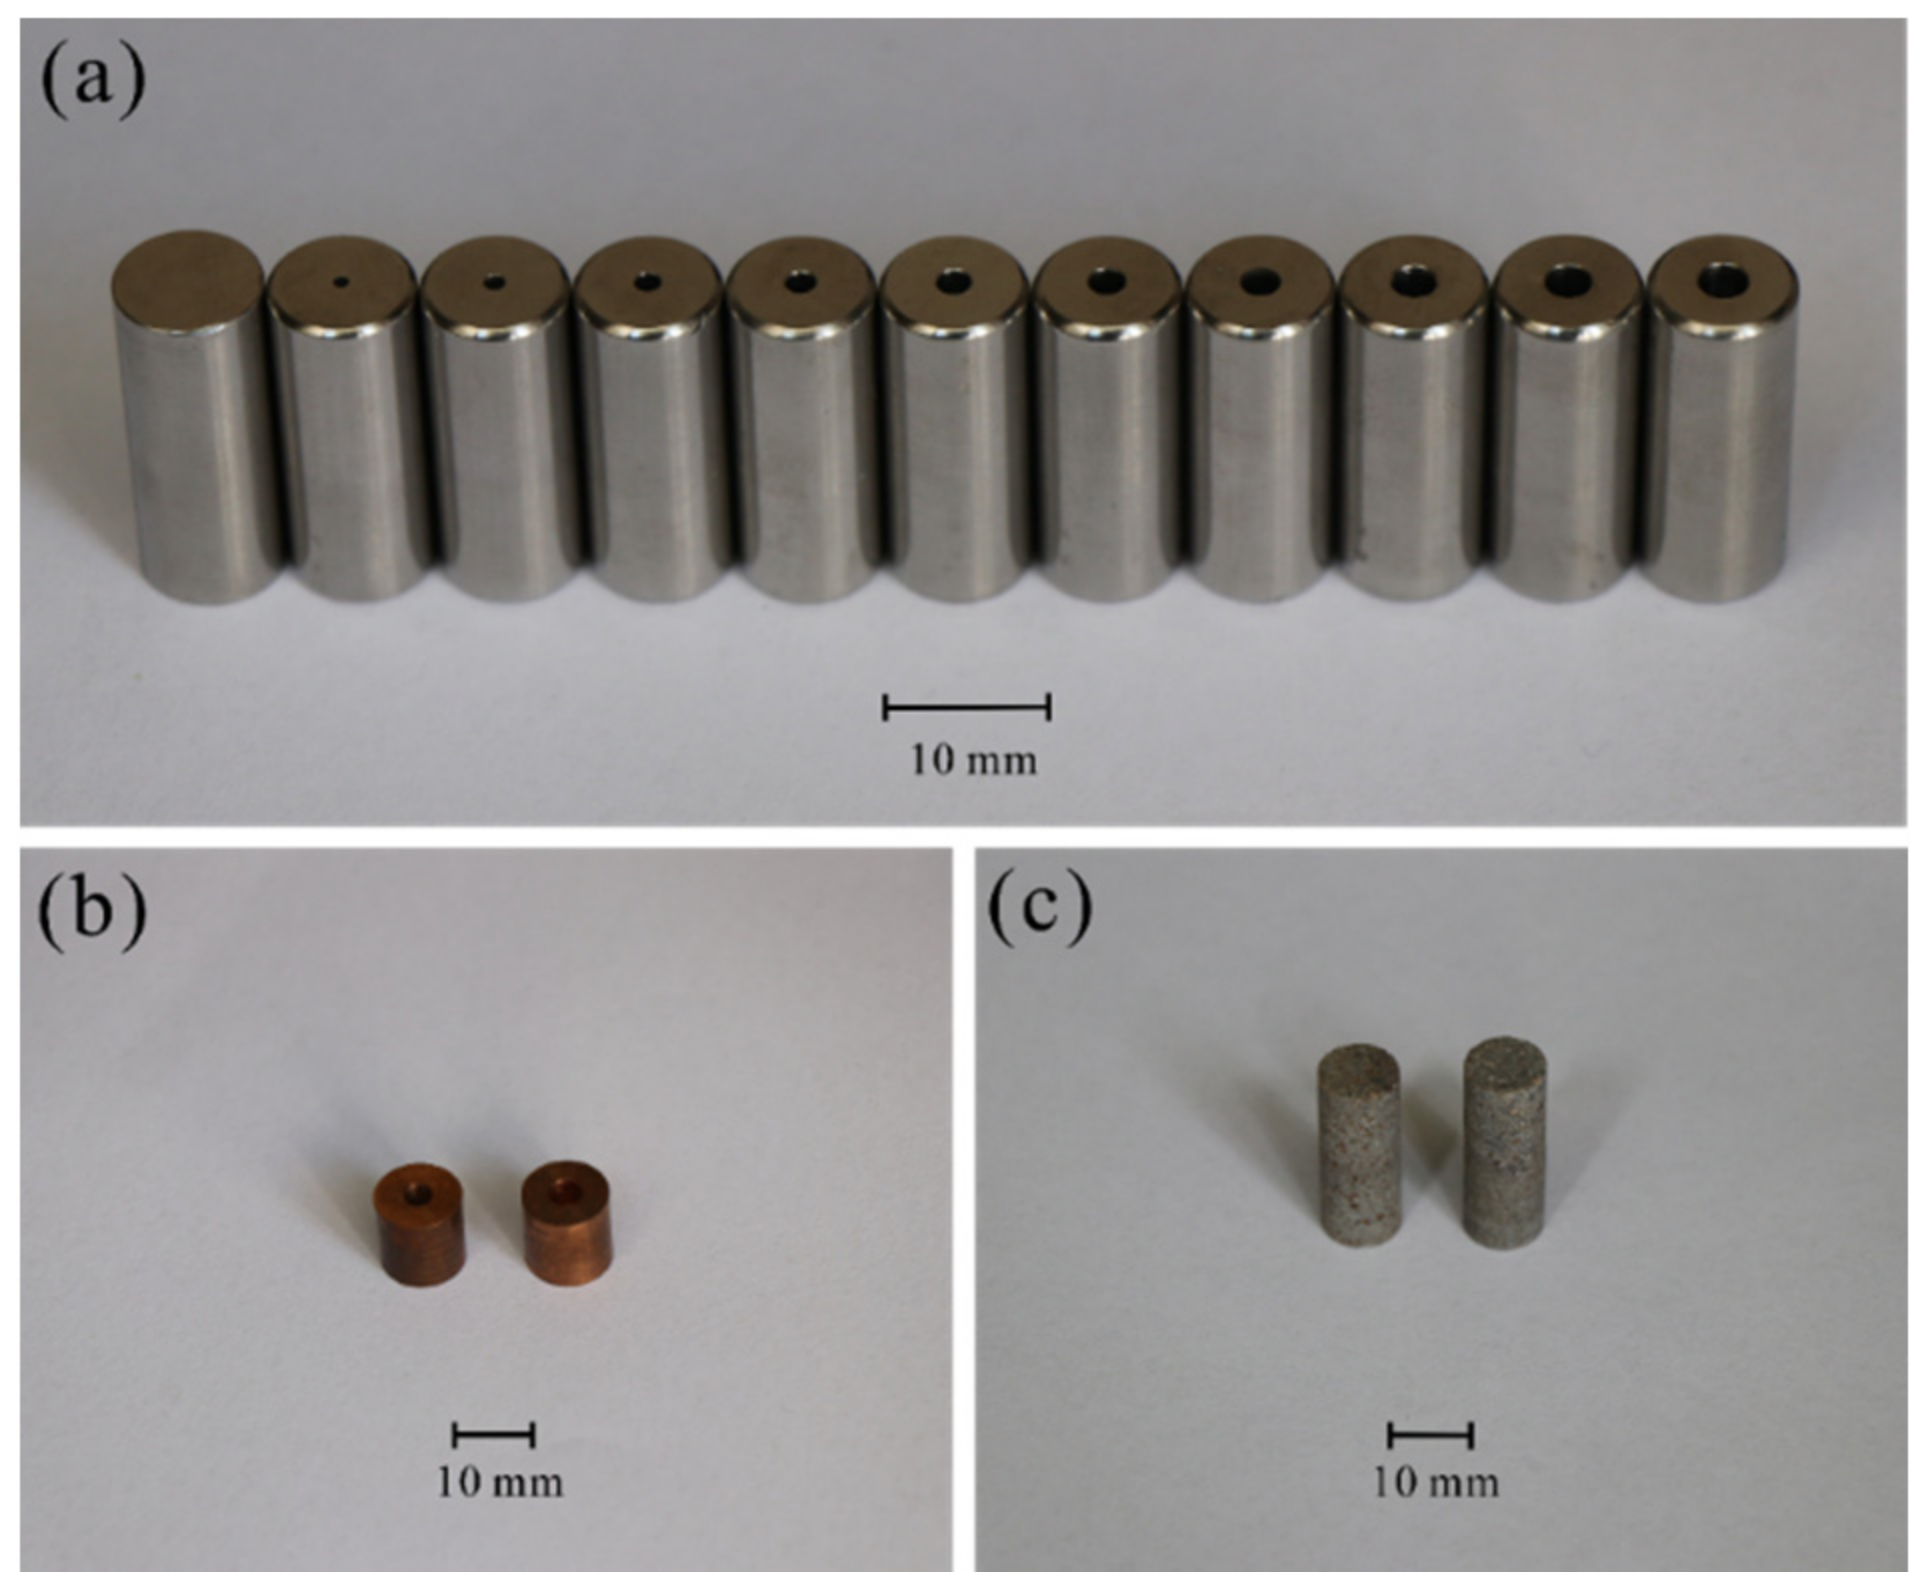
Figure 1. Schematic diagram of the rock porosity measurement apparatus.
Minerals 12 00127 g001
Figure 2. A sectional view of the autoclave.
Minerals 12 00127 g002
Figure 3. Photograph of the samples. (a) Cylindrical 304 stainless steel samples. (b) Cylindrical copper samples. (c) Cylindrical sandstone samples.
Minerals 12 00127 g003
Figure 4. Calibration curve for the relationship between the drop in the gas pressure of the calibration sample and its void volume.
Minerals 12 00127 g004
Figure 5. Relationship between inlet pressure and time.
Minerals 12 00127 g005
Figure 6. Relationship between porosity and isostatic pressures of two sandstones.
Minerals 12 00127 g006
Figure 7. Relationship between gas equilibrium pressure and equilibrium time when the initial gas pressures were 120 kPa, 150 kPa, and 180 kPa.
Minerals 12 00127 g007
Table 1. The size and porosity of the processed calibration samples.
Sample NumberCenter-Bore
Diameter (mm)
Void Volume
(mm3)
Density
(g/cm3)
Effective
Porosity (%)
S0007.8960
S10.9317.0027.8620.87
S21.3736.8967.8601.88
S31.6956.1457.8512.87
S41.9675.5487.8703.86
S52.2095.1447.8654.86
S62.42115.2177.8195.88
S72.64137.0087.8647.00
S82.81155.2837.8307.94
S92.96172.1667.8268.78
S103.13192.5877.8519.84
Table 2. Basic dimensions and theoretical porosities of cylindrical copper samples.
Sample
Number
Loss of Pressure Variation
(kPa)
Void
Volume
(mm3)
Bulk Volume
(mm3)
Determined
Porosity
(%)
Calculated
Porosity
(%)
Copper 0149.5681.40778.7010.3210.45
Copper 0250.97129.78805.8315.6916.10
Table 3. Basic dimensions and physical properties of sandstone.
Sample
Number
Diameter
(mm)
Height
(mm)
Mass
(g)
Bulk Density
(g/cm3)
Sandstone 110.4826.355.502.23
Sandstone 210.4428.085.992.49
Publisher’s Note: MDPI stays neutral with regard to jurisdictional claims in published maps and institutional affiliations.

