Article

Sedimentary Facies Controls for Reservoir Quality Prediction of Lower Shihezi Member-1 of the Hangjinqi Area, Ordos Basin

1
Institute for Ecological Research and Pollution Control of Plateau Lakes, School of Ecology and Environmental Science, Yunnan University, Kunming 650500, China
2
School of Earth Resources, China University of Geosciences, Wuhan 430074, China
3
Key Laboratory of Tectonics and Petroleum Resources, Ministry of Education, China University of Geosciences, Wuhan 430074, China
4
Department of Petroleum Engineering, NED University of Engineering and Technology, Karachi 75270, Pakistan
5
Department of Geosciences, University of Baltistan, Skardu 16100, Pakistan
6
School of Resource Environment and Earth Science, Yunnan University, Kunming 650500, China
*
Authors to whom correspondence should be addressed.
Minerals 2022, 12(2), 126; https://doi.org/10.3390/min12020126
Submission received: 8 December 2021 / Revised: 17 January 2022 / Accepted: 19 January 2022 / Published: 21 January 2022
(This article belongs to the Special Issue Studies of Seismic Reservoir Characterization)

Abstract

:
The tight gas reserves in the Hangjinqi area are estimated at 700 × 109 m3. Since the exploration of the Hangjinqi, numerous wells are already drilled. However, the Hangjinqi remains an exploration area and has yet to become a gas field. Identifying a paleo-depositional framework such as braided channels is beneficial for exploration and production companies. Further, braided channels pose drilling risks and must be properly identified prior to drilling. Henceforth, based on the significance of paleochannels, this study is focused on addressing the depositional framework and sedimentary facies of the first member (P2x1) of the lower Shihezi formation (LSF) for reservoir quality prediction. Geological modeling, seismic attributes, and petrophysical modeling using cores, logs, interval velocities, and 3D seismic data are employed. Geological modeling is conducted through structural maps, thickness map, and sand-ratio map, which show that the northeastern region is uplifted compared to northwestern and southern regions. The sand-ratio map showed that sand is accumulated in most of the regions within member-1. Interval velocities are incorporated to calibrate the acoustic impedance differences of mudstone and sandstone lithologies, suggesting that amplitude reflection is reliable and amplitude-dependent seismic attributes can be employed. The Root Mean Square (RMS) attribute confirmed the presence of thick-bedded braided channels. The results of cores and logging also confirmed the presence of braided channels and channel-bars. The test results of wells J34 and J72 shows that the reservoir quality within member-1 of LSF is favorable for gas production within the Hangjinqi area.

1. Introduction

Tight sandstone can be defined as a potential reservoir with permeability less than 1 mD or 0.1 × 10⁻³ μm2 and porosity less than 12% [1]. As per contemporary reports of 2019, hydrocarbon shares more than 58% of the world’s energy consumption [2]. To suffice the energy needs, tight sandstone gas is presently the leading unconventional natural gas source globally and has developed into a vital parameter for natural gas production [3]. In China, unconventional tight gas provides the most contribution of the unconventional resources and accounts for 39.2% reserves and 24.6% annual production of the total natural gas [3]. Therefore, many geoscientists are working on the reservoir quality prediction of sandstone reservoirs [4,5,6,7]. The Ordos basin (OB) is one of the most productive basins with the highest annual gas output in China [8,9]. The OB has the largest number of gas fields in China. These gas fields include Jingbian, Daniudi, Yulin, Zizhou, Wushenqi, Shenmu, Mizhi, and Sulige [10,11]. The Hangjinqi area lies at the northern OB, situated amid the Yimeng uplift and Yishan slope [12] (Figure 1b). Many exploratory wells have been drilled within the Hangjinqi area, and a substantial volume of gas in the upper Paleozoic sandstones has been found [13,14]. The Hangjinqi has the potential to become a significant gas exploration zone [15].
In the last few decades, geoscientists have emphasized quantitative methods for seismic interpretation because these can provide enhanced information regarding reservoir characterization and reservoir quality prediction [16,17]. Geological modeling is an advanced and essential tool for understanding the depositional framework of sedimentary systems. Geological modeling can be defined as the spatial depiction of surfaces to showcase variations, topography, relief of rocks corresponding to historical geological events. These spatial surfaces are modeled as isochronous surfaces interpolated over the full domain space [18]. Seismic attributes have developed into an advanced and essential tool in most hydrocarbon and developments projects because of their high resolution and high success rate [19,20,21]. The faults distribution deliver imperative evidence associated with tectonics, overpressure, burial history, and diagenesis [18,22,23]. Formation evaluations are widely used to interpret the lithology, porosity, permeability, water saturation, matrix volume, and shale content [24,25,26].
Limited studies have identified reservoir characterization, and most studies highlighted the reservoir diagenesis of the lower Shihezi formation (LSF) (P2x) [1]. The main issues in studying the sedimentary depositional pattern within the Hangjinqi area are as follows; (a) the presence of coal layers beneath LSF [15], (b) uplifting in the Paleozoic causes several lateral variations which were further triggered during the Yanshan structural movements [27]. Former studies conducted on the Hangjinqi area were focused on the evaluation of genetic types and source of upper Paleozoic tight gas [12], hydrothermal mineralization of uranium deposits [28], evaluation of clay mineral content, and type of reservoir properties [8], channel identification within second member and the third member of the LSF [15], structural evolution [11,29], and tectonic controls [30]. We focused on the identification of depositional framework and sedimentary facies controls to evaluate the reservoir quality prediction within the first member (P2x1) of the LSF (P2x) by utilizing the cores, logs, velocities, and 3D seismic data (Figure 1c). The presented study will showcase important insights related to favorable zones of sand deposition of the lower Shihezi member-1, that can be exploited for future studies.

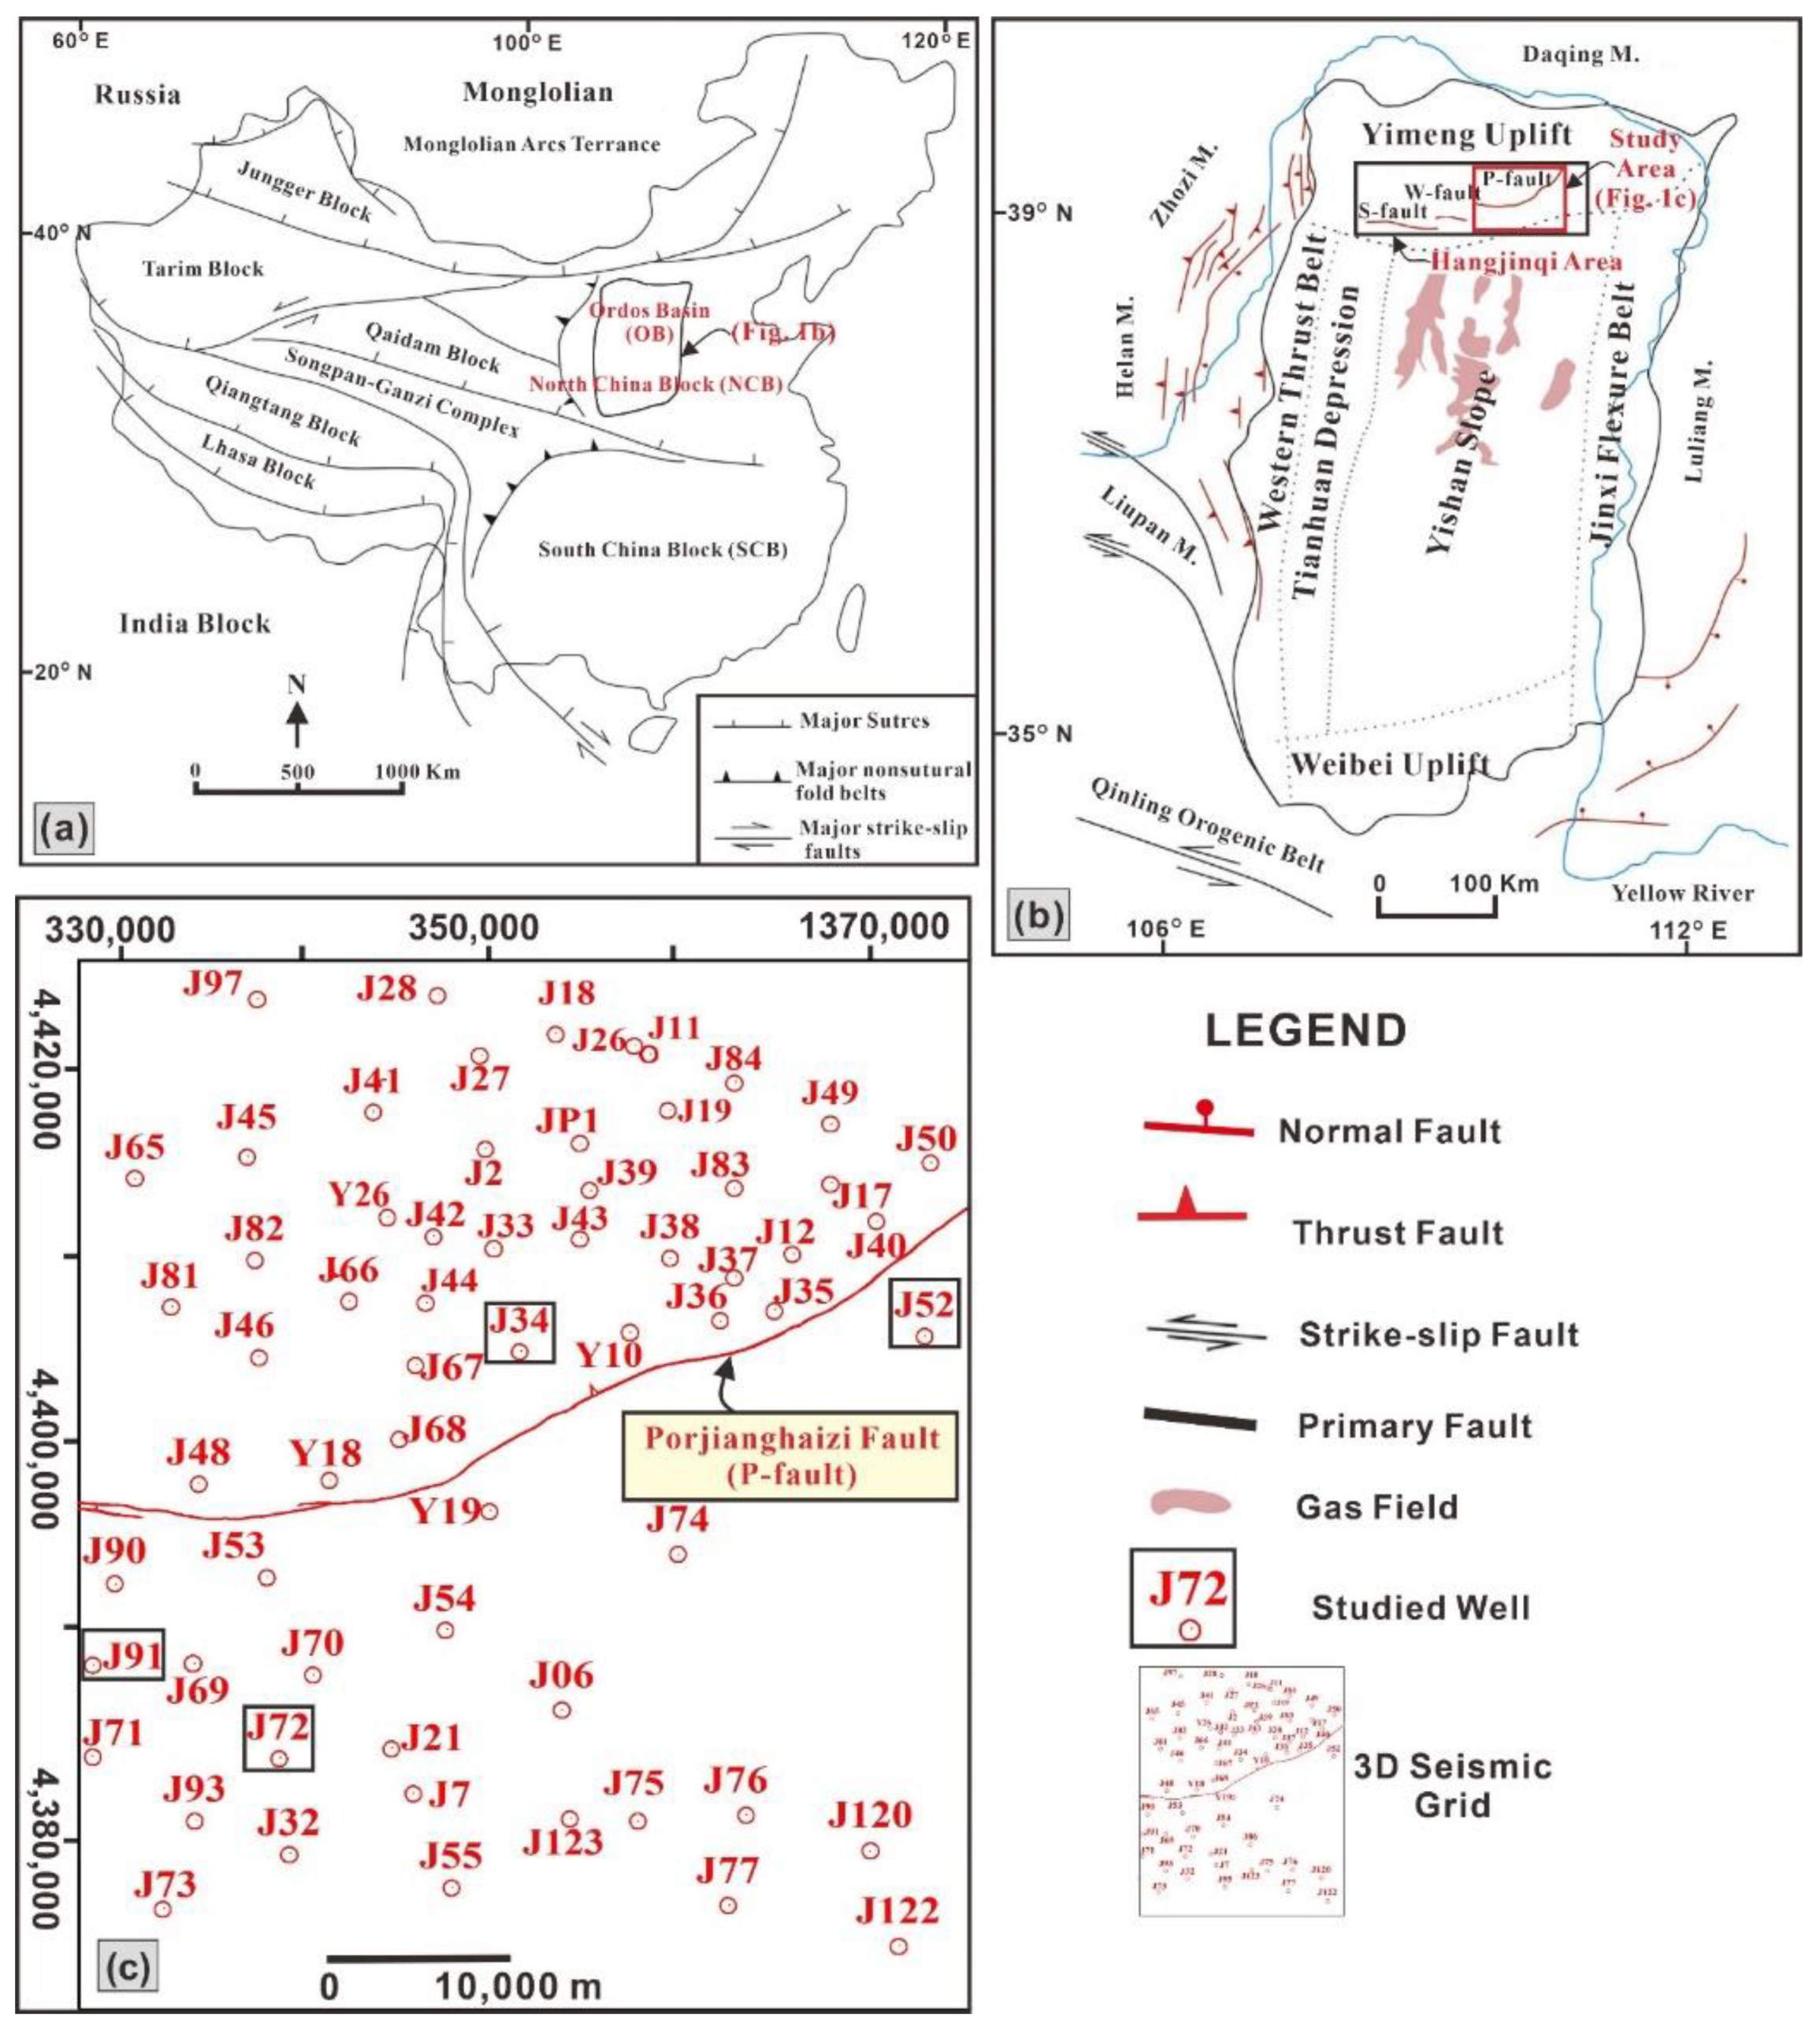
2. Geology of the Study Area

The evolution of the OB is the consequence of the interaction among the Paleo-Asian Ocean and North China Block (NCB) (Figure 1a). The OB was formed in the western margin of the NCB during the Paleozoic. The OB was uplifted during the late Cretaceous and converted to a Plateau [28]. However, the OB was separated from the NCB during the Cenozoic, which resulted in six tectonic regions at the top of the Archean-Proterozoic basement [30,31,32,33,34]. The six tectonic units include Weibei uplift, Yimeng uplift, Western thrust belt, Jinxi flexural belt, Yishan slope, and Tianhuan depression [30,35]. The Hangjinqi region is positioned at the Yishan ramp and Yimeng uplift intersection. The Hangjinqi area is considered a favorable area for hydrocarbon migration due to the development of the paleo-high in the northern OB [36]. From the west to the east region of the study area, three main faults are disseminated, among which Porjianghaizi fault (P-fault) (also referred as Boerjianghaizi fault in the literature) is the largest fault that separates the Hangjinqi area into the north and south regions [30] (Figure 1b).
The petroleum play of the study area includes the source rocks of Taiyuan (C3t) and Shanxi (P1s) formations of Carboniferous and lower Permian, which consists of numerous layers of coal bed seams (CBM) and thick beds of mudstones. The main reservoir within the Hangjinqi area consists of the LSF (P2x) of the middle Permian. The LSF (P2x) consists of three members. These members are categorized as a first member (P2x1), second member (P2x2), and third member (P2x3) [30] (Figure 2). The tight sandstones of the LSF having low porosity and low permeability act as the main reservoir, comprising coarse-grained pebbly sandstone, coarse-to-fine sandstones, sandy conglomerate and mudstones layers [15,37]. The thick-bedded mudstones of upper Shihezi (P2s) and Shiqianfeng (P3s) formations act as the main seal rocks [12].

3. Materials and Methods

The database incorporated in our study consist of 3D seismic, cores, well logs, and interval velocities. The seismic grid of 2500 km2 and 62 wells are included to observe the depositional framework on a regional scale within the Hangjinqi area. Several geophysical logs from wells J34, J52, J72, such as gamma-ray (GR), spontaneous potential (SP), deep resistivity (LLD), shallow resistivity (LLS), caliper (CAL), and sonic (DT) are incorporated [37,38]. The interval velocities from well J72 are included to identify the acoustic impedance differences among lithologies of the member-1 of the LSF. The core samples from wells J34, J72 and J91, including coarse-grained pebbly sandstone, coarse-to-fine sandstones, sandy conglomerate and mudstones layers, are utilized in our study. The test results of wells J34 from north, J52 from the center, and J72 from southern region were utilized to evaluate the reservoir quality prediction through formation evaluation.
Initially, cores of wells J34, J72 and J91 are incorporated in the study to observe rock type characteristics and sedimentary features such as bedding, grading, sorting, shape, color, and lithologies to identify the facies, subfacies, and microfacies. In the second part, a synthetic seismogram is made using seismic and well log data to interpret the targeted horizons within the member-1 of the LSF. Our study focuses on the first member of the LSF, which lies between the T9d and T9e horizons. T9d was marked at the top of the Shanxi Formation (P1s), while T9e was marked at the lower boundary of the second member (P2x2) of the LSF (Figure 2). Faults distributed within targeted horizons of T9d and T9e are interpreted to identify the impact of tectonic activity. Geological modeling and seismic attribute methods are performed to interpret the reservoir quality prediction. Geological modeling is an effective tool to identify the distribution of sedimentary facies. The geoscientists are constantly evolving geological modeling methods for enhanced prediction of subsurface depositional systems [39,40]. Structural and thickness maps are employed to delineate the topography and thickness distribution of sediments.
For decades, geoscientists have employed seismic attribute analysis to classify sedimentary facies [41,42,43]. Seismic attributes provide valuable, reliable information regarding bed thickness, continuity, fractures, porosity, lithofacies, and sequence boundaries [44]. Interval velocities of well J72 are incorporated to differentiate the sandstone and mudstone lithologies. Later, the Root Mean Square (RMS) attribute is extracted for the lower Shihezi member-1 to identify the geometry of the fluvial braided channels.
In the end, a depositional facies map was produced to show the depositional framework using integrated analysis of structural maps, thickness map, fault distribution maps, sand-ratio map, and horizon RMS attribute map. The reservoir quality is studied through petrophysical analysis using wells J34, J52 and J72 via interpretation of the perforation intervals at reservoir depths of member-1 of the LSF in the Hangjinqi area, northern OB, China.

4. Results

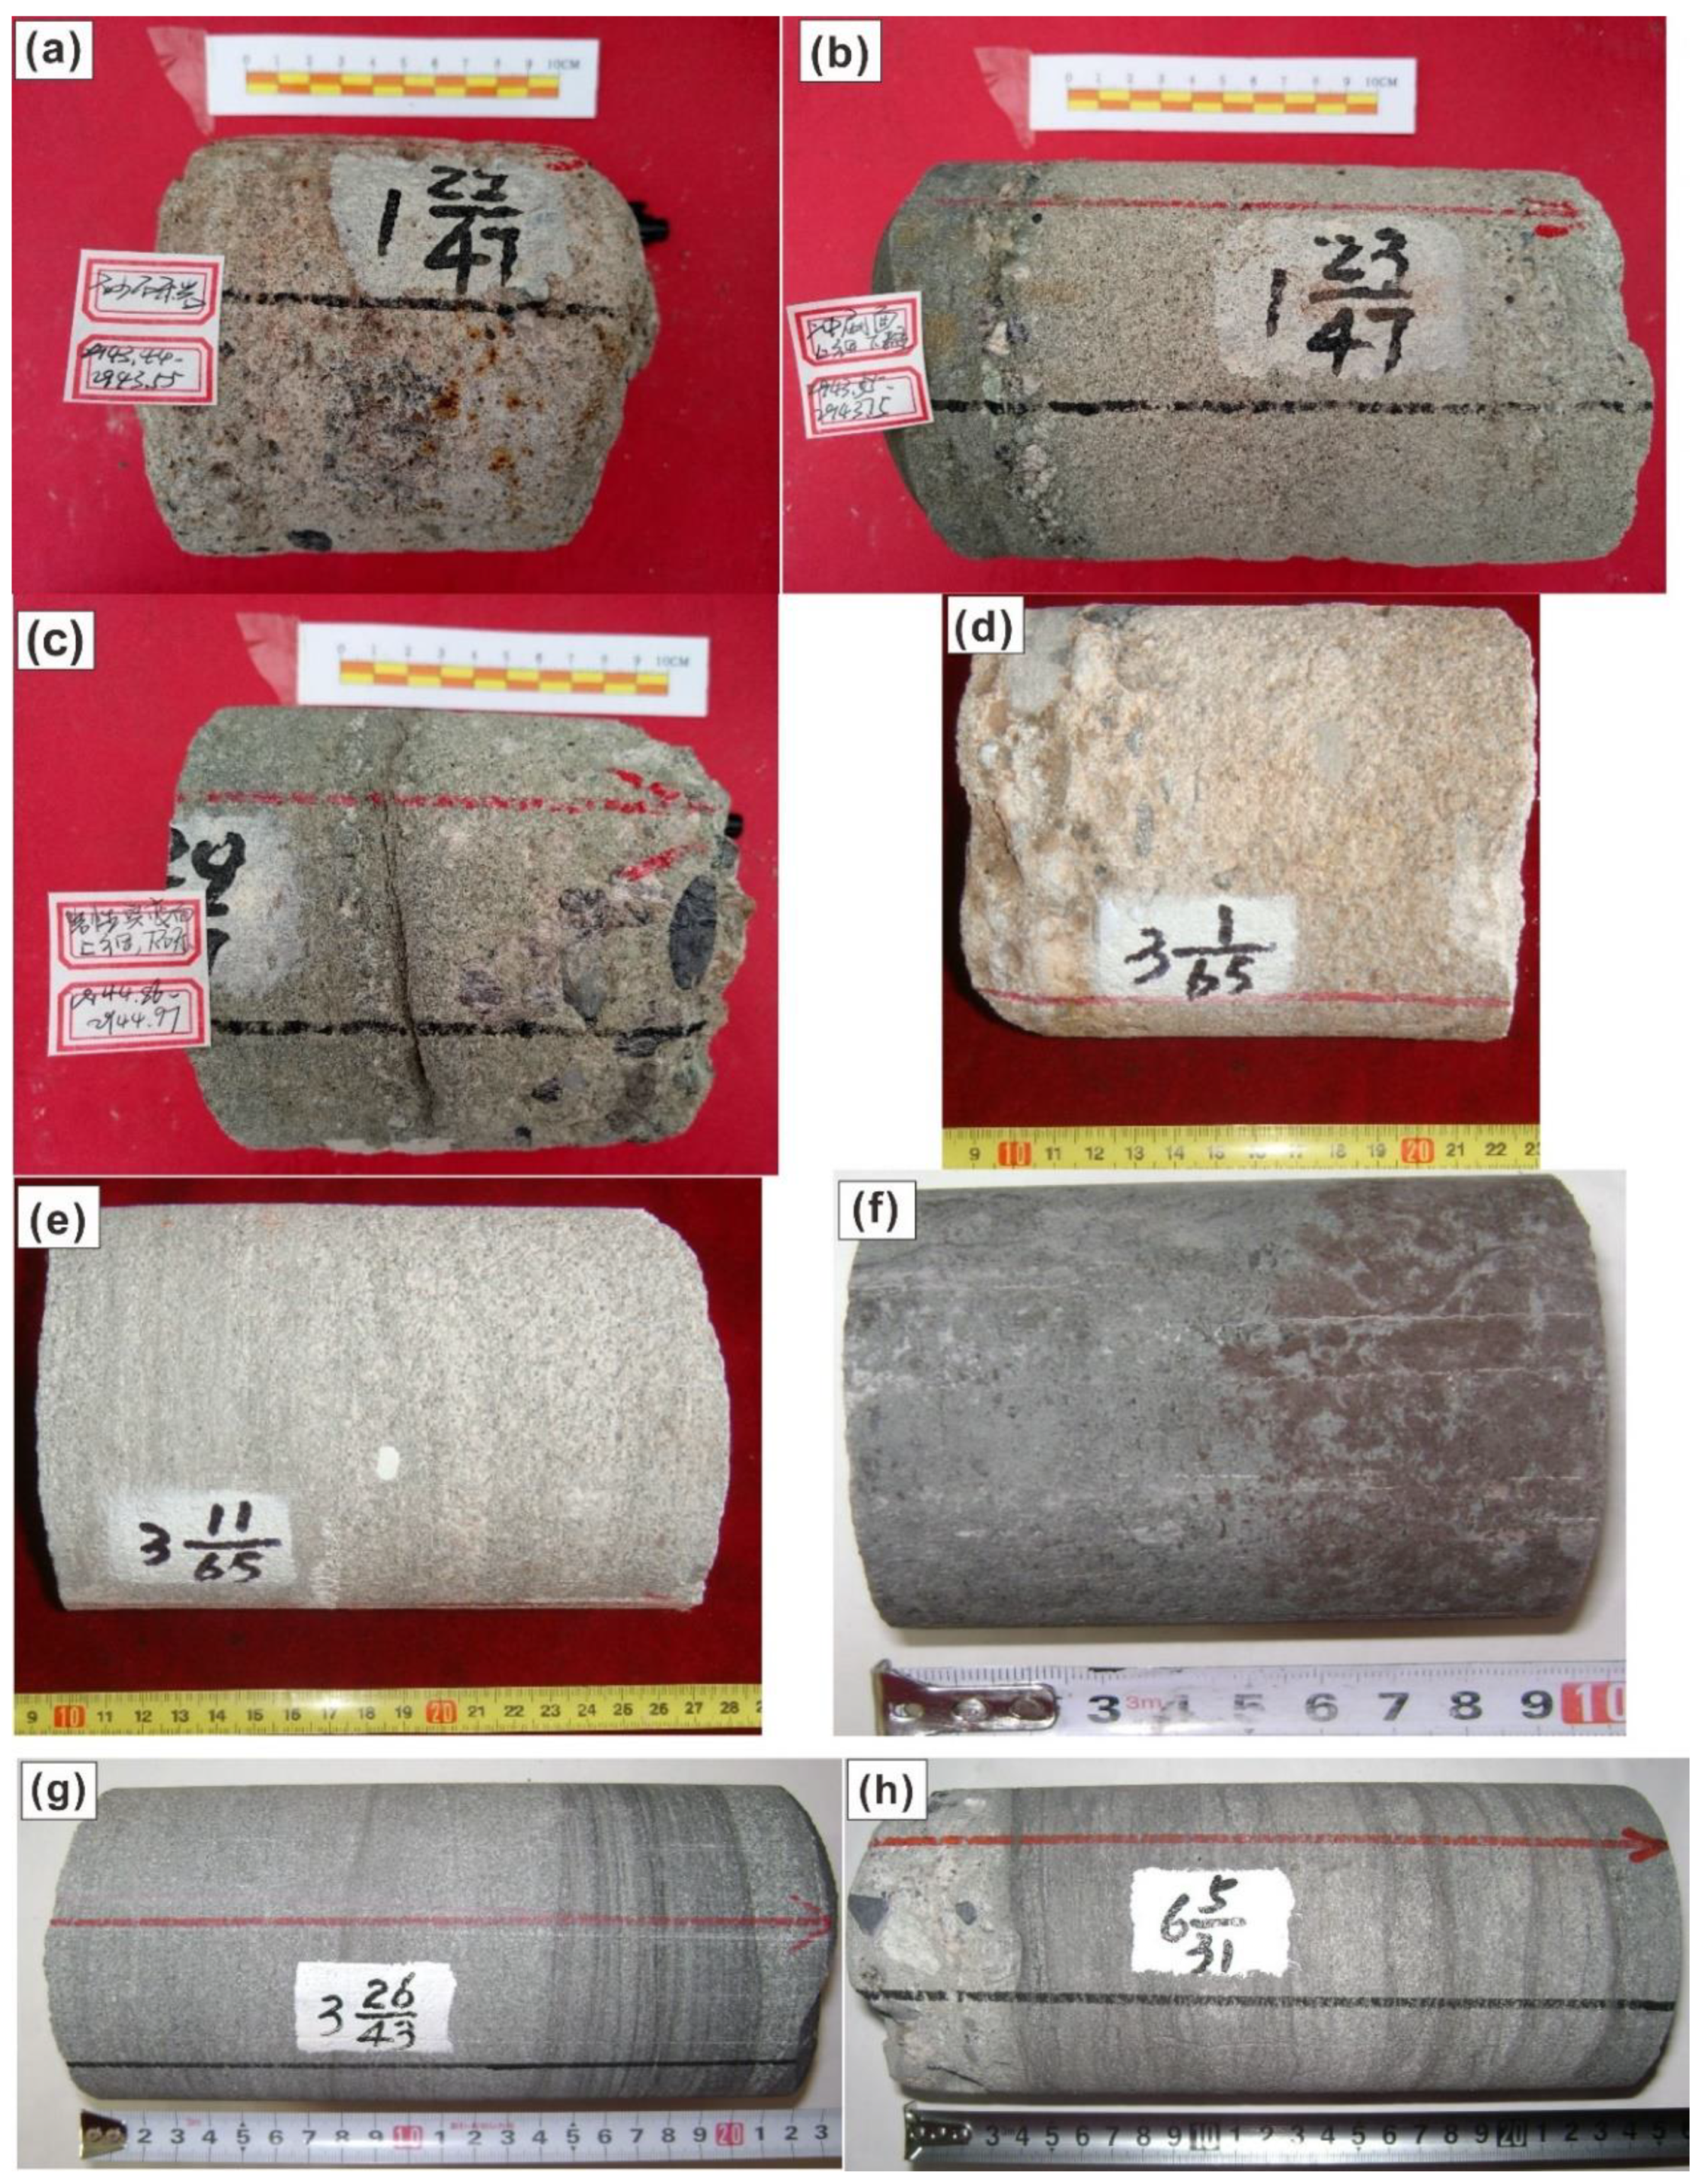
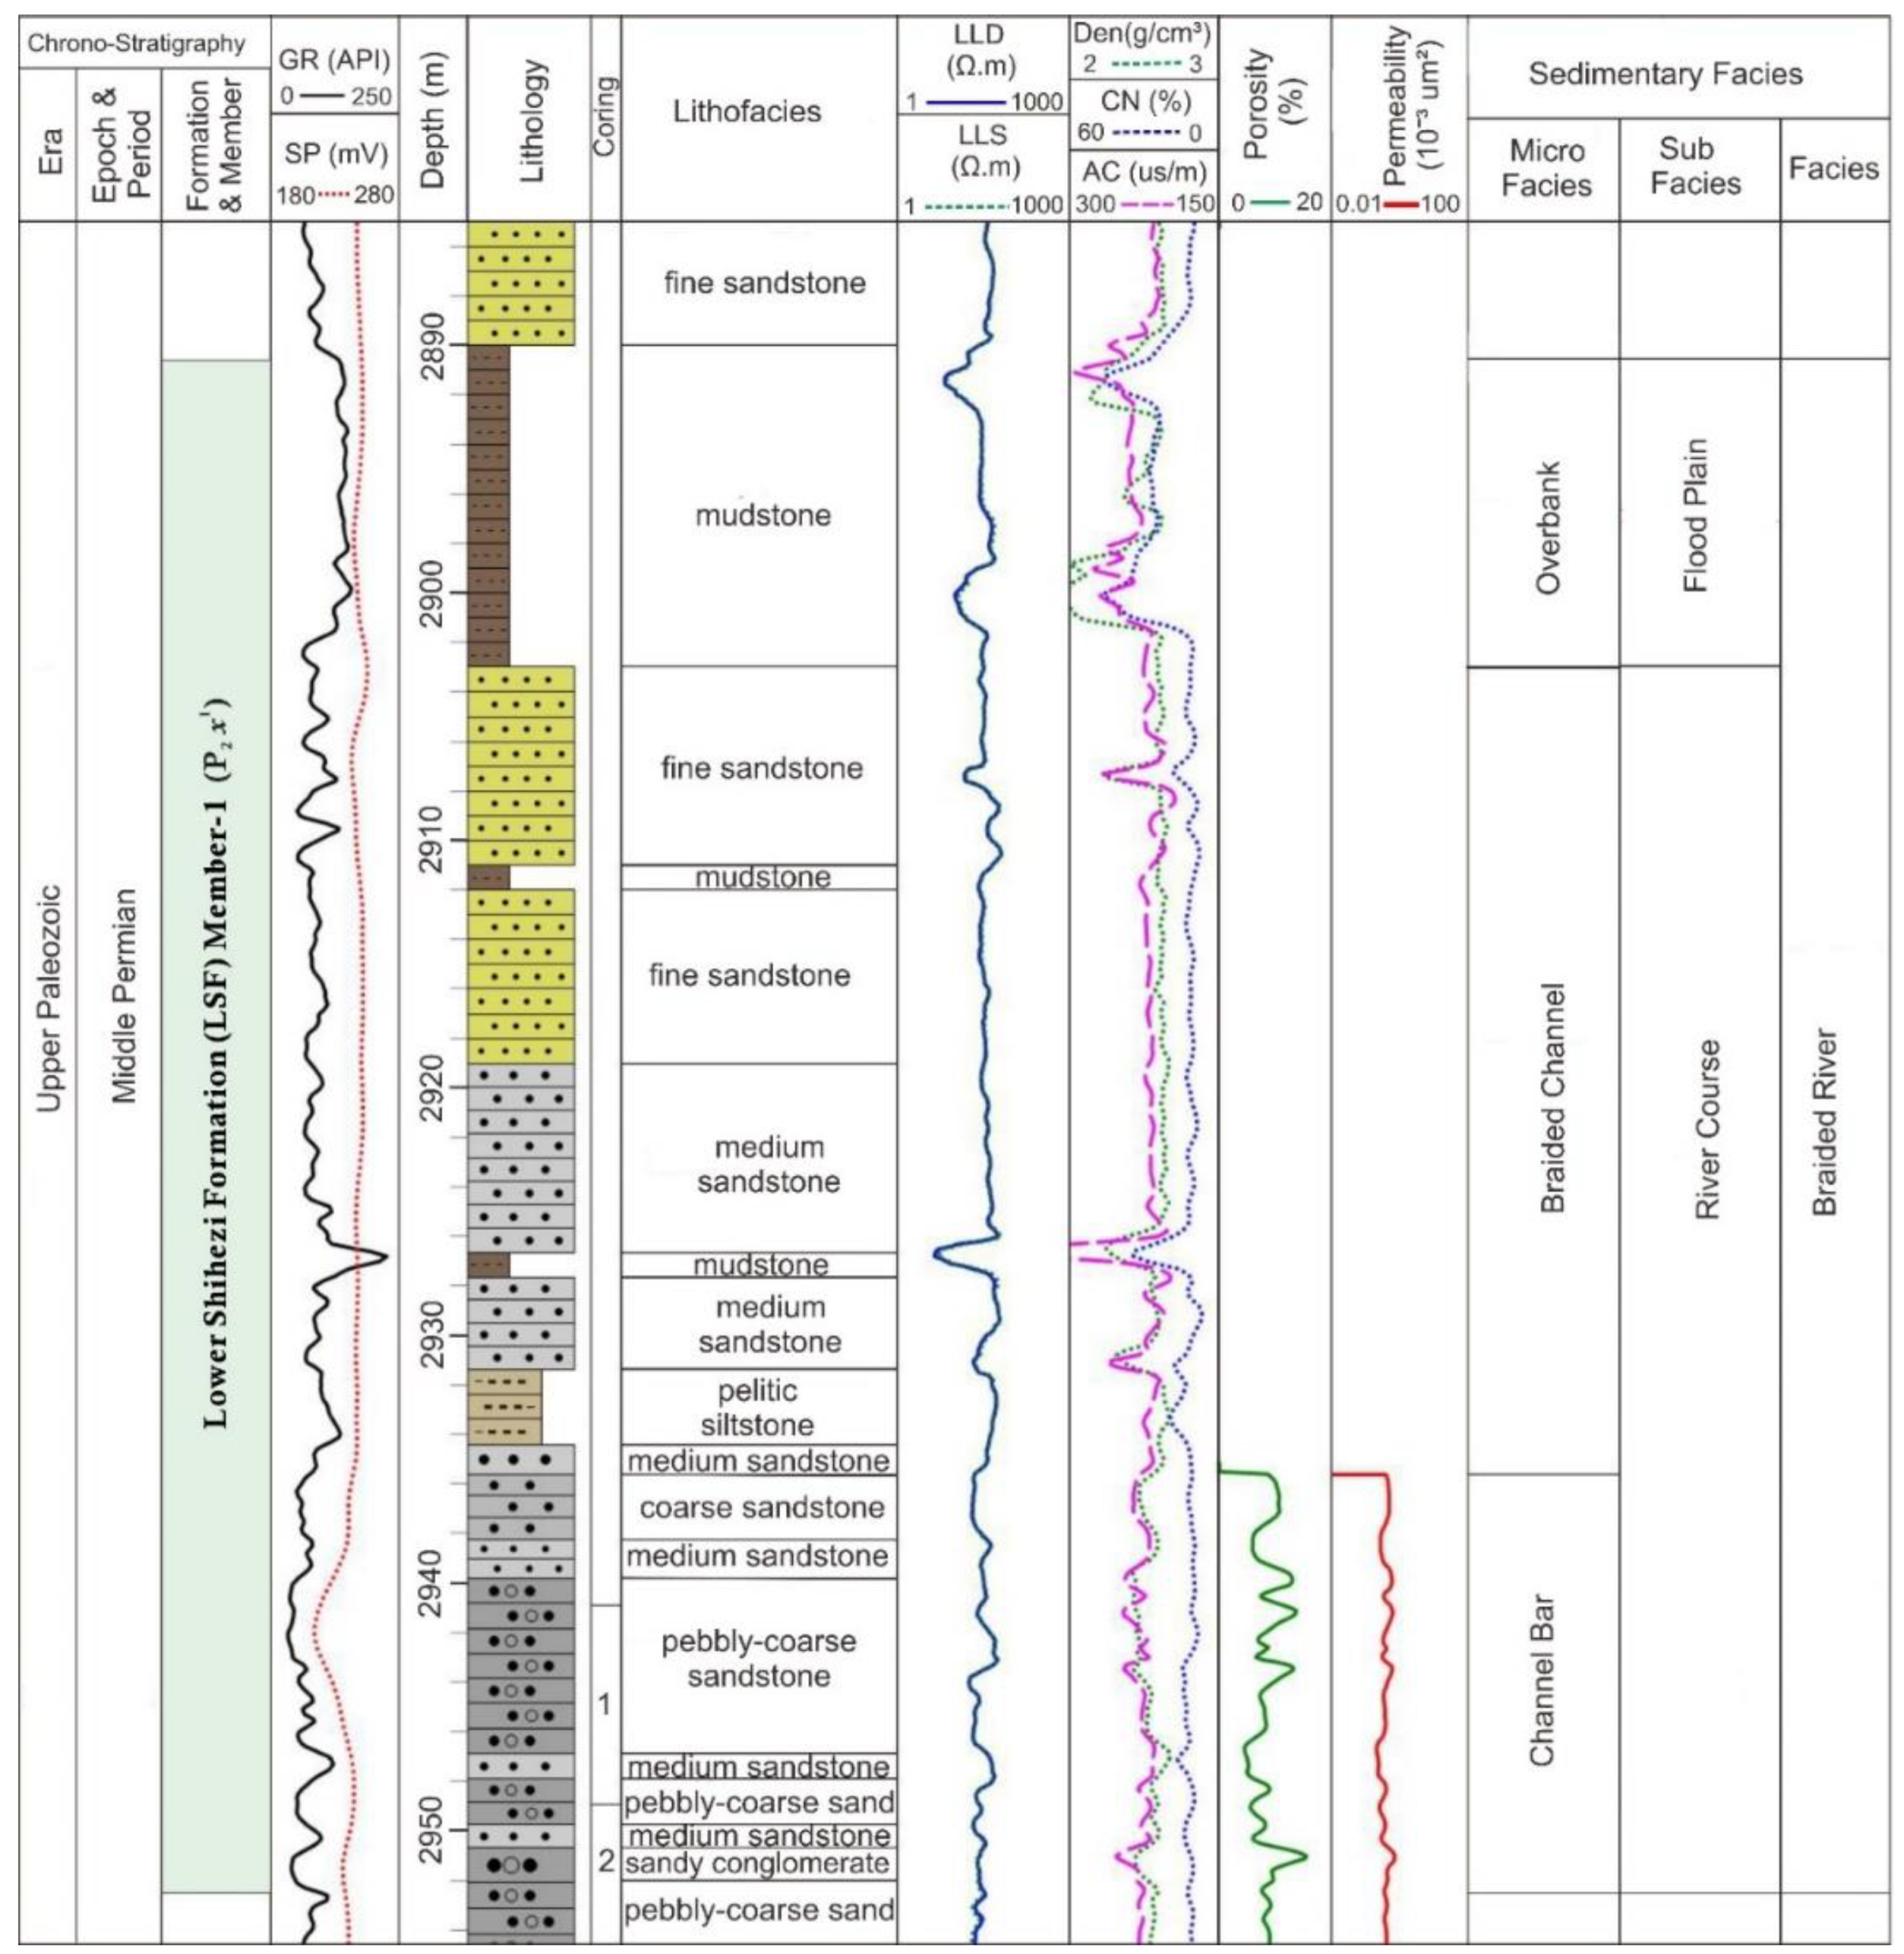
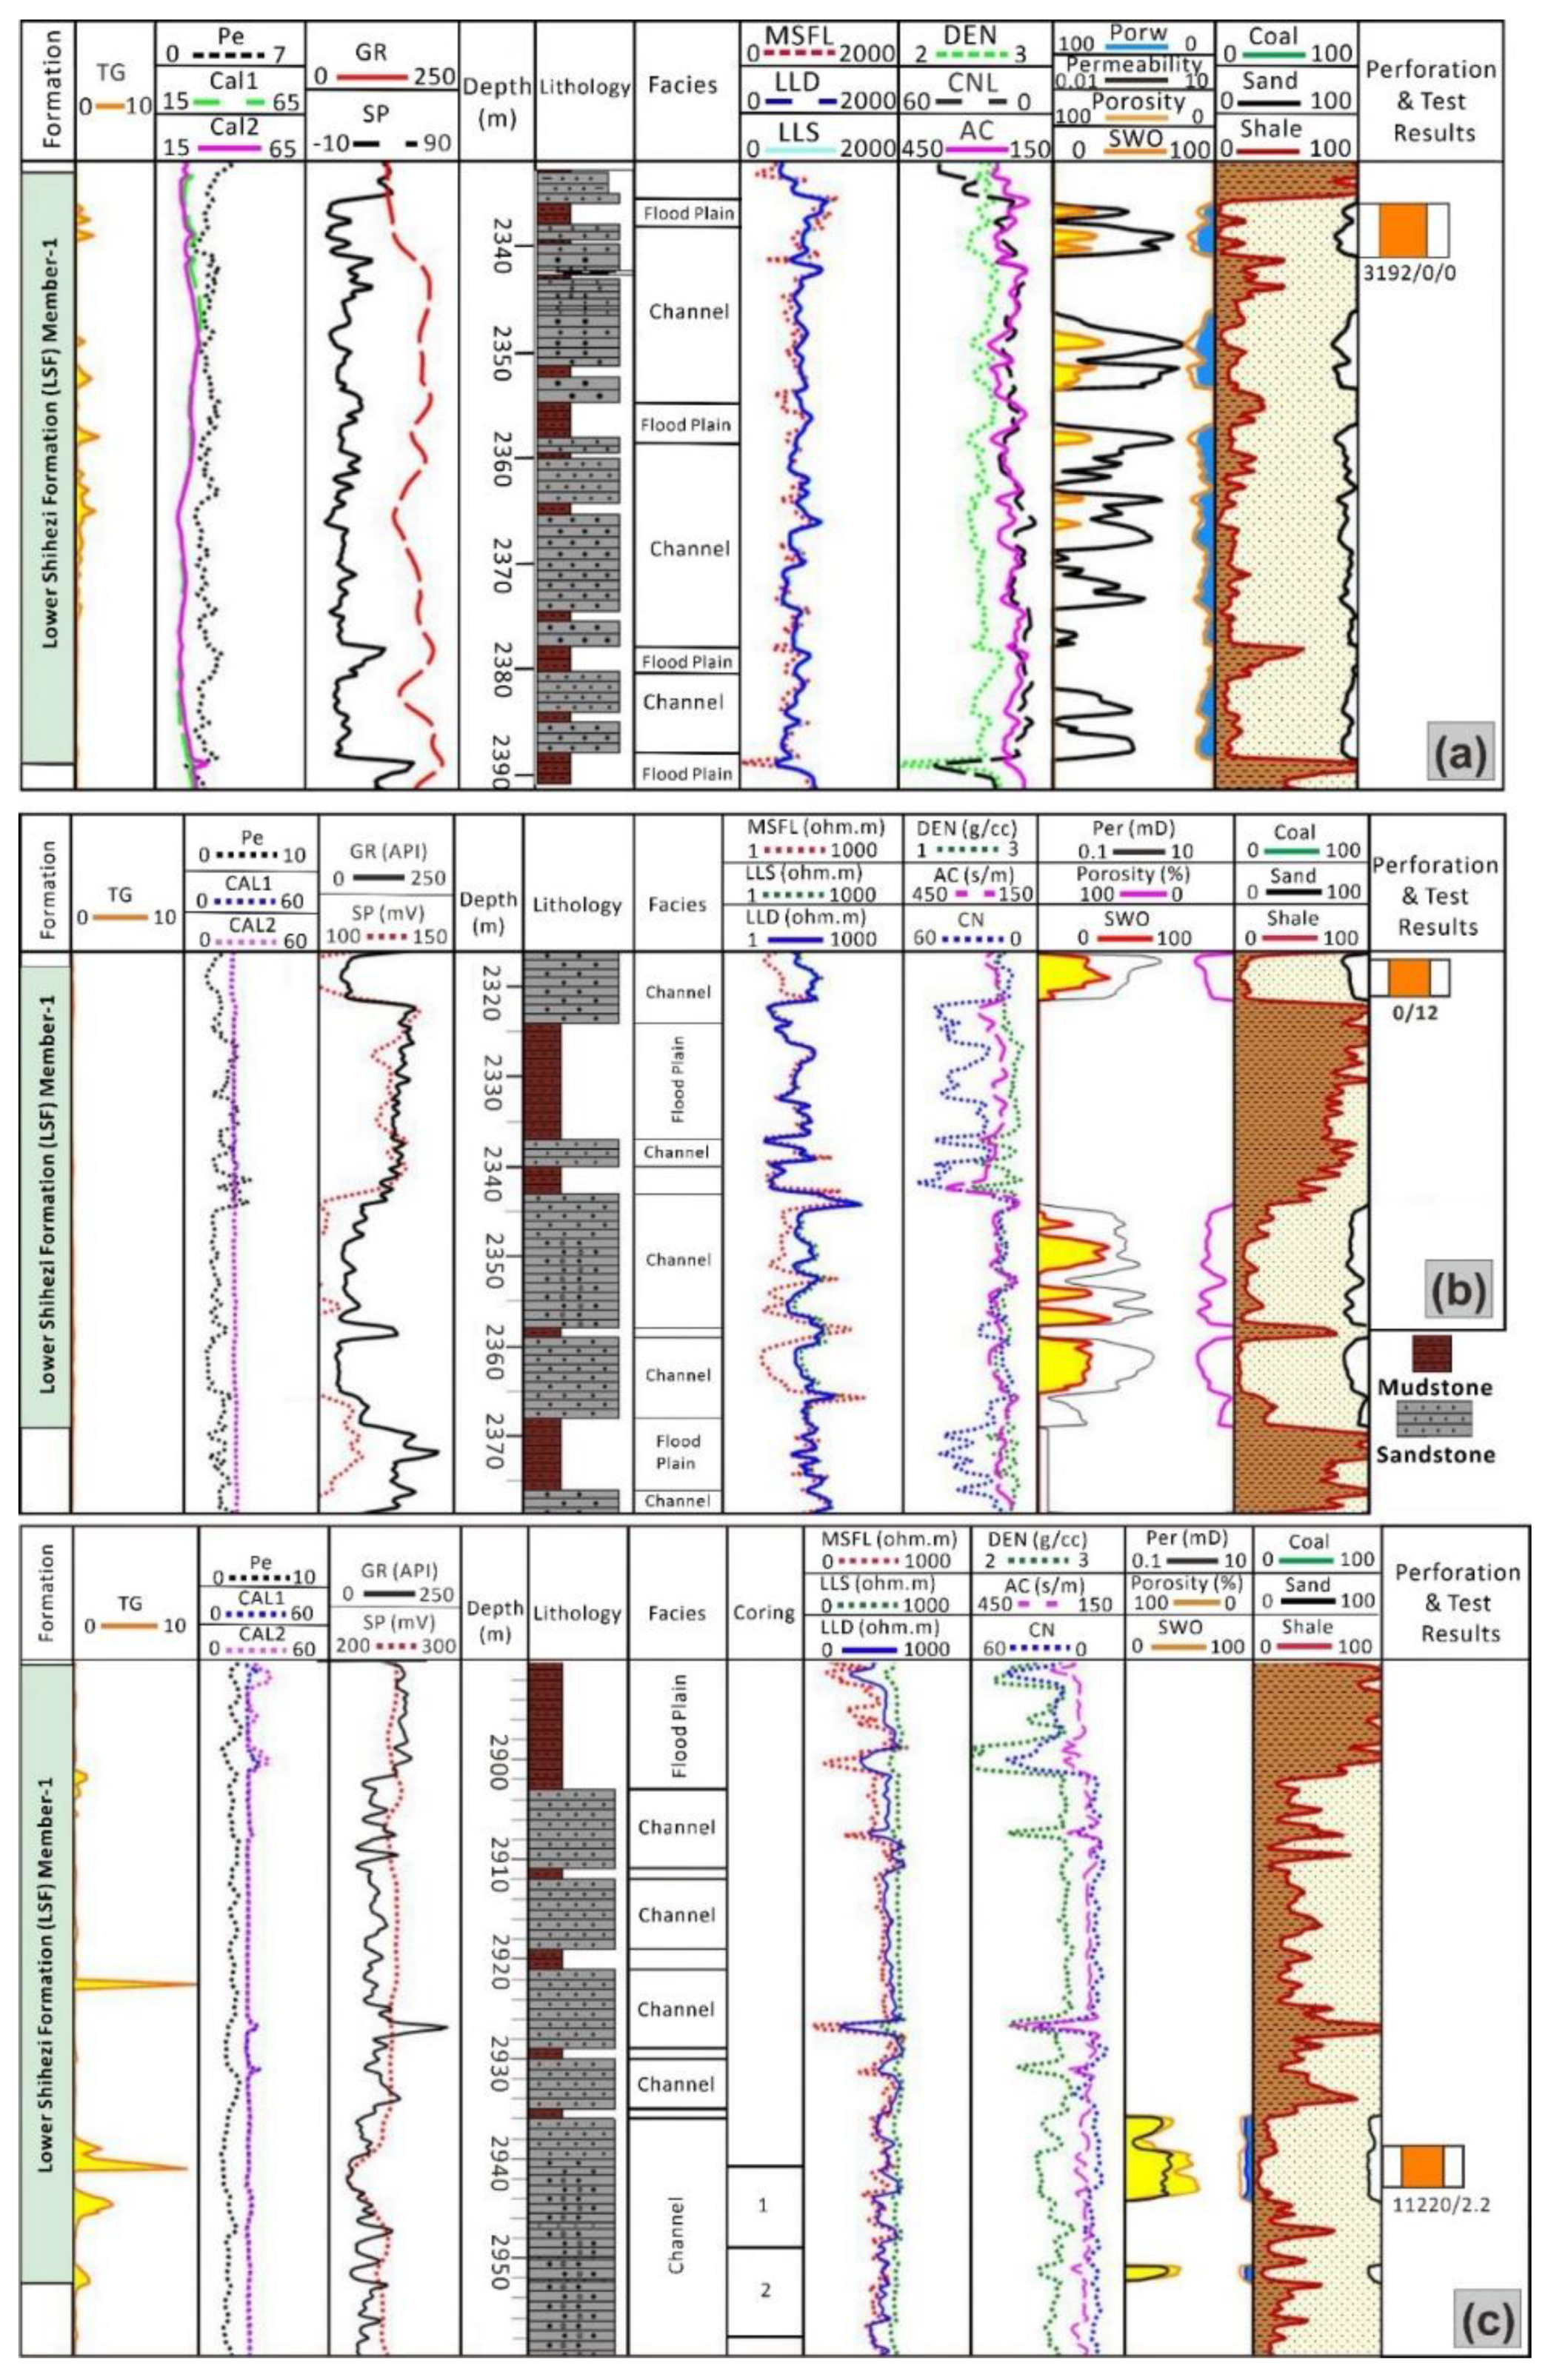
4.1. Description and Interpretation of Drilling Cores and Well-Logging

The fluvial paleo-environments are characterized by porous and permeable coarse-grained sediments such as sandy conglomerate and coarse-grained pebbly sandstone that deposit in the braided channels and establish good quality reservoirs [45]. The sandstone in the braided channels generally exhibit the characteristics of erosional base, good sorting, sub-angular grains, graded bedding and trough cross-bedding [46]. Thin beds of pebbly-sandstone and sandy conglomerate are usually developed at the bottom shows braided bars or channel-bars [47].
The available geological cores of wells J72, J34 and J91 from the member-1 of the LSF are incorporated to identify the characteristics of the microfacies. The core of well J72 at depths of 2943.44–2943.55 m shows the presence of a sandy conglomerate having massive bedding (Figure 3a). A 0.08 m mudstone present in the upper part of the core of well J72 at depths of 2943.55–2943.75 m is in abrupt contact with underlying coarse-grained pebbly sandstone having erosional surface (Figure 3b). The core of well J72 at depths of 2944.86–2944.97 m, shows the presence of a conglomerate in the lower part, having lithological interface of conglomerate to fine sandstone discontinuity (Figure 3c). The core of J34 at depths of 2340.84–2340.96 m shows the presence of a light gray coarse-grained pebbly sandstone which is intermixed with gray-white oil traces that is composed of quartz gravel and mud gravel. The coarse-grained gravel sandstone sediments are uneven, disorderly distributed, and locally enriched. The sediments are sub-angular and have medium sorting (Figure 3d). The core of J34 at depths of 2341.90–2342.06 m shows light gray thick-bedded coarse sandstone, mainly composed of quartz, followed by rock debris and a small amount of feldspar and mica. The sediments are sub-angular, have good sorting with relatively loose argillaceous cementation (Figure 3e). The core of well J91 at depths of 2953.19–2953.28 m shows the presence of a gray brown mudstone (Figure 3f). The core of well J91 at depths of 2981.08–2981.30 m shows the presence of a light gray medium sandstone. Further, an argillaceous stripe with oblique bedding can also be seen in the middle part of the core surface, and several argillaceous stripes with horizontal bedding are also present in the lower part indicating braided channel facies (Figure 3g). The core of well J91 at depths of 3002.62–3002.85 m shows the presence of light gray coarse-gained pebbly sandstone and light gray medium sandstone. Gravel is enriched in the upper part of the core, and multiple argillaceous stripes are seen in the lower part of the medium sandstone, exhibiting ripple bedding (Figure 3h).
Integrated geophysical logging and geological cores data of various wells were incorporated in our study to describe the depositional framework of the member-1 of the LSF. The depositional environment of LSF in the Hangjinqi area is deduced as the braided river. The river course and flood plain are interpreted as subfacies, whereas braided channel, channel-bar, and overbank are interpreted as microfacies. The existence of gray brown mudstone (Figure 3f) and mud gravel in the light gray oil traces present between the light gray coarse-grained gravel sandstone (Figure 3d), and right box-car shaped characteristics with high GR values (Figure 4), indicates floodplain. These mudstone sediments were deposited in the overbank regions. The abrupt change of mudstone present in the upper part with underlying coarse-grained pebbly sandstone shows that there is a transition from floodplain to braided channel (Figure 3b). The presence of light gray coarse-grained pebbly sandstone (Figure 3b,d,h), sandy conglomerate (Figure 3a), coarse sandstone (Figure 3e), erosional surface (Figure 3b), ripple bedding (Figure 3h), argillaceous stripes with horizontal and oblique bedding (Figure 3g), sub-angular grains with good sorting (Figure 3e), finning-upward trend (Figure 3b and Figure 4), and left box-car shaped gamma-ray curve characteristics (Figure 4), signifies the fluvial nature of braided channel sediments. The coarse-grained pebbly-sandstone and sandy conglomerate at the bottom of the member-1 of LSF indicates channel-bars [47] (Figure 4).

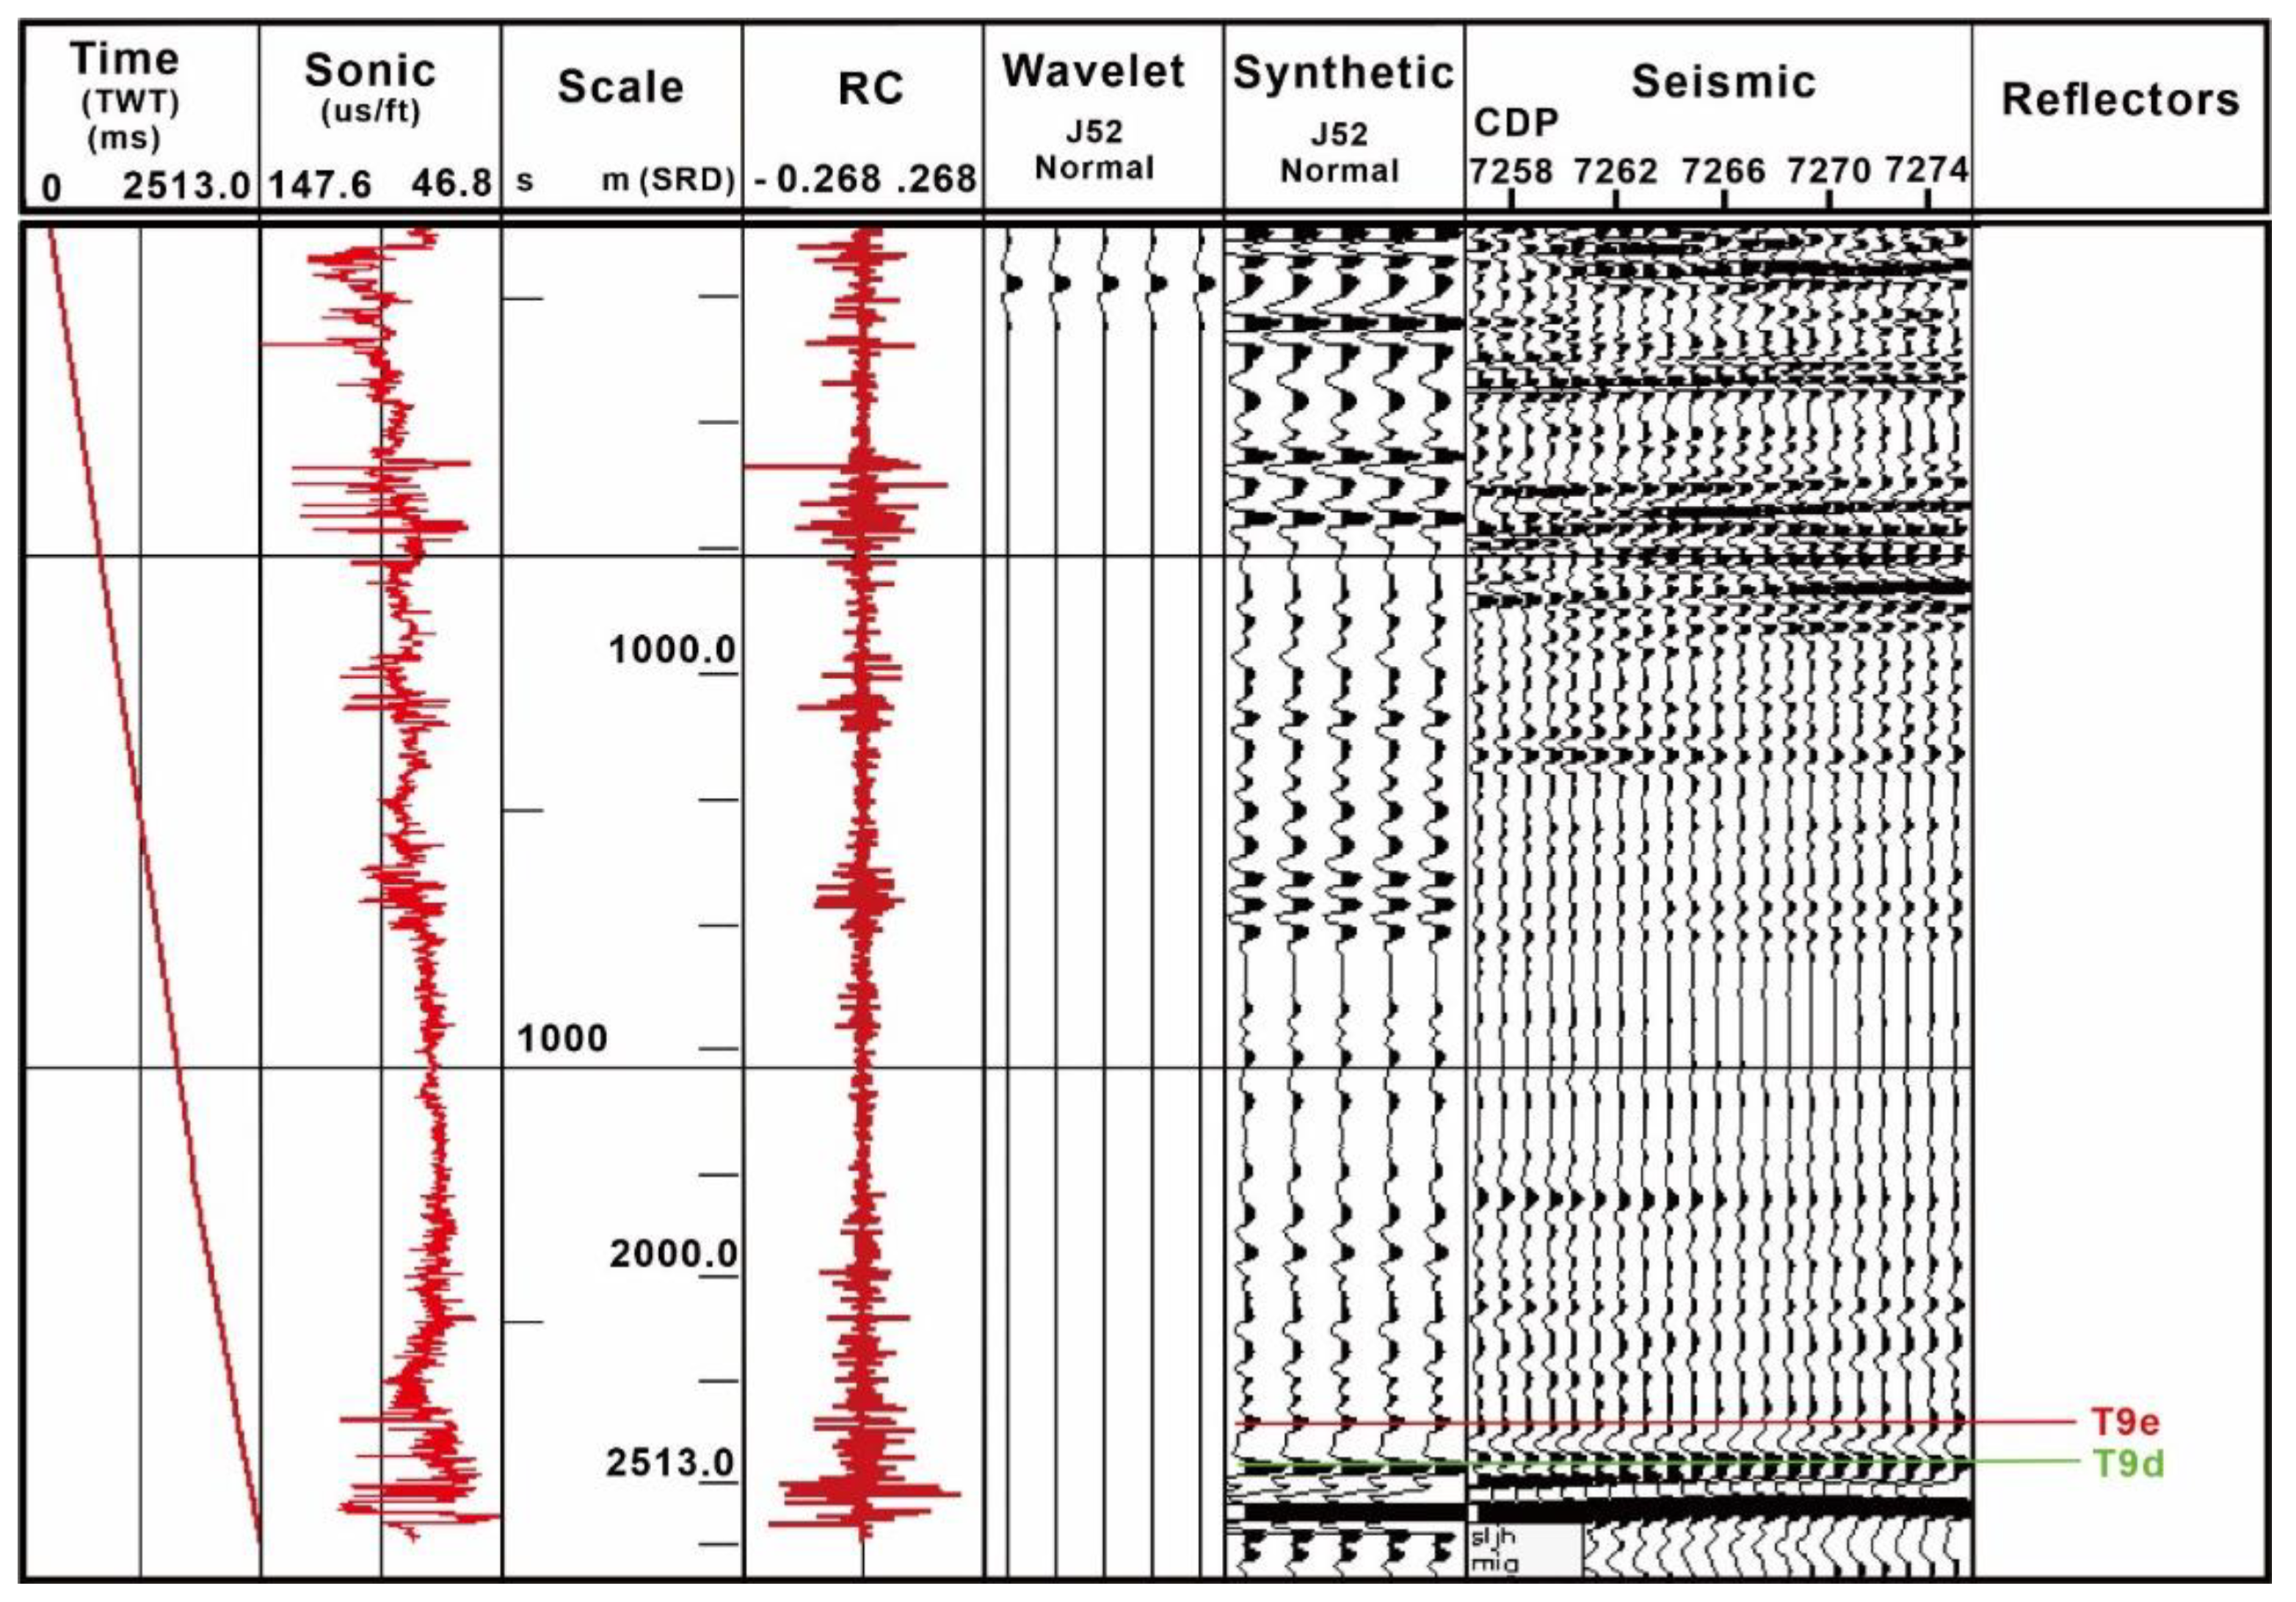
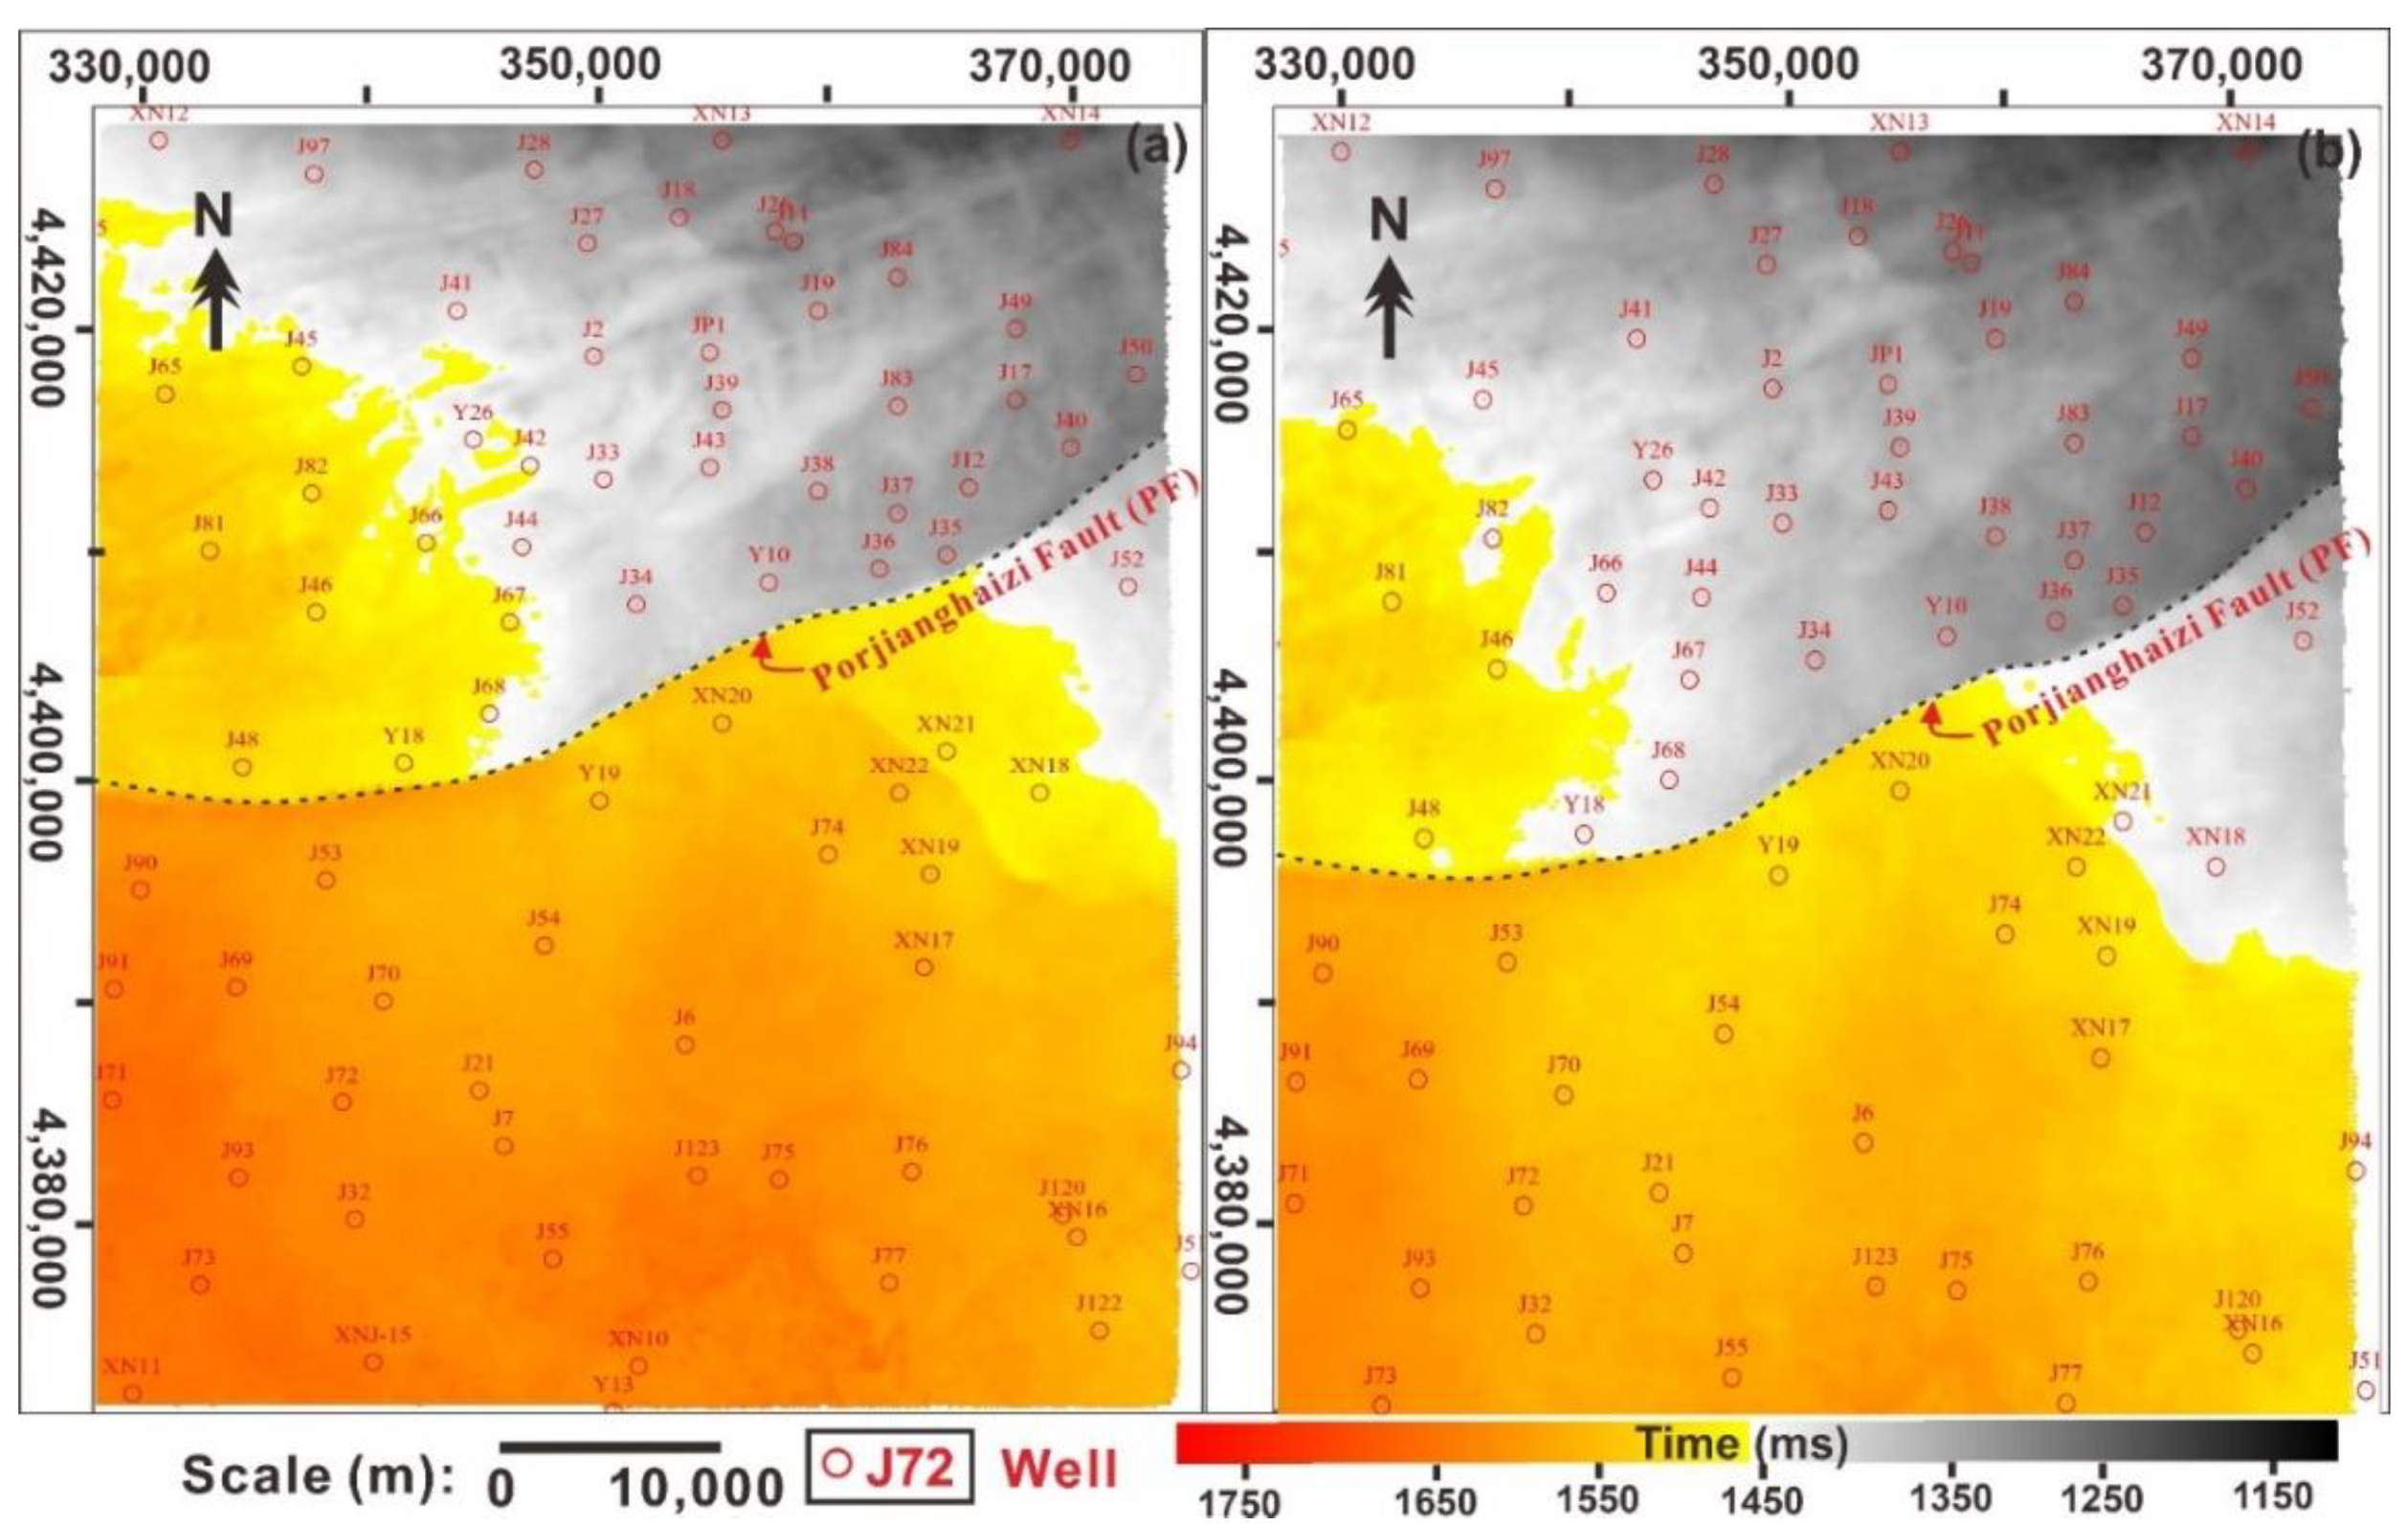
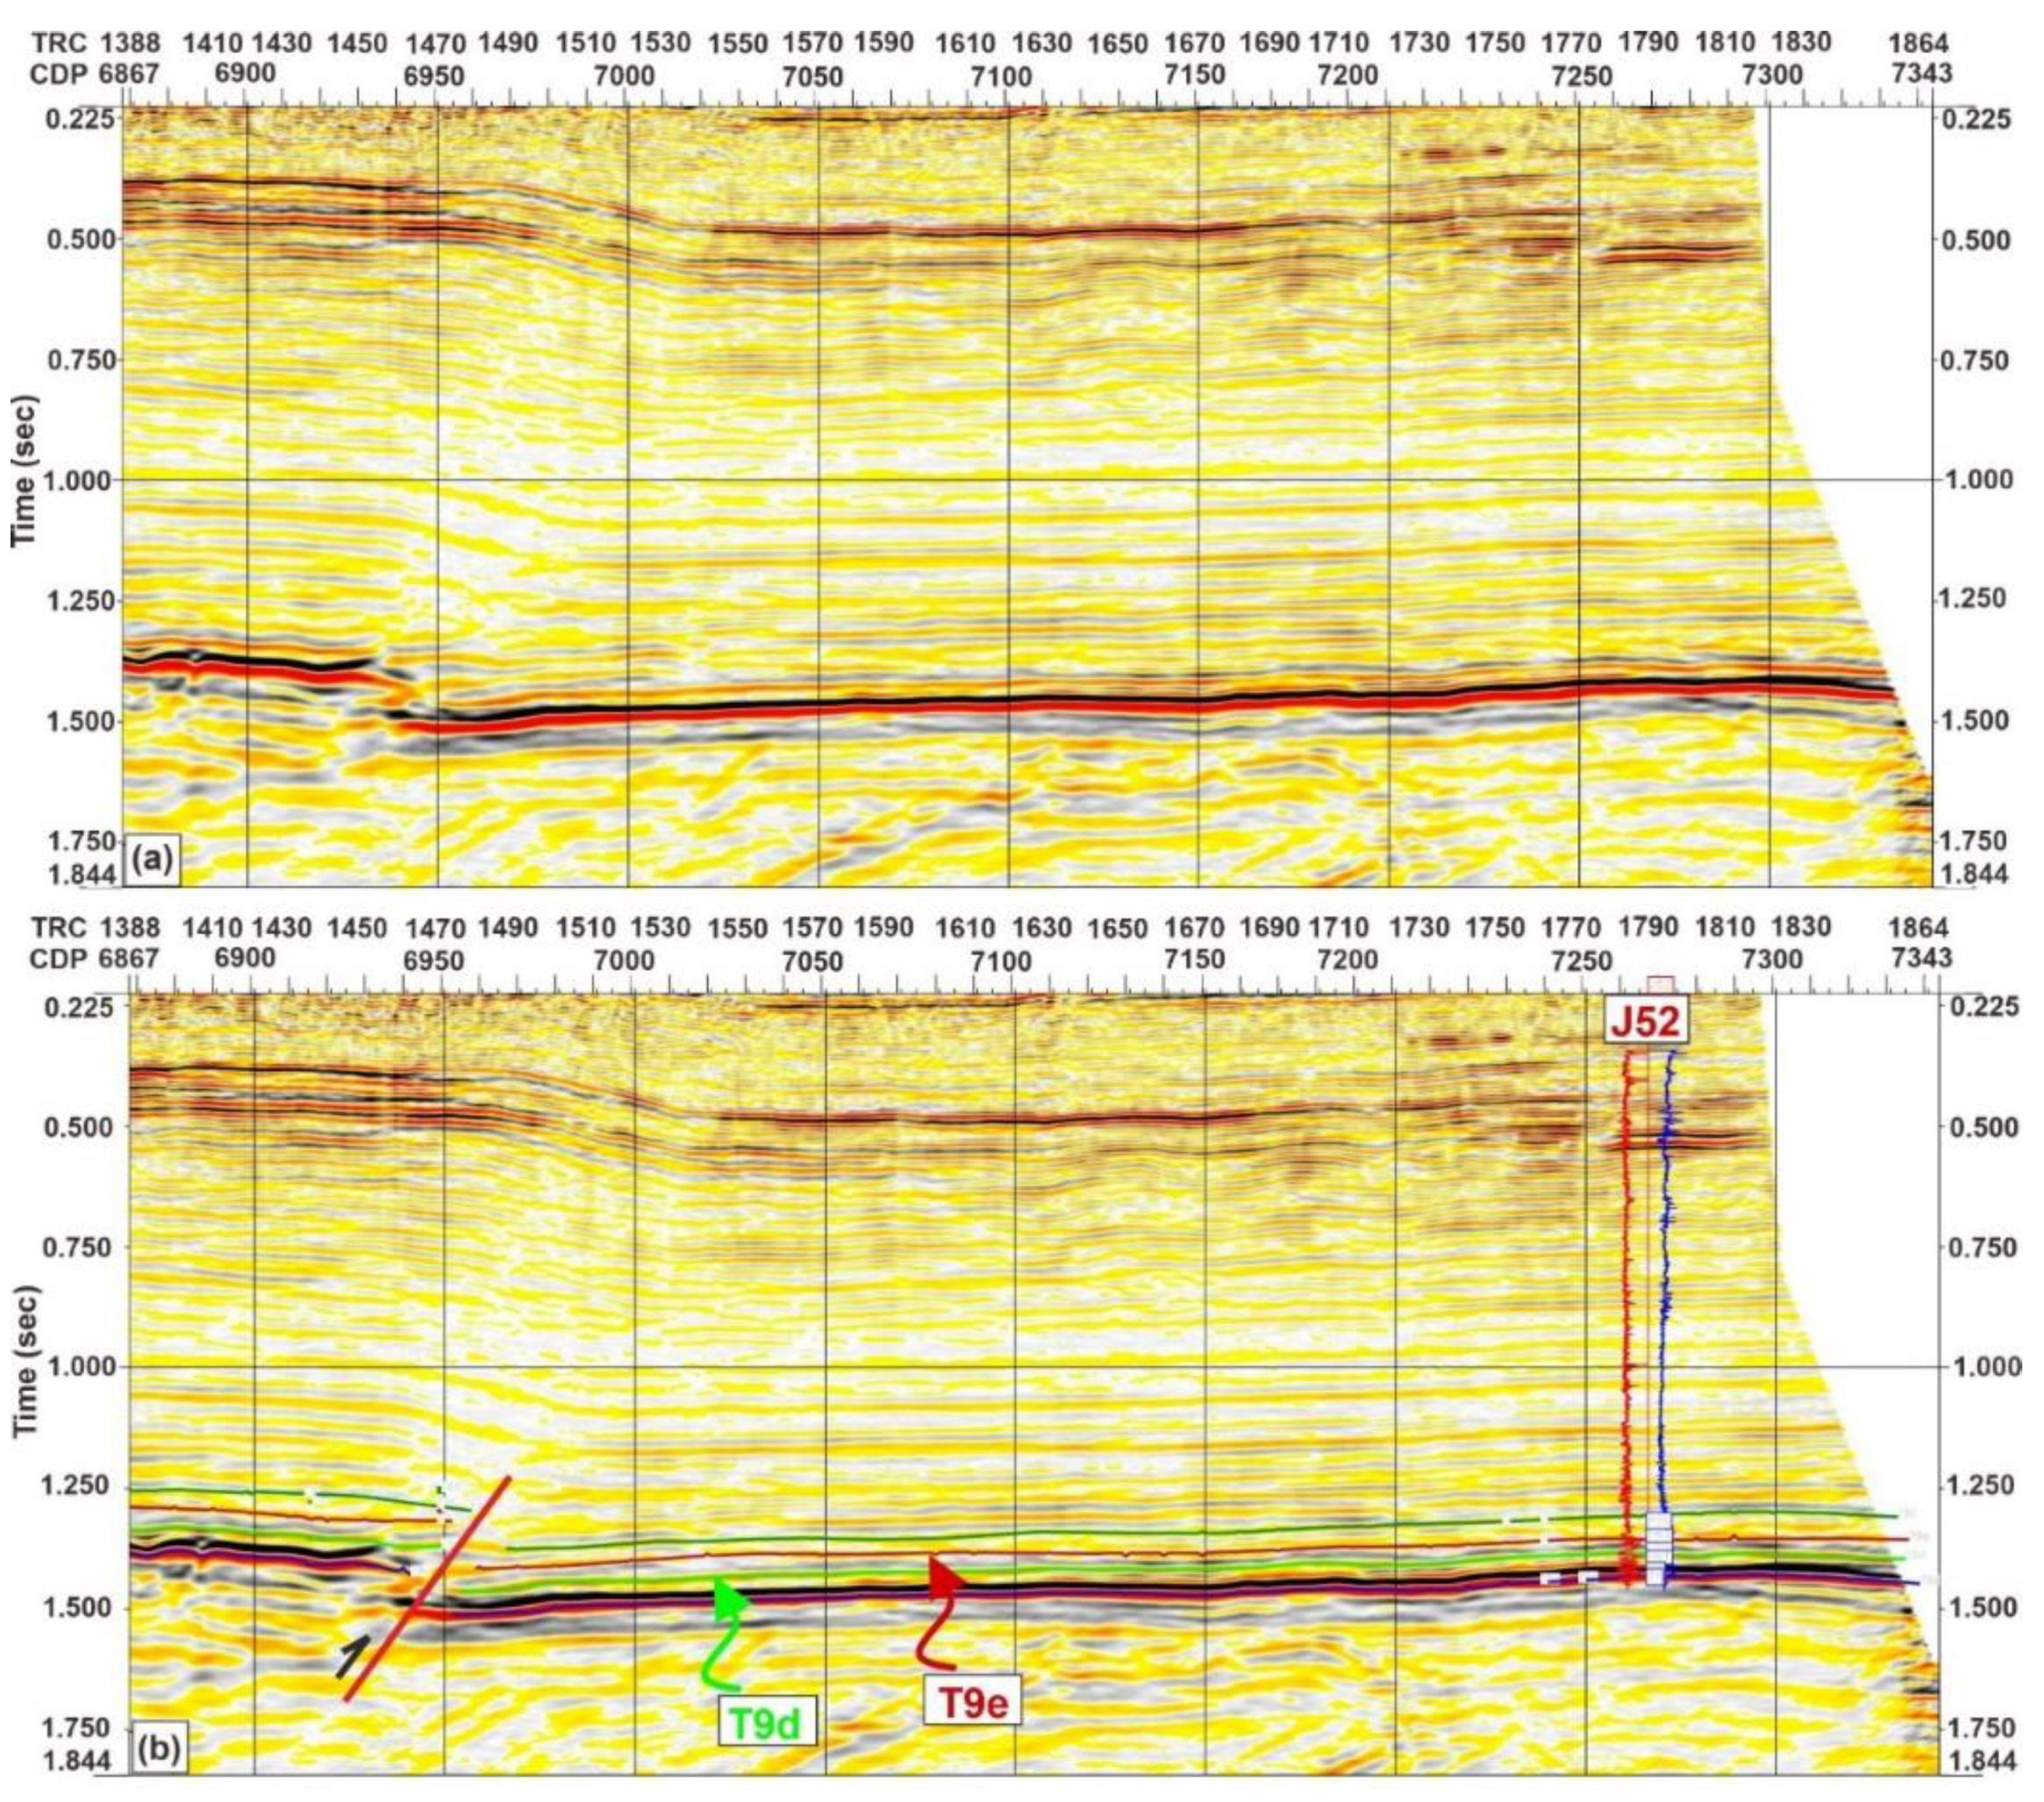
4.2. Seismic Interpretation

Integrated seismic and well log data was employed to make a relationship between the seismic interfaces and geological characteristics. Through the seismic-to-well tie method, two horizons are marked T9d and T9e [48,49] (Figure 5). These two marked horizons denote the first member (P2x1) of the LSF. The interpolations of the interpreted horizons show the major P-fault, which divides the study area into northern and southern parts (Figure 6a,b).
The middle Permian sediments of LSF show parallel internal geometry configuration on the seismic section. The external geometry shows the features of narrow undercutting that indicate channel fill. The seismic reflection configuration of the member-1 of LSF shows the characteristics of medium-amplitude, good-continuity, and medium-frequency (Figure 7a,b). According to the geological data, the lithology of these middle Permian sediments comprised coarse-to-fine-grained sandstone, mudstone with thin intercalations of siltstone. The narrow seismic section of Carboniferous below the Permian sediments shows the disordered weak reflections of low-amplitude and low-continuity which are associated with soft-sediments. The seismic reflections are divergent due to the presence of faulting. These soft sediments are associated with mudstone and coal layers (Figure 2 and Figure 7b).

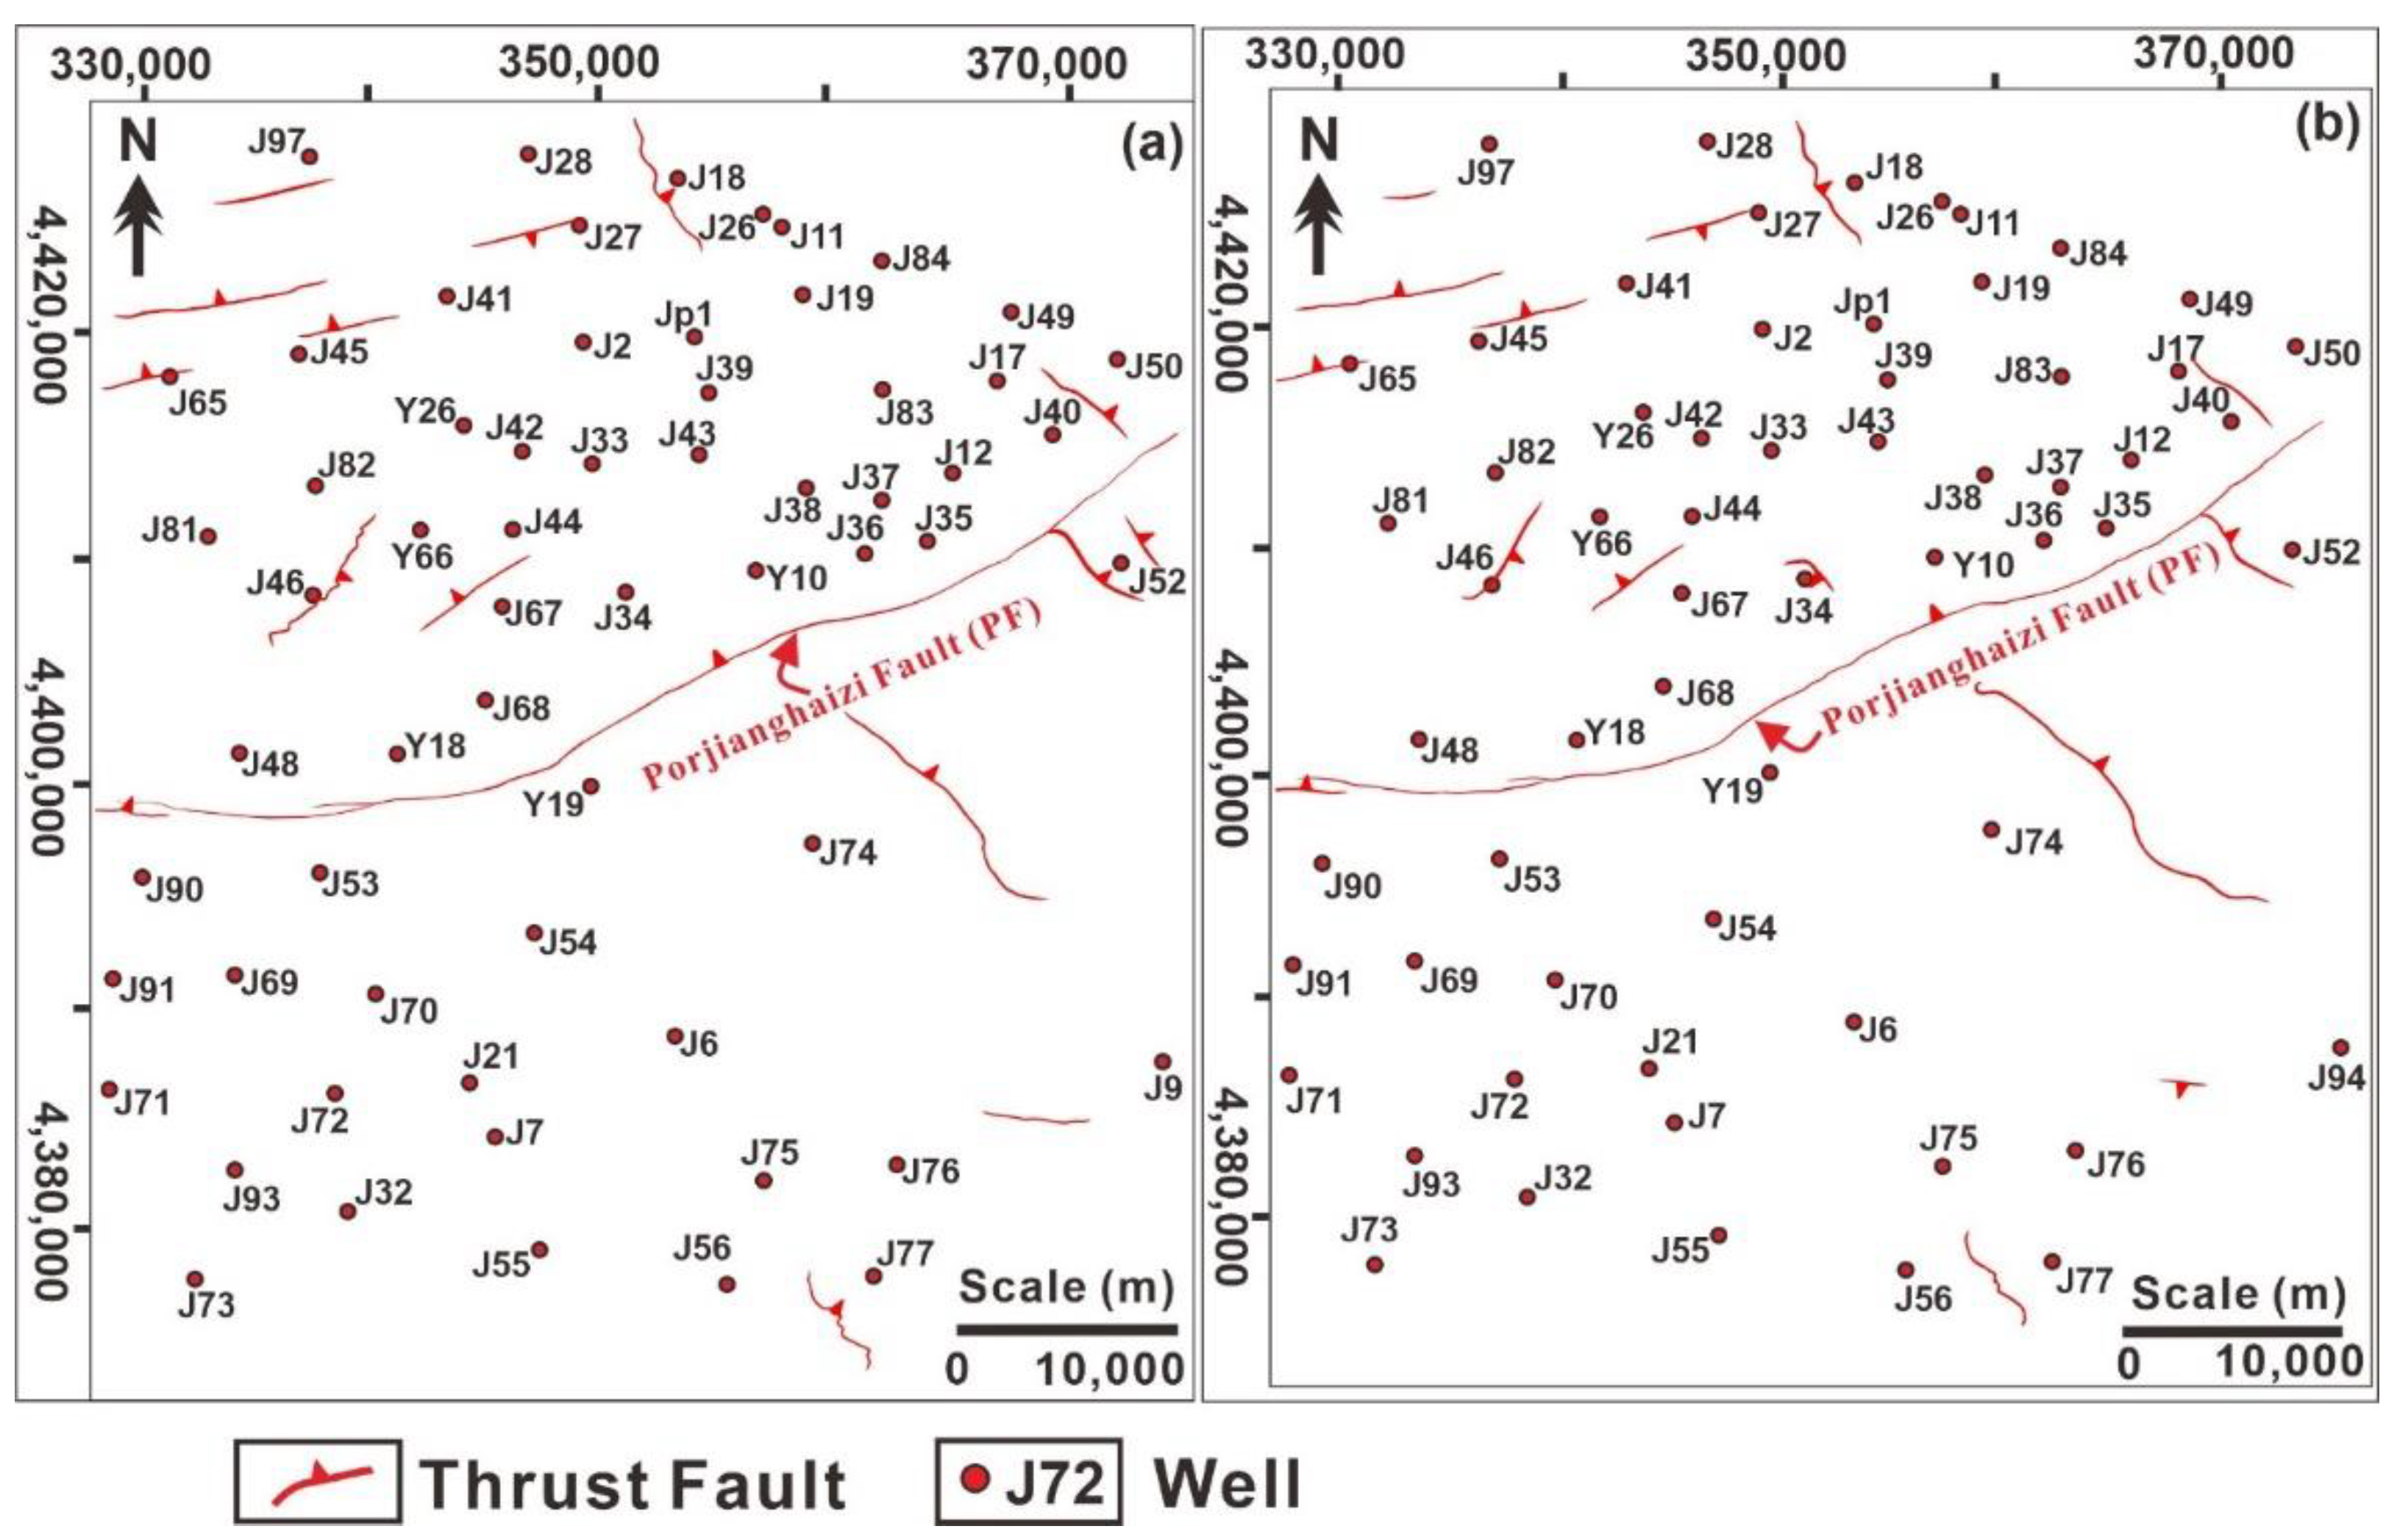
4.3. Fault Characteristics of Lower Shihezi Member-1

The results of the fault distribution of targeted T9d and T9e horizons show that P-fault mainly controls the Hangjinqi area. The P-fault is extending laterally and is the main reason for the presence of frequent low-to-medium ranked faults. The author [31] sub-divided the Hangjinqi fault zone (HFZ) into east (P-fault), central (WF), and west (SF) (Figure 1b). The three segments of faults subtly established in the east Hangjinqi area is as follows: (a) late Haixi fault (weak extrusion) developed near well J75 and Shiguhao area, (b) early Yanshan late fault (strong extrusion) developed in the regions of Shiguhao and Azhen areas, and (c) late Yanshan early fault (weak extension and positive inversion) developed in P-fault zone, Lijiaqu fault zone and Shiguhao and Azhen area [11]. The Hangjinqi area is characterized by many thrust faults. The P-fault is north-trending thrust fault [9]. Many small-scale local faults are scattered along the whole region. However, the northern region has suffered more tectonic activity than the southern region (Figure 8a,b).

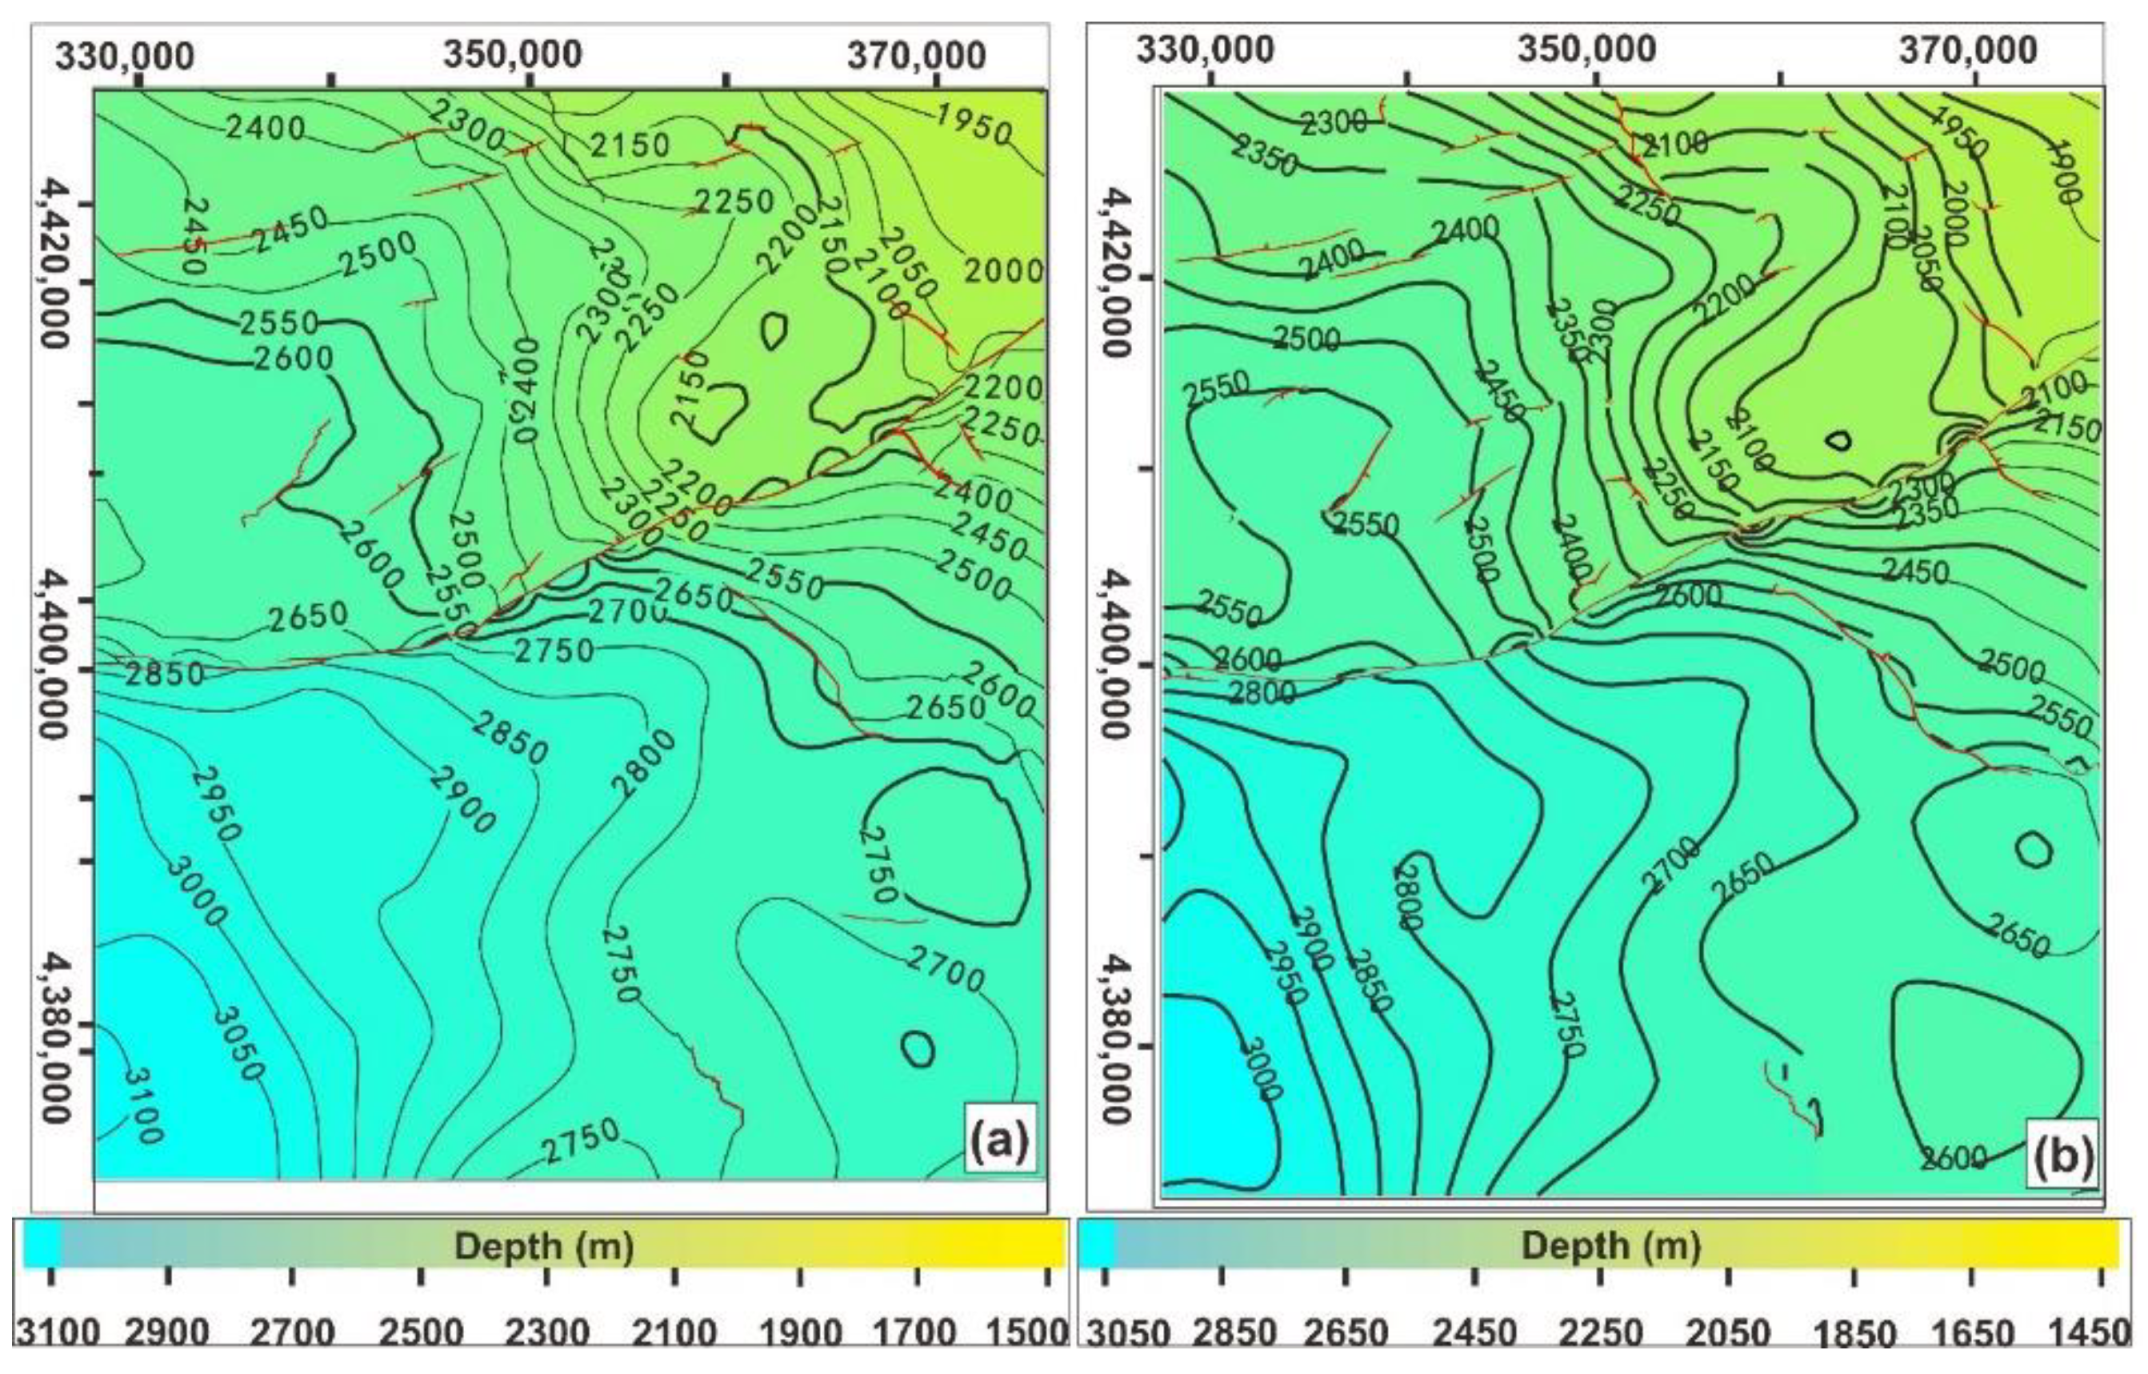
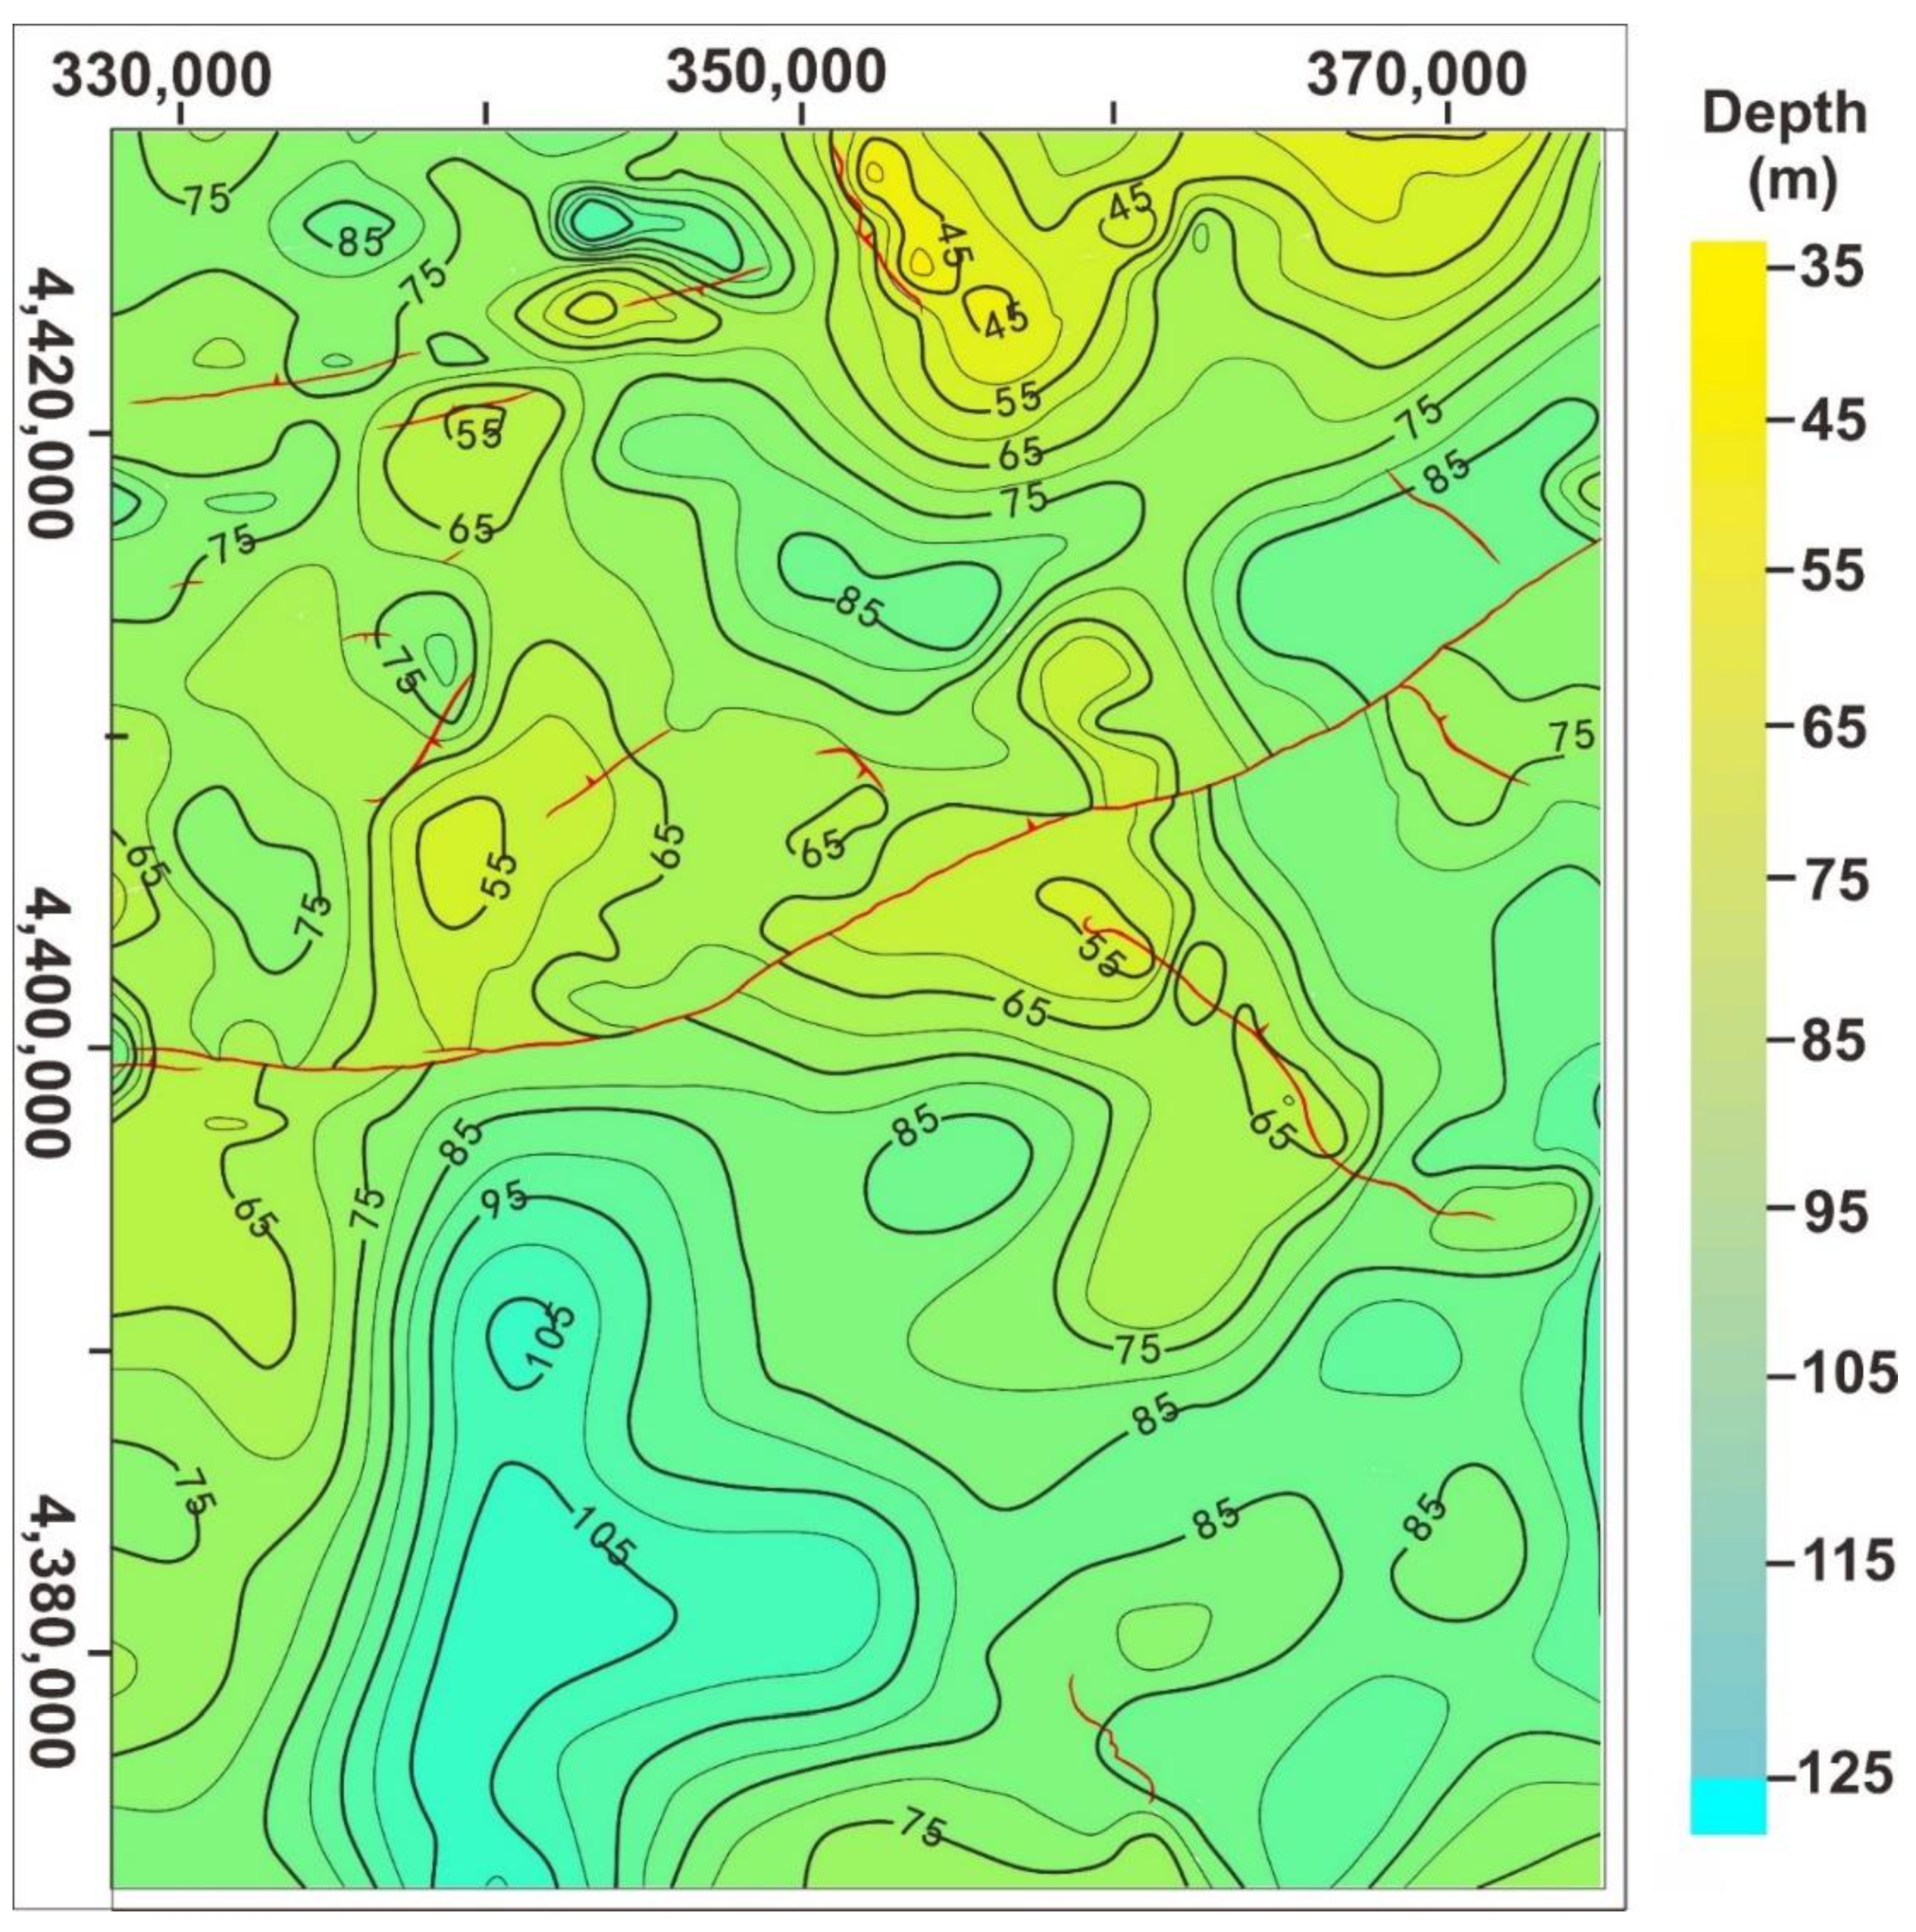
4.4. Structural Mapping

Structure maps provide the relief of the strata below the surface, such as syncline, anticline, and faults. The structural maps of T9d and T9e horizons are made by incorporating the average velocities of all the wells. The results show significant structural variations. The structural depth ranges from 1950 m to 3100 m for T9d (Figure 9a), while it ranges from 1900 m to 3000 m for T9e (Figure 9b). The structural trend of both targeted horizons shows almost same trend having same structural depths. The southern region shows depths of around 2800–3050 m. In contrast, the northern region shows shallow depths of 1950–2400 m. The P-fault played a significant role in dividing the Hangjinqi area into northern and southern regions. The topography of these maps suggests that the northern area is uplifted compared to the southern region. The northeastern (NE) region shows stratigraphic thinning of about 1900 m, compared to northwestern (NW) and southern regions, which shows that the NE region is more uplifted than other regions.

4.5. Thickness Mapping

The thickness map displays the thickness of the targeted strata. The variations in the thickness indicate erosion surfaces, slope identification, and structural discontinuities. A thickness map was drawn amongst these two targeted horizons of T9d-T9e. The results suggest vast thickness variations in the member-1 (P2x1) of the LSF. The thickness ranges from 40 m to 110 m. The thickness is lesser in the northern region as compared to the southern region. The thickness in the north part ranges from 45 m to 85 m, while it ranges from 65 m to 105 m in the south area (Figure 10). The northeastern region’s lesser thickness of about 45 m suggests erosion due to uplifting based on the following reasons; (a) faulting intensity towards the north is high, (b) presence of scouring surface and friable argillaceous material in the cores, (c) prominent coarse-grained arenaceous lithology. The NE region is more uplifted as compared to NW and southern regions. These results agree with the results of the structural mapping, which also shows the same trend. The uplifted NE region suggests the origin of the braided channel river within the member-1 (P2x1) of the LSF. The gentle slope trend lies from NE to SW region, providing the flowing direction of braided channels. The thicknesses of the different layers were disturbed by the presence of major P-fault, which offset the sedimentary layers.

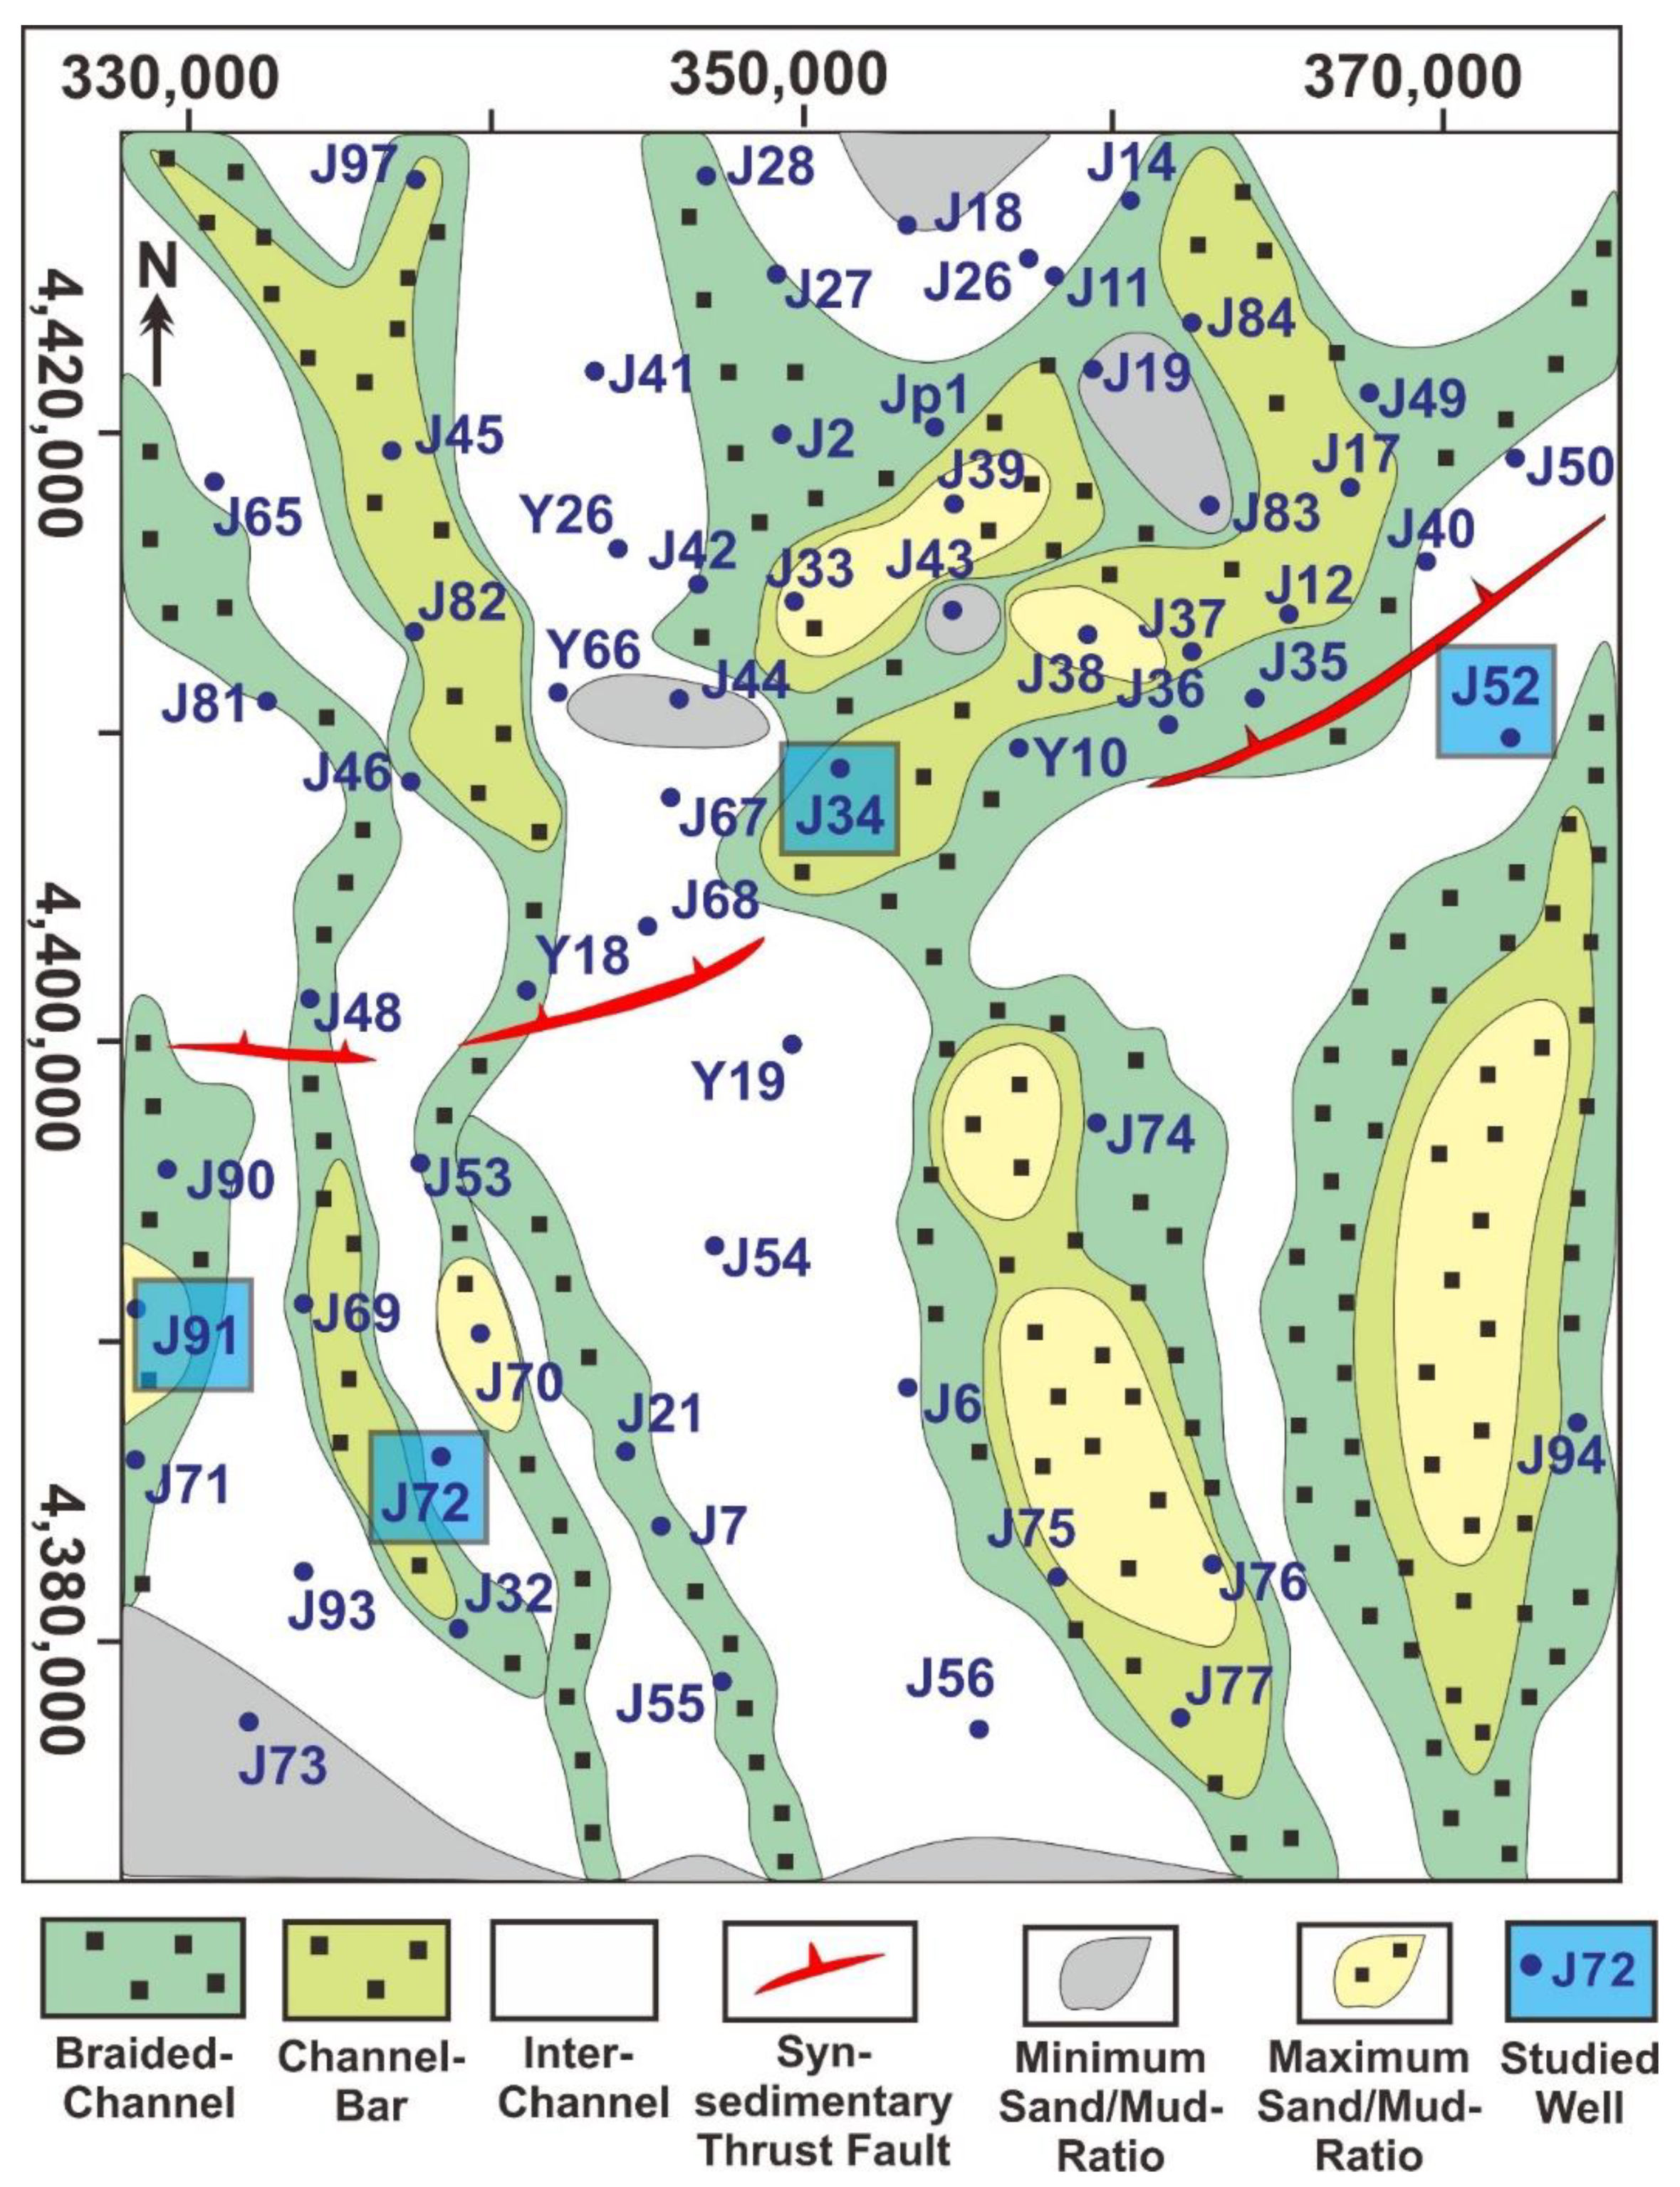
4.6. Sand-Ratio Distribution

Sand-ratio map provides information regarding the distribution of sandstone and mudstone across the targeted layers. It also showcases the distribution of sand gas accumulation zones. Sand-ratio map was calibrated for the member-1 of the LSF, which lies in between T9d and T9e horizons. The yellow color in the sand-ratio map shows the deposition of minimum sand and maximum mud, whereas cyan color shows the deposition of maximum sandstone and minimum mudstone (Figure 11). The sand-ratio ranges from 0.4 to 0.9 in the region. However, most areas show maximum values of 0.65–0.9, which shows that the member-1 of LSF is favorable to gas accumulation. The results also give the indication of thick braided channels. The high values of sand/mud ratio gives the indication of channel-bars.

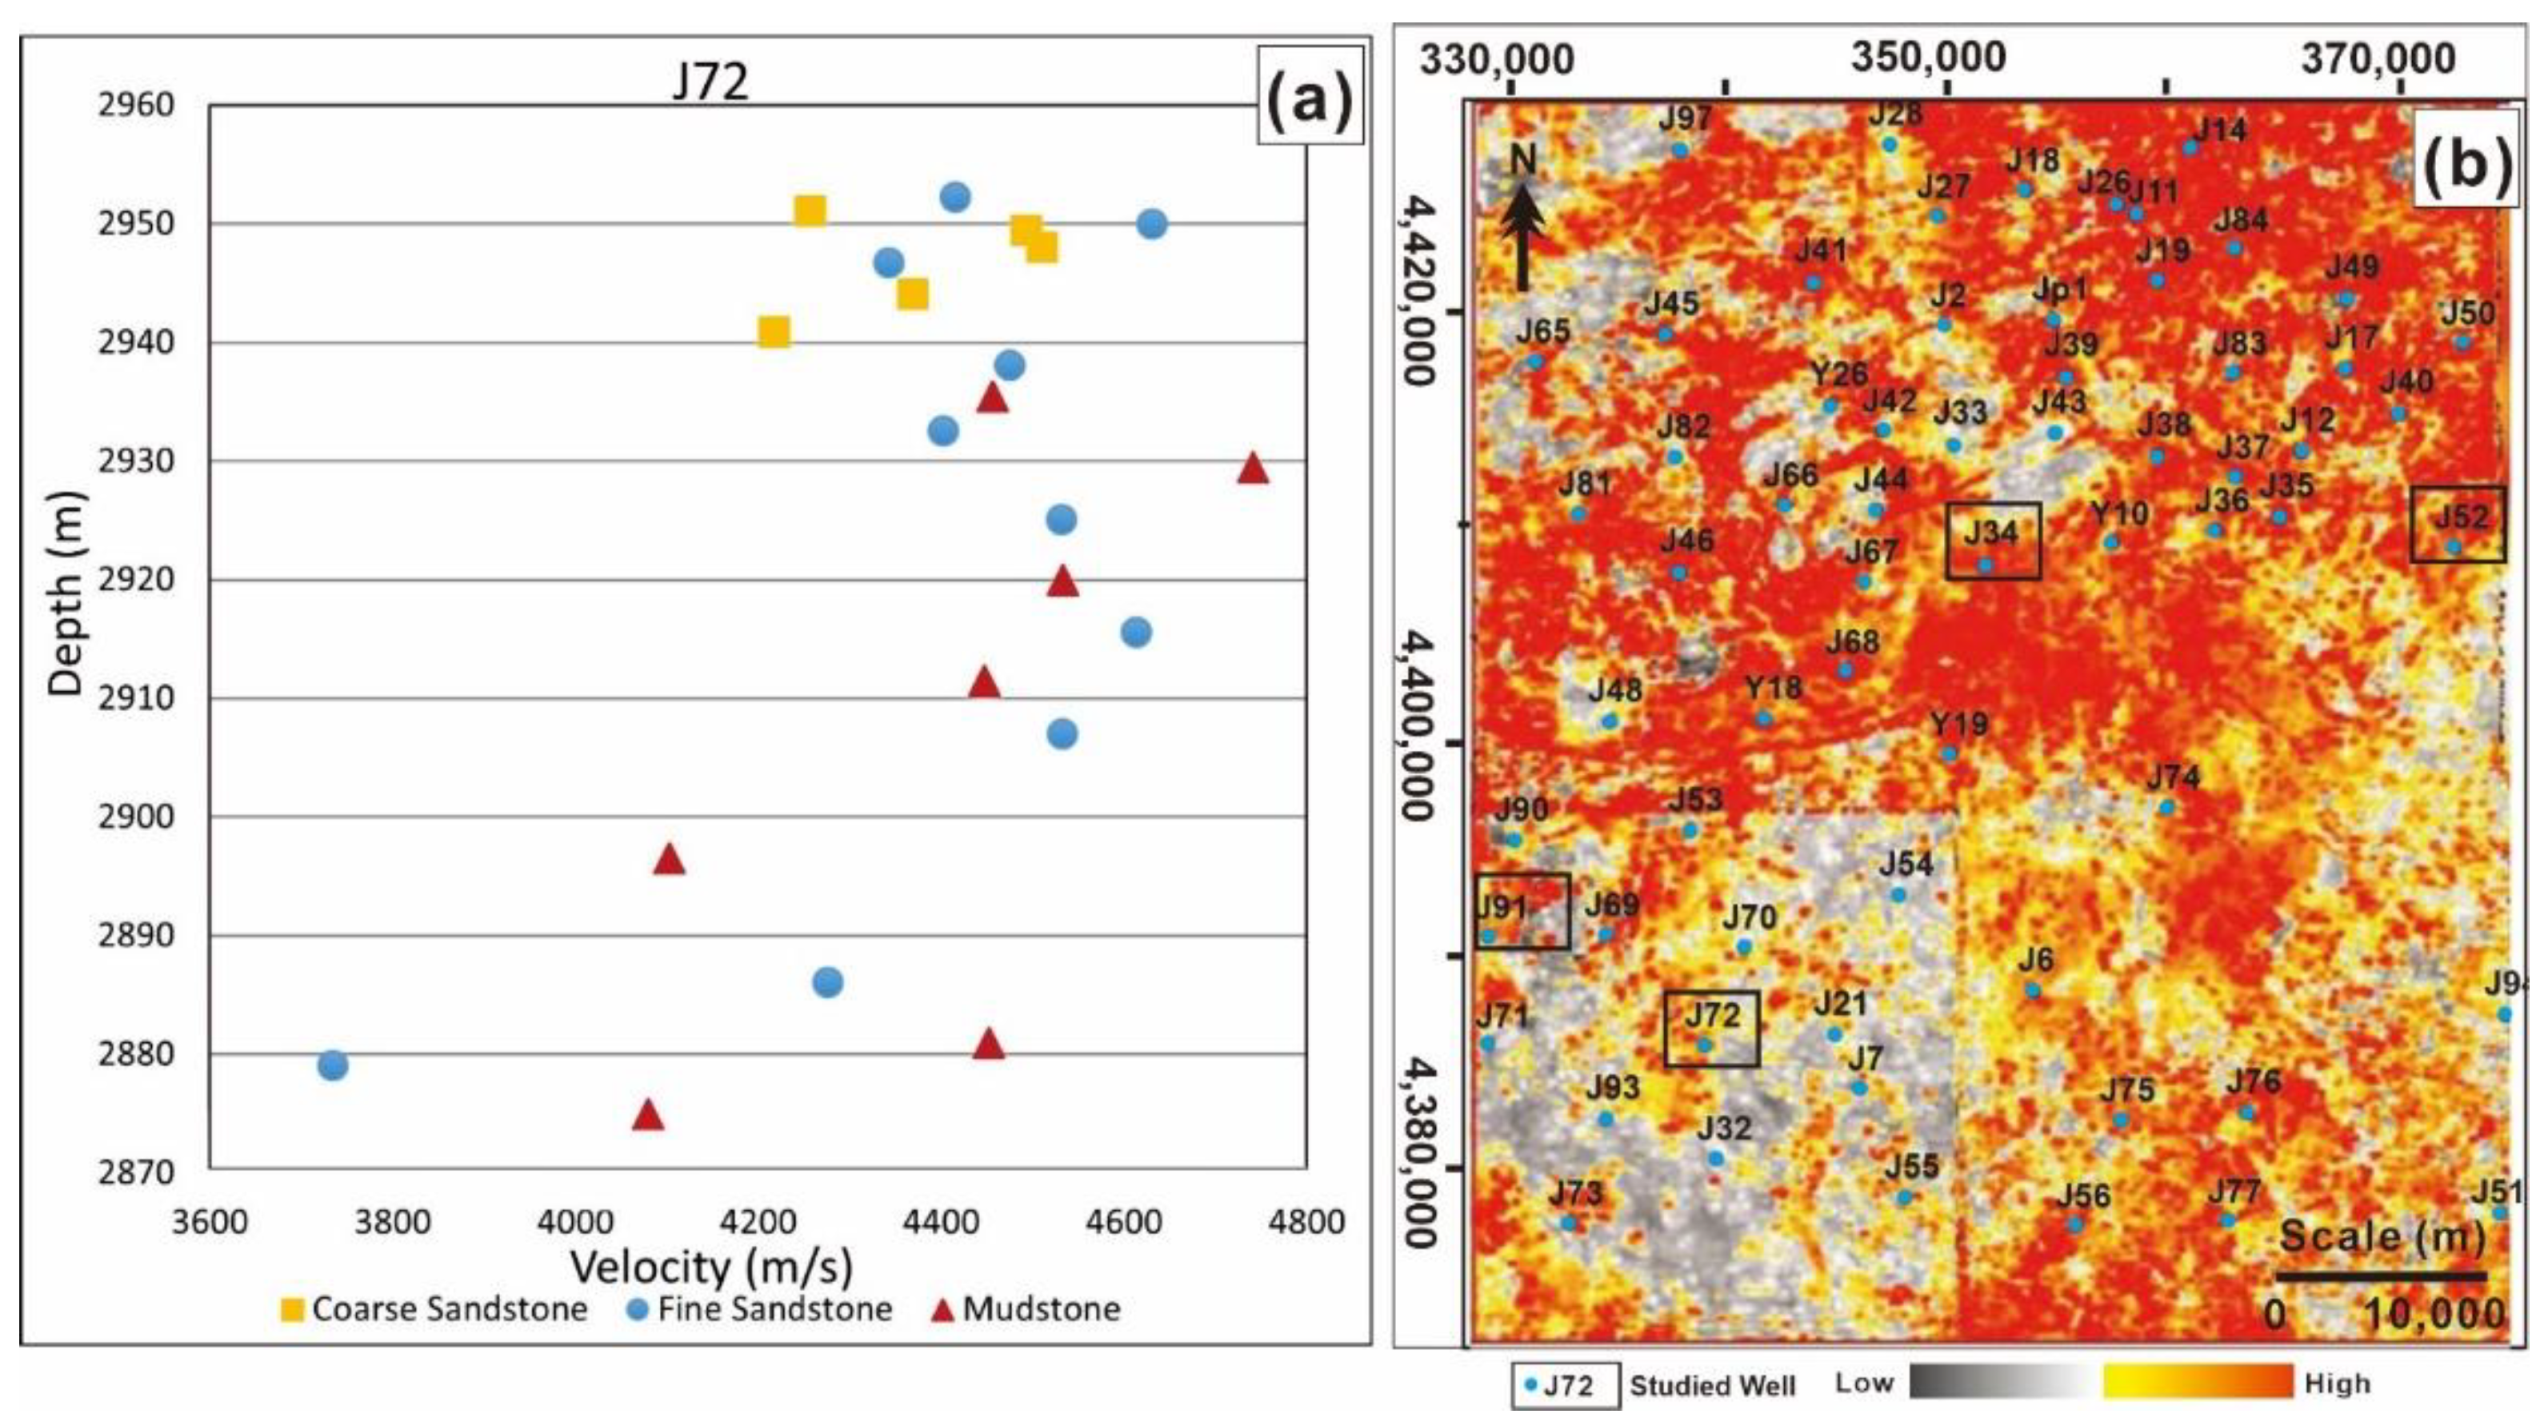
4.7. Velocity Optimization and RMS Attribute Map

Before extracting several horizon attributes to identify sand zones, interval velocities of different lithologies are utilized for attribute optimization. The member-1 of the LSF comprised various lithologies such as coarse sandstone (pebbly sandstone, sandy conglomerate), fine sandstone, and mudstone. The results show that the mudstone and coarse-to-fine sandstone have different interval velocities. These differences in the interval velocities indicate the difference in acoustic impedance amongst various lithologies (Figure 12a). Thus, seismic amplitude reflection can be seen in the section, which confirms that the ampllitude attributes can be utilized to identify sand zones.
Numerous seismic attributes are employed to identify the behavior of sand accumulation. Several amplitude attributes are evaluated to acquire the best possible results. The RMS attribute provided good results, hence incorporated in the study. RMS map is made between the targeted T9d and T9e horizons. The horizon RMS attribute map shows variations in amplitude values associated with lithological changes, sand/mud zones, and various depositional environments. The high values are associated with shoreward sand facies, whereas low-amplitude values are associated with mud-saturated zones. The RMS map shows high values throughout the map except for the SW region, which suggests that the sand is thoroughly distributed throughout the targeted area. The RMS amplitude values are maximum towards the NE region, where the values are quite low at the SW region. However, wells J72, J69, J91, and J55 towards the SW region lie reasonably in high amplitude values. The noticeable square pattern towards the SW region is due to the presence of another 3D grid that lies in the Hangjinqi area, and is not an artefact (Figure 12b). Corollary, the results of RMS attribute analysis show that the member-1 of the LSF has the potential to produce a good reservoir.

5. Discussion

5.1. Reservoir Quality Prediction through Petrophysical Modeling

There is one perforation interval within the well J34 (Figure 13a). The depth of the perforated layer ranges from 2337–2341 m. The thickness of the perforated interval is 4 m. The average porosity value of the perforated interval is 13.1 %. The average permeability value of the interval is 0.8 mD. The perforated layer is less affected by mud intrusion and diameter expansion. The log curves of the reservoir section show high resistivity, low GR, low SP, low density, medium AC, and high porosity-permeability values. The test gas production volume is 3192 m3/day, and the water volume is 0 m3/day. The gas logging curve of the total hydrocarbon value is high at reservoir interval. These log interpretation results suggest that the reservoir is a pure gas layer. Henceforth, well J34 within the LSF belongs to a good sandstone gas reservoir.
One perforation interval lies within the member-1 of the LSF within well J52 (Figure 13b). The depth of the perforated layer ranges from 2317.5–2321.5 m. The total thickness of the perforated interval is 4 m. The average porosity value of the interval is 14.5%. The average permeability value of the interval is 2.6 mD. The perforated layer is less affected by mud intrusion and diameter expansion. The log curves of the reservoir section show medium resistivity, low GR, low SP, medium density, relatively low AC, and high porosity-permeability values. The test gas production volume is 0 m3/day, and the water volume is 12 m3/day. The gas logging curve of total hydrocarbon value (TG) is minimum close to reservoir depth. These log interpretation results suggest that the reservoir is a dry well. Henceforth, the reservoir within J52 of the LSF belongs to a dry well. The possible reason for the zero gas production within J52 is its location near the P-fault. The faults offset the layers, and the gas through the open spaces was migrated towards the northern region from the southern region.
There is one perforation interval within the well J72 (Figure 13c). The depth of the perforated layer ranges from 2939–2943 m. The thickness of the perforated interval is 4 m. The average porosity value of the perforated interval is 9.8%. The average permeability value of the interval is 0.31 mD. The perforated layer is less affected by mud intrusion and diameter expansion. The log curves of the reservoir section show medium resistivity, low GR, low SP, low density, medium AC, and low porosity-permeability values. The test gas production volume is 11220 m3/day, and the water volume is 2.2 m3/day. The gas logging curve of the total hydrocarbon value is close to 10 at reservoir interval. These log interpretation results suggest that the reservoir is not a pure gas but a water-gas layer. Henceforth, well J72 within the LSF belongs to a medium tight sandstone reservoir because of medium resistivity and low porosity-permeability values and water in the gas.

5.2. Controlling Factors and Demarcation of Favorable Zones of Sand Accumulation

The evolution of P-fault in the Hangjinqi area controls the migration of the hydrocarbon in the northern region [9]. In addition to the P-fault, many local faults were also developed in the northern region, whereas the faults developed in the southern region were small in numbers and sparse (Figure 8). During the Taiyuan-LSF periods, the depositional environment of the basin was changed from marine environment to continental depositional environment (Figure 2). Therefore, the structural and thickness map results showed an uplifting trend in the northern region and a deepening trend in the southern zone, thus forming a gentle slope. Moreover, the P-fault was steadily linked by separate reverse faults during the late development of the evolution process, due to which structural transformation zones paved the way for transporting the channels. Therefore, the sedimentary facies of the middle Permian sediments of the LSF comprises fluvial deposits. The main controlling factors include the development of paleogeomorphology, variations in tectonic movements due to the presence of major P-fault, maximum sediment supply, and supporting climate conditions for the formation of braided river channels as the dominant depositional microfacies for the member-1 of the LSF within the Hangjinqi area.
The depositional facies map made through the integrated results of the sand-ratio map and RMS attribute map confirmed the presence of braided river channels (Figure 14). These braided channels are very thick in the northern region and flow towards the south region. The channels are narrowing, and the major micro-facies developed are channel-bars and bradided channel deposits. The RMS and sand-ratio values are quite high, indicating thick-bedded sandstone deposition. The sand-ratio values towards the NE and SE regions are quite high compared to the SW region. The channels towards the SW region are thin, and the sand-ratio and RMS values are relatively low. The wells J73, J93, Y19, and J54 lie within the low RMS zone. In addition, wells J66, Y26, J18, J19, J41, J43, J44, J73, and J83 show minimum sand-ratio values. On the contrary, wells J33, J37, J39, J70, J75, J76, and J91 lie within the maximum sand-ratio zone.
Three wells J34, J52 and J72, were chosen to study the test results. The test results of well J34 shows that the perforation layer is a pure gas layer. The high RMS and high sand/mud values at J34 also support these results. The test results of well J52 shows that the perforation layer is a dry gas layer with zero gas volume. The results of the proposed depositional facies map are reliable, showing that J52 lies within minimum sand-ratio zone. Since J52 lies in the vicinity of P-fault, it was heavily affected by tectonic activity. Due to uplifting towards the northern region, the accumulated gas in the southern region was affected and migrated laterally towards the northern region through the open areas in the P-fault [29]. The test results of well J72 shows that the perforation layer is a gas-water layer. Well J72, located towards the SW region of the Hangjinqi area, lies within the relatively medium sand-ratio zone. The RMS values are also optimal for producing a relatively good reservoir in J72 wells. Wells J34 and J72 lies in the channel-bar deposits, whereas well J52 lies within the inter-channel region. Thick braided channels are passing through J34, narrow channels through J72, while no channel are passing through J52. These results shows that J34 lies in the most favorable zone, while J52 is least favorable zone. Overall results of the proposed depositional facies maps predicts that the reservoir quality within the member-1 of the LSF is good for regional gas production.

6. Conclusions

This study has identified the depositional framework and sedimentary facies controls by analyzing the rock type characteristics, faults and facies distribution, sand-ratio accumulation, and other significant sedimentary features using drilling cores, logs, and 3D seismic data in the member-1 of the lower Shihezi formation in the Hangjinqi area. The results of the cores and well logging showed depositional framework of member-1 reservoir was established into braided channels and channel-bars. The thickness and structural maps suggested that the north area is uplifted as compare to south region. The uplifting in the northeastern region shows that the braided channels flows from north towards south region. The uplifting towards the north causes the structural thinning towards the southern region making a gentle slope towards the southwestern region, due to which the channels become narrower towards SW region. The thick-bedded sand bodies are discontinuous and scattered along the whole area due to the presence of the P-fault, which played a major role in migrating the gas of nearby well J52 from the south towards the uplifted northern region. The test results of well J34 and J72 showed the presence of gas. In addition, we have also highlighted the regions of maximum sand/mud ratio and channel-bars, which are favorable for gas production. In a nutshell, we predicted that the reservoir quality within the member-1 of the lower Shihezi formation is favorable and can produce gas reserves regionally and economically. The proposed facies model will provide further insights towards the development of Hangjinqi area into Hangjinqi gas field.

Author Contributions

A.A. (Aqsa Anees), W.S. and U.A. conceived this study. W.S. supervised this project. R.W. and K.L. undertook the responsibility of arranging the data for this project. A.A. (Aqsa Anees) and U.A. wrote the manuscript. A.A. (Ayesha Abbas), Z.U. and Y.Z. helped in formal analysis and software. X.Z., L.D. and F.L. discussed the data. S.T. and H.Z. reviewed the manuscript and provided the necessary funding. All authors have read and agreed to the published version of the manuscript.

Funding

This research was supported by the National Natural Science Foundation of China (Grant Nos. 4162134 and 41820104008), the National Key R & D program of China (2017YFE0106300), the 13th Five year Plan of the Ministry of Science and Technology of China (2016ZX05034-002003), the Fundamental Research Funds for the Central Universities, China University of Geosciences (Wuhan) (CUGCJ1712), and the Open Fund of the Key Laboratory of Tectonics and Petroleum Resources (China University of Geosciences in Wuhan) (TPR-2018-18), and Yunnan Provincial Government Leading Scientist Program, No. 2015HA024.

Data Availability Statement

The data underlying this article cannot be shared publicly due to reason that it is confidential for the privacy of individuals that participated in the study. However, the data will be shared on reasonable request to the corresponding author.

Acknowledgments

I am grateful to my former supervisor Shi Wanzhong for providing the necessary data, guidance, support, software, and technical help to accomplish this research. I am also thankful for my labmates at the China University of Geosciences. I also acknowledge the China University of Geosciences, Wuhan, and Yunnan University for funding this project.

Conflicts of Interest

The authors declare no conflict of interest.

References

  1. Shao, X.; Pang, X.; Jiang, F.; Li, L.; Huyan, Y.; Zheng, D. Reservoir Characterization of Tight Sandstones Using Nuclear Magnetic Resonance and Incremental Pressure Mercury Injection Experiments: Implication for Tight Sand Gas Reservoir Quality. Energy Fuels 2017, 31, 10420–10431. [Google Scholar] [CrossRef]
  2. AlRassas, A.M.; Al-Qaness, M.A.A.; Ewees, A.A.; Ren, S.; Elaziz, M.A.; Damaševičius, R.; Krilavičius, T. Optimized ANFIS Model Using Aquila Optimizer for Oil Production Forecasting. Processes 2021, 9, 1194. [Google Scholar] [CrossRef]
  3. Dai, J.; Ni, Y.; Wu, X. Tight gas in China and its significance in exploration and exploitation. Pet. Explor. Dev. 2012, 39, 257–264. [Google Scholar] [CrossRef]
  4. Adebayo, A.R.; Babalola, L.; Hussaini, S.R.; Alqubalee, A.; Babu, R.S. Insight into the Pore Characteristics of a Saudi Arabian Tight Gas Sand Reservoir. Energies 2019, 12, 4302. [Google Scholar] [CrossRef] [Green Version]
  5. Ashraf, U.; Zhang, H.; Anees, A.; Ali, M.; Zhang, X.; Abbasi, S.S.; Mangi, H.N. Controls on Reservoir Heterogeneity of a Shallow-Marine Reservoir in Sawan Gas Field, SE Pakistan: Implications for Reservoir Quality Prediction Using Acoustic Impedance Inversion. Water 2020, 12, 2972. [Google Scholar] [CrossRef]
  6. Barshep, D.V.; Worden, R.H. Reservoir Quality of Upper Jurassic Corallian Sandstones, Weald Basin, UK. Geosciences 2021, 11, 446. [Google Scholar] [CrossRef]
  7. Dar, Q.U.Z.; Pu, R.; Baiyegunhi, C.; Shabeer, G.; Ali, R.I.; Ashraf, U.; Sajid, Z.; Mehmood, M. The impact of diagenesis on the reservoir quality of the early Cretaceous Lower Goru sandstones in the Lower Indus Basin, Pakistan. J. Pet. Explor. Prod. Technol. 2021. [Google Scholar] [CrossRef]
  8. Wang, R.; Shi, W.; Xie, X.; Zhang, W.; Qin, S.; Liu, K.; Busbey, A.B. Clay mineral content, type, and their effects on pore throat structure and reservoir properties: Insight from the Permian tight sandstones in the Hangjinqi area, north Ordos Basin, China. Mar. Pet. Geol. 2020, 115, 104281. [Google Scholar] [CrossRef]
  9. Xu, Q.; Shi, W.; Xie, X.; Busbey, A.B.; Xu, L.; Wu, R.; Liu, K. Inversion and propagation of the Late Paleozoic Porjianghaizi fault (North Ordos Basin, China): Controls on sedimentation and gas accumulations. Mar. Pet. Geol. 2018, 91, 706–722. [Google Scholar] [CrossRef]
  10. Duan, Y.; Wang, C.; Zheng, C.; Wu, B.; Zheng, G. Geochemical study of crude oils from the Xifeng oilfield of the Ordos basin, China. J. Asian Earth Sci. 2008, 31, 341–356. [Google Scholar] [CrossRef]
  11. Yang, M.; Li, L.; Zhou, J.; Jia, H.; Sun, X.; Qu, X.; Zhou, D.; Gong, T.; Ding, C. Mesozoic structural evolution of the Hangjinqi area in the northern Ordos Basin, North China. Mar. Pet. Geol. 2015, 66, 695–710. [Google Scholar] [CrossRef]
  12. Wu, X.; Ni, C.; Liu, Q.; Liu, G.; Zhu, J.; Chen, Y. Genetic Types and Source of the Upper Paleozoic Tight Gas in the Hangjinqi Area, Northern Ordos Basin, China. Geofluids 2017, 2017, 4596273. [Google Scholar] [CrossRef] [Green Version]
  13. Anees, A.; Zhang, H.; Ahraf, U.; Wang, R.; Liu, K.; Mangi, H.N.; Jiang, R.; Zhang, X.; Liu, Q.; Tan, S.; et al. Identification of Favorable Zones of Gas Accumulation Via Fault Distribution and Sedimentary Facies: Insights from Hangjinqi Area, Northern Ordos Basin. Front. Earth Sci. 2022, 9, 1375. [Google Scholar]
  14. Mingjian, W.; Dengfa, H.; Hongping, B.; Renqi, L.; Baoling, G. Upper Palaeozoic gas accumulations of the Yimeng Uplift, Ordos Basin. Pet. Explor. Dev. 2011, 38, 30–39. [Google Scholar] [CrossRef]
  15. Anees, A.; Shi, W.; Ashraf, U.; Xu, Q. Channel identification using 3D seismic attributes and well logging in lower Shihezi Formation of Hangjinqi area, northern Ordos Basin, China. J. Appl. Geophys. 2019, 163, 139–150. [Google Scholar] [CrossRef]
  16. Paumard, V.; Bourget, J.; Durot, B.; Lacaze, S.; Payenberg, T.; George, A.D.; Lang, S. Full-volume 3D seismic interpretation methods: A new step towards high-resolution seismic stratigraphy. Interpretation 2019, 7, B33–B47. [Google Scholar] [CrossRef]
  17. von Harten, J.; de la Varga, M.; Hillier, M.; Wellmann, F. Informed Local Smoothing in 3D Implicit Geological Modeling. Minerals 2021, 11, 1281. [Google Scholar] [CrossRef]
  18. Ashraf, U.; Zhang, H.; Anees, A.; Mangi, H.N.; Ali, M.; Ullah, Z.; Zhang, X. Application of Unconventional Seismic Attributes and Unsupervised Machine Learning for the Identification of Fault and Fracture Network. Appl. Sci. 2020, 10, 3864. [Google Scholar] [CrossRef]
  19. Vo Thanh, H.; Sugai, Y. Integrated modelling framework for enhancement history matching in fluvial channel sandstone reservoirs. Upstream Oil Gas Technol. 2021, 6, 100027. [Google Scholar] [CrossRef]
  20. Vo Thanh, H.; Sugai, Y.; Nguele, R.; Sasaki, K. Integrated workflow in 3D geological model construction for evaluation of CO2 storage capacity of a fractured basement reservoir in Cuu Long Basin, Vietnam. Int. J. Greenh. Gas Control. 2019, 90, 102826. [Google Scholar] [CrossRef]
  21. Vo Thanh, H.; Sugai, Y.; Sasaki, K. Impact of a new geological modelling method on the enhancement of the CO2 storage assessment of E sequence of Nam Vang field, offshore Vietnam. Energy Sources Part A Recovery Util. Environ. Eff. 2020, 42, 1499–1512. [Google Scholar] [CrossRef]
  22. Ullah, J.; Luo, M.; Ashraf, U.; Pan, H.; Anees, A.; Li, D.; Ali, M.; Ali, J. Evaluation of the geothermal parameters to decipher the thermal structure of the upper crust of the Longmenshan fault zone derived from borehole data. Geothermics 2021, 98, 102268. [Google Scholar] [CrossRef]
  23. Zhou, Y.; Ji, Y.; Zhang, S.; Wan, L. Controls on reservoir quality of Lower Cretaceous tight sandstones in the Laiyang Sag, Jiaolai Basin, Eastern China: Integrated sedimentologic, diagenetic and microfracturing data. Mar. Pet. Geol. 2016, 76, 26–50. [Google Scholar] [CrossRef]
  24. Ehsan, M.; Gu, H. An integrated approach for the identification of lithofacies and clay mineralogy through Neuro-Fuzzy, cross plot, and statistical analyses, from well log data. J. Earth Syst. Sci. 2020, 129, 101. [Google Scholar] [CrossRef]
  25. Ehsan, M.; Gu, H.; Akhtar, M.M.; Abbasi, S.S.; Ehsan, U. A geological study of reservoir formations and exploratory well depths statistical analysis in Sindh Province, Southern Lower Indus Basin, Pakistan. Kuwait J. Sci. 2018, 45, 84–93. [Google Scholar]
  26. Ehsan, M.; Gu, H.; Ali, A.; Akhtar, M.M.; Abbasi, S.S.; Miraj, M.A.F.; Shah, M. An integrated approach to evaluate the unconventional hydrocarbon generation potential of the Lower Goru Formation (Cretaceous) in Southern Lower Indus basin, Pakistan. J. Earth Syst. Sci. 2021, 130, 90. [Google Scholar] [CrossRef]
  27. Sun, Y.; Liu, C.; Lin, M.; Li, Y.; Qin, P. Geochemical Evidences of Natural Gas Migration and Releasing in the Ordos Basin, China. Energy Explor. Exploit. 2009, 27, 1–13. [Google Scholar] [CrossRef] [Green Version]
  28. Zhang, L.; Liu, C.; Fayek, M.; Wu, B.; Lei, K.; Cun, X.; Sun, L. Hydrothermal mineralization in the sandstone–hosted Hangjinqi uranium deposit, North Ordos Basin, China. Ore Geol. Rev. 2017, 80, 103–115. [Google Scholar] [CrossRef]
  29. Minghui, Y.; Liang, L.; Jin, Z.; Huichong, J.; Xiao, S.; Ting, G.; Chao, D. Structural Evolution and Hydrocarbon Potential of the Upper Paleozoic Northern Ordos Basin, North China. Acta Geol. Sin. 2015, 89, 1636–1648. [Google Scholar] [CrossRef]
  30. Liu, K.; Wang, R.; Shi, W.; Zhang, W.; Qi, R.; Qin, S.; Xu, L. Tectonic controls on Permian tight gas accumulation: Constrains from fluid inclusion and paleo-structure reconstruction in the Hangjinqi area, northern Ordos Basin, China. J. Nat. Gas Sci. Eng. 2020, 83, 103616. [Google Scholar] [CrossRef]
  31. Yang, Y.; Li, W.; Ma, L. Tectonic and stratigraphic controls of hydrocarbon systems in the Ordos basin: A multicycle cratonic basin in central China. AAPG Bull. 2005, 89, 255–269. [Google Scholar] [CrossRef]
  32. Yang, M.; Li, L.; Zhou, J.; Qu, X.; Zhou, D. Segmentation and inversion of the Hangjinqi fault zone, the northern Ordos basin (North China). J. Southeast Asian Earth Sci. 2013, 70–71, 64–78. [Google Scholar] [CrossRef]
  33. Zhang, Y.Q.; Mercier, J.L.; Vergély, P. Extension in the graben systems around the Ordos (China), and its contribution to the extrusion tectonics of south China with respect to Gobi-Mongolia. Tectonophys 1998, 285, 41–75. [Google Scholar] [CrossRef]
  34. Hao, S.; Li, L.; You, H. Permo-Carboniferous paralic depositional systems in the Daniudi gas field and its near-source box-type gas accumulation forming model. Geol. China 2007, 34, 605–611. [Google Scholar]
  35. Xue, H.; Wang, Y.; Mao, X.P.; Xu, P.; Nie, H.K.; Yin, Y.; Guo, H.Q. The timing of gas pooling in the Upper Paleozoic in the northern Ordos Basin: A case study of the Hangjinqi Block. Nat. Gas Ind. 2009, 29, 9–12. [Google Scholar]
  36. Zhang, L.; Bai, G.; Luo, X.; Ma, X.; Chen, M.; Wu, M.; Yang, W. Diagenetic history of tight sandstones and gas entrapment in the Yulin Gas Field in the central area of the Ordos Basin, China. Mar. Pet. Geol. 2009, 26, 974–989. [Google Scholar] [CrossRef]
  37. Ali, M.; Jiang, R.; Ma, H.; Pan, H.; Abbas, K.; Ashraf, U.; Ullah, J. Machine learning—A novel approach of well logs similarity based on synchronization measures to predict shear sonic logs. J. Pet. Sci. Eng. 2021, 203, 108602. [Google Scholar] [CrossRef]
  38. Ali, M.; Ma, H.; Pan, H.; Ashraf, U.; Jiang, R. Building a rock physics model for the formation evaluation of the Lower Goru sand reservoir of the Southern Indus Basin in Pakistan. J. Pet. Sci. Eng. 2020, 194, 107461. [Google Scholar] [CrossRef]
  39. Ashraf, U.; Zhu, P.; Yasin, Q.; Anees, A.; Imraz, M.; Mangi, H.N.; Shakeel, S. Classification of reservoir facies using well log and 3D seismic attributes for prospect evaluation and field development: A case study of Sawan gas field, Pakistan. J. Pet. Sci. Eng. 2019, 175, 338–351. [Google Scholar] [CrossRef]
  40. Radwan, A.E. Three-dimensional gas property geological modeling and simulation. In Sustainable Geoscience for Natural Gas Subsurface Systems; Elsevier: Cambridge, MA, USA, 2022; pp. 29–49. [Google Scholar]
  41. Ashraf, U.; Zhang, H.; Anees, A.; Mangi, H.N.; Ali, M.; Zhang, X.; Imraz, M.; Abbasi, S.S.; Abbas, A.; Ullah, Z.; et al. A Core Logging, Machine Learning and Geostatistical Modeling Interactive Approach for Subsurface Imaging of Lenticular Geobodies in a Clastic Depositional System, SE Pakistan. Nonrenew. Resour. 2021, 30, 2807–2830. [Google Scholar] [CrossRef]
  42. Jiang, R.; Zhao, L.; Xu, A.; Ashraf, U.; Yin, J.; Song, H.; Su, N.; Du, B.; Anees, A. Sweet spots prediction through fracture genesis using multi-scale geological and geophysical data in the karst reservoirs of Cambrian Longwangmiao Carbonate Formation, Moxi-Gaoshiti area in Sichuan Basin, South China. J. Pet. Explor. Prod. Technol. 2021. [Google Scholar] [CrossRef]
  43. Wang, X.; Zhang, B.; Zhao, T.; Hang, J.; Wu, H.; Yong, Z. Facies analysis by integrating 3D seismic attributes and well logs for prospect identification and evaluation—A case study from Northwest China. Interpretation 2017, 5, SE61–SE74. [Google Scholar] [CrossRef]
  44. Abbas, A.; Zhu, H.; Anees, A.; Ashraf, U.; Akhtar, N. Integrated seismic interpretation, 2D modeling along with petrophysical and seismic atribute analysis to decipher the hydrocarbon potential of missakeswal area, Pakistan. J. Geol. Geophys. 2019, 8, 455. [Google Scholar] [CrossRef]
  45. Mohebian, R.; Riahi, M.A.; Yousefi, O. Detection of channel by seismic texture analysis using Grey Level Co-occurrence Matrix based attributes. J. Geophys. Eng. 2018, 15, 1953–1962. [Google Scholar] [CrossRef] [Green Version]
  46. Li, J.; Zhang, X.; Tian, J.; Liang, Q.; Cao, T. Effects of deposition and diagenesis on sandstone reservoir quality: A case study of Permian sandstones formed in a braided river sedimentary system, northern Ordos Basin, Northern China. J. Southeast Asian Earth Sci. 2021, 213, 104745. [Google Scholar] [CrossRef]
  47. Li, R.; Tian, J.C.; Zhang, X.; Li, L.; Jia, H.C. Sedimentary microfacies and distribution characteristics of Xiashihezi Formation in the Shiguhao Region, North Ordos Basin. J. Mineral. Petrol. 2014, 113, 34–104, (In Chinese with English Abstract). [Google Scholar]
  48. Anees, A.; Zhong, S.W.; Ashraf, U.; Abbas, A. Development of a computer program for zoeppritz energy partition equations and their various approximations to affirm presence of hydrocarbon in missakeswal area. Geosciences 2017, 7, 55–67. [Google Scholar]
  49. Ashraf, U. Analysis of Balkassar Area Using Velocity Modeling and Interpolation to Affirm Seismic Interpretation, Upper Indus Basin. Geosciences 2016, 6, 78–91. [Google Scholar]
Figure 1. (a) Tectonic map of China (modified after [9]), (b) Major tectonic units of OB (modified after [9]), (c) 3D seismic grid and wells incorporated in our study.
Minerals 12 00126 g001
Figure 2. Generalized stratigraphic chart of the Hangjinqi area, OB (left). Three members of the lower Shihezi formation (right). The light green rectangles highlight the targeted formation and member, while the red-colored text shows the study area (Modified from [30]).
Minerals 12 00126 g002
Figure 3. Cores of wells J34, J72 and J91 from the member-1 of the LSF. (a) sandy conglomerate at depth of 2943.44–2943.55 m, (b) mudstone present in the upper part with underlying coarse-grained pebbly sandstone at 2943.55–2943.75 m, (c) conglomerate to fine sandstone at 2944.86–2944.97 m, (d) light gray coarse-grained pebbly sandstone intermixed with gray-white oil traces at 2340.84–2340.96 m, (e) light gray thick-bedded coarse sandstone at 2341.90–2342.06 m, (f) gray brown mudstone at 2953.19–2953.28 m, (g) light gray medium sandstone at 2981.08–2981.30 m, and (h) light gray coarse-gained pebbly sandstone and light gray medium sandstone at 3002.62–3002.85 m.
Minerals 12 00126 g003
Figure 4. Sedimentary facies interpretation of well J72 through conventional well logs showing the porosity, permeability, and lithofacies for the member-1 (P2x1) of the LSF.
Minerals 12 00126 g004
Figure 5. Synthetic seismogram of well J52 displaying the sonic log, synthetic and seismic traces. The interpreted horizons T9d and T9e are the targeted horizons that lie within the member-1 of the LSF.
Minerals 12 00126 g005
Figure 6. Horizon interpolation. (a) T9d, and (b) T9e.
Minerals 12 00126 g006
Figure 7. (a) uninterpreted, and (b) interpreted seismic sections at well J52 with targeted interpreted horizons.
Minerals 12 00126 g007
Figure 8. Interpretation of faults distribution and horizon slices of (a) T9d and (b) T9e.
Minerals 12 00126 g008
Figure 9. Structural maps show the faults distribution and contour values along horizon slices (a) T9d and (b) T9e.
Minerals 12 00126 g009
Figure 10. Thickness map of member-1 of LSF showcasing the faults distribution and contour values along with targeted horizon slices of T9d-T9e.
Minerals 12 00126 g010
Figure 11. Sand-ratio distribution map of the member-1 (T9d-T9e) of the LSF within the Hangjinqi area.
Minerals 12 00126 g011
Figure 12. (a) Interval velocity distribution to differentiate sandstone and mudstone lithologies. (b) RMS horizon attribute map for the member-1 (T9d-T9e) of the LSF.
Minerals 12 00126 g012
Figure 13. Well log interpretation of wells (a) J34, (b) J52, (c) J72.
Minerals 12 00126 g013
Figure 14. Proposed depositional facies map for reservoir quality prediction showcasing the depositional framework and sedimentary facies distribution for the member-1 of the LSF within the Hangjinqi area.
Minerals 12 00126 g014
Publisher’s Note: MDPI stays neutral with regard to jurisdictional claims in published maps and institutional affiliations.

