Article

Research on the Homogenization Evaluation of Cemented Paste Backfill in the Preparation Process Based on Image Texture Features

1
School of Civil Engineering, Henan Polytechnic University, Jiaozuo 454003, China
2
School of Civil and Environmental Engineering, University of Science and Technology Beijing, Beijing 100083, China
*
Author to whom correspondence should be addressed.
Minerals 2022, 12(12), 1622; https://doi.org/10.3390/min12121622
Submission received: 16 November 2022 / Revised: 10 December 2022 / Accepted: 14 December 2022 / Published: 16 December 2022
(This article belongs to the Special Issue Cemented Mine Waste Backfill: Experiment and Modelling)

Abstract

:
In China, cemented paste backfill (CPB) is a common treatment method after the exploitation of basic energy. The homogeneity of slurry influences the performance of CPB. However, the online monitoring and characterization of homogeneity lack relevant technologies and unified standards. This article discusses an online image analysis technique applied to the online monitoring of cemented paste backfill mixing, which is based on the evolution of the texture of images taken at the surface of the mixing bed. First, the grayscale distribution of the image obtained by the high-speed camera in the CPB preparation process was analyzed by Matlab and its variance (s2) was solved, and the texture features of the image were analyzed by the variance of grayscale distribution. Then, a homogeneity discriminant model ( c s t ) was established. The results show that the variance value of the grayscale distribution of the slurry image increases rapidly at first, then gradually decreases, and becomes stable in the final stage since it turns a constant value. When the s2 value tends to be stable, the slurry gradually reaches homogenization, and the discriminant coefficient of paste homogenization based on the homogenization discriminant model reaches 0.05. The homogenization prediction of CPB proves to be consistent with the backfill performance comparison results. The evolution of the texture allows obtaining important information on the evolution of different formulations during mixing, which can be used for intelligent monitoring of CPB preparation process.

1. Introduction

Mineral resources are the material basis for social and economic development. However, the exploitation of mineral resources has caused serious environmental pollution and safety problems. According to statistics, China’s accumulation of tailings reached 22.26 billion tons by 2020, which not only seriously pollutes the environment, but also puts the tailings storage facility (TSF) at risk of dam failure and landslide [1]. In addition to that, a large number of goafs will be left underground, since the ore is dug away, resulting in potential danger of subsidence on the surface. In recent years, CPB was widely researched and applied around the world due to its advantages of environmental protection, safety, and high efficiency [2]. CPB technology eliminates pollution such as the tailings accumulation on the surface, and risks of dam failure and landslide. In addition, it can utilize solid waste resources in mines [3], and also can realize the low-carbon mining mode, which is in line with the “carbon neutrality and carbon emission peaking” goal proposed by the Chinese government.
However, the high cost greatly restricts the application of CPB technology. Cost reduction is the eternal pursuit of the development of backfilling technology. During the application of backfilling technology, the cost of labor and gelling materials accounts for more than 90% of costs. Therefore, reducing the amount of cement and improving the intelligence of backfilling are necessary for the purpose of achieving low-cost mine backfilling. In order to reduce the amount of cement, it is meaningful to improve the homogeneity of cement in the paste and increase the hydration rate of cement. Studies show that fresh and hardened properties of CPB are closely related to homogeneity. Therefore, more and more attention has been paid to the homogeneity of materials in CPB preparation process. In this field, it is known that paste homogenization varies with mixing time and is closely related to fluidity. The mechanical properties and fluidity of CPB can be improved by changing parameters such as mixing speed [4,5], mixing strength [6,7], mixing time [8], and aggregate grading [9]. Although these studies arrived at some conclusions in improving the homogenization of slurry, no relevant studies on monitoring the homogeneity of the slurry preparation process have been conducted, and the homogeneity of slurry in actual production is not yet known [10].
Intelligent mining for backfilling is considered as an important technology for reducing backfilling costs. Intelligent mining for backfilling should meet the needs of three aspects [11,12], namely, intelligent selection of mining methods, intelligent monitoring of paste preparation, and intelligent analysis of the matching relationship between CPB and the environment. In these three aspects, due to the high solid concentration, opaqueness, and hydration of the CPB, it is difficult to understand the change in material homogeneity during the mixing process, which results in many difficulties in the intelligent monitoring of the paste preparation process [13,14]. Efficient online process monitoring has become critical to quality and productivity within many industries. In order to understand the homogenization of the paste, mining engineers need to take samples and test the fluidity and mechanical properties of the CPB to analyze the homogenization changes of the paste from batch to batch [15,16,17]. With the advent of new technologies, some online monitoring equipment was applied to the homogenization monitoring of paste preparation process, which has proven effective. For instance, focused beam reflection measurement (FBRM) [18] technology and particle video microscopy (PVM) [19] can monitor the floccules changes in the slurry in real time. With all these merits, they have great potential for paste homogeneity monitoring. The problem is that the application of these two technologies is expensive and mining investment will increase accordingly. In the field of concrete preparation, the homogeneity of slurry can be determined by monitoring the power consumption of the mixing equipment [20,21]. This low-cost technology can only be used in an intermittent agitator, while paste mixing is generally used in a continuous agitator. In addition, some researchers tried ultrasonic [22] and infrared ray methods [23] to monitor the homogeneity of paste, but no industrial application has been reported so far.
In summary, solving the technical problem of online monitoring of homogeneity in the paste preparation process is of great significance to the development of intelligent mining for backfilling and the improvement of paste homogeneity. In recent years, image analysis technology has been widely used in various fields due to its low cost and high accuracy [24]. For example, image texture features can be used to reflect the homogeneous evolution of concrete during concrete preparation [25], as well as in the application of image analysis technology to the powder granulation (pharmaceutical production) process, enabling intelligent monitoring of granulation size [26]. Image analysis technology, which is simple, rapid, and low-cost, uses computer software to convert image signals into digital signals [27]. Further research on image texture features and backfilling properties of fresh and hardened state pastes under mixing action are necessary so as to understand how this affects the fresh and hardened state behavior of CPB. Therefore, this paper adopts image analysis technology to carry out the monitoring research of the homogeneity in the process of the paste preparation. According to the characteristics of CPB, the variance of grayscale distribution was proposed as the feature value of image texture, and the homogenization evolution law of mixing process was analyzed. Moreover, the homogeneity discriminant model of the paste was established to contrast with the backfilling performance and verify the reliability of the discriminant model. The image processing technology provides technical guidance for controlling the quality of paste preparation, which will be applicable to various mining enterprises using cemented backfilling such as non-ferrous, ferrous, precious metals, and rare metals.

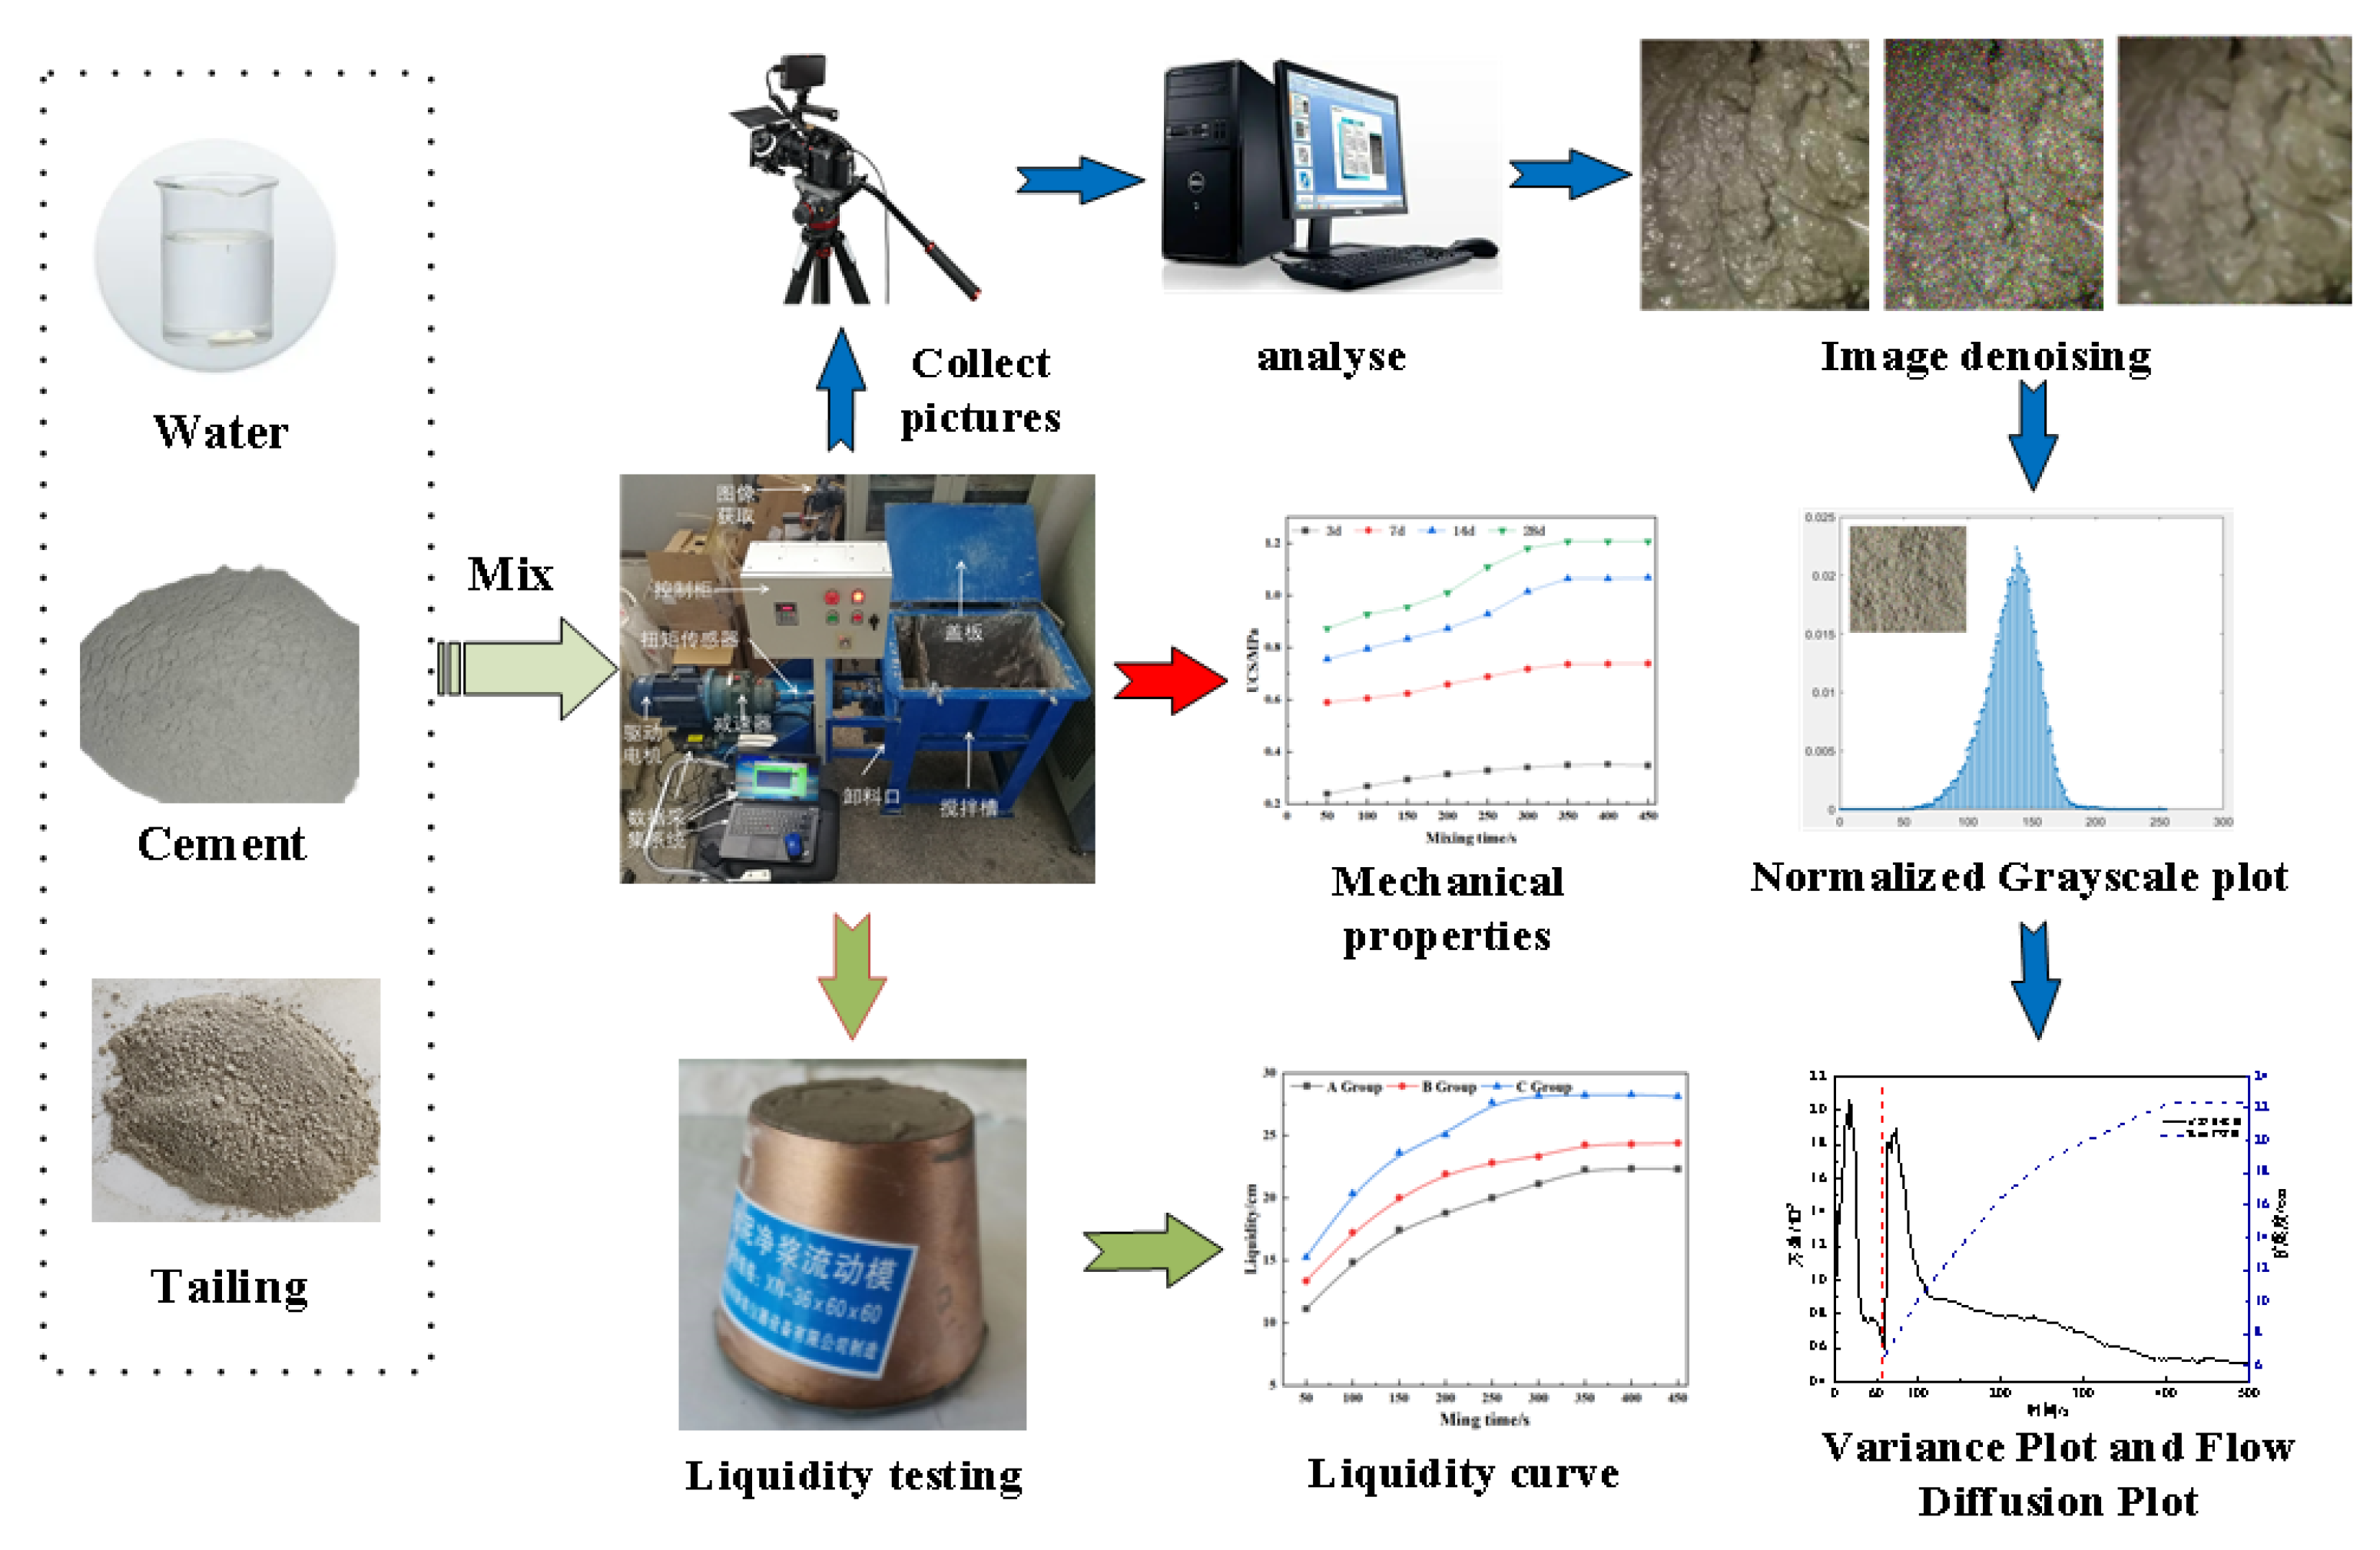
2. Materials and Methods
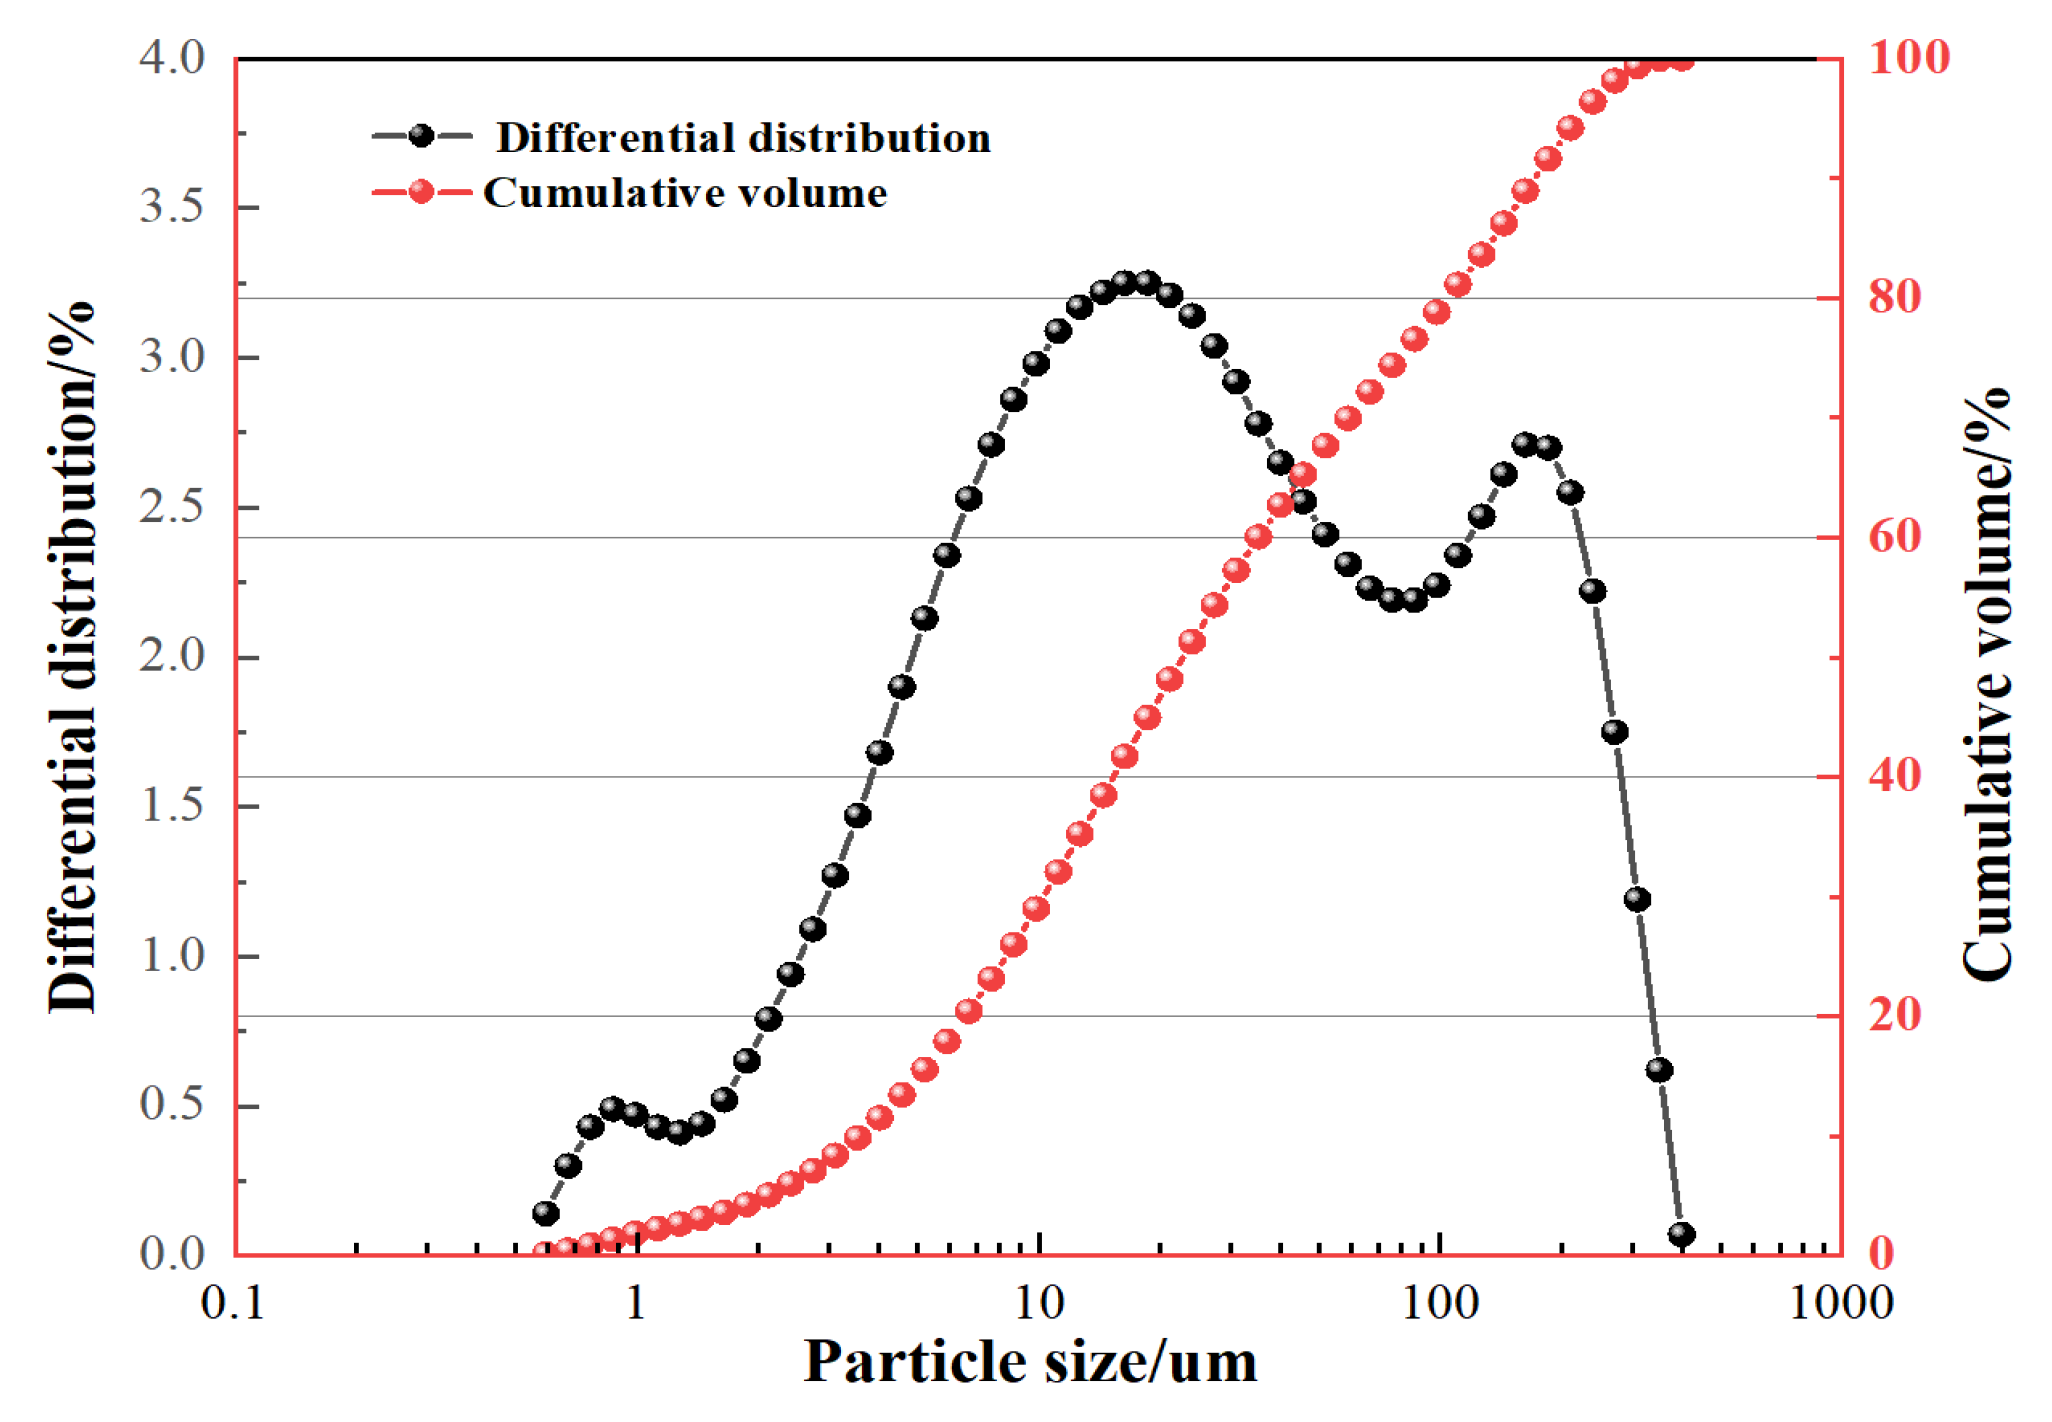
2.1. Materials

Experimental materials include cement and tailings. The tailings came from a copper mine and the cement was 42.5R ordinary Portland cement. The chemical composition of the tailings obtained by X-ray fluorescence spectrometer (XRF) (XRF-1800 X-ray fluorescence spectrometer, Shimadzu, Japan) is shown in Table 1. The specific gravity of the tailings is 2.71, and the main chemical components of the tailings are SiO2, CaO, Al2O3, etc.
The particle size of materials exerts great influence on the mixing process of CPB, so the laser particle size analyzer (Topsizer 2000) was used to measure the particle size distribution of the test tailings and cement. The measurement results are shown in Figure 1. Tailings with a particle size smaller than 30 μm account for 60%, and particles smaller than 20 μm account for 52%. According to the relevant literature [28,29], the tailings could be classified as fine tailings.
According to the test report provided by the cement factory, the specific surface area of the cement was 401 m2/kg, and the specific gravity was 3.15. XRF was used to measure the chemical composition of the cementitious material. The results are shown in Table 2. It can be seen from the results that the chemical composition of cement is mainly CaO and SiO2.

2.2. Mixture Contents

In order to compare the influence of solid concentration on the mixing process, three commonly used concentrations in engineering were set up for comparison in the experiment (cement–sand ratio was 1:8). The solid concentrations were 68%, 70%, and 72%. It should be noted that the moisture content of tailings was about 7%. The mixture contents for the experiment are shown in Table 3. Deionized water was used to mix the cement and tailings.

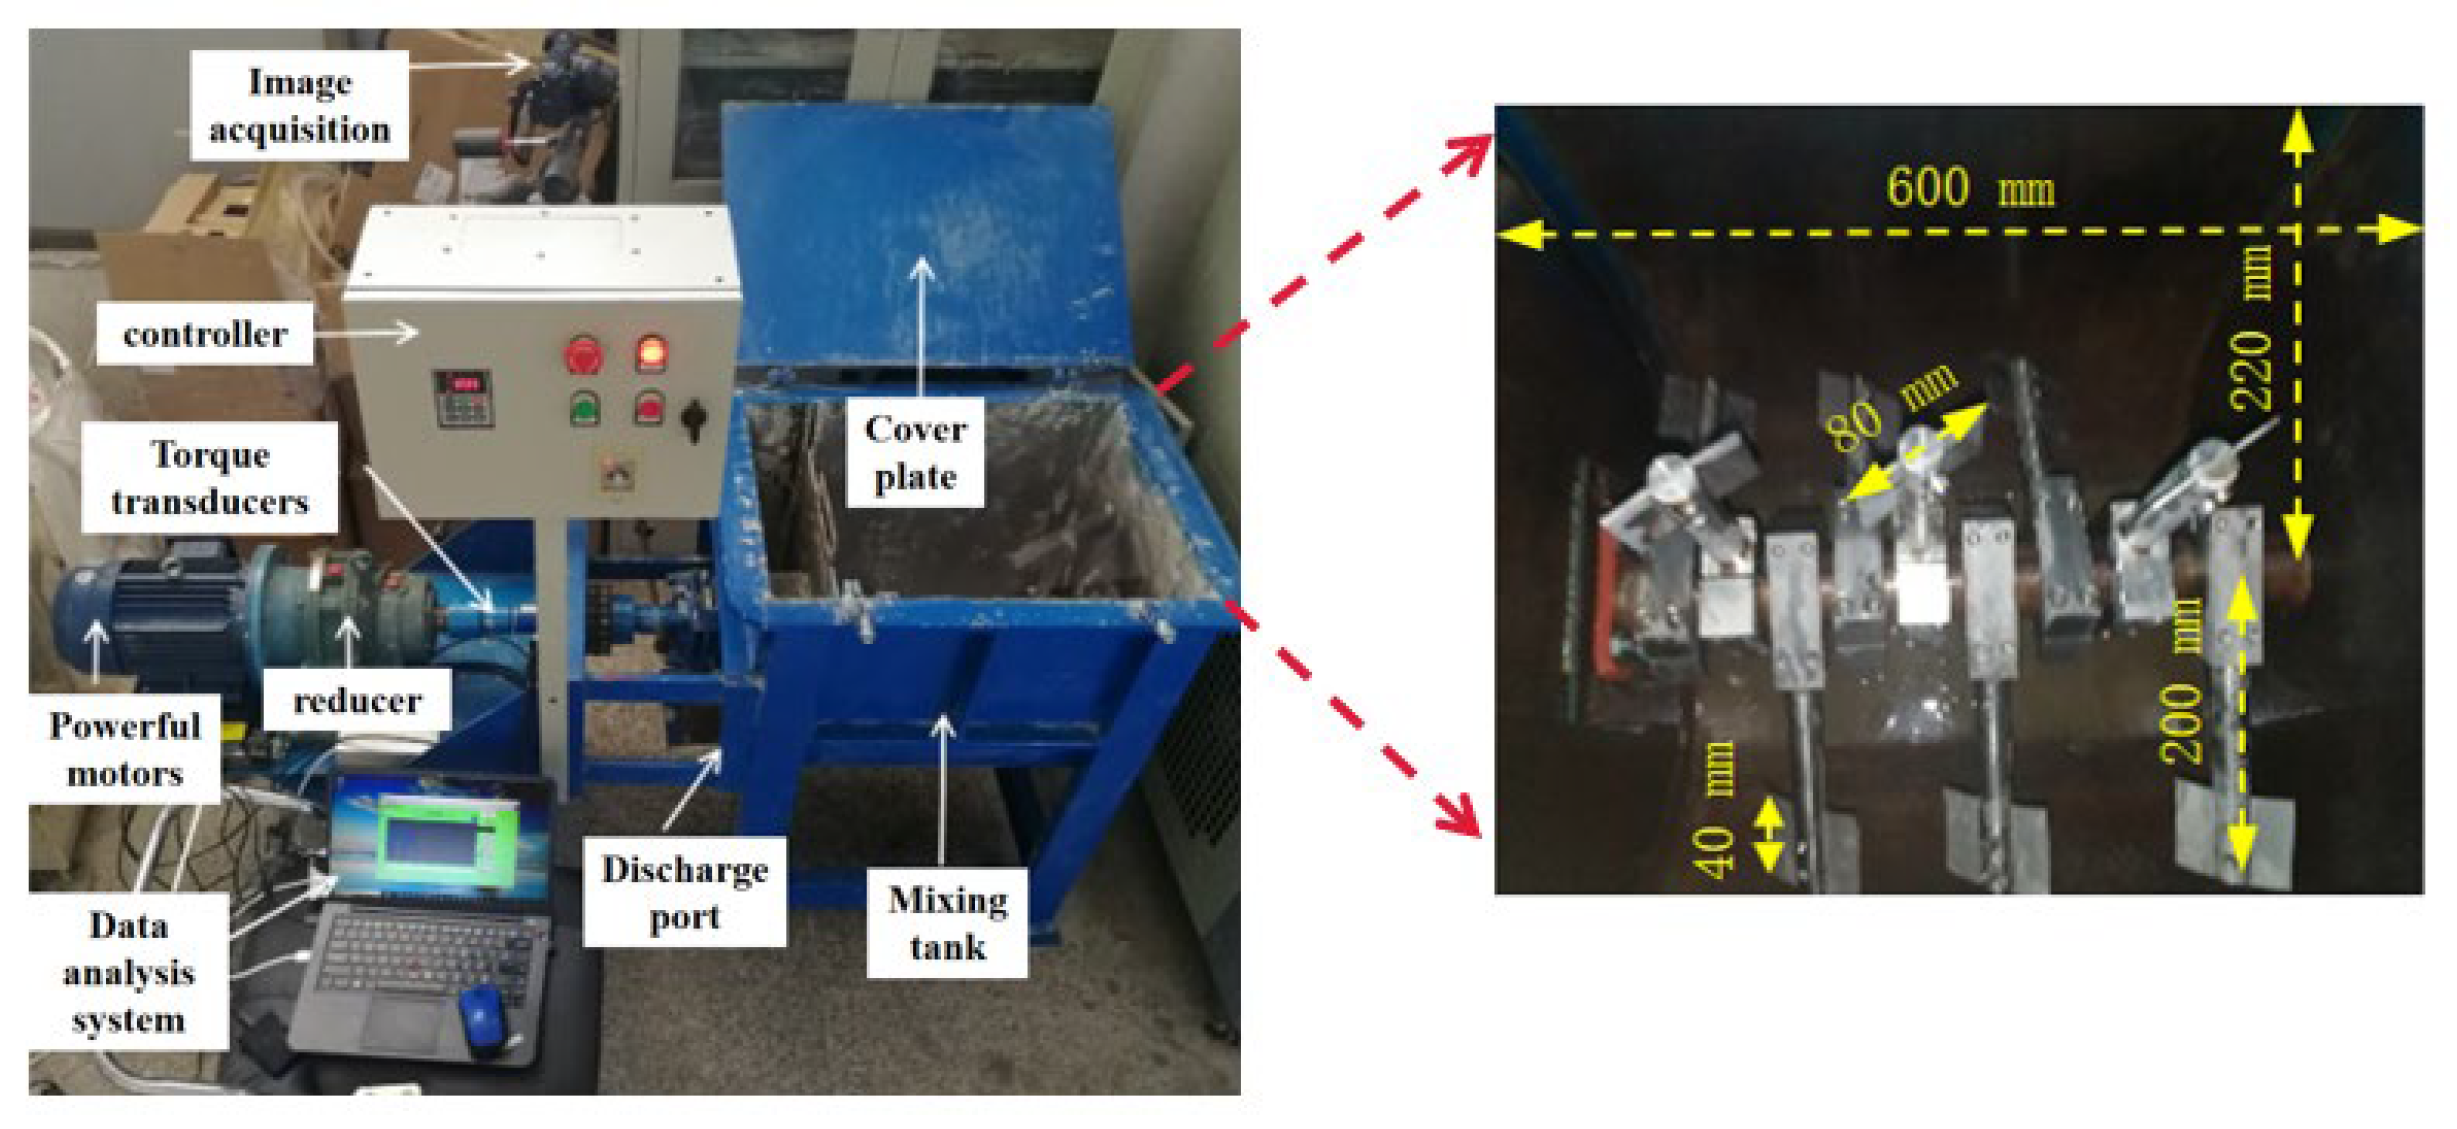
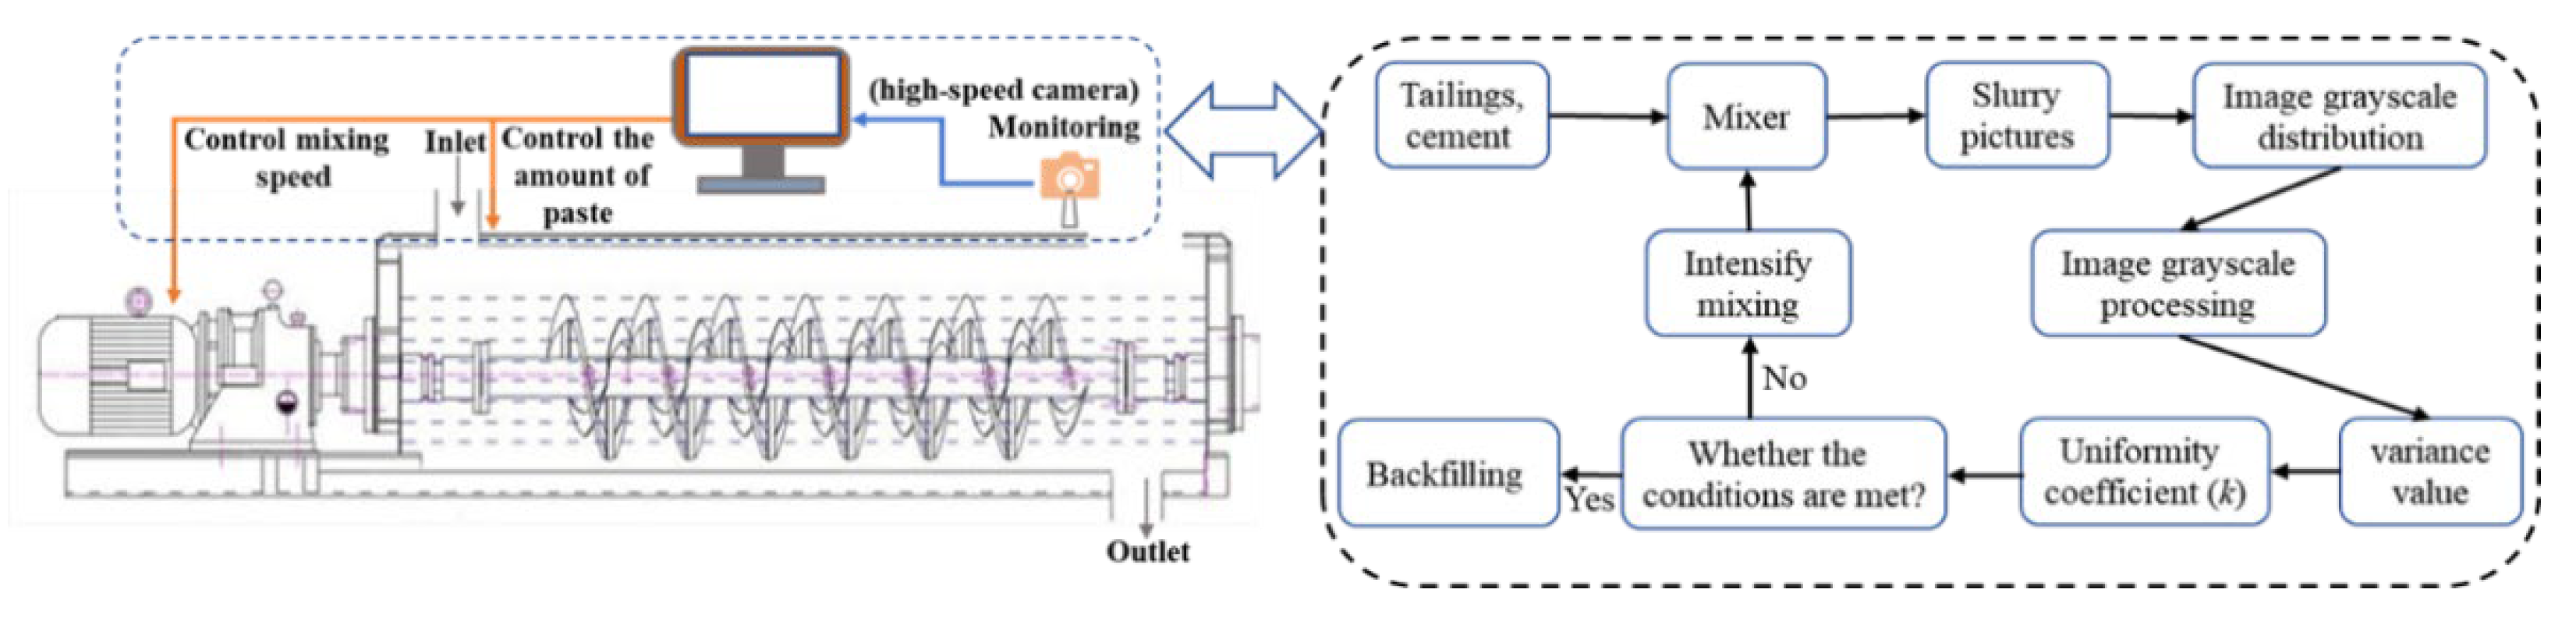
2.3. Experimental Device

Continuous mixers are widely used in CPB technology of mines in China. When a continuous mixer is in operation, cementitious material, cement, water, and admixture are poured into the mixing tank from one section of the mixer. The materials are mixed by the blade, and poured out the mixer from the other section of the mixer. In order to simulate the working process of a continuous mixer, we designed the experimental device as shown in Figure 2. The maximum capacity of the mixing tank is 0.045 m3, the motor power is 3.0 kW, and the speed adjustment range is 0–500 rpm. The cover plate can be opened so that the materials’ state can be observed at any time during the mixing process. A high-speed camera is installed above the mixing equipment to capture images of materials during the preparation process, and the acquisition frequency of the camera is set to 1 Hz. In order to make the line speed of the experimental mixer similar to that of the paste engineering mixer, the mixer ran at a constant rate of 120 rpm/min during the test process.
In most cases, the maximum linear speed of the mixer blade is set at about 1.5 m/s when the CPB is prepared in the mine paste factory. Therefore, the rotational speed of the laboratory mixer was 72 rpm/min and the line speed was 1.5 m/s during the preparation of CPB in the research.

2.4. Experimental Methods

2.4.1. Image Texture Features

The experimental process is shown in Figure 3. All these operations were carried out at room temperature. During the mixing process, images collected by the camera were stored in the computer. At the end of the experiment, MATLAB R2021b was used to analyze the images. According to the results, the curve of texture features of the image with mixing time was drawn. The image analysis method was introduced in Section 3.
For each sample preparation process, cement and tailings were first poured into the mixer for dry mixing for 50 s, and then water was added and mixed with them for the preset mixing time (in the following discussion, we take the time point of adding water as the 0 point of the time coordinate). It should be pointed out that the experiments on groups with the same ratio but different mixing times were conducted separately in the test of paste backfilling performance. Therefore, three experimental groups, A, B, and C, were all performed 10 times (the mixing time of each group was different), namely, a total of 30 times. For example, in group A, a total of 10 experiments were performed from A1 to A10. In the A1 experiment, cement and tailings were added to the mixer for dry mixing with the whole process lasting 50 s, and then water was added to mix with them for a consecutive 450 s. Finally, the images of the mixing process were captured by the camera. For A2~A10, cement and tailings were poured into the mixer for dry mixing with the whole process lasting for a consecutive 50 s, and then water was added to mix with them for 50 s, 100 s, 150 s, 200 s, 250 s, 300 s, 350 s, 400 s, and 450 s, respectively. After the paste was prepared for each group, samples were taken to test its fluidity in fresh state and the mechanical strength after hardening.

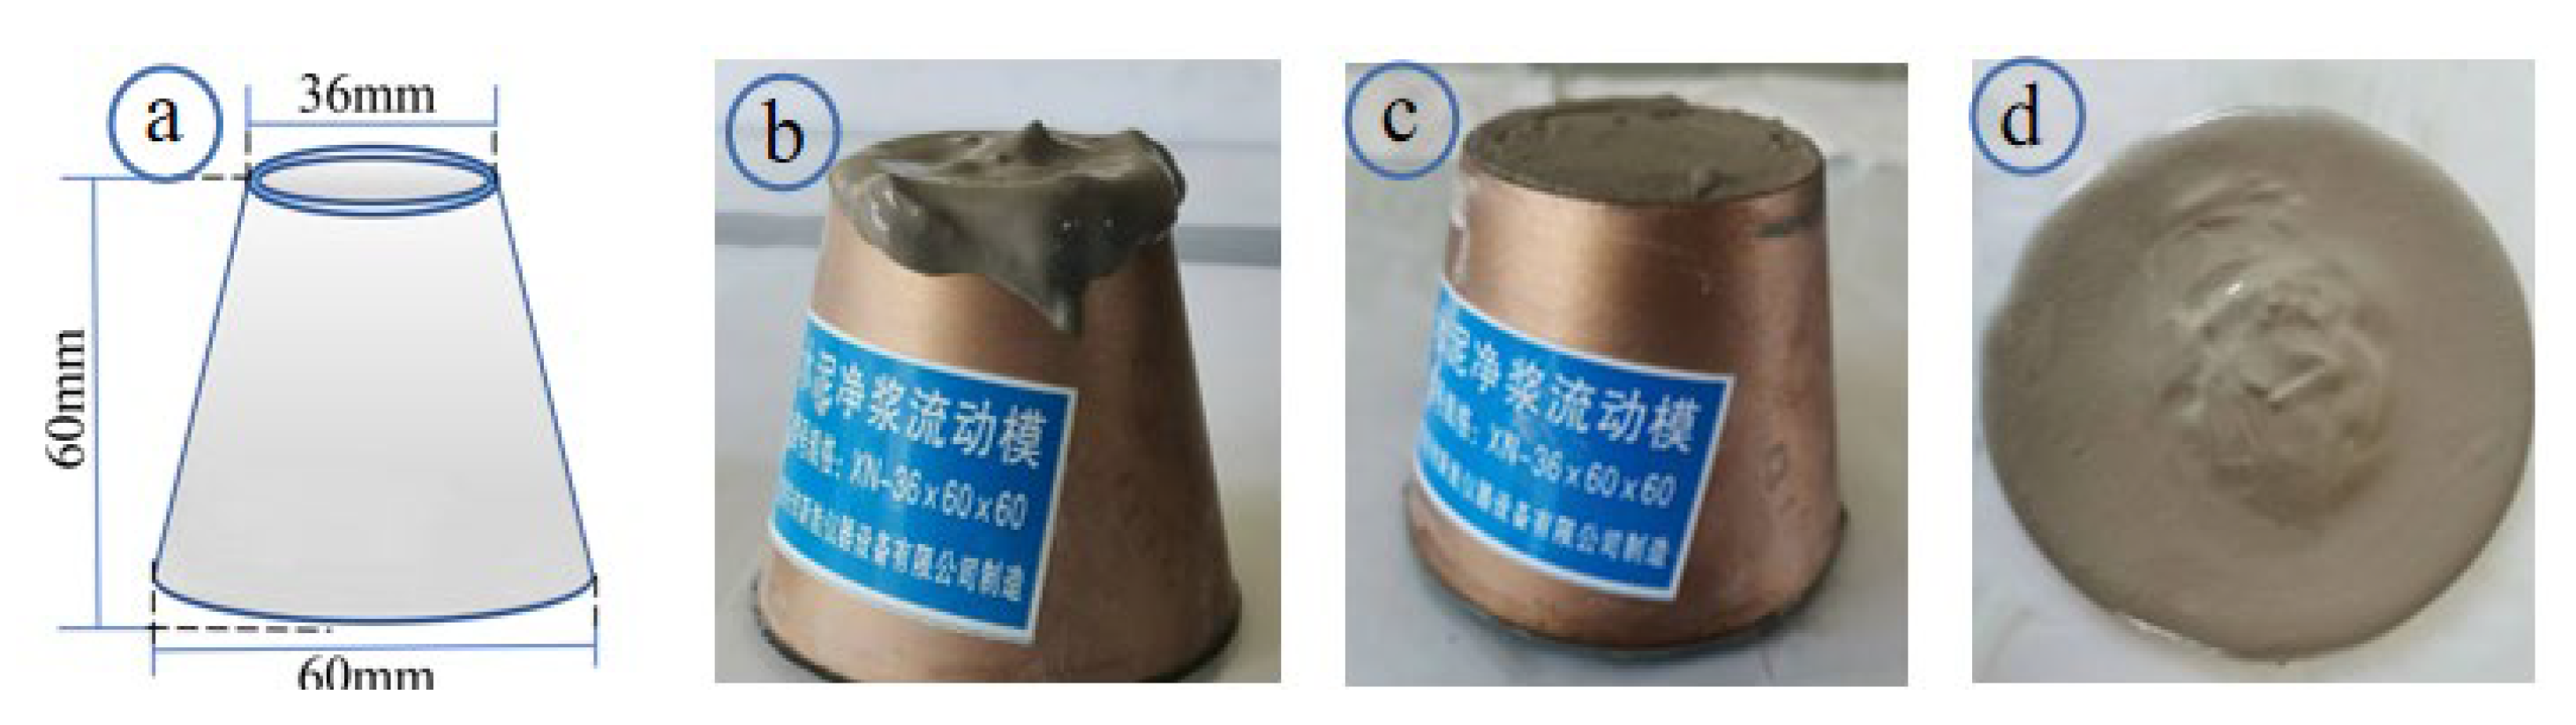
2.4.2. Flow Characteristic Test

In the field, the fluidity and mechanical strength of fresh and hardened paste are often used to determine whether the paste was homogeneously mixed. Therefore, we tested the fluidity and mechanical strength of fresh and hardened pastes with different mixing times, analyzed the variation of the fluidity and mechanical strength of fresh and hardened pastes with mixing time, and compared the results with image texture features. A small slump cone (XN-36 × 60 × 60 mm) was used for the paste fluidity test, as shown in Figure 4.

2.4.3. Uniaxial Compressive Strength Test

After the paste was prepared, the sample was loaded into a standard test mold (70.7 mm × 70.7 mm × 70.7 mm). All operations were performed in accordance with ASTM-C1437. Each strength value represented an average value obtained from uniaxial compressive strength (UCS) tests of more than five specimens. When the mold was completed, the mold and specimen were removed after standing for 48 h, and then the specimen was placed in the standard curing chamber for curing.
UCS test was performed after curing at a predetermined period (3, 7, 14, 28 days). A computer-controlled mechanical press with a load capacity of 100 kN was used to test the mechanical properties. The displacement speed of the press was controlled to be 0.5 mm/min during the experiment.

3. Image Texture Analysis Techniques

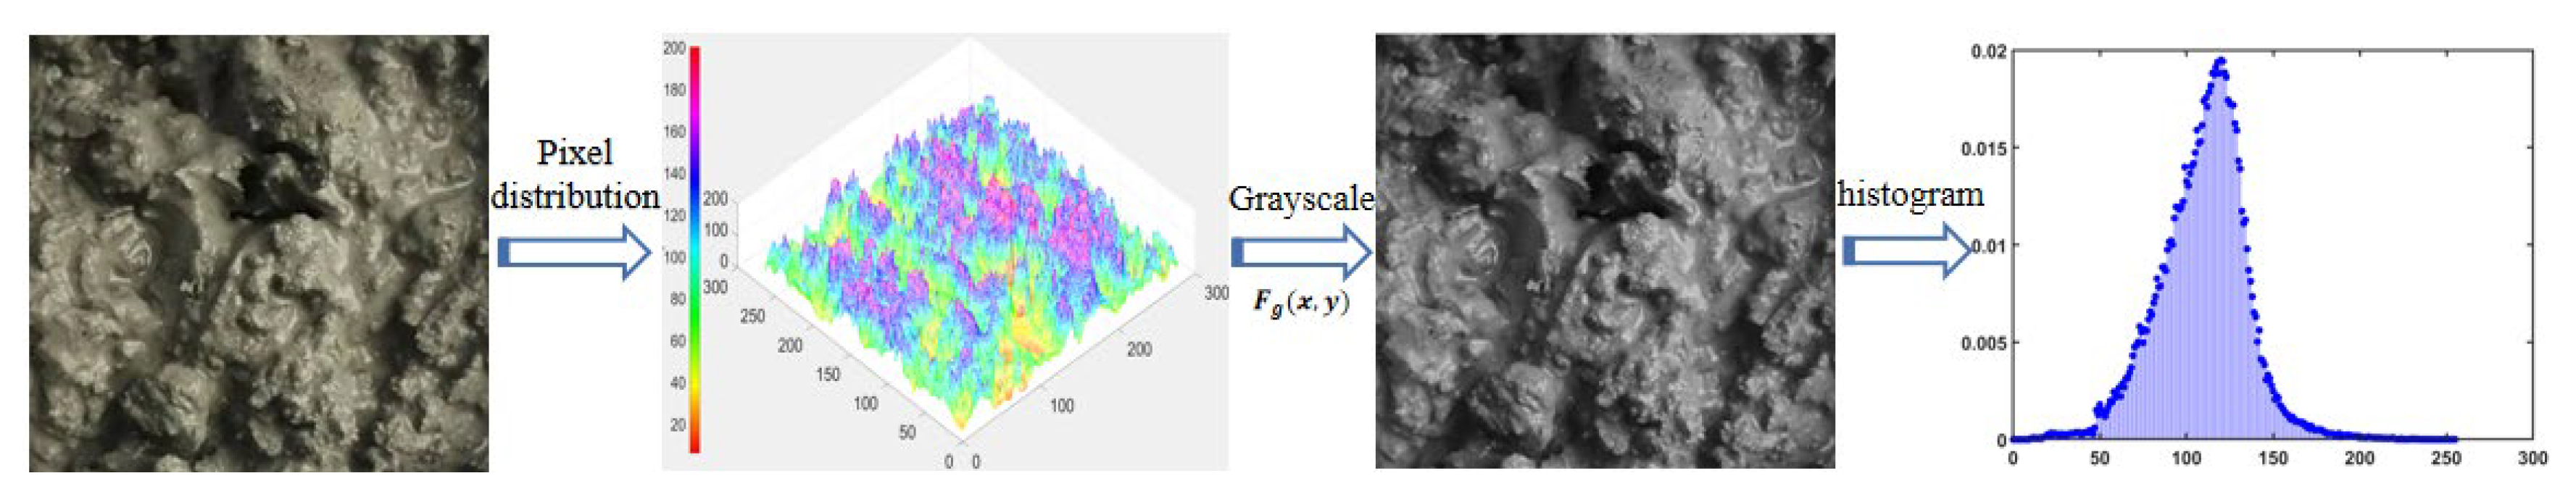
3.1. Image Grayscale

Grayscale image processing is the process of converting the color images into the grayscale image. The color images were converted into the two-dimensional grayscale images by using Matlab. Its value F g x , y can be calculated by the weighted average value of the brightness of the color images of R, G, and B. There are many calculation methods for the grayscale value of images, and the calculation method adopted in the research is expressed as follows:
F g x , y = 0.299 R x , y + 0.587 G x , y + 0.114 B x , y
where R, G, and B are the red, green and blue pixel value, respectively, and x and y are coordinates on a two-dimensional image.
Gray pixels are represented by the numeric value of the function f(x, y), the value range of which is [0, 255]. In this equation, 0 represents pure black, 255 represents pure white, and the ascending value represents the depth of the pixel [30]. The image processing by Matlab is the data operation process of converting the color images into a two-dimensional grayscale image function f(x, y). Finally, the histogram of grayscale distribution of images is output [31].
As shown in Figure 5, with enough groups and small class intervals, the grayscale distribution approximates the normal distribution curve. On the curve, different grayscale values represents different paste shapes. When the distribution of grayscale value is more concentrated, it indicates that the difference in the shape of the paste slurry corresponding to the image is small, otherwise the shape difference is large.

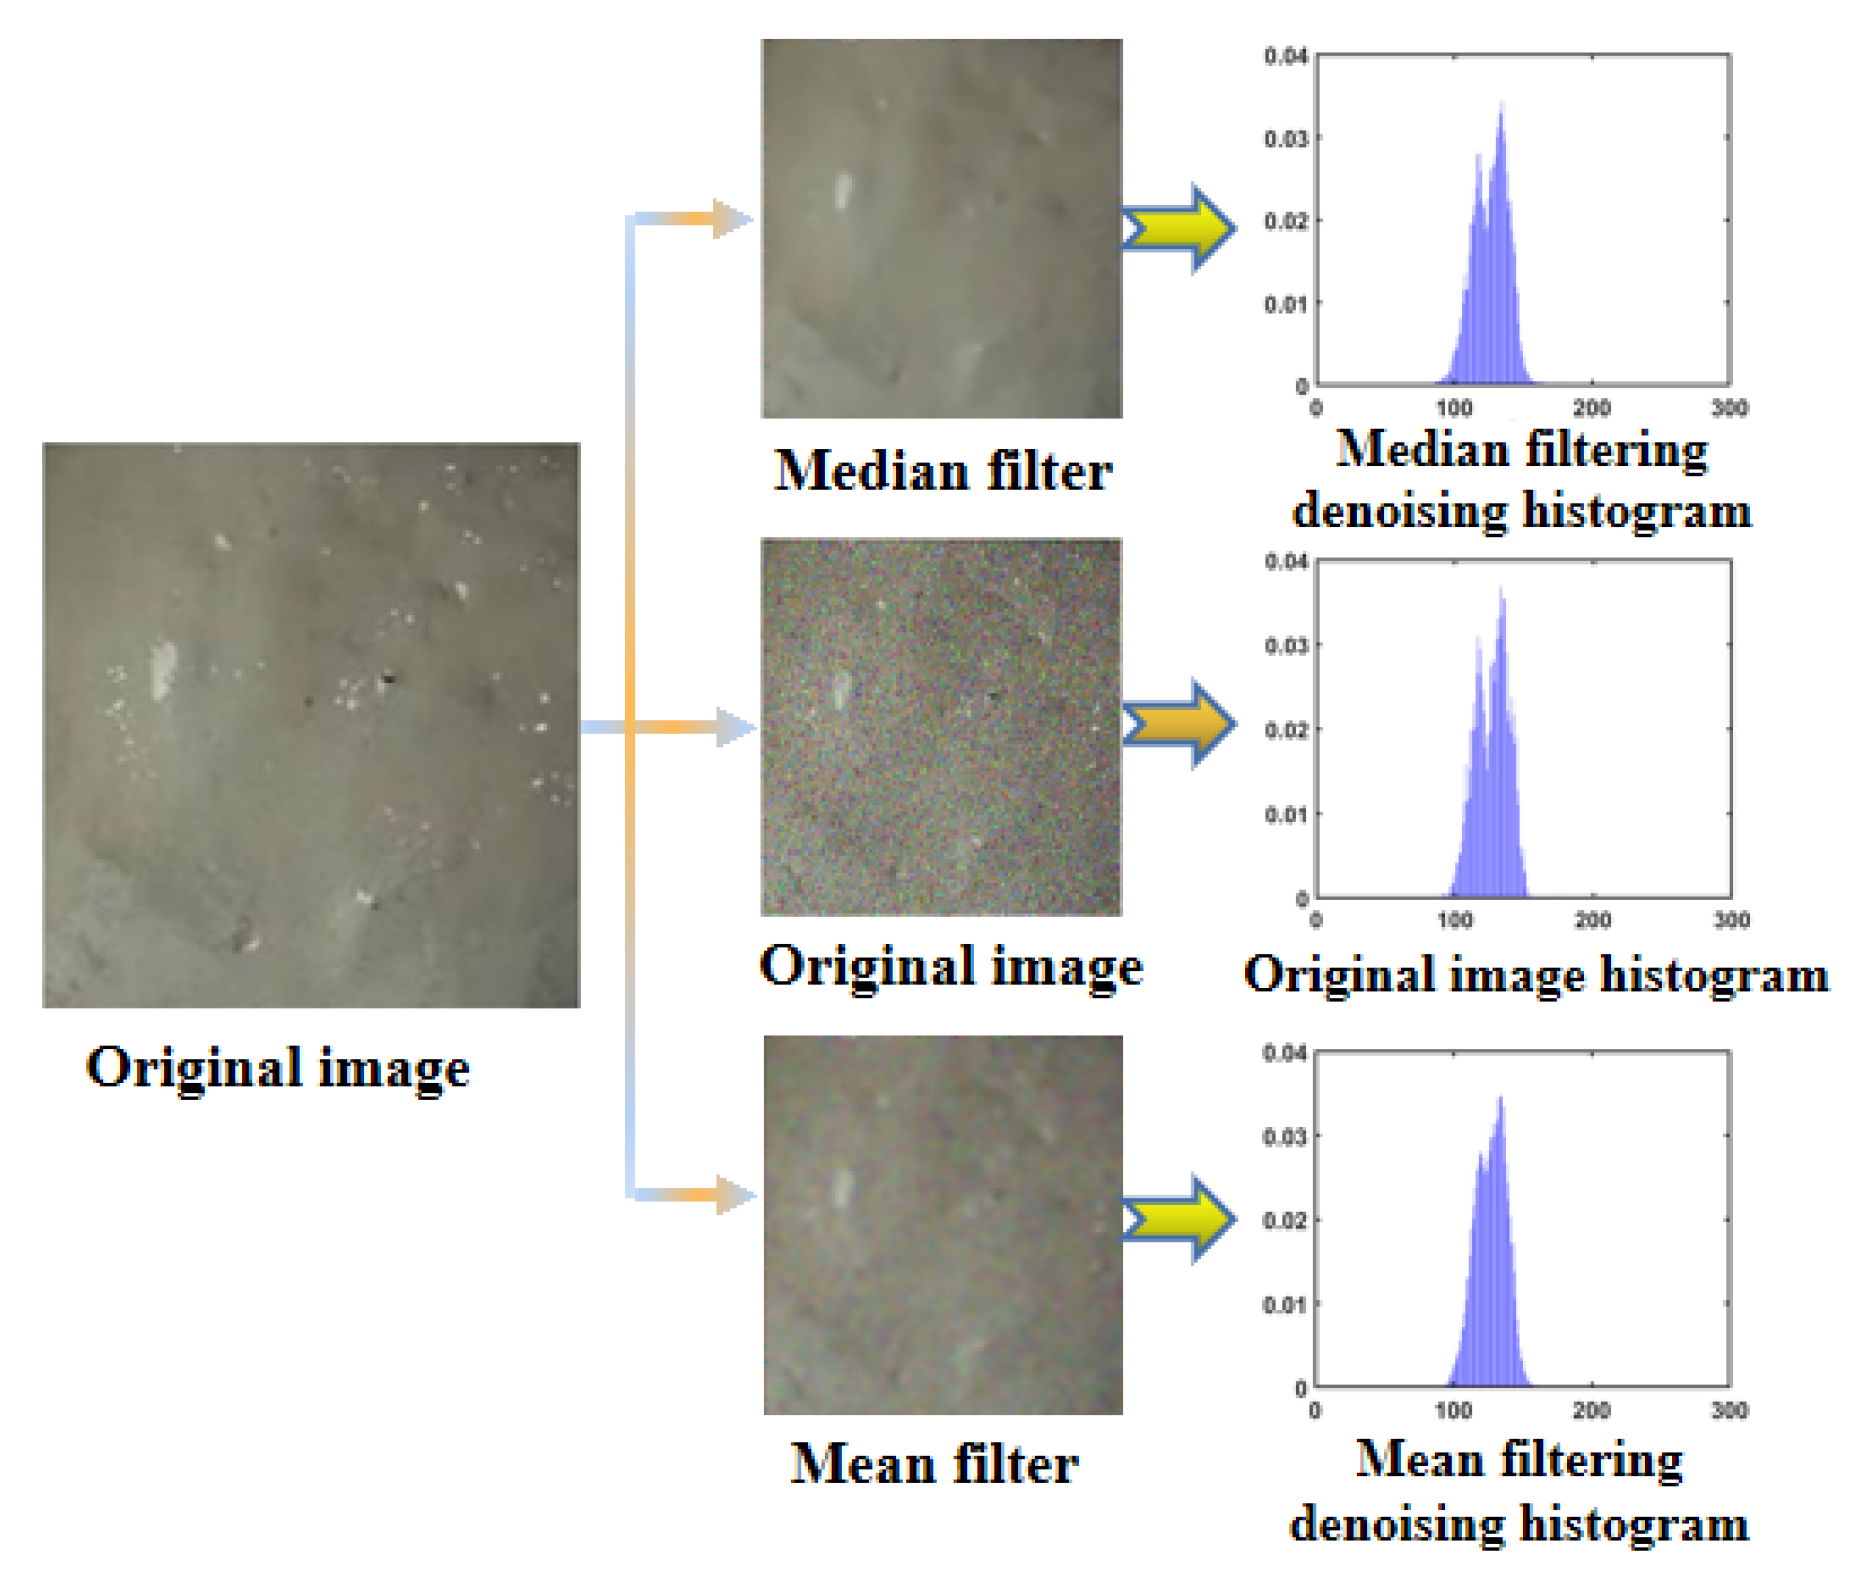
3.2. Image Filtering for Denoising

In the analysis process, the difference in light, material flow, and equipment vibration can lead to errors in the collected image pixels [32], which has a great impact on the experimental results. Therefore, it is necessary to filter and denoise the image before texture analysis [33]. Filtering and denoising reduction processing is to filter out some special frequencies (noise point) of the image to make images more homogeneous and reduce external impacts on image acquisition. The most frequently used methods to denoise are wiener filtering [34], mean filtering [35], median filter [36] and so on. This study focuses on two methods, which are median filtering and mean filtering. Median filtering is to replace noise pixels of the original image with adjacent pixels values, so as achieve the purpose of eliminating noise points. Theoretically, it is the nonlinear smoothing function, and its equation is expressed as follows:
g x ,   y = m e d f α k , α l , k , l W
where g(x, y) is the filtered pixels; W is the image mask, (the mask refers to the use of a specific image to block the processed image, which can achieve the purpose of image processing); α is the noise point pixel; and k and l are the pixels near W.
Mean filtering replaces each pixel value in the original image in the form of an average value, that is, taking the noise point as the center and selecting a certain range of pixels as the reference value to replace the value of noise, which reads:
g x , y = 1 m × n f     n e i g h b o r f z
where m, n represent the range of filter; fz represents the center pixel value; and neighbor is the adjacent pixel value of fz.
After denoising, the interference of external factors can be reduced and the real pixel value can be preserved to the greatest extent. It can be seen from Figure 6 that the image denoised by median filter is similar to the original image, and closer to the real value after removing the noise interference. Meanwhile, the mean filtering can destroy the edge of the image in the process of image denoising, making the image blurred. Compared with mean filtering, the paste slurry image, which adopted median filtering, can better reflect its real information. Therefore, in order to ensure the continuity and accuracy of data processing, the research used median filtering to denoise images.

3.3. Grayscale Variance

Although the image grayscale converted the image of slurry into grayscale distributions function, it still could not achieve quantitative token of the surface texture. Therefore, it is necessary to set up a variable to represent the image texture feature. In previous studies [37], the image texture feature was mostly represented by standard deviation (STD), which was prone to having extreme values in image processing, resulting in large error. In order to overcome the influence of extreme value, the variance value of image grayscale distribution was used to characterize the texture feature of the image. According to the probability and statistics theory, the calculation method of grayscale distribution frequency is as follows:
p G k = n k M N  
where nk is the pixel occupied by the grayscale value GK in the image, P(GK) is the distribution probability of Gk, and, k = 0 n 1 p G K = 1 .
Based on the probabilities P(GK), we can derive an average grayscale value of the image, thereby drawing the variance formula of the image gray, which reads:
m = k = 0 n 1 G K p G K s 2 = k = 0 n 1 G K m 2 p G K
where m is the average grayscale value and s2 is the variance value.
According to the principle of statistics, variance is the measurement of the dispersion degree of sample data. Therefore, when the pixels are equally distributed and colors are uniform in the image, the texture feature value is small. If the pixels are chaotic and the grayscale difference is large, the texture feature value is large. In the research, the value reflects the difference among different areas of the slurry. In theory, the smaller the texture feature value is, the smaller the difference in the surface features of the slurry is, and vice versa.

4. Results and Discussion

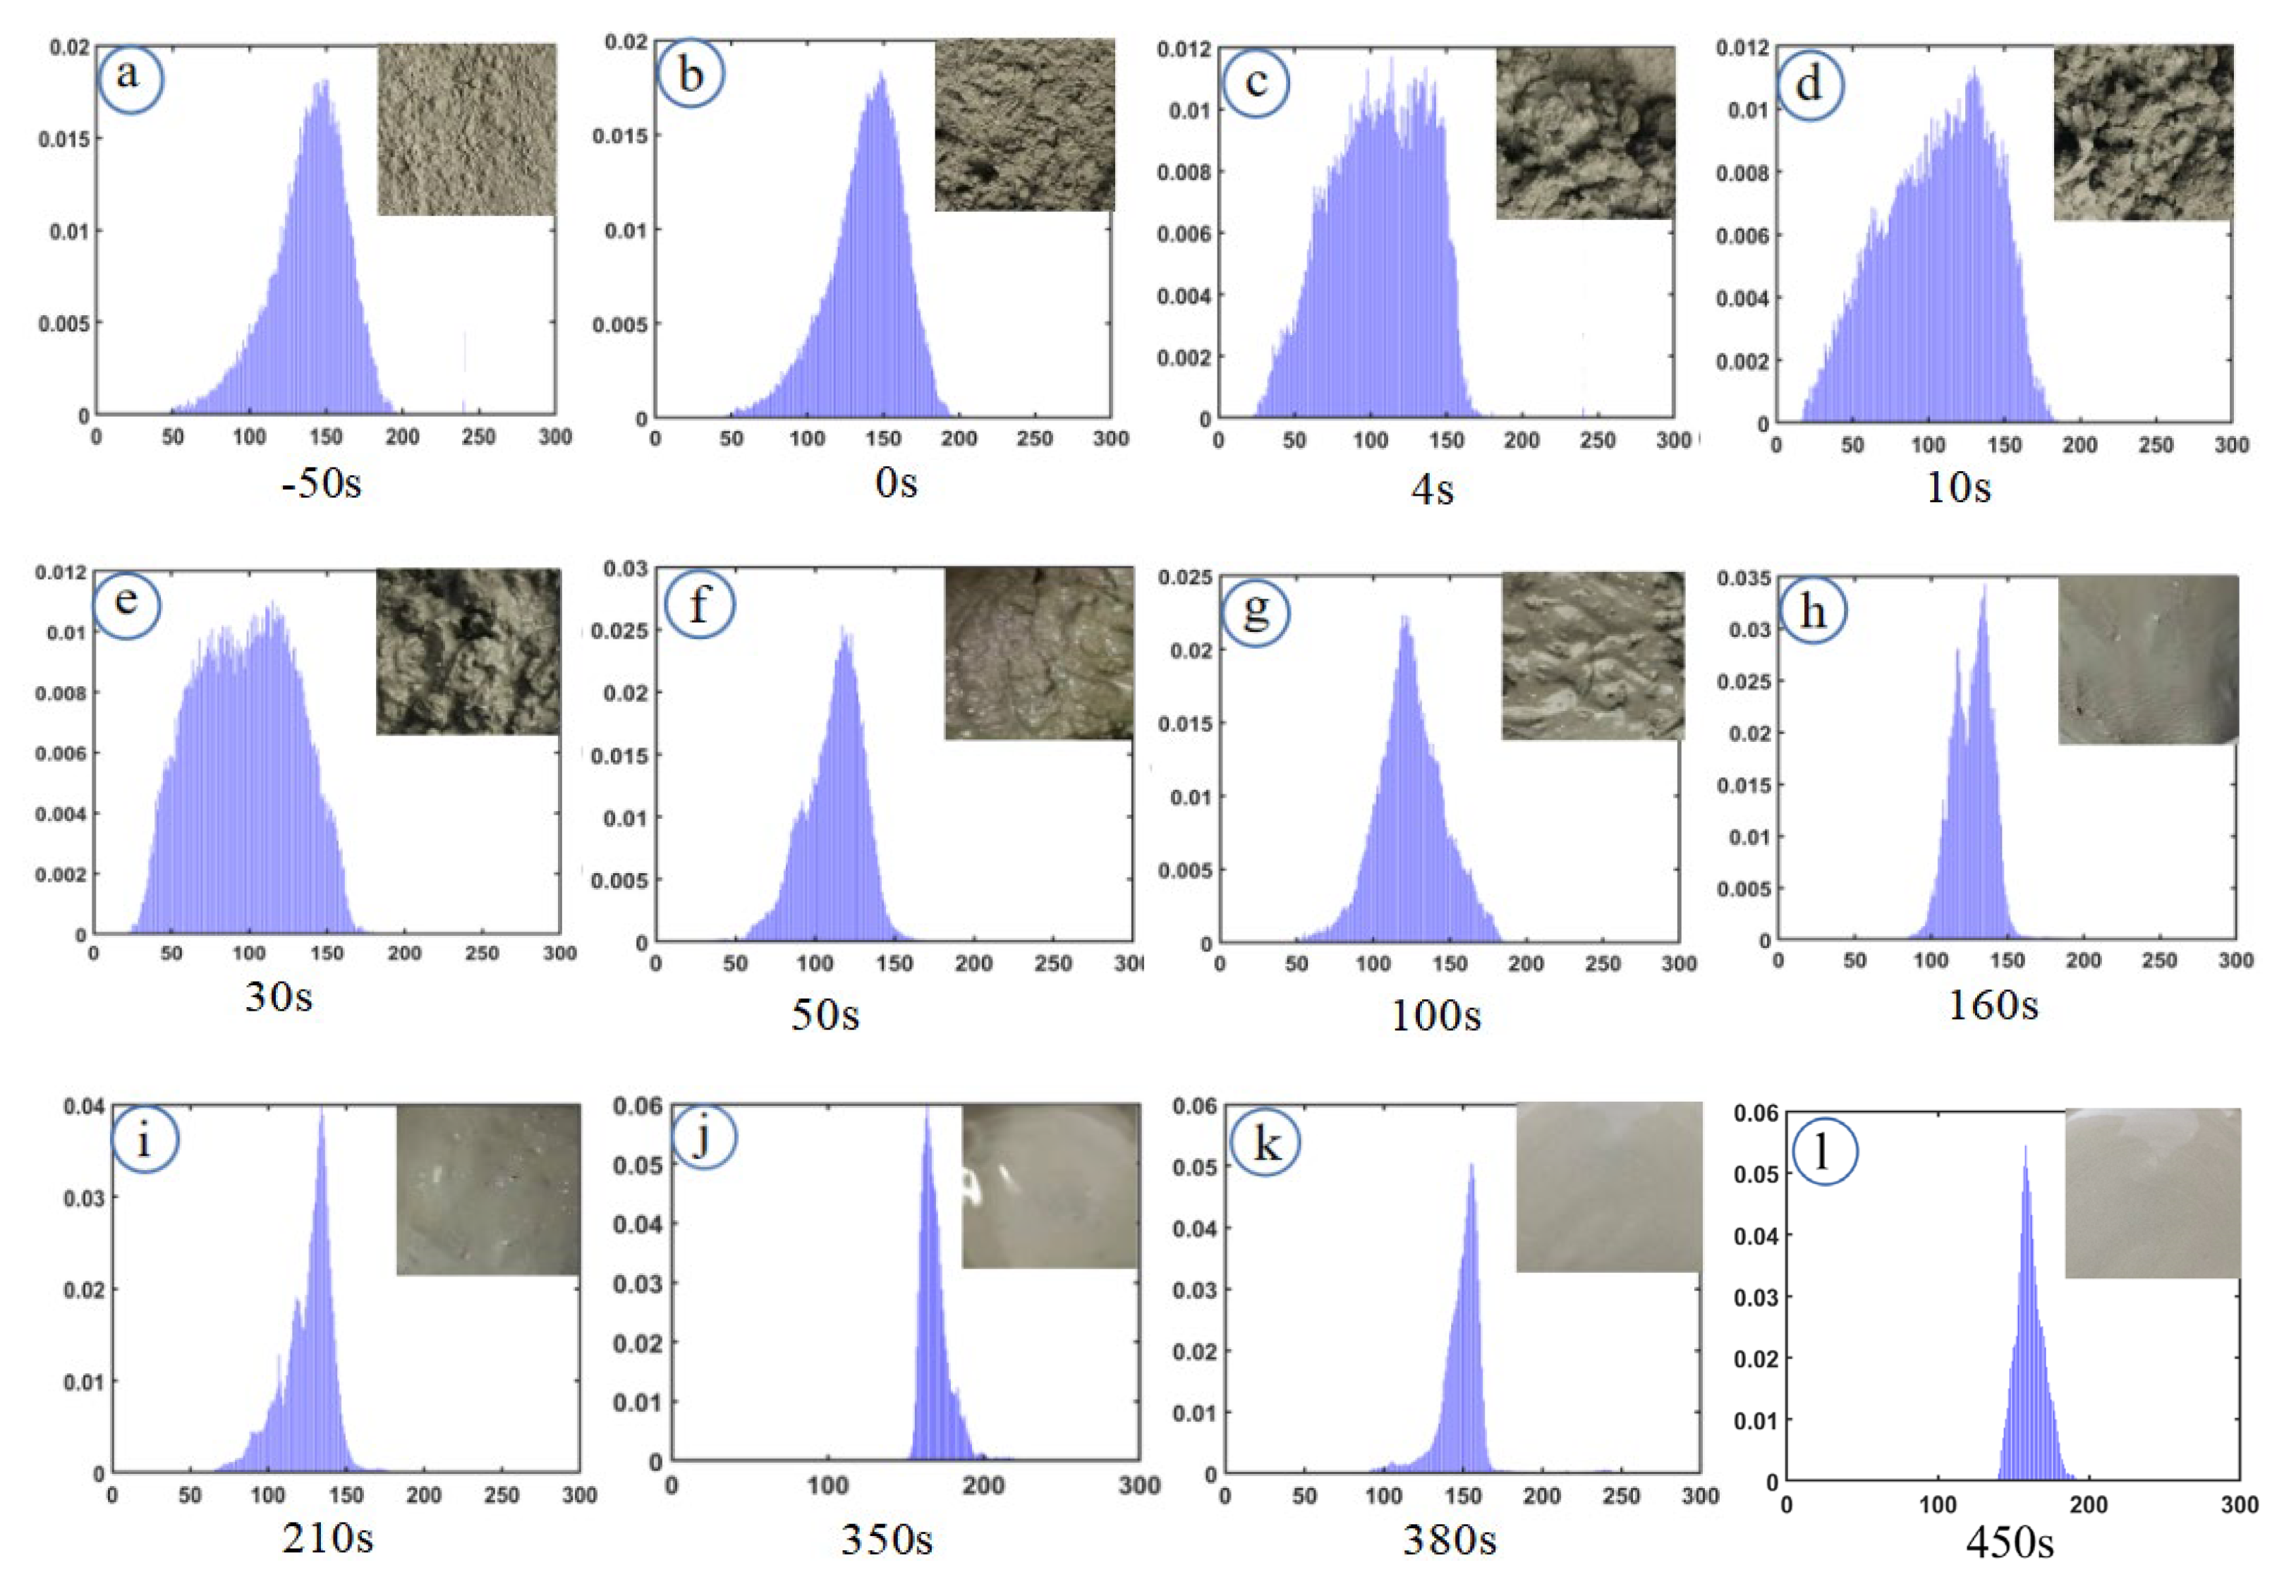
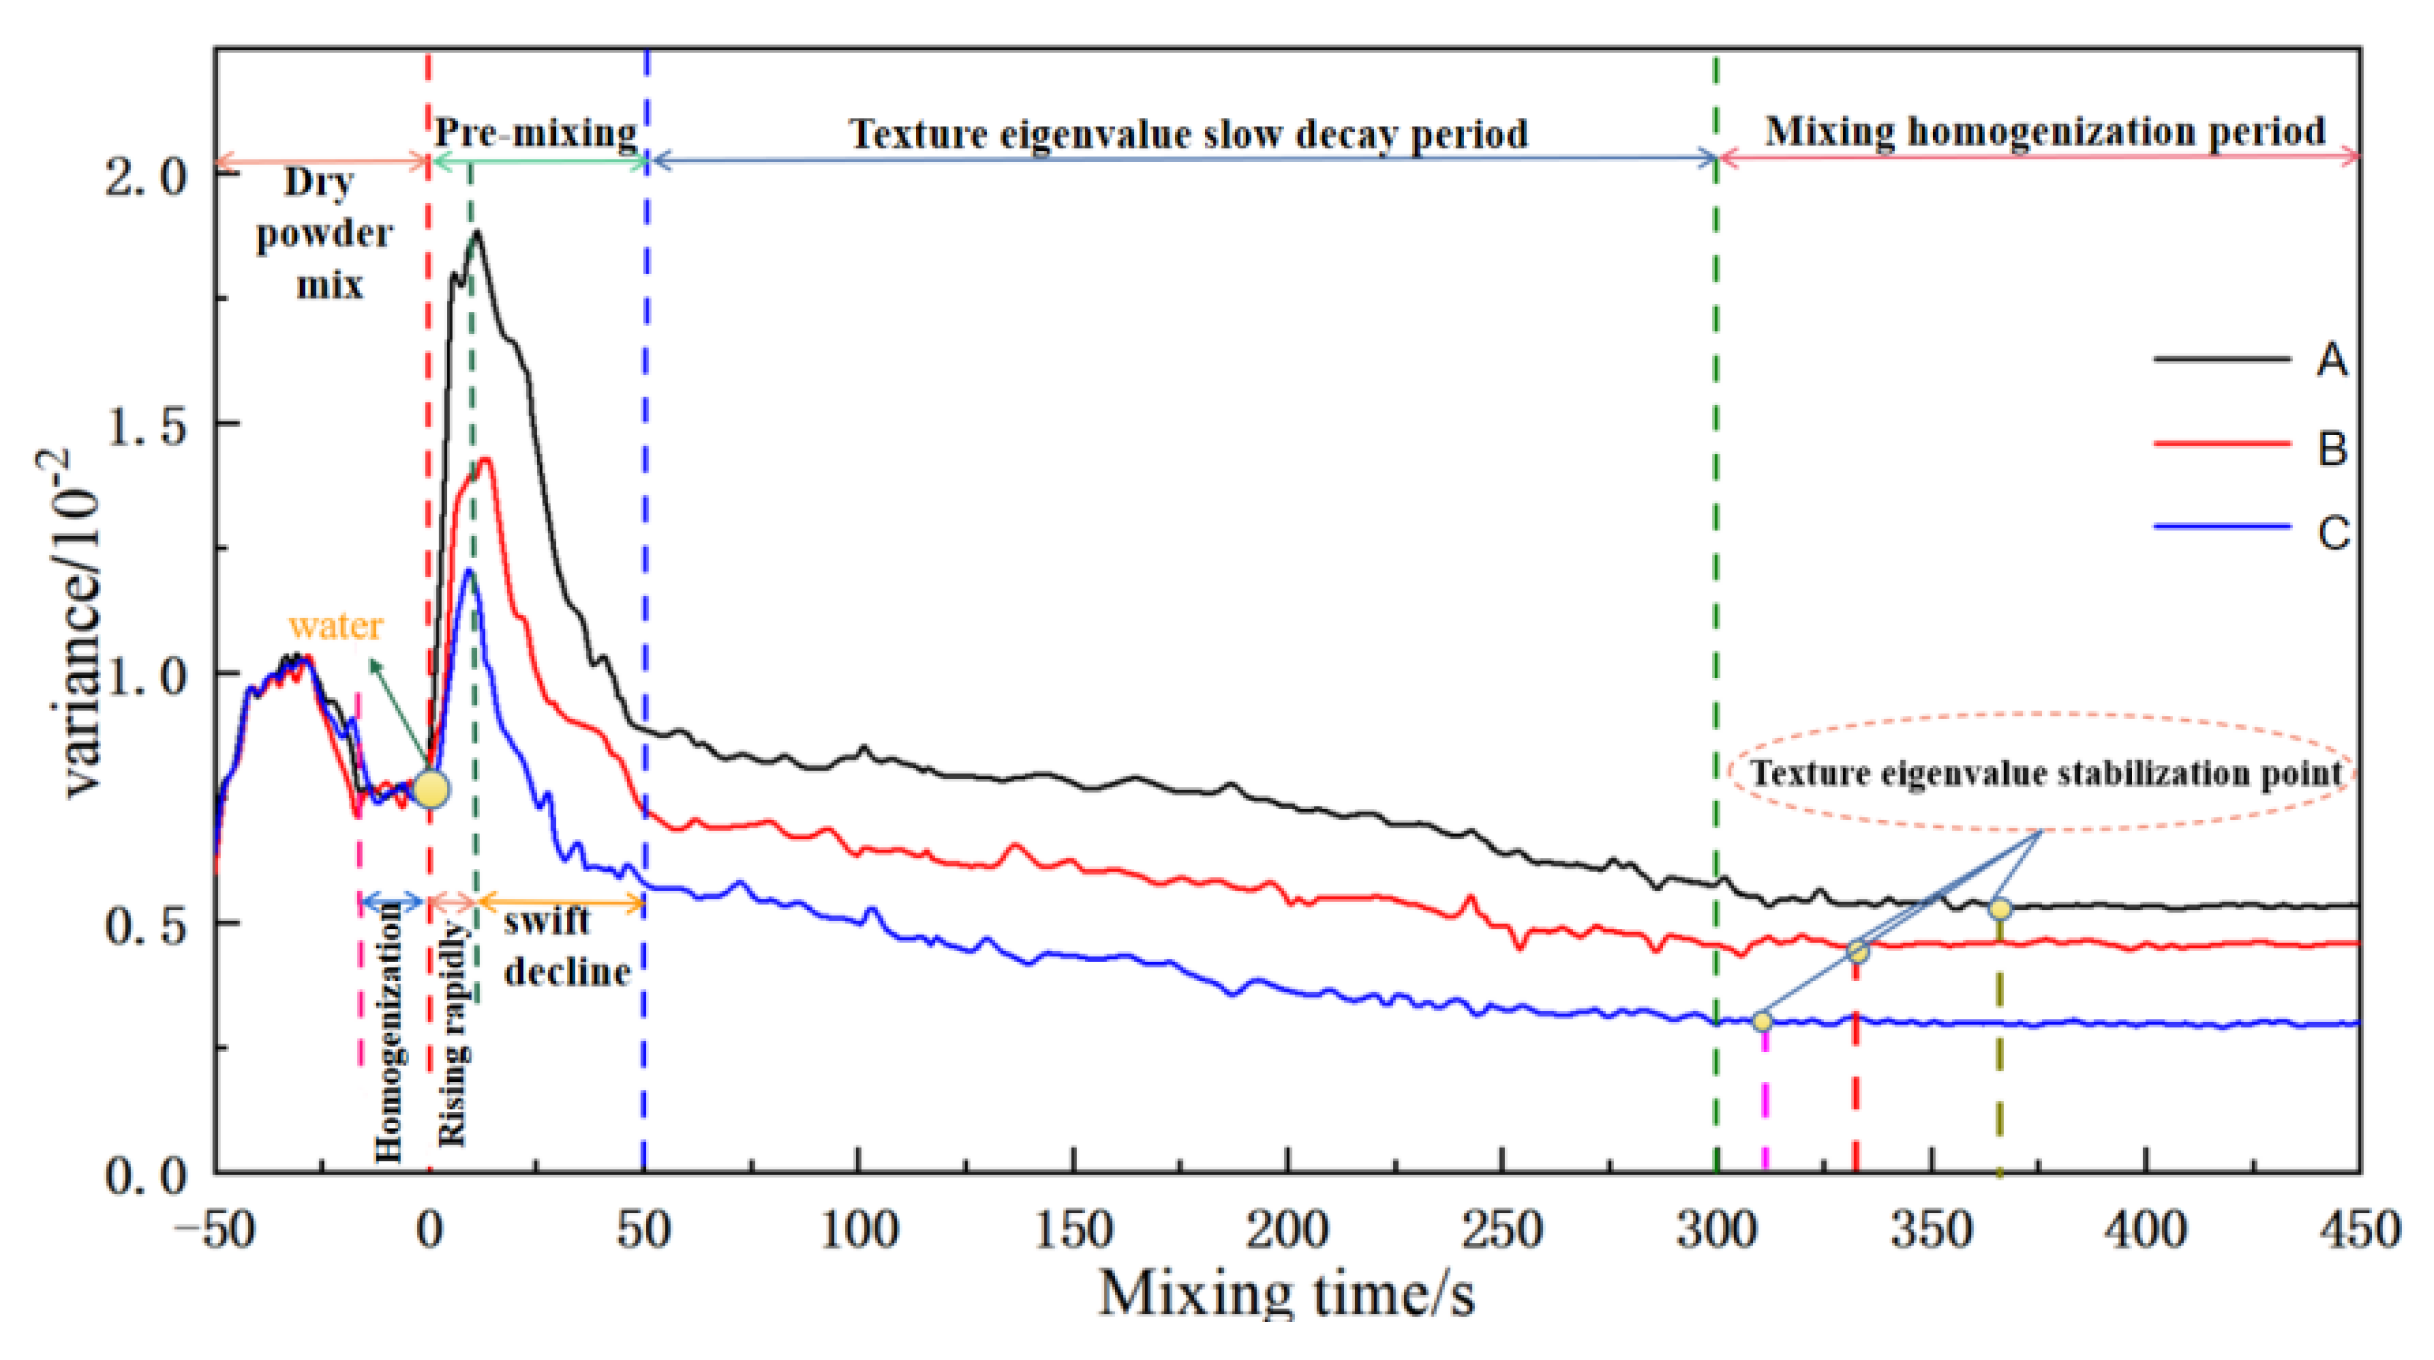
4.1. Image Texture Change

When the experiment was over, the image was exported from the high-speed camera (as shown in Figure 7). This research adopted the image texture analysis method introduced in Section 2.2 to obtain the image grayscale distribution histogram of the material at different mixing moments. Among them, the grayscale distribution results of group A1 (mass fraction of 72%) at different times are shown in the following Figure 7.
As shown in Figure 7, the grayscale distribution histogram is approximately normal distribution. The range of grayscale distribution first widens and then narrows with time, that is, the grayscale distribution curve is “fat” and then “thin”. The results show that during the process of mixing, the surface configuration of the material changes greatly, which reflects the difference between histograms. In order to further quantify this difference, the denoising method and variance calculation method in Section 3.2 were used to calculate the variance of the image grayscale distribution at different moments in three groups of experiments (A1, B1, and C1). The relationship curve between the grayscale distribution variance and time is shown in Figure 8.
As show in Figure 7 and Figure 8, the surface layer has dry tailings before mixing (Figure 7a). As the image color and surface texture are uniform, and the image grayscale values are concentrated, the texture feature values are relatively small. As the mixing went on, the cement and tailings are mixed with each other, which increases the surface difference of the material. Therefore, the texture feature value increases slightly.
With the addition of water, tailings and cement particles are bonded into agglomerates under the action of the liquid bridge force of water, as shown in Figure 7c. At that time, the surface texture of different size of particle clusters is more chaotic. There are even some shadow areas in the images, where the grayscale distribution range is wider, which means that the shape of the grayscale distribution curve becomes “short and fat”. In this process, the curve changes rapidly. In the experiments of the three groups, the curve rapidly becomes “fat” within 30 s after adding water, and the variance reaches its peak.
Under the further action of mixing and shearing, the agglomerated materials are gradually sheared and dispersed. The tailings, cement, water, and agglomerated particles that continued to adsorb water were broken and dispersed under the action of mixing and initially homogenized, which presented a “paste-like” form (as shown in Figure 7h). Finally, the texture feature value decreases rapidly. With further shearing, the three-dimensional structure of the finer particle flocculation and the slurry is destroyed and it releases the internal wrapped water. The material gradually takes the shape of a homogeneous paste with a relatively smooth surface and a consistent image texture (as shown in Figure 7i–l). The texture feature curve gradually reaches stability. At the same time, for the convenience of analysis and discussion, the study defines the time that the grayscale curve reaches its stability as the stabilization time (Ts).

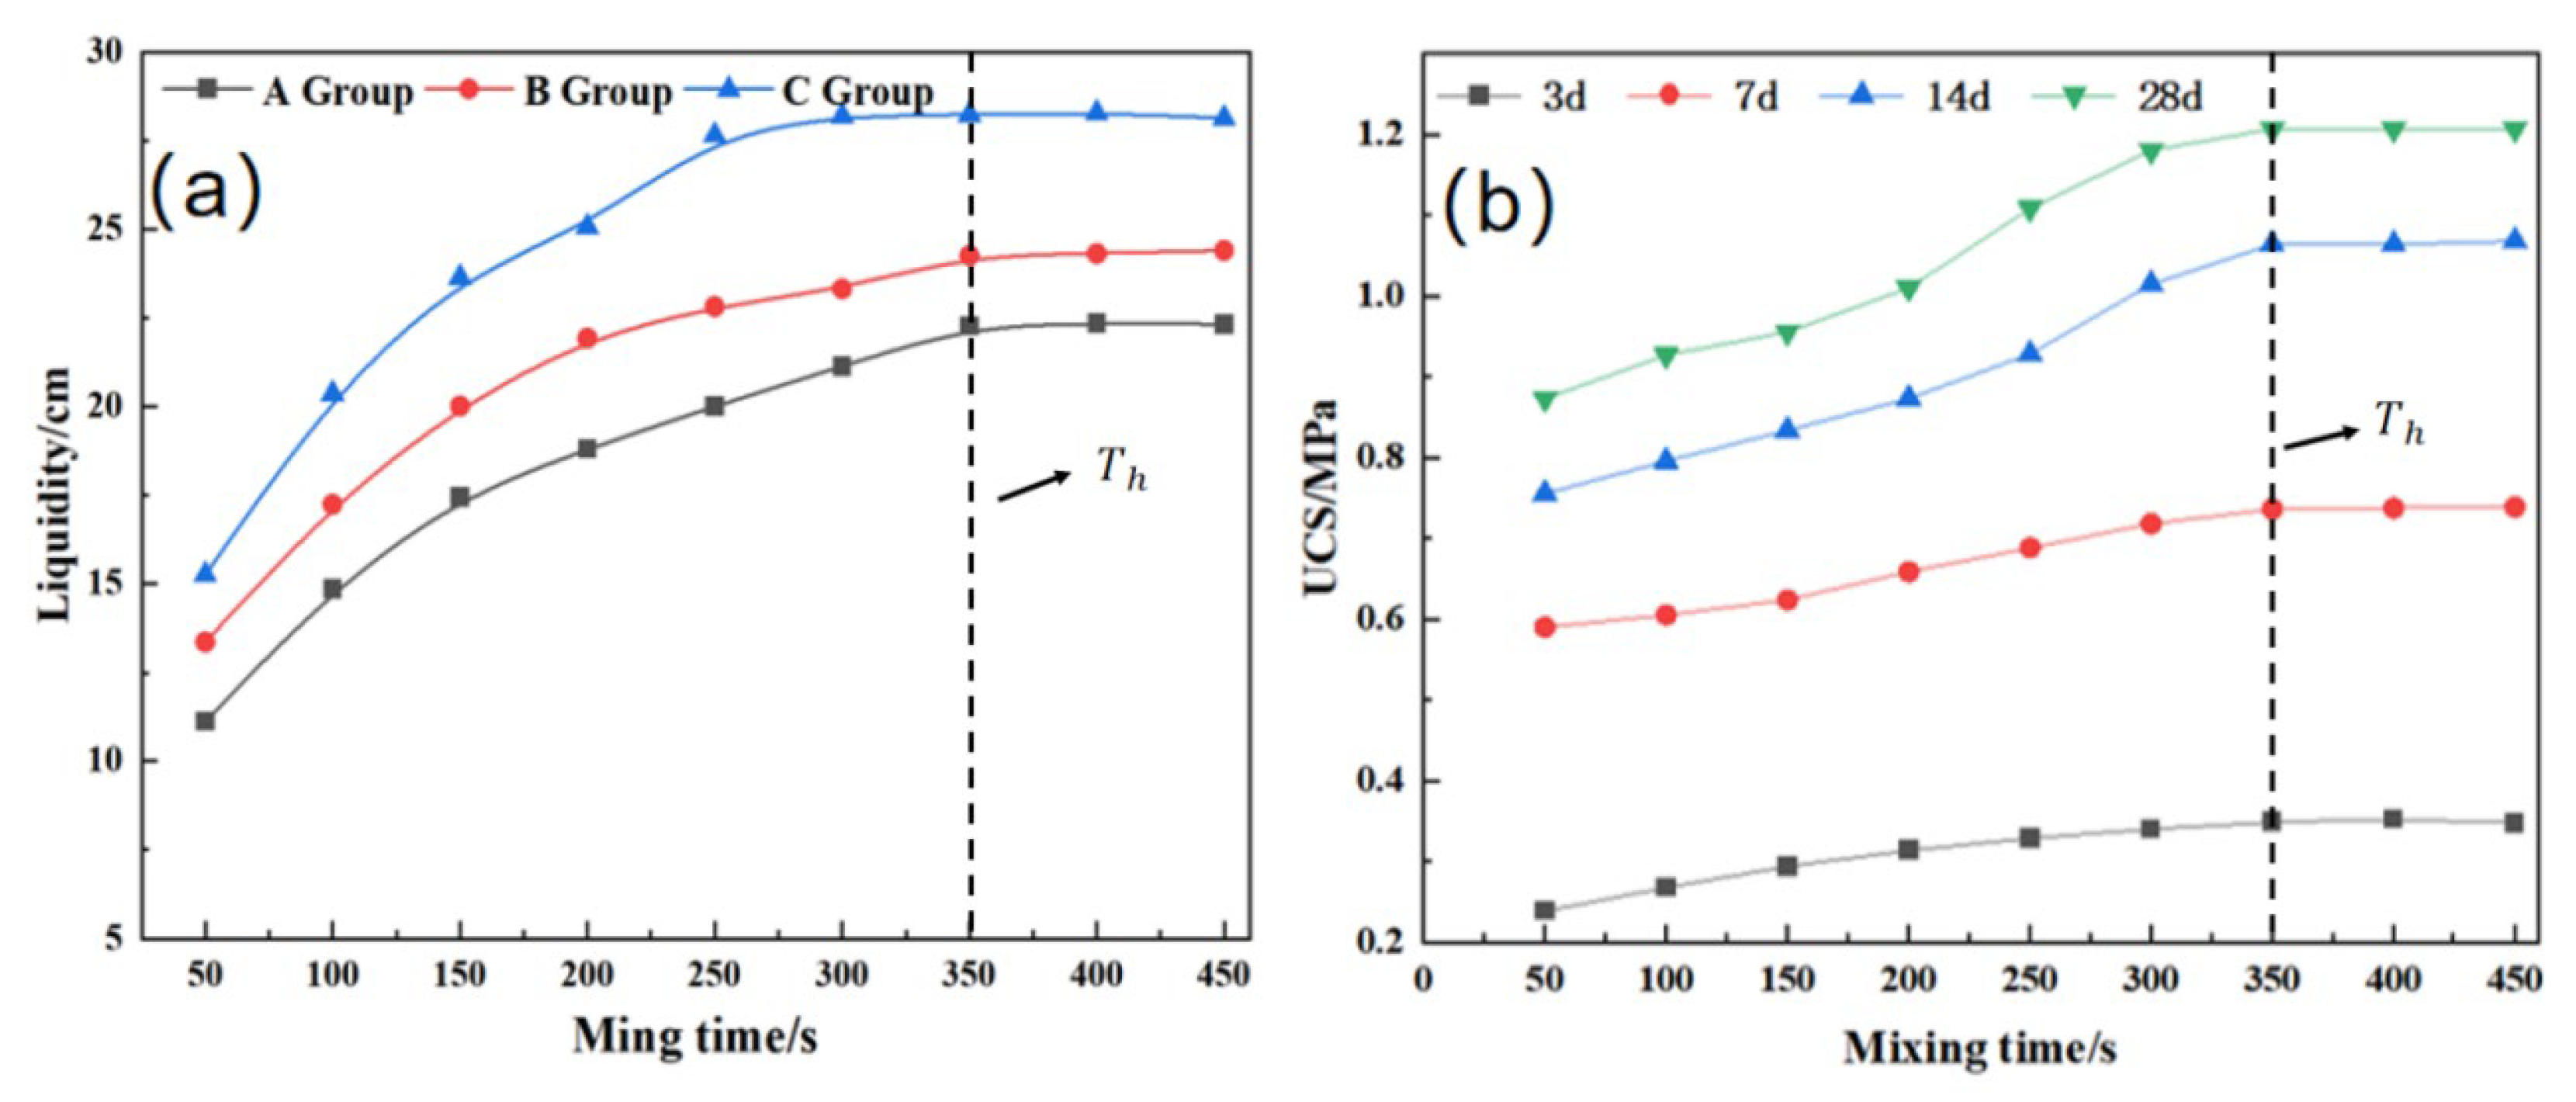
4.2. The Performance Test Results

According to the experiment results, the relationship between the liquidity of the slurry and mixing time is shown in Figure 9a. In addition to fluidity, the mechanical strength of the hardened paste is also of great significance. Therefore, the relationship between mechanical properties and mixing time was analyzed by testing the UCS of three samples with different proportions under different curing times. A representative set of UCS curves (A group) is shown to indicate the mechanical strength of hardened paste.
It can be seen from Figure 9 that the fluidity of CPB becomes worse as the concentration increases. However, increasing the concentration can promote the development of the mechanical strength of the hardened paste. Under the action of mixing, the mixture homogenizes gradually, and the fluidity and mechanical strength of fresh and hardened slurry are improved with the increased mixing time. They gradually tend to be stable (between 350 s and 400 s). It is also found that the higher the sample concentration is, the longer the mixing time we need to stabilize the fluidity and mechanical properties of the slurry. Compared with the slurry of relatively low concentration, it is more difficult to achieve homogenization in the slurry of relatively high concentration and requires longer mixing time.
Compared with (a) and (b) in Figure 9, it can be seen that the changing trend of slurry fluidity and mechanical strength with mixing time is consistent, and the mixing time required to achieve the best fluidity and mechanical strength for the same experimental group is almost the same. Studies show that the effect of mixing on fluidity and mechanical strength is closely related to the homogeneity of the mixture. Therefore, for the convenience of discussion and analysis, the mixing time required for the slurry to achieve the best homogeneity can be defined as the homogenization time (Th).

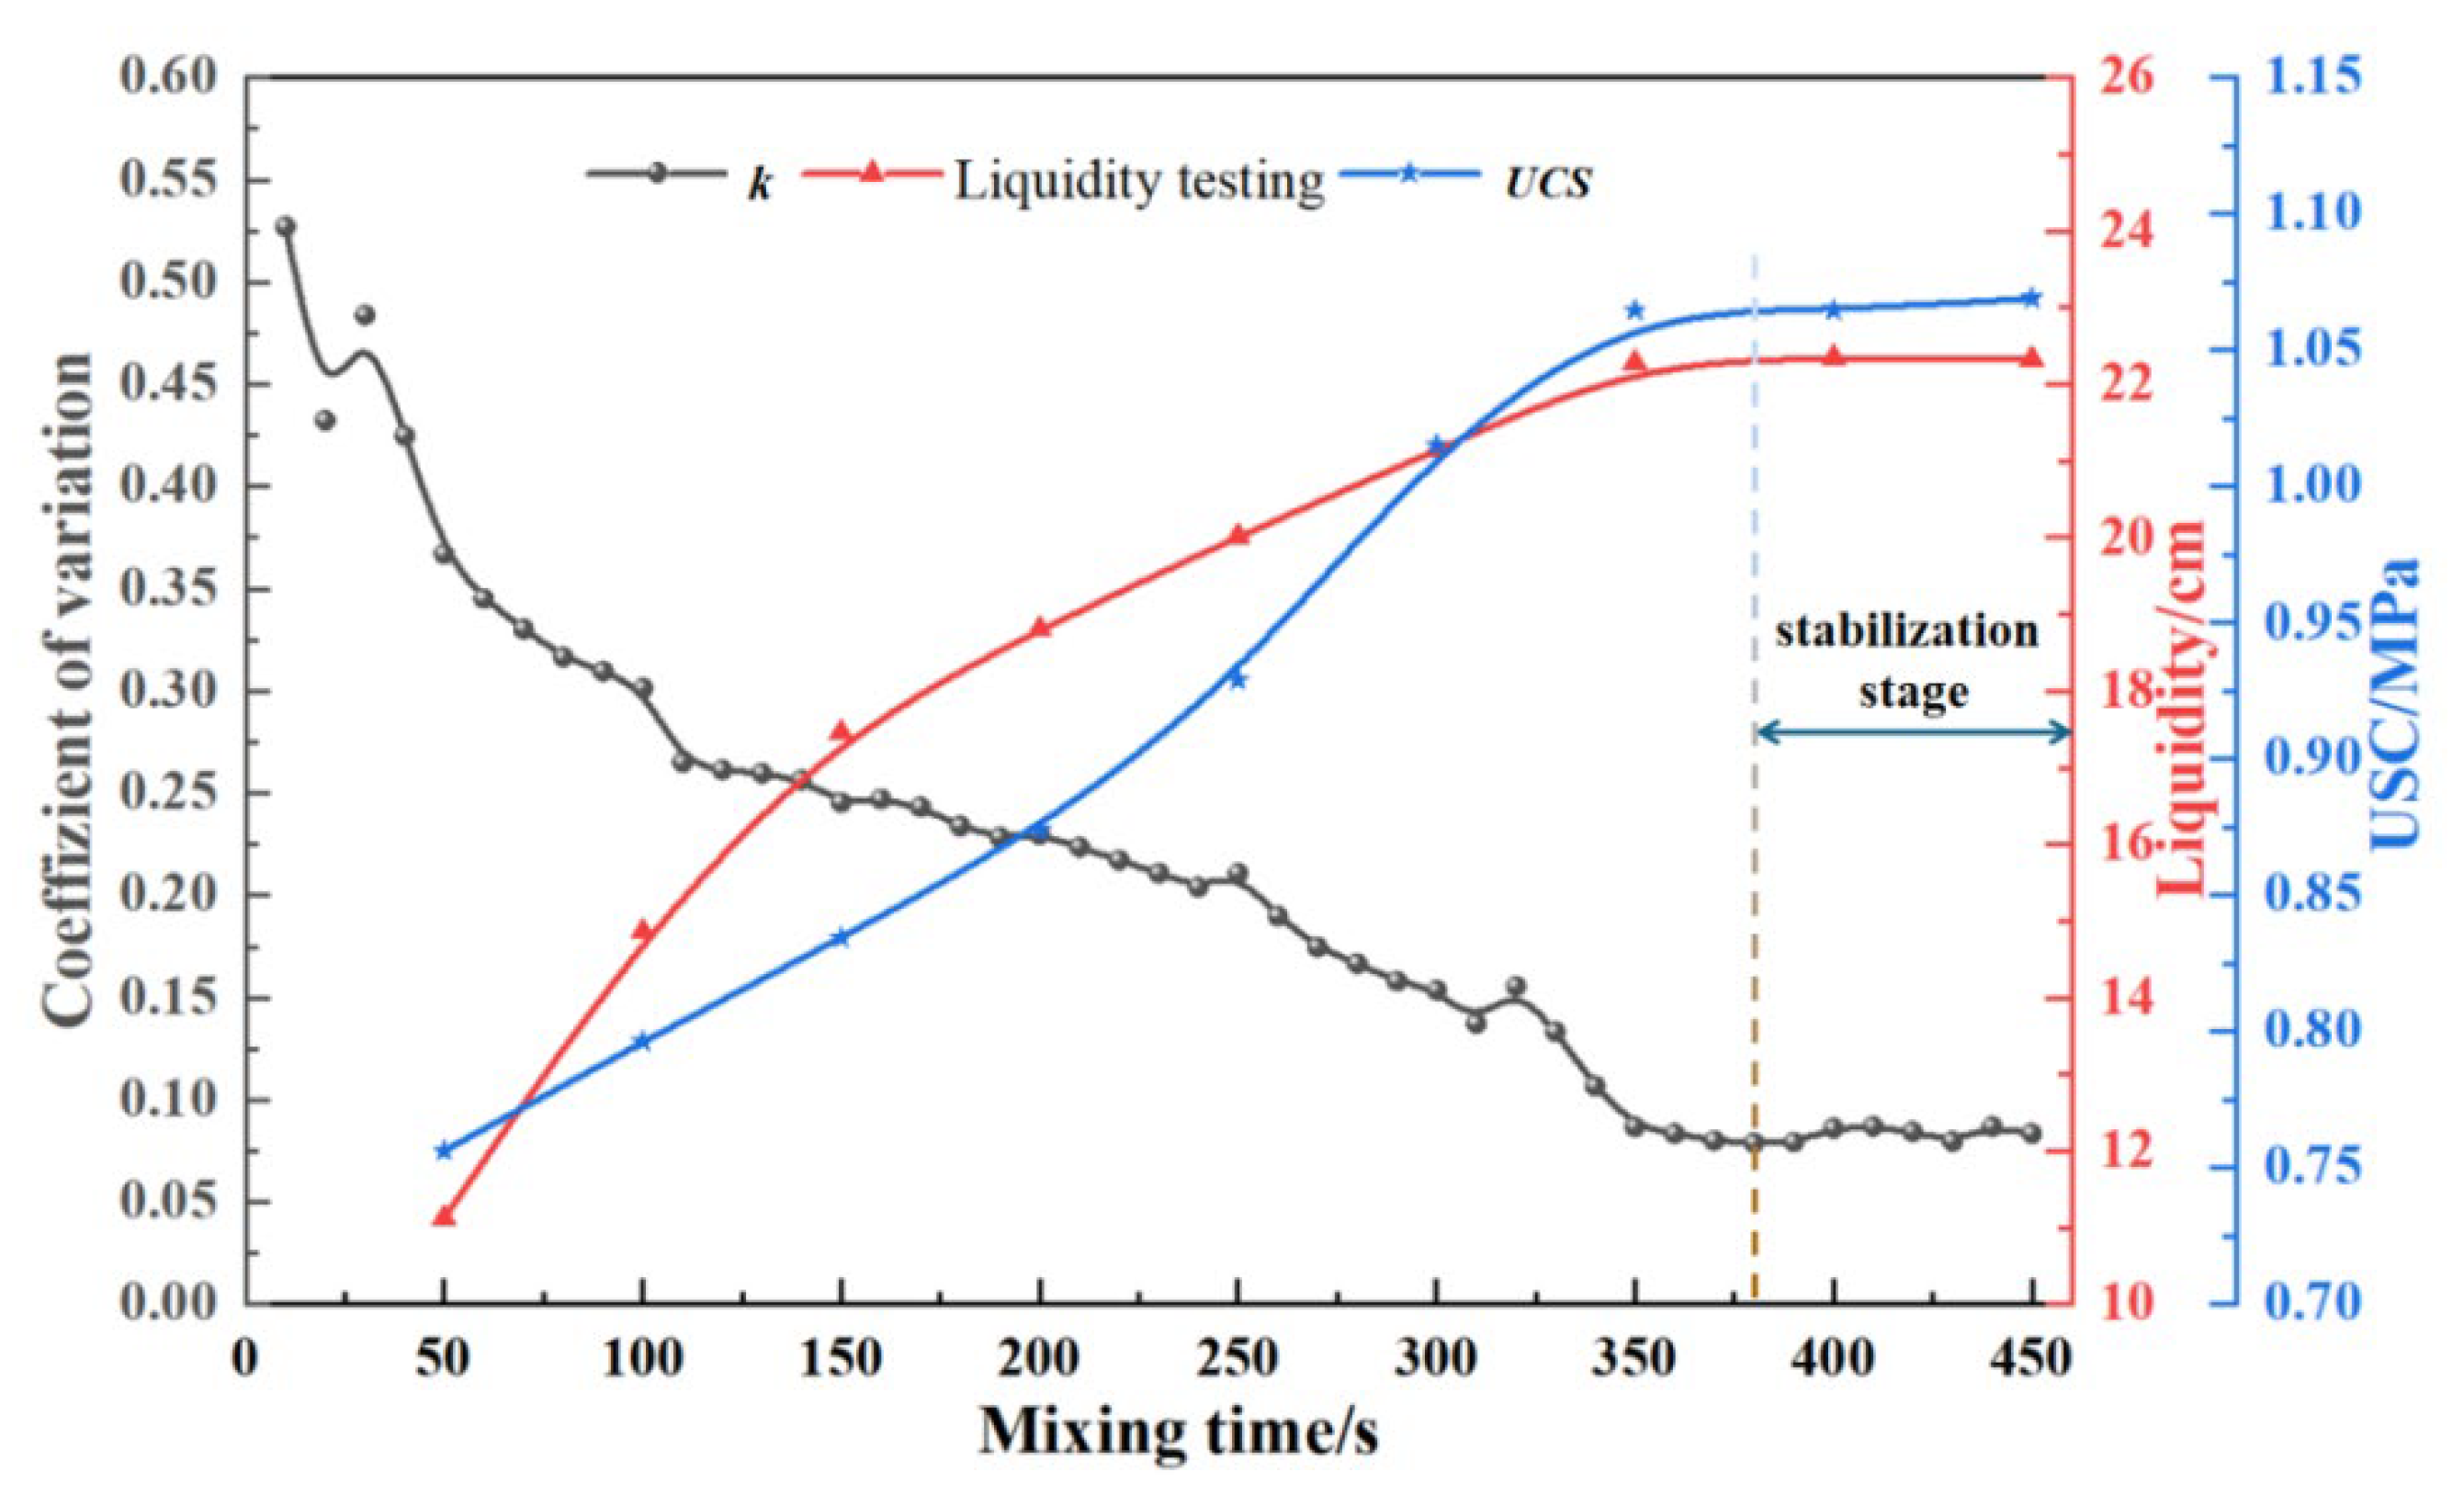
4.3. A New Characterization Method

At present, there is no uniform standard for the homogeneity of CPB. In the field of concrete, the homogeneity is mainly measured by testing the distribution of different batches of coarse aggregates. For CPB, coarse aggregate is not one of the most necessary components, so the technical standards for concrete cannot be borrowed. By referring to the mixing efficiency calculation method [38], it proposes a discriminative model of CPB homogeneity, which reads:
k = σ c t c s t c s t = C i + C i + 1 + + C i + 10 10 C i C i + n < C q     1 n 10
where k is the coefficient of paste homogeneity; σ(ct) is the standard deviation of the image texture feature. Cst is the final stability coefficient of the texture feature curve; Ci is the texture feature value at a certain time; and Cq is the maximum permissible error. Combined with the result in Figure 10, the value is 0.01.
According to the model, when the k value remains stable within a certain period of time, particle convection and water migration in different areas of the material maintain dynamic balance. This means that homogenization is reached. According to Daumann’s theory, k will eventually converge on a certain value under the condition of specific mixing equipment and process parameters, which has nothing to do with the ratio of materials. Thus, the homogeneous state of the slurry at a certain time can be determined by the convergency value.
The discriminative model of CPB homogeneity was used to analyze the results of image texture features, and the k of test groups A, B, and C converge to 0.048, 0.051, and 0.051, respectively. The calculation result of group A is shown in Figure 10. As we all know [39], to improve the homogeneity of the mixture is to pursue a better backfilling performance of CPB. The theoretical calculation results were used to compare with the backfilling performance (fluidity of fresh paste and UCS of the samples after curing for 14 days). Therefore, it was used as the criterion to analyze the accuracy of the theoretical model, as shown in Figure 10.
The average value of k convergence values (0.048, 0.051, 0.051) for the three experimental groups was 0.05, which can be taken as the discriminant coefficient of the paste homogeneity. By comparing the results of Figure 10, it can be seen that the group A1 experiment reaches a stable stage at about 370 s. Combined with the changing curve of backfilling performance, its backfilling performance (fluidity and mechanical strength) also tends to be stable at 370 s. The discriminant curve has negative correlation with the changing curve of backfilling performance before 370 s. At the same time, these three curves begin to stabilize at about 370 s, that is Ts = Th. The results show that there is a close correlation between texture features and homogenization, and the enhancement of homogenization of mixture reduces the texture feature value, and the image texture features are the macroscopic expression of the homogenization among the meso-particles [40].
Based on the discriminant model, the texture feature value of group B and group C were analyzed, and the stabilization time (Th) of the two experimental groups was 330 s and 310 s, respectively. Thus, the homogenization time (T0) of experimental groups B and group C was predicted to be 330 s and 310 s, respectively. This prediction was verified by the backfilling performance test results of group B and group C. Therefore, homogenization monitoring based on image analysis technology has good applicability and can give positive feedback to the evolution of backfilling performance of CPB in the mixing process, thus, the intelligent level and preparation quality are improved, and the labor cost of CPB technology is reduced.

4.4. The Engineering Implications of the Technology

Currently, most technicians in mines determine the mixing effect by testing the slurry samples to obtain the paste properties, e.g., mechanical performance, hydration properties, and fluidity. However, this method has great randomness and severe hysteresis quality. The paste factories lack the real-time monitoring technology of the slurry homogenization, and cannot learn about the quality of the slurry mixing in time. In this way, they fail to further optimize the mixing parameters.
In this study, a technique for judging the homogeneity of paste slurry based on images is proposed, which can quickly judge the effect of paste mixing. The operation to realize such an effect is shown in Figure 11. A camera is installed above the mixer to capture the image of the slurry, and the acquired image is transmitted to the control center. In the control center, the image analysis software is used to perform grayscale distribution statistics on the paste picture. Combined with Section 4.3, the K value is used as the basis for the identification of paste homogeneity, which is calculated by Formula (6). When the K value is less than 0.05, the prepared paste homogeneity can be considered good; when the K value is greater than 0.05, the network control center will give feedback to the mixer system so as to strengthen the mixing, such as increasing the mixing speed or reducing the backfill flow to extend the mixing time.
This technology enables real-time monitoring of the paste preparation process, helping to accurately grasp the homogeneity of the paste to ensure that the paste meets the backfill needs. In addition, this technology can improve the automatic management level of the backfill process, realize the unmanned backfill and mixing workshop, thus greatly reducing the labor cost and bringing considerable economic benefits to the mining enterprises.

5. Conclusions

Image analysis technology is applied to monitor the paste preparation process and grayscale variance value is adopted as the texture feature value to discriminate the surface differences of the slurry. The experimental results show that the variance curve of the three sets of slurry experiments has the same changing trend, converging at 370 s, 330 s, and 310 s, and its texture feature values are 0.00534, 0.00462, and 0.00305, respectively. It indicates that there is a correlation between the texture feature value and the paste properties. The higher the paste concentration is, the longer the mixing homogenization time is, and also, the greater the image texture feature value is.
Taking the backfilling performance (fluidity and mechanical properties) as the homogeneity index, the homogeneity appears to rise rapidly and then tends to stabilize with passing of the mixing time. This changing trend is similar to that of the image texture feature value. The results show that there is a correlation between image texture features and homogeneity of slurry, and it can be considered that the image texture features are the macroscopic manifestations of slurry meso-structure. It proves that the image texture feature value can be used to monitor the paste homogeneity.
Based on the image texture feature value of the paste to establish the discriminant model suitable for analyzing the homogeneity of paste slurry, the discriminant coefficient of the paste homogeneity is 0.05, which is suitable. Image monitoring technology can be used for homogeneity monitoring of intelligent backfilling process. When the k value in the discriminant model is close to 0.05, it can be considered that the paste slurry achieves good homogeneity. When the K value is greater than 0.05, the mixing system needs to strengthen mixing so that the paste performance can meet the backfill requirements. This technology is accurate and highly automated, which can greatly reduce the cost of backfilling management.

Author Contributions

Conceptualization, L.Y. and J.L.; methodology, H.J.; software, J.L.; validation, H.J. and A.W.; formal analysis, S.Y. and J.L.; data curation, L.Y.; writing—original draft preparation, J.L. and A.W.; writing—review and editing, L.Y. and J.L.; funding acquisition, L.Y. and H.J. All authors have read and agreed to the published version of the manuscript.

Funding

This research was funded by the National Natural Science Foundation of China (52104129), the key Laboratory of Mine Ecological Effects and Systematic Restoration, Ministry of Natural Resources (MEER-2022-09), the certificate certifies its holder is awarded the fellowship of China Postdoctoral science foundation (2022T150195), the Shandong Provincial Major Science and Technology Innovation Project, China (2019SDZY05), and the Doctoral Fund of Henan Polytechnic University (B2021-59).

Data Availability Statement

Data is contained within the article.

Conflicts of Interest

The authors declare no conflict of interest.

References

  1. Tuylu, S. Effect of different particle size distribution of zeolite on the strength of cemented paste backfill. Int. J. Environ. Sci. Technol. 2022, 19, 131–140. [Google Scholar] [CrossRef]
  2. Zhang, Y.L.; Li, J.J.; Liu, H.; Zhao, G.L.; Tian, Y.J.; Xie, K.C. Environmental, social, and economic assessment of energy utilization of crop residue in China. Front. Energy 2021, 15, 308–319. [Google Scholar] [CrossRef]
  3. Ruan, Z.E.; Wu, A.X.; Wang, Y.M.; Wang, S.Y.; Wang, J.D. Multiple response optimization of key performance indicators of cemented paste backfill of total solid waste. Chin. J. Eng. 2021, 44, 496–503. [Google Scholar] [CrossRef]
  4. Ali, G.; Fall, M.; Alainachi, I. Time-and Temperature-Dependence of Rheological Properties of Cemented Tailings Backfill with Sodium Silicate. J. Mater. Civ. Eng. 2021, 33, 04020498. [Google Scholar] [CrossRef]
  5. Elghali, A.; Benzaazoua, M.; Bussière, B.; Genty, T. In situ effectiveness of alkaline and cementitious amendments to stabilize oxidized acid-generating tailings. Minerals 2019, 9, 314. [Google Scholar] [CrossRef] [Green Version]
  6. Hefni, M.; Ahmed, H.A.M.; Omar, E.S.; Ali, M.A. The potential re-use of Saudi mine tailings in mine backfill: A path towards sustainable mining in Saudi Arabia. Sustainability 2021, 13, 6204. [Google Scholar] [CrossRef]
  7. Kasap, T.; Yilmaz, E.; Sari, M. Physico-chemical and micro-structural behavior of cemented mine backfill: Effect of pH in dam tailings. J. Environ. Manag. 2022, 314, 115034. [Google Scholar] [CrossRef]
  8. Liné, A. Energy consumption to achieve macromixing revisited. Chem. Eng. Res. Des. 2016, 108, 81–87. [Google Scholar] [CrossRef]
  9. Gautam, B.P.; Panesar, D.K.; Sheikh, S.A.; Vecchio, F.J. Effect of coarse aggregate grading on the ASR expansion and damage of concrete. Cem. Concr. 2017, 95, 75–83. [Google Scholar] [CrossRef]
  10. Liu, S.G.; Fall, M. Fresh and hardened properties of cemented paste backfill: Links to mixing time. Constr. Build. Mater. 2022, 324, 126688. [Google Scholar] [CrossRef]
  11. Adigamov, A.; Rybak, J.; Golovin, K.; Kopylov, A. Mechanization of stowing mix transportation, increasing its efficiency and quality of the created mass. Transp. Res. Procedia 2021, 57, 9–16. [Google Scholar] [CrossRef]
  12. Cheng, H.Y.; Wu, A.X.; Wu, S.C.; Zhu, J.Q.; Li, H.; Liu, J.; Niu, Y.H. Research status and development trend of solid waste backfill in metal mines. Chin. J. Eng. 2022, 44, 11–25. [Google Scholar] [CrossRef]
  13. Cazacliu, B.; Roquet, N. Concrete mixing kinetics by means of power measurement. Cem. Concr. Res. 2009, 39, 182–194. [Google Scholar] [CrossRef]
  14. Iveson, S.M.; Litster, J.D.; Hapgood, K.; Ennis, B.J. Nucleation, growth and breakage phenomena in agitated wet granulation processes: A review. Powder Technol. 2001, 117, 3–39. [Google Scholar] [CrossRef]
  15. Koohestani, B.; Bussière, B.; Belem, T.; Koubaa, A. Influence of polymer powder on properties of cemented paste backfill. Int. J. Miner. Process. 2017, 167, 1–8. [Google Scholar] [CrossRef]
  16. Gong, K.; Yang, J.; Wang, X.; Jiang, C.W.; Xiong, Z.; Zhang, M.; Guo, M.X.; Lv, R.; Wang, S.; Zhang, S.X. Comprehensive review of modeling, structure, and integration techniques of smart buildings in the cyber-physical-social system. Front. Energy 2022, 16, 74–94. [Google Scholar] [CrossRef]
  17. Ozersky, A.; Khomyakov, A.; Peterson, K. Novel ultrahigh performance concrete mixing technology with preliminary dry forced packing. Constr. Build. Mater. 2021, 267, 120934. [Google Scholar] [CrossRef]
  18. Wang, H.J.; Yang, L.; Li, H.; Zhou, X.; Wang, X.T. Using coupled rheometer-FBRM to study rheological properties and microstructure of cemented paste backfill. Adv. Mater. Sci. Eng. 2019, 2019, 6813929. [Google Scholar] [CrossRef] [Green Version]
  19. Ermolovich, E.A.; Ivannikov, A.L.; Khayrutdinov, M.M.; Kongar-Syuryun, C.B.; Tyulyaeva, Y.S. Creation of a Nanomodified Backfill Based on the Waste from Enrichment of Water-Soluble Ores. Materials 2022, 15, 3689. [Google Scholar] [CrossRef]
  20. Zhou, X.; Ruan, Z.E.; Wu, A.X.; Wang, H.J.; Wang, Y.M.; Yin, S.H. Aggregate evolution rule during tailings thickening based on FBRM and PVM. Chin. J. Eng. 2021, 43, 1425–1432. [Google Scholar] [CrossRef]
  21. Cazacliu, B. In-mixer measurements for describing mixture evolution during concrete mixing. Chem. Eng. Res. Des. 2008, 86, 1423–1433. [Google Scholar] [CrossRef]
  22. Yan, B.X.; Zhu, W.C.; Hou, C.; Yilmaz, E.; Saadat, M. Characterization of early age behavior of cemented paste backfill through the magnitude and frequency spectrum of ultrasonic P-wave. Constr. Build. Mater. 2020, 249, 118733. [Google Scholar] [CrossRef]
  23. Chen, J.L.; Zhang, N.; Li, H.; Zhao, X.B.; Liu, X.M. Hydration characteristics of red-mud based paste-like backfill material. Chin. J. Eng. 2017, 39, 1640–1646. [Google Scholar] [CrossRef]
  24. Li, Z.Y. Application research of digital image technology in graphic design. J. Vis. Commun. Image Represent. 2019, 65, 102689. [Google Scholar] [CrossRef]
  25. Nalesso, S.; Codemo, C.; Franceschinis, E.; Realdon, N.; Artoni, R.; Santomaso, A.C. Texture analysis as a tool to study the kinetics of wet agglomeration processes. Int. J. Pharm. 2015, 485, 61–69. [Google Scholar] [CrossRef] [Green Version]
  26. Watano, S. Direct control of wet granulation processes by image processing system. Powder Technol. 2001, 117, 163–172. [Google Scholar] [CrossRef]
  27. Su, Y.; Hong, F.; Shu, L. A building unit decomposition model for energy leakage by infrared thermography image analysis. Front. Energy 2020, 14, 901–921. [Google Scholar] [CrossRef]
  28. Zahid, A.A.; Rushd, S.; Hasan, A.; Rahman, M.A. Experimental investigation of multiphase flow behavior in drilling annuli using high speed visualization technique. Front. Energy 2020, 14, 635–643. [Google Scholar] [CrossRef]
  29. Xue, G.L.; Yilmaz, E.; Song, W.D.; Yilmaz, E. Influence of fiber reinforcement on mechanical behavior and microstructural properties of cemented tailings backfill. Constr. Build. Mater. 2019, 213, 275–285. [Google Scholar] [CrossRef]
  30. Mutahira, H.; Ahmad, B.; Muhammad, M.S.; Shin, D.R. Focus measurement in color space for shape from focus systems. IEEE Access 2021, 9, 103291–103310. [Google Scholar] [CrossRef]
  31. Wang, Y.B.; Wang, X.W.; Zhang, B.; Wang, Y. Projective invariants of D-moments of 2D grayscale images. J. Math. Imaging Vis. 2015, 51, 248–259. [Google Scholar] [CrossRef]
  32. Li, H.; Asbjörnsson, G.; Lindqvist, M. Image process of rock size distribution using dexined-based neural network. Minerals 2021, 11, 736. [Google Scholar] [CrossRef]
  33. Mafi, M.; Rajaei, H.; Cabrerizo, M.; Adjouadi, M. A robust edge detection approach in the presence of high impulse noise intensity through switching adaptive median and fixed weighted mean filtering. IEEE Trans. Image Process. 2018, 27, 5475–5490. [Google Scholar] [CrossRef] [PubMed]
  34. Guan, Z.X.; Pamba, R.V.; Balachander, B.; Kumarkhare, D.; Ded, N.; Boddu, R. Retrospection of Nonlinear Adaptive Algorithm-Based Intelligent Plane Image Interaction System. Comput. Intell. Neurosci. 2022, 2022, 3502830. [Google Scholar] [CrossRef]
  35. Li, P.; Liu, X.; Xiao, H. Quantum image weighted average filtering in spatial domain. Int. J. Theor. Phys. 2017, 56, 3690–3716. [Google Scholar] [CrossRef]
  36. Segura, I.; Molero, M.; Aparicio, S.; Moragues, A. Measurement of the degraded depth in cementitious materials by automatic digital image processing. Meas. Sci. Technol. 2010, 21, 055103. [Google Scholar] [CrossRef]
  37. Juez, J.M.; Artoni, R.; Cazacliu, B. Monitoring of concrete mixing evolution using image analysis. Powder Technol. 2017, 305, 477–487. [Google Scholar] [CrossRef] [Green Version]
  38. Daumann, B.; Fath, A.; Anlauf, H.; Nirschl, H. Determination of the mixing time in a discontinuous powder mixer by using image analysis. Chem. Eng. Sci. 2009, 64, 2320–2331. [Google Scholar] [CrossRef] [Green Version]
  39. Wu, A.X.; Ruan, Z.E.; Wang, J.D. Rheological behavior of paste in metal mines. Int. J. Min. Met. Mater. 2022, 29, 717–726. [Google Scholar] [CrossRef]
  40. Berthiaux, H.; Mosorov, V.; Tomczak, L.; Gatumel, C.; Demeyre, J.F. Principal component analysis for characterising homogeneity in powder mixing using image processing techniques. Chem. Eng. Process. 2006, 45, 397–403. [Google Scholar] [CrossRef]
Figure 1. Particle size distribution of tailings and cement.
Minerals 12 01622 g001
Figure 2. Laboratory mixer and its internal structure.
Minerals 12 01622 g002
Figure 3. Experimental process.
Minerals 12 01622 g003
Figure 4. Paste diffusion test process: (a) prepare a slump cone with the height of 60mm and the diameter of 36 mm, 60 mm, respectively; (b) grout; (c) trowl; (d) measure.
Minerals 12 01622 g004
Figure 5. Image grayscale.
Minerals 12 01622 g005
Figure 6. Filtering denoising for image of slurry.
Minerals 12 01622 g006
Figure 7. Gray-level histogram at different time (al); −50 s, 0 s, 4 s, 10 s, 30 s, 50 s, 100 s, 160 s, 210 s, 350 s, 380 s, 450 s) of a CPB mixing.
Minerals 12 01622 g007
Figure 8. Comparison of the difference after denoising treatment of each test group.
Minerals 12 01622 g008
Figure 9. Flow expansion (a) and mechanical properties (b) of group A.
Minerals 12 01622 g009
Figure 10. Homogeneity versus backfilling performance.
Minerals 12 01622 g010
Figure 11. On-line monitoring of CPB undergoing mixing.
Minerals 12 01622 g011
Table 1. Mineral composition of tailings.
CompoundSiO2SO3CuAgCaOMgOAl2O3Others
content/%67.681.392.531.599.264.46.196.96
Table 2. Main mineral composition of cement.
CompoundMgOSiO2Na2OK2OAl2O3SO3Fe2O3CaO
content (%)1.4020.700.180.484.502.603.3065.10
Table 3. Experimental ratio table.
GroupCement–Sand RatioSolid Concentration (%)Cement (g)Water (g)Tailing (g)
A1:8722790976524,000
B1:870279010,76124,000
C1:868279011,81624,000
Publisher’s Note: MDPI stays neutral with regard to jurisdictional claims in published maps and institutional affiliations.

