Article

Field Observations and Geophysical Research Applied to the Detection of Manganese (Mn) Deposits in the Eastern Part of Oban Massif, South-Eastern Nigeria: An Integrated Approach

1
Geo-Resources Research Group, Geology Department, University of Calabar, Calabar 540271, Nigeria
2
Applied Geophysics Unit, Department of Physics, Covenant University, Ota 11001, Nigeria
3
Department of Geoscience, University of Calgary, Calgary, AB T2N 1N4, Canada
4
Department of Archaeology, College of Tourism and Archaeology, King Saud University, Riyadh 12372, Saudi Arabia
*
Author to whom correspondence should be addressed.
Minerals 2022, 12(10), 1250; https://doi.org/10.3390/min12101250
Submission received: 4 September 2022 / Revised: 13 September 2022 / Accepted: 27 September 2022 / Published: 30 September 2022

Abstract

:
The growing need for an industrialized world, especially in Africa, cannot be feasible without adequate mineral resources. Thus, the search for more mineral deposits will continue to be necessary. An integrated approach involving geological mapping and a high-resolution geophysical (aeromagnetic) investigation was conducted to assess the manganese mineralization in parts of the Oban Massif, southeast Nigeria. The aeromagnetic data were processed using regional-residual anomaly separation techniques, first vertical derivative (1VD), analytical signals, source parameters imaging (SPI), and Euler deconvolution to better understand magnetic source distributions and their depths of occurrence. The geological investigation revealed a dominant variety of metamorphic rock types, including migmatitic (banded) gneisses hornblende granite gneisses, amphibolites, charnockites, and some quartzite ridges. Also present are some indications of pockets of dolerites. The study area also observed epithermal Mn+Fe+Qtz vein type mineralization associated with hydrothermal alteration zones whose orientation coincides with dominant structural orientation from aeromagnetic interpretation. Analysis of aeromagnetic data shows that the study area is dominated by ENE, NNE, and E-W structural directions (near-surface basement structures), with the ENE trends related to mineralization in the area. The manganese mineralization within Oban Massif is structurally controlled. The depths of the magnetic anomalies in the study area were estimated using SPI and Euler decomposition algorithms. SPI delineated the shallow, intermediate, and deep magnetic anomalies at 84–142 m, 152–200 m, and 215–656 m, respectively. Euler decomposition, however, revealed that shallow, intermediate, and deep depths occurrence of the magnetic anomalies are at 200–377 m, 393–472 m, and 499–793 m, respectively.

1. Introduction

In recent times, there has been the need to diversify the Nigerian economy from over-dependence on the oil sector to one that is multi-sectorial. Amidst several options is the revitalization of the mining sector through exploration and exploitation of the endowed natural resources of the nation. In addition to this significant point, there is a growing need for energy transition, especially regarding cleaner and greener energies. Before now, most geoscience players in the oil sector have viewed this move with increasing uncertainty, but the good side of the story is that some of the critical requirements of the energy transition are geoscience-related. Certain essential minerals will likely determine the pace and chart the course toward a successful energy transition. Geoscientists’ skill sets are required to fit into the big picture adequately. The technological requirements of each renewable energy flow path can be directly related to critical minerals and metals (copper, nickel, molybdenum, manganese, lithium, chromium, rare earth elements, etc.). The search for the availability of these minerals becomes very paramount. At present, it is noted that countries such as China, Peru, and the Democratic Republic of Congo (DRC) as known sources of these minerals, and their presence in other climes are not well documented or exploited [1,2]. The Federal Government of Nigeria’s move towards revitalizing the nation’s foremost Ajaokuta Steel Company for domestic production stresses the need for raw materials (Iron, Manganese, carbonates) and to make Oban manganese deposits open to the ready market. Besides this move, manganese, a multi-faceted metallic mineral, is not found as an element in nature but occurs in many minerals such as sugilite, purpurite, rhodonite, rhodochrosite, pyrolusite, and psilomelane [3]. It has extensive economic use in other sectors, including the steel industry, chemical, and environmental engineering, production of special aluminum alloys, ceramics industry, water purifying agents, agriculture (additives to livestock feed, plant fertilizers), colorants for bricks, and batteries [4]. The occurrence of manganese in Nigeria is distributed mainly within the NW and SW schist belts, including Maru-Anka, Birnin Gwari, and Igarra-Jakura-Kabba schist belts (Figure 1) belonging to the younger metasediments [5]. It is documented that Nigeria has over 5,000,000 metric tons (MT) of manganese deposits [6]. There are reports of manganese within basement rocks in southeastern parts of Nigeria and adjacent Cameroun [7,8,9,10]. However, [11] noted four (4) fracture sets in the Oban massif, the most prominent being the NNW-SSE trend, while minor sets occur in the NNE-SSW, E-W, and NW-SE trends. Local manganese occurrences have been reported in Neghe, Oban, Aking, and Akor [2,11].
These structural orientations are common to other mineralization, such as gold, banded iron formation (BIF), lead/zinc ores, tantalite, manganese, and marble deposits elsewhere in the crystalline basement rocks in Nigeria [12]. However, little is known about the manganese mineralization in the Oban area regarding the extent, nature, and style of mineralization. A proper understanding of the geology, structural setting, and the lateral extent of the deposit are needed to develop the resource. Like other basement terrains in Nigeria, the Oban Massif had experienced poly-phase deformational episodes with their relicts/vestiges left in the rocks of the area. The structural attributes of these deformational episodes are significant for exploration geologists in aspects of water and mineral exploration, building, and construction materials, among others [13,14,15]. This study is part of ongoing research to document updated information about the origin and economic significance of the area’s manganese (MnO) deposit. To this end, a geological and preliminary geophysical investigation was carried out in parts of the Oban Massif to unravel the relationship between basement structures and mineral deposits. The choice of the aeromagnetics technique as a tool here is to narrow the area of investigation and concentrate further exploration activities in highly prospective areas. The objective of this research involves analyzing the geological structures present within the study area and relating them to the occurrence of manganese mineralization. This research further elucidates the particular structure dominantly controlling the Mn mineralization.

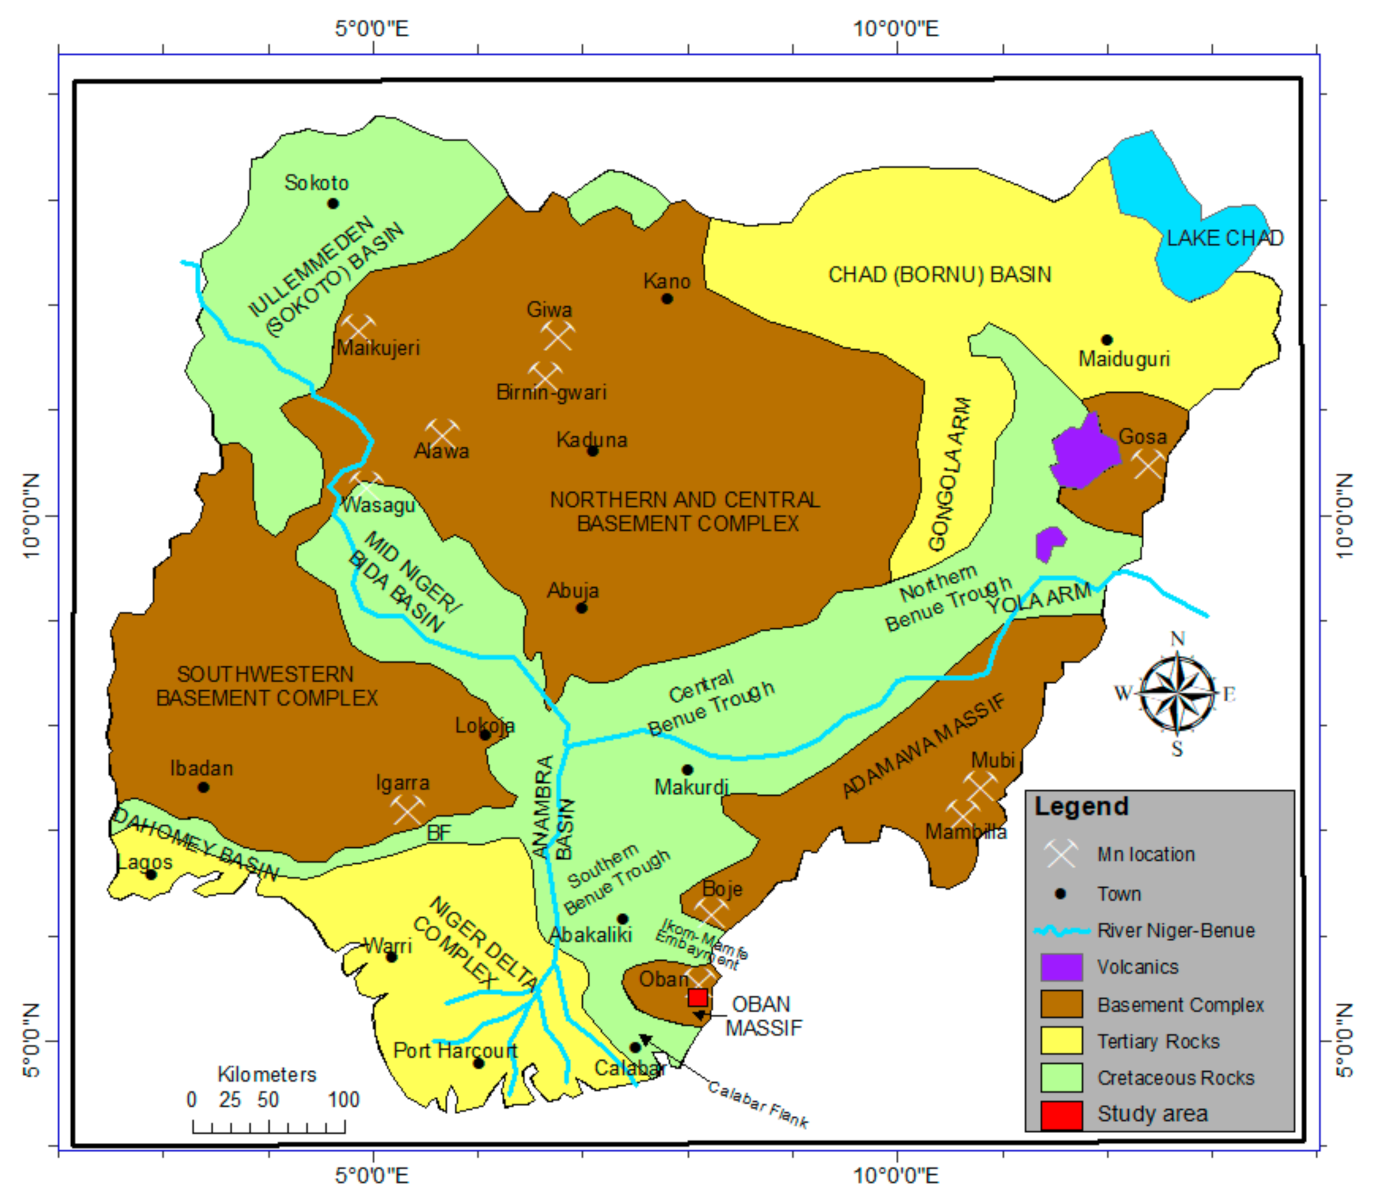
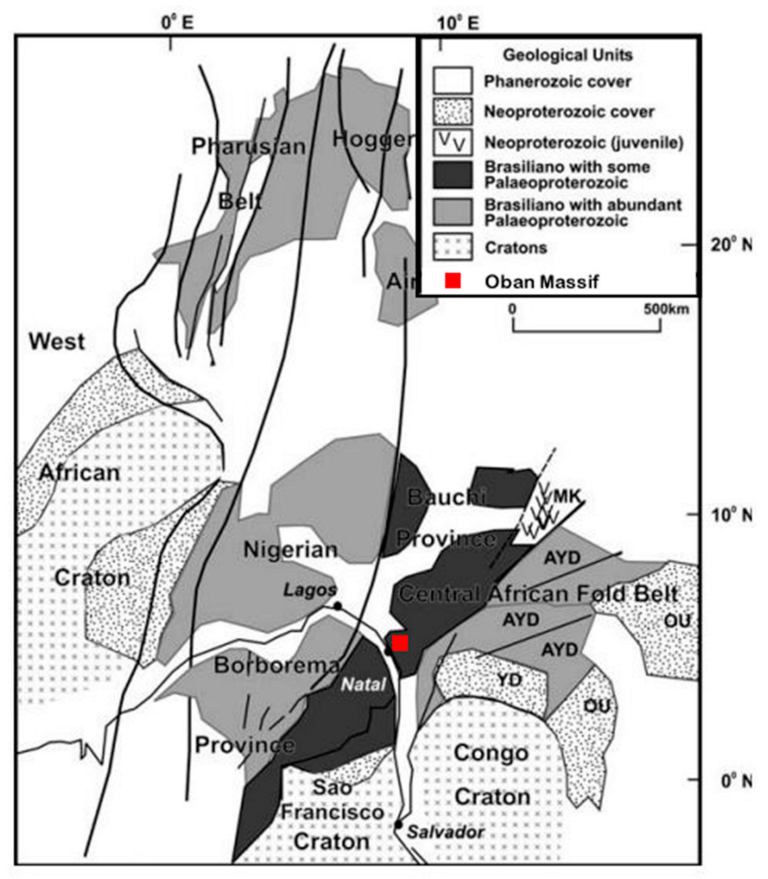
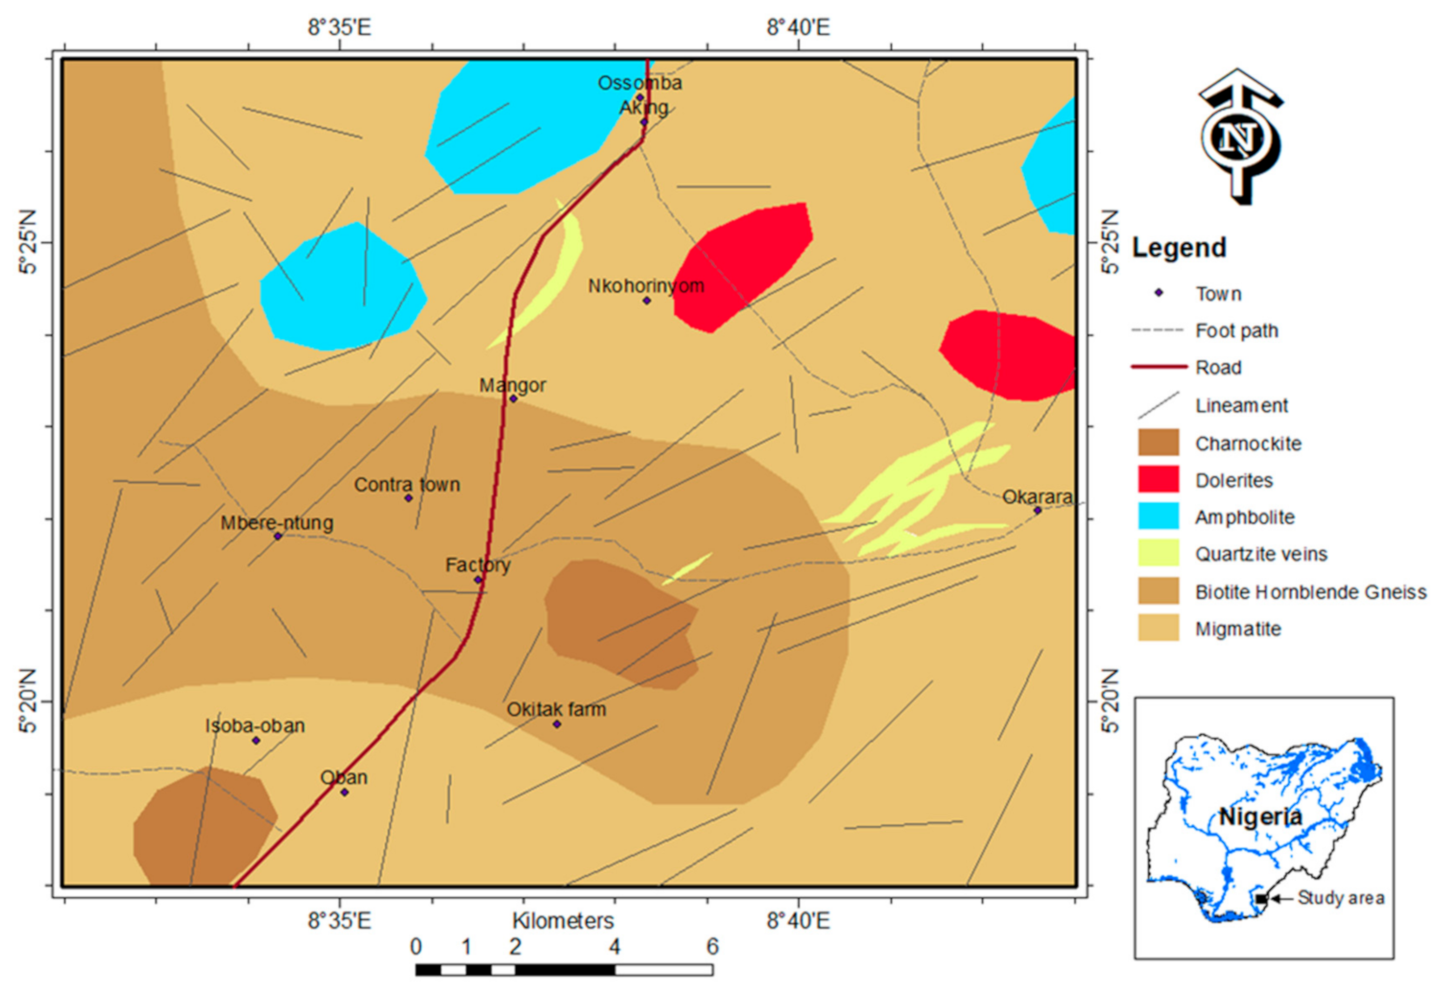
2. Geological Settings

The study area is in the SE highland and forms part of the Oban Massif in the southeastern Nigerian Basement complex. It is situated within Latitudes 5° 18′ 00″ N to 5° 27′ 00″ N and Longitudes 8° 32′ 00″ E to 8° 43′ 00″ E covering an estimated area of approximately 336.804 m2 (Figure 2). Remotely sensed data used to extract the topographic information were ASTER-DEM sourced from a global land cover facility (GLCF), hosted by the University of Maryland, U. S. A. There is a predominance of isolated hills in the area, with maximum heights of about 1200 m above sea level [16]. These hills rise steeply and abruptly, often dissected by V-shaped valleys, and are thickly forested to the summit of even the highest peaks.
Significant towns in the study area include Oban, Okarara, Mangor, Aking, Neghe, Ossomba, Isoba-Oban, and Mbere-Ntung, among others. The major road that gives accessibility to the study area is the Calabar-Ekang road. Other access routes into the interior areas where rock outcrops are exposed during the field mapping include minor roads, foot-path, and tracks. The study area is well-drained with a network of rivers and associated streams, actively engaged in the erosion of channels. The underlying geology is expressed within the weathered zones, fractured and jointed areas, and the drainage pattern is controlled [17,18]. Smaller rivers and streams drain into the larger Great Kwa River and the Cross River. Prominent ones include Ikpai, Ibe, Akarom, Mankor, Ajin, Ayok, Eku, and many other rivers.
Geologically, the study area lies within the Oban Massif of the southeastern Basement Complex of Nigeria and forms part of the Pan-African mobile belt. It is Precambrian and extends from the African continent to the orogenic belts known around the northeast of South America [19,20,21]. It forms part of the Nigerian Basement Complex and is composed dominantly of the gneiss-migmatite rock suites, which were later intruded by the Older Granite (Pan-African) and Younger Granite (Jurassic) rock series, as well as mafic, ultramafic, and intermediate rocks [22,23]. The absolute age from radiometric dating (Rb-Sr and K-Ar) revealed that the basement rocks are polycyclic [24]. They were affected by the Eburnean (2000 ± 200 Ma), Kibaran (1300–900 Ma), and Pan-African (800–500 Ma) orogeny [25,26,27]. According to [28], Archean and Proterozoic rocks found in the basement terrains were believed to have been remobilized during the Neoproterozoic with a valuable portion of juvenile materials (Figure 3).
The Orogenic belts in Nigeria have been divided into eastern and western blocks and are separated by a major NS trending lineament [30,31]. The main feature characterizing the eastern terrains of the Precambrian basement rocks are high-grade metamorphic rocks [32], pervasive migmatization, granite plutonism [33], and a thin metallogenic province [5,34].

3. Materials and Methods

3.1. Data Acquisition

Data for this study were from geologic field mapping and secondary aeromagnetic data obtained from the Nigerian Geological Survey Agency. The geologic field campaign involved lithological mapping of rock units and measuring the observed structural (foliation orientations, lineament) features. Rock samples and mineral samples were also collected during the mapping exercise. Thus, structural data were tabulated and used to generate rose diagrams and stereographic projections. Secondary aeromagnetic data were employed in this study from part of topographic sheet 324 (Oban) Nigeria, on a scale of 1:100,000. Fugro-Airborne Surveys (FAS) of Canada collected airborne magnetic data in Nigeria under contract to the Nigerian government under the supervision of the Nigerian Geological Survey Agency (NGSA) between the years 2005 and 2010. Aeromagnetic data of some parts of Nigeria are available for research upon request from the Nigerian Geological Survey Agency (NGSA). The data were acquired with a terrain clearance of 0.08–0.1 km, tie line spacing of 0.5 km, and flight-line spacing of 0.1 km along 826,000 lines using the Flux Adjusting Surface Data Assimilation System (FASDAS). The flight lines and tie-lines, respectively, were aligned northwest–southeast and northeast–southwest. The direction of the tie-lines was carefully chosen to run across the major geological strike. To eliminate IGRF from the produced dataset, FAS used the 10th generation International Geomagnetic Reference Field (IGRF) version 4.0. In magnetic data reduction, IGRF is widely used and widely available. IGRF ensures uniformity in data reduction methods. Mineral evaluation programs, basin framework, hydrocarbon, hydrogeological explorations, and regional geologic boundary delineation can benefit from processed and corrected high-resolution aero-magnetic data [35,36,37]. The airborne magnetic data used in this study were corrected and processed into a total magnetic intensity map (Figure 4), which was gridded, stored, and shown in color raster format in Oasis Montaj Geosoft.

3.2. Data Processing and Analysis

The outcrop and mineral samples collected from the field were subjected to petrographic analysis using an XP-213C petrographic microscope, and the information was used to classify the rocks and map out the boundaries for the geological map. Fugro-Airborne Surveys (FAS), Canada, completed all of the needed aerial magnetic data filtering and correction techniques. The magnetic data were fed into the World Geodetic System 84 (WGS 84) and the Universal Transverse Mercator coordinate system at zone 32 of the Northern Hemisphere (UTM-32N) using the local datum-transformation and projection method, respectively. The data file was loaded into Oasis Montaj. The processes such as regional-residual anomaly separation, first vertical derivative (1VD), analytical signals, source parameters imaging (SPI), and Euler deconvolution were comprehensively applied to extract valuable structural information, mapping subsurface structures such as geological contacts, faults, and zones associated with mineral deposits in the study area.
In geophysical studies, the observed total magnetic field intensity is the sum of magnetic fields generated from all subsurface sources. The goal of a particular magnetic interpretation often involves the delineation of small-scale targets buried at a specific depth, and the magnetic responses of these targets are merged with a regional field which is typically the responses of more extensive or deeper magnetic sources than the shallower targets. The residual fields created by the target sources are usually removed from the regional field using the residual-regional anomaly separation technique [38]. The high and short-wavelength components of the magnetic anomaly are termed regional and residual anomalies, respectively. The residual anomalies are seen as small, local patterns but of considerable importance. They provide information on structures for mineral ore exploration. The conventional method for regional-residual anomaly separation utilizes either low pass (for regional) or high pass (for residual) filtering techniques. The high pass filter attenuates the frequencies lower than the cut-off frequency ( λ c ) and passes high-frequency signals [39]. It passes all frequencies with λ λ c . The high pass rectangular filter can be expressed in the 1D Fourier domain as:
L ( λ ) = { 1 , λ λ c 0 , λ < λ c
The low pass filter attenuates all frequencies higher than the cut-off frequency ( λ c ) and passes low-frequency signals [39,40,41]. The exact attenuation number depends on each frequency’s filter configuration [41]. The low pass rectangular filter can be expressed in the 1D Fourier domain as:
L ( λ ) = { 0 , λ > λ c 1 , λ λ c
The 1VD was employed to remove long-wavelength features of the magnetic field, thereby significantly improving the resolution of closely spaced and superposed anomalies. Additionally, a fast Fourier transform (FFT) combined with transfer functions of the first vertical derivative and a low-pass filter was performed using the gridded residual magnetic intensity data. The vertical gradient filters ideally amplify short-wavelength field components at the expense of long wavelengths [42]. The applied analytical signal (AS) filter is significant in detecting the source of magnetic minerals [43,44]. The amplitude of the analytic signal can be obtained from the square root of the square sum of the vertical and horizontal derivatives of the magnetic field as follows:
A S I G ( x , y ) = ( m x ) 2 + ( m y ) 2 + ( m z ) 2
where m is the observed magnetic field.
The significance of this technique in data enhancement is that its amplitude function is ever positive and the assumption on the magnetization direction of the source. The analytical signal operates on a principle similar to the horizontal gradient method; peaks in the analytic signal (AS) amplitude are identified. The identified maxima of the analytical signal can be used to detect the structures responsible for the observed magnetic anomalies over the study area. AS technique helps to delineate the source locations of the magnetic anomaly irrespectively of the direction and remnant magnetization in the source.
Depth estimation by the Euler deconvolution technique was used for mapping the geologic contacts within the area. This technique is a boundary finder and a depth estimating method because it automatically calculates source location and depth. The standard-Euler deconvolution (st-ED) method relies on solving Euler’s homogeneity equation:
( x x 0 ) m x + ( y y 0 ) m y + ( z z 0 ) m z = N ( B M )
where ( x 0 , y 0 , z 0 ) represents the position of the magnetic source that produces the total magnetic field M measured at ( x , y , z ) . B and N is the regional value of the total magnetic field and structural index, respectively. The depth approximation using source parameter imaging is derived from the wavelength of the analytical signal, which according to [45], is described as;
A 1 ( x , z ) = T ( x , z ) x j T z
where j = 1 , and T ( x , z ) is the magnitude of the anomalous total magnetic field; x and z are the orthogonal Cartesian coordinates representing the vertical and horizontal directions perpendicular to the strike, respectively.
The gridded aeromagnetic data for this research were processed using the Oasis Montaj software version 8.2. The data were subjected to various enhancement algorithms, such as edge detection and source detection. These algorithms enabled the delineation of lineaments and magnetic zonation related to lithology and their subsequent mineralization within the heterogeneous subsurface. The enhancement techniques utilized variation in the physical properties such as magnetic susceptibility and thickness of the lithologic units. Structural information enhanced from processed magnetic data was then extracted using ArcMAP 10.4, a GIS software. The surface and near-surface structural information were digitized from the processed aeromagnetic data.

4. Results

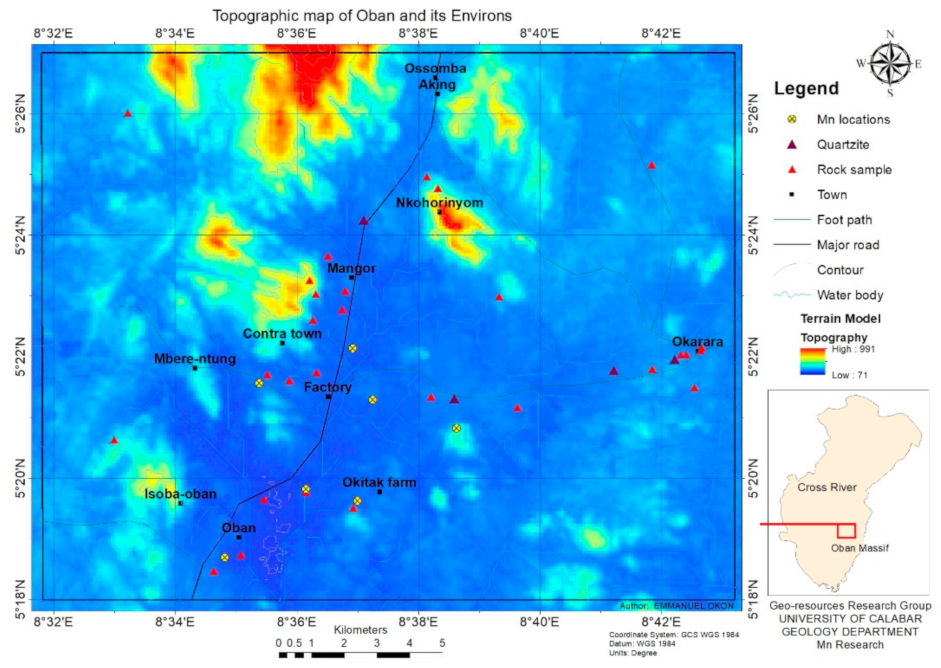
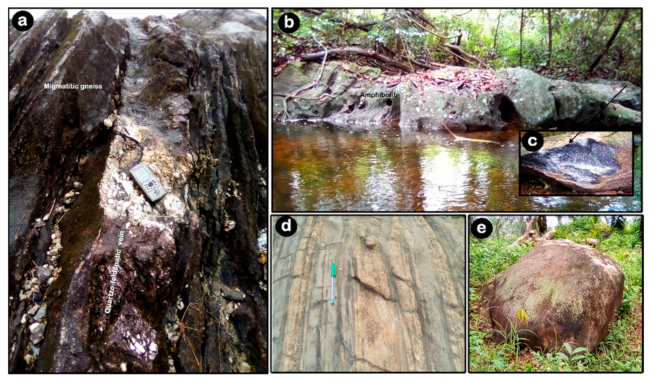
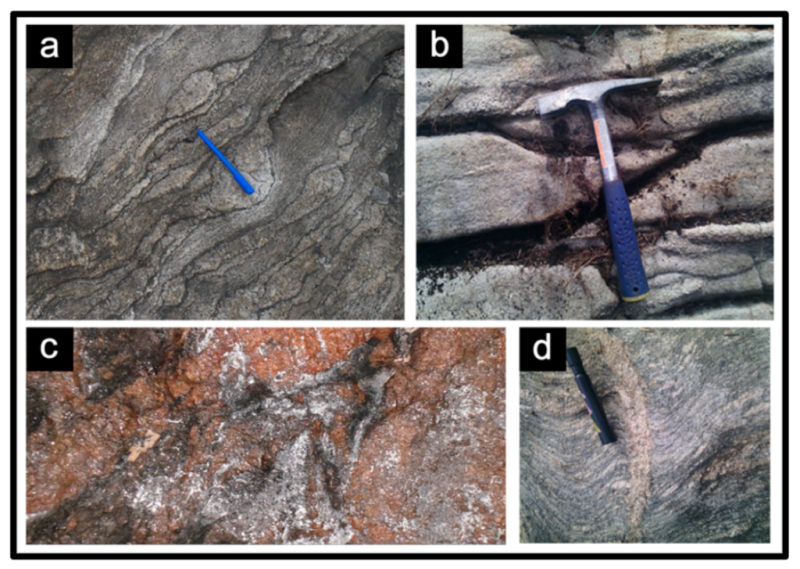
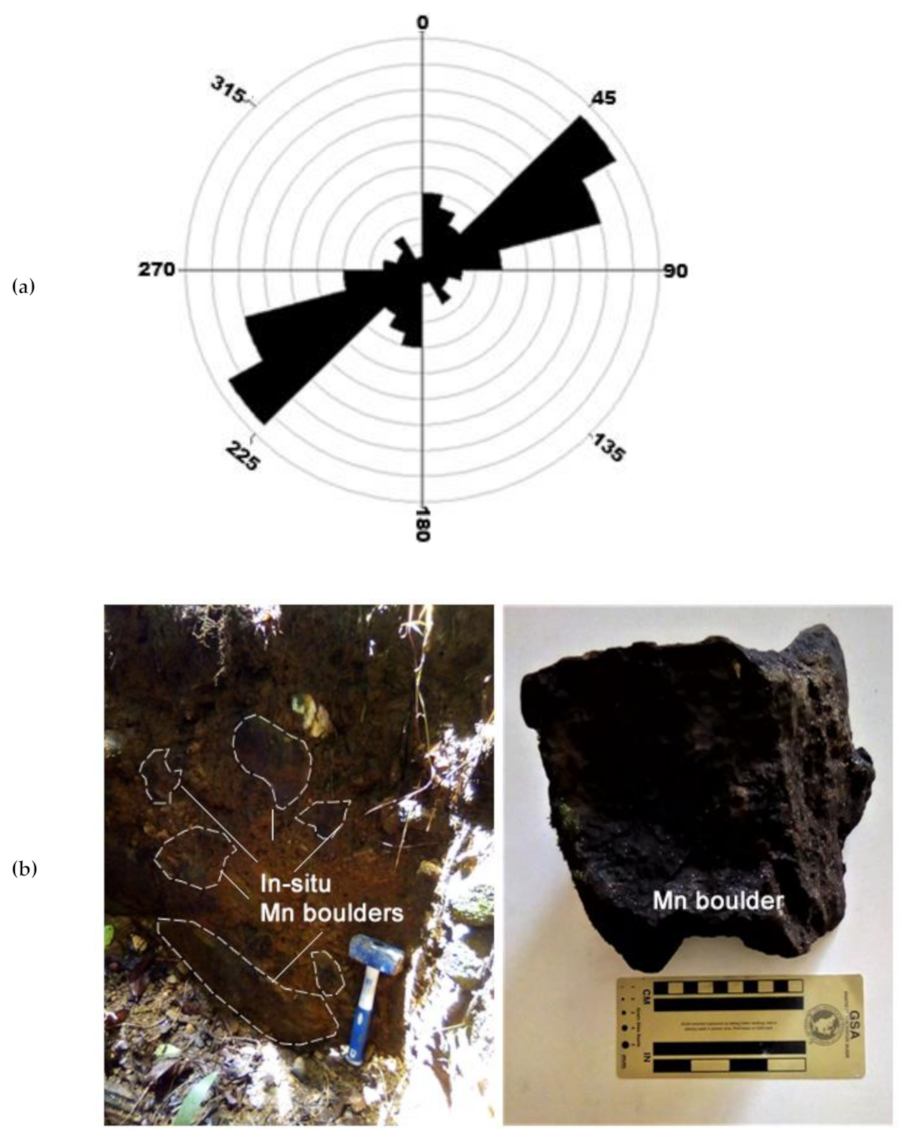
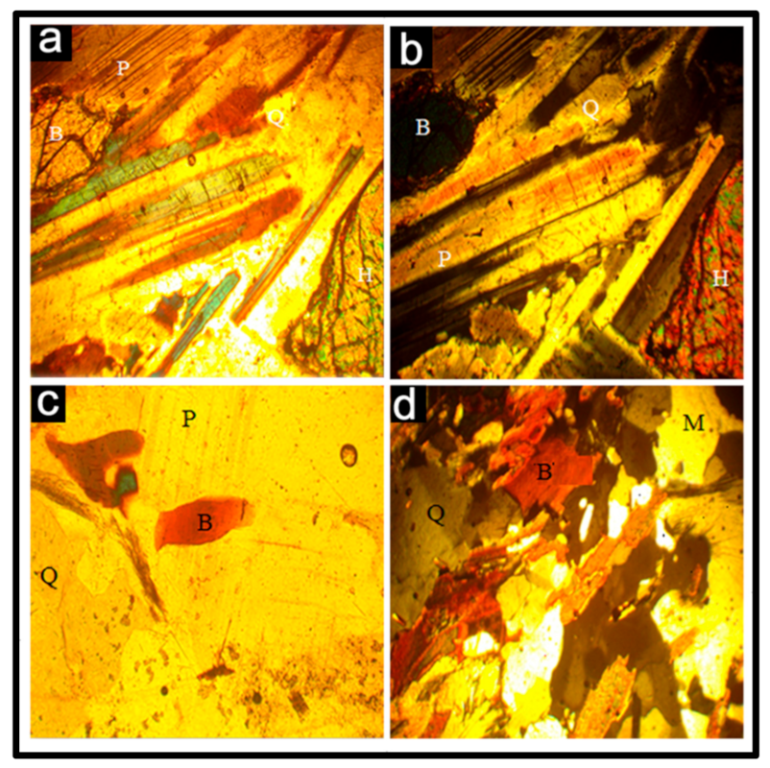
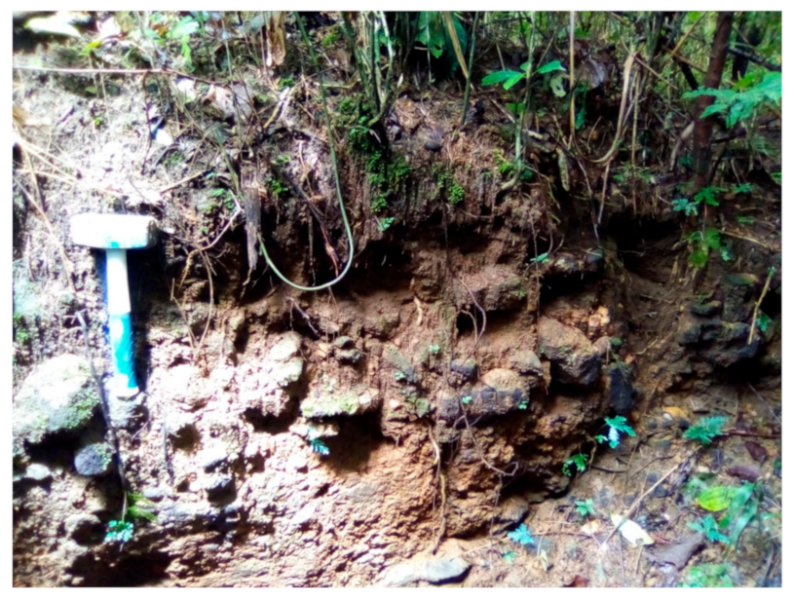
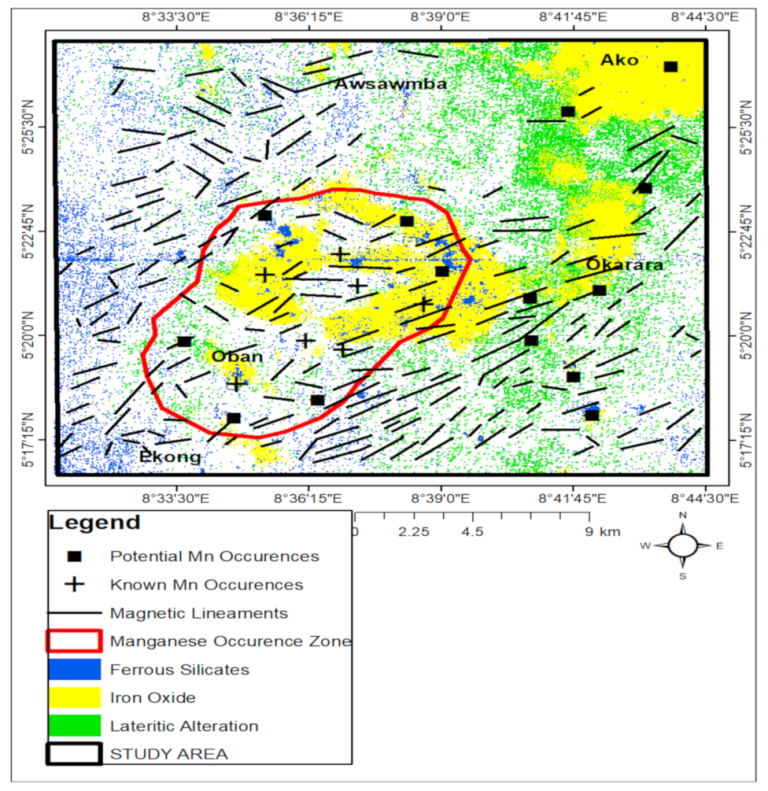
4.1. Field Geological Mapping

Field investigation revealed the presence of hornblende granite gneiss and migmatitic (banded) gneiss, which were observed to dominate the area with amphibolite and a few quartzite ridges scattered across the map area (Figure 5a–e). The rock exposures are predominantly low-lying and highly weathered, with evidence of mineral banding (lit-par-lit mineral segregation) and fracture patterns with orientation in the N-S, ENE, and NW-SE trends (Figure 5d and Figure 6). Rosette (Figure 7a) was prepared using the joint data collected in the field during the field mapping exercise, especially within the rocks that host the mineralization; these rocks predominantly have E-W fracture patterns. Notably, most quartz veins near manganese mineralization attain a black coloration and have iron stains. The mineralization follows the ENE like many observed healed joints in the field, especially towards the eastern half of the map area. Notably, large mountain ranges occur within the north-western part of the map.
Deep weathering and overburden thickness concealed most of the mineralized veins in the area except for the large resistant boulders of iron–manganese–quartz association (Figure 7b). Field observation indicated intense weathering in areas where the Mn-rich boulders were sampled. This made indications of mineral alterations difficult to document; however, the observed brecciated stained-quartz, chlorite, and clays in the area were almost overtaken by the incomplete lateritization process. This alteration is marked by linear zones almost parallel to the E-W fracture patterns in the area. Additionally, along stream channels, the rocks were exposed for critical study, and visual analysis of stream sediment samples revealed the presence of transported fragments of Manganese grains within the stream sediment load. A petrographic study of the hornblende granite gneiss revealed the presence of the two most common minerals, quartz, and feldspar. In contrast, biotite and hornblende formed a lesser portion of the rock (Figure 8; Table 1). The minerals show preferred alignment indicating the influence of metamorphism. The distribution of the rocks, their lineament features, and their inferred lithological boundaries are presented in Figure 9.

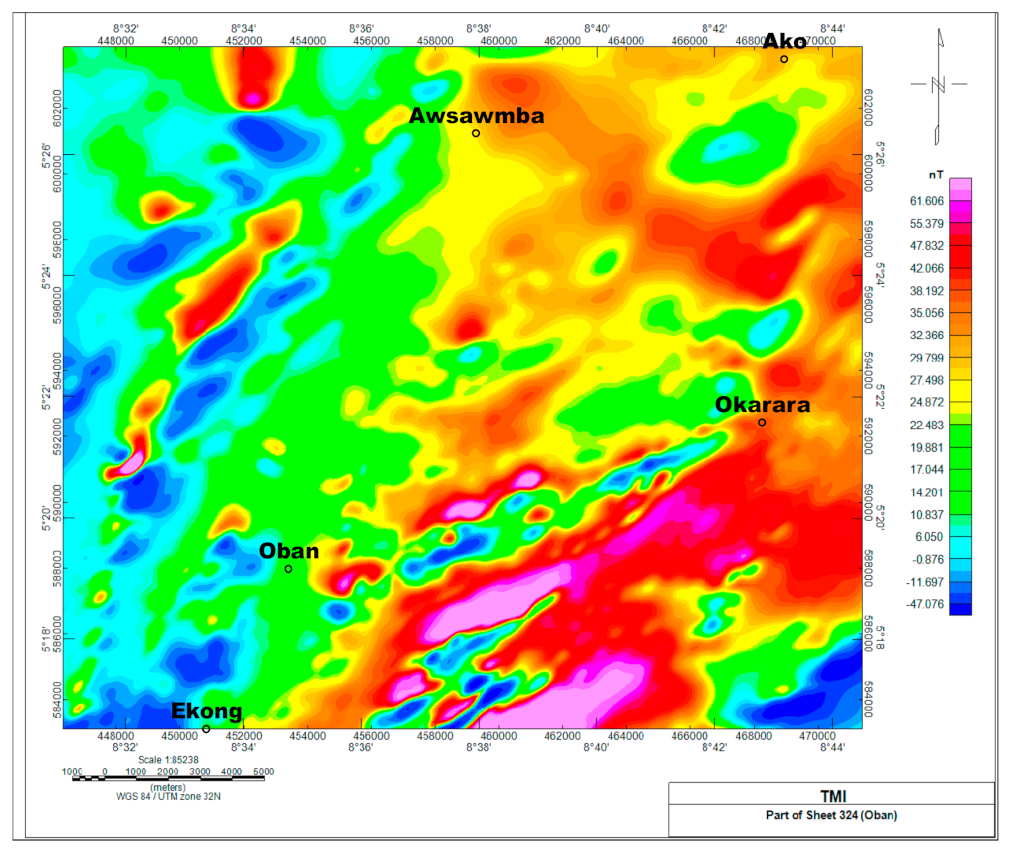
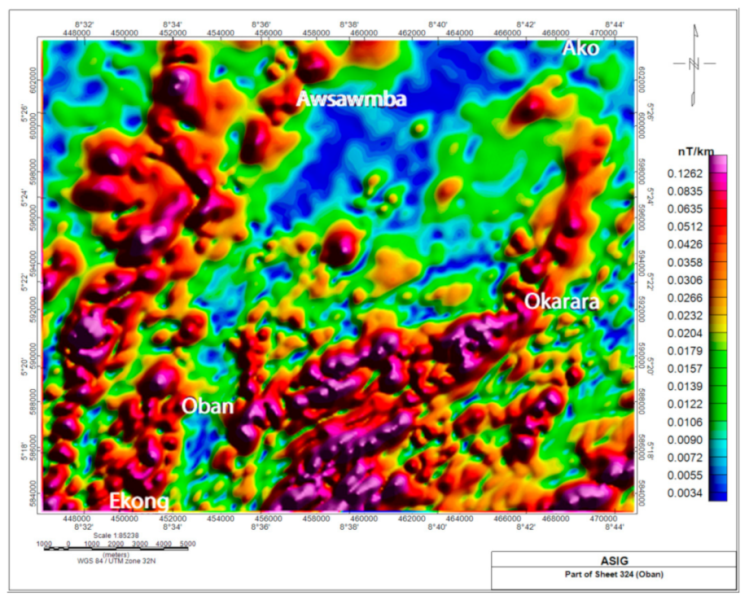
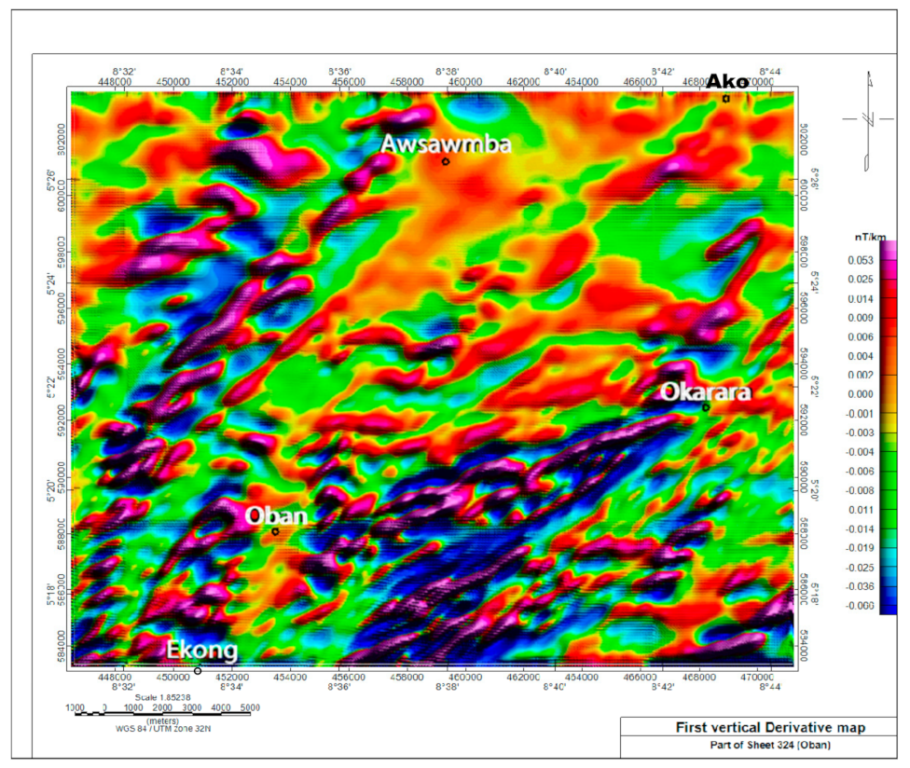
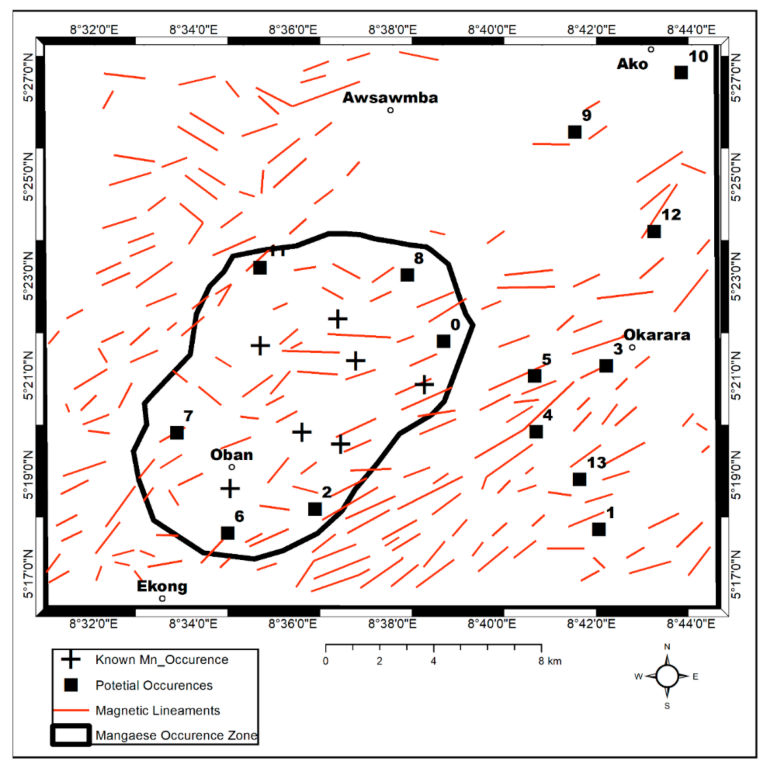
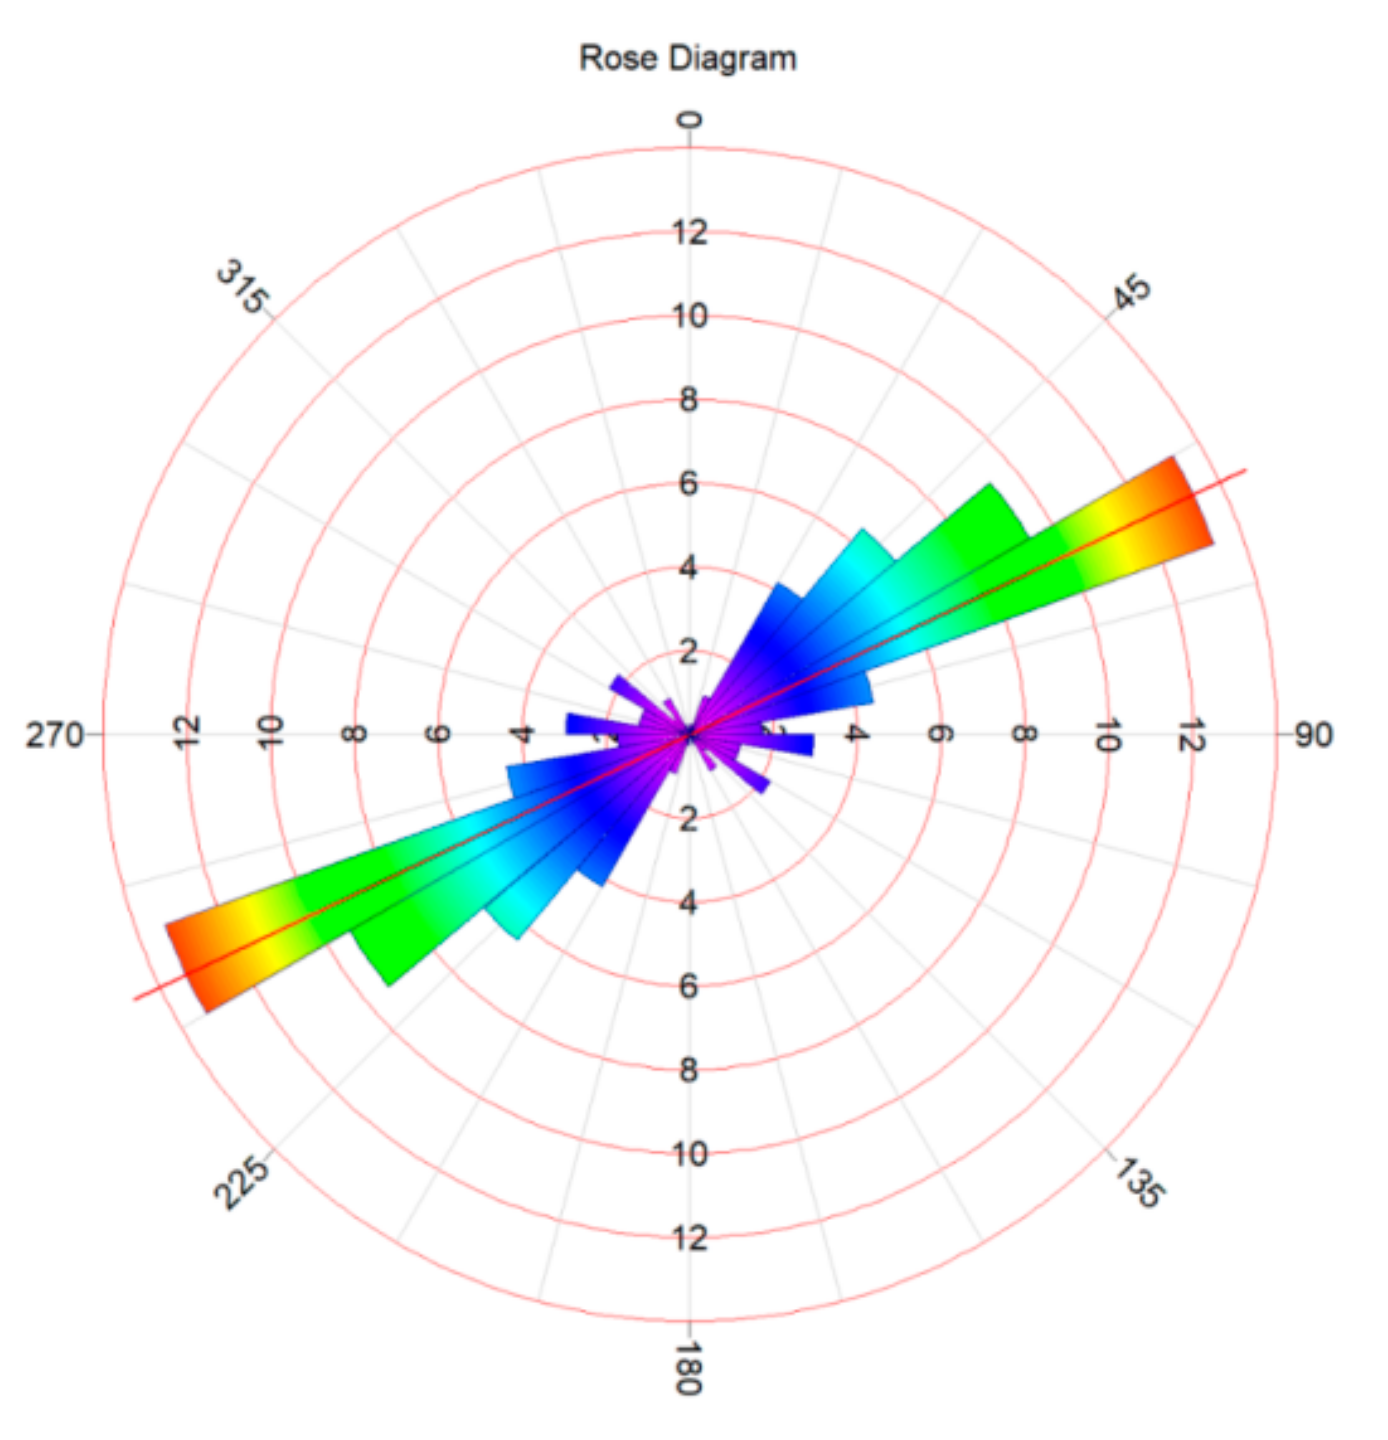
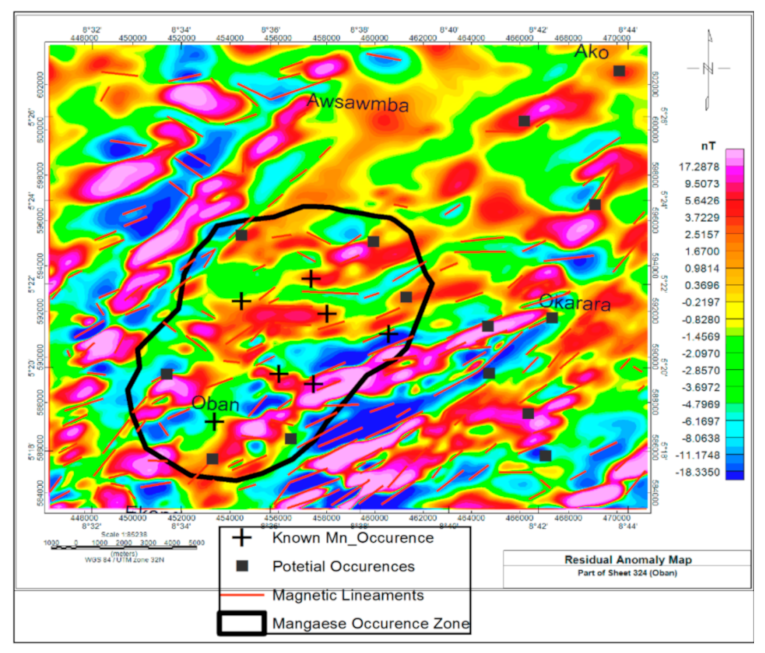
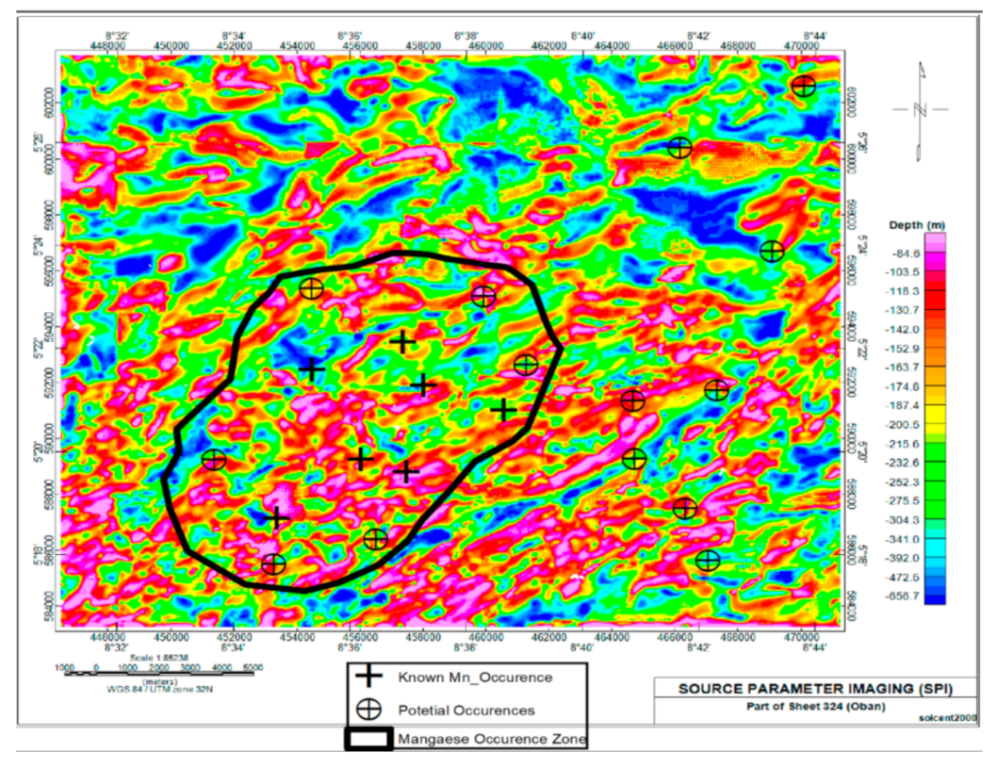
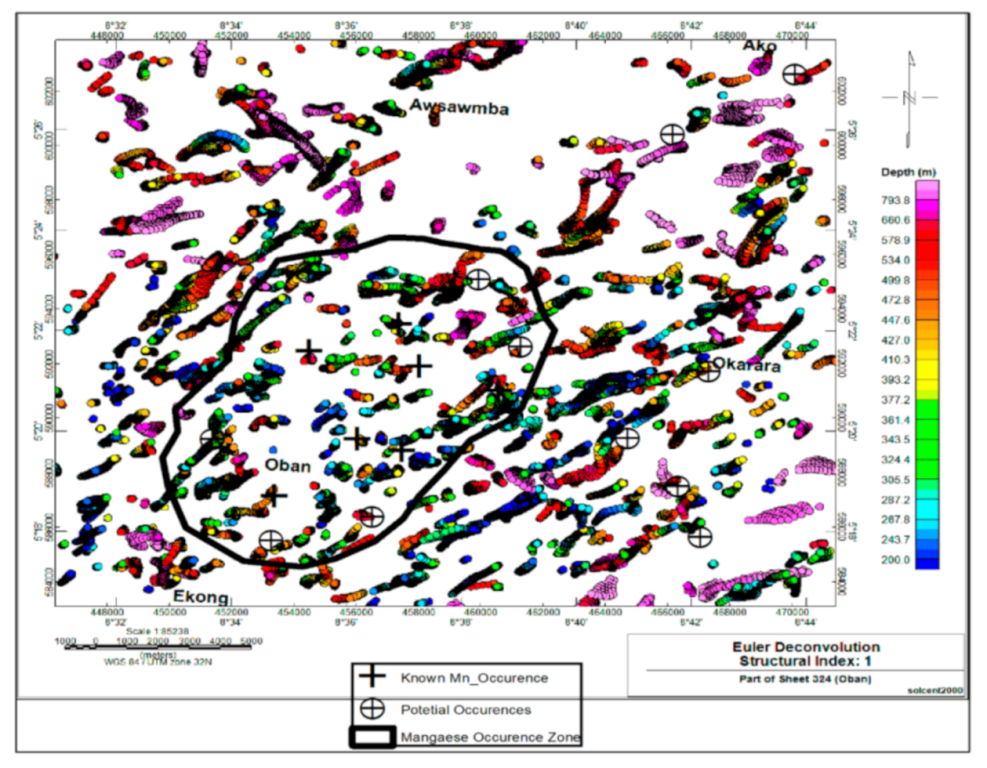
4.2. Geophysical Exploration

The analytical signal map of the TMI (Figure 4) was analyzed. The analytical signal map reveals the sources of the magnetic anomalies in the study area (Figure 10). The analytical map showed magnetic intensity ranging from 0.0034 nT/km to 0.1262 nT/km (Figure 10). The sources of the high magnetic anomalies in the study area are the Chanockites, Dolerites, Hornblende granite gneiss, Amphibolites, Quartzite veins, and Migmatitic rocks. In contrast, the weathered basements rocks constitute the overburden in the study area with low magnetic anomalies. The first vertical derivative grid enabled the identification of magnetic susceptibility anomalies reinforcing the interpreted geological structures from the TMI. The first vertical derivative map presented the magnetic intensity value range from −0.066 nT/km to 0.053 nT/km (Figure 11). The derivative image was upward continued by 100 m to reduce the effect of man-made features (artifacts) that might affect the accuracy of the results. The first vertical derivative map enhances the structural components such as lineament (fractures) with a general orientation in the NE-SW directions for this study (Figure 12 and Figure 13). The general lineament orientations agree with the regional geology of the study area. The signatures of known locations of the manganese in the study area were used to predict other occurrences of the manganese minerals in the area leading to the delineation of thirteen new locations in the study area (Figure 12 and Figure 13; Table 2).
The residual magnetic intensity (RMI) map reveals the spatial distribution of magnetic intensity anomaly within the study area (Figure 14). It was produced after removing the regional magnetic effects from the TMI data. The magnetic intensity values within the study area range between −18.3350 nT for magnetic low and 17.2878 nT for magnetic high. The high magnetic intensity anomalies represent the occurrence of basic igneous and metamorphic rocks such as Dolerites, Chanockites, Hornblende granite gneiss, Amphibolites, and Migmatitic gneiss within the study area.
However, the low magnetic intensity anomalies in the area represent the weathered basement rocks, including eluvium deposits and alluvium surrounding large stream channels. Juxtaposing the geology of the area with the interpreted aeromagnetic signatures (derived analytical signal, first vertical derivative, magnetic lineament, and residual magnetic anomaly), it became clear that the manganese mineralization zones in the area are structurally controlled. They are associated with fractures and fault structures within hornblende granite gneiss, amphibolites, migmatitic gneisses, and quartzite veins.
The source parameters imaging (SPI) and Euler decomposition techniques are data enhancement processes for evaluating the depth and location of magnetic bodies [47]. They are suitable for delineating the geometries of the magnetic sources and their susceptibility variations [48,49]. The color ranges (pink-blue) depicting various depths and locations of different magnetic sources within the subsurface in the study area are presented by the SPI (Figure 15) and Euler decomposition gridded maps (Figure 16).
The negative signs on the color legend bar of the SPI map indicate the depth measurement from the earth’s surface downward into the subsurface (Figure 15). SPI presented the shallow depths (red-pink), intermediate depths (yellow-red), and deep depths (lemon green-blue) with ranges of 84–142 m, 152–200 m, and 215–656 m, respectively. However, the Euler decomposition (Figure 16) shows the depth of shallow (from 200 to 377 m), intermediate (from 393 to 472 m), and deep (from 499 to 793 m) magnetic sources characterized by blue-lemon green, yellow-red, and red-pink colors, respectively. These results show that most of the manganese occurrences are localized within the shallow to the intermediate depths of the study area.

5. Discussion

Deep weathering and overburden thickness concealed most of the mineralized veins in the area except for the resistant large boulders of iron–manganese–quartz association. Field observation indicated intense weathering in areas where the Mn-rich boulders were sampled. The boulders observed were resistant bodies within the weathering profile of the area where the mineral samples were collected. For example, the host rock in the area is migmatitic-gneiss, and it most probably was intruded by a high-medium temperature late phase hydrothermal fluid that was rich in manganiferous materials to the degree that most of the quartz veins observed in the area attain a black coloration due to the presence (trace concentration) of manganese. A shallow Mn-pit dug parallel to this ENE fracture direction revealed some of these manganese boulders within the weathering profile in the area (Figure 17). The boulders were observed to be uneven and angular and range in sizes from 8–37 cm in diameter, having Mn–Fe–Qtz association and being siliceous in places. This made indications of mineral alteration difficult to document; however, brecciated stained-quartz, chlorite, and clays we observed in the area were almost overtaken by the incomplete lateritization process. Although at this stage of the investigation, geochemical analyses were not carried out, the alteration marked by linear zones almost parallel to the E-W fracture patterns in the area provided some indications of hydrothermal emplacement. It is hypothesized that the variation in nascent temperature of the mineralizing fluid affected the integrity of the host rock and allowed it to weather easily, leaving the more resistant Mn–Fe–Qtz minerals to remain as boulders. This, however, does not preclude supergene enrichment of Manganese within the weathering profile in the area. Field observation near Neghe village (due east of Ekong town) showed manganese occurrence approximating the preferred orientation of ENE direction as observed from fracture patterns in the area. This association and mode of occurrence suit the humid (tropical) hypergenic deposit of manganese origin mostly observed in weathered crusts [50]. The extent to which this suits the gondite model is worth investigating. It has been suggested that the Manganese of weathering crusts are commonly the richest and most economically valuable. More often, they represent ferromanganese ores of hypergenesis (gondites, ampelites, manganous carbonates, e.tc) origin found in varying climatic zones [5,50]. However, studies have shown that the geochemical (Ba, Sr, Ti, As, and Sb) and mineralogical (barite, fluorite, and calcite association) composition are critical elements in determining the origin of the Mn deposit, whether hydrothermal or from secondary processes [50,51].
The findings of this study have revealed that the geophysical technique using the aeromagnetic method could complement geological mapping to enhance the structural interpretation for mineral exploration. The most dominant structural alignment of lineaments hosting Mn occurrence was observed within the ENE-WSW structures, consistent with the Mn mineralization in the area from the geological mapping results. With more accuracy, the aeromagnetic data enabled the identification of structural features such as faults and fractures associated with mineral emplacement. However, the depth interpretations of these structural features reveal that they are concealed by overburdened sediment thickness. However, the detailed interpretation of the aeromagnetic data revealed the area of interest (AOI) for manganese exploration. The overall distribution of the economic minerals based on the mineral resources map of Nigeria [52] with structural lineaments mapping within the study area is presented in Figure 18. This further suggests that the manganese minerals within the study area occur as structurally controlled emplacements within the iron oxides and areas with intense lateritic alterations [53]. The map (Figure 17) corroborates the reports of [2,11,53,54,55] on the occurrence of manganese, iron ores, and silicate minerals within the Akampa local government area of Cross-River state, Nigeria.

6. Conclusions

The need for mineral resources for economic development is the key in any developing country. This study was channeled towards assessing the manganese mineralization potential in part of eastern Oban, southeastern Nigeria. Geological field observations and aeromagnetic data interpretation were used to identify mineral-bearing zones that show high prospects of manganese deposits within the study area. The orientation of the mineral banding of the exposed rocks and fracture patterns are N-S, ENE, and NW-SE trends. The rose diagram for the subsurface lineaments revealed that they are aligned in the NE-SW directions. Field observations have revealed the occurrence of an epithermal Mn+Fe+Qtz vein type mineralization with orientation coinciding with dominant structural orientation from aeromagnetic data in the study area. The ENE was the most important one that coincided with Manganese occurrences along regional structural indications and was considered the preferred orientation of ore deposits.
The spatial distribution and depths of occurrence of the manganese minerals were mapped using source parameter imaging (SPI) and Euler decomposition algorithms. The manganese minerals occur within the shallow to intermediate depths of 84–142 m and 152–200 m by the SPI algorithm, and 200–377 m, from 393 to 472 m by the Euler decomposition algorithm. New spatial locations of Mn mineralization were identified in the study area and were suggested to be favorable locations for mineralization emplacement. The magnetic data show near-surface and deep-seated structural features (faults and lineaments) related to mineralization in the area. This buttressed the fact that the manganese mineralization is structurally controlled. The research provides a baseline for mineral resource development, exploration, and management in the study area. It is recommended that a detailed ore reserve estimation of the manganese deposits in the area should be conducted. Furthermore, a comprehensive ore characteristic and ore grade analysis should be carried out on the manganese mineral deposits.

Author Contributions

Conceptualization, E.E.O., E.A.K., K.D.O., B.O.O. and M.M.; methodology, E.A.K., K.D.O. and M.M.; software, K.D.O., O.O. and M.M.; validation, B.O.O., K.D.O., E.E.O. and M.M; formal analysis, E.A.K.; field investigation, E.E.O., E.A.K. and B.O.O.; resources, O.O. and M.M.; data curation, K.D.O. and E.A.K.; writing—original draft preparation, K.D.O. and E.E.O.; writing—review and editing, K.D.O. and M.M.; supervision, B.O.O. and M.M.; project administration, E.A.K. and K.D.O.; funding acquisition, M.M. All authors have read and agreed to the published version of the manuscript.

Funding

This work was funded by the Research Supporting Project number (RSP-2021/89), King Saud University, Riyadh, Saudi Arabia.

Data Availability Statement

Not applicable.

Acknowledgments

The authors wish to thank the Nigerian Geological Survey Agency (NGSA) for providing the aeromagnetic data for this research. The authors would like to thank the Research Supporting Project number (RSP) (RSP-2021/89), King Saud University, Riyadh, Saudi Arabia for funding this work.

Conflicts of Interest

The authors declare no conflict of interest. The aeromagnetic data were provided by Nigerian Geological Survey Agency (NGSA) for research purposes.

References

  1. Eckels, M. Role of Geoscientists in the Energy Transition. AAPG Explorer. 2021. Available online: https://explorer.aapg.org/story/articleid/61004/geoscientists-will-be-the-backbone-of-the-energy-transition (accessed on 10 February 2022).
  2. Omang, B.; Okon, E.; Kudamnya, E. Geological interpretation of aeromagnetic data and its significance for manganese mineralization in the Oban-Massif, SE Nigeria. In Proceedings of the 3rd Conference of the Arabian Journal of Geosciences (CAJG), Sousse, Tunisia, 2–5 November 2020; pp. 1–5. [Google Scholar]
  3. Cannon, W.F. What Is Manganese? How Is It Used? United States Geological Survey (USGS) Fact Sheet: Reston, FL, USA, 2014; pp. 2014–3087. [Google Scholar]
  4. Post, J.E. Manganese oxide minerals: Crytal structures and economic and environmental significance. Proc. Natl. Acad. Sci. USA 1999, 96, 3447–3454. [Google Scholar] [CrossRef] [PubMed]
  5. Woakes, M.; Rahaman, M.A.; Ajibade, A.C. Some metallogenetic features of the Nigerian basement. J. Afr. Earth Sci. 1987, 6, 54–64. [Google Scholar] [CrossRef]
  6. Nigeria Extractive Industries Transparency Initiative (NEITI). Report on Financial Audit of Nigeria’s Solid Mineral Sector, 2007–2010; NEITI Report; NEITI: Abuja, Nigeria, 2013; p. 122.
  7. Wright, J.B.; McCurry, P. First Occurrence of Manganese Ores in Northern Nigeria. Econ. Geol. 1970, 65, 103–106. [Google Scholar] [CrossRef]
  8. Dada, O. The ‘Schist’ belt of the Nigerian Precambrian and its potentials for raw material development for steel plants in Nigeria. In Precambrian Geology of Nigeria; Oluyide, P.O., Ed.; Geological Survey of Nigeria: Kaduna, Nigeria, 1988; pp. 211–218. [Google Scholar]
  9. Okorie, B.A. The role of geoscientists and mining engineers in solid mineral development in Nigeria—A metallurgical perspective. Crust 1994, 91, 23–30. [Google Scholar]
  10. Ekwueme, B.N. Precambrian Geology and Evolution of the Southeastern Nigerian Basement Complex; University of Calabar Press: Calabar, Nigeria, 2003; 135p. [Google Scholar]
  11. Oden, M.I.; Okpamu, T.A.; Amah, E.A. Comparative analysis of fracture lineaments in Oban and Obudu Basement areas, SE Nigeria. J. Geogr. Geol. 2012, 4, 36–45. [Google Scholar]
  12. Aina, A.; Olarewaju, V.O. Geological interpretation of aeromagnetic data in some parts of north-central Nigeria. J. Afr. Earth Sci. 1992, 14, 103–109. [Google Scholar] [CrossRef]
  13. Iliya, A.G.; Bassey, N.E. A regional magnetic study of Oban and Obudu Precambrian Massifs, southeastern Nigeria. J. Min. Geol. 1993, 29, 101–110. [Google Scholar]
  14. Amigun, J.O.; Afolabi, O.; Ako, B.D. Application of airborne magnetic data to mineral exploration in the Okene Iron-ore Province of Nigeria. Int. Res. J. Geol. Min. 2012, 2, 132–140. [Google Scholar]
  15. Ekwok, S.E.; Akpan, A.E.; Kudamnya, E.A. Exploratory mapping of structures controlling mineralization in Southeast Nigeria using high resolution airborne magnetic data. J. Afr. Earth Sci. 2019, 162, 103700. [Google Scholar] [CrossRef]
  16. Ayi, N.E. Geology and Geochemistry of the Eastern Part of the Oban Massif. Master’s Thesis, University of Calabar, Calabar, Nigeria, 1987. [Google Scholar]
  17. Petters, S.W.; Adighije, C.I.; Essang, E.B.; Ekpo, I.E. A Regional Hydrogeological Study of Rural Water Supply Options for Planning and Implementation of Phase II Rural Water Programme in Cross River State, Nigeria; Report for Directorate of Rural Development; Cross River State Government: Calabar, Nigeria, 1989. [Google Scholar]
  18. Cross River Basin Development Authority (CRBDA). Hydrogeological Survey of Lower Cross River Basin: Final Report; CRBDA: Cameroon, Nigeria, 2008; 158p. [Google Scholar]
  19. Caby, R. Precambrian terranes of Benin-Nigeria and northeast Brazil the Late Proterozoic South Atlantic fit. Geol. Soc. Am. Spec. Pap. 1989, 230, 145–158. [Google Scholar]
  20. Jacobs, J.; Thomas, R.J. Himalayan-type indenter-escape tectonics model for the southern part of the late Neoprotorozoic-early Paleozoic EastAfrican-Antarctic orogeny. Geology 2004, 32, 721–724. [Google Scholar] [CrossRef]
  21. De-Wit, M.J.; Stankiewicz, J.; Reeves, C. Restoring Pan-African-Brasiliano connections: More Gondwana control, less trans-Atlantic corruption. In Pre-Cenozoic Correlations across the South Atlantic Region; Pankhurst, R.J., Trouw, R.A.J., Brito Neves, B.B., Dee-Wit, M.J., Eds.; The Geological Society of London Special Publication: London, UK, 2008; pp. 399–412. [Google Scholar]
  22. Oyawoye, M.O. The Basement Complex of Nigeria. In African Geology; Dessauvagie, T.F.J., Whiteman, A.J., Eds.; Ibadan University Press: Ibadan, Nigeria, 1972; pp. 67–99. [Google Scholar]
  23. Rahman, A.A.M.S.; Ukpong, E.E.; Azmatullah, M. Geology of parts of the Oban Massif, Southeastern Nigeria. J. Min. Geol. 1981, 18, 60–65. [Google Scholar]
  24. Grant, N.K. Geochronology of Precambrian basement rocks from Ibadan, south-western Nigeria. Earth Planet. Sci. Lett. 1970, 10, 29–38. [Google Scholar] [CrossRef]
  25. Ekwueme, B.N. Rb/Sr ages and petrologic features of Precambrian Rocks from the Oban Massif, SE Nigeria. Precambrian Res. 1990, 47, 271–286. [Google Scholar] [CrossRef]
  26. Dada, S.S.; Tubosun, I.A.; Lancelot, J.R.; Lar, A.U. Late Archaean U-Pb age for the reactivated basement of Northeastern Nigeria. J. Afr. Earth Sci. 1993, 16, 405–412. [Google Scholar] [CrossRef]
  27. Dada, S.S. Crust-forming ages and Proterozoic crustal evolution in Nigeria: A reappraisal of current interpretations. Precambrian Res. 1998, 87, 65–74. [Google Scholar] [CrossRef]
  28. Goodenough, K.M.; Lusty, P.A.J.; Roberts, N.M.W.; Key, R.M.; Garba, A. Post-collisional Pan-African granitoids and rare metals pegmatites in western Nigeria: Age, petrogenesis and the pegmatite conundrum. Lithos 2014, 200–201, 22–34. [Google Scholar] [CrossRef]
  29. Dada, S.S. Proterozoic evolution of the Nigeria–Boborema province. In West Gondwana: Pre-Cenozoic Correlations Across the South Atlantic Region; Pankhurst, R.J., Trouw, R.A.J., Brito Neves, B.B., De Wit, M.J., Eds.; Geological Society of London, Special Publications: London, UK, 2008; Volume 294, pp. 121–136. [Google Scholar] [CrossRef]
  30. Ananaba, S.E.; Ajakaiye, D.E. Evidence of tectonic control of mineralization in Nigeria from lineament density analysis: A Landsat-study. Int. J. Remote Sens. 1989, 1, 1445–1453. [Google Scholar] [CrossRef]
  31. Ferré, E.; Déléris, J.; Bouchez, J.L.; Lar, A.U.; Peucat, J.J. The Pan-African reactivation of Eburnean and Archean provinces in Nigeria: Structural and isotopic data. J. Geol. Soc. Lond. 1996, 153, 719–728. [Google Scholar] [CrossRef]
  32. Onyeagocha, A.C.; Ekwueme, B.N. Temperature-pressure distribution pattern in metamorphosed rocks of the Nigerian Basement Complex: A preliminary analysis. J. Afr. Earth Sci. 1990, 11, 83–93. [Google Scholar] [CrossRef]
  33. Wright, J.B. Controls of mineralization in the older and younger tin fields of Nigeria. Econ. Geol. 1970, 65, 945–951. [Google Scholar] [CrossRef]
  34. Olade, M.A. Precambrian metallogeny in West Africa. Geol. Rundsch. 1980, 69, 411–429. [Google Scholar] [CrossRef]
  35. Oha, I.A.; Onuoha, K.M.; Nwegbu, A.N.; Abba, A.U. Interpretation of high-resolution aeromagnetic data over southern Benue Trough, southeastern Nigeria. J. Earth Sys. Sci. 2016, 125, 369–385. [Google Scholar] [CrossRef]
  36. Osumeje, J.O.; Oniku, A.S.; Meludu, O.C.; Ogwuche, M.M.; Usman, A. Interpretation of Aeromagnetic and Satellite Data over Part of Maru Schist Belt, Northwestern Nigeria. J. Geol. Geophys. 2019, 8, 457. [Google Scholar] [CrossRef]
  37. Olasunkanmi, N.; Bamigboye, O.; Saminu, O.; Salawu, N.; Bamidele, T. Interpretation of high-resolution aeromagnetic data of Kaoje and its environs, western part of the Zuru Schist belt, Nigeria: Implication for Fe–Mn occurrence. Heliyon 2020, 6, e03320. [Google Scholar] [CrossRef] [PubMed] [Green Version]
  38. Li, Y.; Oldenburg, D.W. 3-D inversion of Gravity Data. Geophysics 1998, 63, 109–119. [Google Scholar] [CrossRef]
  39. Magaia, L.A. Processing Techniques of Aeromagnetic Data. Case Studies from the Precambrian of Mozambique; Uppsala University Publications: Uppsala, Sweden, 2009. [Google Scholar]
  40. Allen, R.L.; Mills, D.W. Signal Analysis, Time, Frequency, Scale, and Structure; John Wiley & Sons: Hoboken, NJ, USA, 2004. [Google Scholar]
  41. Jayeoba, A.; Odumade, D. Geological and structurally interpretation of Ado-Ekiti southwest and its adjoining areas using aeromagneic data. In Proceedings of the Pacific Section AAPG, SEG and SEPM Joint Technical Conference, Oxnard, CA, USA, 3–5 May 2015. [Google Scholar]
  42. Foss, C. Magnetic data enhancement and depth estimation. In Encyclopedia of Solid Earth Geophysics; Gupta, H.K., Ed.; Springer: Cham, Switzerland, 2011. [Google Scholar]
  43. Thompson, D.T. A New Technique for making computer-assisted depth estimates from magnetic data. Geophysics 1982, 47, 31–37. [Google Scholar] [CrossRef]
  44. Kayode, J.S.; Nawami, M.N.M.; Abdullah, K.B.; Khalil, A.E. Integrating aeromagnetic and LandsatTM 8 data into subsurface structural mapping of Precambrian basement complex. J. Afr. Earth Sci. 2017, 125, 202–213. [Google Scholar] [CrossRef]
  45. Mehanee, S.; Essa, K.S.; Diab, Z.E. Magnetic data interpretation using a new R-parameter Imaging method with application to mineral exploration. Nat. Resour. Res. 2021, 30, 77–95. [Google Scholar] [CrossRef]
  46. Ekwueme, B.N.; Ekwere, S.J. The geology of the eastern section of the Oban Massif, southeastern Nigeria. J. Min. Geol. 1989, 25, 317–329. [Google Scholar]
  47. Elkhateeb, S.O.; Eldosouky, A.M. Detection of porphyry intrusions using analytic signal (AS), Euler deconvolution, and centre for exploration targeting (CET) technique porphyry analysis at Wadi Allaqi Area, south eastern desert, Egypt. Int. J. Sci. Eng. Res. 2016, 7, 471–477. [Google Scholar]
  48. Eldosouky, A.M.; Abdelkareem, M.; Elkhateeb, S.O. Integration of remote sensing and aeromagnetic data for mapping structural features and hydrothermal alteration zones in Wadi Allaqi Area, southeastern desert of Egypt. J. Afr. Earth Sci. 2017, 130, 28–37. [Google Scholar] [CrossRef]
  49. Eldosouky, A.M.; Elkhateeb, S.O. Texture analysis of aeromagnetic data for enhancing geologic features using co-occurrence matrices in Elallaqi Area, southeastern desert of Egypt. NRIAG J. Astron. Geophys. 2018, 7, 155–161. [Google Scholar] [CrossRef]
  50. Varentsov, I.M. Manganese Ores of Supergene Zone: Geochemistry of Formation; Kluwer Academic Publishers: Dordrecht, The Netherlands, 1996; 302p. [Google Scholar]
  51. Varentsov, I.M.; Golovin, D.I. Manganese beds of Groote Eylandt, Northern Australia: K-Ar dating of cryptomelane minerals and genetic aspects. Doklady Akademii Nauk SSSR 1987, 294, 203–207. [Google Scholar]
  52. Nigeria Geological Survey Agency (NGSA). Geological and Mineral Resources Map of Cross-River State, Nigeria; Nigeria Geological Survey Agency (NGSA): Abuja, Nigeria, 2010. [Google Scholar]
  53. Akpeke, B.G. An inventory of mineral resources in Cross-Rivers state, southeastern Nigeria. Glob. J. Geol. Sci. 2006, 4, 129–138. [Google Scholar]
  54. Obi, D.A.; Oyonga, A.O.; Morphy, M. Application of electrical resistivity and ground magnetic investigation of ironstones deposits in Abiati Akampa LGA Cross-River State, Nigeria. J. Environ. Sci. 2018, 8, 133–139. [Google Scholar]
  55. Njar, G.N. Spatial pattern in solid minerals distribution in Cross-River state, Nigeria. J. Appl. Sci. Environ. Manag. 2018, 22, 1661–1666. [Google Scholar] [CrossRef] [Green Version]
Figure 1. Simplified geological map of Nigeria showing the locations of known manganese occurrences (Source: [2]).
Minerals 12 01250 g001
Figure 2. Topographic map of the study area showing the major towns, sample locations, and Mn occurrences (Prepared by authors).
Minerals 12 01250 g002
Figure 3. Pre-drift Paleo-proterozoic belts between Africa and NE South America (Modified after [29]). AYD, Adamawa-Yade domain; MK, Mayo Kebi terrain; OU, Oubanguide fold belt; YD, Yaounde domain.
Minerals 12 01250 g003
Figure 4. Total magnetic intensity map of the area under investigation.
Minerals 12 01250 g004
Figure 5. Rock exposures in the study area (Oban Massif): (a) Migmatitic gneiss at Oban town, (b) Homogeneous amphibolite exposed at the bank of River Ajin, (c) a broken fragment exposing the fresh surface of amphibolite, (d) low-lying banded gneiss exposed in Okarara showing disproportionate mineral segregation of light and dark bands (ball pen in the direction of North), and (e) large boulder of granitic rock exposed near Okarara.
Minerals 12 01250 g005
Figure 6. Some rock exposures in the study area (Oban Massif): (a) Migmatitic gneiss at Oban town displaying district foliation planes, (b) rock displaying various fracture patterns SW of Okitak farm, (c) rock displaying irregular-shaped pegmatite intrusions south of Okarara, not mappable to the scale of the map, and (d) banded gneiss mapped around Okarara area.
Minerals 12 01250 g006
Figure 7. (a) The rosette of fracture directions in the study area from geological mapping. (b) A section of an abandoned mining pit dug to excavate Mn deposit in Oban area (NB. Mn boulder is enlarged for clarity).
Minerals 12 01250 g007
Figure 8. Photomicrographs of some of the rock samples collected during field investigation: (a) and (b) hornblende granite gneiss showing feldspars and micas (biotite) indicate some preferred orientations, under parallel and cross nicols, (c) section of granitic pegmatite showing large crystals under parallel nicols, and (d) section of a migmatite under cross nicols showing the distribution of biotite, quartz, etc.
Minerals 12 01250 g008
Figure 9. Geological map of the study area showing the rock distribution (modified from [46].
Minerals 12 01250 g009
Figure 10. Analytical signal magnitude map.
Minerals 12 01250 g010
Figure 11. First vertical derivative map.
Minerals 12 01250 g011
Figure 12. Magnetic lineament map of the study area.
Minerals 12 01250 g012
Figure 13. The rosette of fracture directions in the study area.
Minerals 12 01250 g013
Figure 14. Residual magnetic anomaly map.
Minerals 12 01250 g014
Figure 15. Source parameter imaging map with known and potential occurrence zones in the study area.
Minerals 12 01250 g015
Figure 16. Standard Euler decomposition (structural index = 1.0; max. % depth tolerance = 5, window size = 10) with known and potential occurrence zones in the study area.
Minerals 12 01250 g016
Figure 17. Section of a 2-m excavation dug parallel to the E-W direction for sampling resistant boulders rich in Mn at Neghe village (Hammer used as the scale is 25 cm long).
Minerals 12 01250 g017
Figure 18. Potential minerals occurrence map with potential manganese zones in the study area (Modified from [52]).
Minerals 12 01250 g018
Table 1. Modal composition of rocks of the study area.
MineralMigmatitic
Gneiss (n = 4)
Hornblende Granite Gneiss (n = 5)Amphibolite
(n = 2)
Pegmatite
(n = 2)
Charnockite
(n = 1)
Quartz453551939
Plagioclase1816202417
K-Feldspar1113174220
Biotite19211798
Chlorite20000
Epidote11001
Muscovite16000
Garnet01320
Hornblende1733011
Accessories21453
Total100100100100100
Table 2. Predicted locations for potential occurrence of manganese minerals.
IDX LONGY LAT
08.6503922695.361502236
18.7024111245.29835895
28.6073420125.30508693
38.7048772575.353322316
48.6813873355.331182978
58.6809249985.349889541
68.5781285485.29713331
78.5610478985.330773567
88.6381830975.383744871
98.6943467655.43181191
108.729894645.45175794
118.5888989835.386156108
128.7208430535.398378085
138.6959017655.315178112
Publisher’s Note: MDPI stays neutral with regard to jurisdictional claims in published maps and institutional affiliations.

