Article

Velocity Structure and Cu-Au Mineralization of the Duobaoshan Ore District, NE China: Constrained by First-Arrival Seismic Tomography

1
Chinese Academy of Geological Sciences, Beijing 100037, China
2
College of Transportation Engineering, Nanjing Tech University, Nanjing 211800, China
3
School of Earth Sciences and Engineering, Sun Yat-Sen University, Zhuhai 510275, China
*
Author to whom correspondence should be addressed.
Minerals 2022, 12(8), 959; https://doi.org/10.3390/min12080959
Submission received: 30 May 2022 / Revised: 13 July 2022 / Accepted: 22 July 2022 / Published: 28 July 2022

Abstract

:
The genesis of deeply buried deposits in the Duobaoshan ore district, the largest porphyry-related Cu-Mo-Au ore field in northeastern China, is not well understood and their exploration is lacking because the fine velocity structure of this region is not comprehensively understood. Herein, first-arrival seismic travel times were picked along a deep seismic reflection profile and inverted using the tomographic method to obtain a detailed velocity profile of the upper 2900 m of the crust beneath this region. The profile showed that the velocity varied from 1900 to 6100 m/s and that the crust was subdivided into five parts by two low-velocity (2500–4000 m/s) blocks. Based on previous studies, the boundaries between the high-speed and low-speed bodies were interpreted as hidden fractures, and the 5000–6100 m/s parts were interpreted as concealed granite bodies in these sections. Porphyry copper deposits in the Duobaoshan ore district were related to the occulted granite bodies, and epithermal Au deposits were associated with the occulted fracture zones. Comprehensive evaluation of hydrothermal activity, regional magnetic anomalies, and deposit distribution indicated that the hidden fractures served as channels for ore-related magmas. Combining previous research on the Duobaoshan ore district with our results of the high-velocity interface, we infer that the prospecting range of the Tongshan deposit is below the depth of 1000 m.

1. Introduction

Research on the continuity of deep metallogenic bodies and exploration of deeply buried mineral resources is gaining global academic attention. Economic development has led to the depletion of shallow metal ore bodies, and deeply buried metal ores have emerged as the main targets of mining activities [1]. Currently, mining activities can only be carried out up to depths of approximately 1 km; therefore, it is necessary to study underground structures at depths of 1–3 km so as to locate and develop deeper deposits. At present, the delineation of the spatial distribution of metallogenic systems (1–3 km) is not sufficiently detailed. Porphyry copper deposits are of great economic value, supplying approximately 75%, 90%, and 20% of global copper, molybdenum, and gold, respectively [2,3,4]. The Duobaoshan ore district is one of the largest Cu-Mo-Au ore fields in northeastern (NE) China; it contains unique minerals and has developed multiple phases of copper- and gold-dominated mineralization [5,6,7,8,9]. Major magmatic phases were coeval with ore formation, including (1) Early Ordovician (485–73 Ma) porphyry-type Cu-Mo-(Au), (2) Early-Middle Triassic (246–229 Ma) porphyry-related epithermal Au-(Cu-Mo), and (3) Early Jurassic (177–173 Ma) Fe-Cu skarn mineralization [10].
The Duobaoshan ore district is large and highly complex, with magmatic mineralization spanning over 300 Ma. The oldest magmatic mineralization events occurred during the Early Ordovician, and the youngest mineralization and magmatism developed during the Early-Middle Jurassic and Late Cretaceous, respectively [11]. The mineralization is governed by the surrounding rocks and tectonics and involves the superposition and modification of multiple phases of hydrothermal activity, which is very complex in the Duobaoshan ore district. Therefore, the shallow surface structure of the area requires elucidation to provide strong constraints for the study of multi-phase magmatic mineralization. The existence of the porphyry body is the most important evidence of porphyry copper ore. Previous studies of the Tongshan deposit have not dealt with the depth of porphyry body burial, and only a few porphyry branches have been found in boreholes [6,12].
In geophysical exploration, seismology offers the advantage of high accuracy; the detailed information carried by seismic waves through Earth’s interior can be processed through mathematical and physical methods to obtain subsurface tectonic and lithological characteristics. Since the 1980s, a new field of seismology, seismic tomography, has been developed based on medical computerized tomography techniques to capture the spatial distribution of physical parameters (e.g., velocity, attenuation coefficient) within Earth’s interior. The active source method is an efficient approach to obtain the subsurface velocity structure; it employs the first-arrival wave travel time data of deep seismic reflection profiles [13,14,15,16].
The seismic data are generated from blast excitation in deep wells with small trace distances and long alignments, and therefore, inversion results based on these data are higher than those based on passive seismic data. First-arrival seismic data carry detailed tectonic information on the velocity structure and interface variations in the upper crust. The fine velocity structure can reveal the upper interface and undulatory patterns of concealed rocks as well as the distribution of fracture systems [14]. Understanding these fracture systems and occulted rock bodies is crucial to the interpretation of mineralization in ore districts. In this study, seismic tomography was used to obtain the fine shallow velocity structure based on first-arrival travel time data; the aim was to provide precise constraints for the exploration of major porphyry bodies and blind deposits in the Tongshan deposit and elucidate the shallow structure of the Duobaoshan ore district to study the mineralization.

2. Geological Setting

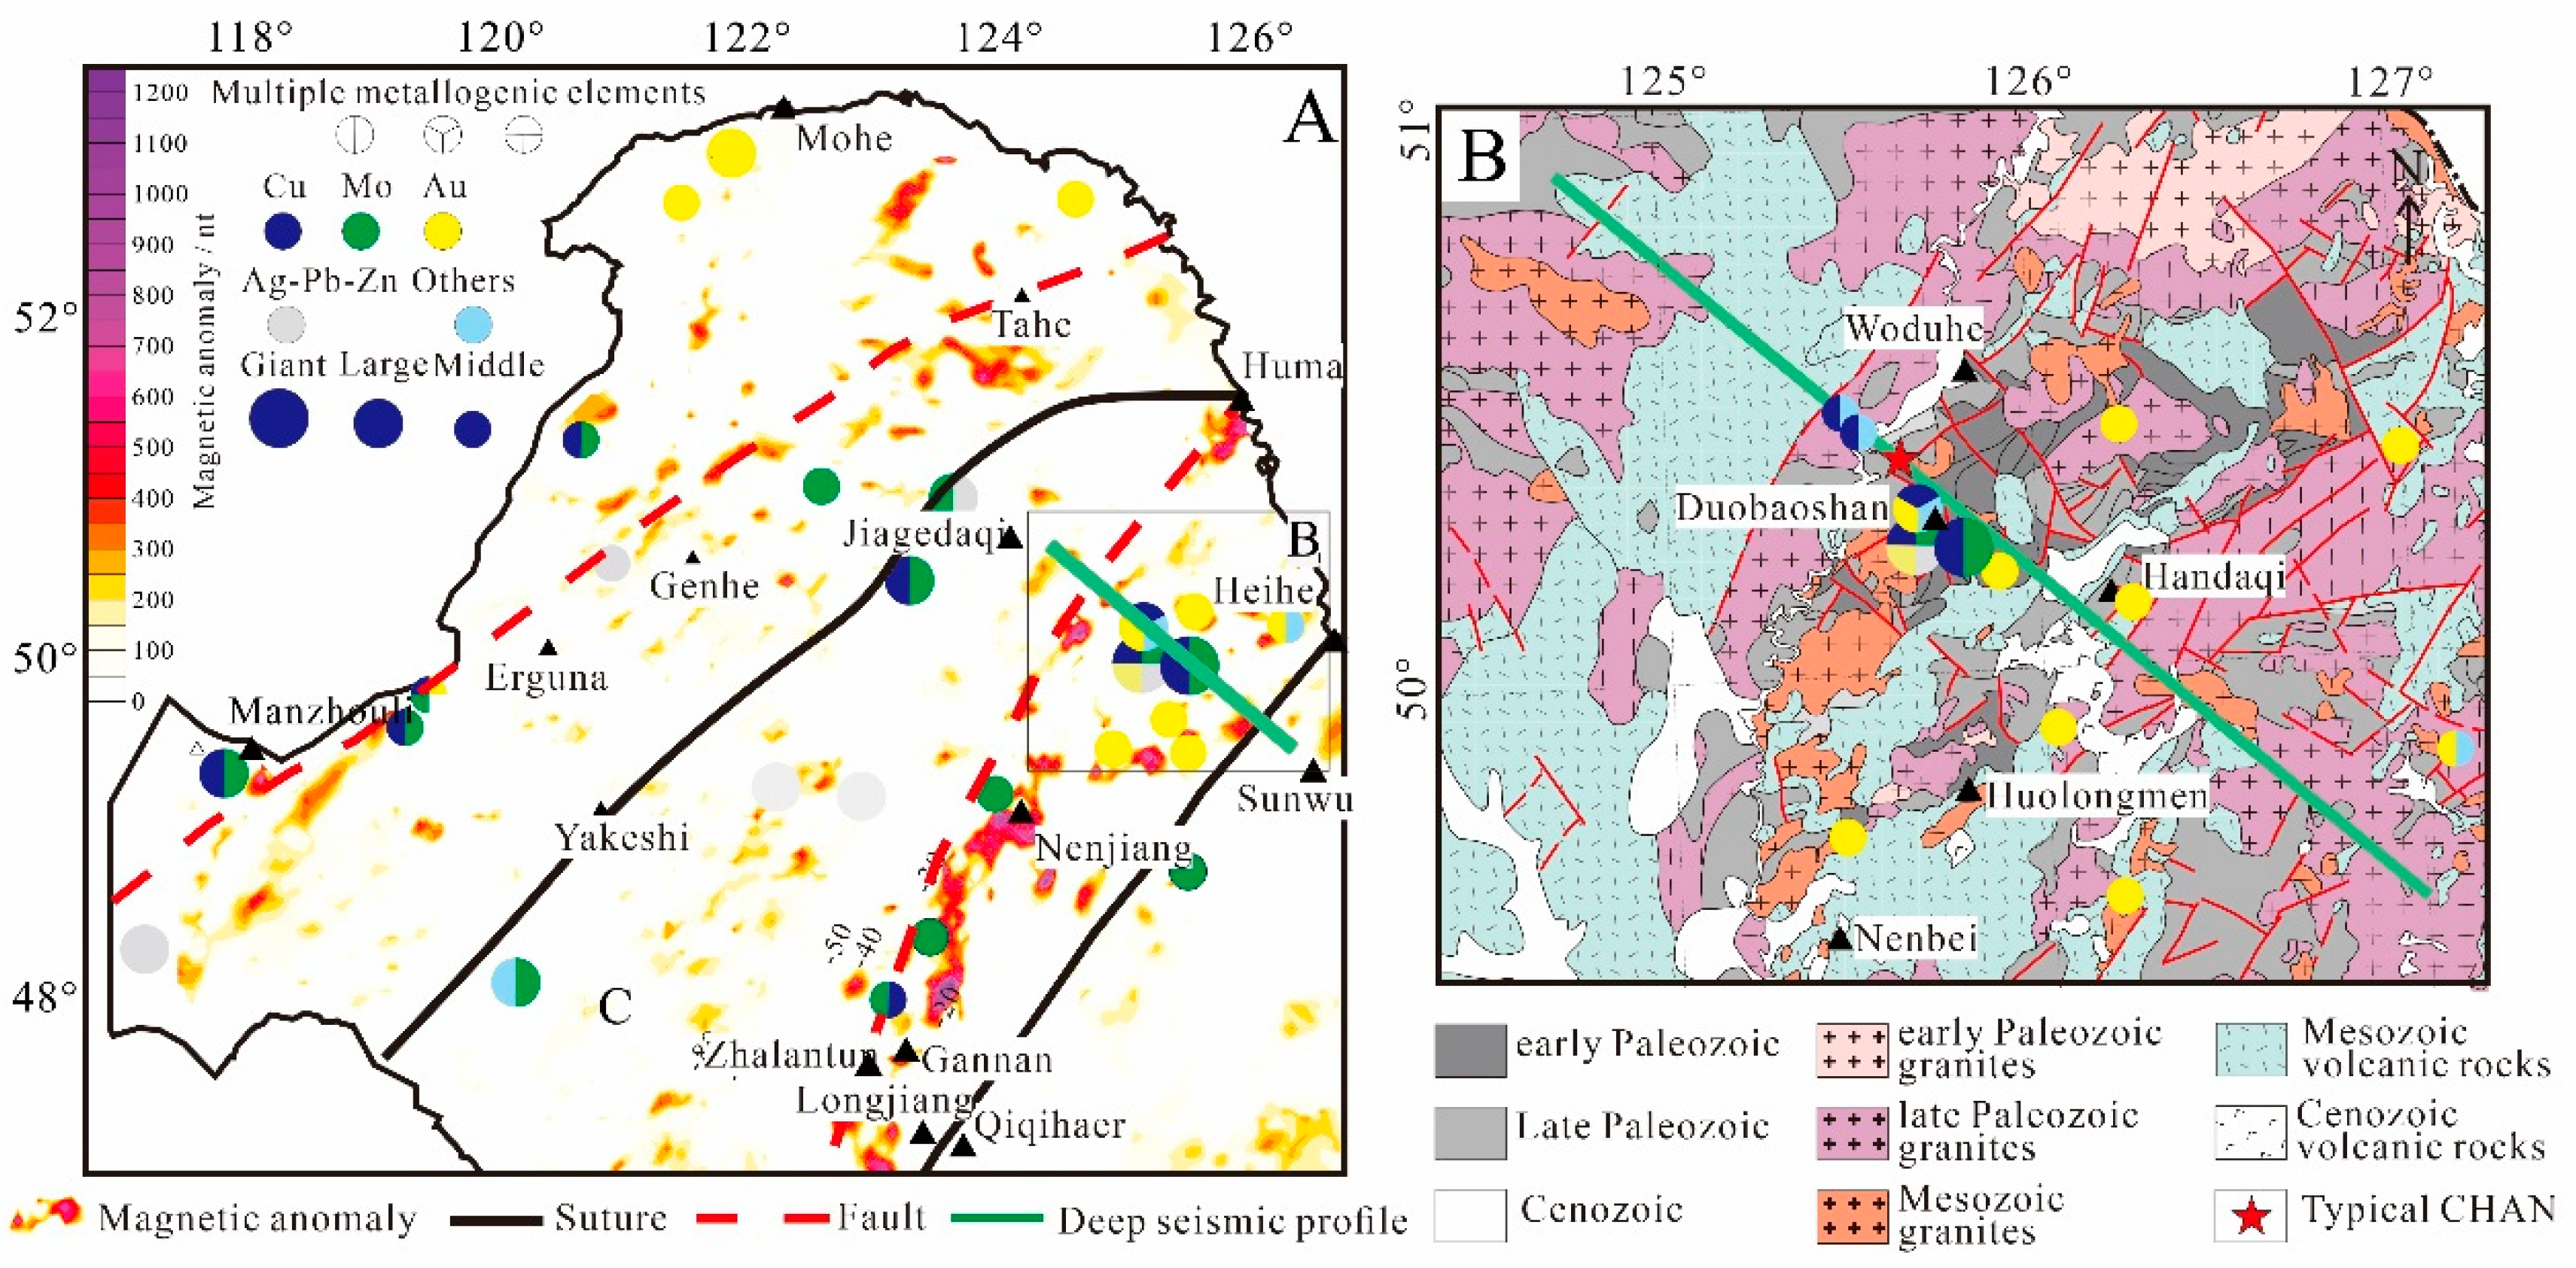
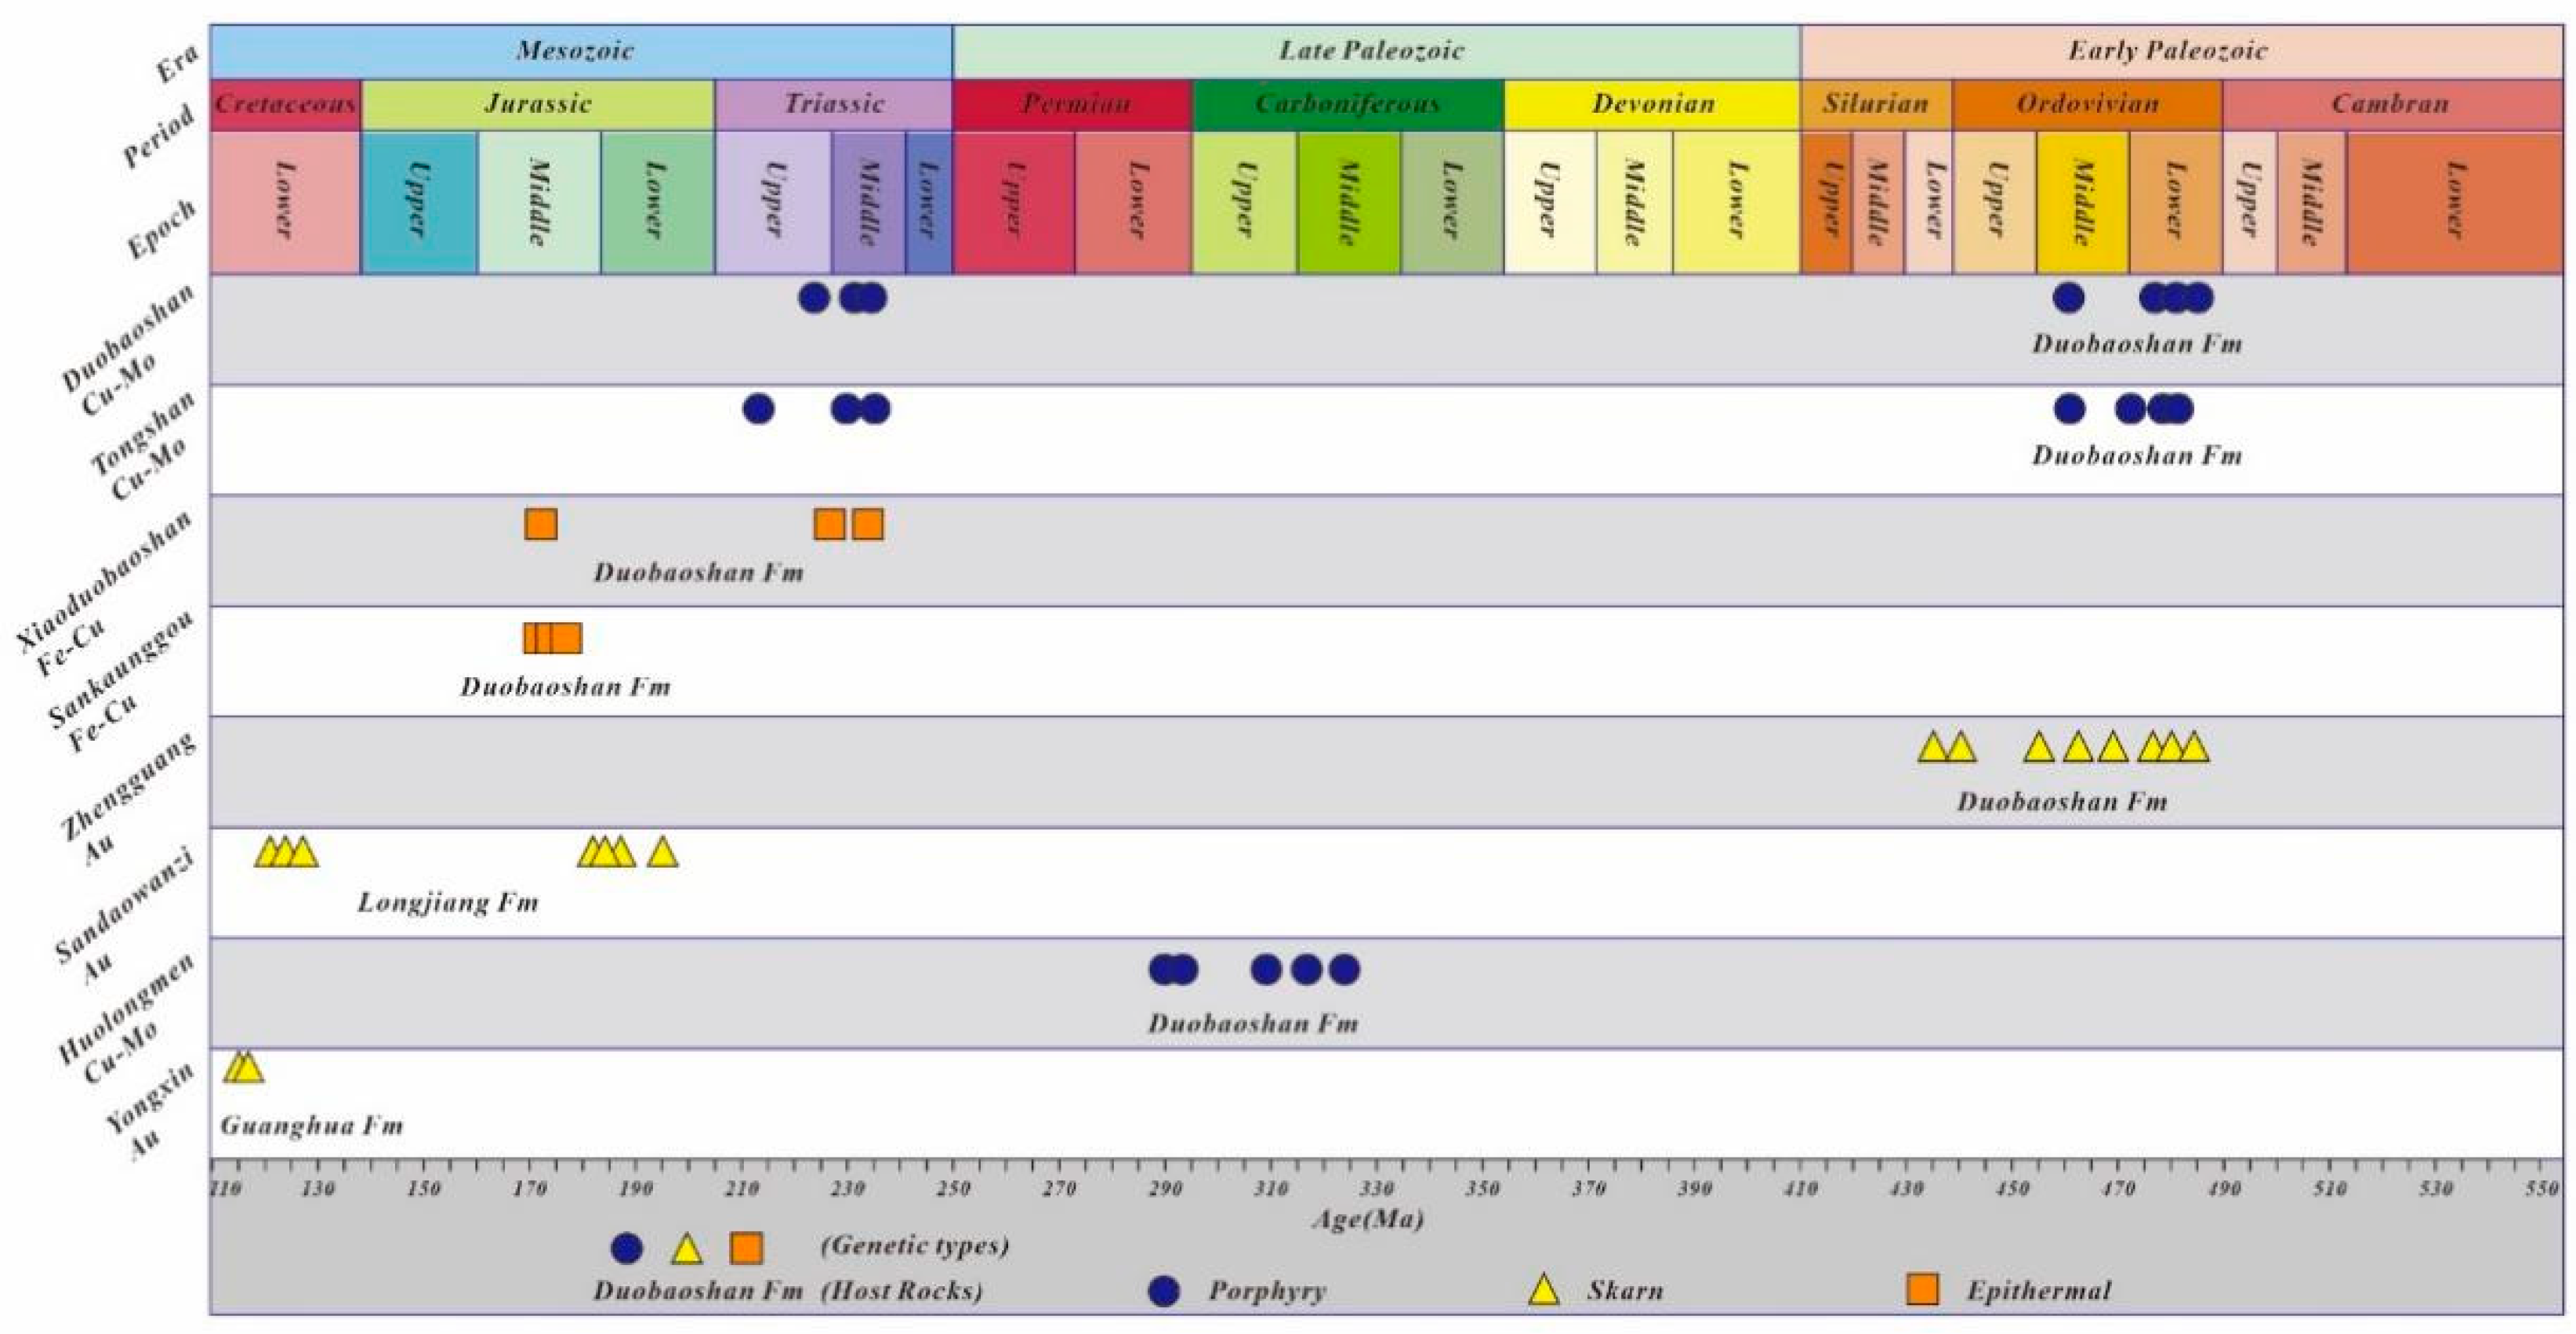
2.1. Regional Geology

The Duobaoshan ore district is located in Heilongjiang Province in NE China. It is a part of the eastern section of the Central Asian Orogenic Belt (CAOB), which is associated with the accretion of ophiolites, island arc, and microcontinental blocks [17,18,19,20,21]. NE China consists of the Erguna Block in the north, the Xing’an Block and Songneng Block in the central region, and the Jiamusi Block in the east [15,22,23,24]. NE China has experienced different stages of evolution under three tectonic regimes, namely, those of the Paleo-Asian Ocean, Mongol-Okhotsk Ocean, and Paleo-Pacific Ocean [15,18,19,25,26].
The Greater Xing’an Range, located in the eastern part of the CAOB, consists mainly of the Erguna Block, Xing’an Block, and Songneng Block. The geotectonic framework and tectonic unit layout of the Greater Xing’an Range were mainly formed during the evolution of the Paleo-Asian Ocean [19]. The Duobaoshan ore field is located in the northeastern part of NE China (Figure 1A), at the confluence of the Greater Xing’an Range and Lesser Xing’an Range. NE China recorded multiphase magmatism during the development of the Paleo-Asian Ocean, Mongol-Okhotsk Ocean, and Paleo-Pacific Ocean [5,12,22,27,28,29,30].
The Duobaoshan ore district is situated in Heihe City, Heilongjiang Province, where several magmatic-hydrothermal deposits are developed, including the Duobaoshan and Tongshan porphyry Cu-Mo-(Au) deposits (Figure 2) [22,29,31], the Xiaoduobaoshan and Sankuanggou Fe-Cu skarn deposits [27,28,32], and the Zhengguang and Sandaowanzi Zhengguang epithermal Au deposits from the late Yanshanian [33,34,35].
The Duobaoshan and Tongshan porphyry Cu-Mo-(Au) deposits are underlain by andesites of the Middle Ordovician Duobaoshan Group, and the intrusive rocks associated with the mineralization are the Caledonian granodiorite body or granodiorite porphyry complex [36]. The mineralization-hosting strata of the Sankuanggou Fe-Cu skarn deposit are mainly of the Middle Ordovician Duobaoshan Group andesite type, and the intrusive rocks associated with the mineralization are plagioclase and granodiorite from the early Yanshanian [37,38]. The late Yanshanian gold deposits in the area are mainly hosted by andesites of the Middle Ordovician Duobaoshan Formation and acidic volcanic rocks of the Lower Cretaceous Longjiang Formation. The intrusive bodies related to mineralization are small intrusive bodies and veins of ultra-shallow or subvolcanic facies.

2.2. Ore District Geology

The stratigraphy of the Duobaoshan ore district consists of Ordovician and Silurian volcanic-terrestrial clastic rocks and sandy mudstone. It includes the Paleozoic Duobaoshan Formation, Luohe Formation, Niqiuhe Formation, Yaosangnan Formation, Mesozoic volcanic rocks, and a series of granite bodies with different ages and characteristics. The granites primarily consist of granodiorite, orthoclase granite, alkali granite, and diorite [1]. The intrusive rocks in the Duobaoshan ore district can be grouped into three intervals, namely, the Early Paleozoic, Late Paleozoic, and Mesozoic. The Early Paleozoic granite is mainly composed of amphibolite and diorite, and the rocks are mainly distributed in the central part of the study area in the western part of Huolongmen village and the northeastern part of Yikete.
The granite, which exhibits a zircon SHRIMP U-Pb age of 440.6 Ma, intruded into the Duobaoshan Group andesite leading to alteration, which is visible in the form of rock strains, with weak chloritization and sericitization. The granite exposures occupy an area of approximately 23 km2. The Late Paleozoic granite is mainly composed of alkali-long-orthoclase granite, with a small amount of granite amphibolite and diorite granite. The rocks are widely distributed and exposed in the southern part of Huolongmen Town, Beigang, and the northeastern part of Yikete, mainly in the form of rock strains. The exposures occupy an area of approximately 104 km2, and exhibit zircon SHRIMP U-Pb ages of 291.5~310.7 Ma. The Mesozoic granites are mainly distributed in the eastern part of Huolongmen Town and exhibit a zircon SHRIMP U-Pb age of 175.2 Ma; they are mainly composed of granitic amphibolite [1].
The Duobaoshan or district exhibits three groups of faults (NW–SE-, E–W-, and NE–SE-trending faults), which have developed because the region has experienced three major tectonic events (Figure 1B). The NW–SE-trending faults are the main ore-controlling structures in the Duobaoshan ore district (Figure 1B) [37,39,40]. The influence of the Caledonian tectonomagmatic activity on the underlying regional tectonic pattern is mainly manifested as NW-oriented tectonics, which played an important role in the formation of porphyry-type copper deposits. The Hercynian tectonic movements, which are mainly manifested as the NEE-oriented tectonics, only rarely resulted in mineralization of economic value. The Yanshanian movement can be divided into early and late Yanshanian phases of movement. The early phase inherited the NEE-oriented tectonics of the Hercynian phase, whereas the late phase exhibited the deep and large NE-oriented left-slip tectonics. The Yanshanian movement had destructive effects on the early porphyry deposits but had obvious enriching effects on gold mineralization [36].

3. Tomographic Inversion

3.1. Fundamental Principles

First-arrival seismic tomography is based on the fluctuation equation theory, which can be regarded as an approximation of ray theory under certain conditions. It is a method used to describe the propagation path, travel time, and velocity of seismic waves in subsurface media. Huygens’, Fermat’s, and Snell’s theorems explain the propagation law of seismic waves in subsurface media. The propagation paths and travel times of seismic waves differ depending on the subsurface medium. The equation for the travel time of seismic waves can be expressed as:
T = s o u r c e r e c e i v e r 1 v d s
where T is the travel time of the seismic wave from the gunpoint to the checkpoint, v is the seismic wave velocity, and s denotes the ray path length [41]. In practice, the first-arrival time and velocity are nonlinear, and to find them, Equation (1) needs to be linearized [42], such that
v ( x ) = v ( x 0 ) + δ v ( x )
where v ( x 0 ) is the background velocity and δ v ( x ) is the value of the velocity perturbation at point x . When δ v ( x ) v ( x 0 ) , the change in initial arrival time is linearly related to the amount of velocity perturbation [43]. Let the seismic wave propagation path s = s 0 + δ s after the perturbation and the travel time T = T 0 + δ T . Then Equation (1) can be rewritten as
T = S 0 + δ S [ 1 v ( x 0 ) + δ v ( x ) ] d s
Expanding Equation (3) geometrically and neglecting the binomial, we obtain
T = S 0 + δ S [ 1 v ( x 0 ) δ v v 2 ( x 0 ) ] d s + o ( δ v 2 ) = S 0 [ 1 v ( x 0 ) δ v v 2 ( x 0 ) ] d s + δ S [ 1 v ( x 0 ) δ v v 2 ( x 0 ) ] d s + o ( δ v 2 )
According to Fermat’s theorem, T / s = 0 . Thus, the seismic wave walk time disturbance is
T = S 0 [ 1 v ( x 0 ) δ v v 2 ( x 0 ) ] d s + o ( δ v 2 )
This can be expressed in matrix form as
δ T = A δ V
where δ T   is the difference between the actual travel time and the calculated travel time of the model, δ V is the velocity perturbation of the grid node, and A   is the Jacobi matrix containing information on the observation mode and ray path. The element a i k = T i / V k denotes the velocity derivative of the travel time of the ith ray with respect to the kth grid node.
Therefore, it is necessary to obtain a velocity perturbation that minimizes the walk-time perturbation (residual) so as to obtain a model that most closely reflects the true subsurface velocity.

3.2. Seismic Data Acquisition

In this study, first-arrival travel time data of the deep seismic reflection profile (205 km) were used for seismic tomography to obtain a fine shallow velocity structure. We collected the deep seismic reflection data in 2019 using the French Sercel 428XL recording system with 24-bit digital geophones. The NE–SW-oriented deep seismic profile starts at Heihe City, passes through the towns of Xiaoyangqi and Handaqi and the Duobaoshan ore district, and ends at Jiagedaqi. We used three types of explosive sources (24 kg, 96 kg, and 480 kg) to obtain high-resolution seismic data. The data from the 24 kg shots were acquired using a 200 m interval, whereas data from the 96 kg and 480 kg shots were acquired using larger intervals of 1000 m to collect deeper signals.

3.3. First-Arrival Seismic Tomography Inversion

We used the Chinese seismic data processing software “ToModel” to perform the tomographic inversion calculations. The software is based on the fluctuation equation for fast step wavefront tracking, which improves the accuracy and efficiency of the model orthorectification, and applies the wavelet transform to the laminar inversion [14]. The process of tomography consists of five main steps: data preprocessing, first-arrival time picking, first-arrival time editing, initial model building, and tomographic inversion (Figure 3).
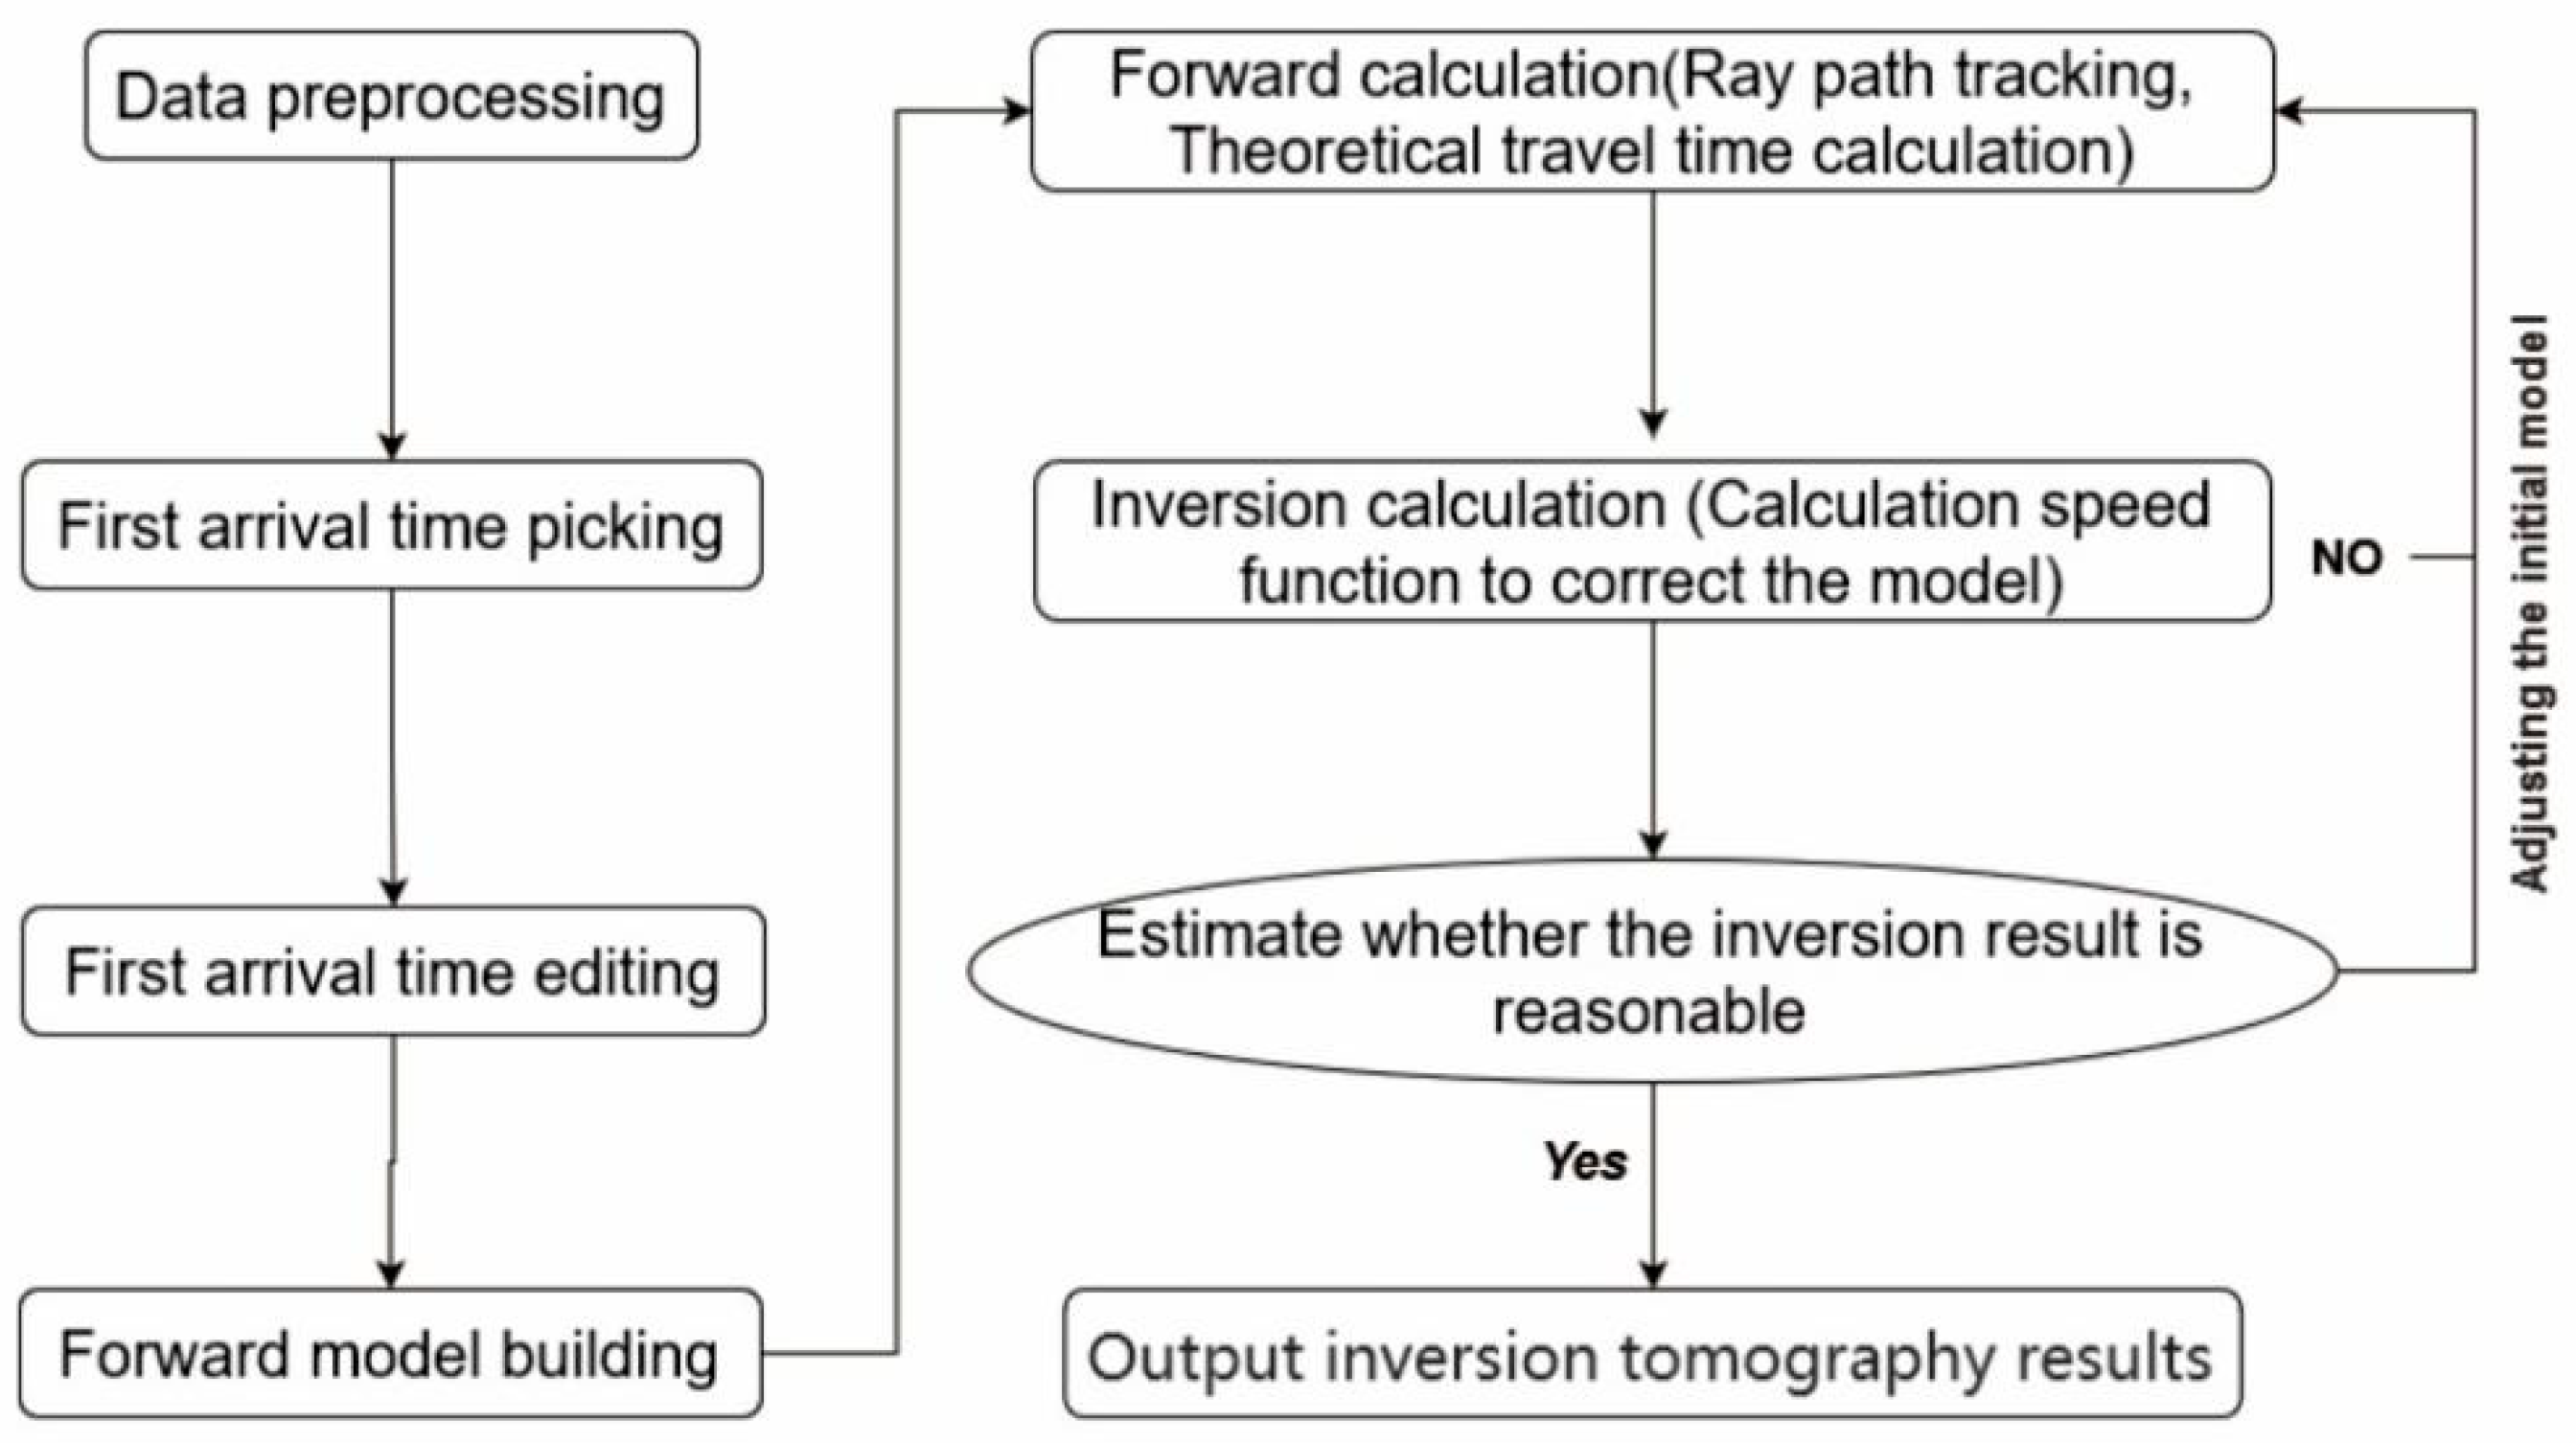
  • Data preprocessing. The seismic data were first decoded to change the format of the seismic instrument field record (e.g., SEG-D) to the format for seismic data processing. The observation system and the trace header were then loaded. The next step was to determine the linear correction parameters and check the first-arrival wave of all shots.
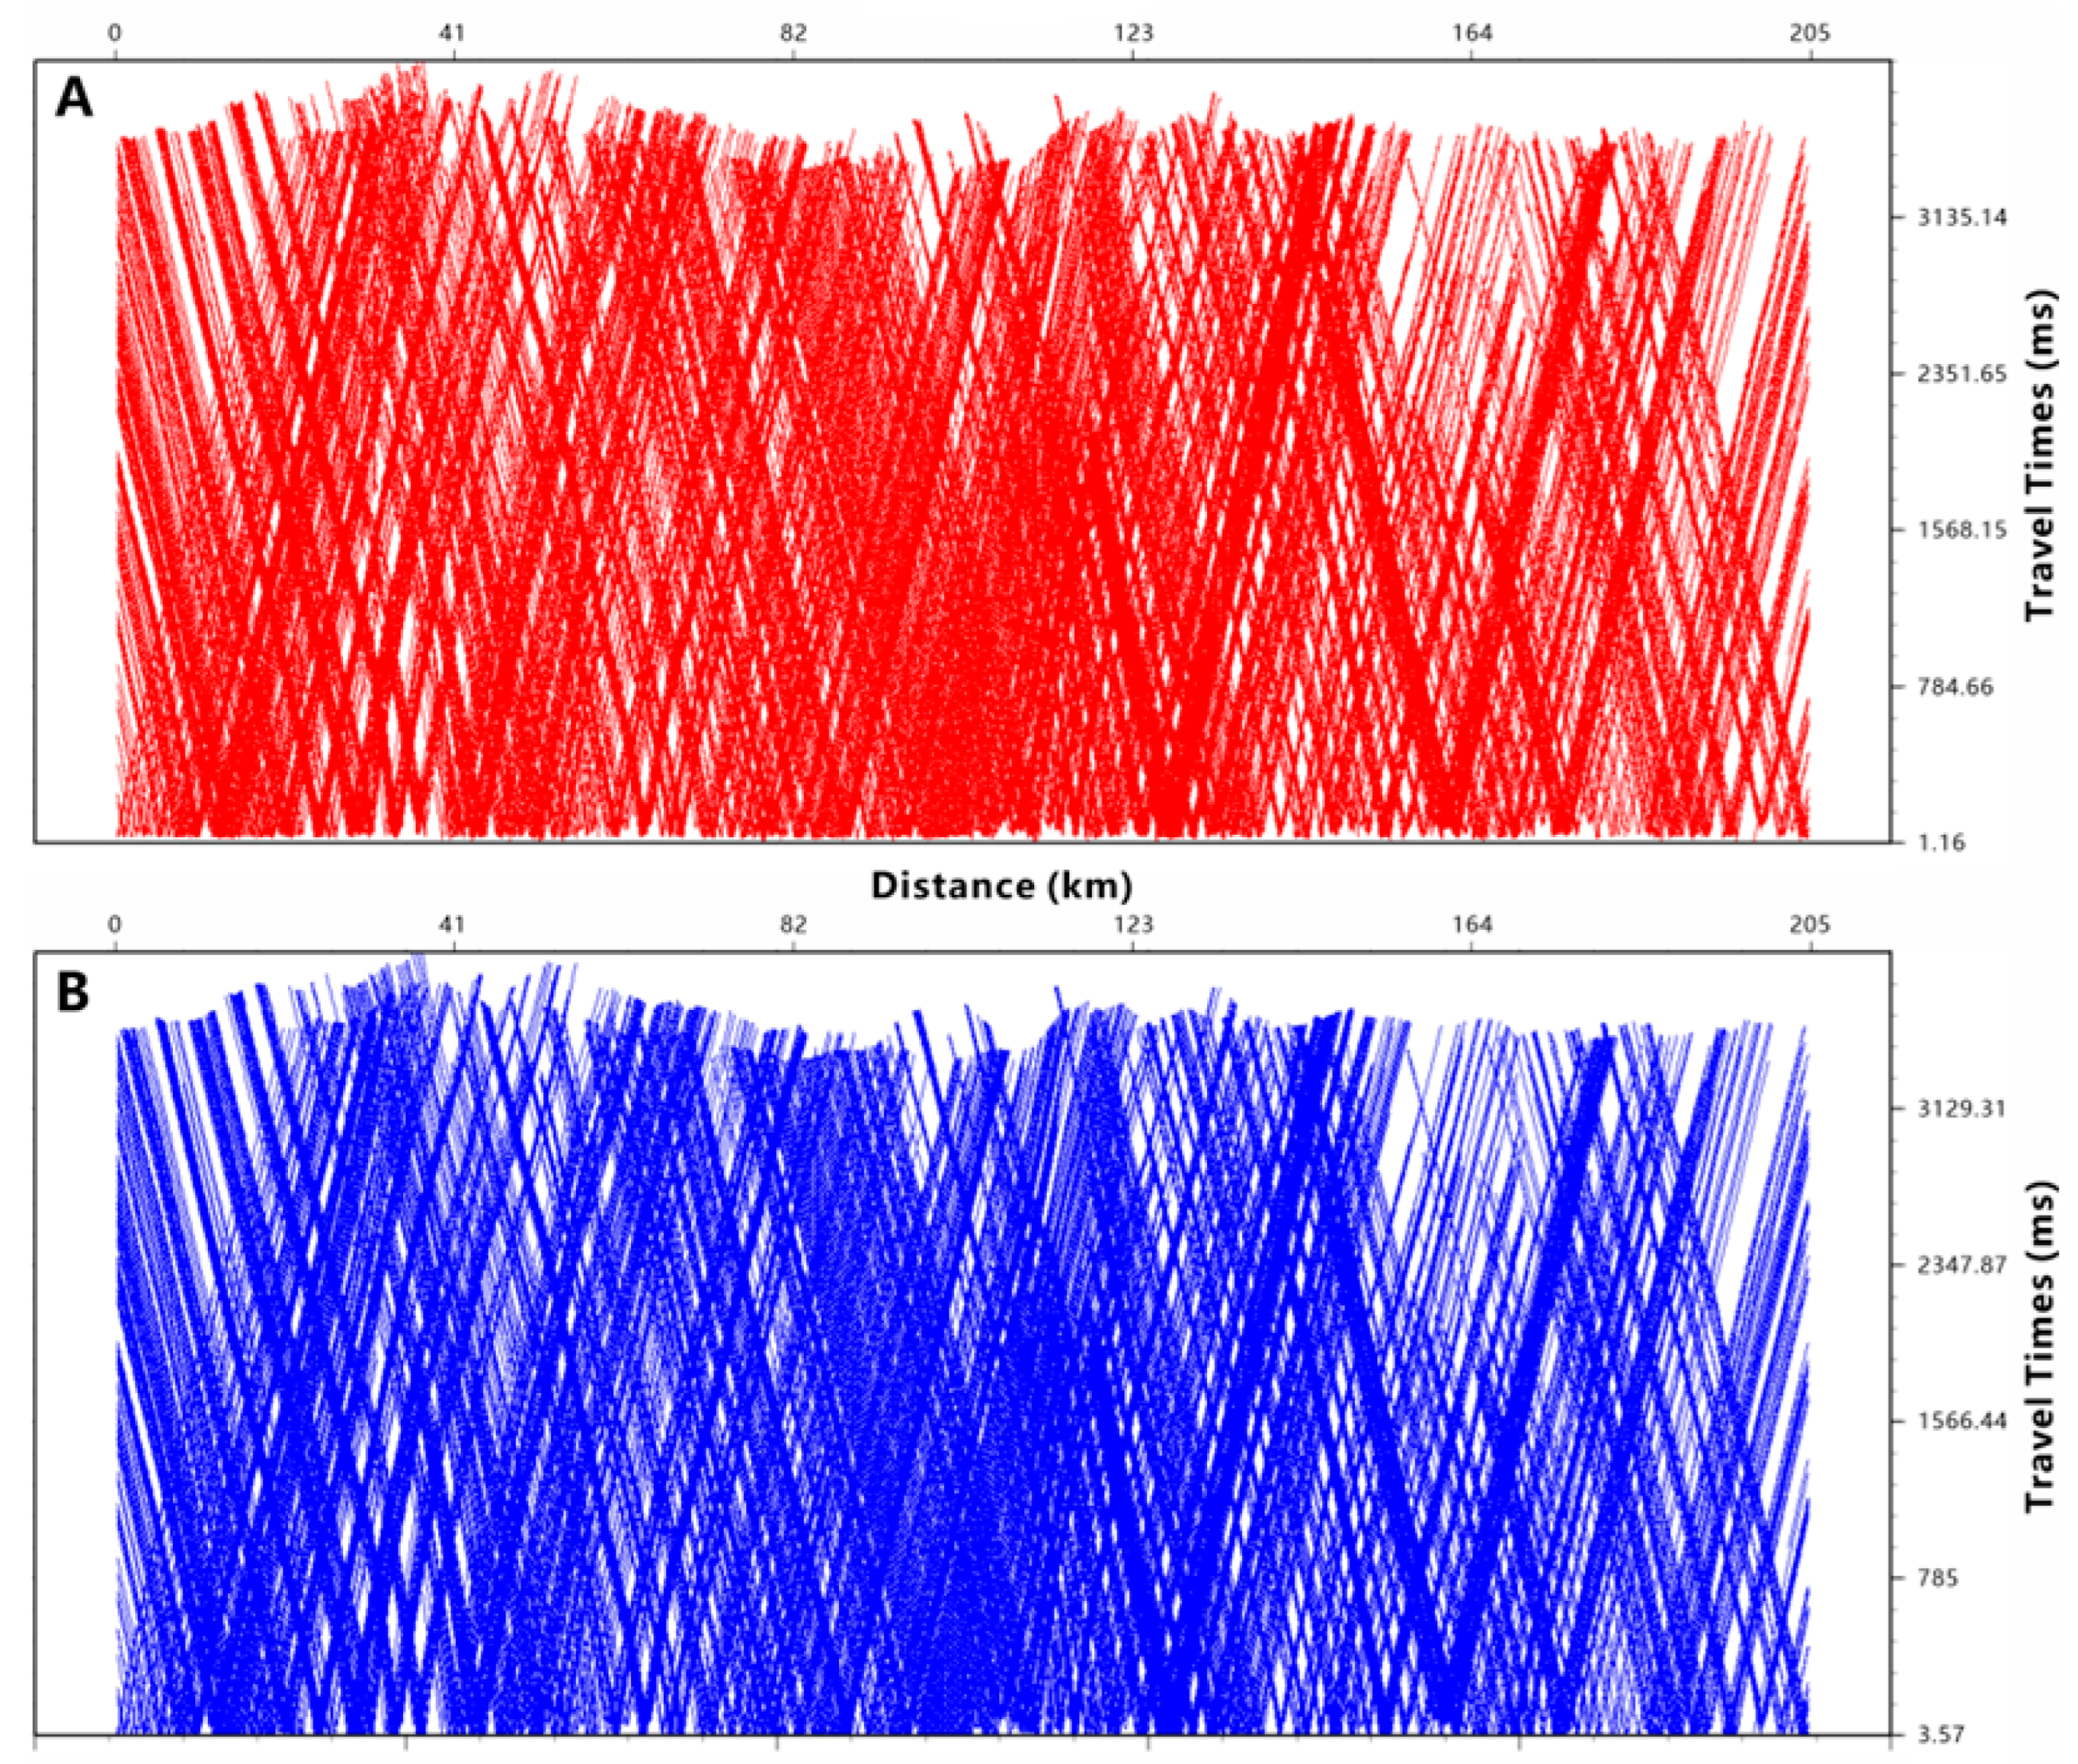
  • First-arrival travel time picking. In this study, a combination of “automatic pickup” and “manual modification” was used to pick the first-arrival wave through cross-correlation of adjacent channels. The first-arrival seismic data were then adjusted according to the actual information of all shots to ensure accurate tomographic inversion results.
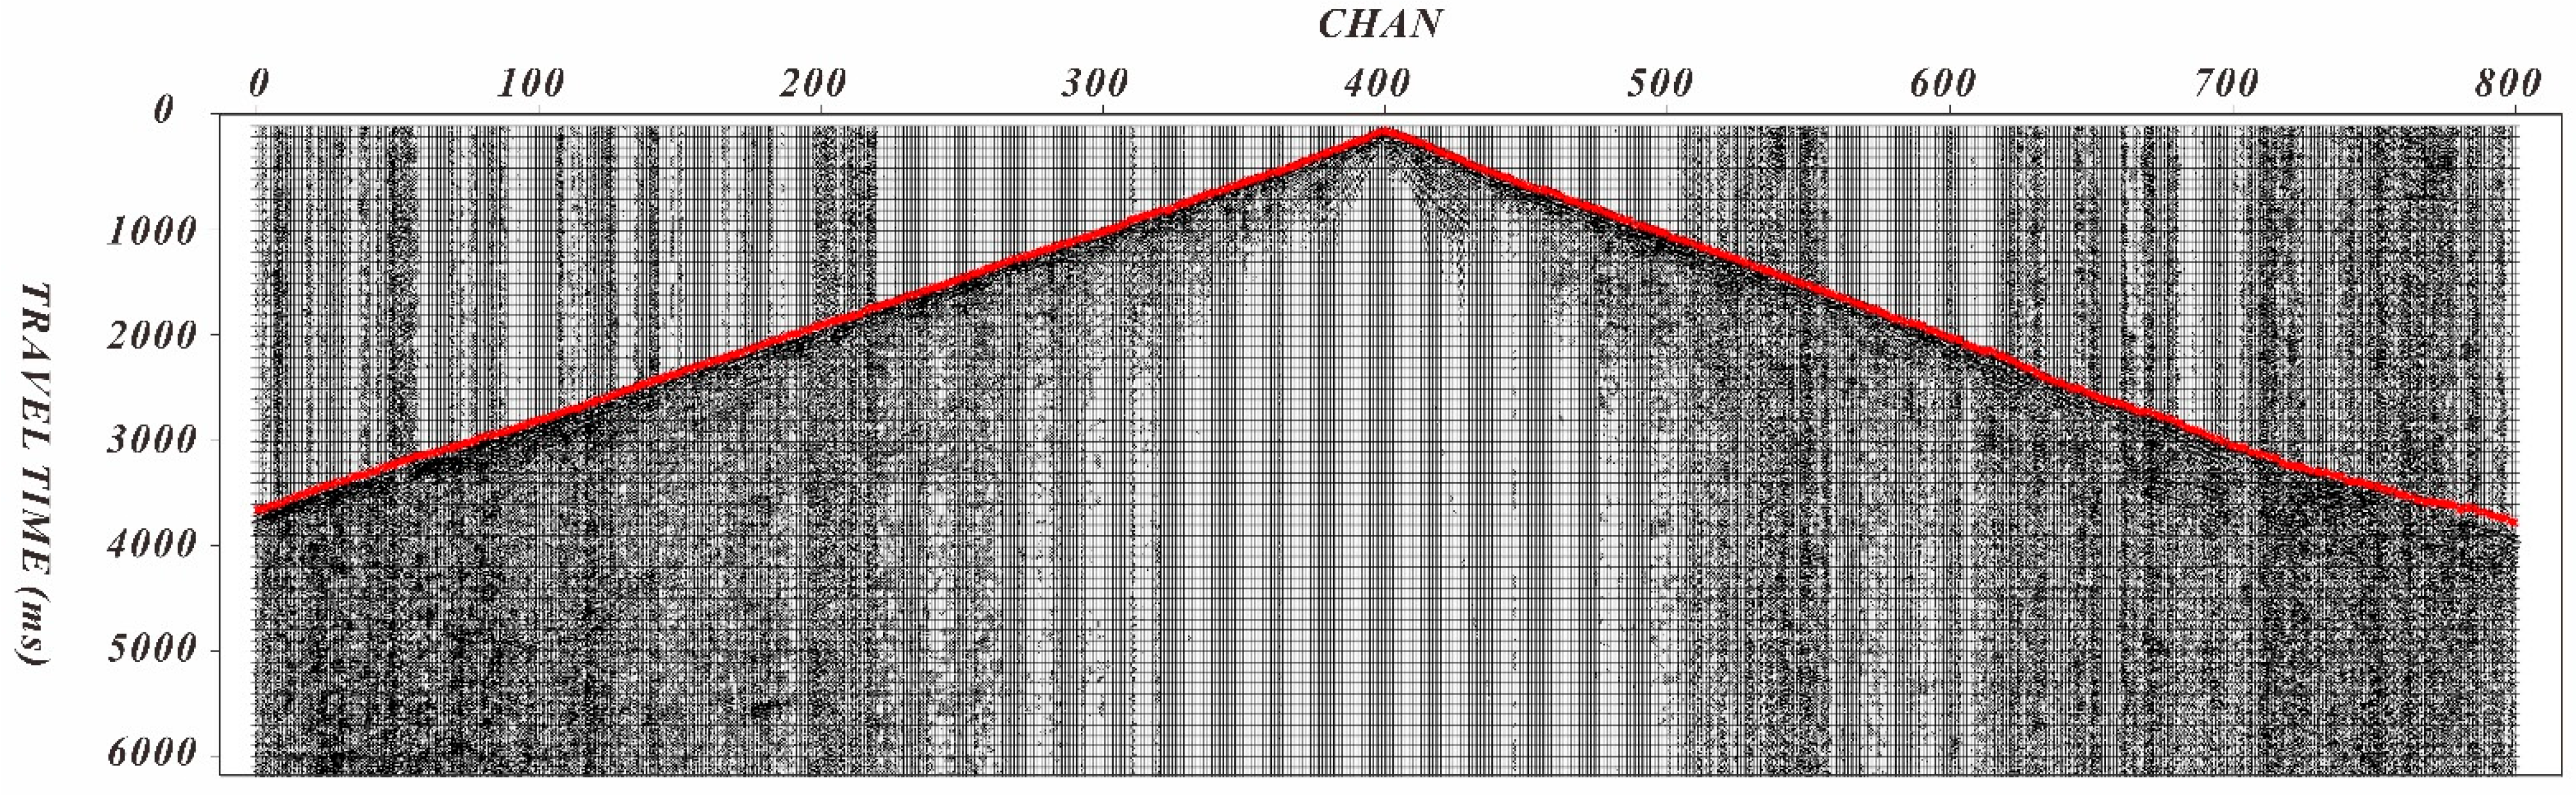
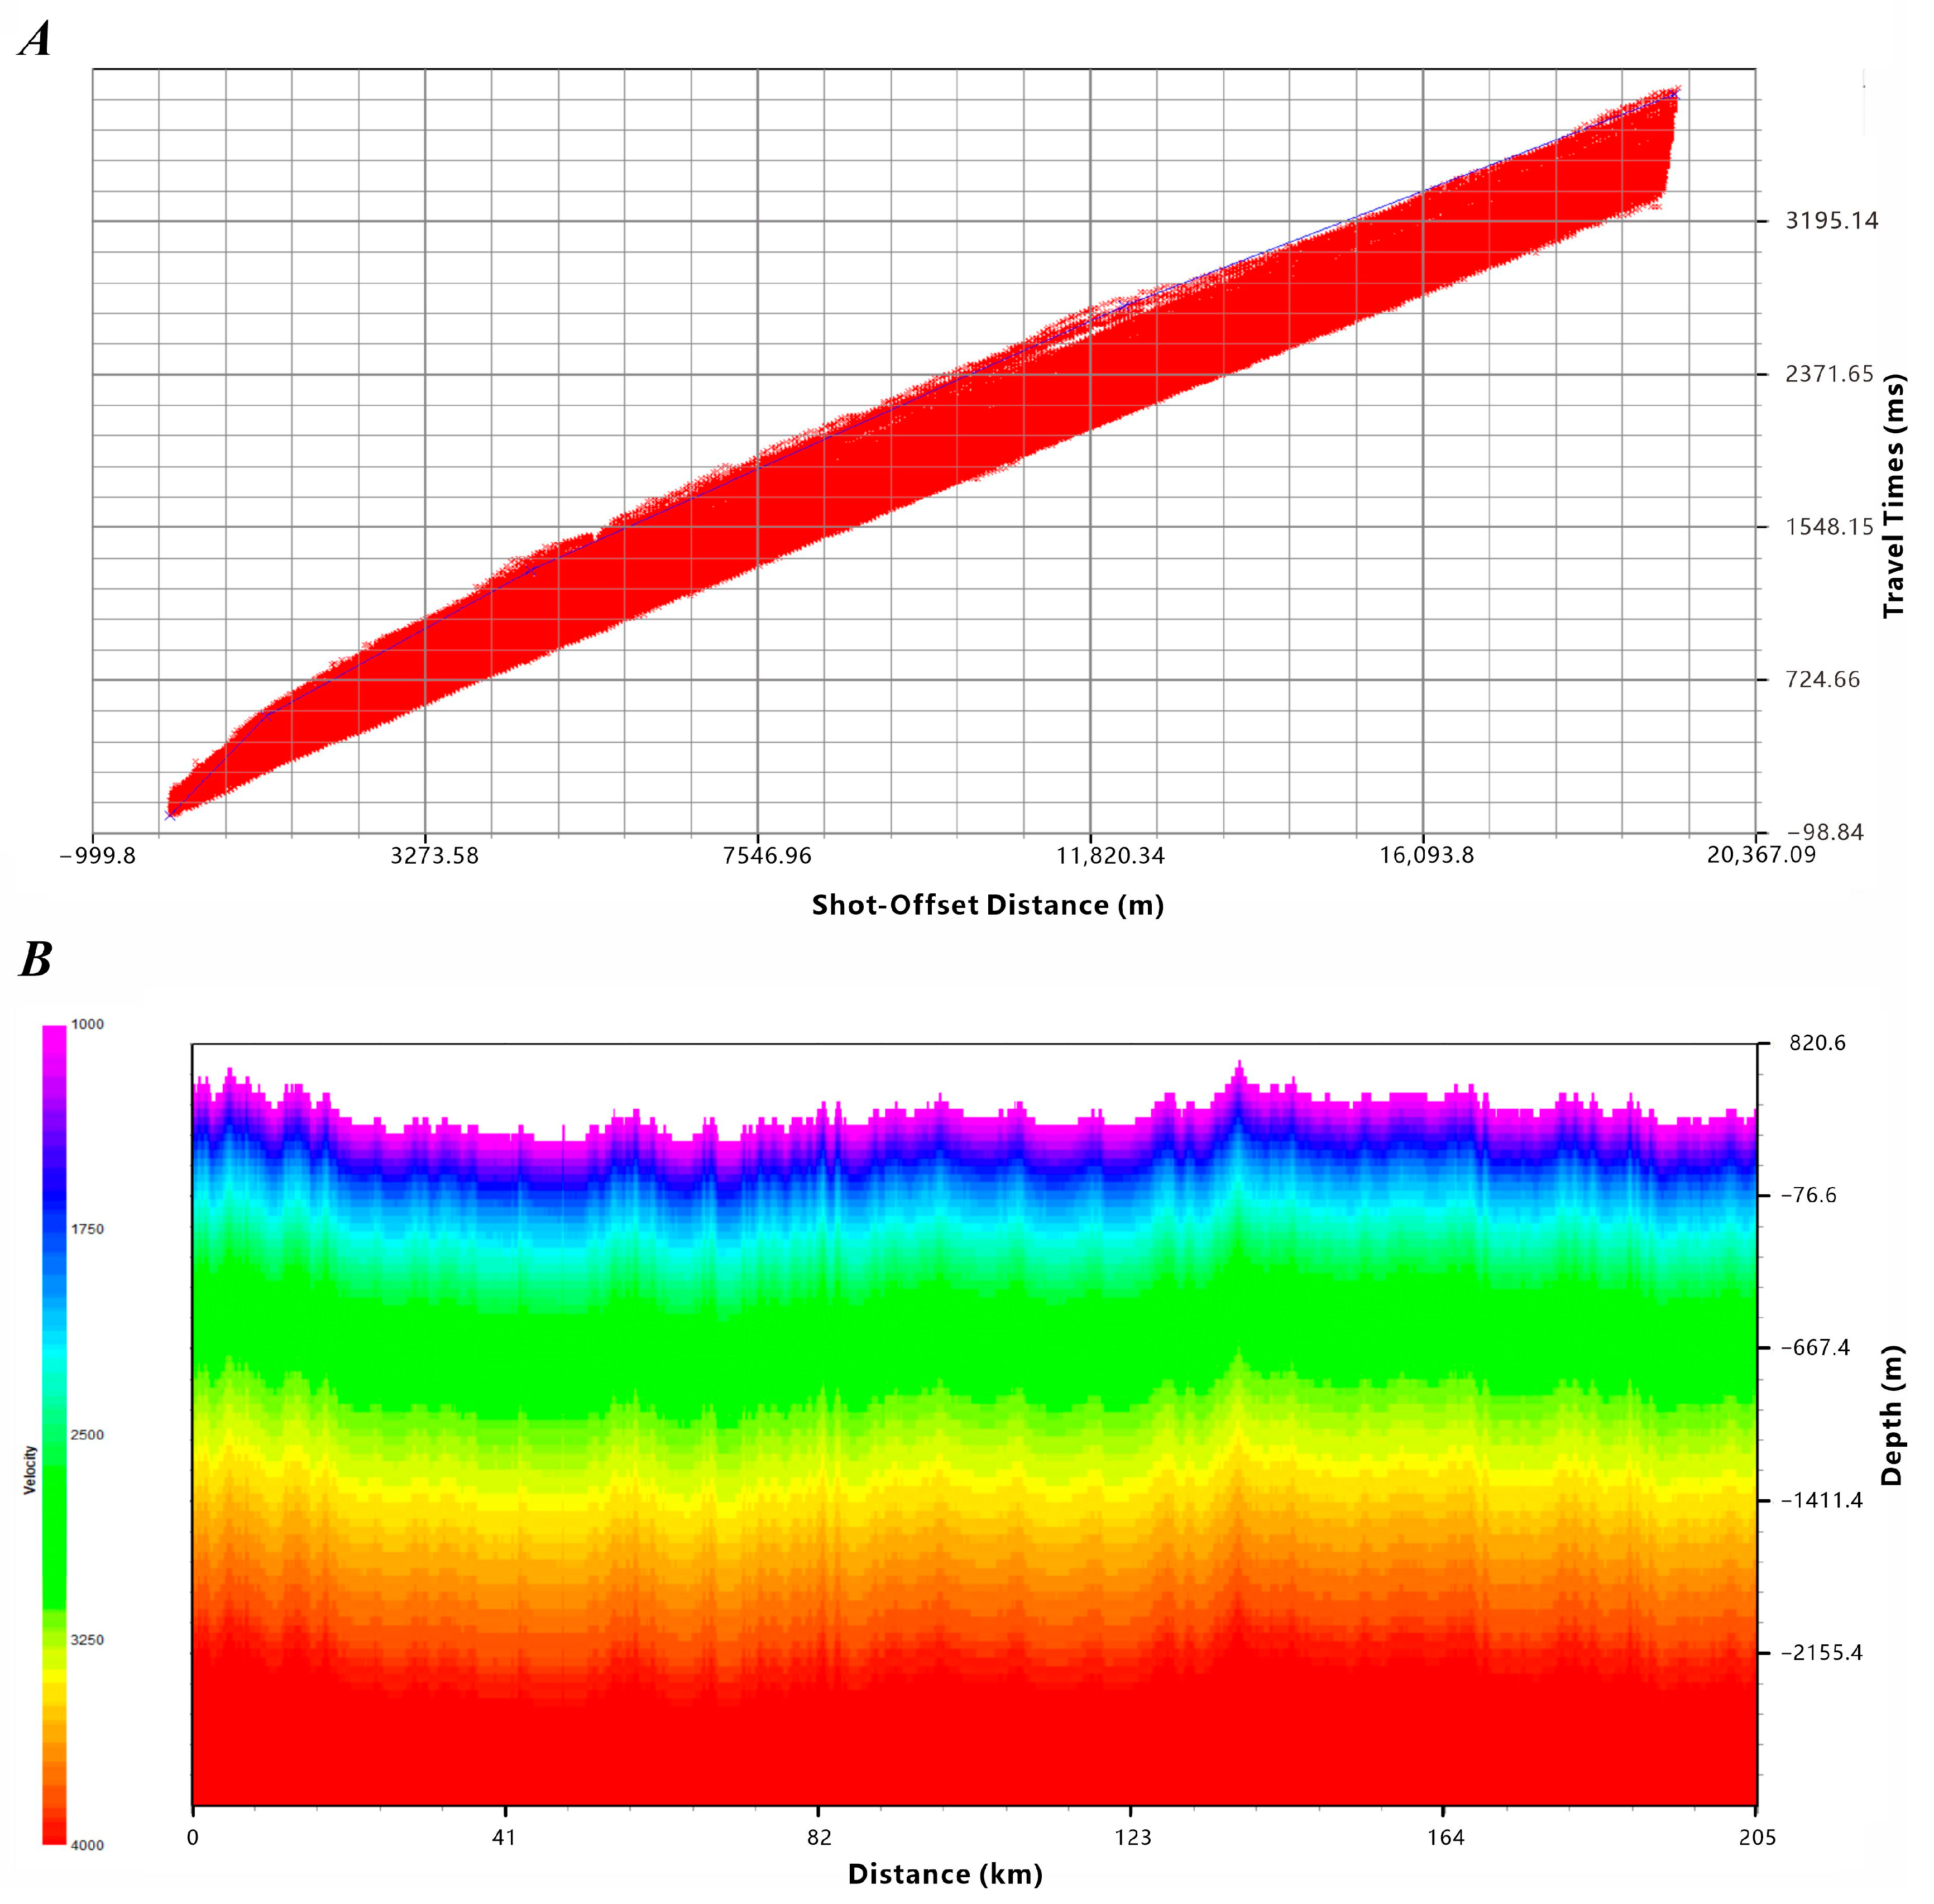
  • First-arrival travel time editing (Figure 4). After converting the coordinates, seismic traces with first-arrival travel times less than 0 were removed, followed by interception of data within the shot point range. Subsequently, bad traces were removed under the display of first-arrival seismic data with the offset time.
  • Initial model building. Displaying the first-arrival data with the offset time, the initial model parameters were determined according to the inflection point of the time-distance curve, and the initial model was established using the delay-time method. The horizontal grid size of the initial model is generally 1/2 that of the trace interval, while the vertical grid size is 1/4 that of the trace interval.
  • Tomographic inversion. Input of walk time data and the established initial model was performed for carrying out tomographic inversion to obtain the shallow velocity structure.

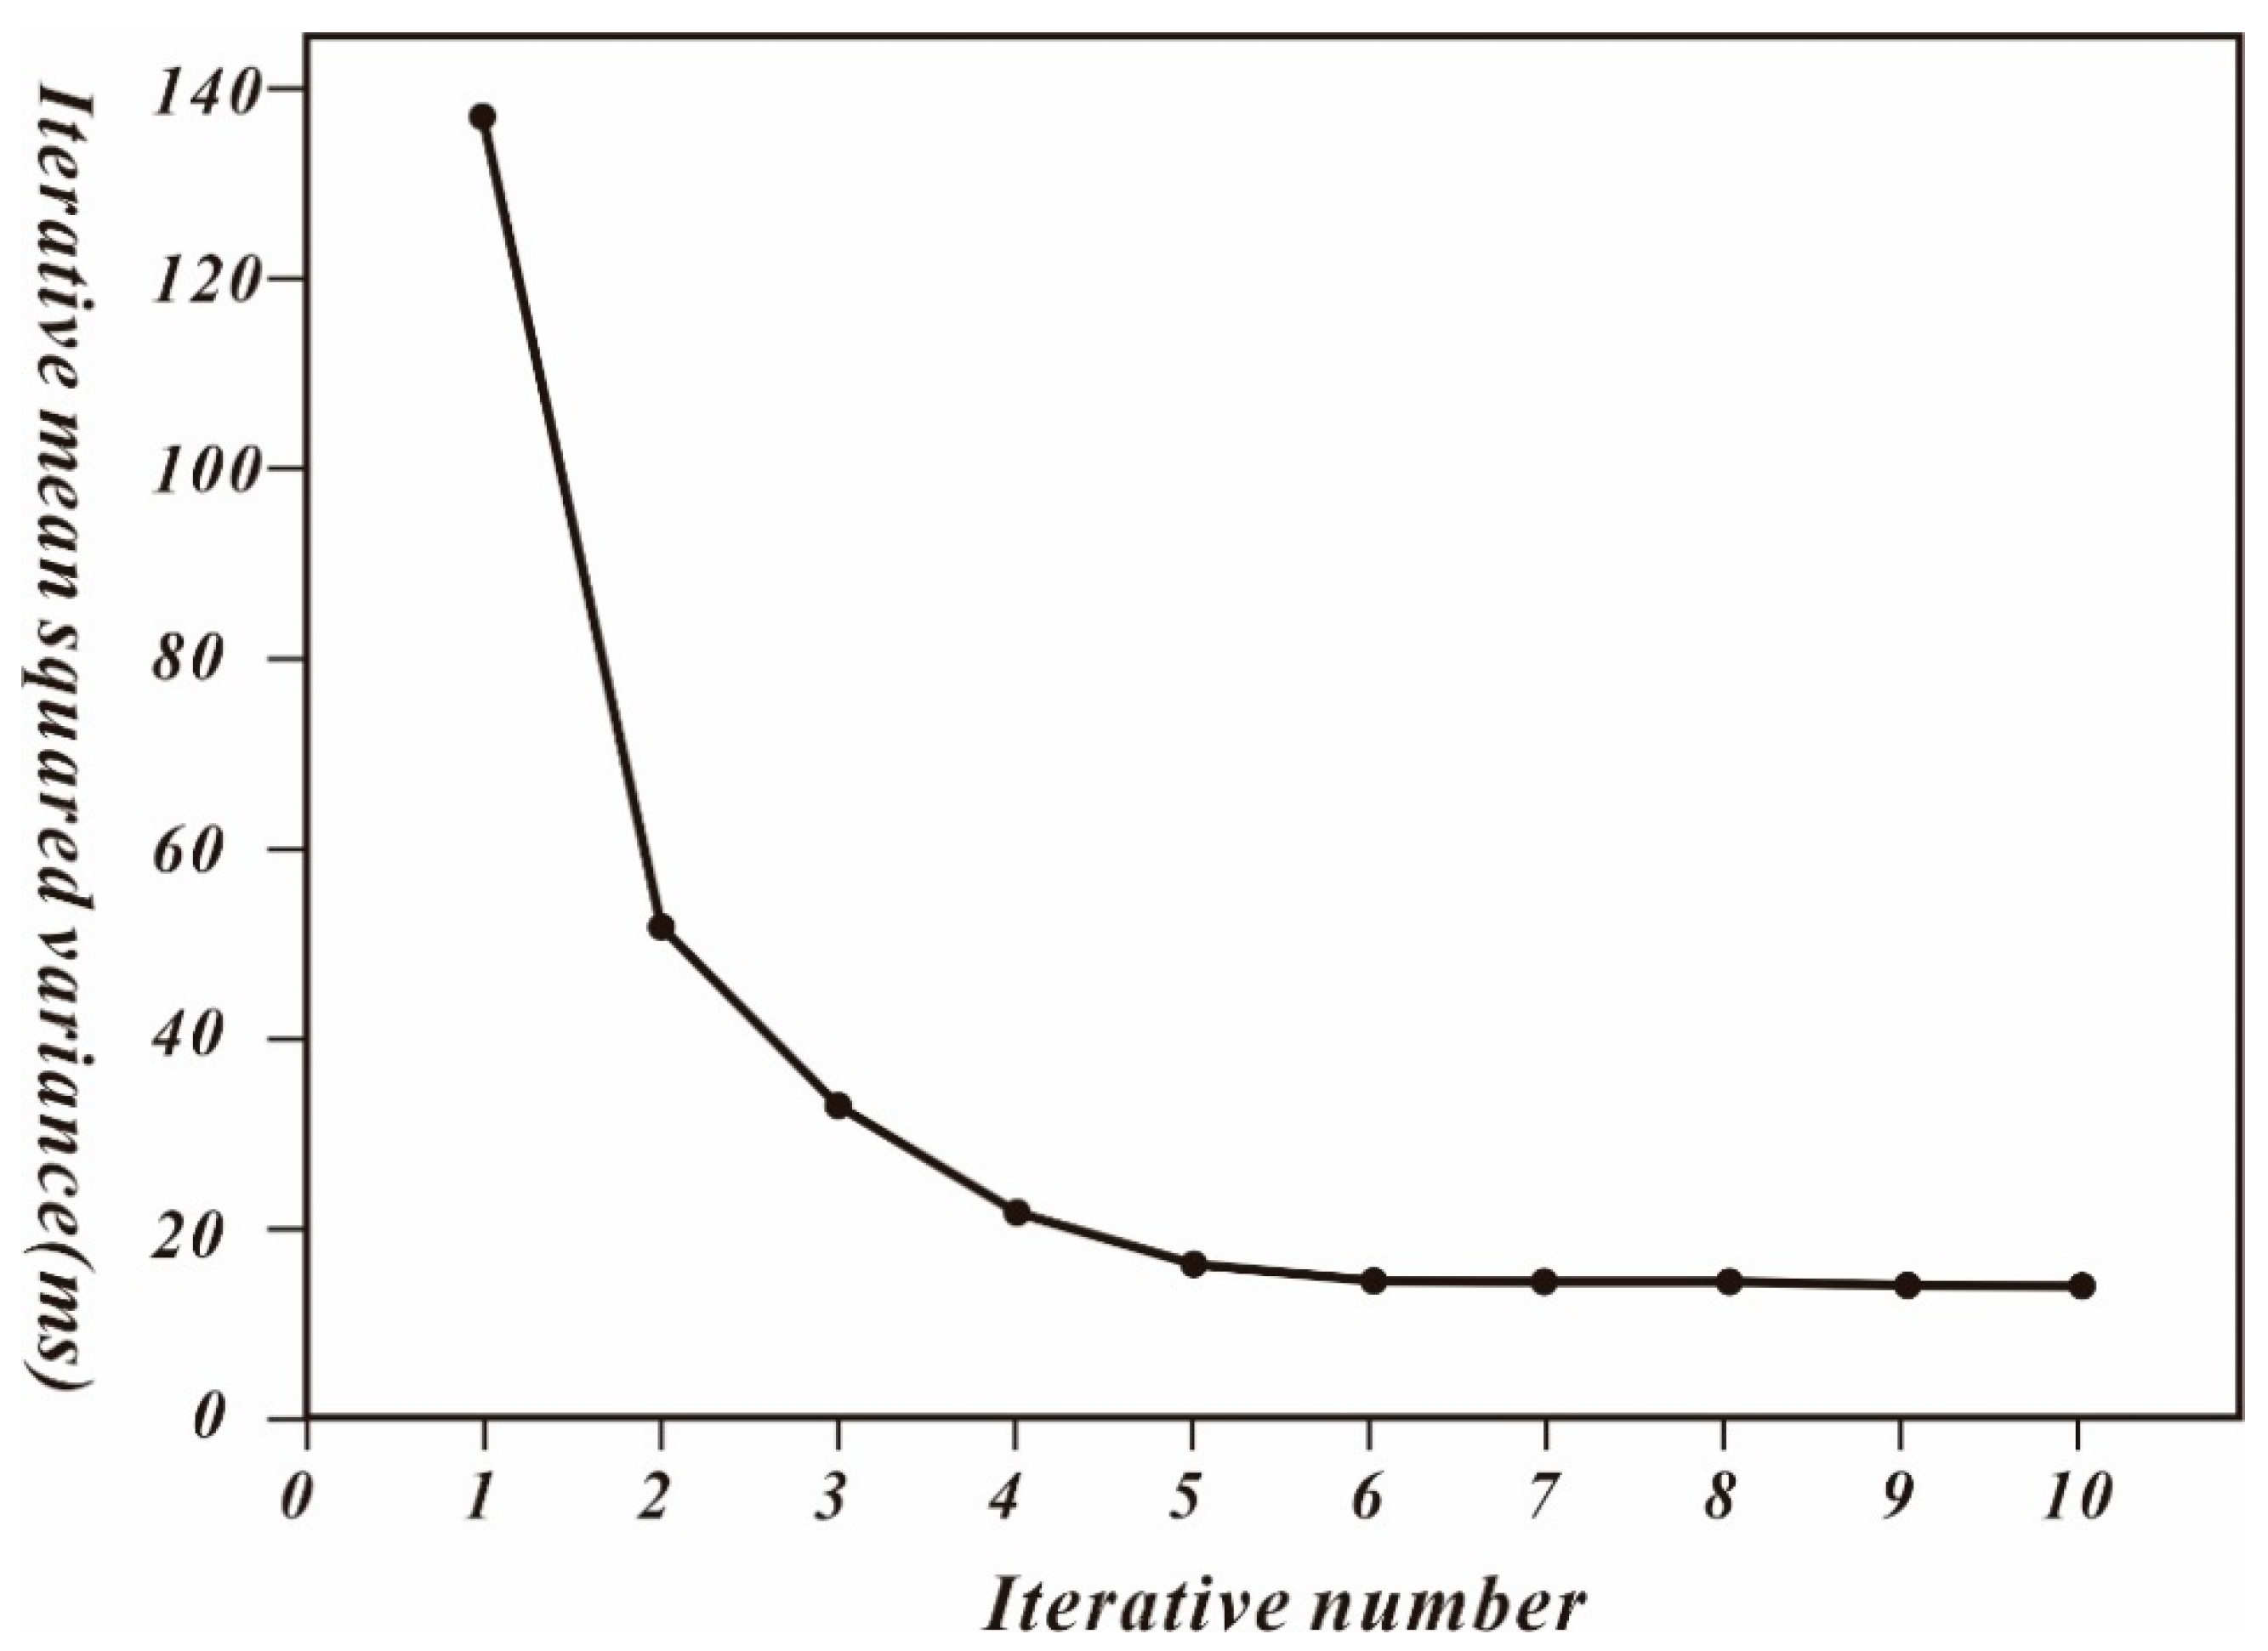
3.4. Parameters of Tomographic Inversion and Analysis of Tomography Results

The first-arrival time is displayed as a function of the shot-receiver distance and time (Figure 5A). Considering the acquisition parameters and inversion time, we selected a 25 × 12.5 m rectangular grid to build an initial model. In this study, we used a nonlinear iterative inversion technique, with the aim of making the inversion results independent of the initial model. Furthermore, considering the iterative efficiency and other issues (topographic conditions, geological conditions, and accuracy of inversion results), the initial model had a layered structure in which velocity increased from the surface downward; the interfaces of the layers were parallel to the undulating terrain. The initial model (Figure 5B) defined four layers from the surface downward. These layers had velocities of 1500 m/s, 2500 m/s, 4000 m/s, and 6000 m/s and corresponding thicknesses of 387 m, 800 m, 1400 m, and 125 m.
The input time data and established initial model were used for the inversion. The parameters of the inversion were set as follows: the orders of the wavelet transform in the X and Z directions were 4 and 1, respectively. The inversion was iterated 10 times, and the velocity variation range was 340~6000 m/s. As a result, we obtained the theoretical inversion of the first-arrival time, ray density, and inversion velocity model.
Based on the mean squared difference of each iteration during the tomographic inversion, we could graph the inversion iteration convergence curve (Figure 6). Figure 6 shows that the mean squared deviation of the initial iterations converges rapidly and decreases fast, whereas that of the last few iterations tends to be smooth. After 10 iterations, the mean squared variance (walk time residual) was within 20 ms, from 136.51 ms to 14.28 ms, with an improvement rate of more than 90%. To a certain extent, this indicated that the inversion results were credible.
As shown in Figure 7, the actual first-arrival times (i.e., the picked first-arrivals times, shown by the red part of Figure 7A) and the theoretical first-arrival times (i.e., the first-arrival times calculated by inversion, shown by the blue part of Figure 7B) were superimposed and displayed in a full-alignment manner. Preliminary inspection indicated that the first-arrival times calculated by inversion were in good accordance with the actual times, indicating that the inversion results and are in good agreement with those of the actual model.

4. Tomography Results

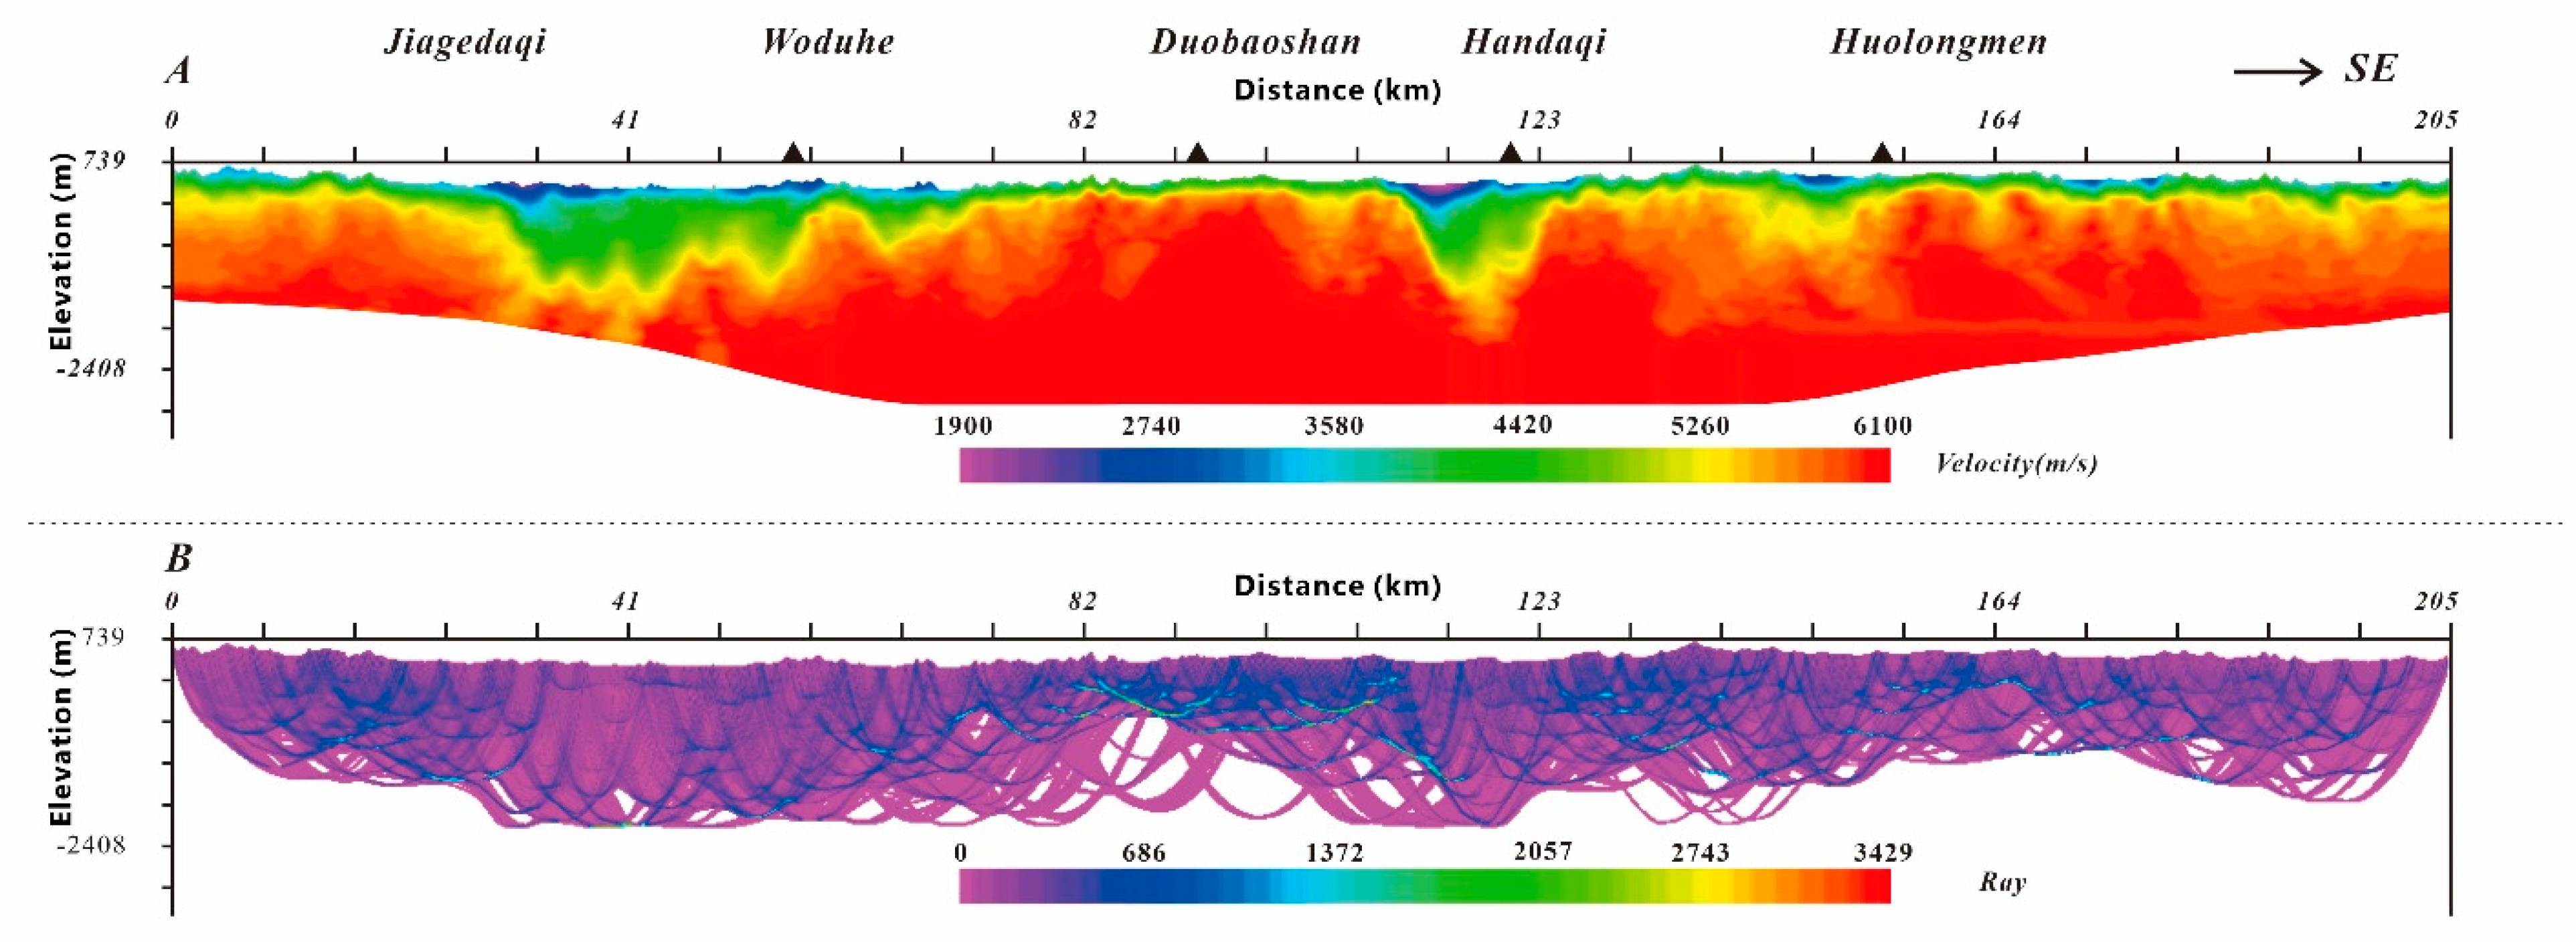
4.1. Ray Density Distribution

The distribution of the ray density can be used to determine the reliability of the grid velocity inversion; in general, the greater the ray density, the higher its accuracy. In contrast, the velocities of the grids not crossed by ray paths are derived from extrapolation of the values of other grids and are therefore less reliable. The reliability of the inversion can also be ascertained based on whether the ray path penetrates the interface or goes beyond the surface. If the ray penetrates the interface and then turns back and bounces out of the surface, the depth and velocity set by the initial model are not reasonable. The ray distribution map of the final inversion results (Figure 8B) shows that the rays do not go beyond the surface and do not fold back into the bottom boundary of the interface, which indicates that the initial model setup is reasonable. The ray distribution map of the final inversion results (Figure 8B) is not uniform, with a higher ray density in the central portion of the profile and a lower ray density at the two ends, and not all grids have dense ray crossings. The ray densities in the Duobaoshan ore district exceed 1000 rays per grid unit, which enables a superior tomographic result of the velocity structure of the Duobaoshan ore district.

4.2. Tomography Profile

In this study, a 205 km velocity profile was prepared based on first-arrival seismic tomography inversion (Figure 8A). The profile is SE-NW oriented and crosses the Duobaoshan ore district. Overall, the tomography profile exhibits a trend of increasing velocity with depth in the vertical direction and undulating high-velocity interfaces in the horizontal direction. In this profile, velocity varies from 1900 to 6100 m/s, and the inversion depth reaches 2900 m. The velocity profile is subdivided into five parts by two low-velocity blocks. The first part is located the Jiagedaqi section (0–30 km), where the velocity varies between 3000 m/s and 6000 m/s. There are no distinct low-velocity zones in this part, and the high-velocity body is located at a depth of approximately 400 m, with a gentle undulating interface. The second part is the Woduhe section (30–75 km), which has distinct low-velocity zones on the surface, with velocity varying between 2500 and 6000 m/s. The high-velocity body is buried at greater depths (100–1000 m), with an interface that is more undulating than that of the Jiagedaqi section. The third section is the Duobaoshan section (75–110 km), where the high velocity body is buried at a shallow depth and partially exposed at the surface; it is the main part of the porphyry copper deposit in the Duobaoshan ore district, and exhibits velocities of 3900–6100 m/s. The fourth section is the Handaqi section (110–160 km), which is the region with the lowest velocities in the whole profile; it exhibits velocities varying between 1900 m/s and 6000 m/s. The last part, the Huolongmen section, which ranges from 160 to 205 km, is the location of the main gold deposits (points); the high-velocity body is buried at a depth of 250–1200 m.

5. Discussion

5.1. Structure of Velocity Profile

In the velocity profile of first-arrival seismic tomography inversion (Figure 9C), the lateral boundaries between high- and low-velocity bodies are visible in the Duobaoshan and Huolongmen sections. The Handiqi section of the velocity profile crosses volcanic granite-like rocks and the Nenjiang Quaternary sedimentary strata from south to north. The location of the granite is consistent with the projection of the high-velocity body in the inversion section (Figure 9D). Moreover, the Nenjiang sedimentary outcrop corresponds to the low-velocity body (Figure 9D).
The ore-controlling structures in the Duobaoshan ore district are mainly NW-, NE-, and SN-trending fractures and folds. The porphyry Cu-Mo-(Au) ore formed during the Caledonian and the Si-Cu-Fe-(Au) ore formed during the early Yanshanian under the control of the NW arc tectonic zone. The gold deposits formed during the late Yanshanian are controlled by NE-, NW-, and near-SN-trending fractures, especially at the confluences of multiple fracture groups [43]. The velocities were generally lower than those of the surrounding rocks in the fractured areas and concealed fracture zones [14].
In combination with the outcrops of fracture zones in the geological profile (Figure 9B), the velocity profile can be used to infer the locations of the occult fractures. Typically, magmatic rocks within the granitic polymetallic zone exhibit velocities greater than 4000 m/s [44]. In summary, the parts of the velocity profile with velocities below 3500 m/s represent sedimentary strata and Quaternary overburden, the parts with velocities of 3500–5000 m/s may represent magmatic and metamorphic rocks, and parts with velocities of 5000–6100 m/s represent concealed granite bodies.
The Duobaoshan ore district involves multiple phases of magmatism and copper and gold mineralization [45]. The Cu (Au) mineralization during the middle Caledonian and early Yanshanian is associated with intermediate and hypabyssal intrusions, and the gold mineralization during the late Yanshanian is primarily related to ultra-shallow magmatic intrusions [46]. Intrusive rocks such as granite, orthogranite, alkali granite, amphibolite, and granite porphyry outcropped in the Duobaoshan ore district [47].
In the velocity profile (Figure 9C), the interface of the high-velocity body is highly undulating and is related to multi-phase magmatism. Since the locations of granitic outcrops within the Duobaoshan ore district correspond with and the undulations in the interface of the high-velocity rock bodies beneath the Duobaoshan porphyry deposit, we can preliminarily infer that multiple phases of magmatic intrusion modified pre-existing geological formations.
The deposits in the Duobaoshan ore district have a regular spatial distribution. The northwestern portion of the Duobaoshan ore district mainly exhibits Fe-Cu skarn deposits, the central portion exhibits porphyry Cu-Mo-(Au) deposits, and the southeastern portion exhibits epithermal Au deposits. The Duobaoshan and Tongshan porphyry Cu-Mo deposits are the products of early Paleozoic magmatism and are closely related to granodiorite porphyry and amphibolite. The mineralized material of the Fe-Cu skarn deposits originates from the mineralized granodiorite rock body [10].
In the velocity profile of first-arrival seismic tomography inversion (Figure 9C), the porphyry copper and silica deposits are observed at shallow depths beneath the occulted granite bodies. The volume of the occulted granite bodies below the silica deposits is small, whereas that below the porphyry deposits is large. The epithermal gold deposits are controlled by intrusive contact zones and NE-oriented fractures, which are distributed in the occulted fracture zones in the velocity profile. Based on the spatial distribution characteristics and velocity structure of each type of deposit, we can infer that the distribution of porphyry copper deposits and diorite deposits in the Duobaoshan ore district is related to occulted granite bodies, while the distribution of the epithermal gold deposits is related to the occulted fracture zones.

5.2. Depth of Porphyry Body Burial at the Tongshan Deposit

The depth of the Tongshan deposit limits the comprehensive exploration of the deposit and the study of its genesis. The porphyry body is the most important marker of the porphyry copper deposit. Previous studies did not identify a porphyry body; only granitic porphyry veins were found in core samples from drill holes, but the exact depth of the porphyry body was not identified due to the limited depth of the drill holes [6]. The Duobaoshan porphyry Cu-Mo-(Au) deposit located close to the Tongshan deposit, where the intrusion ages of the granodiorite and granodiorite porphyry are 485–478 Ma and 477–474 Ma, respectively [5,7,46]. Geochemical data show that they are enriched in LREE and LILE and deficient in HFSE.
LA-ICP-MS zircon dating has indicated that the age of the granodiorite from the Tongshan deposit is 478–476 Ma [46,47]. A branch of the granodiorite porphyry was located in a drill hole, and zircon U-Pb dating indicated that the age of the porphyry was 471 Ma [48]. Geochemical analysis revealed that the granitoids within the Tongshan and Duobaoshan porphyry Cu-Mo-(Au) deposits have similar geochemical characteristics and ages, and therefore, these deposits are contemporaneous. Currently, the Duobaoshan deposit has been more extensively studied than the Tongshan deposit. In this work, we selected the Duobaoshan section (Figure 10A) from the tomography results and provided a basis to identify the porphyry body of the Tongshan deposit based on the velocity characteristics of the porphyry body of the Duobaoshan deposit.
The porphyry body and branch of the Duobaoshan deposit are exposed at elevations of 100–50 m, and the porphyry body has a significant tendency to expand downwards with the main body to an elevation of −200 m [39]. In the velocity profile (Figure 10B), a high-velocity mass (5800 m/s) is noted approximately 450 m below the Duobaoshan porphyry Cu-Mo-(Au) deposit, which is similar to the elevation of the porphyry body in actual production. Previously, only a few granite porphyry branches were observed at an elevation of −800 m during exploration drilling [6], so the porphyry bodies should be at lower elevations. In Figure 10B, a high-velocity body (>5800 m/s) can be observed below the Tongshan deposit at an elevation of −1000 m. Taken together, these velocity features suggest that the porphyry body in the Tongshan deposit is likely buried at an elevation of about −1000 m; the critical exploration area should be below the elevation −1000 m.
The Tongshan Fault is a post-formation fracture that truncates the Tongshan deposit in the Duobaoshan ore district [48]. As shown in Figure 10B, the high-velocity bodies below the Duobaoshan and Tongshan deposits are penetrated by the low-velocity zone of the fracture, and the high-velocity bodies extend downward and are connected at depth. Taken together, the similar ages, geochemical characteristics, and velocity structures [48,49] of the porphyry bodies below the Duobaoshan and the Tongshan deposits indicate that they may be connected at depth.

5.3. Indication of Mineralization

The copper and gold deposits in the Duobaoshan ore district are magmatic-hydrothermal deposits; magmatic intrusion and hydrothermal activity are crucial controls for mineralization in this region. Seven magmatic phases have been identified from data collected on the age of magmatic rocks in the Duobaoshan ore district: (1) Middle and Late Cambrian (506−491 Ma); (2) Early and Middle Ordovician (485−471 Ma) and ~462 Ma; (3) Late Ordovician (450−447 Ma); (4) Early Carboniferous and Late Carboniferous − Early Permian (351−345 Ma) and 323−291 Ma; (5) Middle and Late Triassic (244−223 Ma); (6) Early, Middle, and Late Jurassic (178−168 Ma) and ~150 Ma; and (7) Early Cretaceous (~112 Ma) [10]. The Duobaoshan ore district underwent at least three major metallogenic events: (1) Early Ordovician (485−473 Ma) porphyritic Cu-Mo-(Au) mineralization, (2) Early Middle Triassic (246−229) shallow hydrothermal Au-(Cu-Mo) mineralization, and (3) Early Jurassic (177−173 Ma) Fe-Cu skarn mineralization [33].
The Tongshan porphyry Cu-Mo-(Au) deposit and Zhengguang epithermal Au deposit may be associated with multiple mineralization phases. In the Duobaoshan ore district, the transport and concentration of hydrothermal fluids are closely related to the fracture system in this mineralization area; the most extensive mineralization in the region occurs at the fracture intersection [28], reflecting the succession of mineral-controlling structures and mineralization.
In the Greater Xing’an Range, a string of pearl-like magnetic anomalies is distributed along the Heihe-Hegenshan suture zone [50], which runs from Qiqihar, through Gannan, to the Nengjiang River, and then divides into two branches to Huma and Heihe. As shown in Figure 9A, there are distinct high magnetic anomalies in the Duobaoshan and Huolongmen regions. Combined with the low-velocity fracture zones identified below the ore district (Figure 9C), the copper and gold deposits fall within the high magnetic anomaly zone. The beaded high magnetic anomalies may be caused by intrusive rocks or magnetic minerals emplaced along the fractures, while the narrow vein-shaped low magnetic anomalies may be due to reduced magnetic properties of the rocks within the fracture zones [51].
The magnetic field values are generally in the range of tens to hundreds of nT, indicating the existence of mineral-controlling fracture structures and various intrusive bodies or veins along with the fracture intrusions. The fractures can serve as channels for the transport of mineralized hydrothermal fluids and provide favorable conditions for mineralization. Regional geological data show that many NW-, NE-, and SN-trending fractures are developed, and these fractures are the ore-controlling structures in the Duobaoshan ore district [52,53]. When taken together, the magmatic intrusive activities closely related to the copper and gold hydrothermal deposits, the regional magnetic anomaly characteristics, and the distribution of deposits indicate that the identified occult fractures may have provided a channel for the transport of magma associated with mineralization in the Duobaoshan ore district.

6. Conclusions

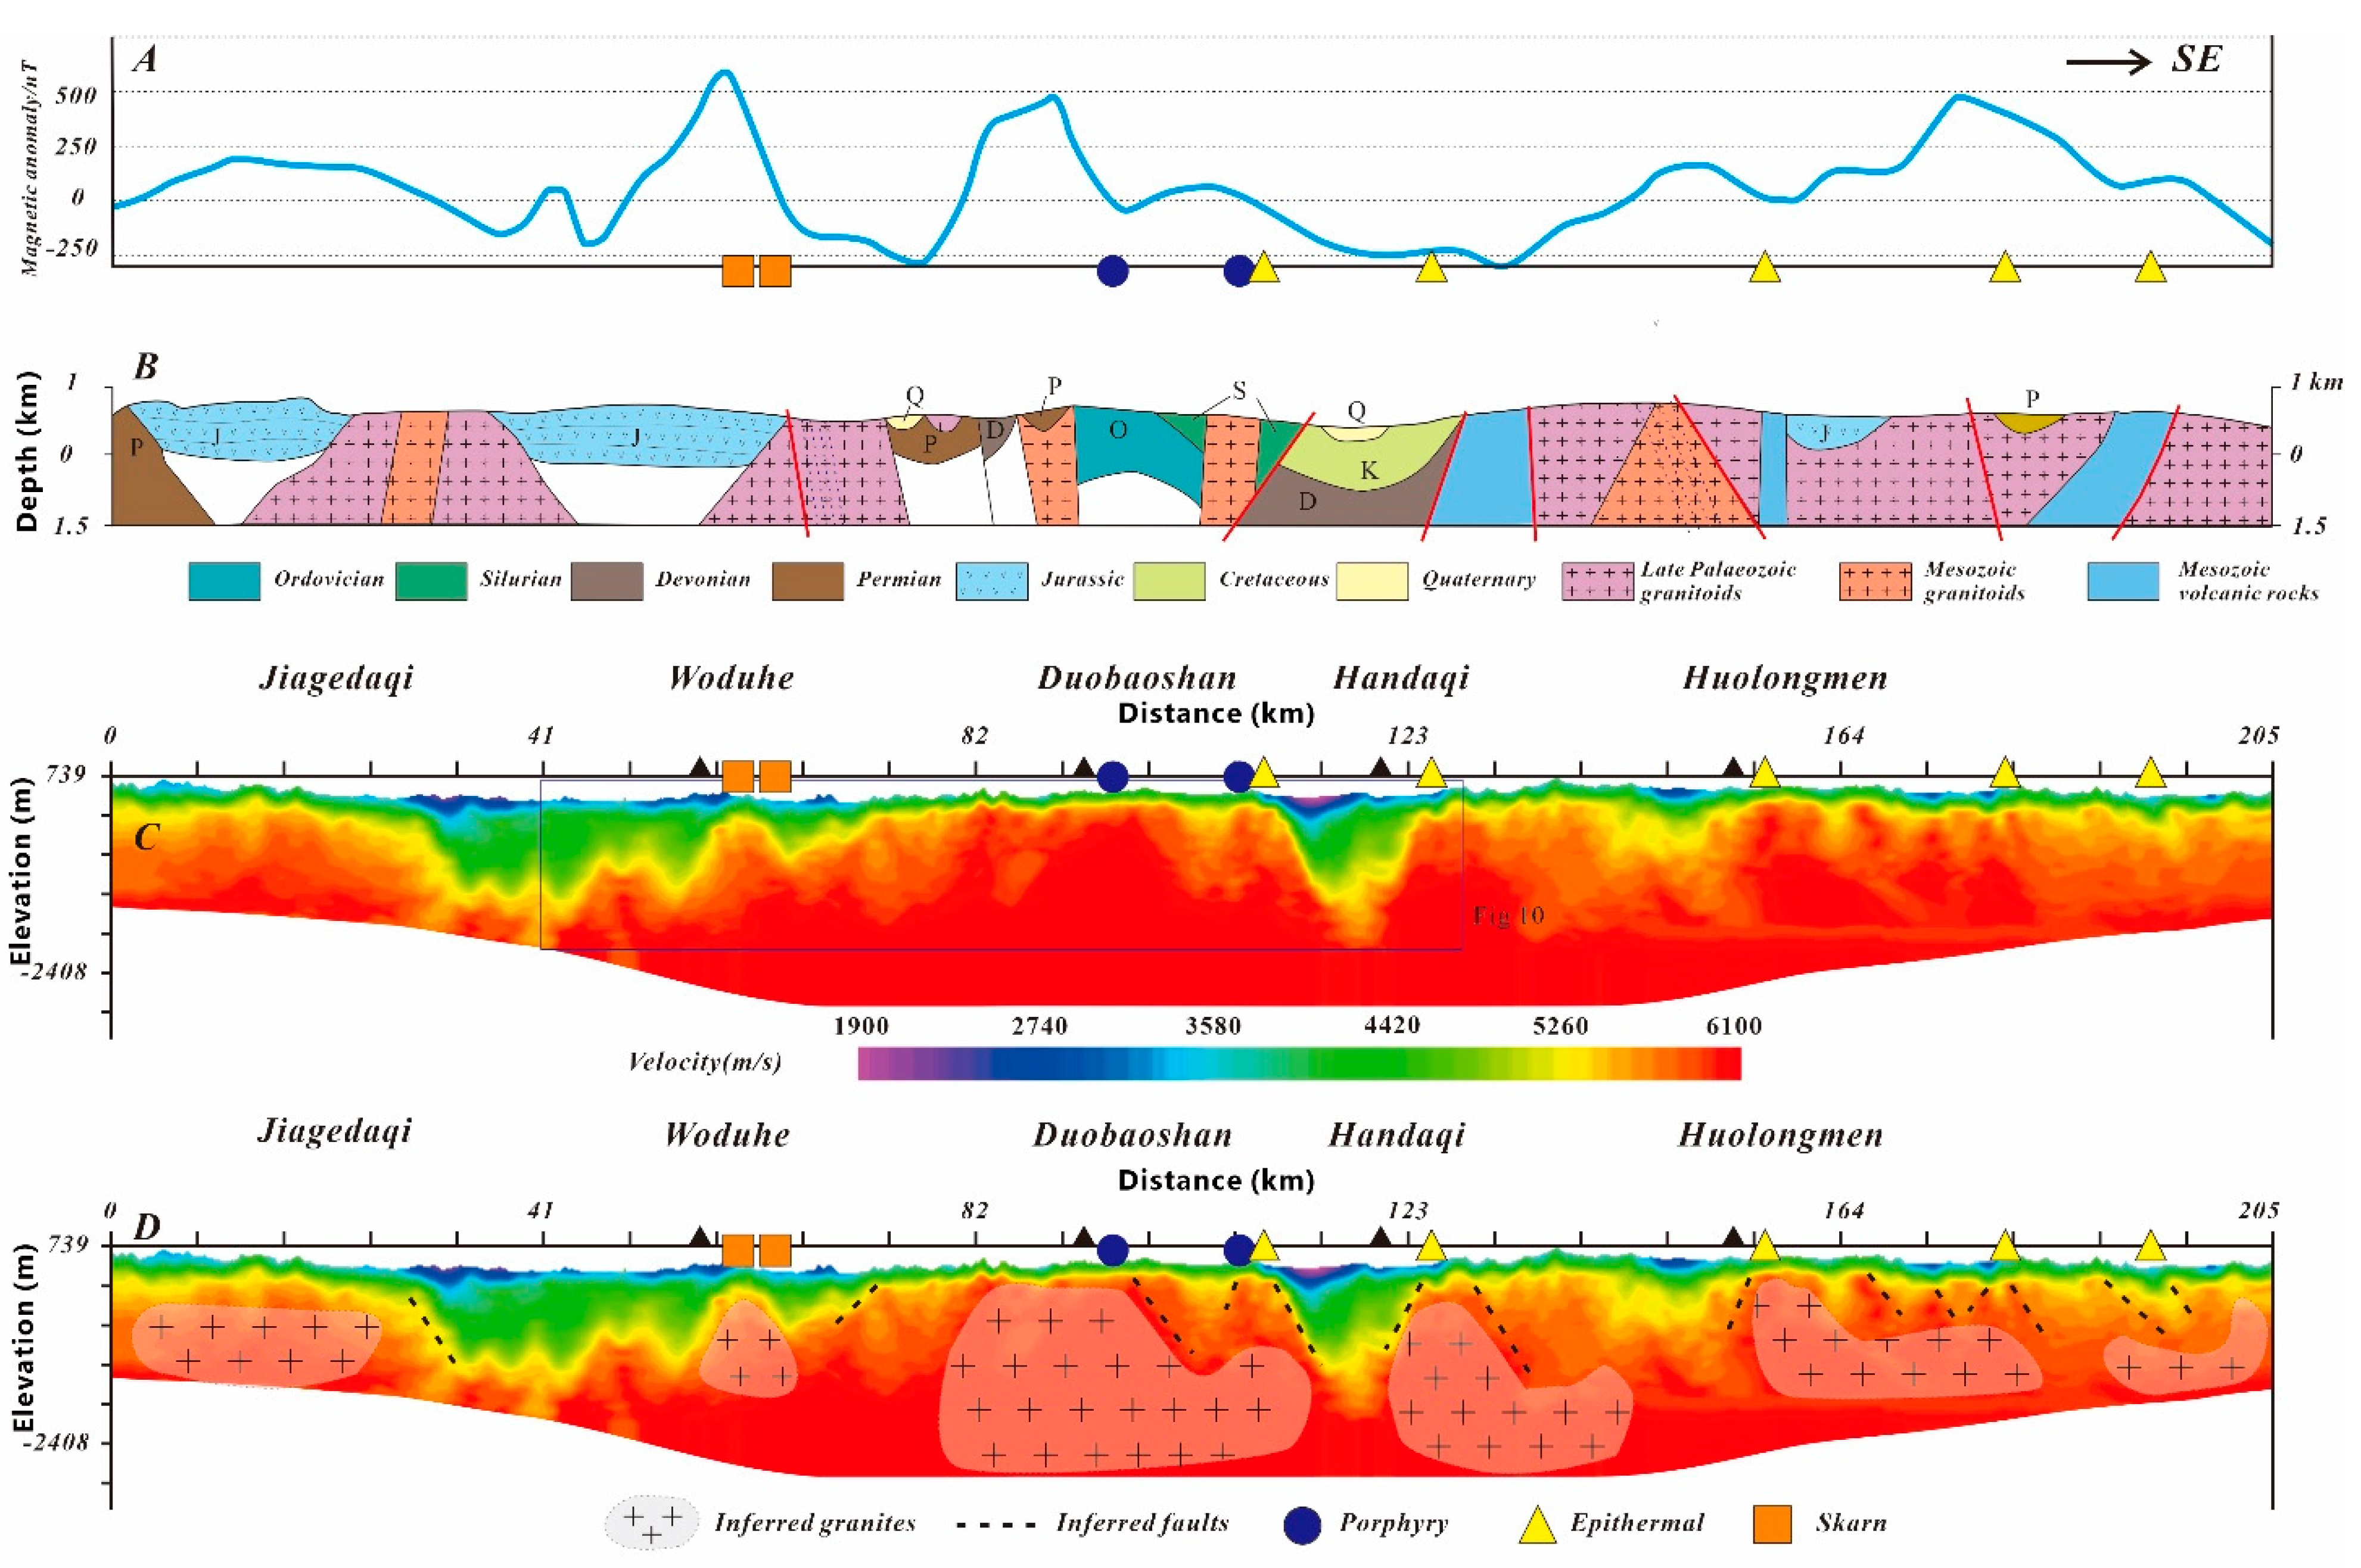
  • In the Duobaoshan ore district, the first-arrival seismic tomography profile shows multiple phases of undulating changes at the high-velocity interface, which may be related to multiple phases of magmatic activity. Based on the spatial distribution characteristics and velocity structure of each type of deposit, we can infer that the distribution of diorite and porphyry copper deposits in the Duobaoshan ore district is related to the occulted granite bodies, whereas the distribution of the epithermal Au deposits is related to the occulted fracture zones.
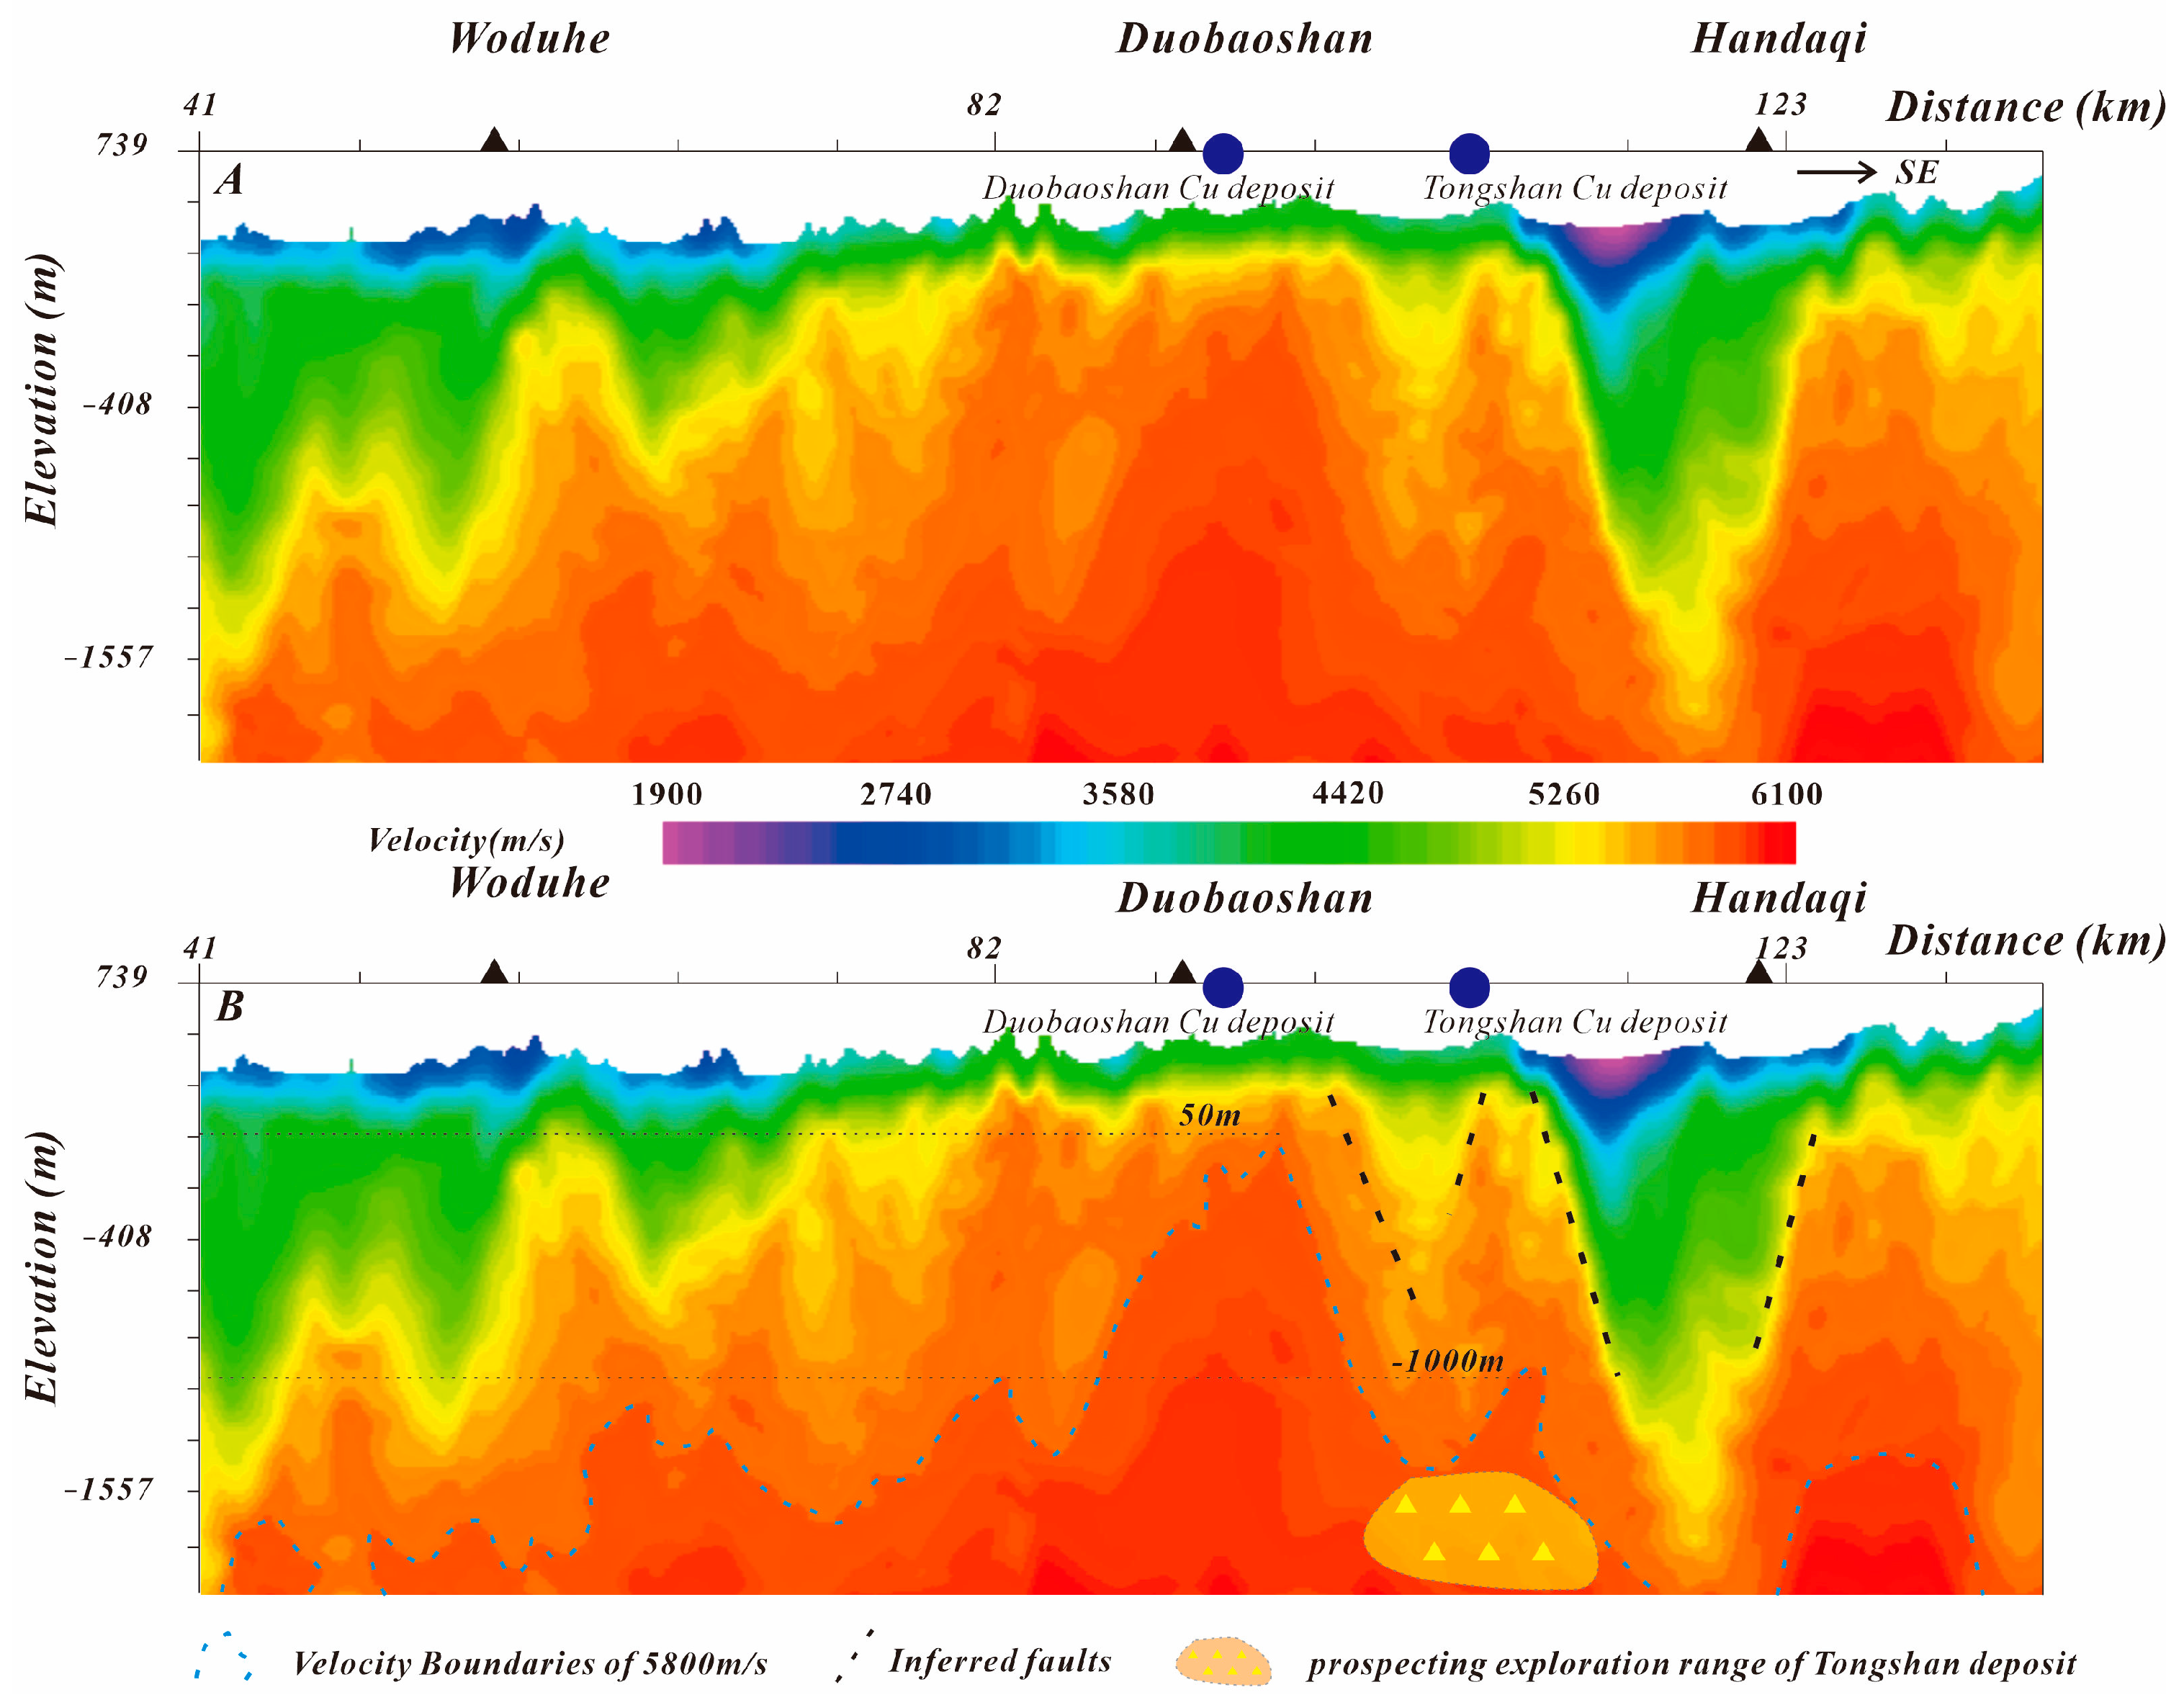
  • The velocity profile suggests that the porphyry body in the Tongshan deposit is likely buried at an elevation of approximately −1000 m, and the critical exploration area should therefore be below this elevation. The similar ages, geochemical characteristics, and velocity structures of the porphyry bodies indicate that they may be connected below the Duobaoshan and Tongshan deposits.
  • The velocity profile shows that there are several groups of occulted fractures beneath the deposits, and the strongest mineralization in the region occurs at the fracture−tectonic intersection. The copper and gold deposits, which are closely related to magmatic activities, fall within the high magnetic anomaly zone in the Duobaoshan ore district. The occulted fractures may have provided a channel for the transport of magma associated with mineralization.

Author Contributions

Conceptualization, H.H. and Z.P.; investigation, Z.P.; writing—original draft preparation, Z.P.; writing— review and editing, H.H., Z.P., W.F., X.D., J.Z. and H.Y.; formal analysis, W.F. and Z.P.; data curation, Z.P.; methodology, X.D. and Z.P.; funding acquisition, H.H. All authors have read and agreed to the published version of the manuscript.

Funding

China Geological Survey (Grant Nos. DD20190010, DD20160207, DD20221643-2) and the Natural Science Foundation of China (Grant Nos. 41474081).

Acknowledgments

This study was jointly supported by China Geological Survey (Grant Nos. DD20190010, DD20160207, DD20221643-2) and the Natural Science Foundation of China (Grant Nos. 41474081). We also thank Xiefan for her valuable advice, and Li Bing and Zhao Zhengsan for providing software (ToModel) and technical support. The authors would like to thank all the reviewers who participated in the review, as well as MJEditor (www.mjeditor.com, accessed on 15 June 2022) for providing English editing services during the preparation of this manuscript.

Conflicts of Interest

The authors declare no conflict of interest.

References

  1. Qu, H.; Li, C.L.; Yang, F.S. Zircon U-Pb ages, geochemical characteristics and their geological implication of granitic complex in Huolongmen area, northwestern Xiao Hinggan mountains. Glob. Geol. 2015, 34, 34–43. [Google Scholar]
  2. Gao, J.; Zhu, M.T.; Wang, X.S.; Hong, T.; Li, G.M.; Li, J.L.; Xiao, W.J.; Qin, K.Z.; Zeng, Q.D.; Shen, P.; et al. Large-scale porphyry-type mineralization in the Central Asian metallogenic domain:tectonic background, fluid feature and metallogenic deep dynamic mechanism. Acta Geol. Sin. 2019, 93, 24–71. [Google Scholar]
  3. Richards, J.P. Postsubduction porphyry Cu-Au and epithermal Au deposits: Products of remelting of subduction-modified lithosphere. Geology 2009, 37, 247–250. [Google Scholar] [CrossRef]
  4. Sillitoe, R.H. Porphyry copper systems. Econo. Geol. 2010, 105, 3–41. [Google Scholar] [CrossRef] [Green Version]
  5. Ge, W.C.; Wu, F.Y.; Zhou, C.Y.; Zhang, J.H. Porphyry Cu-Mo deposits in the eastern Xing’an-Mongolian Orogenic Belt: Mineralization ages and their geodynamic implications. Chin. Sci. Bull. 2007, 52, 3416–3427. [Google Scholar] [CrossRef]
  6. Wang, L.; Qin, K.Z.; Song, G.X.; Pang, X.Y.; Li, Z.Z.; Zhao, C.; Jin, L.Y.; Zou, X.Y.; Li, G.M. Volcanic-subvolcanic rocks and tectonic setting of the Zhengguang intermediate sulfidation epithermal Au-Zn deposit, eastern Central Asian Orogenic Belt, NE China. J. Asian Earth Sci. 2018, 165, 328–351. [Google Scholar] [CrossRef]
  7. Cui, G.; Wang, J.Y.; Zhang, J.X. U-Pb SHRIMP dating of zircon from Duobaoshan granodiorite in Heilongjiang and its geological significance. Global Geol. 2008, 27, 387–394. [Google Scholar]
  8. Wu, F.Y.; Lin, J.Q.; Wilde, S.A.; Zhang, X.O.; Yang, J.H. Nature and significance of the early cretaceous giant igneous event in eastern China. Earth Planet. Sci. Lett. 2005, 233, 103–119. [Google Scholar] [CrossRef]
  9. Wu, G.; Chen, Y.C.; Sun, F.Y.; Liu, J.; Wang, G.R.; Xu, B. Geochronology, geochemistry, and Sr–Nd–Hf isotopes of the Early Paleozoic igneous rocks in the Duobaoshan area, NE China, and their geological significance. J. Asian Earth Sci. 2015, 97, 229–250. [Google Scholar] [CrossRef]
  10. Cai, W.Y.; Wang, K.Y.; Li, J.; Fu, L.J.; Lai, C.K.; Liu, H.L. Geology, geochronology and geochemistry of large Duobaoshan Cu-Mo-Au ore field in NE China: Magma genesis and regional tectonic implications. Geosci. Front. 2021, 12, 265–292. [Google Scholar] [CrossRef]
  11. Cai, W.Y. Metallogenesis of Copper-Molybdenum-Gold Polymetallic in the Duobaoshan Orefield, Heilongjiang Province. Ph.D. Thesis, Jilin University, Changchun, China, 2021. [Google Scholar]
  12. Pang, X.Y.; Qin, K.Z.; Wang, L.; Song, G.X.; Li, G.M.; Su, S.Q.; Zhao, C. Deformation characteristics of the Tongshan fault within Tongshan porphyry copper deposit, Heilongjiang Province, and restoration of alteration zones and orebodies. Acta Petrol. Sin. 2017, 33, 398–414. [Google Scholar]
  13. Shi, J.M.; Lin, Z.F.; Hu, X. Discussion about the connection among aeromagnetic anomaly characteristics, geological structure and metallogenic belt in Daxinganling area. Prog. Geophys. 2014, 29, 110–115. [Google Scholar]
  14. Hou, H.; Gao, R.; He, R.; Liu, J.; Feng, S.; Guan, Y.; Cai, X.; Knapp, J.H.; Wu, F.T. Near-surface velocity structure and static correction of basin-mountain junction zone: Case study on the junction belt of western part of South Tianshan and Tarim Basin. Geophys. Prospect. Pet. 2010, 49, 7–11. [Google Scholar]
  15. Wu, F.Y.; Sun, D.Y.; Ge, W.C.; Zhang, Y.B.; Grant, M.L.; Wilde, S.A.; Jahn, B.M. Geochronology of the Phanerozoic granitoids in northeastern China. J. Asian Earth Sci. 2011, 41, 1–30. [Google Scholar] [CrossRef] [Green Version]
  16. Xie, F.; Wang, H.Y.; Hou, H.H.; Gao, R. Near-surface fine velocity structure in eastern segment of Central Asian Orogenic Belt: Revealed by first-arrival wave tomography from deep seismic reflection profile. J. Jilin Univ. 2021, 51, 584–596. [Google Scholar]
  17. Qin, K.Z.; Li, G.M.; Zhao, J.X.; Zhai, M.G.; Zeng, Q.D.; Gao, J.; Xiao, W.J.; Li, J.L.; Sun, S. Links of collage orogenesis of microcontinents and crust evolution to characteristic metallogeneses in China. Acta Petrol. Sin. 2017, 33, 305–325. [Google Scholar]
  18. Windley, B.F.; Alexeiev, D.; Xiao, W.; Kröner, A.; Badarch, G. Tectonic models for accretion of the Central Asian Orogenic belt. J. Geol. Soc. 2007, 164, 31–47. [Google Scholar] [CrossRef] [Green Version]
  19. Xiao, W.J.; Windley, B.F.; Hao, J.; Zhai, M.G. Accretion leading to collision and the Permian Solonker suture, Inner Mongolia, China: Termination of the central Asian Orogenic Belt. Tectonics 2003, 22, 1069–1090. [Google Scholar] [CrossRef] [Green Version]
  20. Zhou, J.B.; Cao, J.L.; Wilde, S.A.; Zhao, G.C.; Zhang, J.J.; Wang, B. Paleo-Pacific subduction-accretion: Evidence from geochemical and U-Pb zircon dating of the Nadanhada accretionary complex, NE China. Tectonics 2014, 33, 2444–2466. [Google Scholar] [CrossRef] [Green Version]
  21. Zhou, J.B.; Wilde, S.A.; Zhao, G.C.; Han, J. Nature and assembly of microcontinental blocks within the Paleo-Asian Ocean. Earth Sci. Rev. 2018, 186, 76–93. [Google Scholar] [CrossRef]
  22. Liu, J.; Li, Y.; Zhou, Z.H.; Ouyang, H.G. The Ordovician igneous rocks with high Sr /Y at the Tongshan porphyry copper deposit, satellite of the Duobaoshan deposit, and their metallogenic role. Ore Geol. Rev. 2017, 86, 600–614. [Google Scholar] [CrossRef]
  23. Zhou, J.B.; Wilde, S.A.; Zhang, X.Z.; Zhao, G.C.; Liu, F.L.; Qiao, D.W.; Ren, S.M.; Liu, J.H. A > 1300 km late Pan-African metamorphic belt in ne China: New evidence from the Xing an block and its tectonic implications. Tectonophysics 2011, 509, 280–292. [Google Scholar] [CrossRef]
  24. Liu, B.S.; Cheng, Z.X.; Zhang, C.P. Preliminary discussion on the effect of tectonic evolution on the superposition and transformation of the ore concentration area in Duobaoshan-Nenjiang. Miner. Resour. Geol. 2019, 33, 54–62. [Google Scholar]
  25. Li, Y.; Xu, W.L.; Wang, F.; Pei, F.P.; Tang, J.; Zhao, S. Triassic volcanism along the eastern margin of the Xing’an Massif, NE China: Constraints on the spatialtemporal extent of the Mongol-Okhotsk tectonic regime. Gondwana Res. 2017, 48, 205–223. [Google Scholar] [CrossRef]
  26. Zhou, J.B.; Wilde, S.A.; Zhang, X.Z.; Zhao, G.C.; Zheng, C.Q.; Wang, Y.J.; Zhang, X.H. The onset of Pacific margin accretion in NE China: Evidence from the Heilongjiang high-pressure metamorphic belt. Tectonophysics 2009, 478, 230–246. [Google Scholar] [CrossRef]
  27. Deng, K.; Li, Q.; Chen, Y.; Zhang, C.; Zhu, X.; Xu, Q. Geochronology, geochemistry and Sr-Nd-Pb-Hf isotopes of the Early Jurassic granodiorite from the Sankuanggou intrusion, Heilongjiang Province, Northeastern China: Petrogenesis and geodynamic implications. Lithos 2018, 296, 113–128. [Google Scholar] [CrossRef]
  28. Hao, Y.J. Mineralization and Metallogenic Regularity of Duobaoshan Ore Concentration Area in Heilongjiang Province, Northeast China. Ph.D. Thesis, Jilin University, Changchun, China, 2015. [Google Scholar]
  29. Zeng, Q.D.; Liu, J.M.; Chu, S.X.; Wang, Y.B.; Sun, Y.; Duan, X.X.; Zhou, L.L.; Qu, W.J. Re-Os and U-Pb geochronology of the Duobaoshan porphyry Cu-Mo-(Au) deposit, northeast China, and its geological significance. J. Asian Earth Sci. 2014, 79, 895–909. [Google Scholar] [CrossRef]
  30. Zhao, C.; Qin, K.Z.; Song, G.X.; Li, G.M.; Li, Z.Z.; Pang, X.Y.; Wang, L. Petrogenesis and tectonic setting of ore-related porphyry in the Duobaoshan Cu deposit within the eastern Central Asian Orogenic Belt, Heilongjiang Province, NE China. J. Asian Earth Sci. 2018, 165, 352–370. [Google Scholar] [CrossRef]
  31. Liu, J.; Wu, G.; Li, Y.; Zhu, M.T.; Zhong, W. Re–Os sulfide (chalcopyrite, pyrite and molybdenite) systematics and fluid inclusion study of the Duobaoshan porphyry Cu (Mo) deposit, Heilongjiang Province, China. J. Asian Earth Sci. 2012, 49, 300–312. [Google Scholar] [CrossRef]
  32. Bai, L.A.; Sun, J.G.; Gu, A.L.; Zhao, K.Q.; Sun, Q.L. A review of the genesis, geochronology, and geological significance of hydrothermal copper and associated metals deposits in the Great Xing’an Range, NE China. Ore Geol. Rev. 2014, 61, 192–203. [Google Scholar] [CrossRef]
  33. Hao, Y.J.; Ren, Y.S.; Duan, M.X.; Zhao, X.; Yang, Q.; Tong, K.Y.; Li, C. Mineralization time and tectonic setting of the Zhengguang Au deposit in the Duobaoshan ore field, Heilongjiang Province, NE China. Arab. J. Geosci. 2016, 9, 655–675. [Google Scholar] [CrossRef]
  34. Gao, J.; Klemd, R.; Zhu, M.; Wang, X.; Li, J.; Wan, B.; Xiao, W.; Zeng, Q. Large-scale porphyry-type mineralization in the Central Asian metallogenic domain: A review. J. Asian Earth Sci. 2017, 165, 7–36. [Google Scholar] [CrossRef]
  35. Wang, Y.; Yang, X.P.; Na, F.C.; Zhang, G.Y.; Kang, Z.; Liu, Y.C.; Zhang, W.L.; Mao, Z.X. Determination and geological implication of the granitic mylonite in Nenjiang-Heihe tectonic belt. Geol. Res. 2013, 22, 452–459. [Google Scholar]
  36. Zhao, Z.H.; Zheng, W.Z.; Qu, H.; Guo, Y.; Li, C.L.; Wang, Z.; Zhang, J.F. Cu-Au mineralization and metallogenic regularity of Duobaoshan area, Heilongjiang Province. Miner. Depos. 2012, 31, 601–614. [Google Scholar]
  37. Han, Z.X.; Xu, Y.Q.; Zheng, Q.D. Metallogenetic Series and Evolution of Significant Metal and Nonmetal Mineral Resources in Heilongjiang Province; Heilongjiang People Publishing: Harbin, China, 2004; pp. 1–241. [Google Scholar]
  38. Li, D.R.; LV, F.L.; Liu, S.Y.; LV, J. Geological features and prospecting orientation of the Sankuanggou Cu-Mo-Au deposit in Nenjiang county, Heilongjiang province. Geol. China 2011, 38, 415–426. [Google Scholar]
  39. Du, Q.; Ma, X.Y.; Han, C.M.; Li, Z.Y.; Jiang, X.L. Genetic Discussion on Porphyry Copper Deposit; Geological Publishing House: Beijing, China, 2008. [Google Scholar]
  40. Li, Z.T.; Wang, X.J.; Wang, H.B.; Wu, G. Geology of the Sankuanggou gold bearing iron-copper deposit in Nenjiang County, Heilongjiang Province. Geol. Resour. 2008, 17, 170–174. [Google Scholar]
  41. Liu, Z.K.; Wu, Y.G.; Liu, Y.J. Near-surface static correction method using first-arrival traveltimes velocity tomography. Chin. J. Geophys. 1995, 38, 153–159. [Google Scholar]
  42. Hole, J.A. Nonlinear high-resolution three-dimensional seismic travel time tomography. J. Geophys. Res. Solid Earth 1992, 97, 6553–6562. [Google Scholar] [CrossRef]
  43. Wang, C.Y.; Zeng, X.K.; Ding, Z.F.; Hong, R.; Zhao, D.H. Finite-difference tomography of upper crustal structure in Dabieshan Orogenic Belt. Chin. J. Geophys. 1997, 40, 495–502. [Google Scholar]
  44. Du, Y.J. The Metallogenic Characteristics and Prospecting Direction of Duobaoshan Cu-Au Metallogenic Belt, Heilongjiang Province. Ph.D. Thesis, Jilin University, Changchun, China, 2012. [Google Scholar]
  45. Li, J.G.; Zhao, B.; Sun, S.W.; Zhou, X.P.; Sun, Y.; Song, L.F.; Huang, Q.; Xiang, B.; Xiao, K. Application of seismic first arrival tomographic inversion on the exploration of polymetallic mine. Geoscience 2012, 26, 1218. [Google Scholar]
  46. Li, Y. The Study of the Main Rock and Typical Deposits in the North of Duobaoshan District, Heilongjiang Province. Ph.D. Thesis, China University of Geosciences, Beijing, China, 2016. [Google Scholar]
  47. Hao, Y.J.; Ren, Y.S.; Duan, M.X.; Tong, K.Y.; Chen, C.; Yang, Q.; Li, C. Metallogenic events and tectonic setting of the Duobaoshan ore field in Heilongjiang Province, NE China. J. Asian Earth Sci. 2015, 97, 442–458. [Google Scholar] [CrossRef]
  48. Liu, J.M.; Zhnag, R.; Zhang, Q.Z. The regional metallogeny of Da hinggan ling, China. Earth Sci. Front. 2004, 11, 269–277. [Google Scholar]
  49. Zhao, C.; Qin, K.Z.; Song, G.X.; Li, G.M. Switch of geodynamic setting from the Paleo-Asian Ocean to the Mongol-Okhotsk Ocean: Evidence from granitoids in the Duobaoshan ore field, Heilongjiang Province, Northeast China. Lithos 2019, 336–337, 202–220. [Google Scholar] [CrossRef]
  50. Jiang, W.W.; Zhou, L.H.; Xiao, D.Q.; Gao, J.R.; Yuan, S.Q.; Tu, G.H.; Zhu, D.Y. The characteristics of crust structure and the gravity and magnetic fields in northeast region of China. Prog. Geophys. 2006, 21, 730–738. [Google Scholar]
  51. Shi, D.N.; Lü, Q.T.; Xu, W.Y.; Yan, J.Y.; Zhao, J.H.; Dong, S.W.; Chang, F.Y. Crustal structures beneath the mid-lower Yangtze Metallogenic belt and its adjacent regions in eastern China—Evidences from P-wave receiver function imaging for a MASH metallization process? Acta Geol. Sin. 2012, 86, 389–399. [Google Scholar]
  52. Yuan, M.W.; Li, S.R.; Li, C.L.; Santosh, M.; Alam, M.; Zeng, J.Y. Geochemical and isotopic composition of auriferous pyrite from the Yongxin gold deposit, Central Asian Orogenic Belt: Implication for ore genesis. Ore Geol. Rev. 2018, 93, 255–267. [Google Scholar] [CrossRef]
  53. Zhao, C.; Qin, K.Z.; Song, G.X.; Li, G.M.; Mao, J.W. The Triassic Duobaoshan appinite-granite suite, NE China: Implications for a water-fluxed lithospheric mantle and an extensional setting related to the subduction of the Mongol-Okhotsk Ocean. Lithos 2021, 394–395, 106169. [Google Scholar] [CrossRef]
Figure 1. (A) Regional geophysical anomalies of the Duobaoshan ore district and adjacent regions. (B) Regional geological map of the Duobaoshan ore district and adjacent regions.
Minerals 12 00959 g001
Figure 2. Magmatism and mineralization of the main deposits in the Duobaoshan ore district [10].
Minerals 12 00959 g002
Figure 3. Flow chart of tomographic inversion processing.
Minerals 12 00959 g003
Figure 4. Example of first-arrival travel time picking (Red line represents the picked first-arrival travel time). The position is shown in Figure 1B with Typical CHAN.
Minerals 12 00959 g004
Figure 5. (A) Results of the conversion of coordinates of the deep seismic profile (shot-receiver distance and time). (B) Initial model.
Minerals 12 00959 g005
Figure 6. Iterative convergence curves of the tomographic inversion.
Minerals 12 00959 g006
Figure 7. (A) Picked first-arrival times (red) and (B) theoretical first-arrival times (blue) after tomographic inversion.
Minerals 12 00959 g007
Figure 8. Tomographic inversion results. (A) Velocity profile of first-arrival seismic tomography inversion. (B) Ray pathways of first-arrival seismic tomography inversion.
Minerals 12 00959 g008
Figure 9. Tomographic inversion results and interpretation. (A) Magnetic anomalies along deep seismic profile. (B) Geological profile. (C) Velocity profile of first-arrival seismic tomography inversion. (D) Interpretation of velocity structure.
Minerals 12 00959 g009
Figure 10. Velocity profile of the Tongshan and Duobaoshan porphyry Cu-Mo-(Au) deposits. (A) Velocity profile of first-arrival seismic tomography inversion (B) Interpretation of velocity structure.
Minerals 12 00959 g010
Publisher’s Note: MDPI stays neutral with regard to jurisdictional claims in published maps and institutional affiliations.

