Article

Effect of Stabilizer on Gold Leaching with Thiourea in Alkaline Solutions

1
School of Chemical & Environmental Engineering, China University of Mining & Technology, Beijing 100083, China
2
National Engineering Research Center for Environment-Friendly Metallurgy in Producing Premium Non-Ferrous Metals, GRINM Resources and Environment Tech. Co., Ltd., Beijing 101407, China
3
GRIMAT Engineering Institute Co., Ltd., Beijing 101407, China
*
Author to whom correspondence should be addressed.
Minerals 2022, 12(1), 89; https://doi.org/10.3390/min12010089
Submission received: 15 October 2021 / Revised: 6 January 2022 / Accepted: 11 January 2022 / Published: 13 January 2022
(This article belongs to the Section Mineral Processing and Extractive Metallurgy)

Abstract

:
The present work investigated the comparison of the effects of Na2SO3 and Na2SiO3 on thiourea stabilization, and a systematic study was undertaken to establish the effects of these stabilizers on the stability of alkaline thiourea, both qualitatively and quantitatively. The effects of these stabilizers on the activation energy of alkaline thiourea gold leaching was also studied. The results showed that sodium silicate was more suitable as a stabilizer in this system than sodium sulfite because the peak current of gold dissolution with sodium sulfite was higher than that with sodium silicate, but the inhibition of thiourea decomposition by the former was less obvious than that of sodium silicate in the cyclic voltammetry curve. The quartz crystal microbalance results showed that the quality decreased to about 100 ng cm2 in the presence of a stabilizer, while it increased to 300 ng cm2 in the absence of the stabilizer. It is inferred that gold can be dissolved by alkaline thiourea in the presence of a stabilizer, while it cannot without a stabilizer because of the decomposition of thiourea. This assumption was confirmed by atomic force microscopy measurements. The surface activation energy of Au dissolution decreased from 183.76 to 98.07 kJ/moL with the addition of sodium silicate, indicating that Au dissolution was promoted with the chemical.

1. Introduction

Thiourea leaching of gold has attracted much attention because of its environmentally friendliness. Gold recovery from high-grade e-waste, uranium tailing material, mature dumps, etc., using thiourea leaching has been widely studied [1,2,3,4,5]. In recent years, to overcome the disadvantages of acidic thiourea gold leaching, research has been undertaken on alkaline thiourea gold leaching to obtain a milder co-dissolution of base metals, less thiourea destruction/consumption, less corrosion of equipment and greater environmentally friendliness [6,7,8,9]. Research on thiourea decomposition in alkaline media has shown that stabilizers such as Na2SO3 and Na2SiO3 could prohibit thiourea decomposition to some extent and improve thiourea stabilization [10]. Based on a molecular-field analysis, and with the application of HYCHEM technology software, Chai et al. studied the mechanism of molecular thiourea stability in terms of the molecular field, by comparing the highest occupation molecule orbit (HOMO) of a thiourea molecule in related media [11,12,13,14], the result of which helped to establish the structure–activity correlation between the stabilizer and the construction/stabilization of thiourea. This provides a theoretical basis for finding economic alkaline thiourea stabilizers. The HOMO energy of the thiourea molecule in acidic media is much lower than that in alkaline media, suggesting that thiourea is relatively unstable in alkaline media. The addition of sulfite ions in alkaline media can form a stable loop structure with thiourea via lone pair electrons, which reduces the HOMO energy of the thiourea molecule in alkaline media from −3.403572 to −4.534400 eV and improves the stability of alkaline thiourea [15,16]. Mohammed R. Ahmed et al. showed that the presence of sodium sulfite can significantly reduce thiourea decomposition, accelerate the gold dissolution process, decrease the leaching time, and lower the activation energy of gold dissolution [2]. The activation energy with sodium sulfite is 7.62 kJ moL−1, which is much lower than 9.32 kJ moL−1 in the absence of sodium sulfite. The low activation energy confirms the surface reaction dissolution mechanism.
It has been shown that the polarization current density of gold in an alkaline thiourea solution is slightly less than that in an acidic solution from the anodic polarization curve, but gold dissolves more easily than its usual companions and common associated elements, such as silver, copper, nickel, iron and so on, and has the tendency toward preferential dissolution [17].
A quartz crystal microbalance (QCM) is an instrument used to measure the change in the surface quality of the electrode based on the piezoelectric effect of a quartz crystal. The relationship between the quality of the metal film deposited on the surface of the quartz crystal electrode and the change in the frequency of the quartz crystal is represented by the Sauerbrey equation ΔF = −KF2ΔM/A [18]. QCM-D has been reported in the field of metal corrosion, and in recent years, more and more attention has been paid to the interaction between minerals and reagents. In the research on electrochemical workstations and QCM (EQCM), the anodic dissolution of zinc was studied by cyclic voltammetry and the concentration of Zn (I) on the surface of zinc was calculated by using the results of QCM, while the kinetic constants of secondary electron transfer of zinc were also estimated [19]. A study was also performed on the oxidation-reduction mechanism of silver electrode by EQCM [20]. The corrosion of Au in dodecanethiol was studied by means of QCM and AFM, and the kinetic equation of the initial corrosion of Au in dodecanethiol was determined [21]. The leaching of gold in a cyanide-copper-ammonia oxygenated solution was studied by means of QCM. The dissolution of gold was monitored by changing the concentration of copper ions and ammonia [22]. Using the quartz crystal microbalance with dissipation (QCM-D) technique, the leaching kinetics of gold using sodium dicyanamide as a leaching agent with and without potassium ferrocyanide were studied [23]. The mechanism of amine collectors in reverse flotation of quartz from phosphorite veins was studied by using QCM, and the adsorption process of GP193G75 on the surface of hydroxylapatite was also studied by using QCM with energy dissipation function [24]. There are no reports on the kinetic study of alkaline thiourea gold leaching systems by quartz crystal microbalance electrochemical workstations. The application of QCM-D in the above fields can be used for reference in the study of the kinetics of alkaline thiourea leaching gold systems.
According to the structure-activity correlation between the stabilizer and thiourea, sodium sulfite and sodium silicate are qualified as stabilizers. A comparison of the effects of Na2SO3 and Na2SiO3 on thiourea stabilization needs to be established based on the existing research results. The present work was novel because it made a systematic study to determine the effects of these stabilizers on the stability of alkaline thiourea and the activation energy of alkaline thiourea gold leaching. In addition, in this study, along with the presentation of electrochemical measurements (including cyclic voltammetry curves, and the steady state polarization method) that can be used to select the Na2SO3 or Na2SiO3 stabilizer, quartz-crystal microbalance (QCM-D), which is a new method for gold leaching, and atomic force microscopy were used to study the effects of the stabilizers on thiourea stabilization. The Tafel curve method and activation energy calculations were used to establish the effects of the stabilizers on the system.

2. Experimental

2.1. Reagents

Reagent grade thiourea was purchased from Shanghai Lingfeng Chemical Reagent Co., Ltd. (Shanghai, China). Reagent grade sodium silicate and sodium sulfite were purchased from Tianjin Guangfu Technology Development Co., Ltd. (Tianjin, China). All solutions were made from analytical reagents with deionized water.

2.2. Instrumentation

The Au electrode was a customized thin gold chip (1.5 cm diameter, 99.99% Au), and quartz crystals were purchased from Biolin Scientific AB (Västra Frölunda, Sweden). A Q-sense E4 Quartz crystal microbalance (QCM-D, Biolin Scientific AB) was used to measure the quality, frequency, and conformation changes on the surface of the gold chips. A PAR 273 A electrochemical station (USA EG&G Princeton Applied Research Company, Oak Ridge, TN, USA) was used to measure the electrochemical behaviors. The electrode configuration was a triple-electrode system [25]. The Au electrode was the working electrode, the Ag/AgCl electrode (the potential reference value is SSE) was the reference electrode, and the graphite electrode was the auxiliary electrode.
An Agilent AFM 5500 (Santa Clara, CA, USA) with a tapping mode cantilever (V-shaped cantilever configuration) was used to take the AFM images at a scan rate between 2.9 and 3.52 Hz.

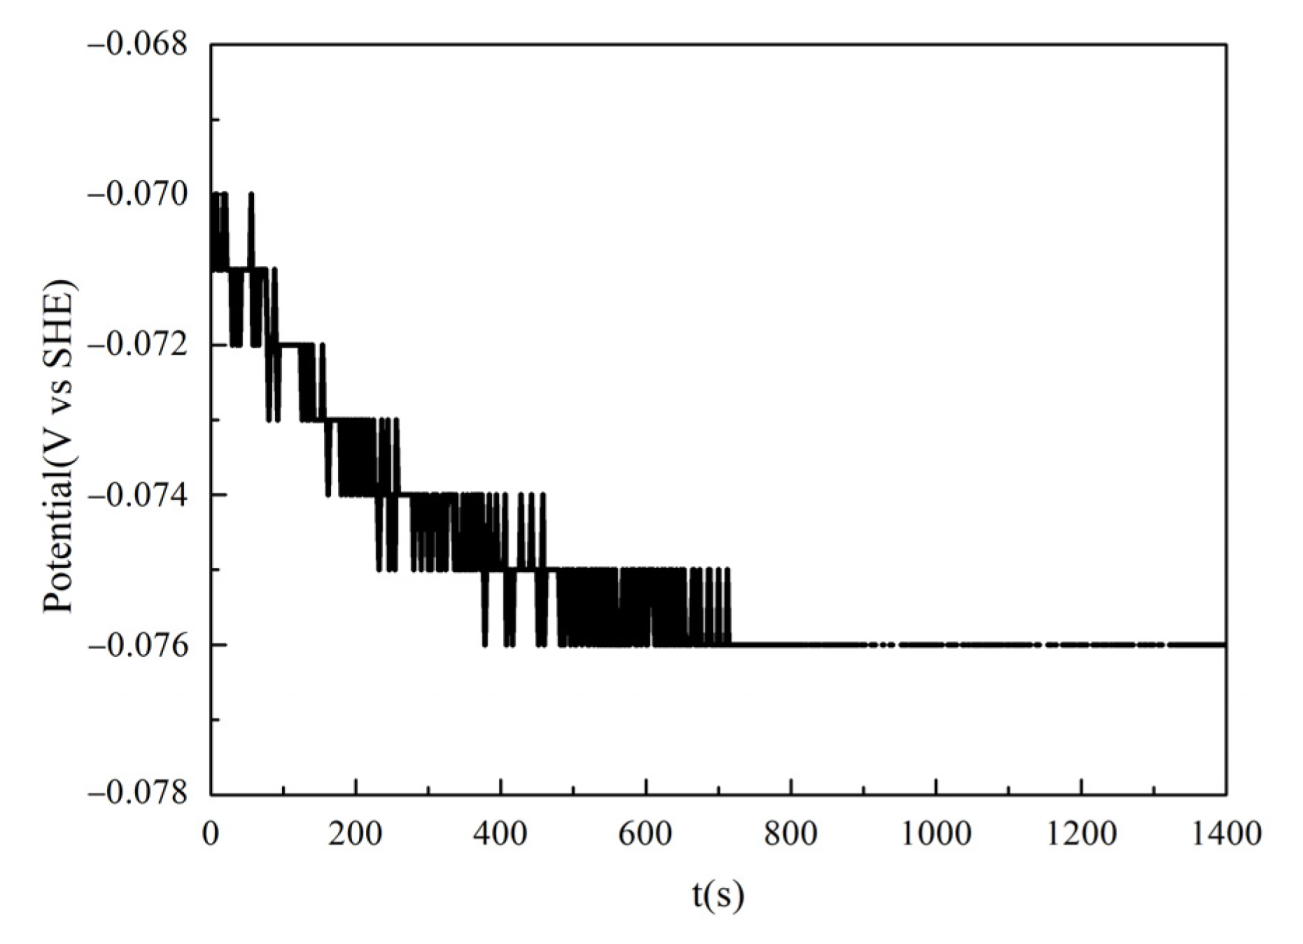
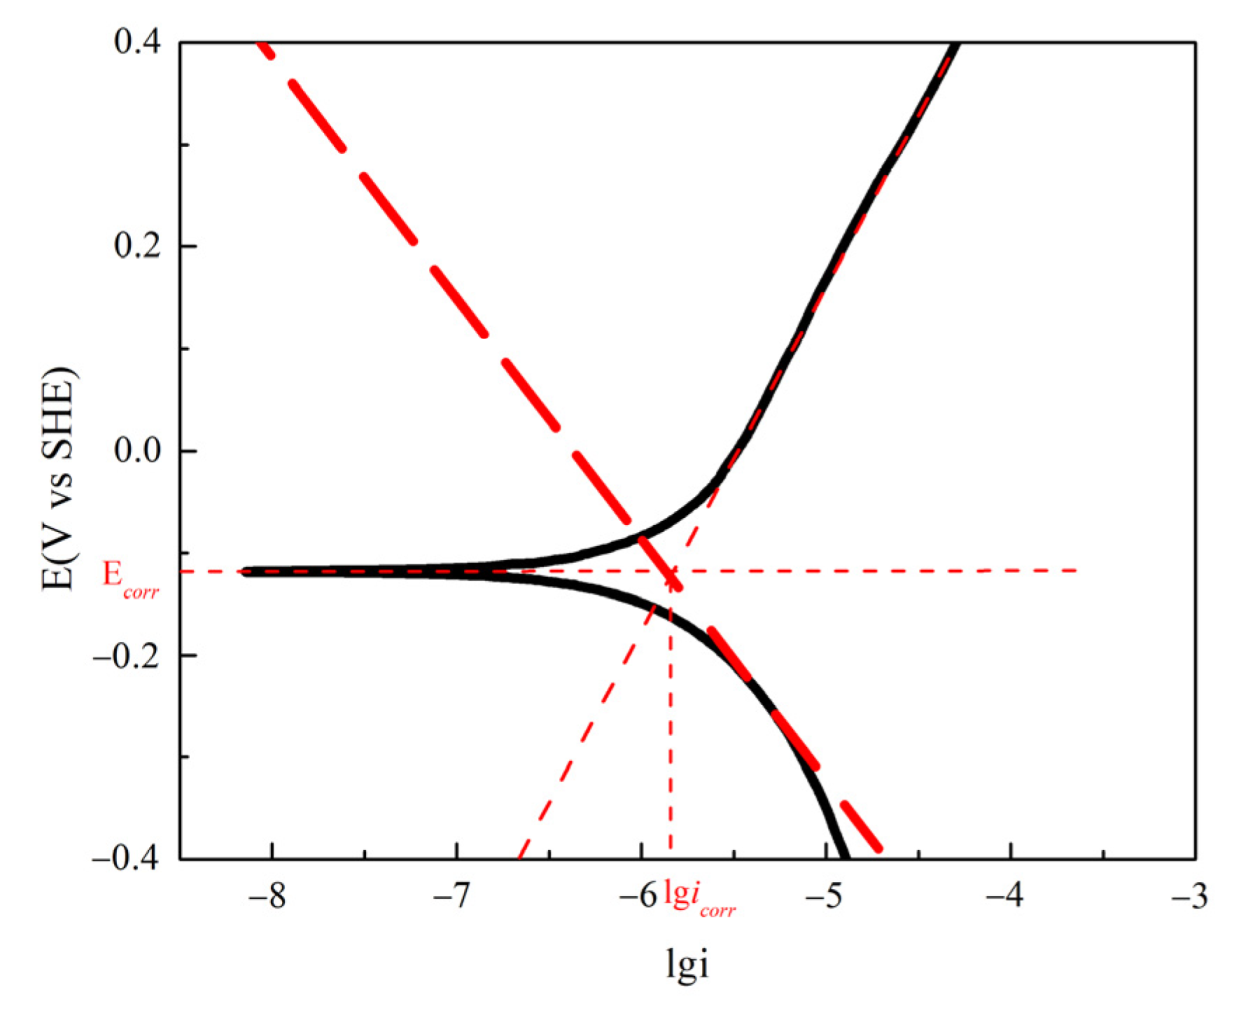
2.3. Electrochemical Measurements

Electrochemical behaviors were measured by the cyclic voltammetry and the steady state polarization methods. Prior to the experiment, the Au working surface was polished to a mirror surface with 2000-mesh metallographic sandpaper, washed three times with alcohol, and cleaned with distilled water. The counter and reference electrodes were placed in a fixture. A 1 × 10⁻⁴ m2 surface area was contacted with the solutions. The pH was adjusted by using NaOH solution. The potentials in this study were converted to potentials of standard hydrogen electrode (vs. SHE).

2.4. Measurements on Quartz Crystal Microbalance with Dissipation

All measurements on the quartz crystal microbalance with dissipation were performed at 25 degrees Celsius (±0.02 °C). A thiourea solution of 0.15 M concentration was prepared using deionized water. Two groups of experiments were conducted, with zero and 0.09 M sodium silicate in the solution, respectively. The pH of the solution was adjusted to 11.0 (±0.1) using NaOH. The flow rate of the solution was controlled at 100 μL/min. When the curve was stable, a solvent was added using the pump to achieve the baseline value [26,27,28,29].

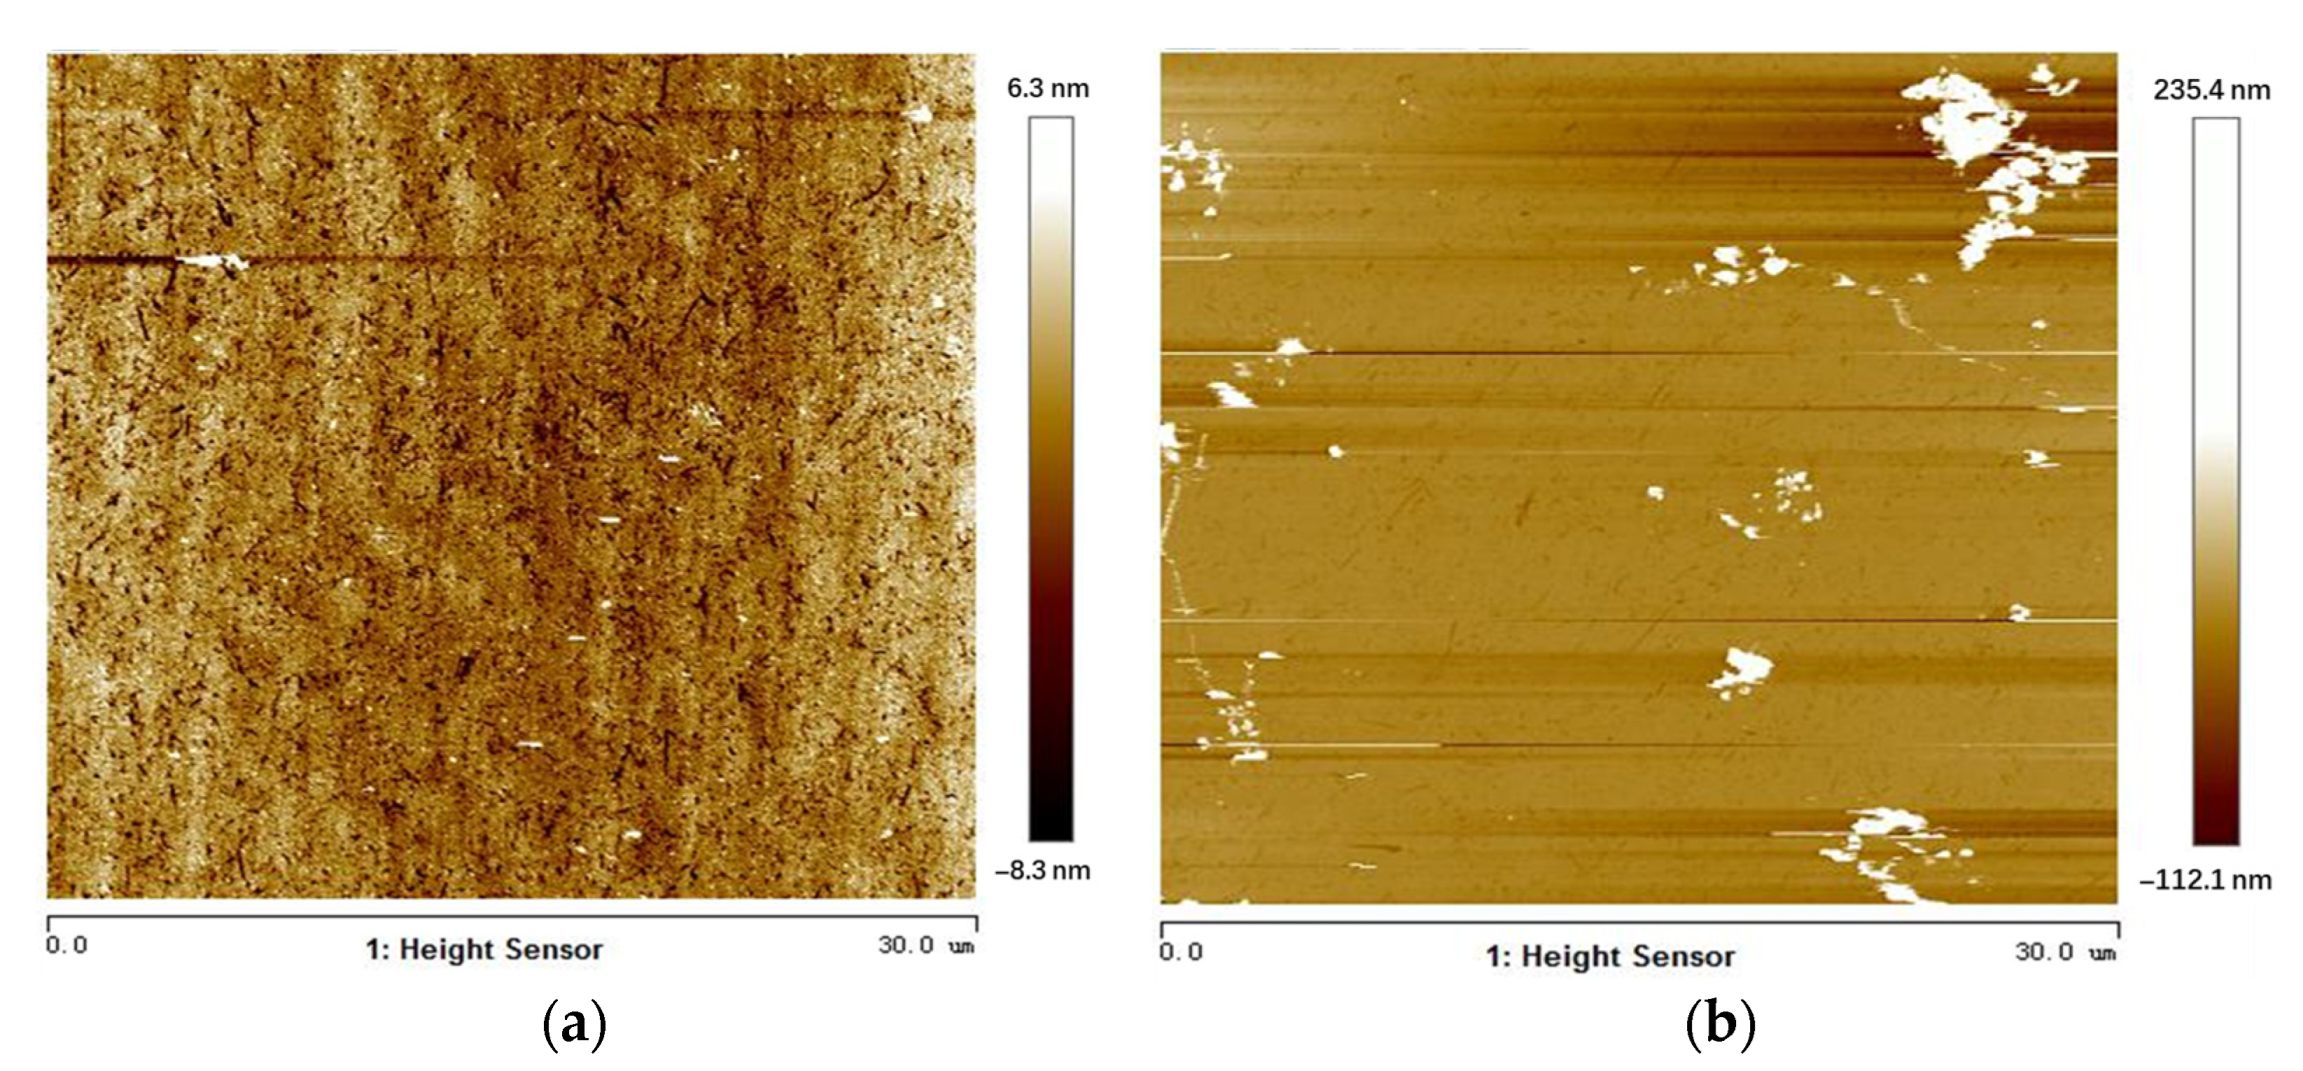
2.5. The Measurements on Atomic Force Microscope

The gold chip measured by the quartz crystal microbalance was dried for 2 h, and the surfaces were tested using an atomic force microscope [30]. The corrosion and adsorption of the gold chip surface were evaluated using nanoscope analysis software.

3. Results and Discussion

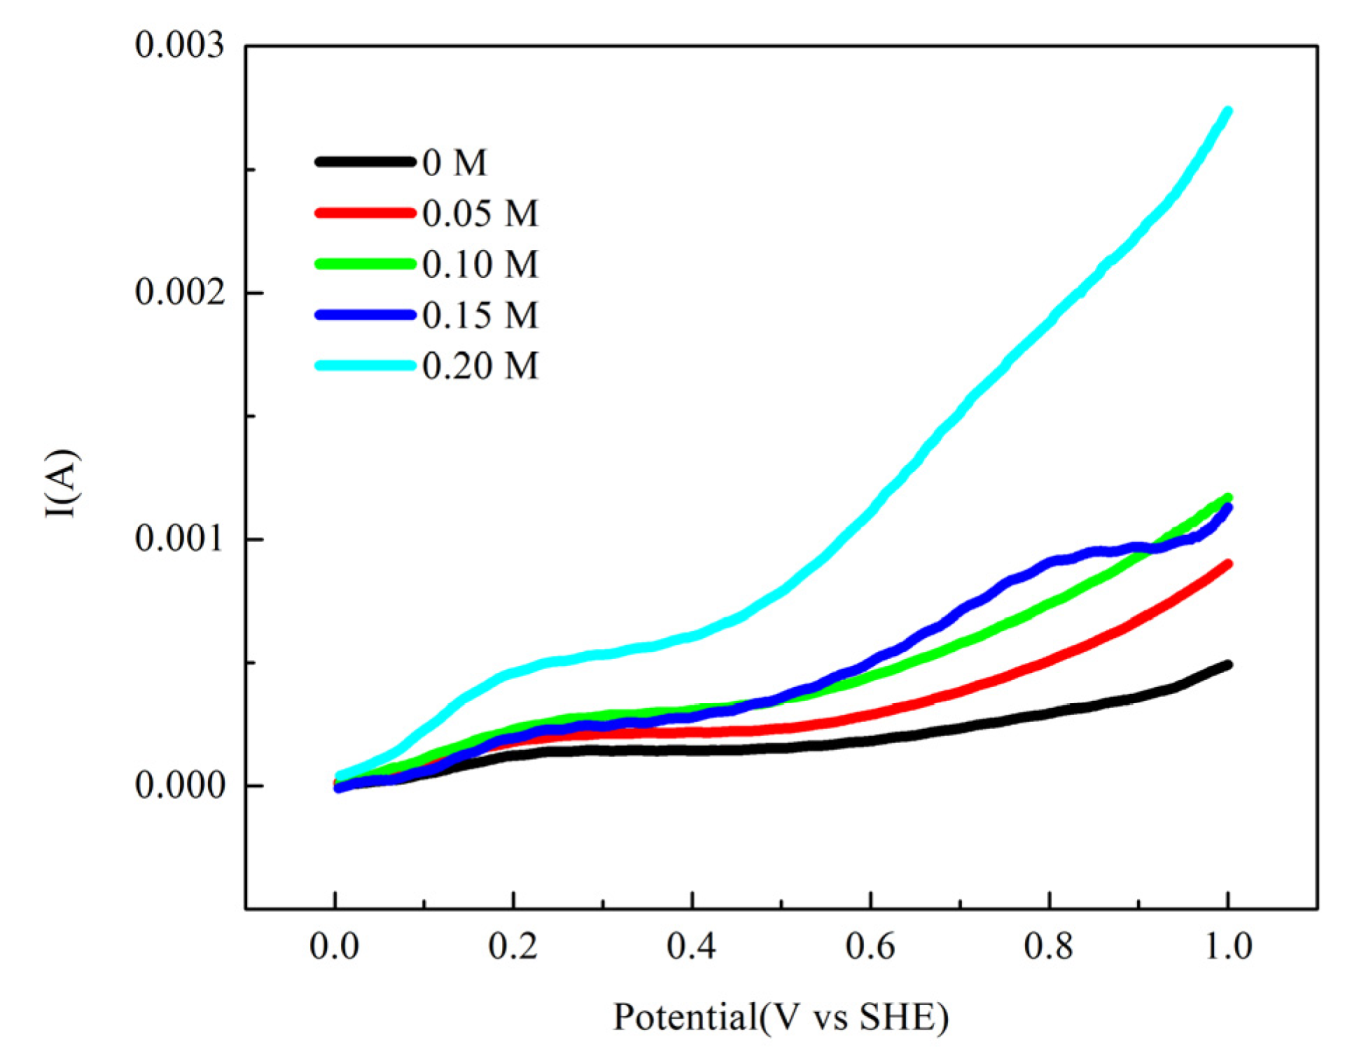
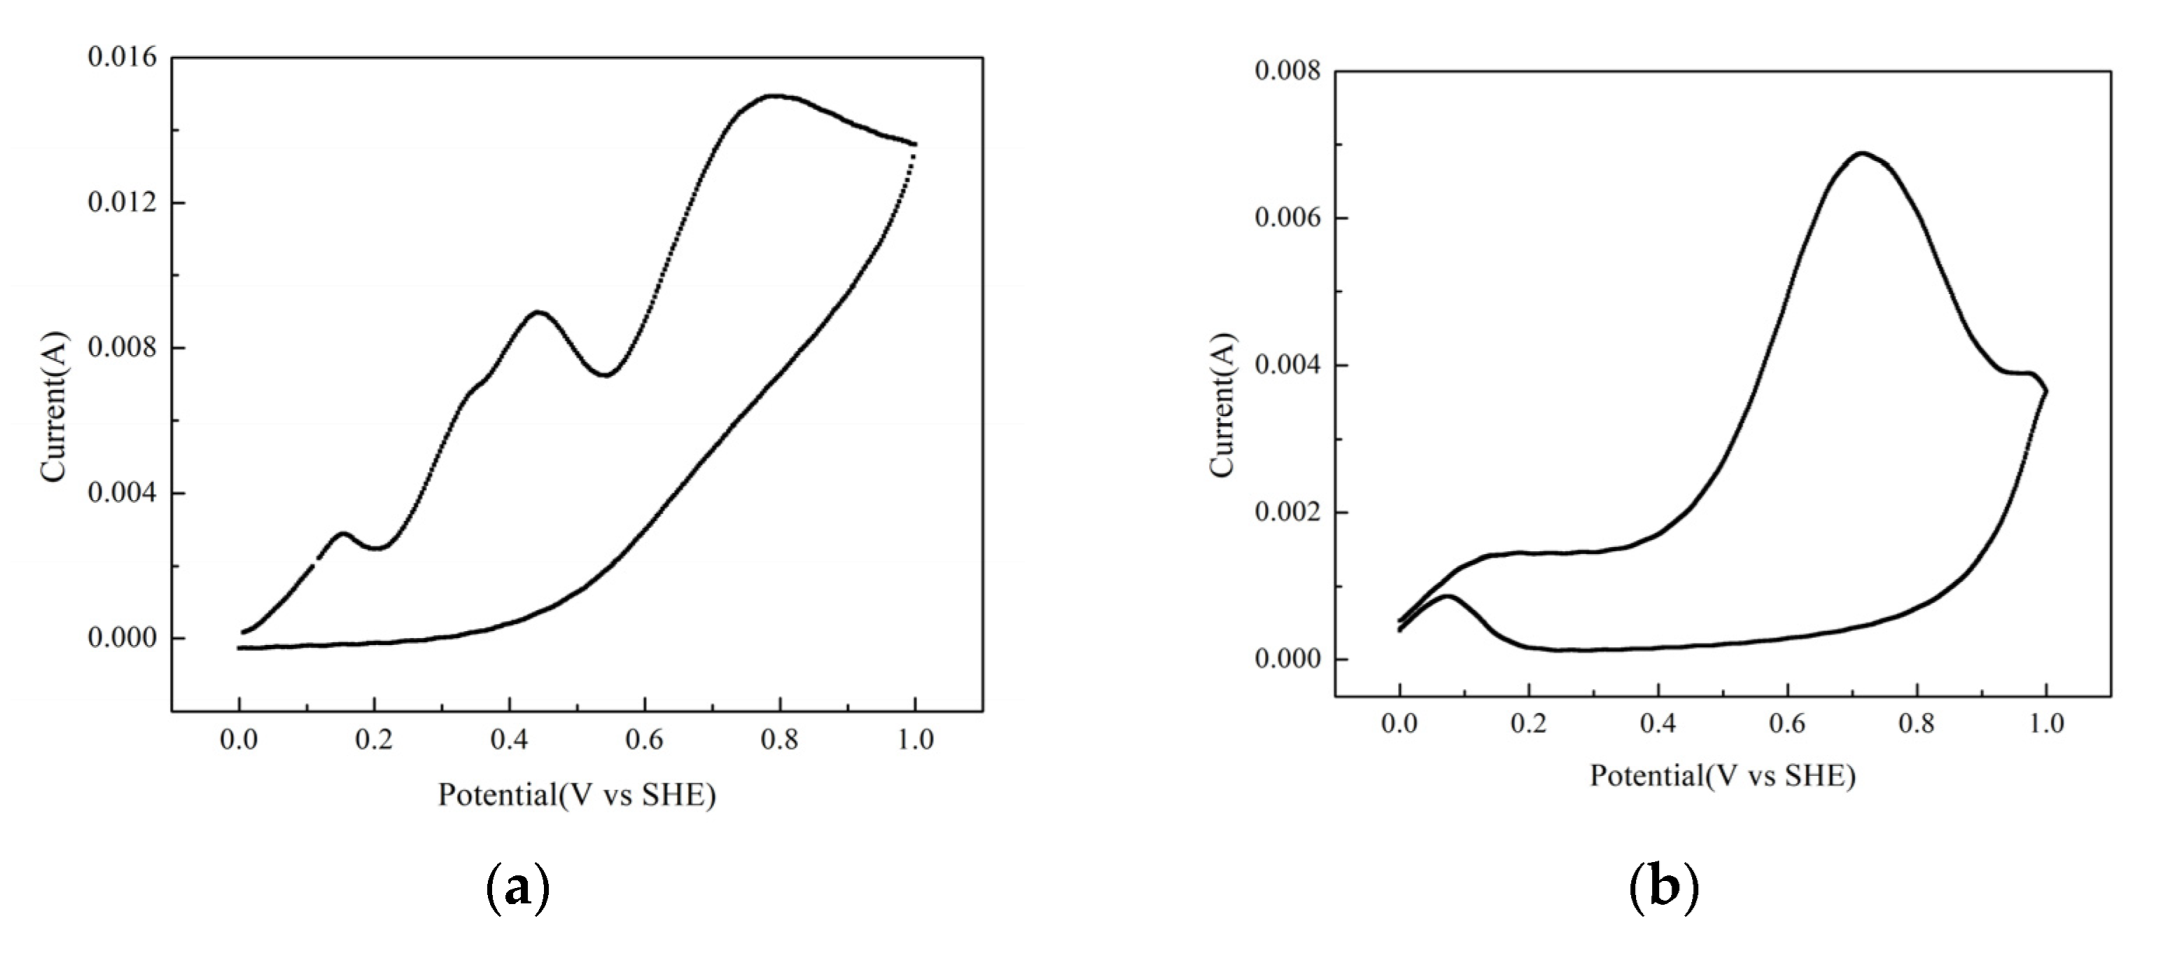
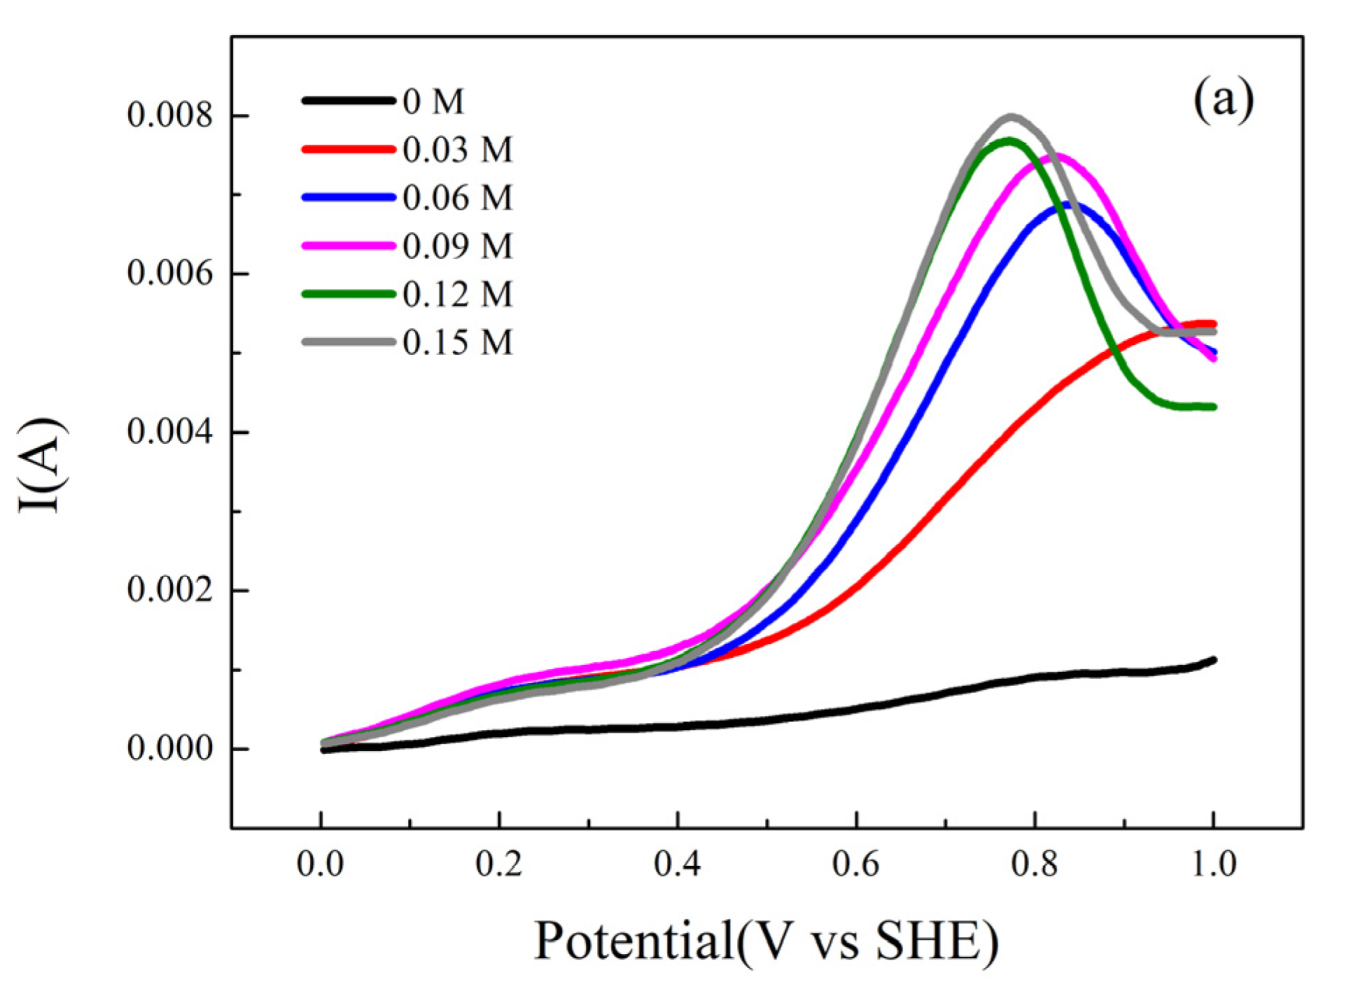
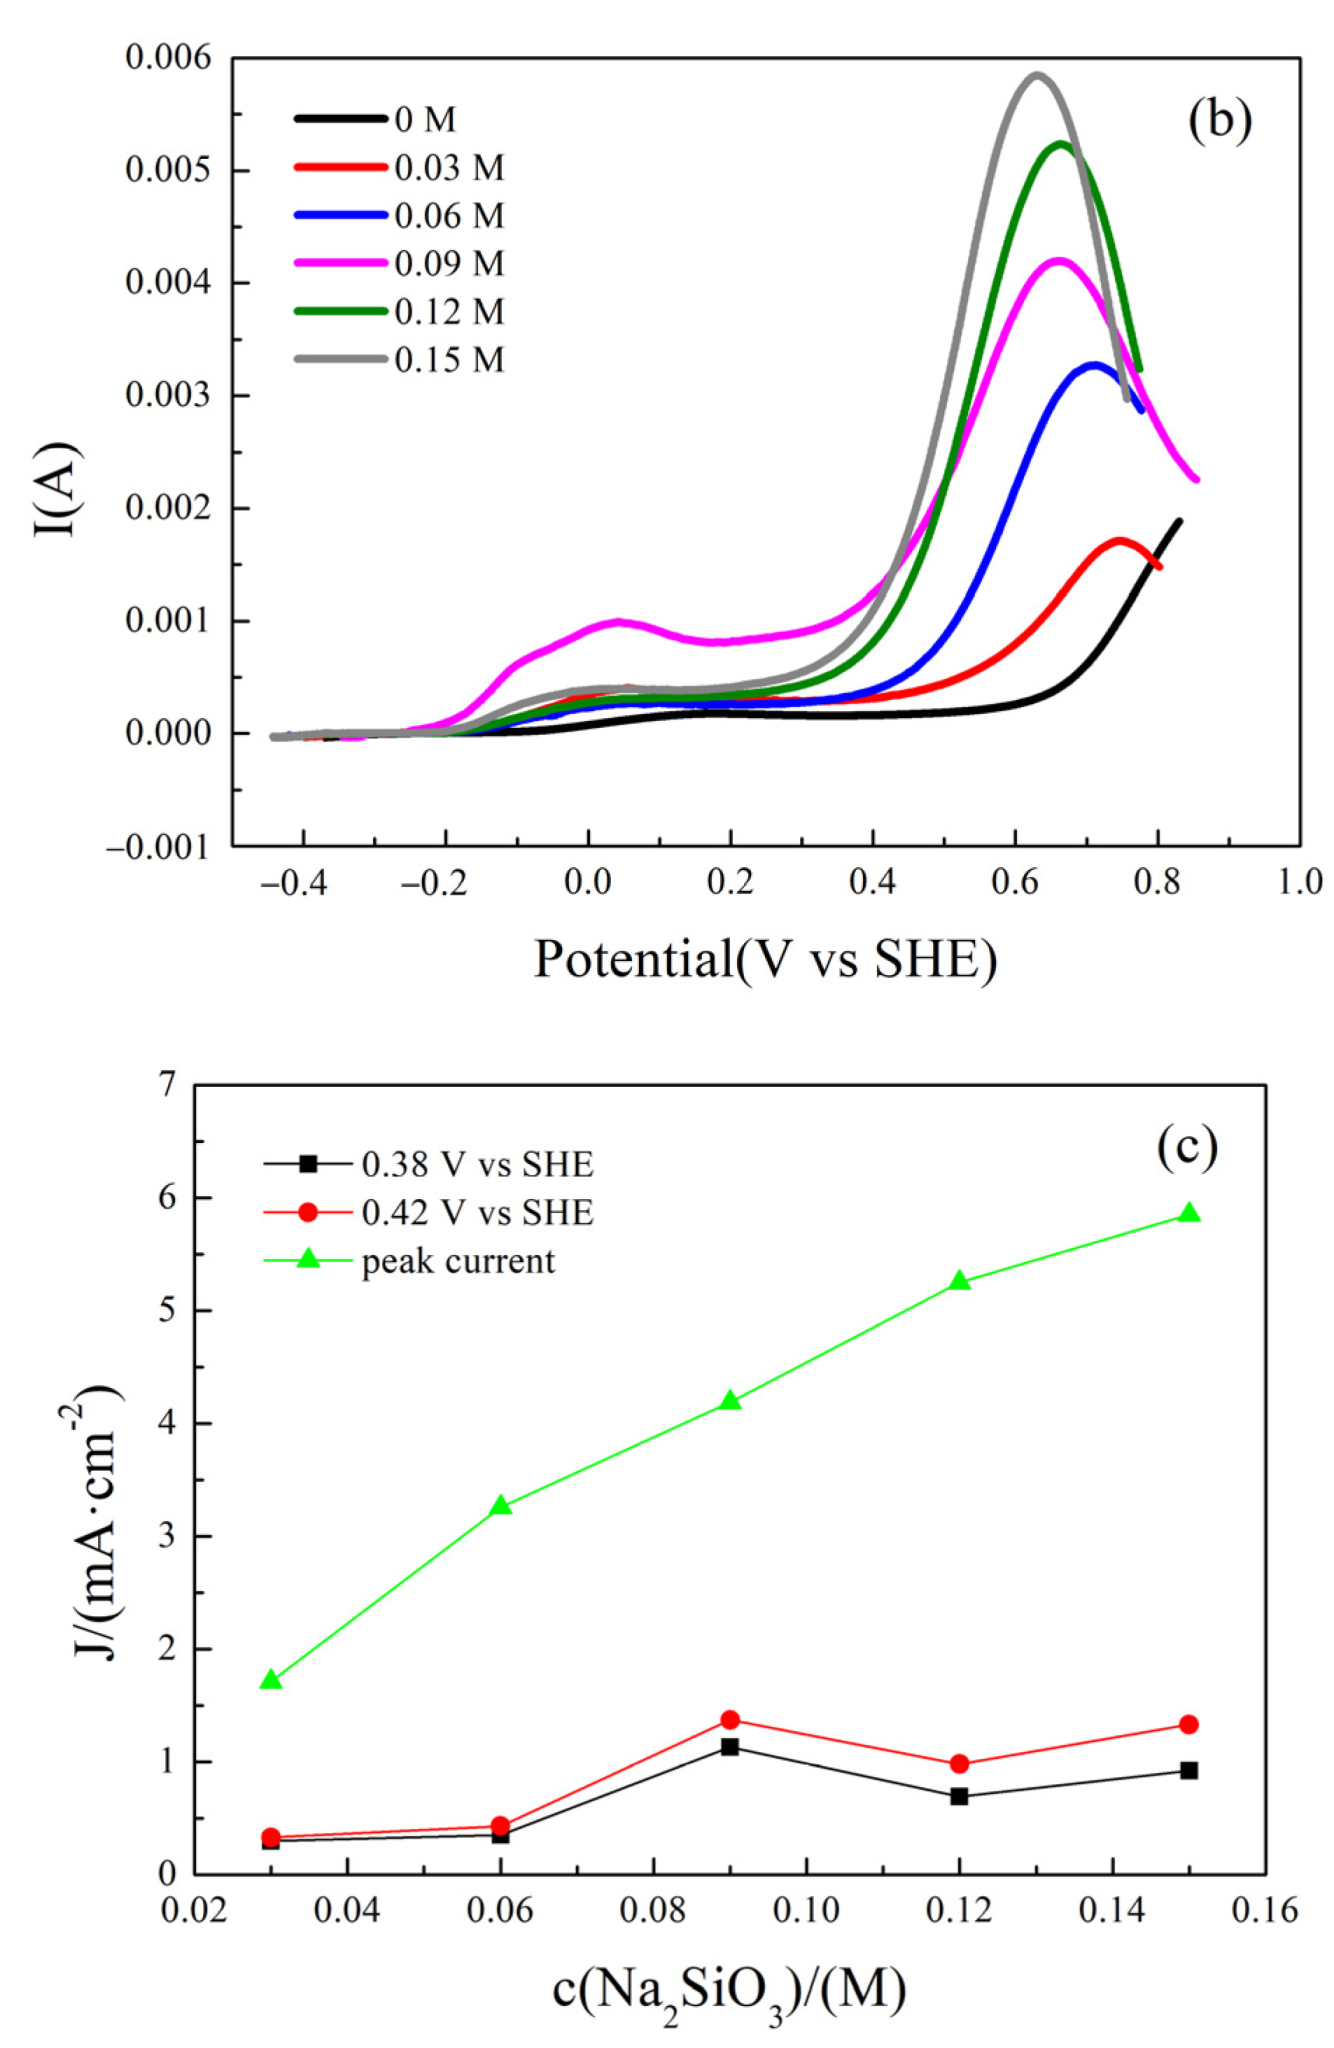
3.1. Effect of Stabilizer on Gold Cyclic Voltammetry Curve in Alkaline Thiourea Solution

The Au cyclic voltammetry curves under different thiourea concentrations, without any stabilizer in alkaline solution, are shown in Figure 1.
The Au cyclic voltammetry curves indicated that an oxidation peak occurred at ~0.2 V and shifted left when the thiourea concentration was increased. The thiourea decomposition reactions are shown in Equation (1).
2 SC ( NH 2 ) 2 + 2 OH = ( SCN 2 H 3 ) 2 + 2 H 2 O + 2 e
With the potential increased, another oxidation peak at ~0.8 V was observed at 0.15 M thiourea. This peak corresponds to the Au dissolution, and the alkaline complex reaction is shown in Equation (2).
Au + SC ( NH 2 ) 2 = Au [ CS ( NH 2 ) 2 ] 2 + + e
Without the stabilizer, thiourea decomposed significantly. Even if an oxidation peak appeared at 0.8 V, the dissolution current was low. There was a clear peak representing Au dissolution at 0.15 M thiourea. The remaining experiments were performed at a thiourea concentration of 0.15 M. Previous studies showed that an effective stabilizer can form a loop structure with thiourea to stabilize thiourea. Two requirements are needed for such a stabilizer: one forming an S–H bond with a thiourea molecule, and one forming a stable loop structure with a thiourea molecule. Subsequent research has shown that all substances with an –XO3 structure can stabilize thiourea [31]. In our experiments, two of the most common thiourea stabilizers, sodium sulfite and sodium silicate, were compared for their effects on Au dissolution in an alkaline thiourea system. The thiourea gold leaching cyclic voltammetry curves are shown in Figure 2a,b for sodium sulfite and sodium silicate, respectively.
As shown in Figure 2a, with Na2SO3 as a stabilizer and with positive scanning, the cyclic voltammetry curve of this system had its first oxidation peak at 0.16 V, which matched the reaction of thiourea oxidation decomposition (Equation (1)).
A second oxidation peak existed at 0.43 V, which corresponds to sodium sulfite oxidation. The oxidation peak at 0.76 V corresponds to Au dissolution and the thiourea complex reaction (as shown in Equation (2)).
During negative scanning, an obvious peak appeared, which means that the reaction was not irreversible. Therefore, the addition of sodium sulfite promoted Au dissolution. Compared with Figure 1, the Au dissolution peak current in Figure 2 reached 15 mA. However, sodium sulfite can be oxidized under alkaline conditions, which leads to an increase in consumption and the thiourea decomposition peak current is not reduced significantly compared with the absence of the stabilizer [31].
As shown in Figure 2b, with Na2SiO3 and positive scanning, the cyclic voltammetry curve had only one clear peak at 0.71 V, which matches Au dissolution with a peak current of 7 mA. No obvious oxidation peak existed at a low potential, indicating the inhibition of thiourea decomposition. No obvious peak was present during negative scanning. Consequently, Au dissolution was promoted by sodium silicate and thiourea decomposition was inhibited.
The Au dissolution peak current was higher in the presence of Na2SO3 than Na2SiO3. However, the suppressing effect of Na2SO3 on thiourea decomposition was weaker than that of Na2SiO3, and Na2SO3 reacts easily under alkaline conditions. Na2SiO3 is a strong alkaline substance, and its addition can stabilize pH, therefore, Na2SiO3 is more suited as a stabilizer than Na2SO3 in this system. The effect of Na2SiO3 concentration on the cyclic voltammetry curve is shown in Figure 3.
Figure 3a shows that the Au cyclic voltammetry curve in the alkaline thiourea gold solution had an obvious oxidation peak after sodium silicate addition. The thiourea oxidation peak disappeared at ~0.2 V and appeared at ~0.8 V. Compared with the cyclic voltammetry curve in the absence of sodium silicate, sodium silicate can suppress thiourea decomposition, which explains why the oxidation peak at ~0.2 V for thiourea decomposition was unclear. When thiourea was not decomposed, Au can be dissolved by the complex reaction with thiourea, and a corresponding oxidation peak appeared at ~0.8 V. Figure 3 also shows that an increase in sodium silicate concentration tended to increase the Au dissolution peak current. When the sodium silicate concentration reached 0.09 M, the increase in the Au dissolution peak current was not obvious and only the decomposition voltage decreased slightly. Therefore, the selected sodium silicate concentration was 0.09 M.
In order to further determine the optimal concentration of sodium silicate, the effect of sodium silicate concentration on the steady-state polarization curve of gold in the alkaline thiourea system was measured with gold as the working electrode by our research team [31], and the results are shown in Figure 3b, where the sodium silicate concentration varied from 0 to 0.15 M at a 0.03 M interval, the thiourea concentration was 0.15 M, the pH is 11, and the sweep speed was 10 mV/s.
Because the standard electrode potential of thiourea-gold complexes, and the potential of the oxidation of thiourea to dithiomamidine, is 0.38 and 0.42 V, respectively, the relationship between the stabilizer concentration and the anode current density at the two potentials and the peak potential was examined at pH 11 [31]. Figure 3c and Table 1 show that the peak current of the gold anode increased with the concentration of the stabilizer at the peak, and increased with the sodium silicate concentration at 0.38 and 0.42 V, respectively, at a silicate concentration of <0.09 M, above which the gold anode current density increased at a slower pace [31]. Therefore, at pH 11, the selected concentration of sodium silicate was 0.09 M. Some scholars also have used the same method to study the optimal sodium silicate concentration of stable thiourea [32]. Although the conclusions of different researchers regarding the optimal concentration of sodium silicate are somewhat biased due to the influence of test conditions and other parameters [32], it is certain that the concentration of sodium silicate is not positively correlated with the stability of thiourea. After exceeding a certain concentration, the stability of thiourea is weakened, and the irreversible decomposition of thiourea is difficult to completely inhibit.

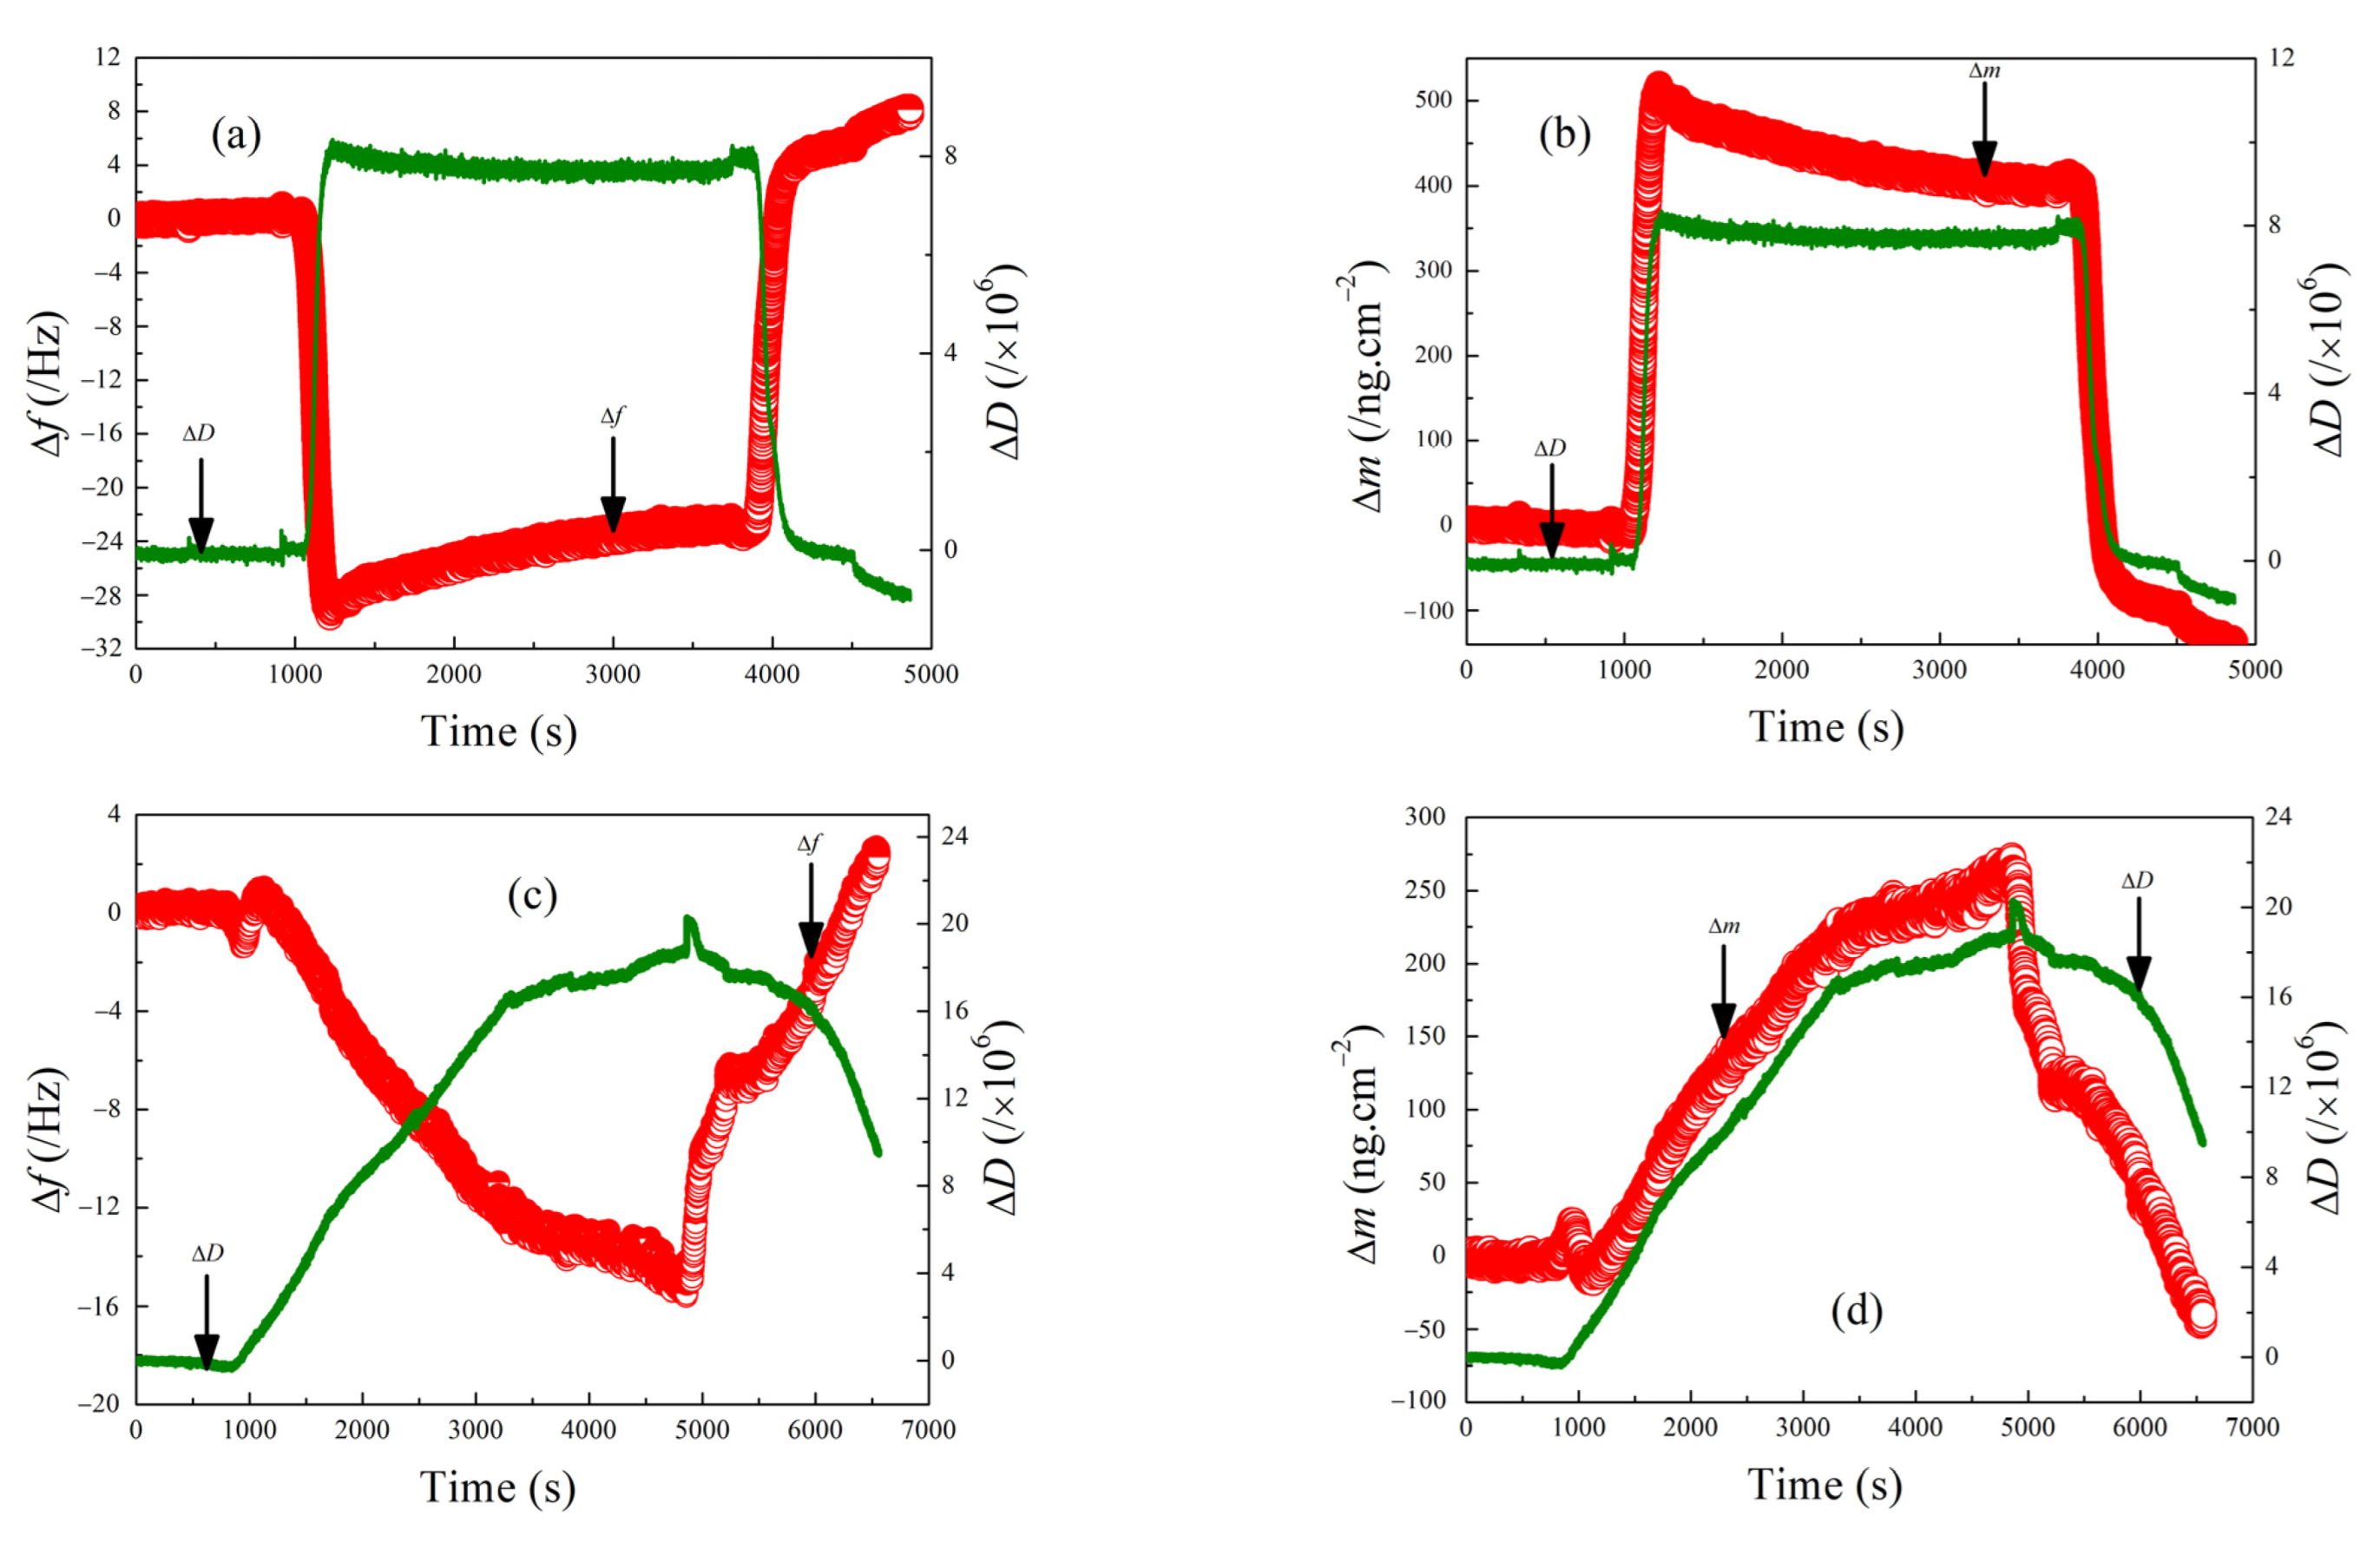
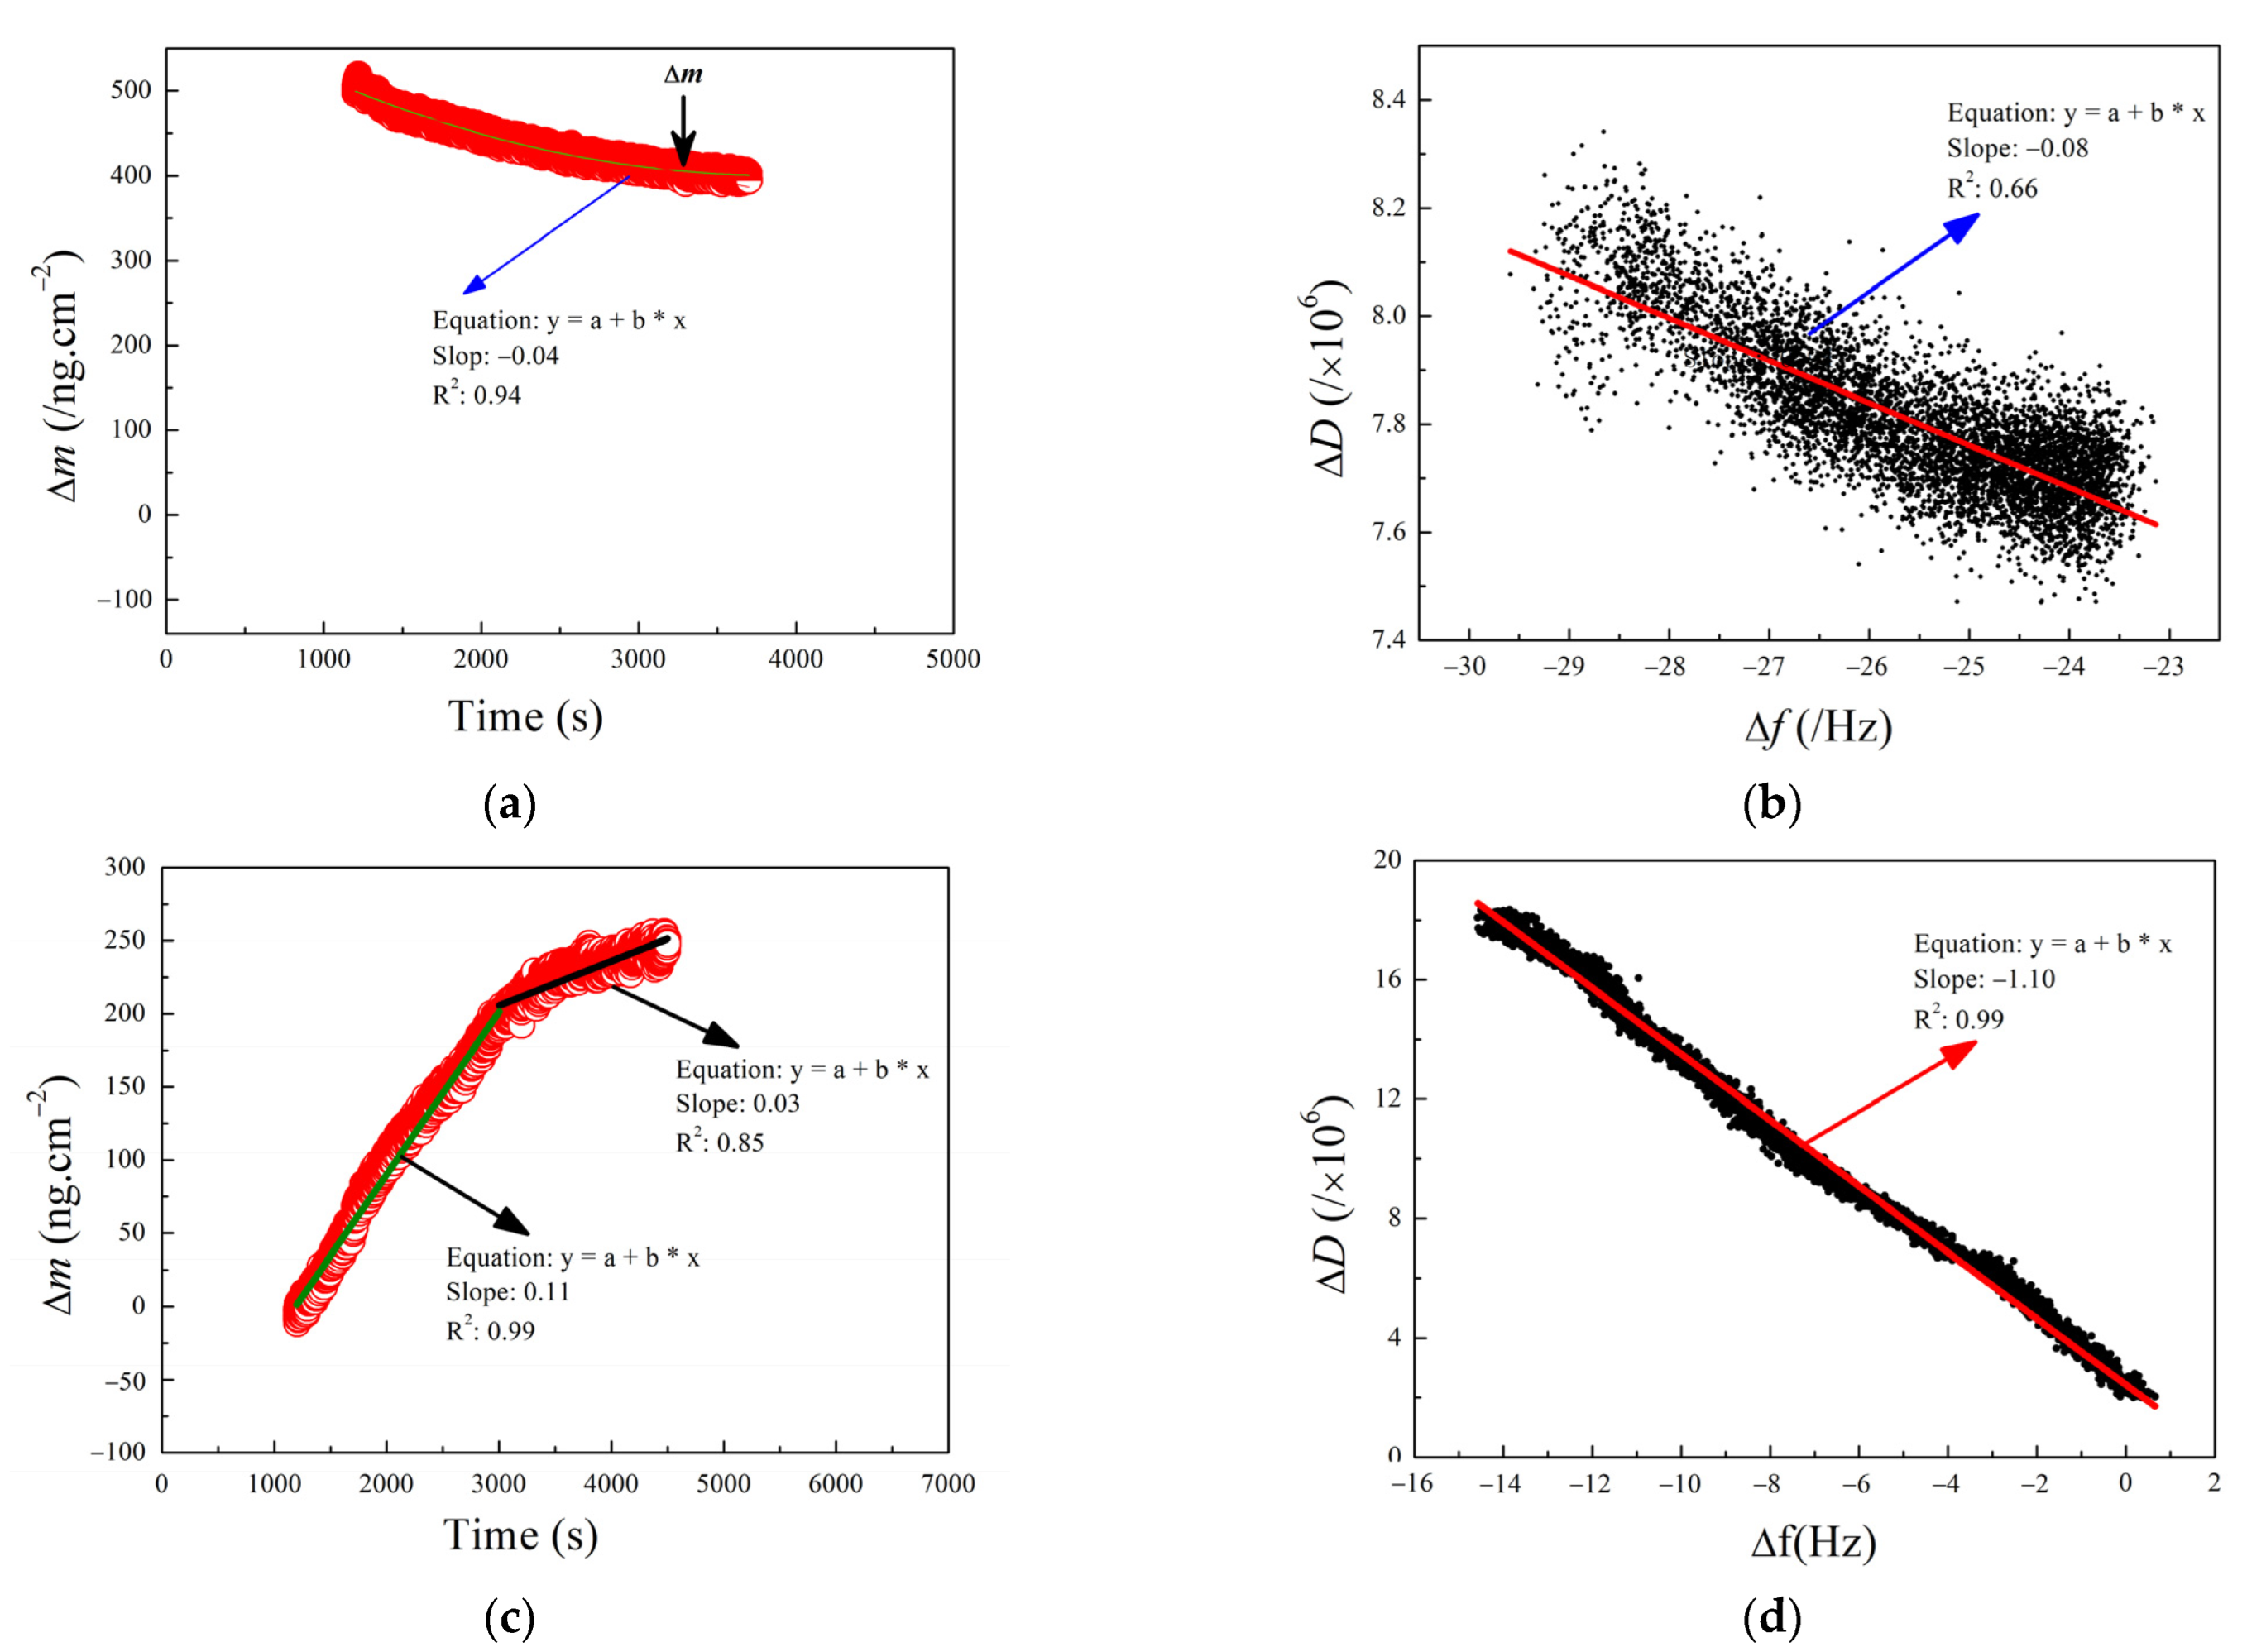
3.2. Dissolution of the Au Chip Surface in Alkaline Thiourea Solution with/without Sodium Silicate by QCM-D

QCM-D was used to study the surface dissolution of the Au chip at pH 11 and 0.15 M thiourea with, or without, sodium silicate. The experimental results are shown in Figure 4.
As shown in Figure 4a,b, Δf increased slowly, and ΔD and Δm showed a slow reduction when adding 0.09 M sodium silicate solution, suggesting that the surface of the Au chip started to dissolve. One hour after the addition of the solution, Δf and ΔD started to increase, but did not return to zero because the surface of the Au chip was partially dissolved, and its quality and appearance had changed. The AFM appearance of the surface is shown in Figure 5a. Figure 4c,d shows that after the addition of the solution without sodium silicate, Δf showed a slow reduction, while ΔD and Δm increased slowly, which means that thiourea decomposition had occurred on the surface of the Au chip. Decomposition reaction products covered the surface of the Au chip and increased its surface mass. One hour after the addition of the solution, the water solution was added, and Δf and ΔD started to increase again, but did not return to zero, which indicated that decomposition products adsorbed strongly to the Au surface. The AFM appearance of this surface is shown in Figure 5b.
Without sodium silicate, there was almost no Au dissolution on the surface of the Au chip because of the extensive decomposition of thiourea and surface coverage by the decomposition product. However, after the addition of 0.09 M sodium silicate, corrosion pits appeared on the surface of the Au chip. The experimental results by QCM-D are consistent with the electrochemical cyclic voltammetry curves.
Figure 6a shows the curve fitting of the Au dissolution in Figure 4b. Figure 6b shows a plotted diagram of the ΔD and Δf in Figure 4a. As shown in Figure 6a, in the case of the addition of sodium silicate stabilizer, the linear regression was carried out for the curve, and the R2 after regression was 0.94 in Figure 6a, so the linearity is poor. Therefore, the dissolution of gold in this section was only a nearly linear dissolution. Figure 6b shows that with the addition of the stabilizer, although the degree of fitting was low, the Δf–ΔD diagram of this system had only one K value. In general, no reaction other than Au dissolution occurs in the system.
Figure 6c shows the curve fitting of the Au chip surface in Figure 4d. Figure 6d shows the plotted diagram of the Δf–ΔD relationship in Figure 4c. As shown in Figure 6c, without the addition of sodium silicate stabilizer, the correlation between Au dissolution quality and time can be fitted linearly because of the coverage by the decomposition products on the surface of the Au chip. The curve is divided into two segments with R2 curve fitting values of 0.98 and 0.84, respectively. The change in K value in the second segment was most likely caused by two factors—the reduction in thiourea concentration because of its decomposition during the late stage of reaction, and the passivation that occurs when the gold surface is covered by oxidation products [25]. Figure 6d shows that, without the addition of sodium silicate stabilizer, there is only one K value for the Δf–ΔD diagram in this system, which means that adsorption of the thiourea decomposition products on the Au chip surface has only one construction.

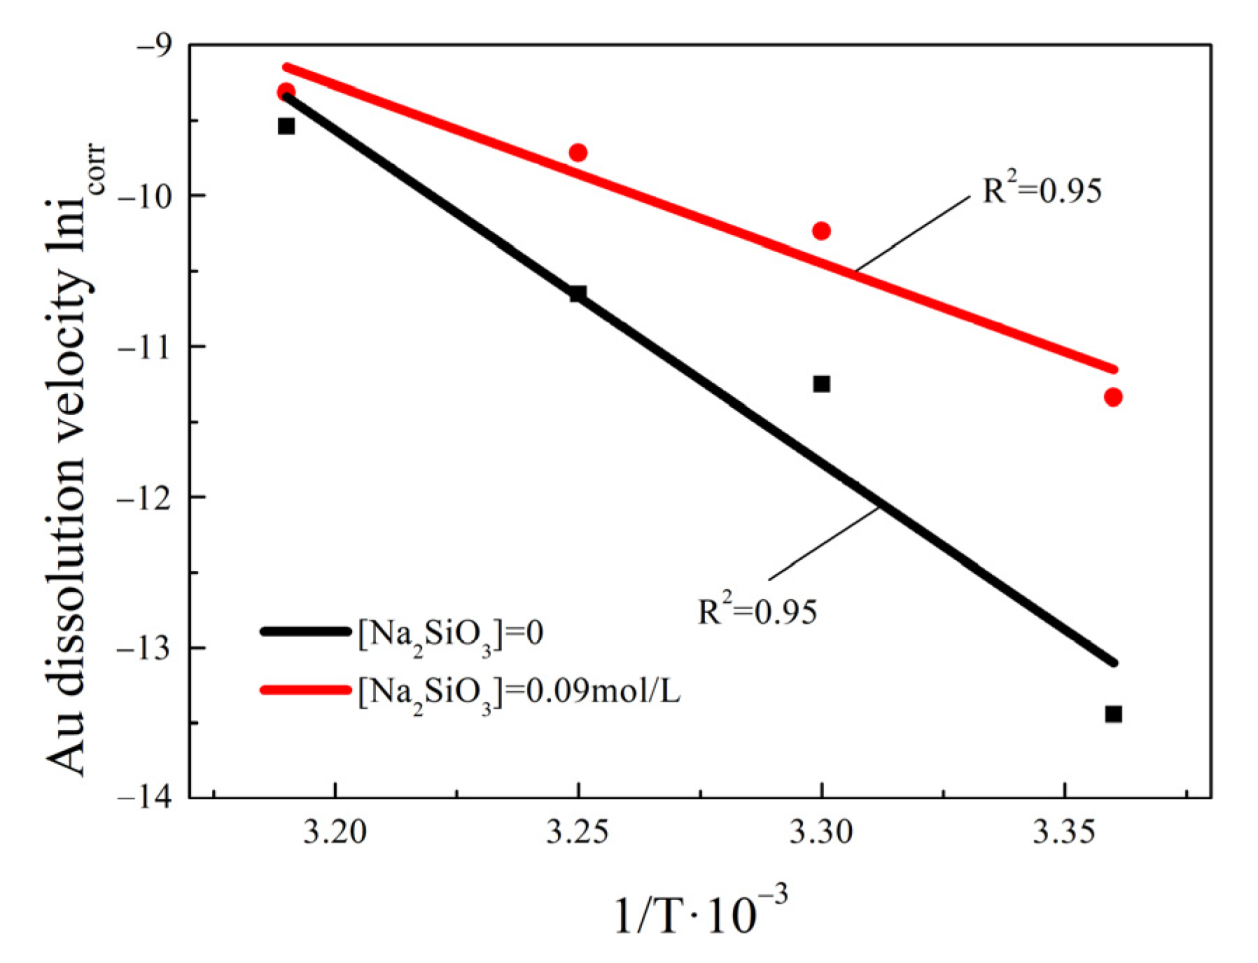
3.3. Study of the Impact of Sodium Silicate on the Surface Activation Energy in the Alkaline Thiourea Gold Leaching System

The Au open-circuit potential (OCP) measured at pH 11 and a thiourea concentration of 0.15 M is shown in Figure 7. The starting Au OCP under these conditions was −0.070 V and changed to −0.076 V after stabilization. Using this OCP value as the middle point, Tafel curves at different temperatures (298, 303, 308, and 313 K) were obtained at −0.5~0.4 V, pH 11, 0.1 mV/S scanning speed, and 0.15 M thiourea concentration. The straight section of the Tafel curves shows an area of strong anode polarization and cathode polarization [33,34,35,36,37]. By extending the straight lines, the X-axis of the intersection point is the corrosion current, while the Y-axis represents corrosion potential.
Figure 8 presents the Tafel curve at 298 K without sodium silicate and the Au corrosion current lg i c o r r = −5.85 in these conditions. Based on lg i c o r r from the Tafel curve, the Au corrosion current i c o r r was calculated at a different temperature. In corrosion electrochemistry, the corrosion current can be seen as the reaction rate of the metal electrode reaction. The calculated Au dissolution velocity at different temperatures is shown in Table 2 and Table 3.
Table 2 and Table 3 show that, with increasing temperature, the Au anode dissolution velocity increased gradually in the alkaline thiourea system without sodium silicate, especially at a high temperature, and the rate of increase accelerated as the temperature was increased. After sodium silicate addition, the Au anode dissolution velocity also increased, but the rate of increase was less rapid than that in Table 2. A comparison of the Au dissolution velocity with, or without, sodium silicate at different temperatures, showed that the Au dissolution velocities in the presence of sodium silicate were larger than those without sodium silicate, which means that silicate promotes Au anode dissolution.
Based on the Arrhenius formula (see Equation (3)):
ln k = C E R · 1 T
where T is the temperature, k is the reaction rate, E is the experimental activation energy, R is the molar gas constant 8.314 J/(moL·K), and C is a constant.
The correlation between the dissolution velocity and activation energy E and temperature T can be obtained. Figure 9 plots ln i c o r r against 1/T, and the slope of the line represents the apparent activation energy.
The fitted line had a slope of −22.102 in the presence of thiourea only. Thus, the calculated apparent activation energy was 183.76 kJ/moL without sodium silicate. The slope of the fitted line was −11.796 for 0.09 M sodium silicate, and the activation energy was 98.07 kJ/moL, indicating that sodium silicate gradually reduces the Au dissolution apparent activation energy, which facilitates Au dissolution.

4. Conclusions

(1) Without any stabilizer, the Au cyclic voltammetry curve in an alkaline thiourea solution had an oxidation peak of thiourea decomposition around 0.2 V when scanning positively. Excessive thiourea consumption lead to an absence of the Au dissolution peak around 0.8 V during subsequent positive scanning. Only a small peak appeared at a thiourea concentration of 0.15 M. The most suitable sodium silicate concentration was 0.15 M.
(2) In terms of Na2SO3 and Na2SiO3, when Na2SO3 was present, the Au dissolution peak current was higher than with Na2SiO3. However, Na2SO3 suppressed the thiourea decomposition to a lesser extent than Na2SiO3, and it reacted easily under alkaline conditions. A comparison with Na2SO3 shows that Na2SiO3 is more suitable as a stabilizer in this system.
(3) The QCM-D results show that, in an alkaline thiourea system, the surface mass of the Au chip was not reduced, but it increased without sodium silicate because of substantial thiourea decomposition and decomposition products covered the Au chip surface. The AFM experimental results confirmed the thiourea decomposition and product coverage on the Au chip surface. Minimal corrosion occurred on the surface of the Au chip in the absence of Na2SiO3. Sodium silicate addition lead to a reduction in surface mass of the Au chip. The surface AFM experimental results also showed that corrosion pits existed to different extents. Thus, sodium silicate can stabilize thiourea under alkaline conditions.
(4) A comparison of the effect of the absence/existence of sodium silicate on the Au Tafel curve in an alkaline thiourea system at different temperatures shows that the Au corrosion current increases as temperature increases, regardless of whether sodium silicate is added or not. The surface activation between them was calculated with the Arrhenius formula. The surface activation energy of Au dissolution without sodium silicate was 183.76 kJ/moL. Its activation energy was 98.07 kJ/moL when 0.09 M sodium silicate was added. This result also indicated that sodium silicate reduced the surface activation energy of Au dissolution significantly and made Au easier to dissolve.

Author Contributions

Conceptualization, W.L. and H.Z.; methodology, H.S.; validation, S.Z., X.Y. and Y.S.; formal analysis, H.Z.; investigation, W.L.; resources, H.Z.; data curation, H.S.; writing—original draft preparation, W.L.; writing—review and editing, X.Y.; visualization, H.Z.; supervision, Y.S.; project administration, H.S. All authors have read and agreed to the published version of the manuscript.

Funding

This research was funded by the National Natural Science Foundation of China grant number 52004244, 52104269, 51504031 and 51704028, the innovation fund of the GRIMAT Engineering Institute Co., Ltd. grant number 533801 and 53319, and the Youth Fund Project of GRINM. And The APC was funded by the National Natural Science Foundation of China grant number 52004244.

Acknowledgments

The authors are grateful for the financial support from the National Natural Science Foundation of China (Grant No. 52004244, 52104269, 51504031, 51704028), the innovation fund of the GRIMAT Engineering Institute Co., Ltd. (Grant No. 533801, 53319) and the Youth Fund Project of GRINM.

Conflicts of Interest

The authors declare no conflict of interest.

References

  1. Maria, I.N.; Ionela, B.; Francesco, F.; Marcello, C.; Francesco, V. Preliminary study on gold recovery from high grade e-waste by thiourea leaching and electrowinning. Minerals 2021, 11, 235. [Google Scholar]
  2. Mohammed, R.A.; Mohammed, H.S.; Mohamed, G.E.; Yasser, K.A. Gold Leaching Using Thiourea from Uranium Tailing Material, Gabal El-Missikat, Central Eastern Desert Egypt. J. Sustain. Metall. 2020, 6, 599. [Google Scholar]
  3. Boboev, I.R.; Selnitsin, R.S.; Kholikov, T.A.; Sharipov, B.K. Technology of gold extraction from mature dumps by thiourea Leaching. Russ. J. Non-Ferr. Met. 2020, 61, 257. [Google Scholar] [CrossRef]
  4. Calla-Choque, D.; Lapidus, G.T. Acid decomposition and silver leaching with thiourea and oxalate from an industrial jarosite sample. Hydrometallurgy 2020, 192, 105289. [Google Scholar] [CrossRef]
  5. Boboev, I.R.; Kurbonov, S.K.; Sel’nitsyn, R.S. Use of thiourea leaching during gold-containing dump treatment. Metallurgist 2019, 63, 633. [Google Scholar] [CrossRef]
  6. Chai, L.Y.; Min, X.B. Structure-property relationship between the stability of alkaline thiourea and the structure of thiourea and sulfite ion. J. Cent. South Univ. Technol. 2002, 33, 473. [Google Scholar]
  7. Zhou, H. Electrochemical Studies of Gold Leaching in Alkaline Thiourea Solutions; General Research Institute for Nonferrous Metals: Beijing, China, 2018; p. 29. [Google Scholar]
  8. Bai, A.P. Research on Influencing Factors and Mechanism of Gold Leaching with Alkaline Thiourea Solution. Master’s Dissertation, General Research Institute for Nonferrous Metals, Beijing, China, 2017. [Google Scholar]
  9. Chen, L.; Tang, D.W.; Tang, Q.; Wang, F.; Xing, W.P.; Wang, X.W. Electrochemical behavior of sodium sulfite in alkaline thiourea system for gold dissolution. Precious Met. 2020, 41, 43. [Google Scholar]
  10. Wei, D.W.; Chai, L.Y.; Ichino, R.; Okido, M. Gold leaching in an alkaline thiourea solution. J. Electrochem. Soc. 2019, 146, 559. [Google Scholar] [CrossRef]
  11. Wang, Y.Y.; Chai, L.Y.; Min, X.B.; Peng, B.; He, D.W. Effect of Na2SiO3 on gold dissolution selectively in alkaline thiourea solutions. J. Cent. South Univ. Technol. 2003, 34, 611. [Google Scholar]
  12. Sun, Z.F. Molecular Simulation technology on Windows 9X platform. Chem. Bull. 2000, 3, 59. [Google Scholar]
  13. Ren, Y.; Yang, J.; Wu, D.Y.; Li, Z.R.; Tian, A.M. Progress in molecular force field. J. Chem. Res. Appl. 1998, 1, 1. [Google Scholar]
  14. Zheng, S.; Wang, Y.Y.; Chai, L.Y. Mechanism of gold dissolution selectively in alkaline thiourea solutions based on complex theory. Chin. J. nonferrous. Met. 2005, 15, 1629. [Google Scholar]
  15. Chu, J.H. Thermodynamic analysis of gold dissolution with thiourea. Gold 1982, 2, 46. [Google Scholar]
  16. Yu, D.Q. Investigation of Chemical Bond and Structure-Property Relationship of Crystal Materials. Ph.D. Dissertation, Dalian University of Technology, Dalian, China, 2008. (In Chinese). [Google Scholar]
  17. Chai, L.Y.; Min, X.B.; Zhong, H.Y. Anodic behavior of gold in alkaline thiourea solution. Min. Metall. Eng. 1999, 19, 53. [Google Scholar]
  18. Chen, C.J.; Jiang, H.F. Review on research progress of QCM. Transducer Microsyst. Technol. 2014, 33, 5. [Google Scholar]
  19. Gimenez, R.D. Calculation of the surface concentration of Zn (I) from the anodic voltammetric peak of zinc combined with the QCM results. Electrochem. Commun. 2004, 6, 903. [Google Scholar] [CrossRef]
  20. Chen, S.L.; Wu, B.L.; Yang, H.X. Studies on the redox process of silver using electrochemical quartz crystal microbalance. Chem. J. Chin. Univ. 1994, 15, 103. [Google Scholar]
  21. Cao, Z.; Xiao, Z.L. Corrosion behaviors on polycrystalline gold substrates in self assembled processes of alkanethiol monolayers. Anal. Lett. 2005, 38, 1289. [Google Scholar] [CrossRef]
  22. Zheng, J.; Ritchie, I.M.; La Brooy, S.R.; Singh, P. Study of gold leaching in oxygenated solutions containing cyanide-copper-ammonia using a rotating quartz crystal microbalance. Hydrometallurgy 1995, 39, 277. [Google Scholar] [CrossRef]
  23. Li, G.Z.; Kou, J.; Xing, Y.; Hu, Y.; Han, W.; Liu, Z.Y.; Sun, C.B. Gold-leaching performance and mechanism of sodium dicyanamide. Int. J. Miner. Metall. Mater. 2021, 28, 1759. [Google Scholar] [CrossRef]
  24. Kou, J.; Tao, D.; Xu, G. Fatty acid collectors for phosphate flotation and their adsorption behavior using QCM-D. Int. J. Miner. Processing 2010, 95, 1–9. [Google Scholar] [CrossRef]
  25. Li, W.J.; Zhou, H.; Bai, A.P.; Song, Y.S.; Cai, L.L.; Zheng, S.L.; Zhang, Q.D.; Cao, S. Electrochemical adsorption and passivation on gold surface in alkaline thiourea solutions. Rare Met. 2020, 39, 951–958. [Google Scholar] [CrossRef]
  26. Kou, J.; Yang, B.H.; Xu, S.H.; Sun, T.C. Adsorption kinetics of sodium dodecyl sulfonate onto hematite. Chin. J. Eng. 2016, 38, 1359. [Google Scholar]
  27. Kou, J.; Xu, S.H.; Sun, T.C. A study of sodium oleate adsorption on Ca2+ activated quartz surface using quartz crystal microbalance with dissipation. Int. J. Miner. Process. 2016, 154, 24. [Google Scholar] [CrossRef]
  28. Xu, S.H.; Kou, J.; Sun, T.C.; Kwang, S.J. A study of adsorption mechanism of dodecylamine on sphalerite. Colloid Surface A 2015, 486, 145. [Google Scholar] [CrossRef]
  29. Kou, J.; Xu, S.H. In situ kinetics and conformation studies of dodecylamine adsorption onto zinc sulfide using a quartz crystal microbalance with dissipation (QCM-D). Colloid Surface A 2016, 490, 110. [Google Scholar] [CrossRef]
  30. Wu, L. Study on Hydration Film on Coal Surface and Interaction Force between Particles Based on AFM. Master’s Dissertation, China University of Mining & Technology, Xuzhou, China, 2015. (In Chinese). [Google Scholar]
  31. Zhou, H.; Song, Y.S.; Li, W.J.; Song, K. Electrochemical behavior of gold and its associated minerals in alkaline thiourea solutions. Int. J. Miner. Metall. Mater. 2018, 25, 737. [Google Scholar] [CrossRef]
  32. Zheng, S. Fundamentals of Green Process of Gold Leaching in Alkaline Thiourea Solution with High Stability. Ph.D. Dissertation, Central South University, Changsha, China, 2006. (In Chinese). [Google Scholar]
  33. Wang, S.L.; Long, F.Y.; Yang, Y.; Wang, M.H. Application and progress of Electrochemical measurement technique in study of pitting corrosion of stainless steel. Corros. Prot. 2016, 37, 586. [Google Scholar]
  34. Hao, L.; Tang, D.Y.; Yao, H.; Lei, X.; Song, J.Z.; Wang, W.; Cheng, B.W. The effect of chlorine/argentum atomic ratios on electrochemical behaviors and signal acquisition abilities of embroidered electrodes for bio-potential signal measurement. Appl. Phys. A 2019, 125, 501. [Google Scholar]
  35. Le, G.; Li, W.J.; Song, K.; Song, Y.S.; Chen, Y.; Bai, A.P.; Cheng, Y. Electrochemical dissolution behavior of gold and its main coexistent sulfide minerals in acid thiocyanate solutions. Rare Met. 2021, 41, 254–261. [Google Scholar] [CrossRef]
  36. Le, G. Dissolution Behavior of Gold and Its Main Coexistent Sulfide Minerals in Acid Thiocyanate Solutions. Master’s Dissertation, General Research Institute for Nonferrous Metals, Beijing, China, 2020. (In Chinese). [Google Scholar]
  37. Ren, C.Y.; Wu, B.; Shang, H.; Wen, J.K.; Zhang, Q.D. Combined process of biological pre-oxidation and gold leaching with acid thiourea. Min. Metall. 2020, 29, 63. [Google Scholar]
Figure 1. The Au potential sweep voltammetry curves under different thiourea concentrations without any stabilizer (scanning speed 50 mv/S; aqueous: Cthiourea from 0 to 0.20 M, pH = 11).
Minerals 12 00089 g001
Figure 2. Gold leaching cyclic voltammetry curve at pH 11, 0.09 M Na2SO3 (a) or Na2SiO3 (b) and 0.15 M thiourea.
Minerals 12 00089 g002
Figure 3. Effect of sodium silicate concentration on gold leaching with thiourea. (a) Effect of Na2SiO3 concentration on cyclic voltammetry curve; (b) effect of sodium silicate concentration on steady-state polarization curve of gold [31]; (c) effect of sodium silicate concentration on the current density of gold anode polar solution [31].
Minerals 12 00089 g003aMinerals 12 00089 g003b
Figure 4. The surface dissolution of the Au chip with, or without, sodium silicate at pH 11 and 0.15 M thiourea: (a,b) CNa2SiO3 = 0.09 M; (c,d) no sodium silicate. The thiourea solution was introduced after approximately 1000 s and switched back to water after one minute.
Minerals 12 00089 g004
Figure 5. The AFM appearance of the surface of the Au chip with, or without, Na2SiO3 with thiourea concentration of 0.15 M: (a) can2SiO3 = 0.09 M; (b) no sodium silicate.
Minerals 12 00089 g005
Figure 6. (a) Correlation between Au dissolution mass and time in the presence of sodium silicate; (b) Δf–ΔD relationship in the presence of sodium silicate; (c) correlation between the surface mass of the Au chip and time without the stabilizer; (d) Δf–ΔD correlation without stabilizer.
Minerals 12 00089 g006
Figure 7. Au OCP at pH 11 and thiourea concentration of 0.15 M.
Minerals 12 00089 g007
Figure 8. Au Tafel curve at 298 K, a thiourea concentration of 0.15 M and pH 11.
Minerals 12 00089 g008
Figure 9. Correlation between temperature and Au dissolution velocity.
Minerals 12 00089 g009
Table 1. Peak current and voltage of steady-state polarization curve of gold electrode at different concentrations of sodium silicate solution [31].
Na2SiO3 Concentration (M)Peak Voltage (V)Peak Current (10−3 A)
000
0.030.741.70
0.060.703.27
0.090.654.19
0.120.645.17
0.150.635.84
Table 2. Effect of temperature on Au dissolution velocity.
Temperature (K) i c o r r   ( μ A / c m 2 )
2981.45
30312.90
30823.63
31372.06
Table 3. Effect of temperature on Au dissolution velocity with sodium silicate.
Temperature (K) i c o r r   ( μ A / c m 2 )
29811.90
30335.76
30860.32
31390.15
Publisher’s Note: MDPI stays neutral with regard to jurisdictional claims in published maps and institutional affiliations.

