
Airflow Velocity Designing for Air Classifier of Manufactured Sand Based on CPFD Method

Abstract
:1. Introduction
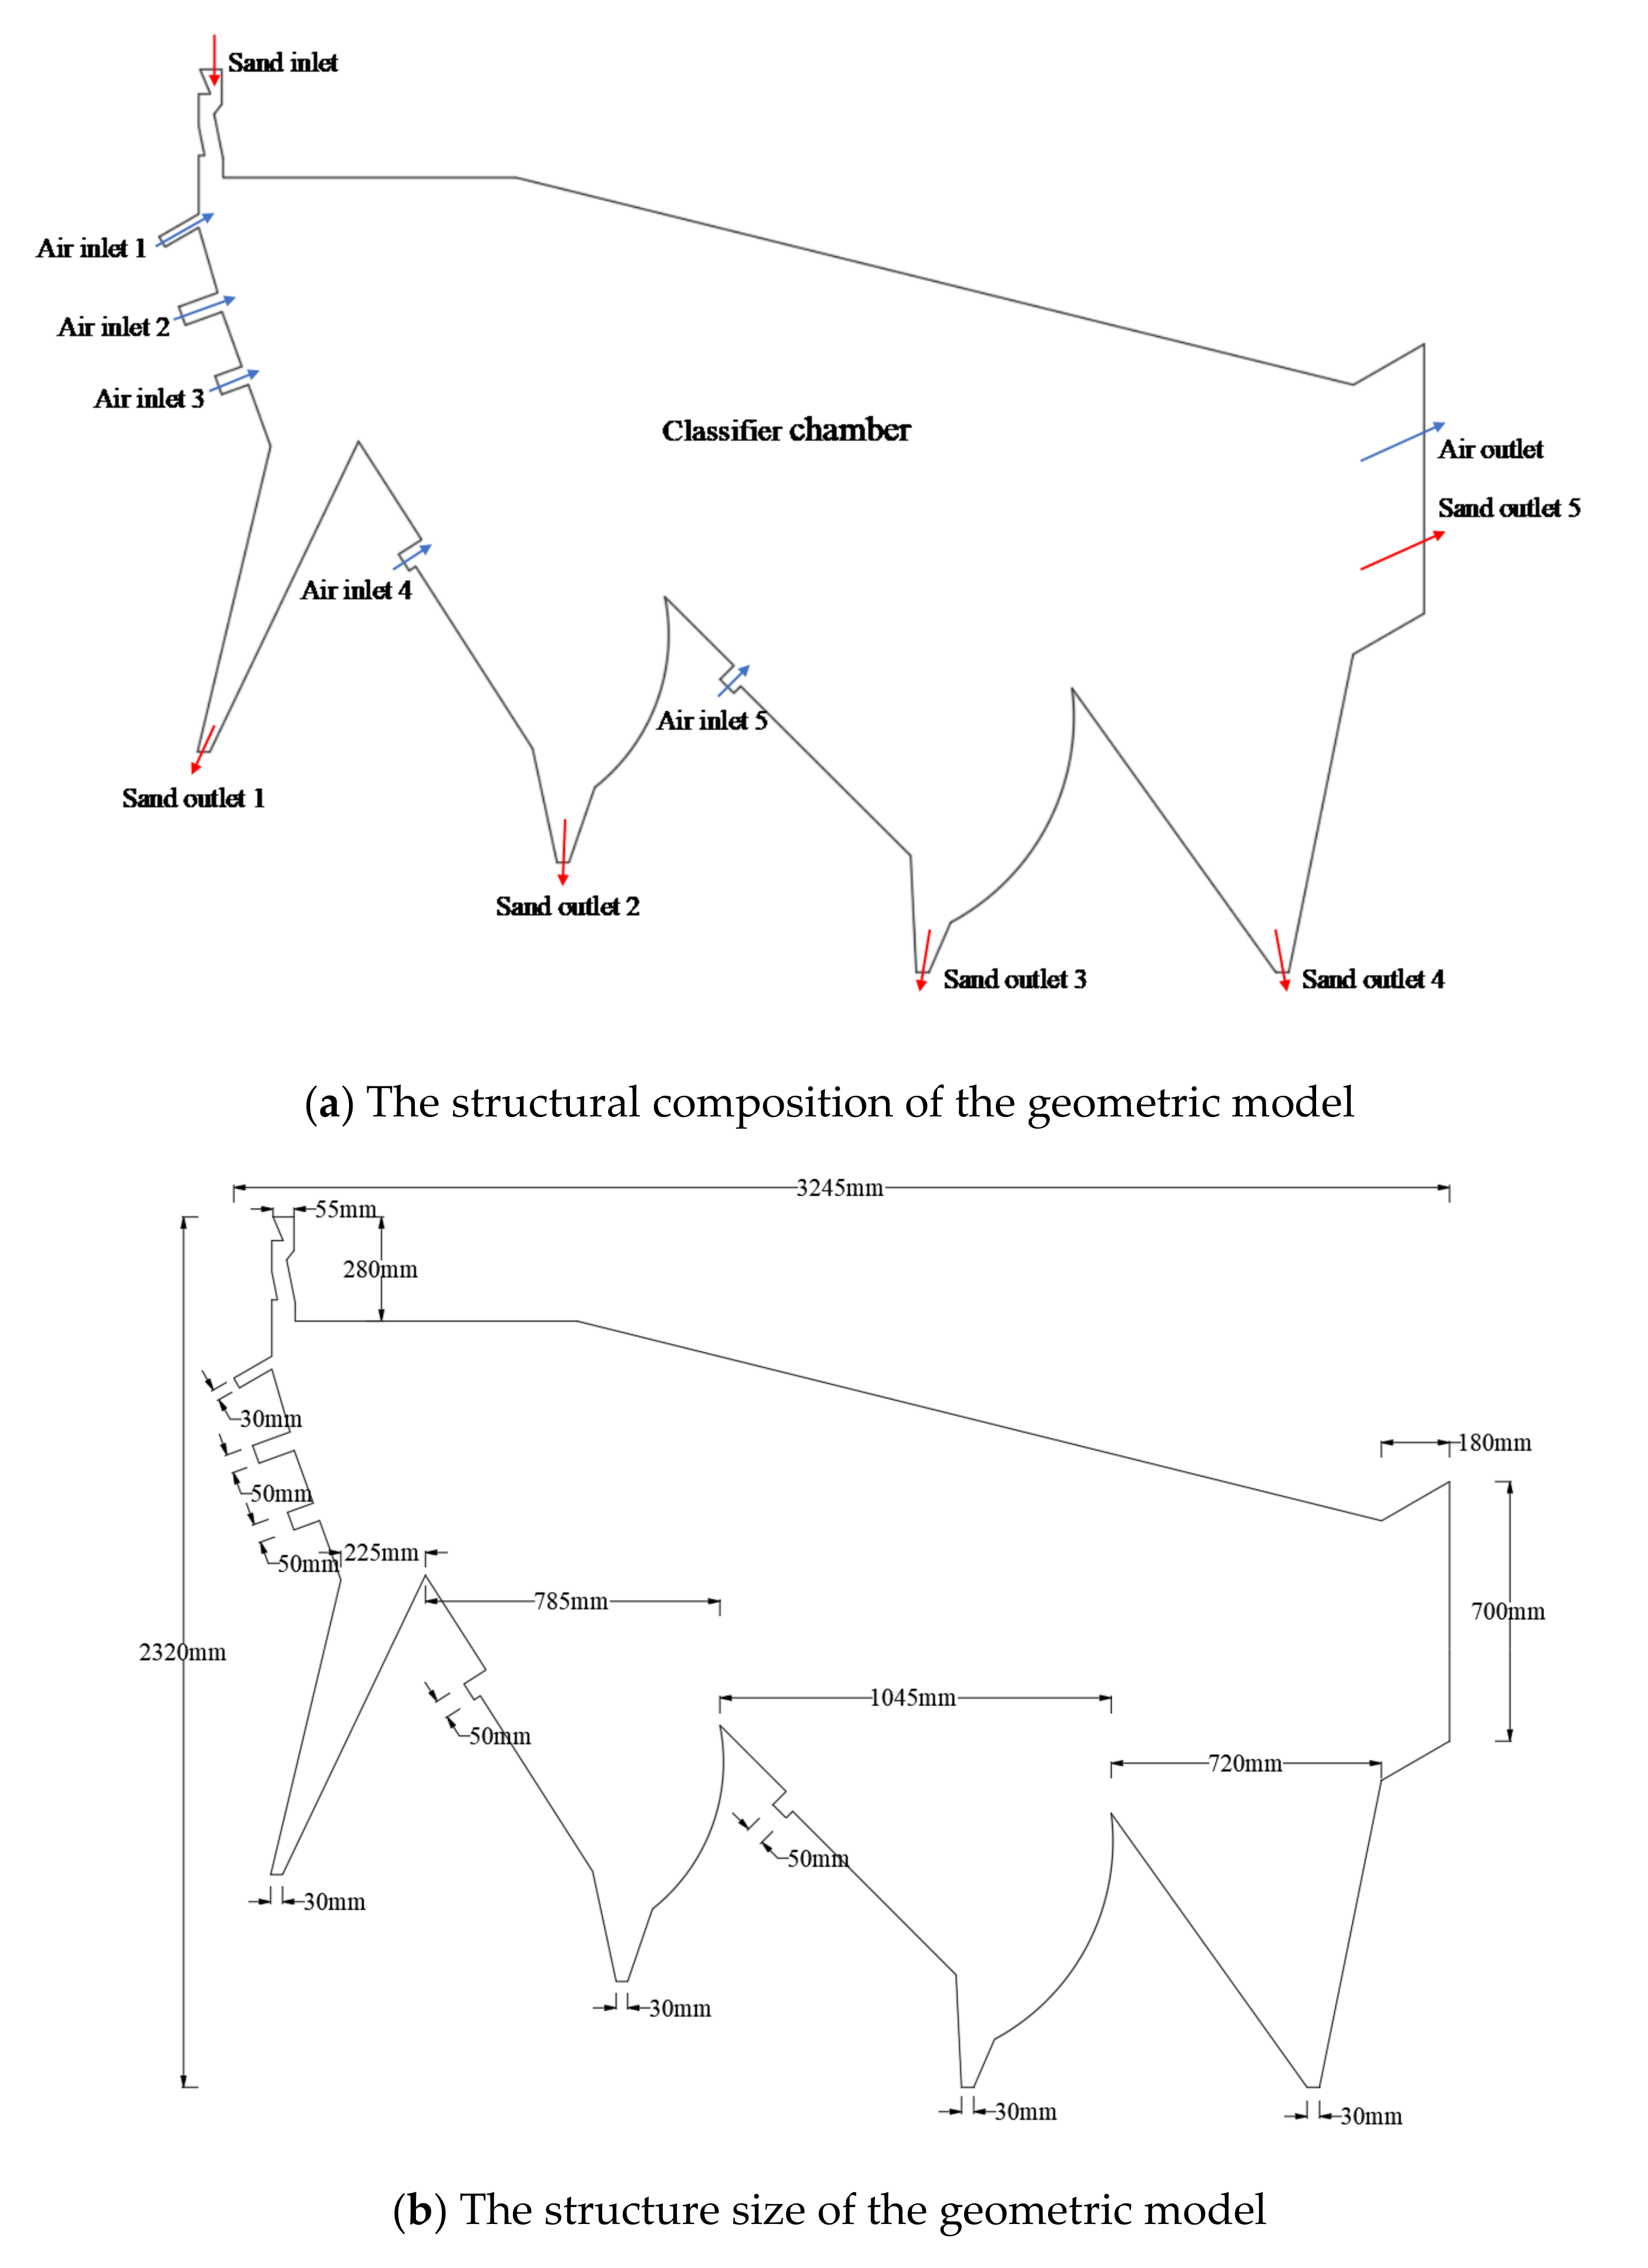
2. Geometric Model
3. Numerical Methods
3.1. Governing Equations for CPFD
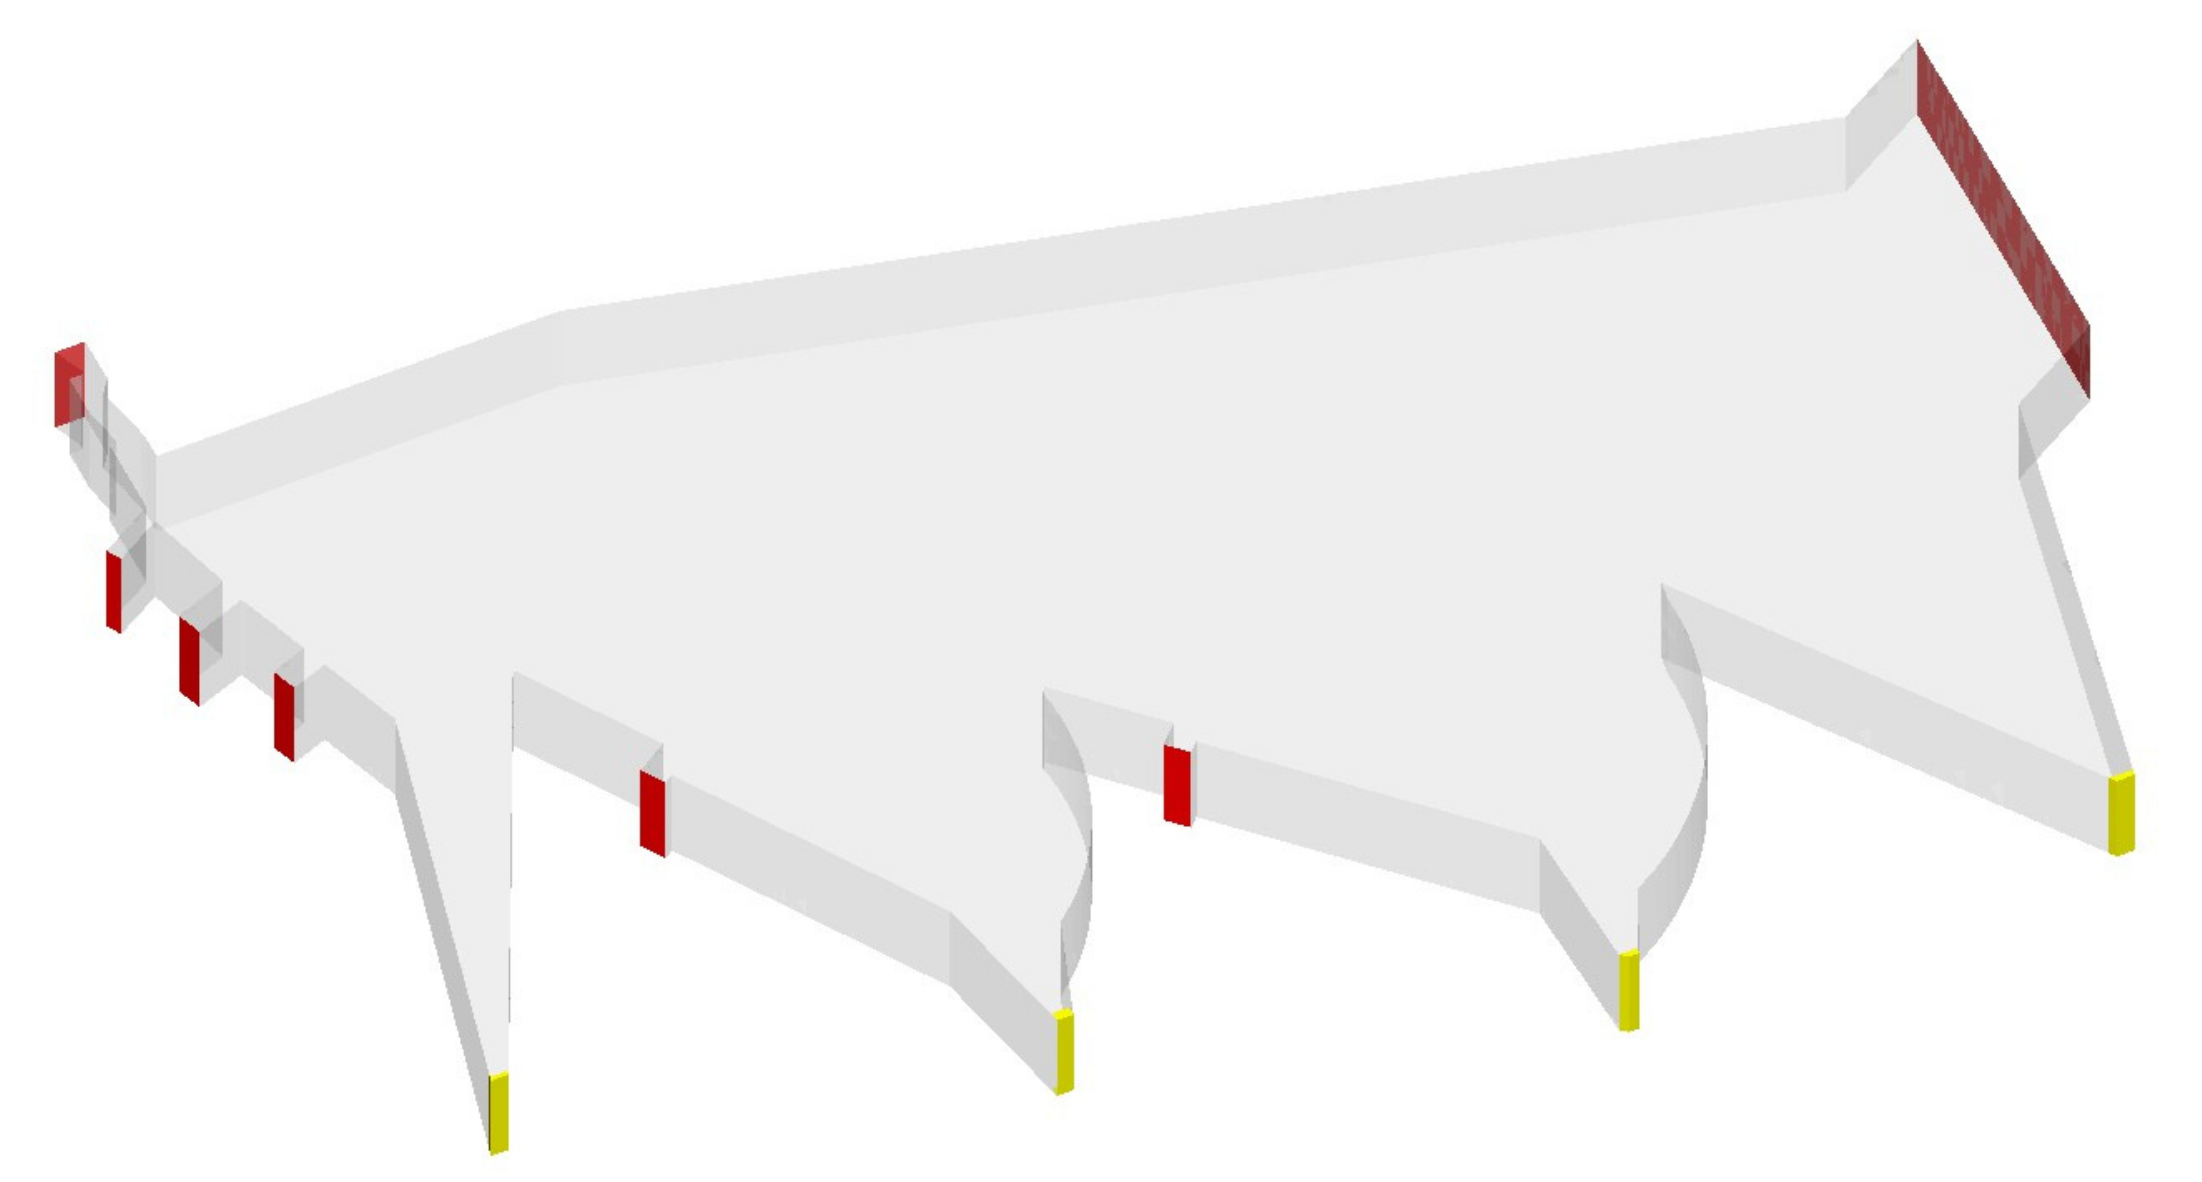
3.2. Numerical Simulation Model
3.3. Boundary Condition
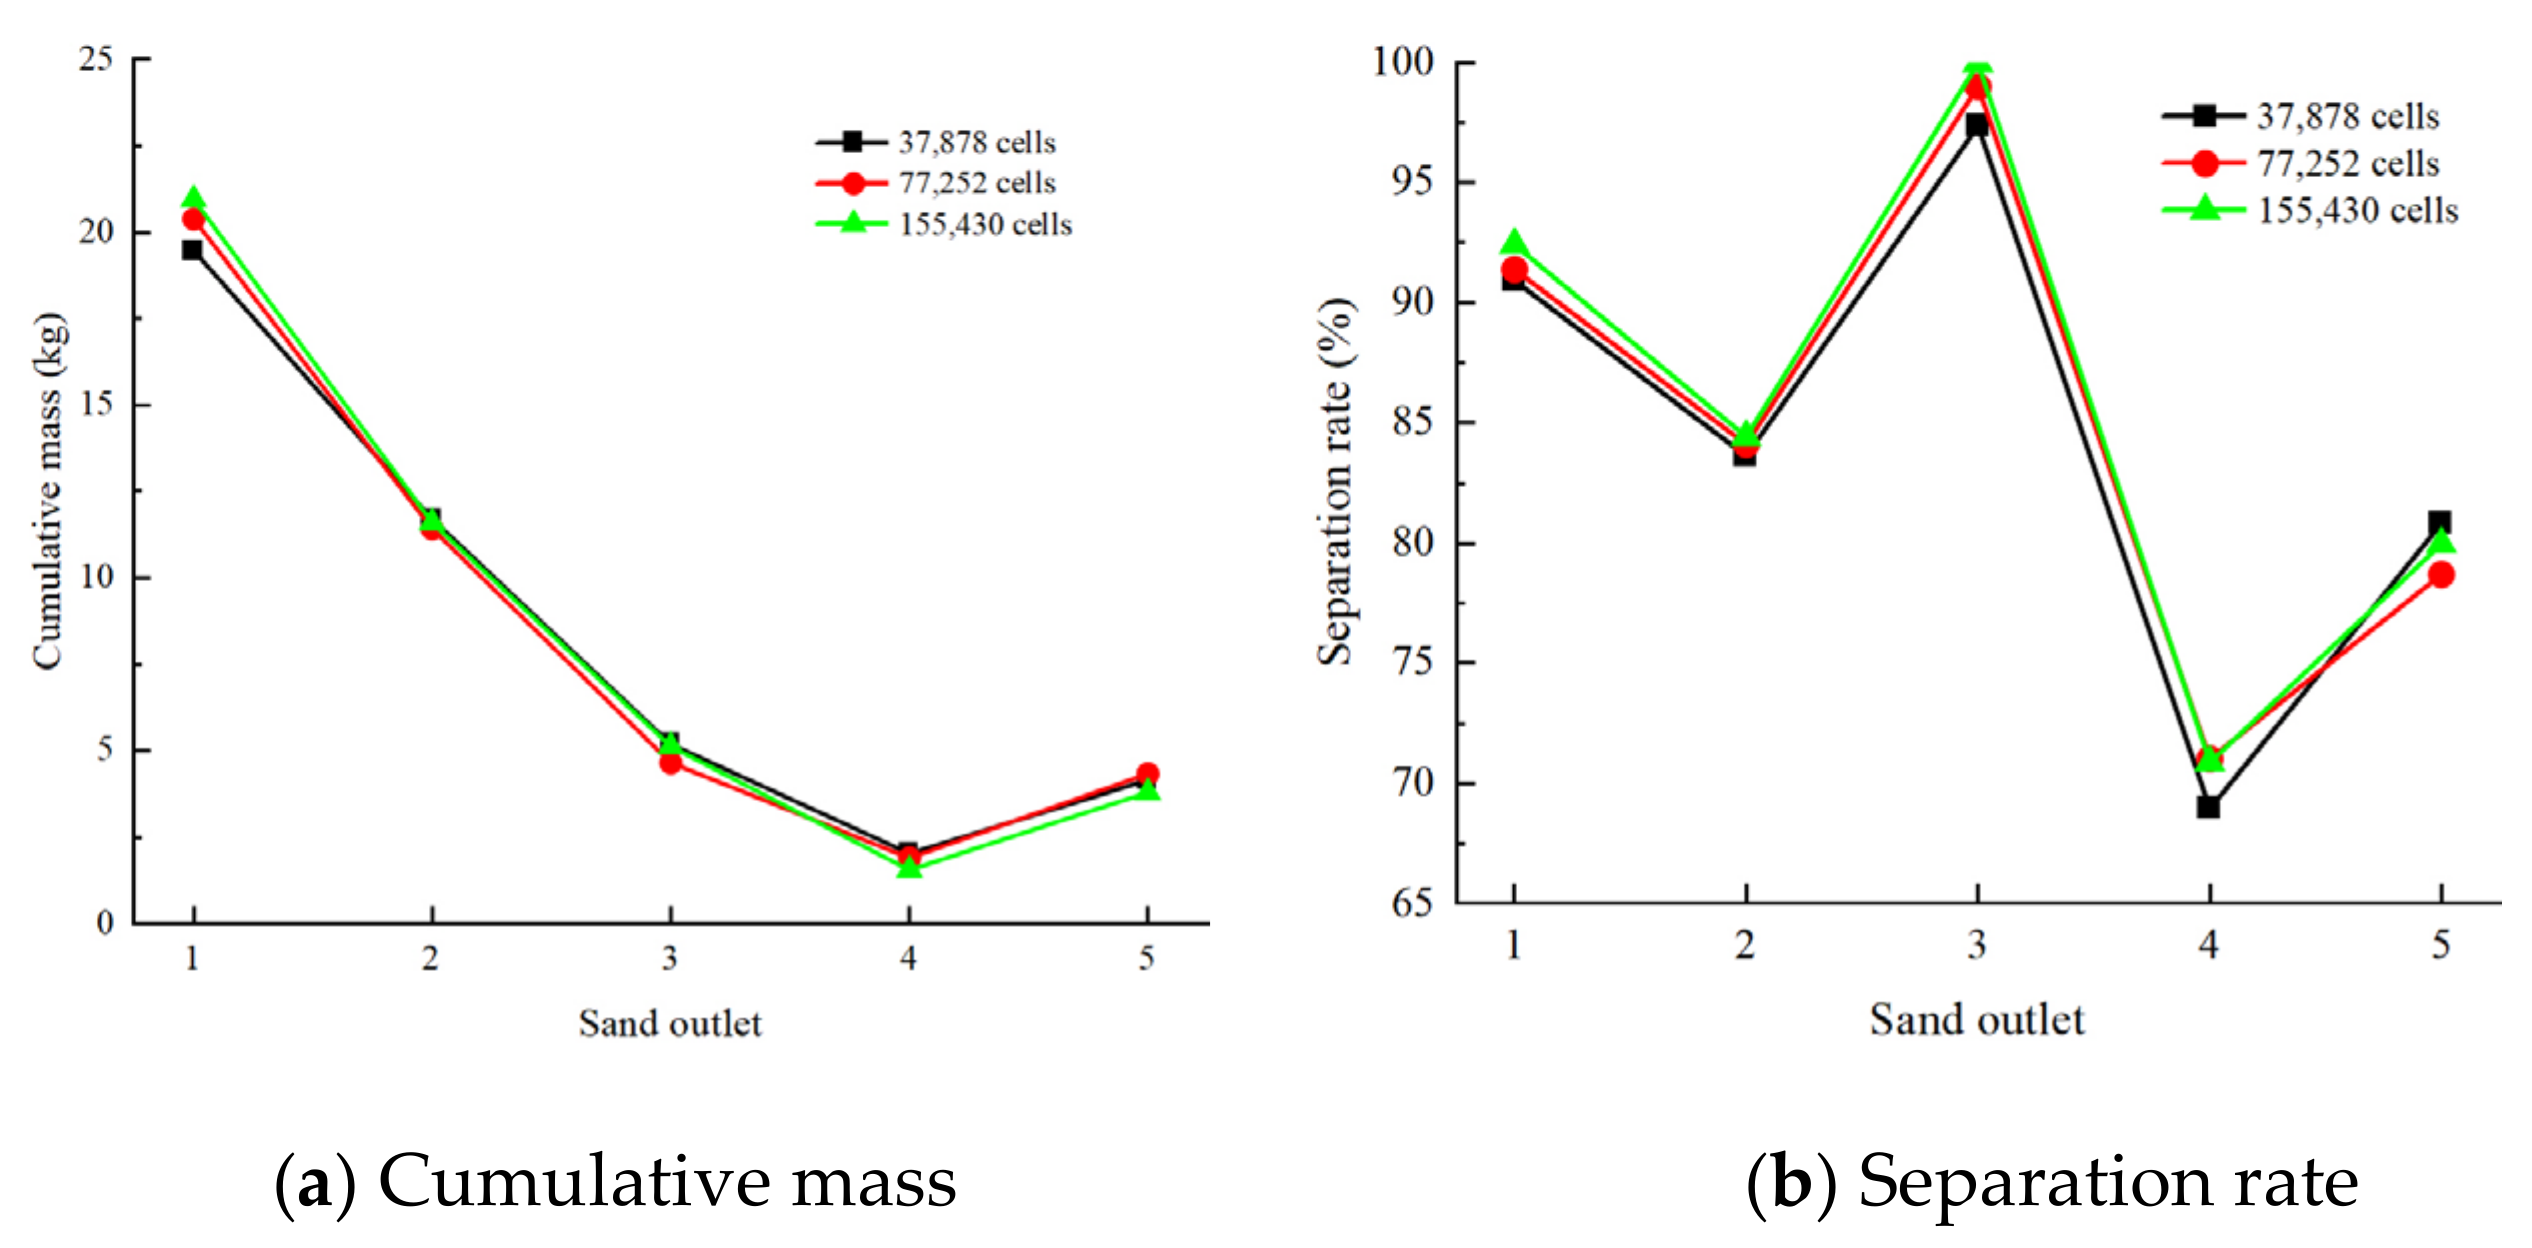
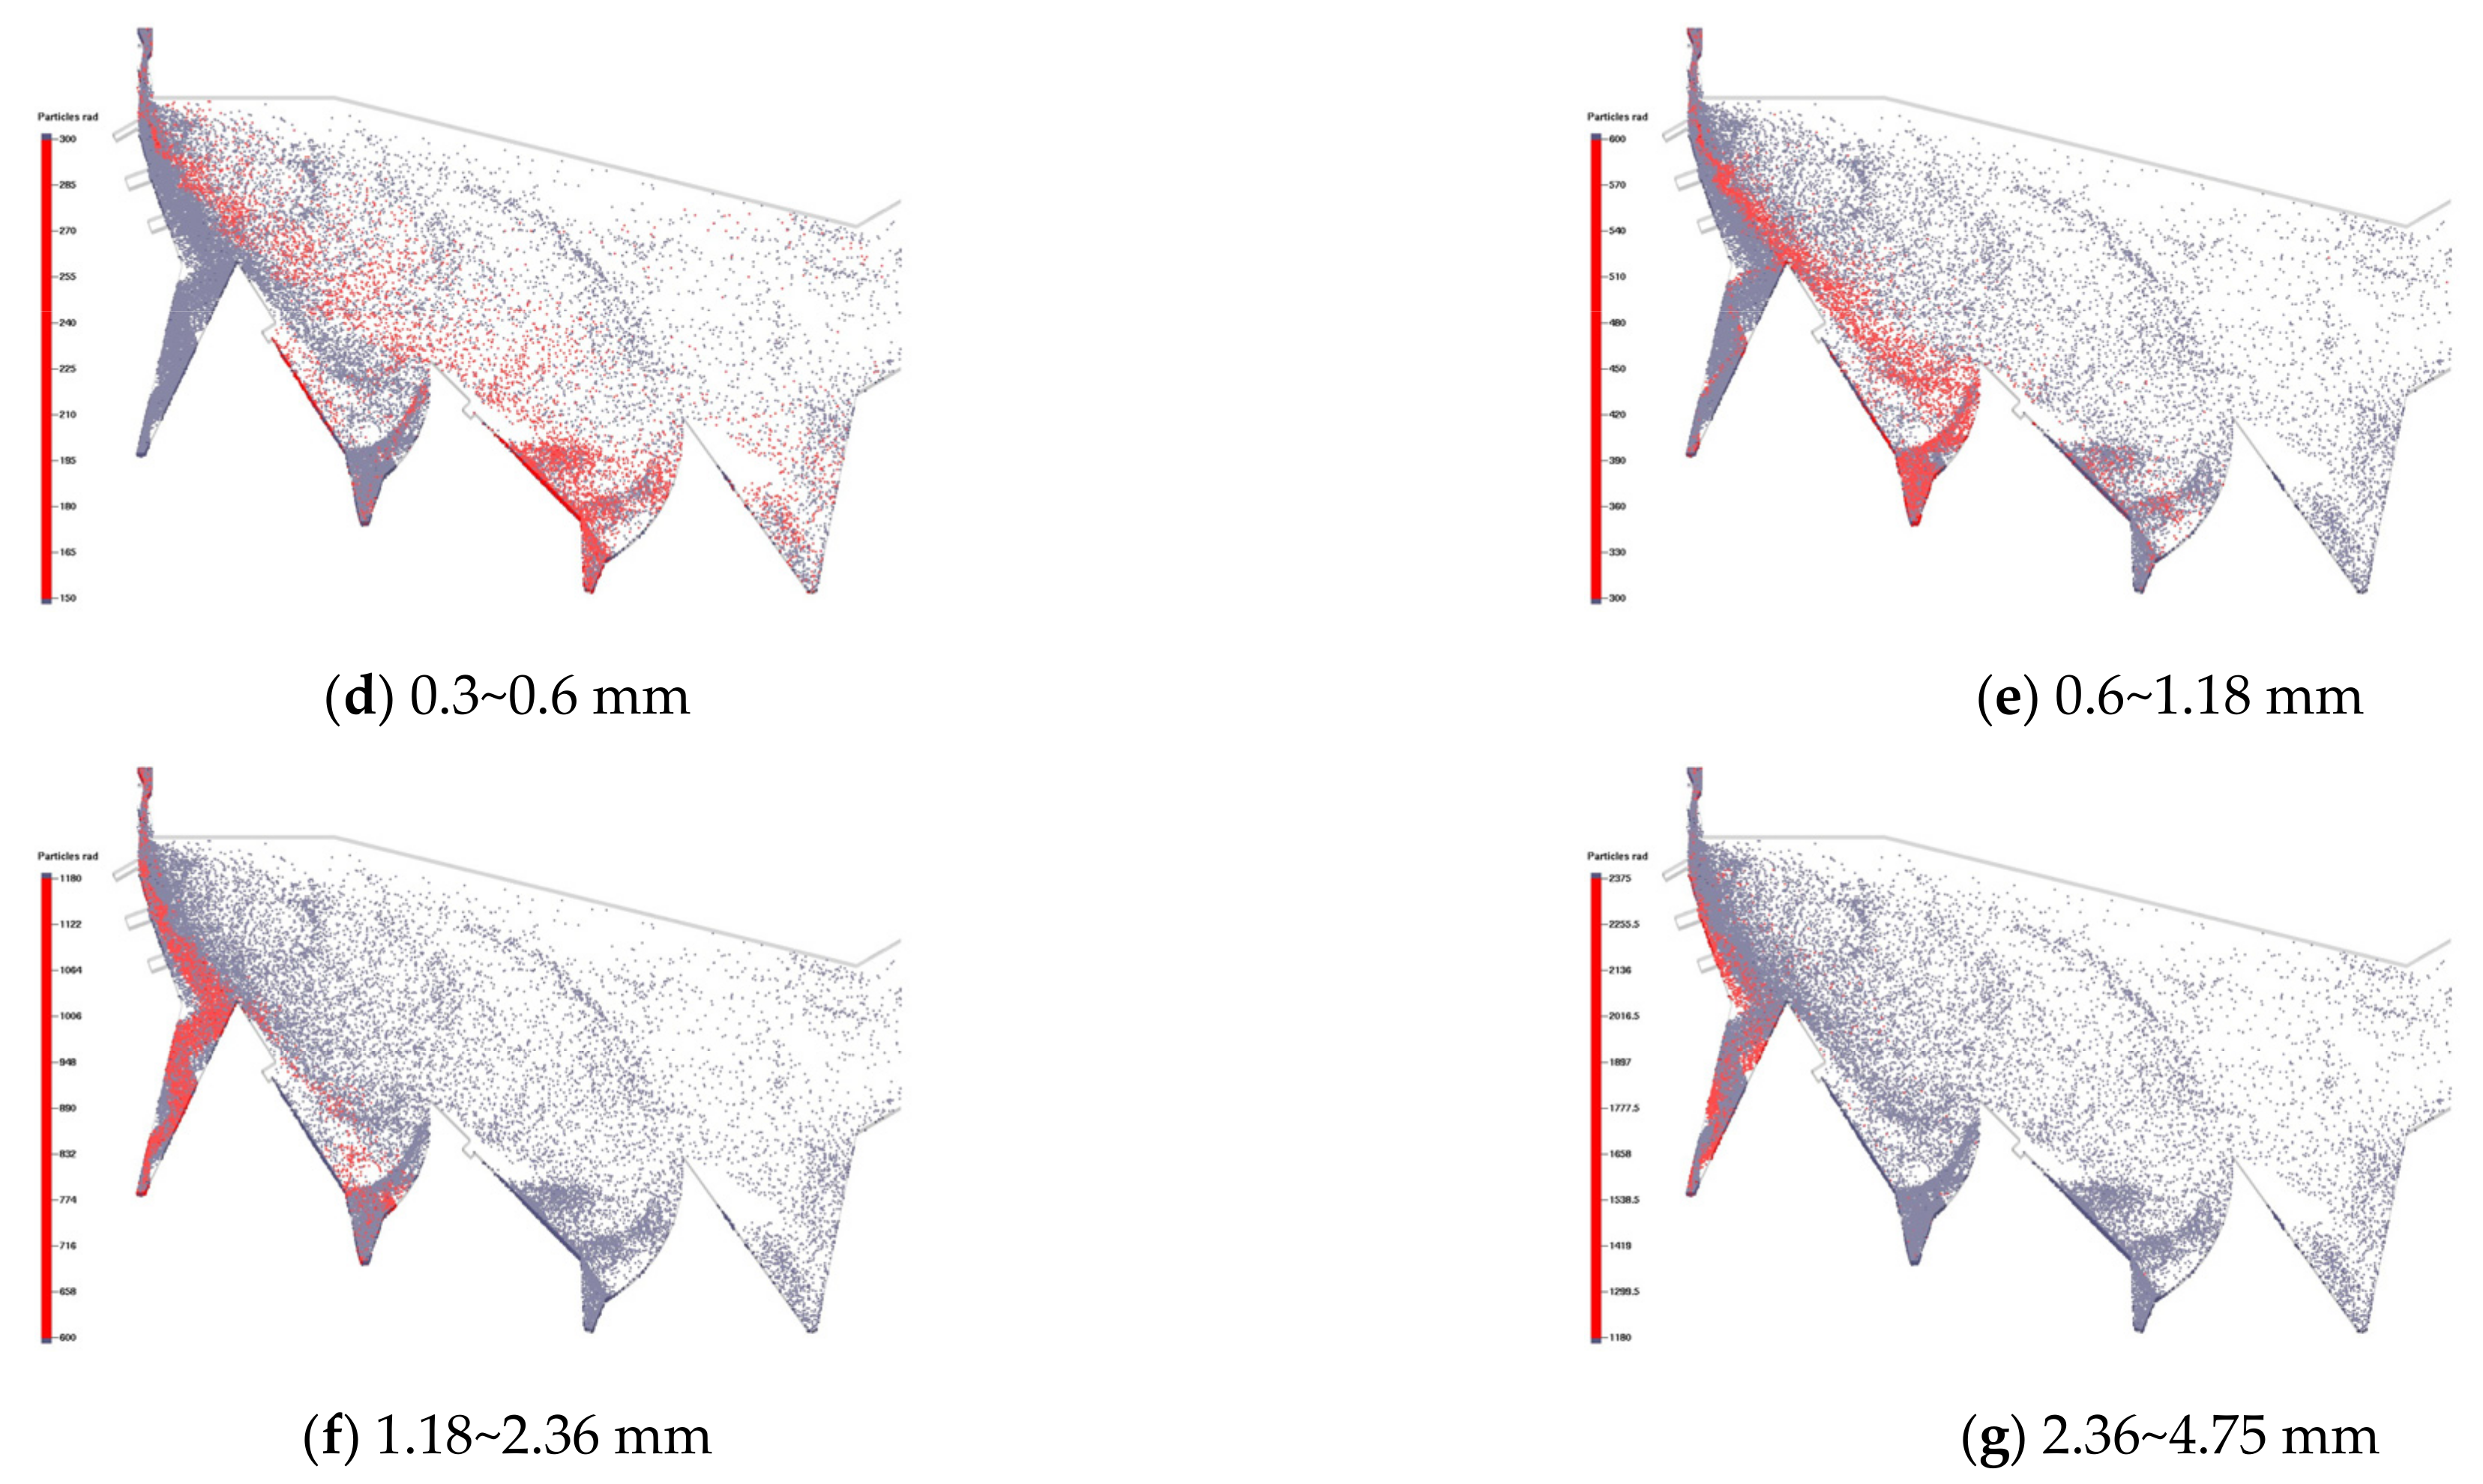
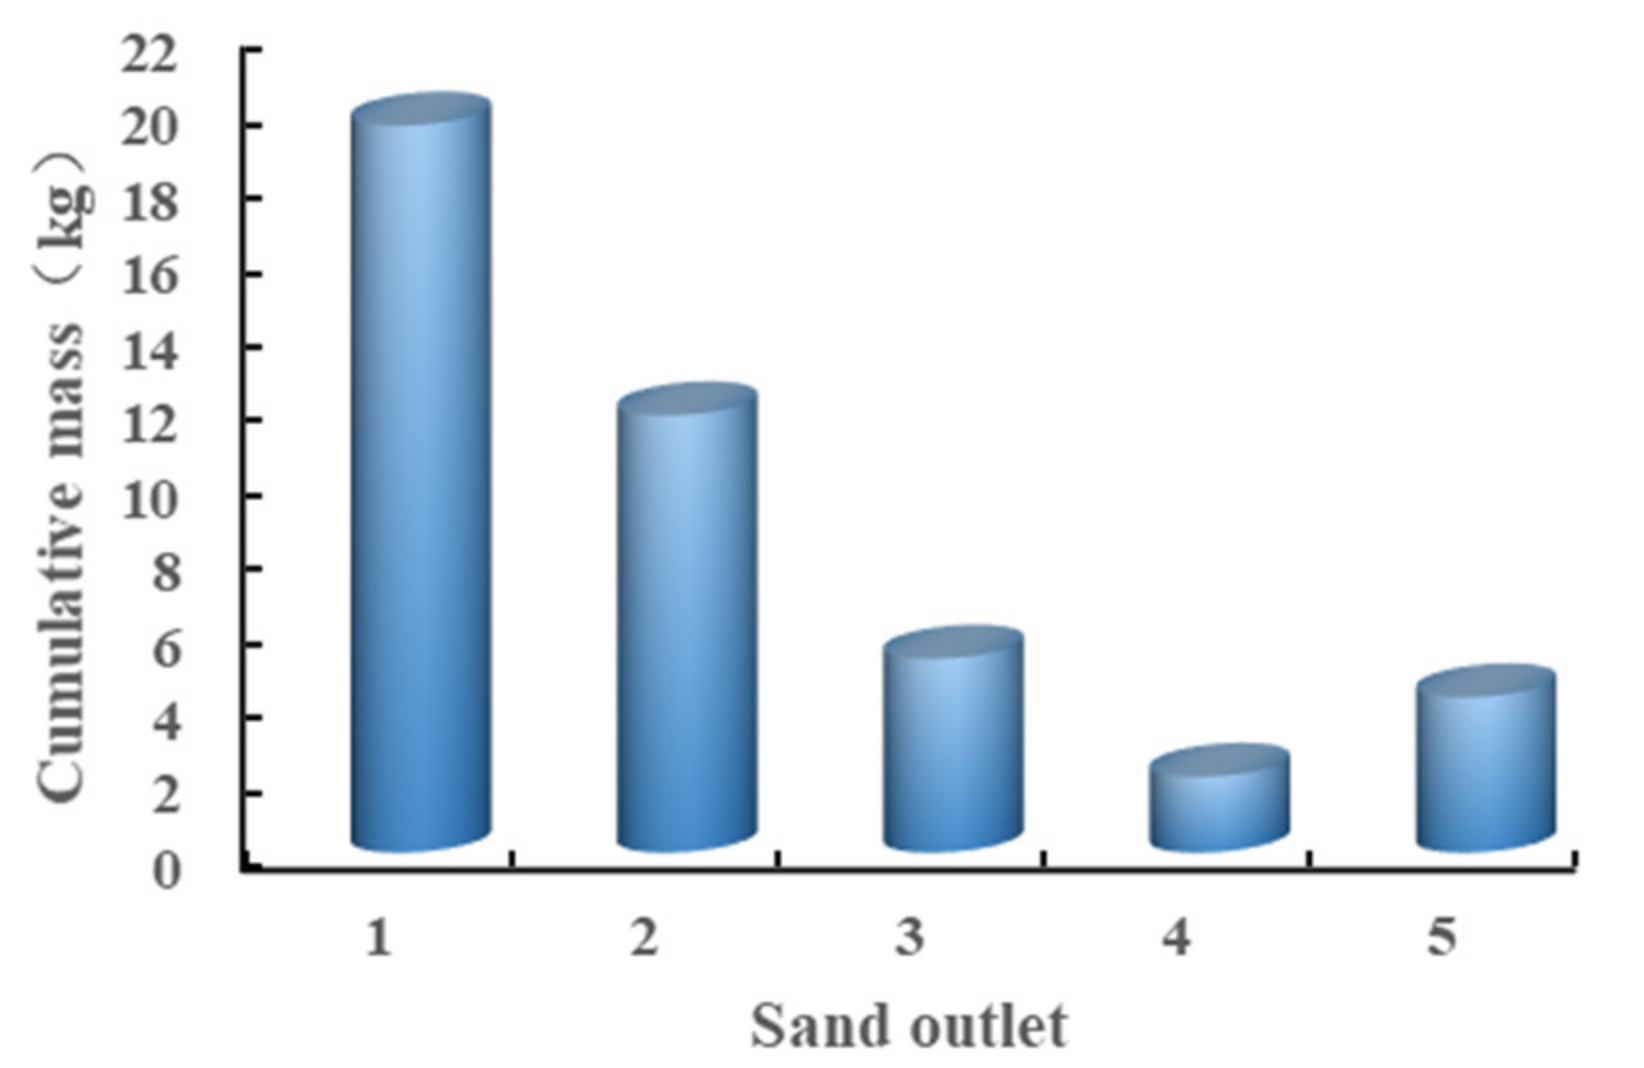
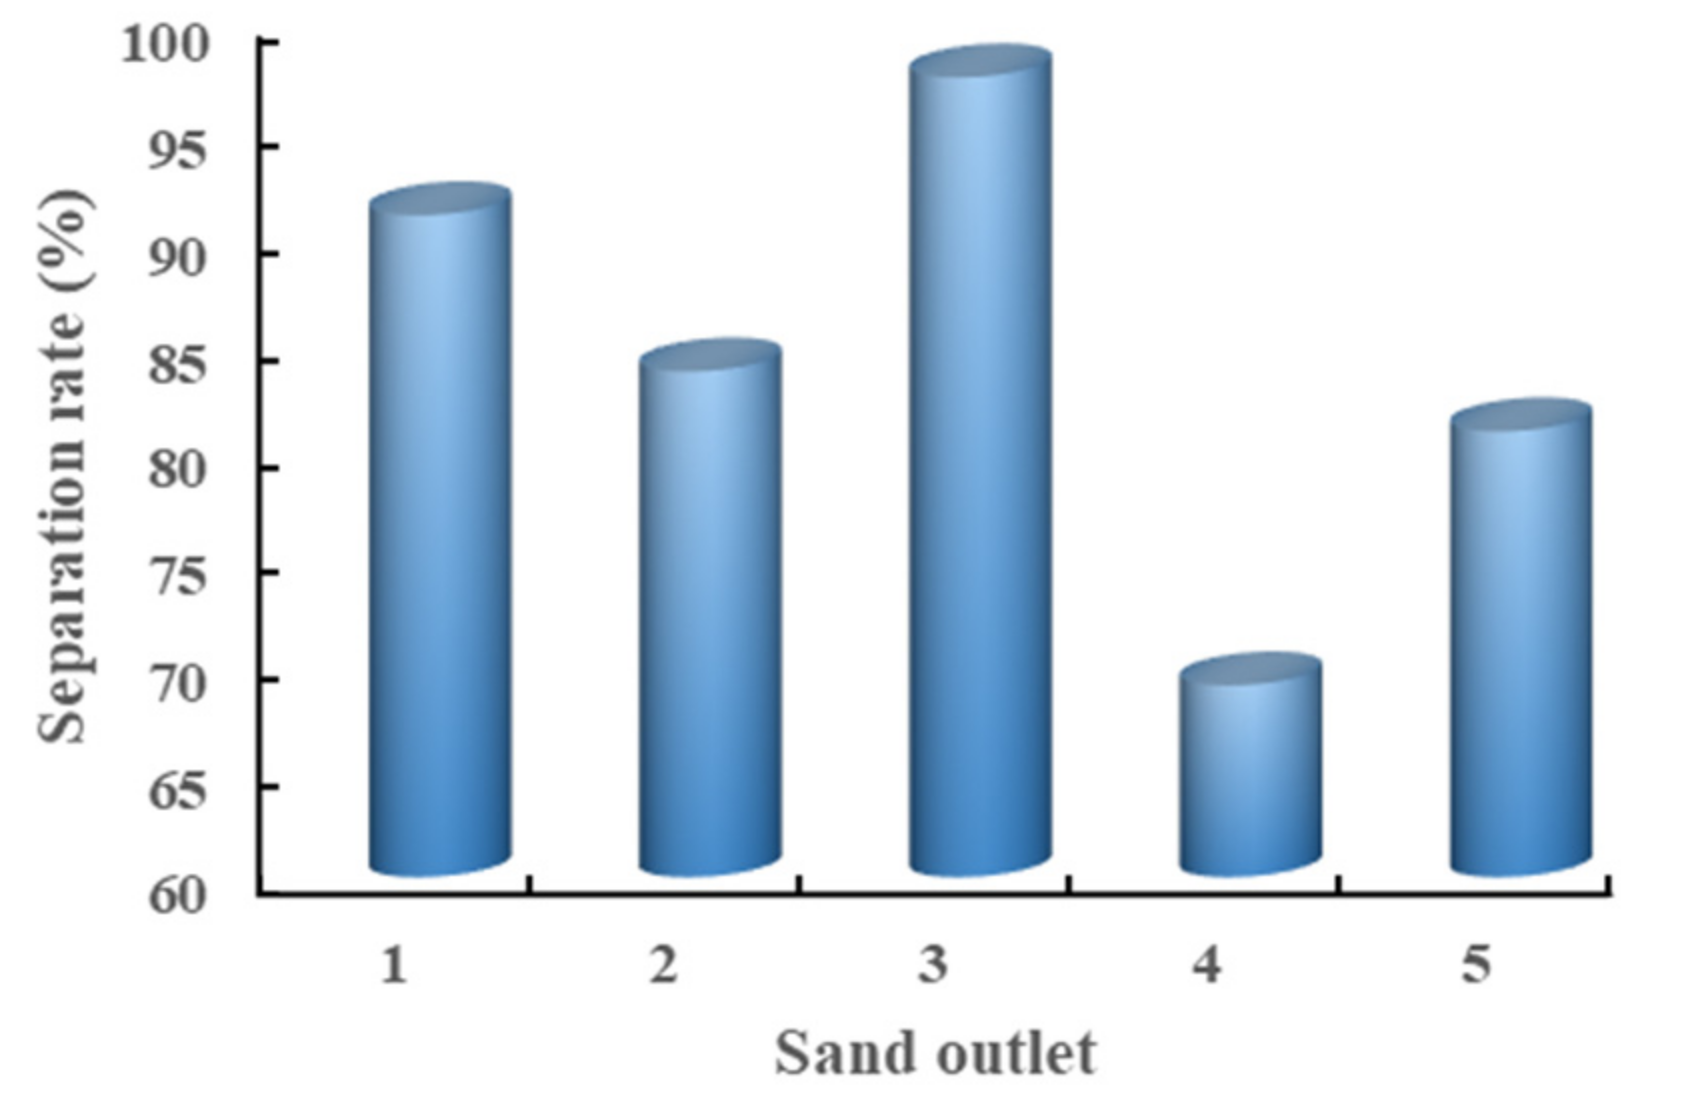
3.4. Simulation Results of the Original Scheme
4. The Effects of Airflow Velocity on the Sand Classification
4.1. Simulation Scheme
4.2. Results and Discussion
5. Simulation of the Optimal Air Velocity Combination
5.1. Simulation Scheme
5.2. Results and Discussion
6. Conclusions
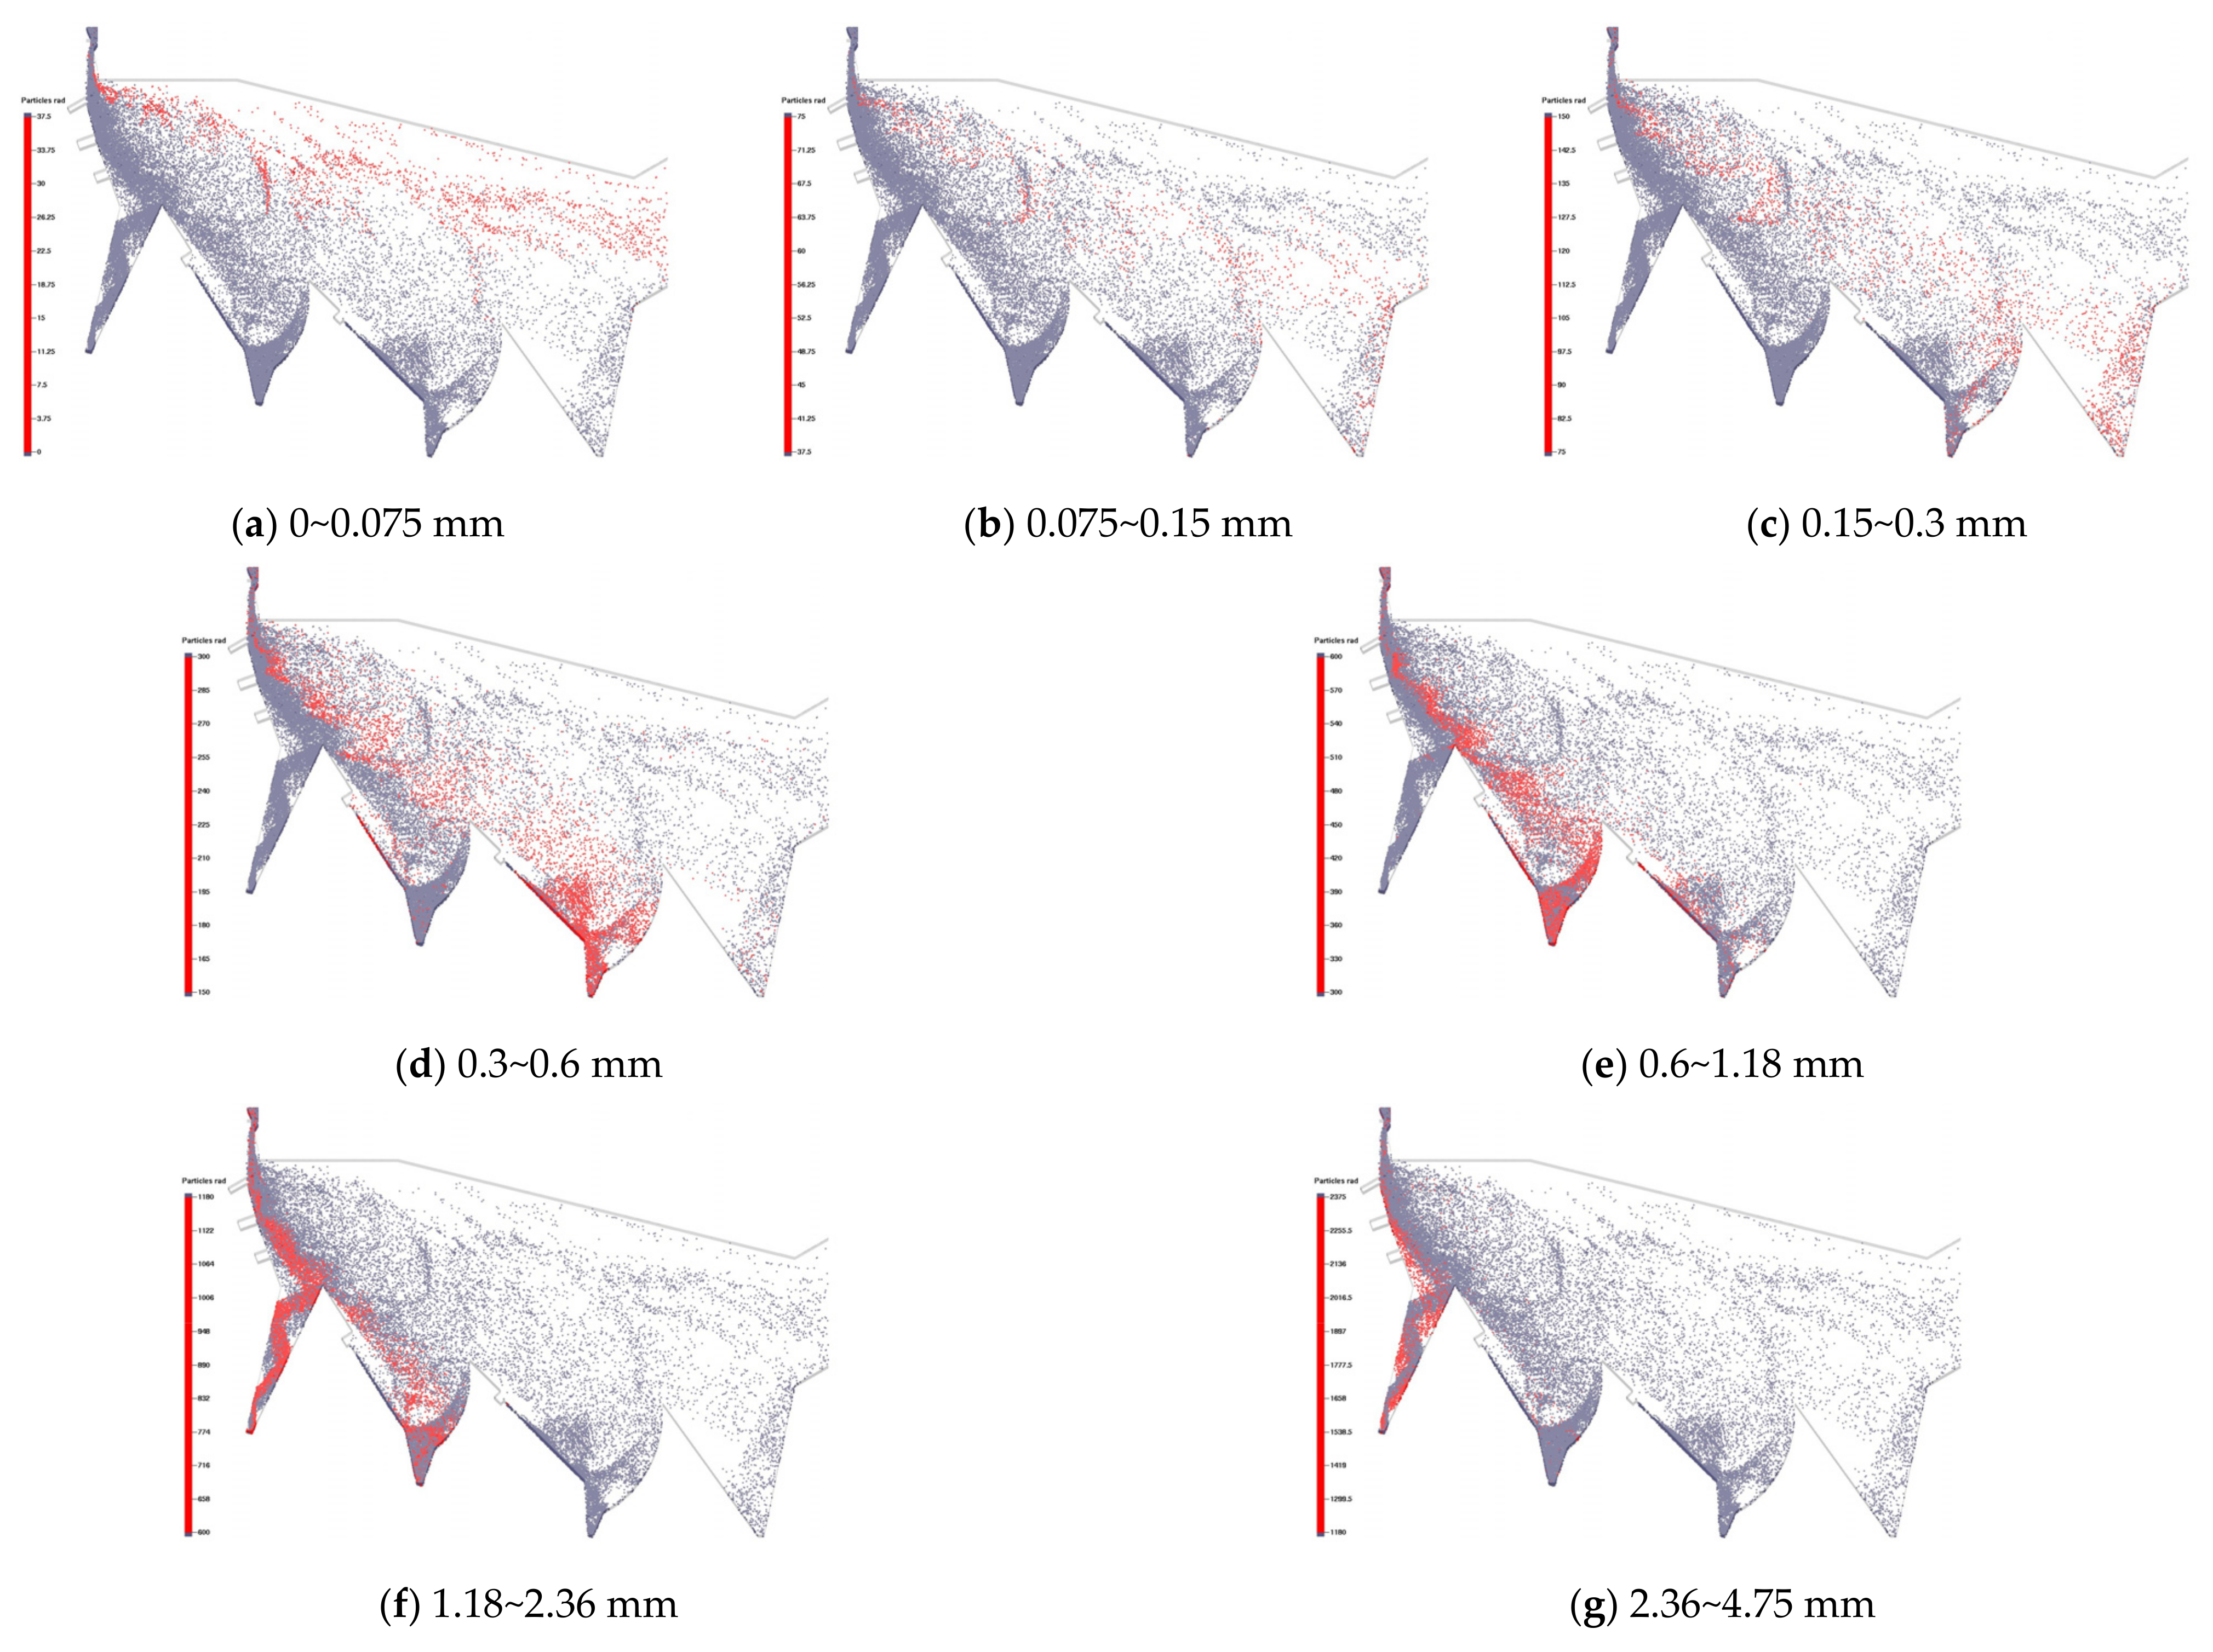
- The multi-air inlet equipment can classify the manufactured sand finely according to its particle size grade. The original scheme can classify powder grain (0~0.15 mm) and coarse grain (1.18~4.75 mm), but the classification accuracy of medium grain (0.15~1.18 mm) needs to be improved.
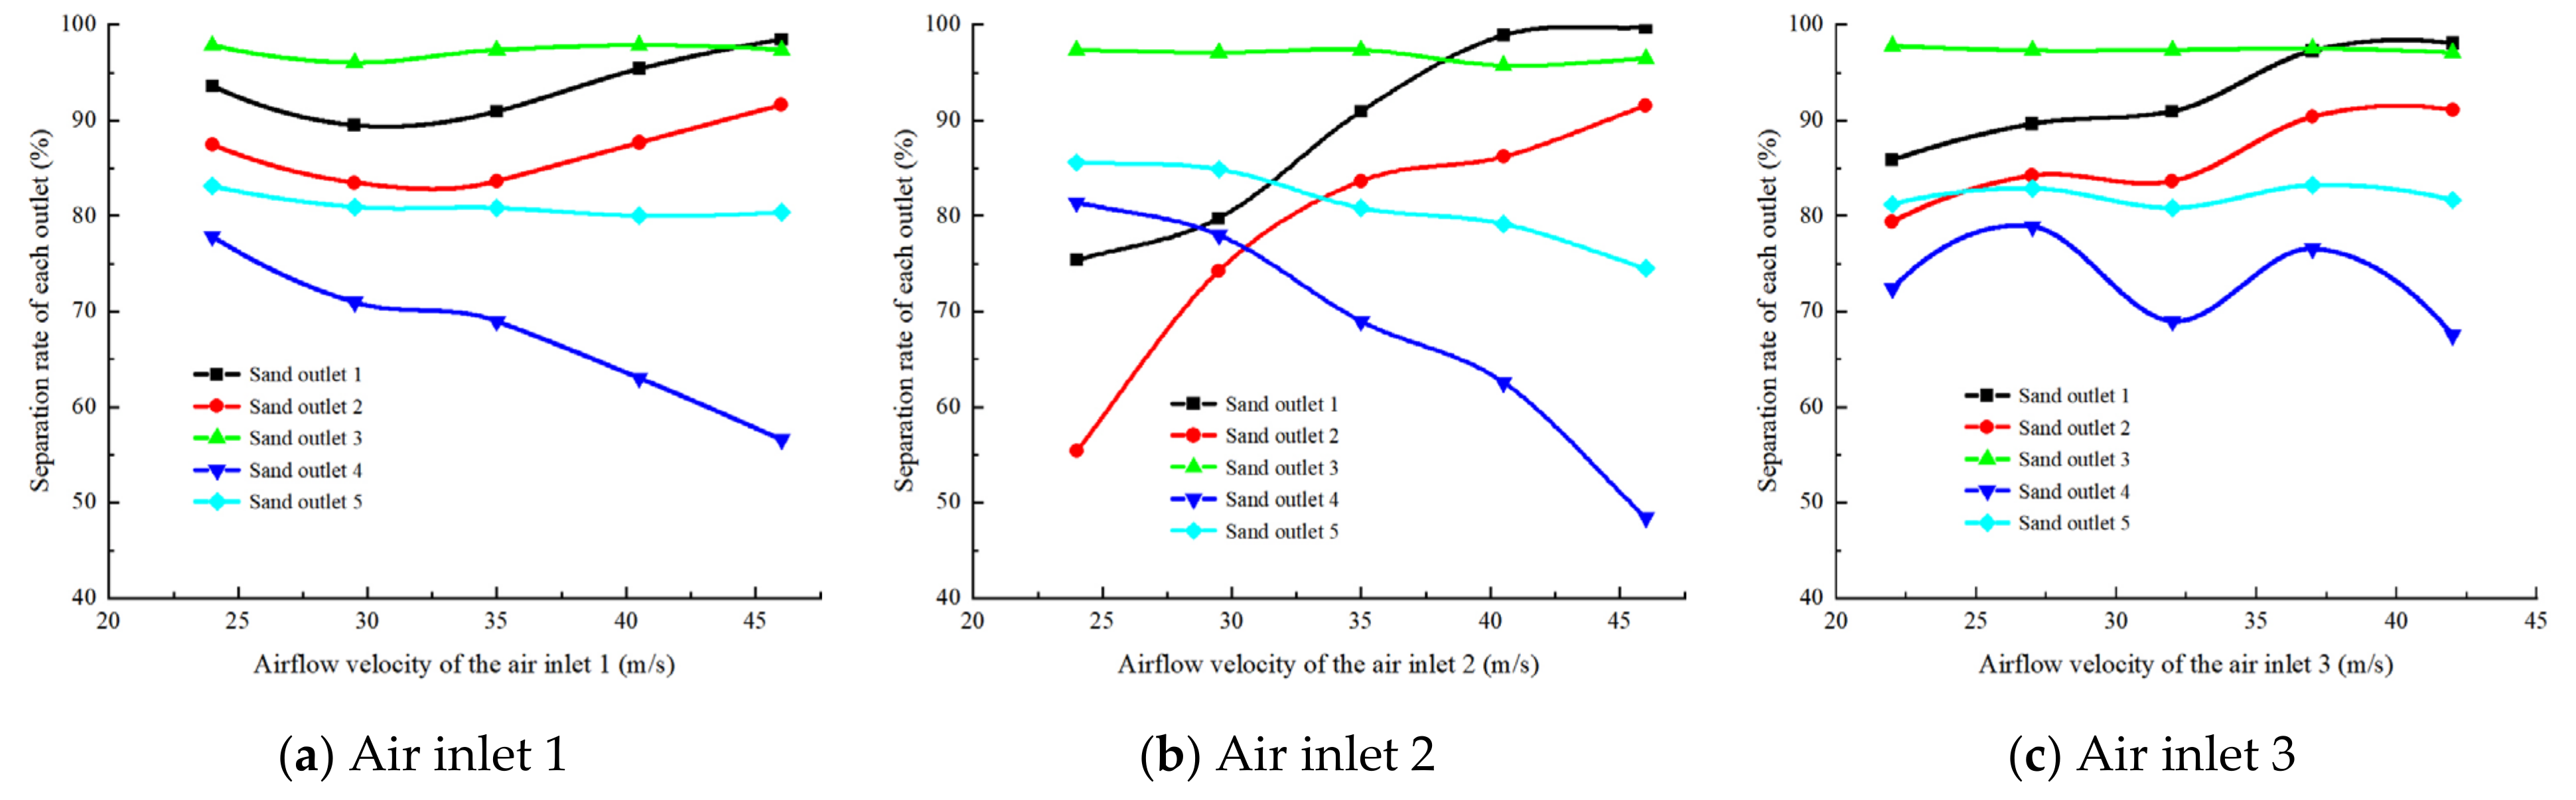
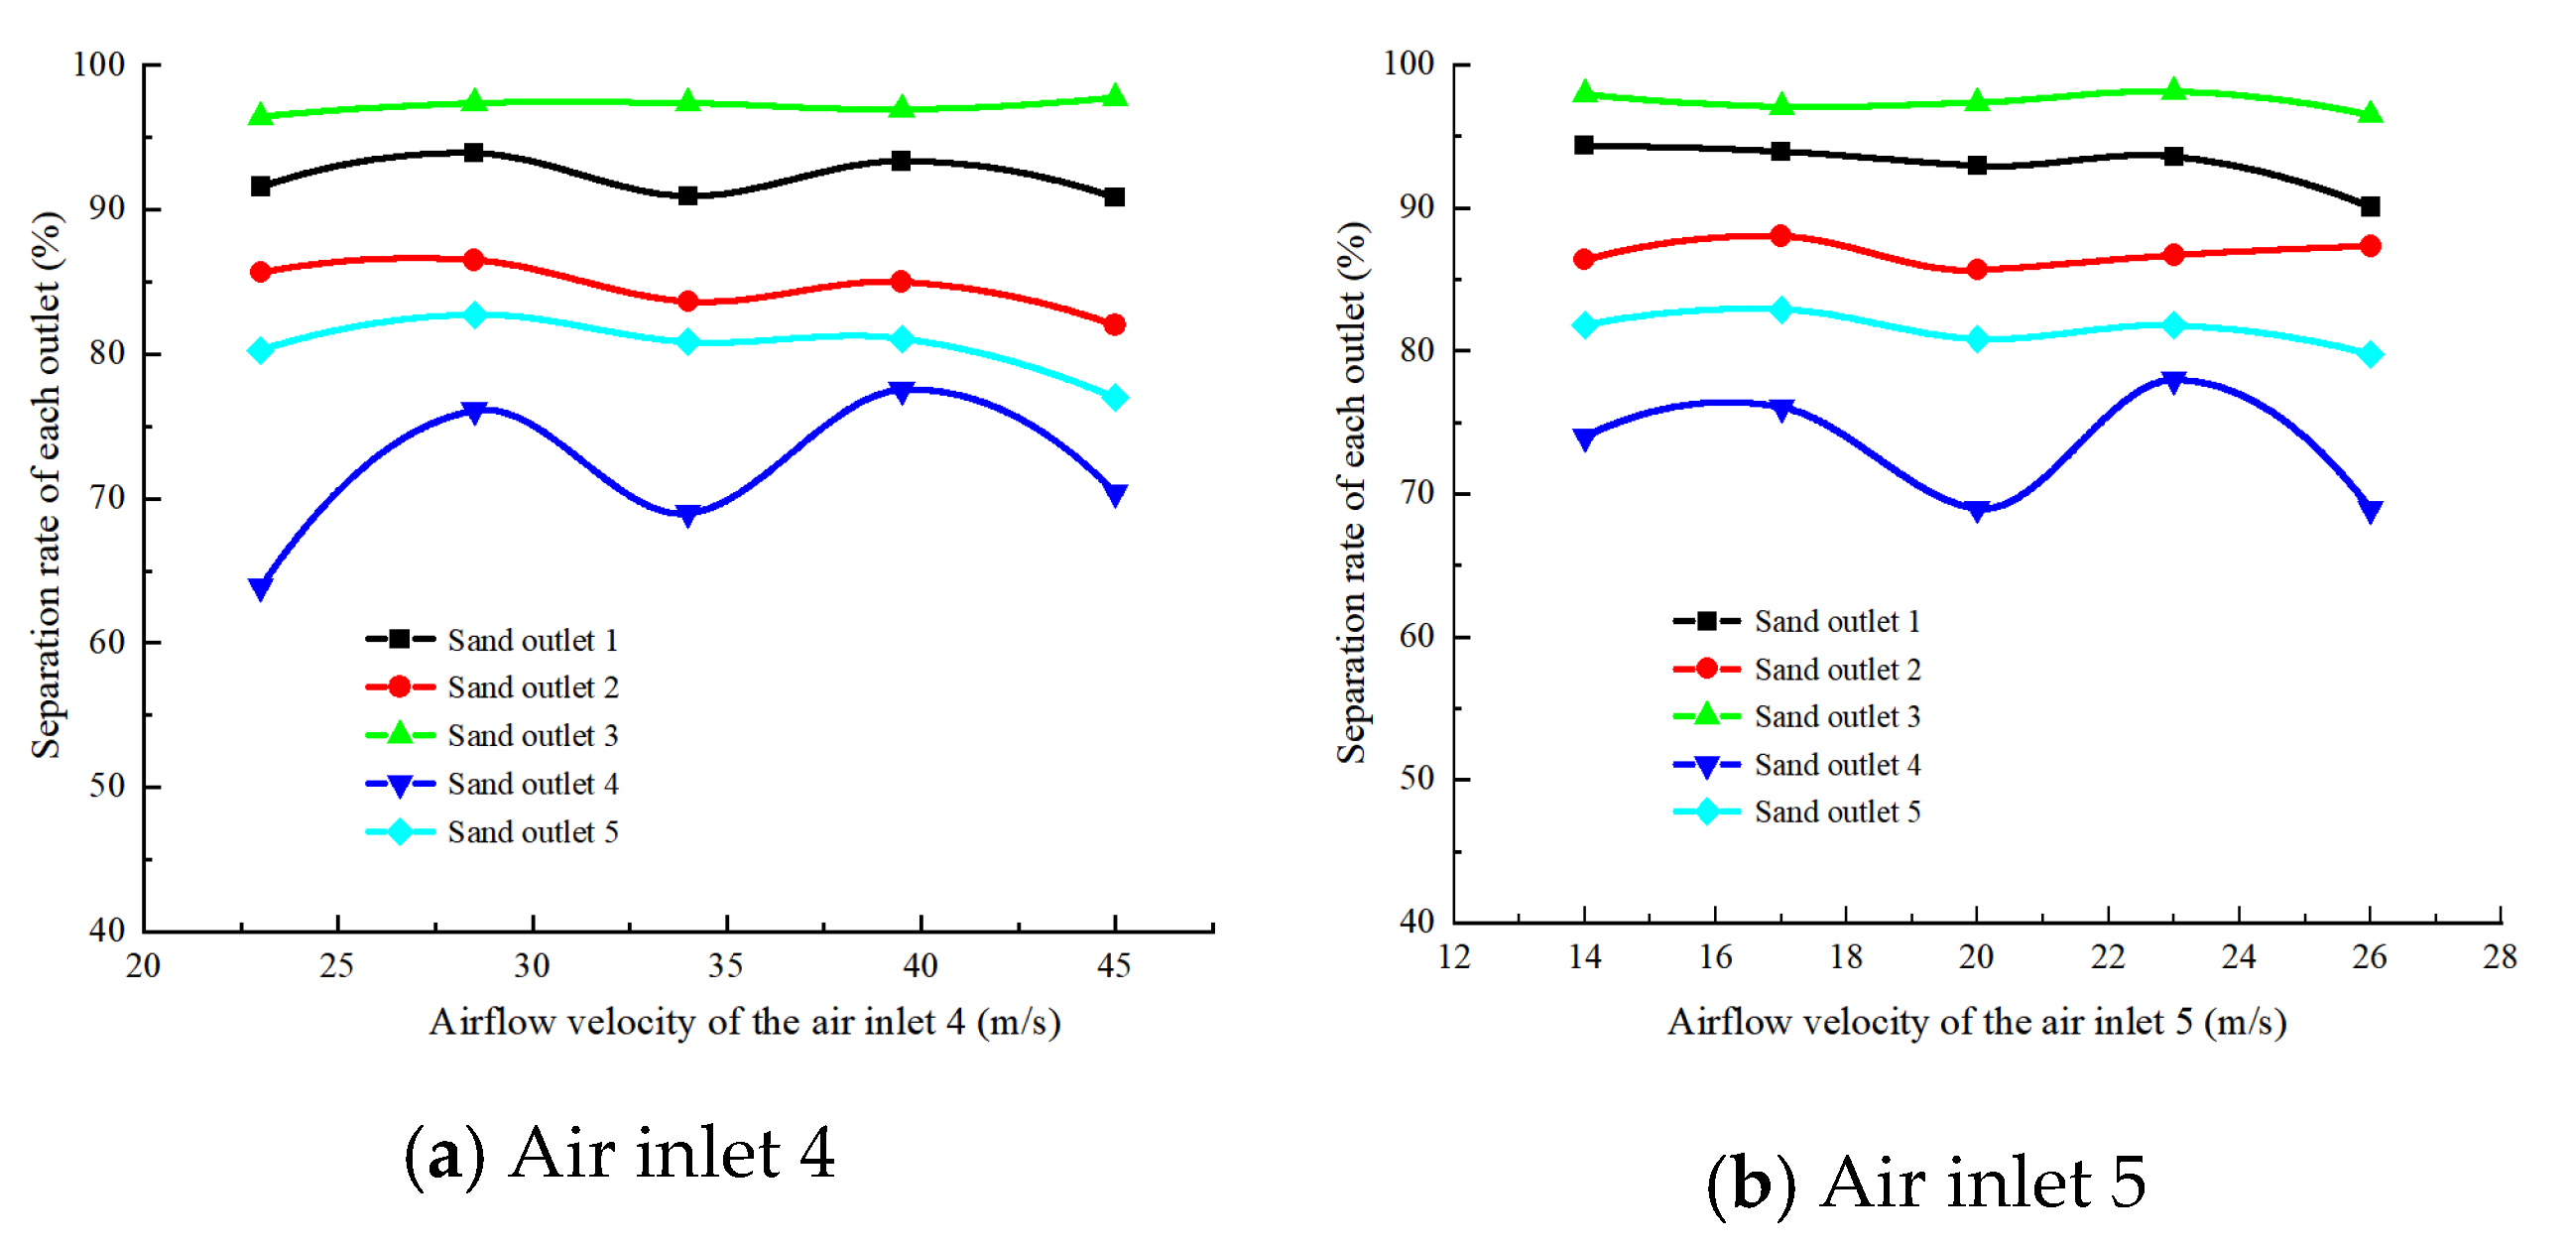
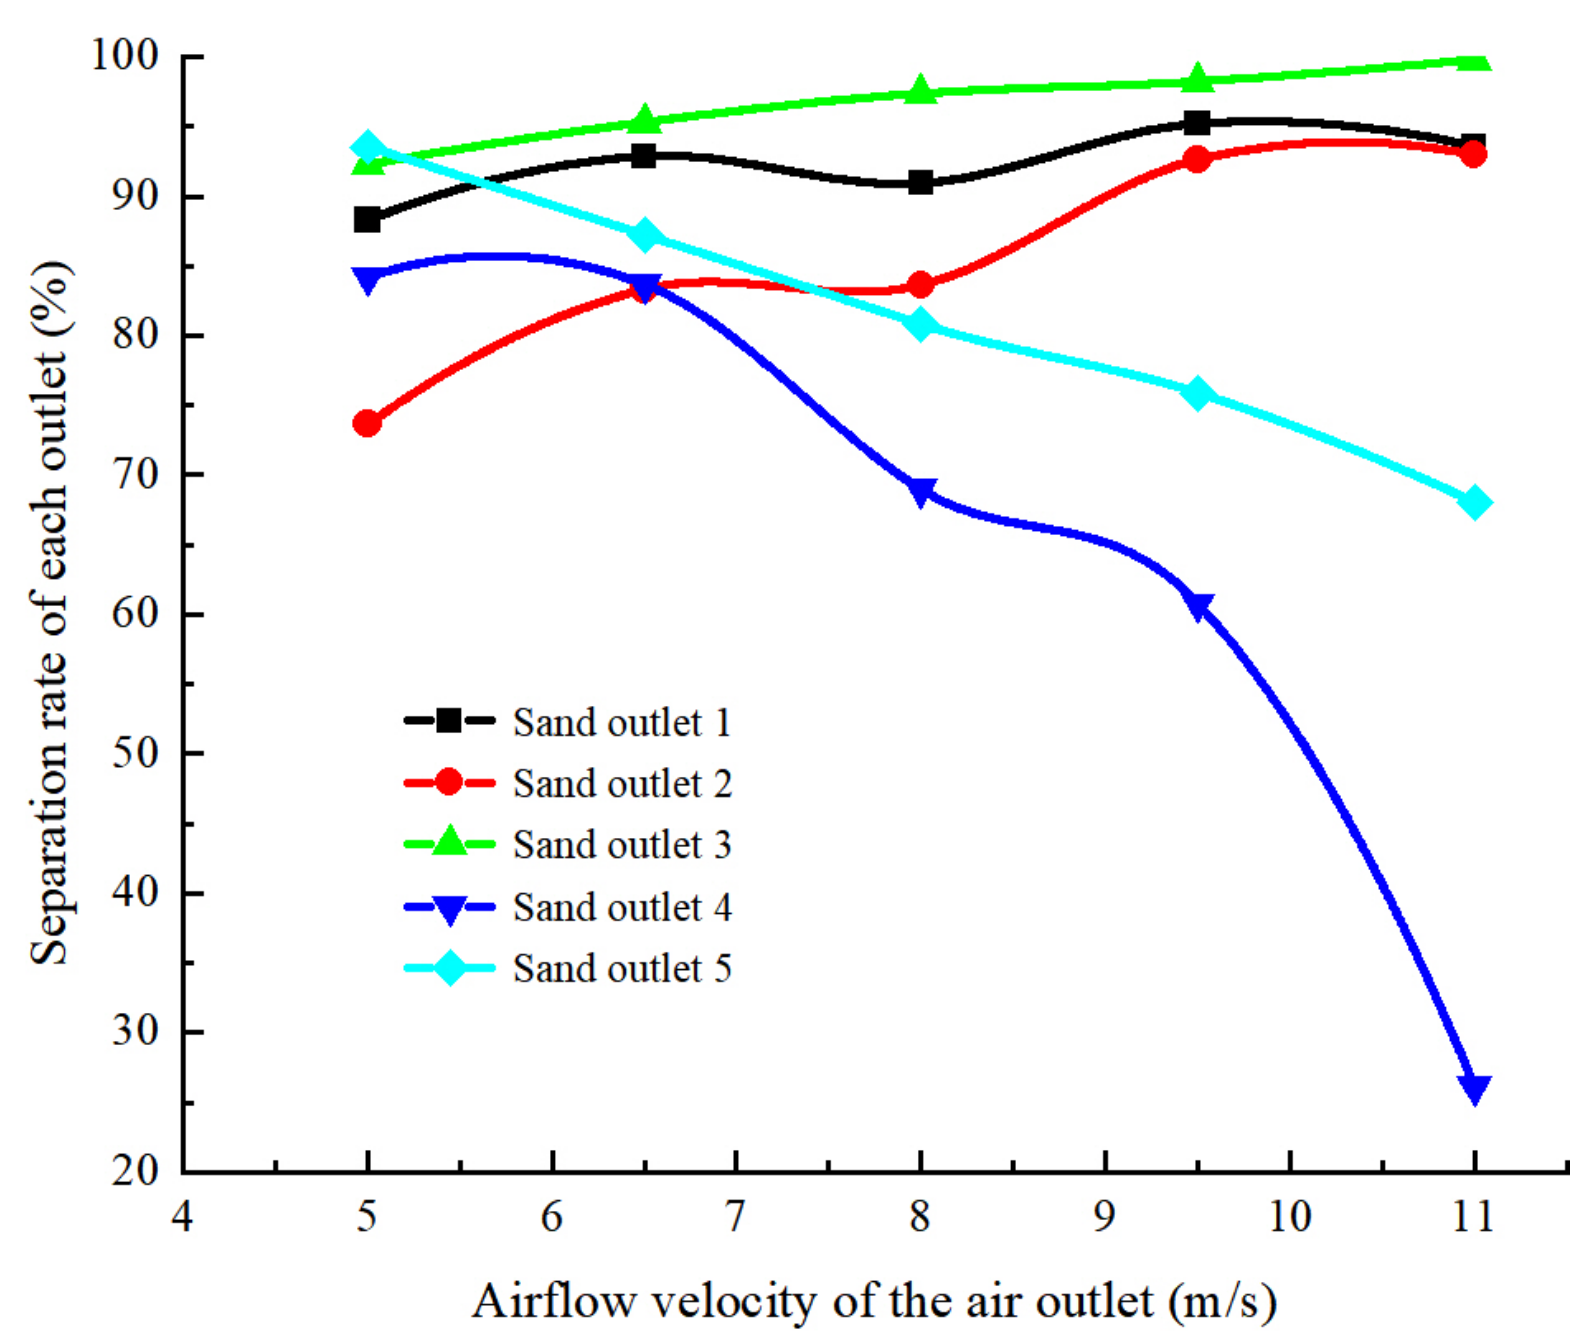
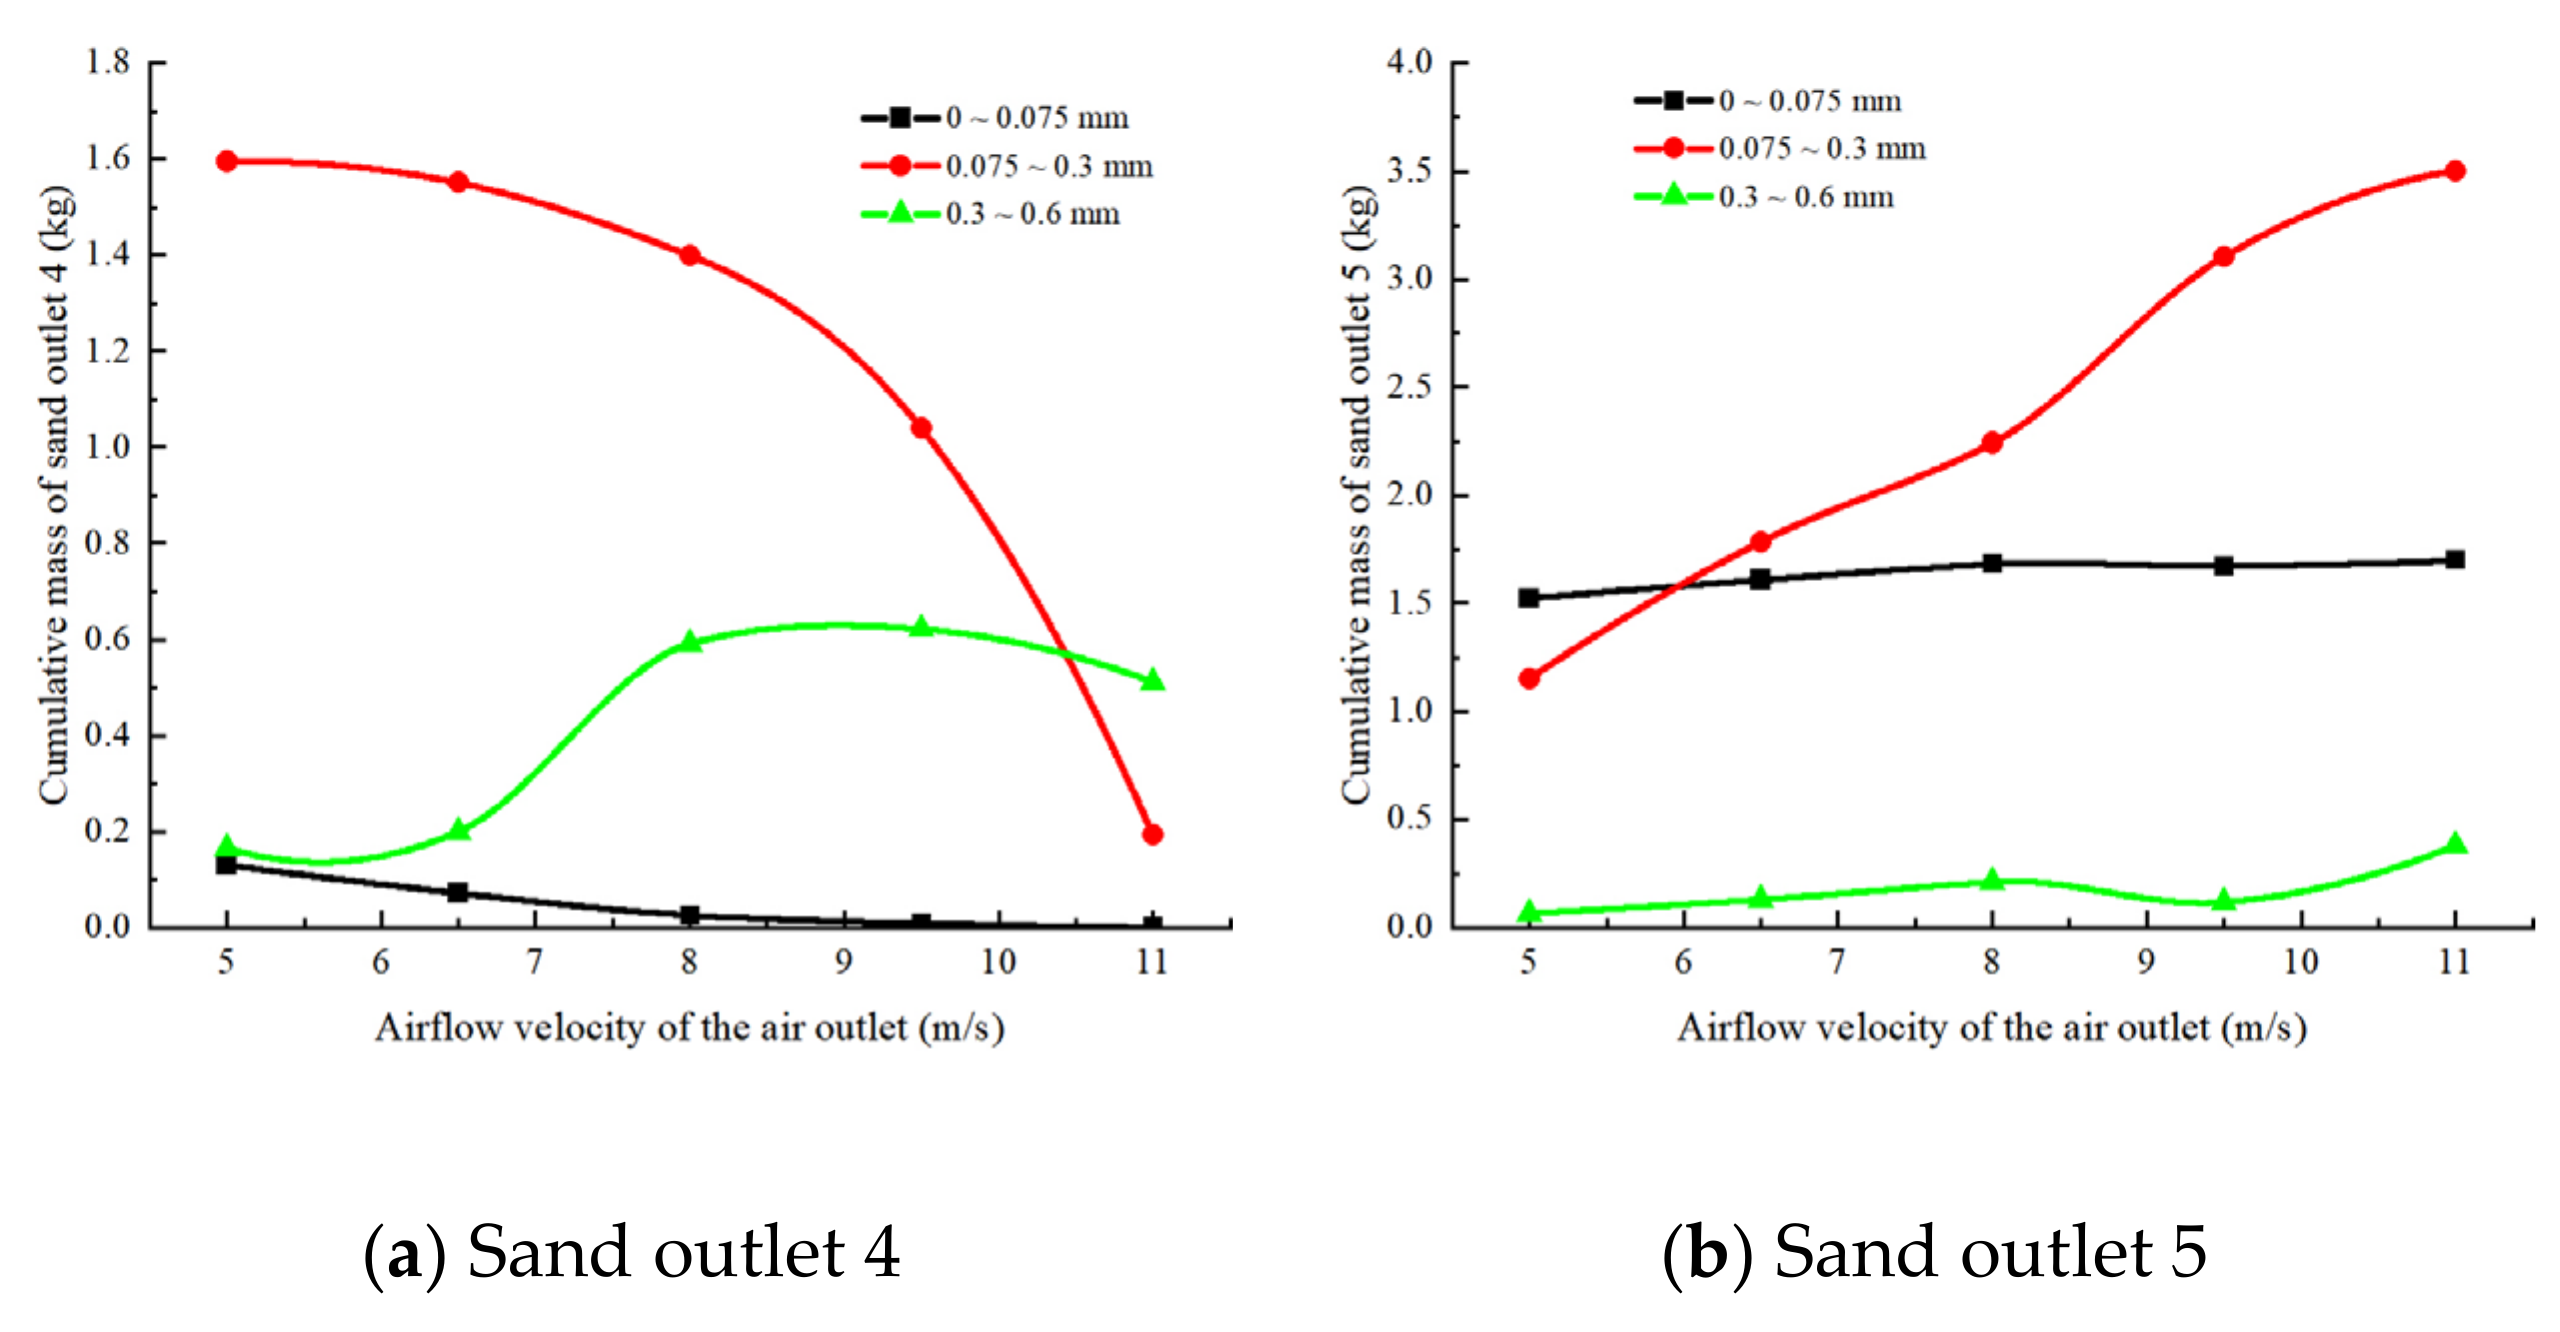
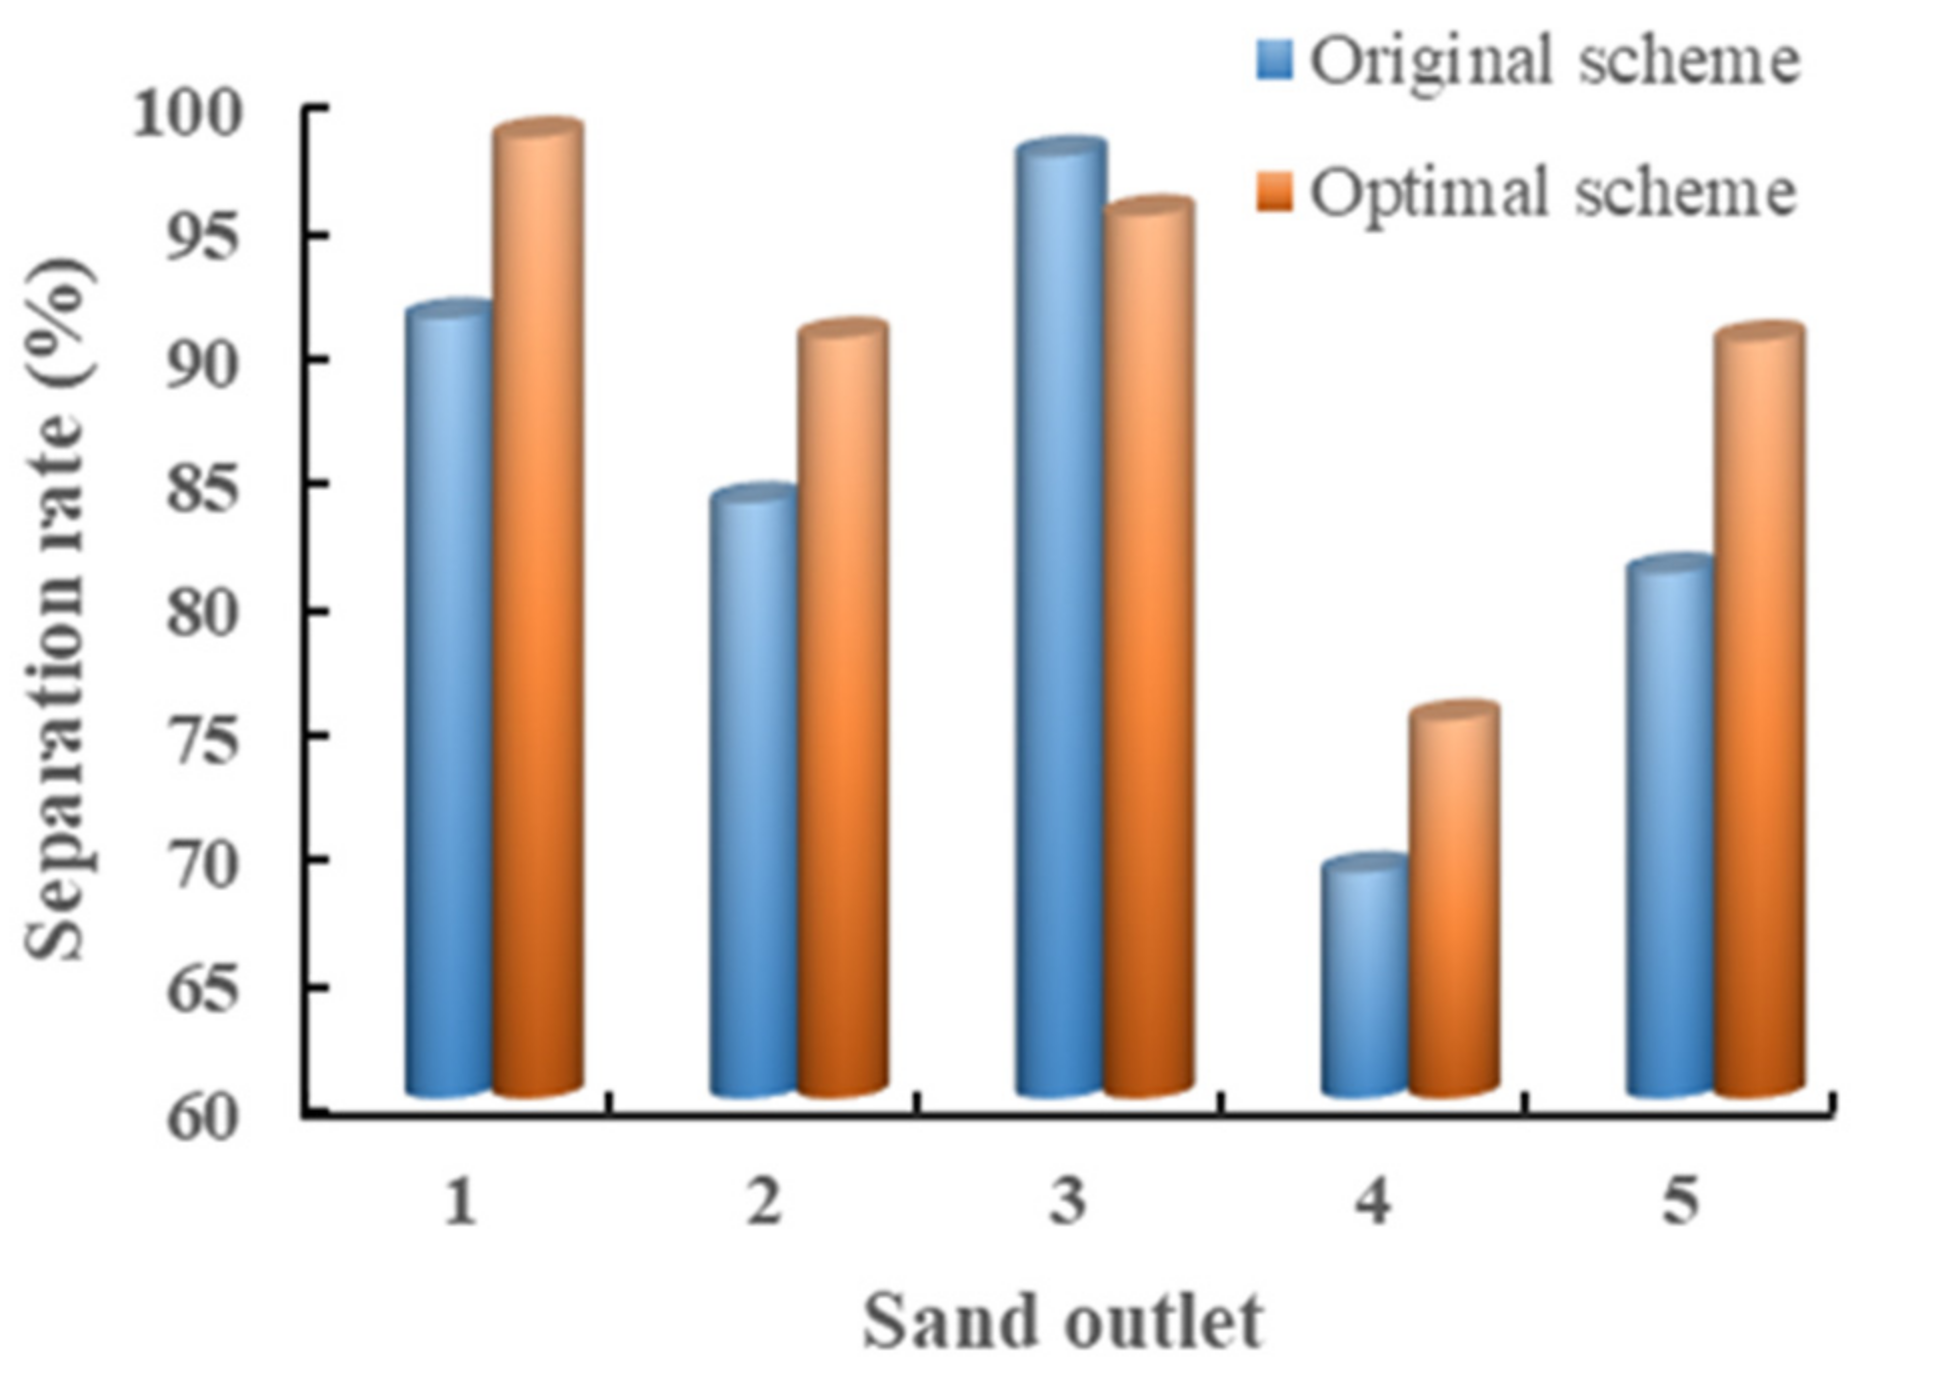
- Adjusting the airflow velocity of the air inlet 2 and the air outlet can most effectively change the classification effect. As the airflow velocity increases, the separation rate of sand outlets 1 and 2 increases, while outlet 4 is significantly reduced. An increase in the airflow velocity at the air outlet will significantly reduce the separation effect of the sand outlet 5. The interior particle size distribution changes with the air flow velocity, despite the fact that the separation rate at the outlet 3 changes little.
- When V2 = 41 m/s and V6 = 6 m/s, there is an optimal airflow classification scheme that meets the design requirements under the condition of only changing the airflow velocity at the air inlet 2 and air outlet.
- The impact of tuyere position and air velocity on different sand particle sizes is variable. Therefore, to achieve the best classification effect, we can monitor the particle size distribution of the inlet sand and adjust the airflow velocity in real-time according to it. The simulation research in this paper can guide the adjustment of airflow velocity in engineering problems.
Author Contributions
Funding
Data Availability Statement
Acknowledgments
Conflicts of Interest
References
- Gavriletea, M. Environmental Impacts of Sand Exploitation. Analysis of Sand Market. Sustainability 2017, 9, 1118. [Google Scholar]
- Zhai, W.; Ding, J.; An, X.; Wang, Z. An optimization model of sand and gravel mining quantity considering healthy ecosystem in Yangtze River, China. J. Clean. Prod. 2020, 242, 118385. [Google Scholar] [CrossRef]
- Leal Filho, W.; Hunt, J.; Lingos, A.; Platje, J.; Vieira, L.; Will, M.; Gavriletea, M. The Unsustainable Use of Sand: Reporting on a Global Problem. Sustainability 2021, 13, 3356. [Google Scholar] [CrossRef]
- Zhang, M.; Wu, F.; Du, L.; Zhu, Q. Study on cleaner production technology and methods of high quality mechanism sand. Inorg. Chem. Ind. 2017, 49, 73–76. [Google Scholar]
- Gonçalves, J.P.; Tavares, L.M.; Toledo Filho, R.D.; Fairbairn, E.M.R.; Cunha, E.R. Comparison of natural and manufactured fine aggregates in cement mortars. Cem. Concr. Res. 2007, 37, 924–932. [Google Scholar] [CrossRef]
- Cortes, D.D.; Kim, H.K.; Palomino, A.M.; Santamarina, J.C. Rheological and mechanical properties of mortars prepared with natural and manufactured sands. Cem. Concr. Res. 2008, 38, 1142–1147. [Google Scholar] [CrossRef]
- Cepuritis, R.; Jacobsen, S.; Onnela, T. Sand production with VSI crushing and air classification: Optimising fines grading for concrete production with micro-proportioning. Miner. Eng. 2015, 78, 1–14. [Google Scholar] [CrossRef]
- Cepuritis, R.; Wigum, B.J.; Garboczi, E.J.; Mørtsell, E.; Jacobsen, S. Filler from crushed aggregate for concrete: Pore structure, specific surface, particle shape and size distribution. Cem. Concr. Comp. 2014, 54, 2–16. [Google Scholar] [CrossRef]
- Wang, Q.; Melaaen, M.C.; De Silva, S.R. Investigation and simulation of a cross-flow air classifier. Powder Technol. 2001, 120, 273–280. [Google Scholar] [CrossRef]
- Kolacz, J. Investigating flow conditions in dynamic air classification. Miner. Eng. 2002, 15, 131–138. [Google Scholar] [CrossRef]
- Li, Y.; Zhang, X.; Shen, X.; Li, H.; Gao, K. Experiment and simulation study on optimized structure of a gravitational air classifier. Int. J. Miner. Process. 2015, 141, 44–50. [Google Scholar] [CrossRef]
- Petit, H.A.; Irassar, E.F.; Barbosa, M.R. Evaluation of the performance of the cross-flow air classifier in manufactured sand processing via CFD–DEM simulations. Comput. Part. Mech. 2018, 5, 87–102. [Google Scholar] [CrossRef]
- Petit, H.A.; Paulo, C.I.; Cabrera, O.A.; Irassar, E.F. Modelling and optimization of an inclined plane classifier using CFD-DPM and the Taguchi method. Appl. Math. Model. 2020, 77, 617–634. [Google Scholar] [CrossRef]
- Lai, W.; Lu, W.; Chou, M. Sorting of fine powder by gravitational classification chambers. Adv. Powder Technol. Int. J. Soc. Powder Technol. 2009, 20, 177–184. [Google Scholar] [CrossRef]
- Ueka, Y.; Matsui, M.; Inoue, E.; Mitsuoka, M.; Okayasu, T. Shape model of grain and straw using coupling elements and flight simulation of threshing unit of combine by discrete element method. Eng. Agric. Environ. Food 2014, 7, 34–39. [Google Scholar] [CrossRef]
- Petit, A.; Cordoba, G.; Paulo, C.I.; Irassar, E.F. Novel air classification process to sustainable production of manufactured sands for aggregate industry. J. Clean. Prod. 2018, 198, 112–120. [Google Scholar] [CrossRef]
- Jayarathna, C.K.; Balfe, M.; Moldestad, B.M.E.; Tokheim, L. Improved multi-stage cross-flow fluidized bed classifier. Powder Technol. 2018, 342, 621–629. [Google Scholar] [CrossRef]
- Betz, M.; Gleiss, M.; Nirschl, H. Effects of Flow Baffles on Flow Profile, Pressure Drop and Classification Performance in Classifiers. Processes 2021, 9, 1213. [Google Scholar] [CrossRef]
- Johansson, R.; Evertsson, M. CFD simulation of a centrifugal air classifier used in the aggregate industry. Miner. Eng. 2014, 63, 149–156. [Google Scholar] [CrossRef]
- Kapustin, F.L.; Perepelitsyn, V.A.; Ponomarev, V.B.; Loshkarev, A.B. Enhancing Efficiency of Rock Crushing Screening Utilization. J. Min. Sci. 2017, 53, 519–523. [Google Scholar] [CrossRef]
- Petit, H.A.; Barbosa, M.R. Simulation of a cross-flow air classifier at high solid feed rates. Rev. Int. Metodos Numer. 2017, 33, 262–270. [Google Scholar]
- Sakaguchi, E.; Suzuki, M.; Favier, J.F.; Kawakami, S. PH—Postharvest Technology: Numerical Simulation of the Shaking Separation of Paddy and Brown Rice using the Discrete Element Method. J. Agric. Eng. Res. 2001, 79, 307–315. [Google Scholar] [CrossRef]
- Eswaraiah, C.; Kavitha, T.; Vidyasagar, S.; Narayanan, S.S. Classification of metals and plastics from printed circuit boards (PCB) using air classifier. Chem. Eng. Process. 2008, 47, 565–576. [Google Scholar] [CrossRef]
- Ataş, S.; Tekir, U.; Paksoy, M.A.; Çelik, A.; Çam, M.; Sevgel, T. Numerical and experimental analysis of pulverized coal mill classifier performance in the Soma B Power Plant. Fuel Process. Technol. 2014, 126, 441–452. [Google Scholar] [CrossRef]
- Johansson, R.; Evertsson, M. CFD simulation of a gravitational air classifier. Miner. Eng. 2012, 33, 20–26. [Google Scholar] [CrossRef]
- Cao, M.; Yang, Y.; Wu, C.; Cai, C. A novel micro-spiral pneumatic selection system for the separation of fresh tea leaves. Int. J. Food Eng. 2021, 17, 595–608. [Google Scholar] [CrossRef]
- Ciukaj, S.; Hernik, B. Field and CFD Study of Fuel Distribution in Pulverized Fuel (PF) Boilers. J. Therm. Sci. 2020, 29, 535–545. [Google Scholar] [CrossRef]
- Yang, X. Kinematic Properties and Test of Plastics’ Optimal Separation Equipment. J. Mech. Eng. 2007, 43, 132–135. [Google Scholar] [CrossRef]
- Johansson, R.; Evertsson, M. An empirical study of a gravitational air classifier. Miner. Eng. 2012, 31, 10–16. [Google Scholar] [CrossRef]
- Zhang, R.; Yang, H.; Junfu, L.Ü. Application of CPFD Approach on Gas-solid Flow and Combustion in Industrial CFB Boilers. Proc. Chin. Soc. Electr. Eng. 2013, 33, 75–83. [Google Scholar]
- Sung, W.C.; Kim, J.Y.; Chung, S.W.; Lee, D.H. Effect of particle size distribution on hydrodynamics of pneumatic conveying system based on CPFD simulation. Adv. Powder Technol. Int. J. Soc. Powder Technol. 2021, 32, 2336–2344. [Google Scholar] [CrossRef]


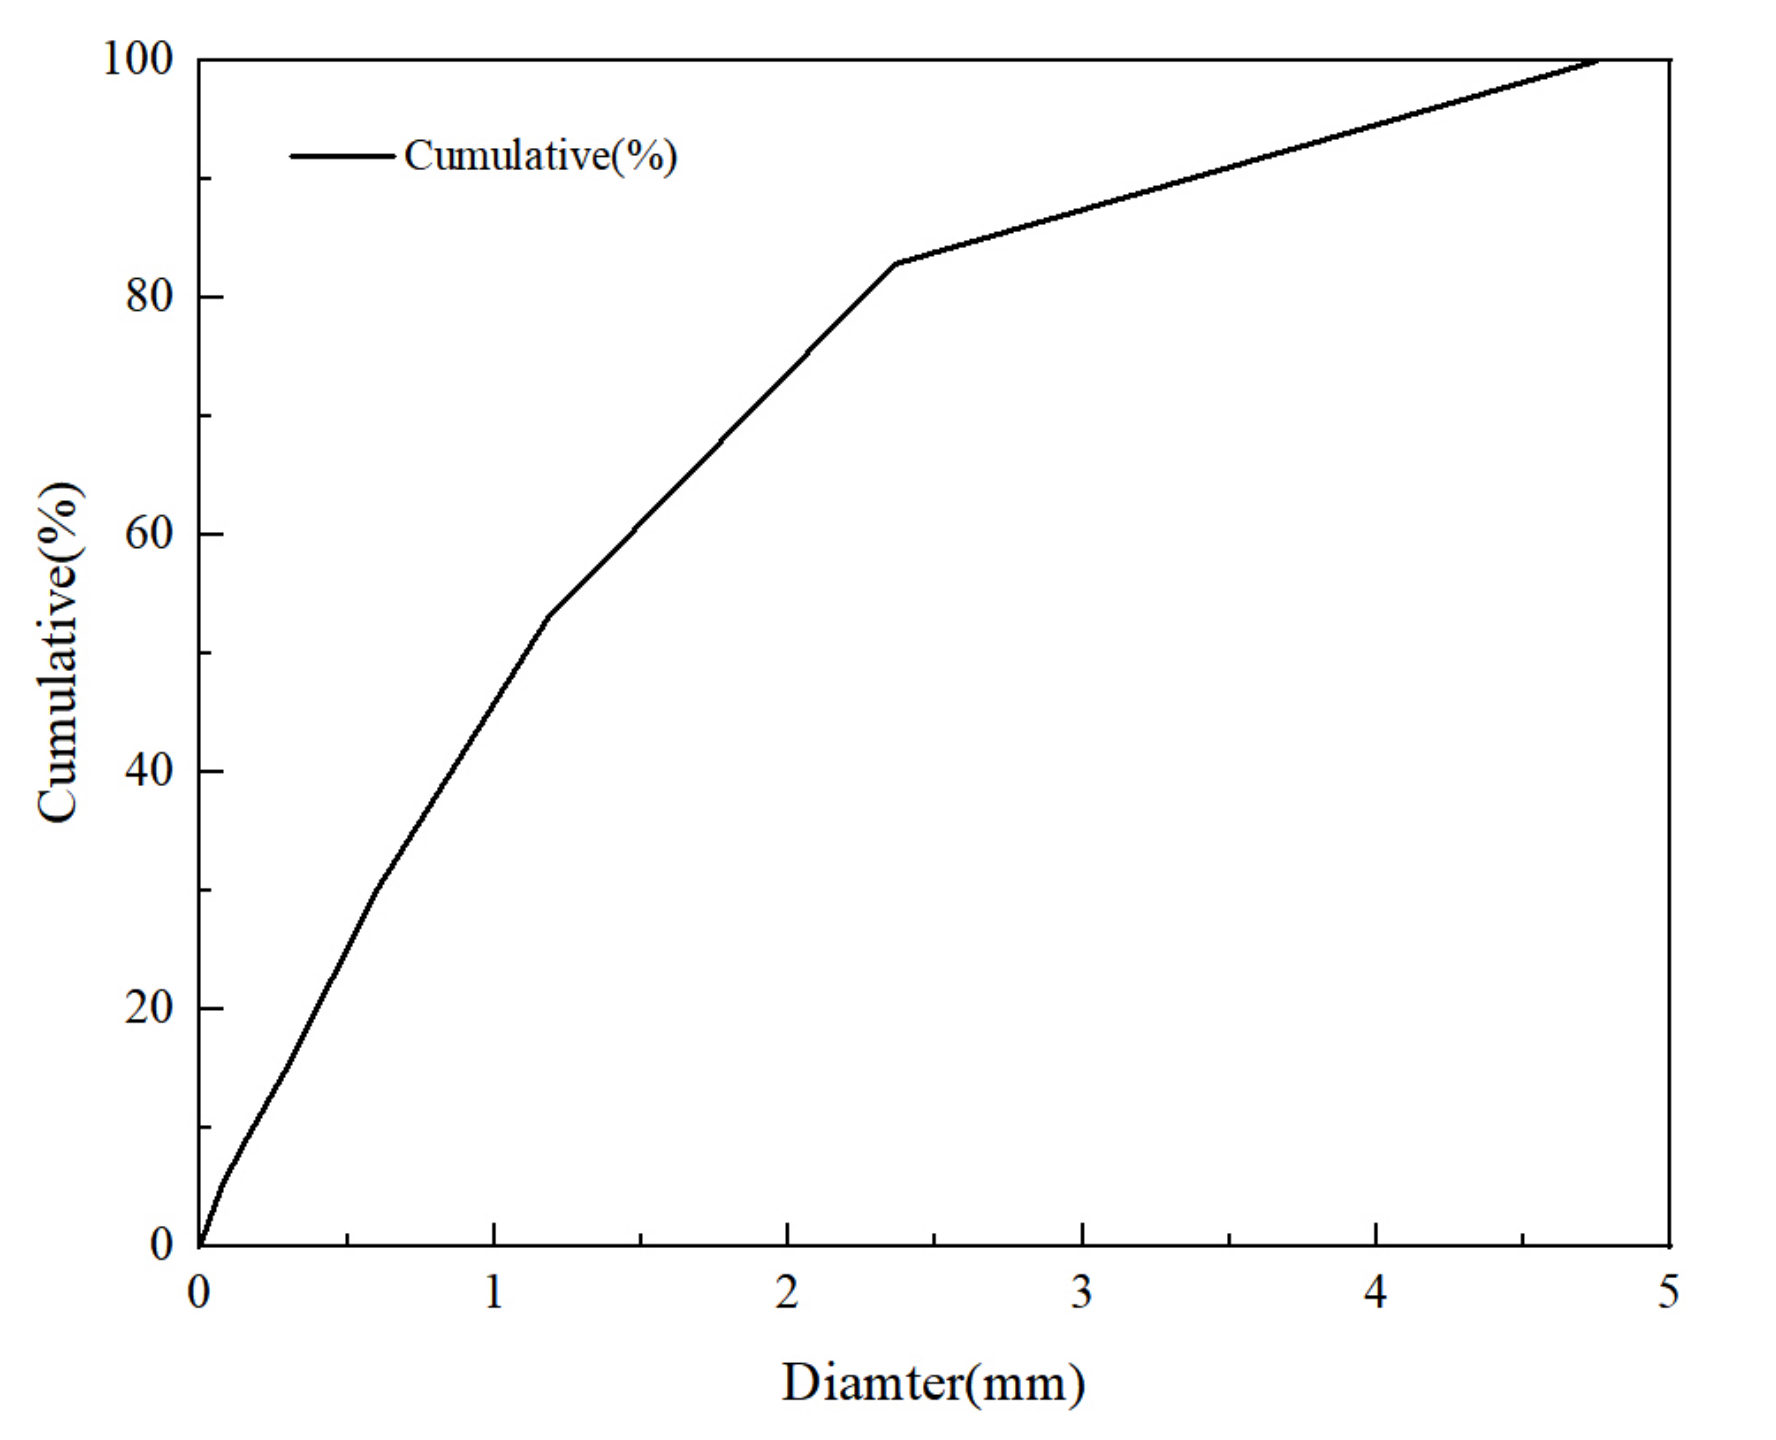
| Diameter (mm) | Cumulative (%) |
|---|---|
| 0.075 | 5.2 |
| 0.15 | 8.6 |
| 0.3 | 15.2 |
| 0.6 | 29.9 |
| 1.18 | 53 |
| 2.36 | 82.8 |
| 4.75 | 100 |
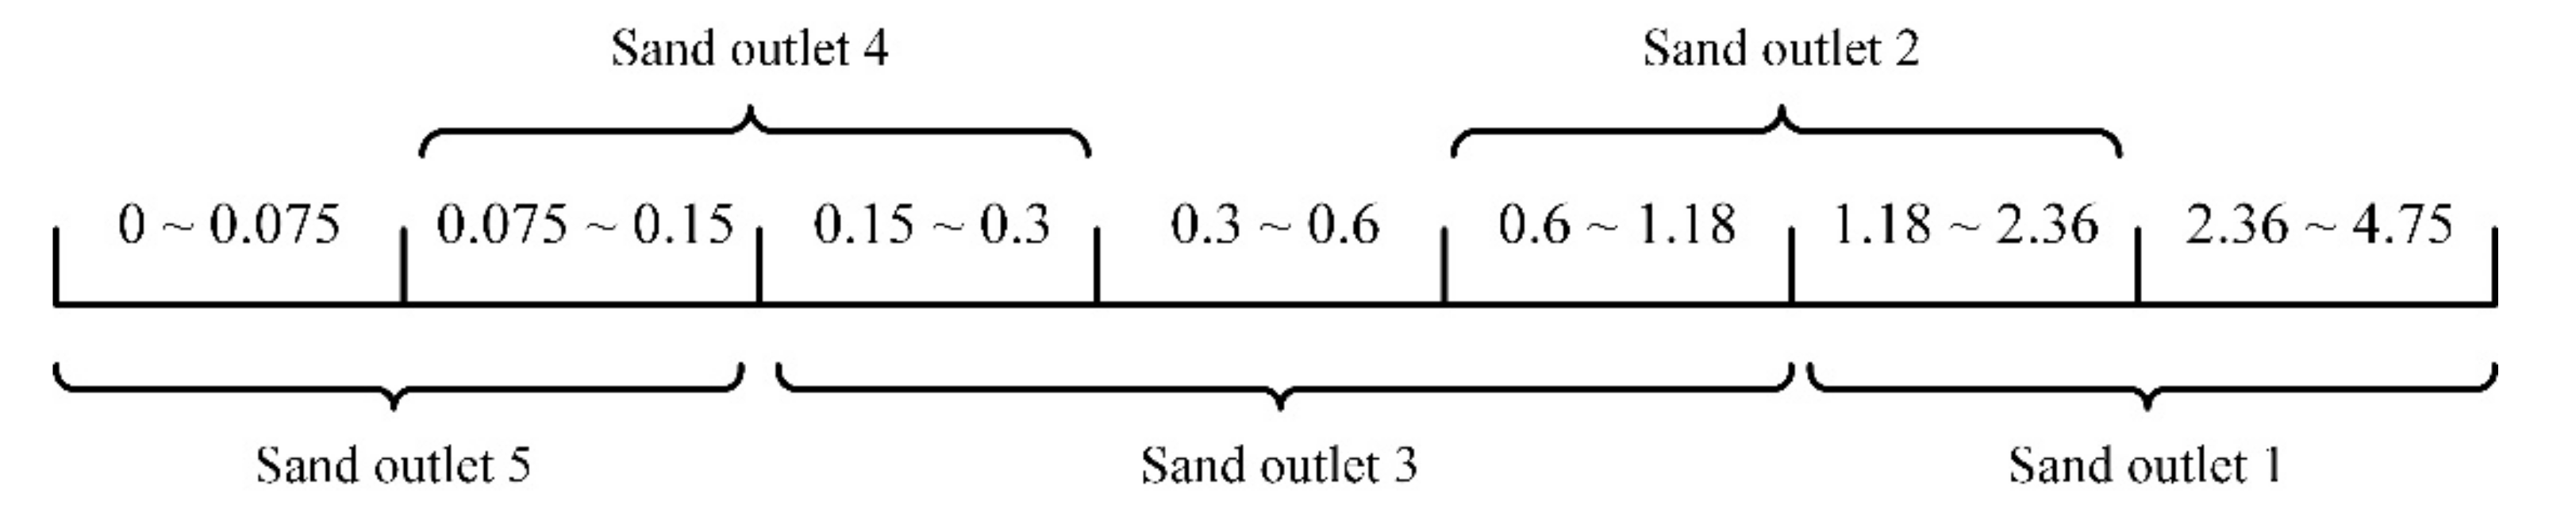
| Sand Outlet | 1 | 2 | 3 | 4 | 5 |
|---|---|---|---|---|---|
| Sand class | Coarse grain | Medium-coarse grain | Medium grain | Fine grain | Powder grain |
| Target particle size (mm) | 1.18~4.75 | 0.6~2.36 | 0.15~1.18 | 0.075~0.3 | 0~0.15 |
| Target separation rate (%) | 90 | 90 | 90 | 75 | 90 |
| Parameter | Value |
|---|---|
| Gas density | 1.225 kg/m3 |
| Gas dynamic viscosity | 1.79 × 10⁻⁵ kg/(m·s) |
| Sand density | 2640 kg/m3 |
| Sand diameter | 0~4.75 mm |
| Sand feed mass flow rate | 7.35 kg/s |
| Sand feed rate | 1 m/s |
| Drag model | Wen-Yu |
| Close pack volume fraction | 0.6 |
| Maximum momentum redirection from collision | 40% |
| Normal-to-wall momentum retention | 0.5 |
| Tangent-to-wall momentum retention | 0.85 |
| Time step | 0.002 s |
| Airflow | Air Inlet | Air Outlet (V6) | ||||
|---|---|---|---|---|---|---|
| 1 (V1) | 2 (V2) | 3 (V3) | 4 (V4) | 5 (V5) | ||
| Airflow velocity (m/s) | 35 | 35 | 32 | 34 | 20 | 8 |
| Airflow | Air Inlet | Air Outlet (V6) | ||||
|---|---|---|---|---|---|---|
| 1 (V1) | 2 (V2) | 3 (V3) | 4 (V4) | 5 (V5) | ||
| Airflow velocity (m/s) | 24/29.5/35/ 40.5/46 | 35 | 32 | 34 | 20 | 8 |
| 35 | 24/29.5/35/ 40.5/46 | 32 | 34 | 20 | 8 | |
| 35 | 35 | 22/27/32/ 37/42 | 34 | 20 | 8 | |
| 35 | 35 | 32 | 23/28.5/34/ 39.5/45 | 20 | 8 | |
| 35 | 35 | 32 | 34 | 14/17/20/ 23/26 | 8 | |
| 35 | 35 | 32 | 34 | 20 | 5/6.5/8/ 9.5/11 | |
| Velocity (m/s) | Mass Proportion of Each Particle Size (%) | Separation Rate (%) | ||
|---|---|---|---|---|
| 0.15~0.3 mm | 0.3~0.6 mm | 0.6~1.18 mm | ||
| 24 | 19.91 | 64.52 | 13.4 | 97.84 |
| 29.5 | 23.4 | 62.09 | 10.55 | 96.05 |
| 35 | 22.49 | 62.91 | 11.96 | 97.37 |
| 40.5 | 19.31 | 59.61 | 18.93 | 97.86 |
| 46 | 15.34 | 54.13 | 27.88 | 97.36 |
| Case | V1 (m/s) | V2 (m/s) | V3 (m/s) | V4 (m/s) | V5 (m/s) | V6 (m/s) |
|---|---|---|---|---|---|---|
| 1 | 35 | 37 | 32 | 34 | 20 | 6/7/9/10 |
| 2 | 35 | 39 | 32 | 34 | 20 | 6/7/9/10 |
| 3 | 35 | 41 | 32 | 34 | 20 | 6/7/9/10 |
| V2 (m/s) | V6 (m/s) | Separation Rate (%) | ||||
|---|---|---|---|---|---|---|
| Sand Outlet 1 | Sand Outlet 2 | Sand Outlet 3 | Sand Outlet 4 | Sand Outlet 5 | ||
| 37 | 6 | 92.9 | 81.3 | 94.5 | 77.6 | 89.5 |
| 7 | 93.7 | 84.3 | 95.8 | 73.4 | 84.6 | |
| 9 | 95.1 | 91.4 | 98.6 | 58.3 | 75.2 | |
| 10 | 95.9 | 94.4 | 99.5 | 48.0 | 70.9 | |
| 39 | 6 | 96.0 | 85.0 | 93.2 | 76.0 | 87.8 |
| 7 | 96.7 | 87.8 | 96.8 | 71.6 | 83.8 | |
| 9 | 98.0 | 93.5 | 98.4 | 55.0 | 74.4 | |
| 10 | 98.1 | 95.6 | 99.4 | 43.6 | 68.8 | |
| 41 | 6 | 98.1 | 90.2 | 95.0 | 75.1 | 89.0 |
| 7 | 98.1 | 91.7 | 95.7 | 67.9 | 82.3 | |
| 9 | 98.9 | 93.7 | 98.1 | 49.5 | 73.3 | |
| 10 | 99.1 | 95.4 | 99.2 | 40.8 | 66.8 | |
Publisher’s Note: MDPI stays neutral with regard to jurisdictional claims in published maps and institutional affiliations. |
© 2022 by the authors. Licensee MDPI, Basel, Switzerland. This article is an open access article distributed under the terms and conditions of the Creative Commons Attribution (CC BY) license (https://creativecommons.org/licenses/by/4.0/).
Share and Cite
Peng, S.; Wu, Y.; Tao, J.; Chen, J. Airflow Velocity Designing for Air Classifier of Manufactured Sand Based on CPFD Method. Minerals 2022, 12, 90. https://doi.org/10.3390/min12010090
Peng S, Wu Y, Tao J, Chen J. Airflow Velocity Designing for Air Classifier of Manufactured Sand Based on CPFD Method. Minerals. 2022; 12(1):90. https://doi.org/10.3390/min12010090
Chicago/Turabian StylePeng, Shuhua, Yu Wu, Jing Tao, and Jianbin Chen. 2022. "Airflow Velocity Designing for Air Classifier of Manufactured Sand Based on CPFD Method" Minerals 12, no. 1: 90. https://doi.org/10.3390/min12010090