Article

An Investigation of the Adsorption of Xanthate on Bornite in Aqueous Solutions Using an Atomic Force Microscope

Department of Mining and Geological Engineering, The University of Arizona, Tucson, AZ 85721, USA
Minerals 2021, 11(8), 906; https://doi.org/10.3390/min11080906
Submission received: 22 July 2021 / Revised: 5 August 2021 / Accepted: 18 August 2021 / Published: 21 August 2021

Abstract

:
An atomic force microscope (AFM) was applied to study of the adsorption of xanthate on bornite surfaces in situ in aqueous solutions. AFM images showed that xanthate, i.e., potassium ethyl xanthate (KEX) and potassium amyl xanthate (PAX), adsorbed strongly on bornite, and the adsorbate bound strongly with the mineral surface without being removed by flushing with ethanol alcohol. The AFM images also showed that the adsorption increased with the increased collector concentration and contact time. Xanthate adsorbed on bornite in a similar manner when the solution pH changed to pH 10. The AFM force measurement results showed that the probe–substrate adhesion increased due to the adsorption of xanthate on bornite. The sharp “jump-in” and “jump-off” points on force curve suggest that the adsorbate is not “soft” in nature, ruling out the existence of dixanthogen, an oily substance. Finally, the ATR-FTIR (attenuated total reflection-Fourier-transform infrared) result confirms that the adsorbate on bornite in xanthate solutions is mainly in the form of insoluble cuprous xanthate (CuX) instead of dixanthogen. This xanthate/bornite adsorption mechanism is very similar to what is obtained with the xanthate/chalcocite system, while it is different from the xanthate/chalcopyrite system, for which oily dixanthogen is the main adsorption product on the chalcopyrite surface. The present study helps clarify the flotation mechanism of bornite in industry practice using xanthate as a collector.

1. Introduction

Flotation has been widely studied as the most efficient separation technique in the copper extraction industry. The adsorption of the collector on the mineral surface is vital for a successful flotation process to achieve a recovery. Historically, many works have been carried out to clarify the adsorption mechanism of collectors on sulfides [1,2,3,4,5,6].
Compared to other copper minerals, such as chalcopyrite and chalcocite, the adsorption of collector on bornite has been rarely studied. Allison et al. [3] studied the reaction products of various sulfide minerals with xanthate solutions. The authors reported that the measured rest potential of bornite in 6.25 × 10⁻⁴ M KEX solution at pH 7 was +60 mV, and the reaction product of PAX on bornite was cuprous alkyl xanthate. Mielczarski and Suoninen [7,8] applied XPS and studied the adsorption of potassium ethyl xanthate on cuprous sulfide. The authors reported that there was a relatively rapid formation of a well-oriented monolayer of xanthate ions followed by a slow growth of disordered cuprous xanthate molecules on top of this layer. Buckley et al. [9] investigated the surface oxidation of bornite by linear potential sweep voltammetry and X-ray Photoelectron Spectroscopy, and proposed the adsorption products on bornite depended on the solution potential. Zachwieja et al. [10] studied the electrochemical flotation of the bornite-ethylxanthate system and reported that KEX reacted with bornite through an electrochemical oxidation reaction, forming cuprous xanthate between −0.4 v and −0.2 v (SCE, saturated calomel electrode). Hangone et al. [11] studied the flotation of a bornite-rich copper sulfide ore using thio collectors and their mixtures, and reported that the highest copper recoveries were obtained with the diethyl dithiophosphate (di C2-DTP). Recently, Dhar et al. [12] investigated the improvement of the copper recovery from Nussir Copper Ore Deposit in Northern Norway, using the blend of xanthate and dithiophosphate as collectors.
These previous studies have revealed a significant amount of information, such as the possible reaction product and reaction mechanism of the adsorption of collectors on the bornite surface. Technically, it is also of great interest to directly obtain the image of the collector on the bornite surface changing with the pulp chemistry, such as the type and dosage of chemicals, solution pH and adsorption time. An autoradiography technique was first applied by Polkin et al. [13] and Plaksin et al. [14] to obtain the images of xanthate radioactive isotopes absorbed on sulfide minerals. The authors reported that there was a mosaic distribution of xanthate collectors on the sulfide mineral surface. Later, scanning tunneling microscopy (STM) was applied by Kim et al. [15] and Smart et al. [16] to collect surface images for the study of the reaction, i.e., oxidation, reaction and absorption, of the galena surface under flotation-related conditions. The reported STM images showed that the pulp chemistry, such as the pH and chemical dosage, impacted the reaction and its products on the galena surface. Recently, the AFM imaging technique has also been successfully applied for the in situ study of the adsorption of chemicals on various mineral surfaces [17,18,19,20,21,22]. The novel analysis method has greatly expanded the understanding of the impact of solution chemistry on the collectors’ adsorption on mineral surface and the flotation mechanism.
In the present investigation, an AFM was applied to obtain the surface morphology of bornite in KEX and PAX solutions. By comparing the AFM images obtained under different conditions, such as the collector’s type, dosage and contacting time, we studied the impact of water chemistry on the adsorption of collectors on bornite. The results will help answer important questions, such as (1) What is the morphology of the adsorbate on mineral surface? (2) What is the impact of the collector’s dosage, the contacting time and the solution pH on the adsorption of the collector on the mineral surface? This information will help to clarify the reaction and adsorption mechanisms of xanthate on bornite changing with aqueous solutions, and therefore its impact on bornite flotation.

2. Materials and Methods

2.1. Materials

Research-grade bornite (Cu5FeS4) and chalcopyrite (CuFeS2) were obtained from Wards Natural Science Establishment Inc. Mineral samples were finely polished by consecutively using #800, #1200 and #2400 sandpaper, and then diamond-polishing paste of 10, 5, 2.5 and 1 microns. (MTI Inc., Richmond, CA, USA) Mineral samples were further cleaned by rinsing thoroughly with ethanol and water. A 1.2 cm × 1.2 cm sample was used for the surface characterization, i.e., AFM and ATR-FTIR analysis. The DI (deionized) water used in the present work had a conductivity of 18.2 MΩ·cm−1 at 22 °C and a surface tension of 72.8 mN/m at 22 °C. Potassium amyl xanthate (PAX, >98%), potassium ethyl xanthate (KEX, >98%) and NaOH (>99%) were obtained from Alfa Aesar and used without further purification. Xanthate solutions were freshly prepared at various concentrations and pH levels as needed each time right before an experiment was carried out.

2.2. AFM Surface Image and Force Measurements

AFM surface image measurements were carried out with a Digital Instrument Nanoscope IIID (Veeco, San Jose, CA, USA) AFM using the contact mode at room temperature (22 ± 1 °C). SNL cantilevers were obtained from Veeco (San Jose, CA, USA). Triangular Si3N4 cantilevers with a nominal spring constant of 0.12~0.58 N/m were used for both AFM imaging and force measurements. For the force measurements, the separation distance (H) between the probe and the substrate (bornite plate) was measured by monitoring the deflection of the cantilever.
To study the mineral surface in water, surface image measurements were carried out after 5 mL DI water was gently injected into an AFM fluid cell. Extreme care was taken to avoid the entrapment of air in the cell. After force data and surface images were collected in water, a 10 mL solution of a specific chemical’s concentration was flushed through the liquid cell, and the cell was left undisturbed for the adsorption of chemicals on mineral surface. AFM image analysis and force measurement were commenced after the exposure of the mineral plate to the chemical’s solution for a specific time. The AFM images as reported in this study, which were processed by no image modification other than being flattened, include both height and deflection images obtained in the contact mode. The same silicon nitride probe used for the force measurement was also applied to obtain the AFM image of the mineral plate in the solutions at different conditions.

2.3. ATR-FTIR Measurement

A Nicolet 6700 Fourier-transform infrared spectrometer (Thermo Electron North America LLC, West Palm Beach, FL, USA) equipped with the Smart iTR accessory was used to collect the mid-infrared spectra. The system was equipped with a liquid-nitrogen-cooled DTGS KBr detector and a diamond ATR crystal with an angle of incidence of 45° to ensure the signals were detected. First, the mineral was put on the stage with the freshly polished surface, which was pressed and fastened toward the ATR crystal to collect the background spectra. Second, the same sample was removed from the stage, and a 5 mL xanthate solution of different concentrations was carefully dipped onto the fresh surface and left untouched for a specific time. Third, the mineral sample was tilted to remove most of the solution and gently blown with ultrapure N2 gas for the removal of residual water. Finally, the mineral sample was again pressed against the ATR crystal, and the ATR-FTIR spectra were collected. The intensities in the spectra were shown in a relative value under the same scale. All spectra were collected at room temperature with no further treatment made toward the spectra except the baseline correction.

3. Results

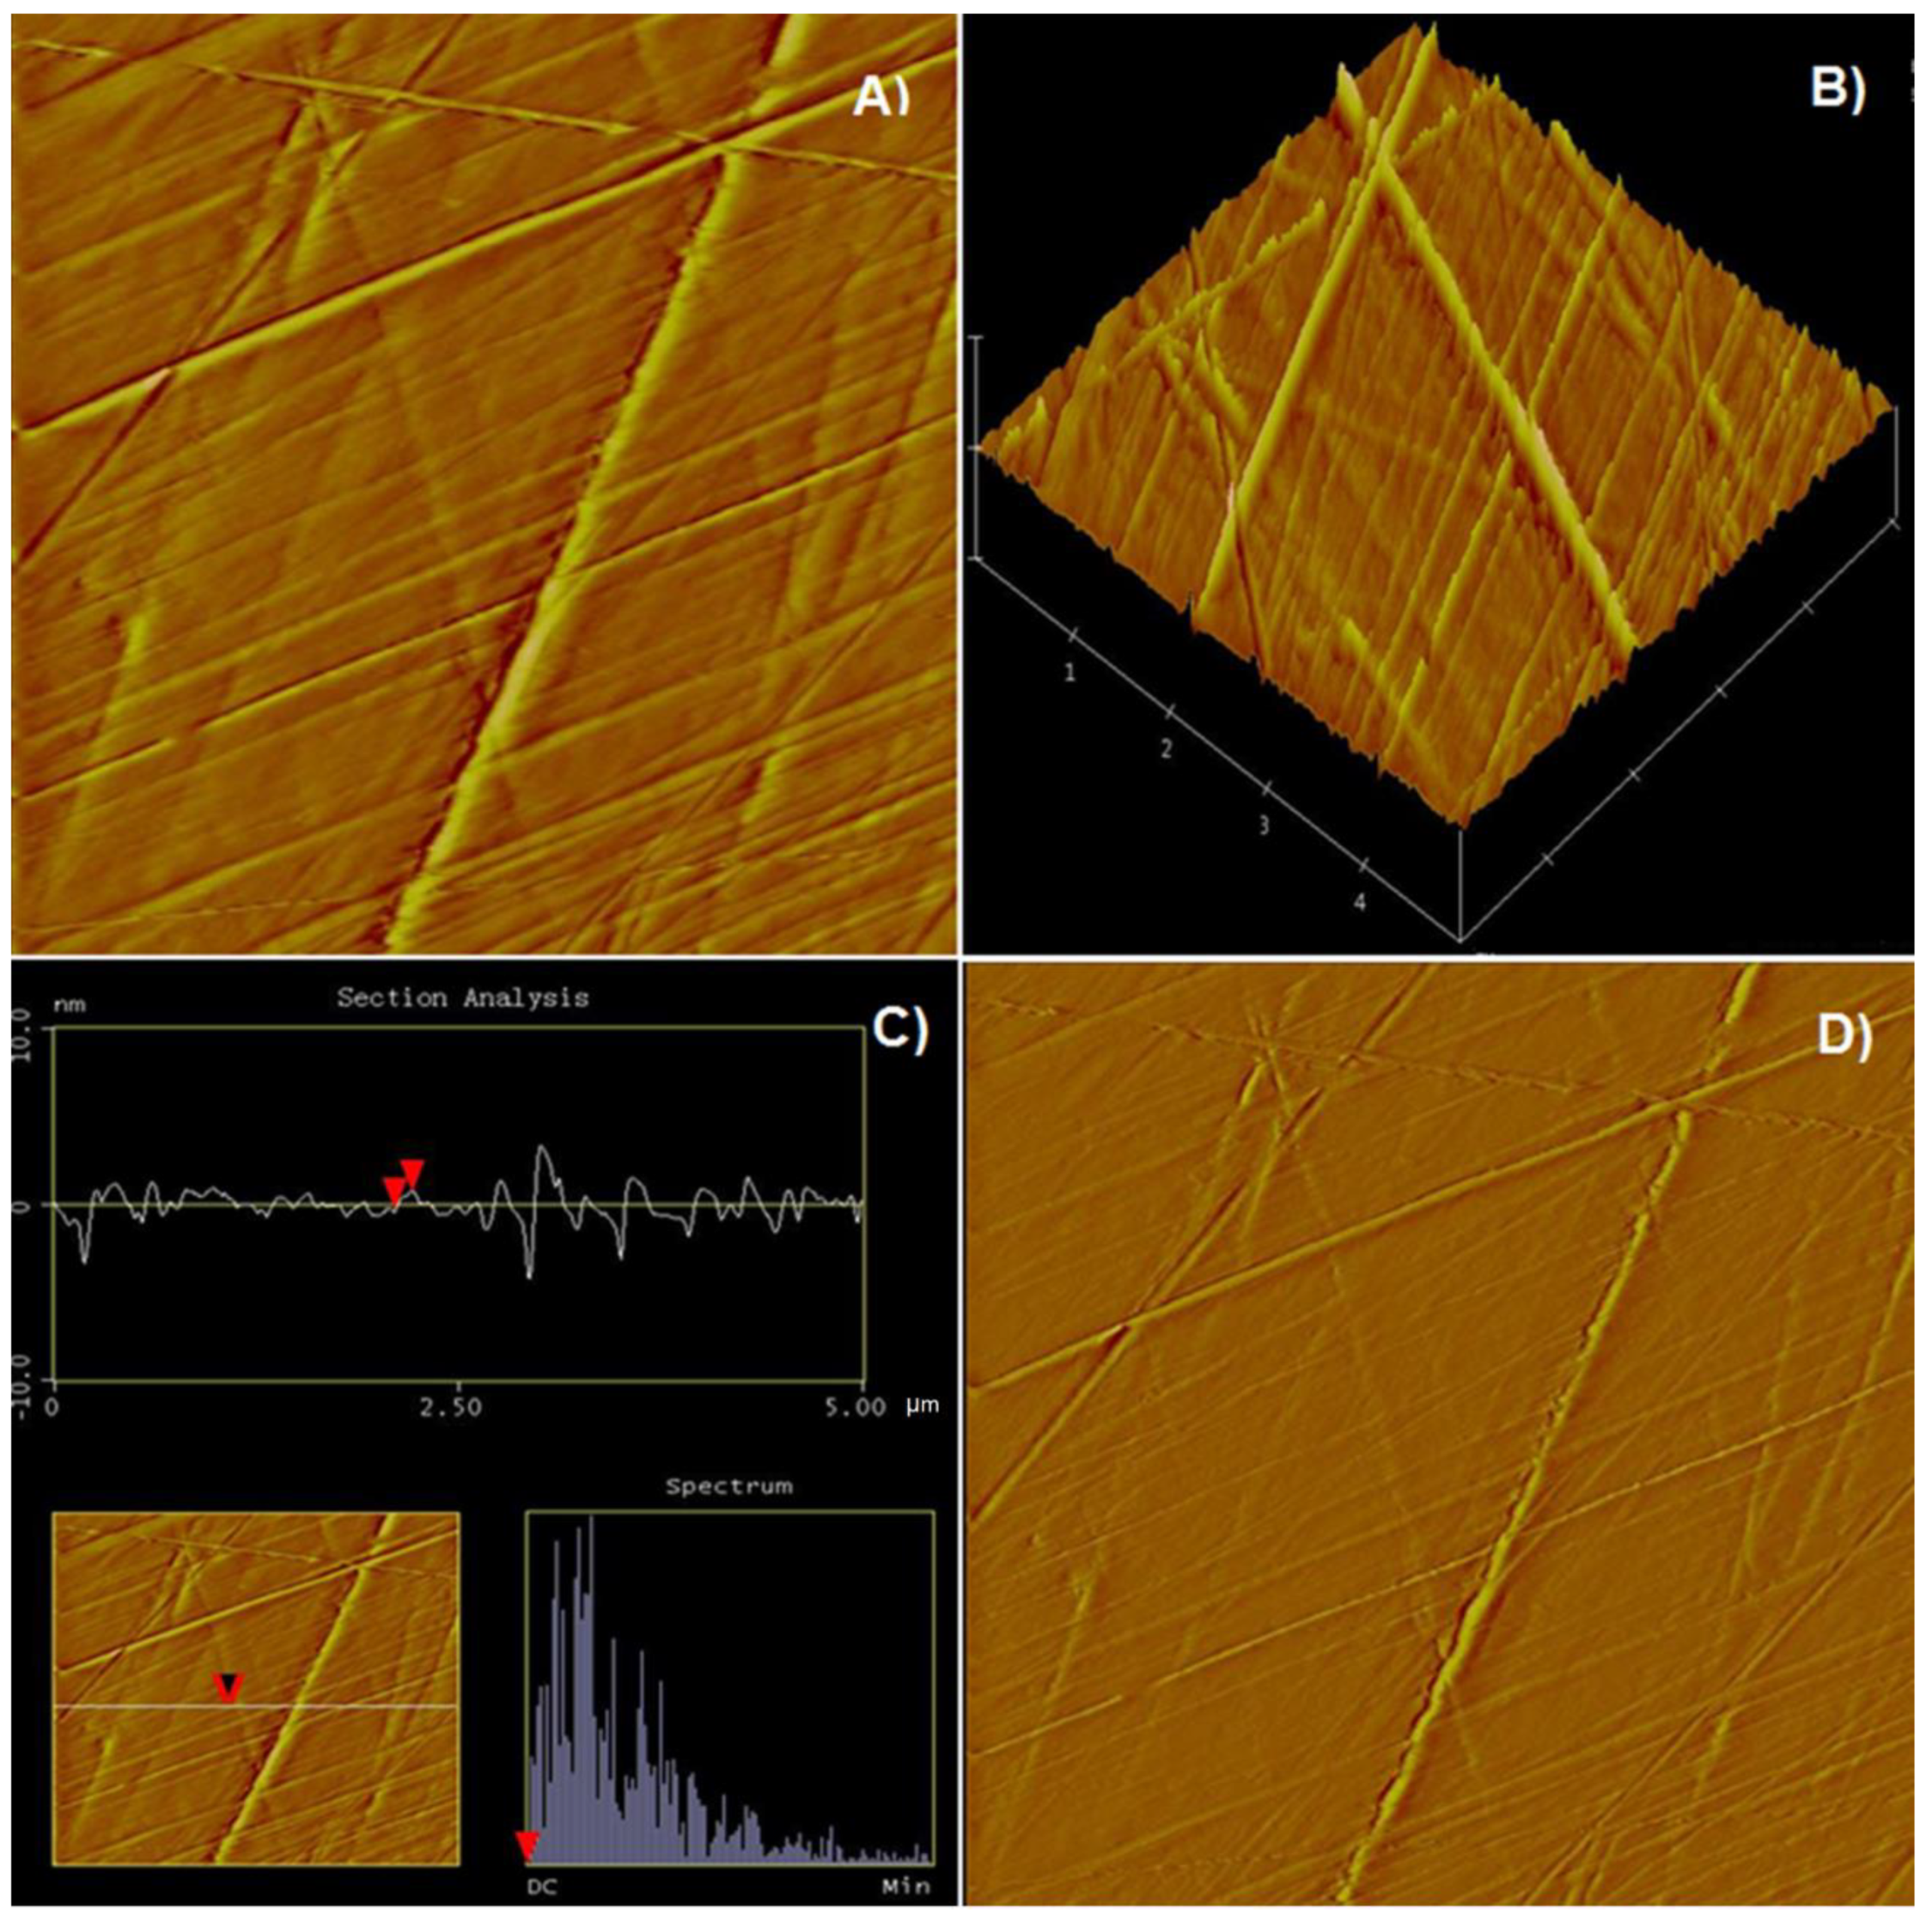
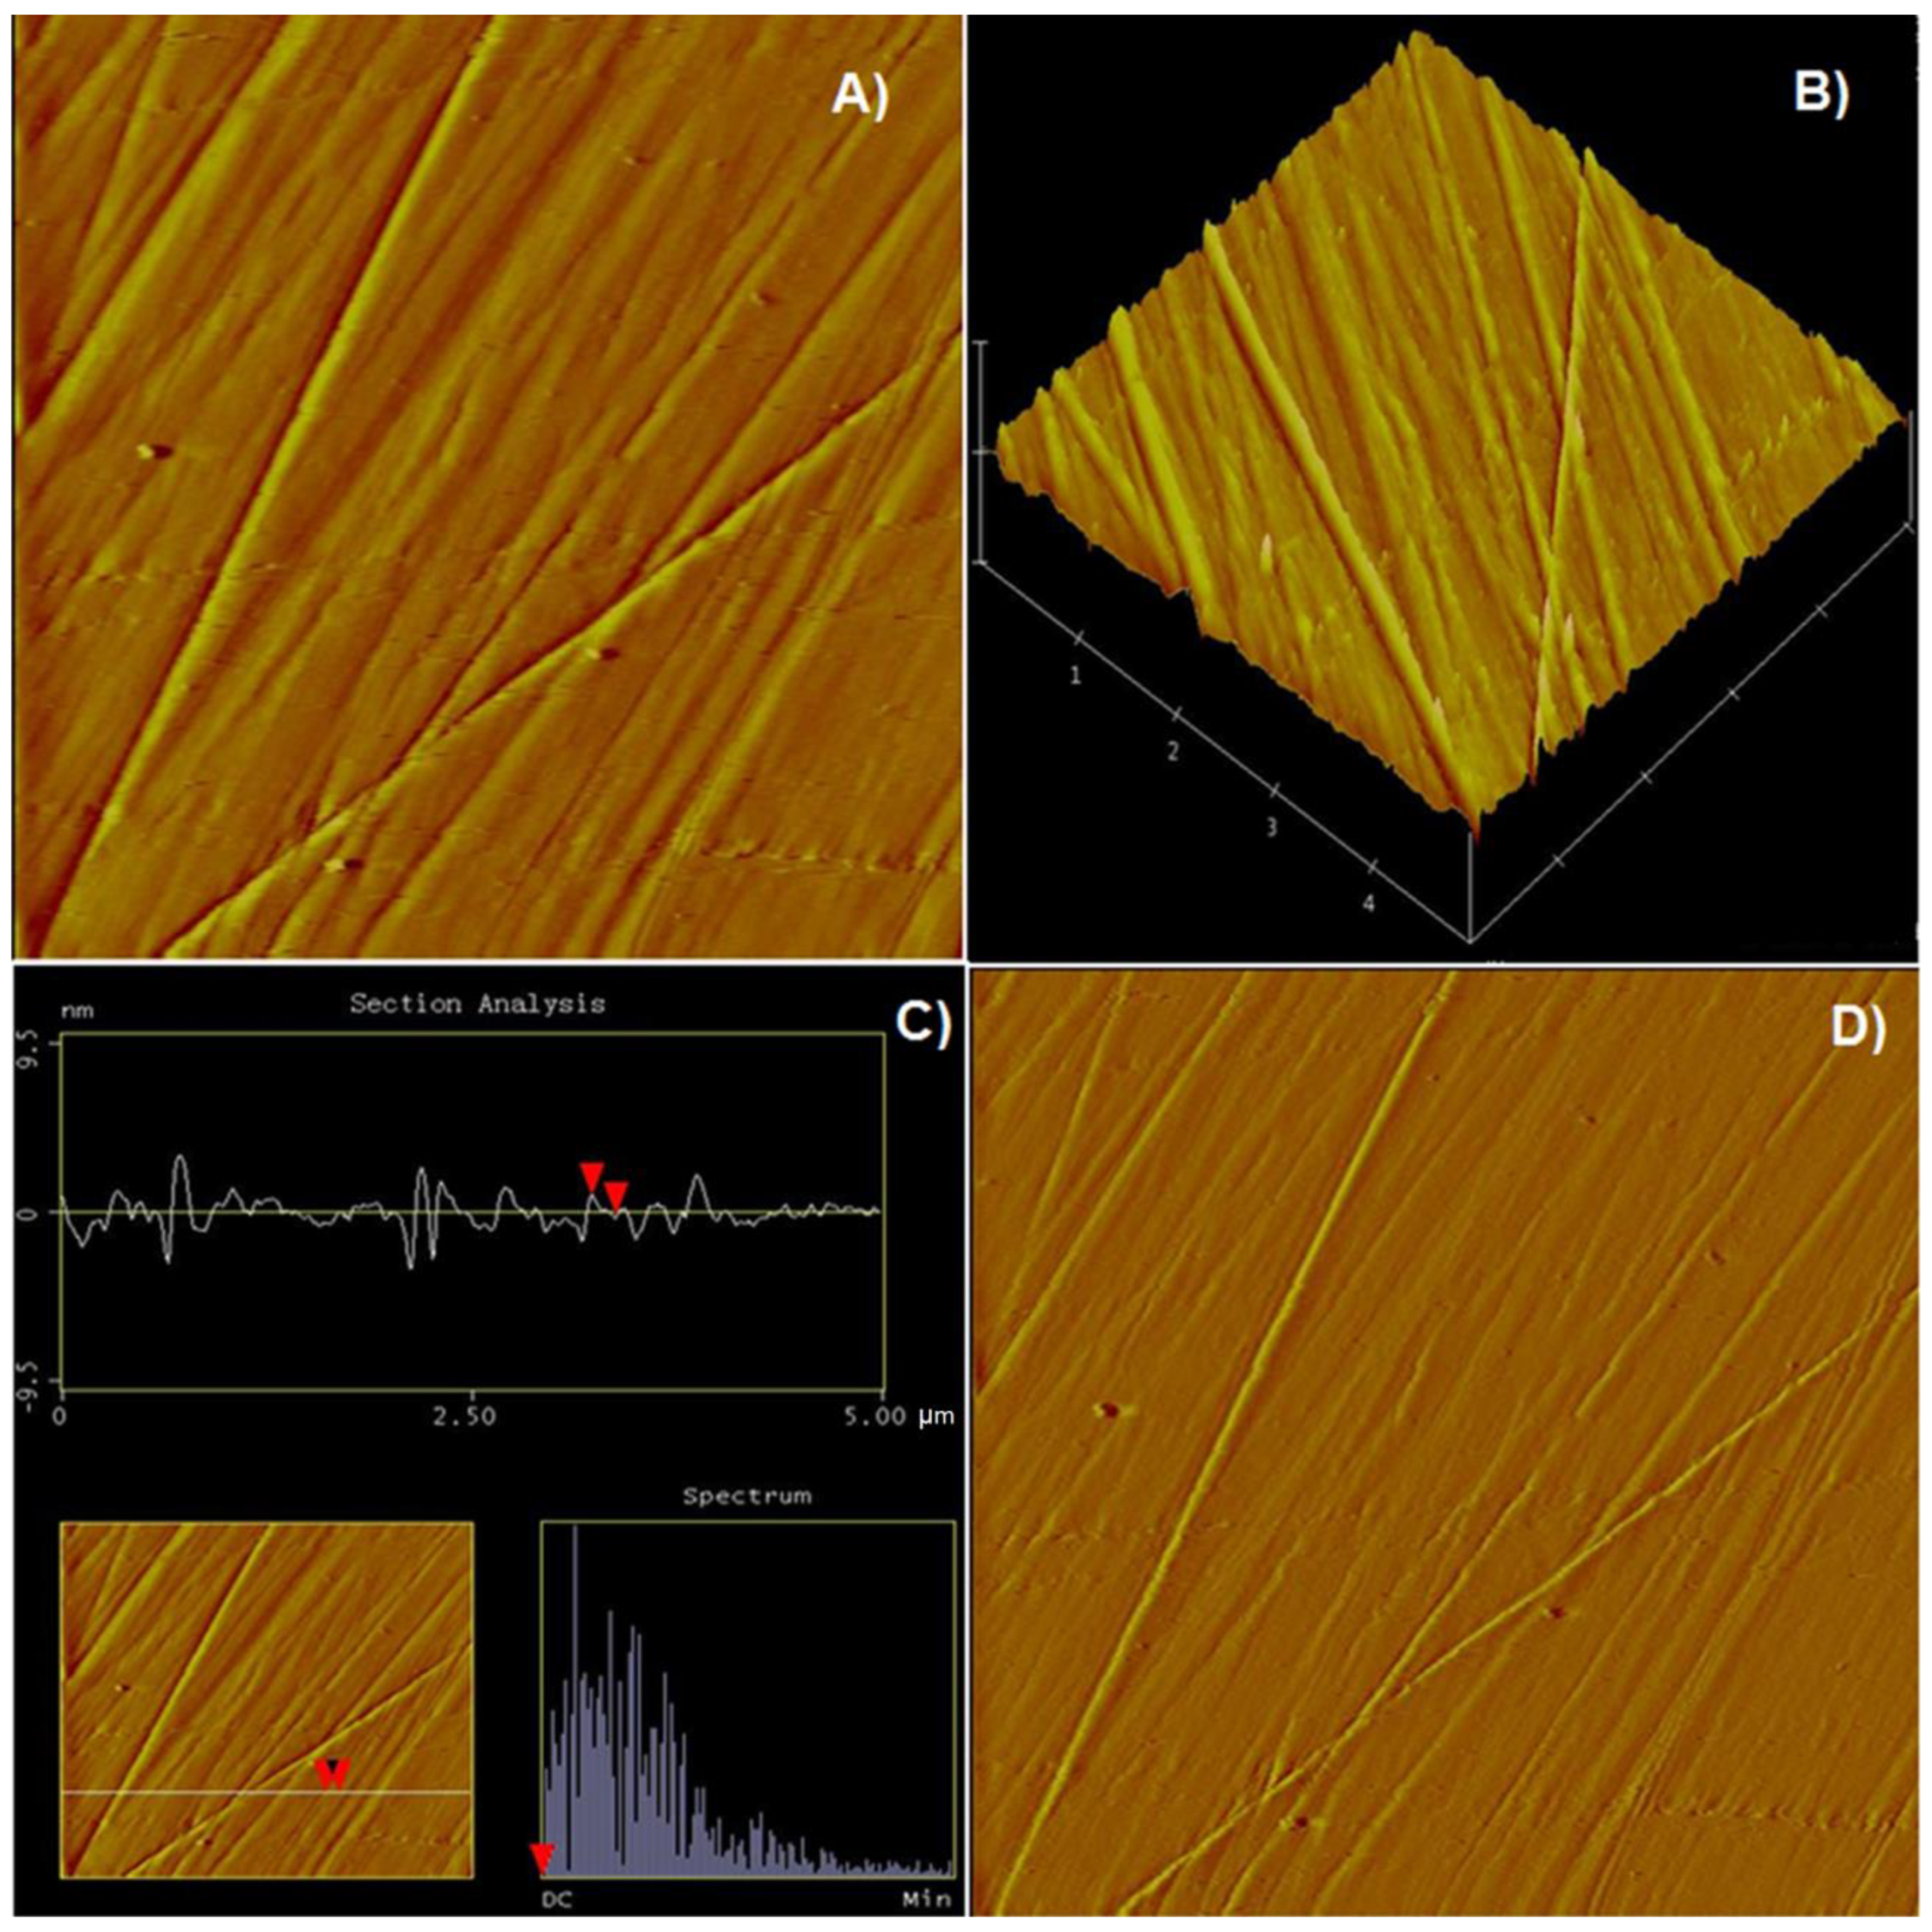
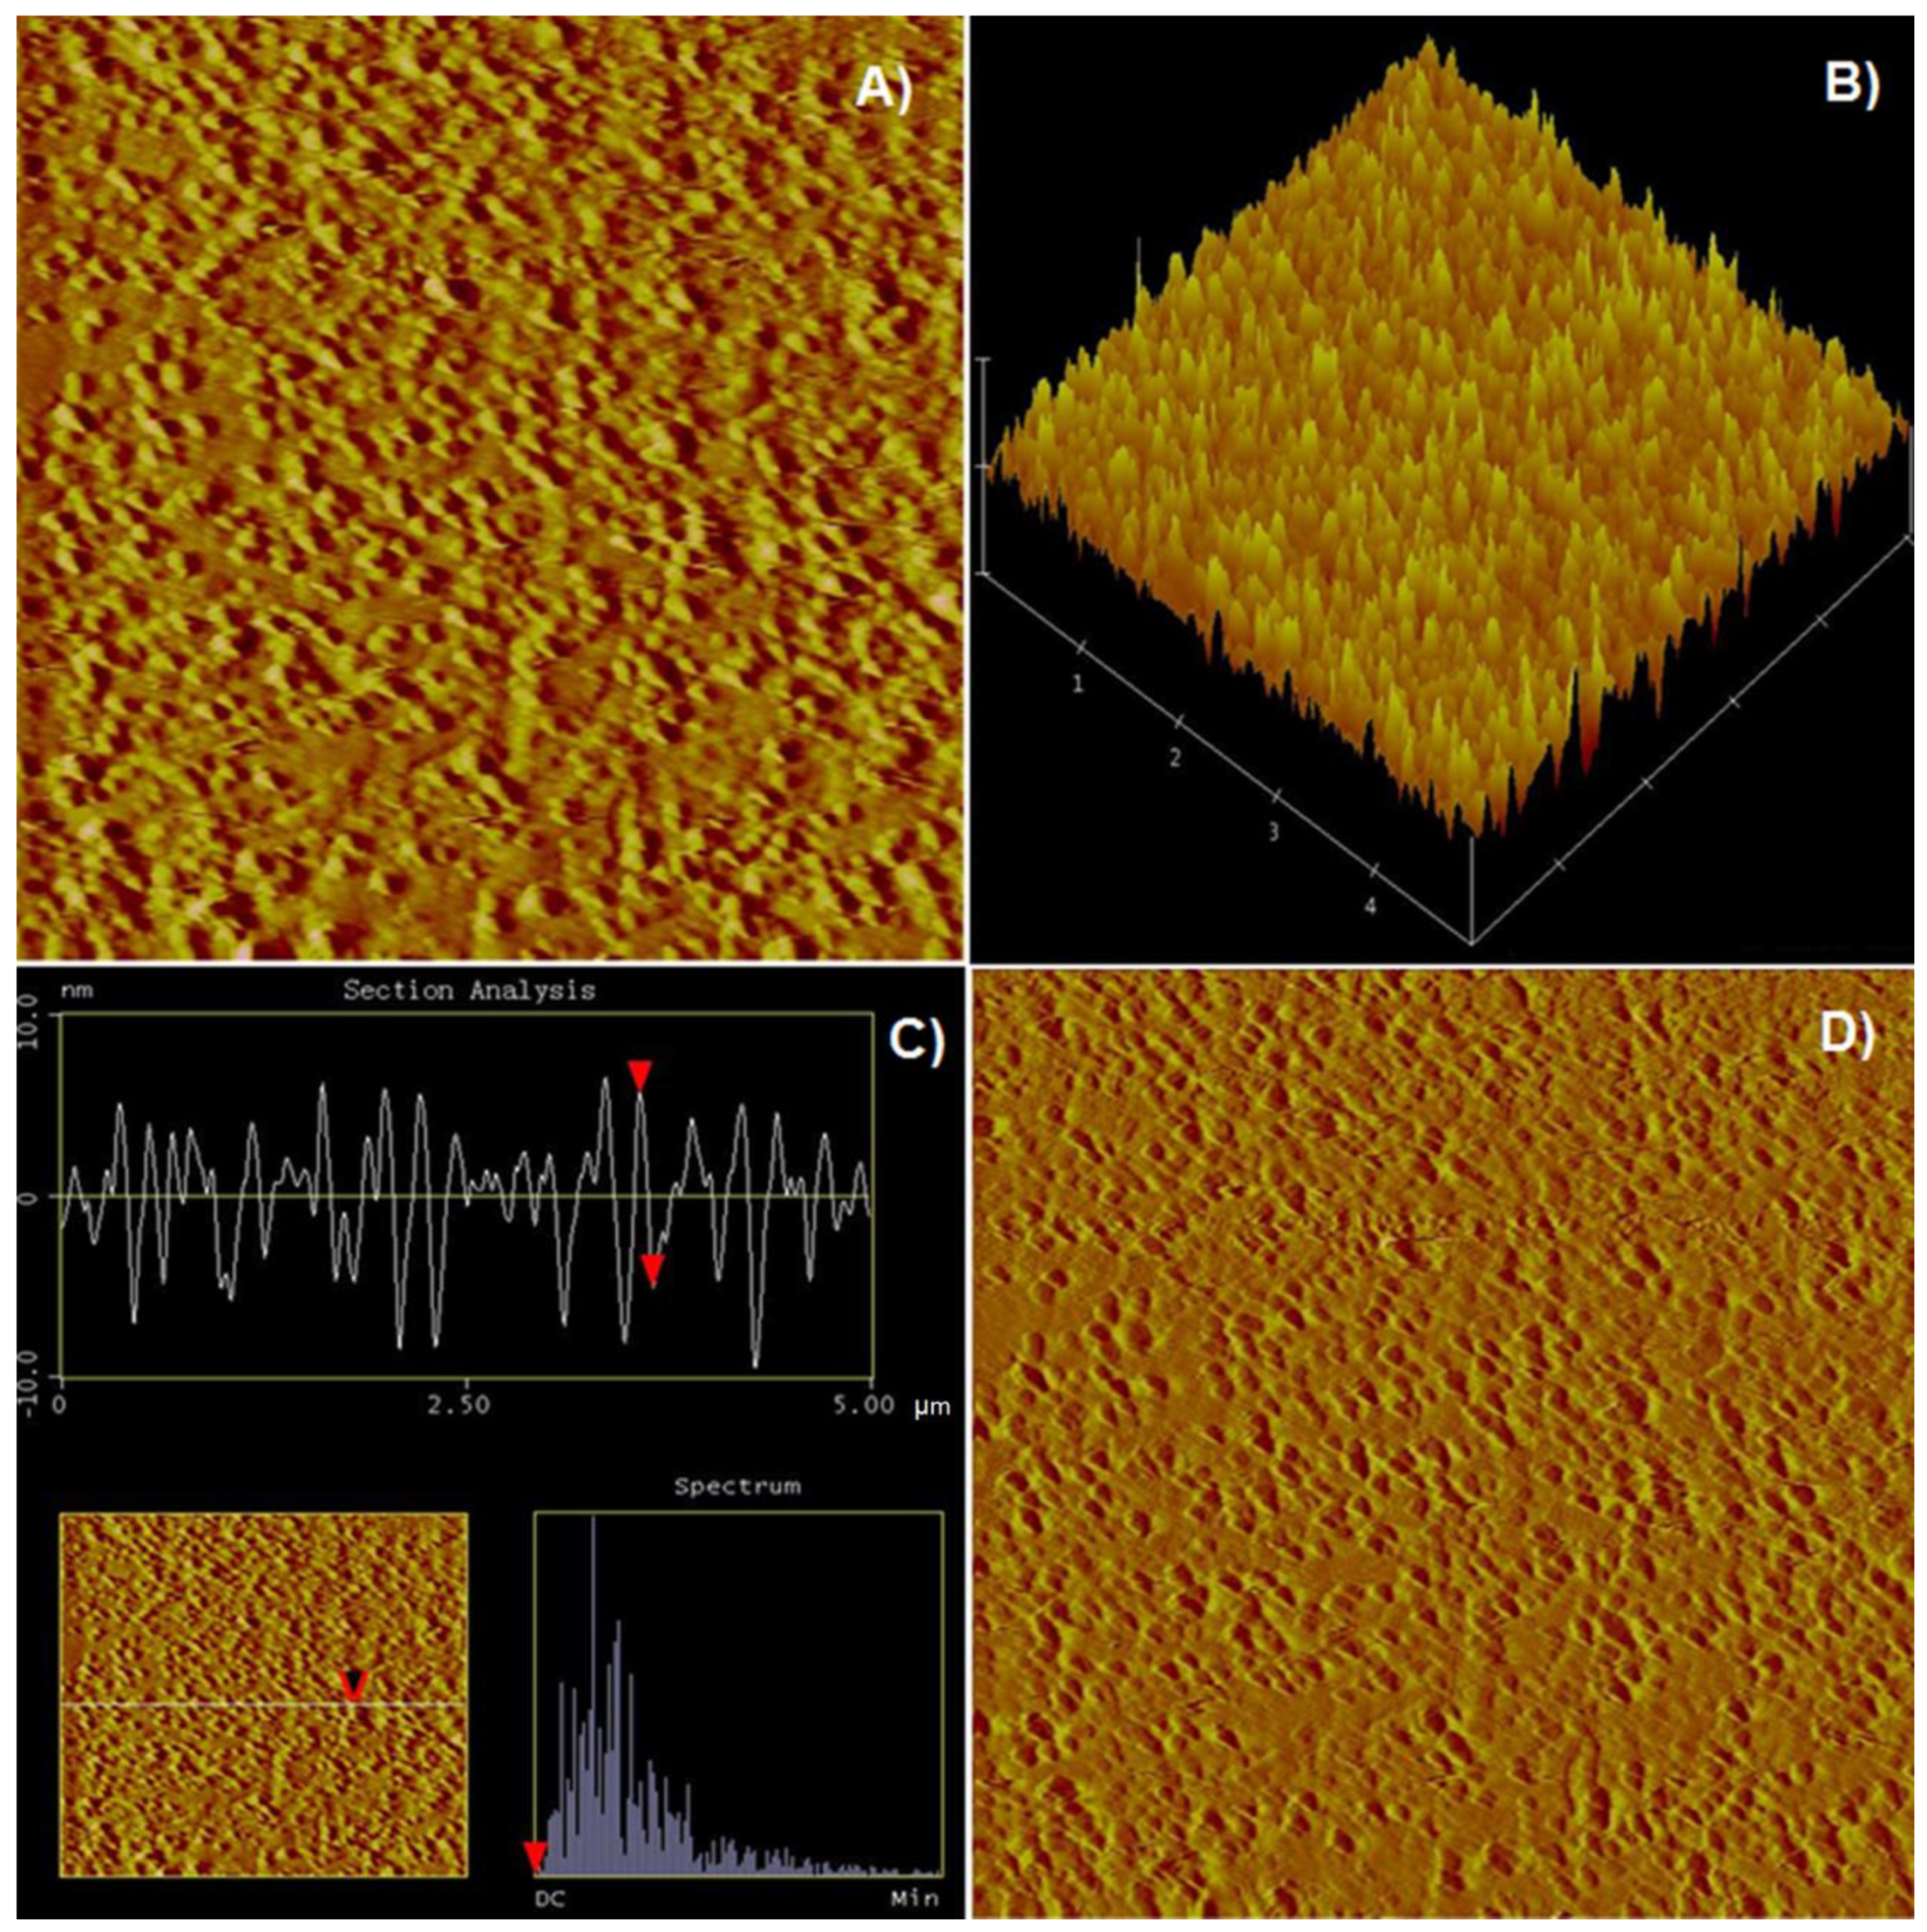
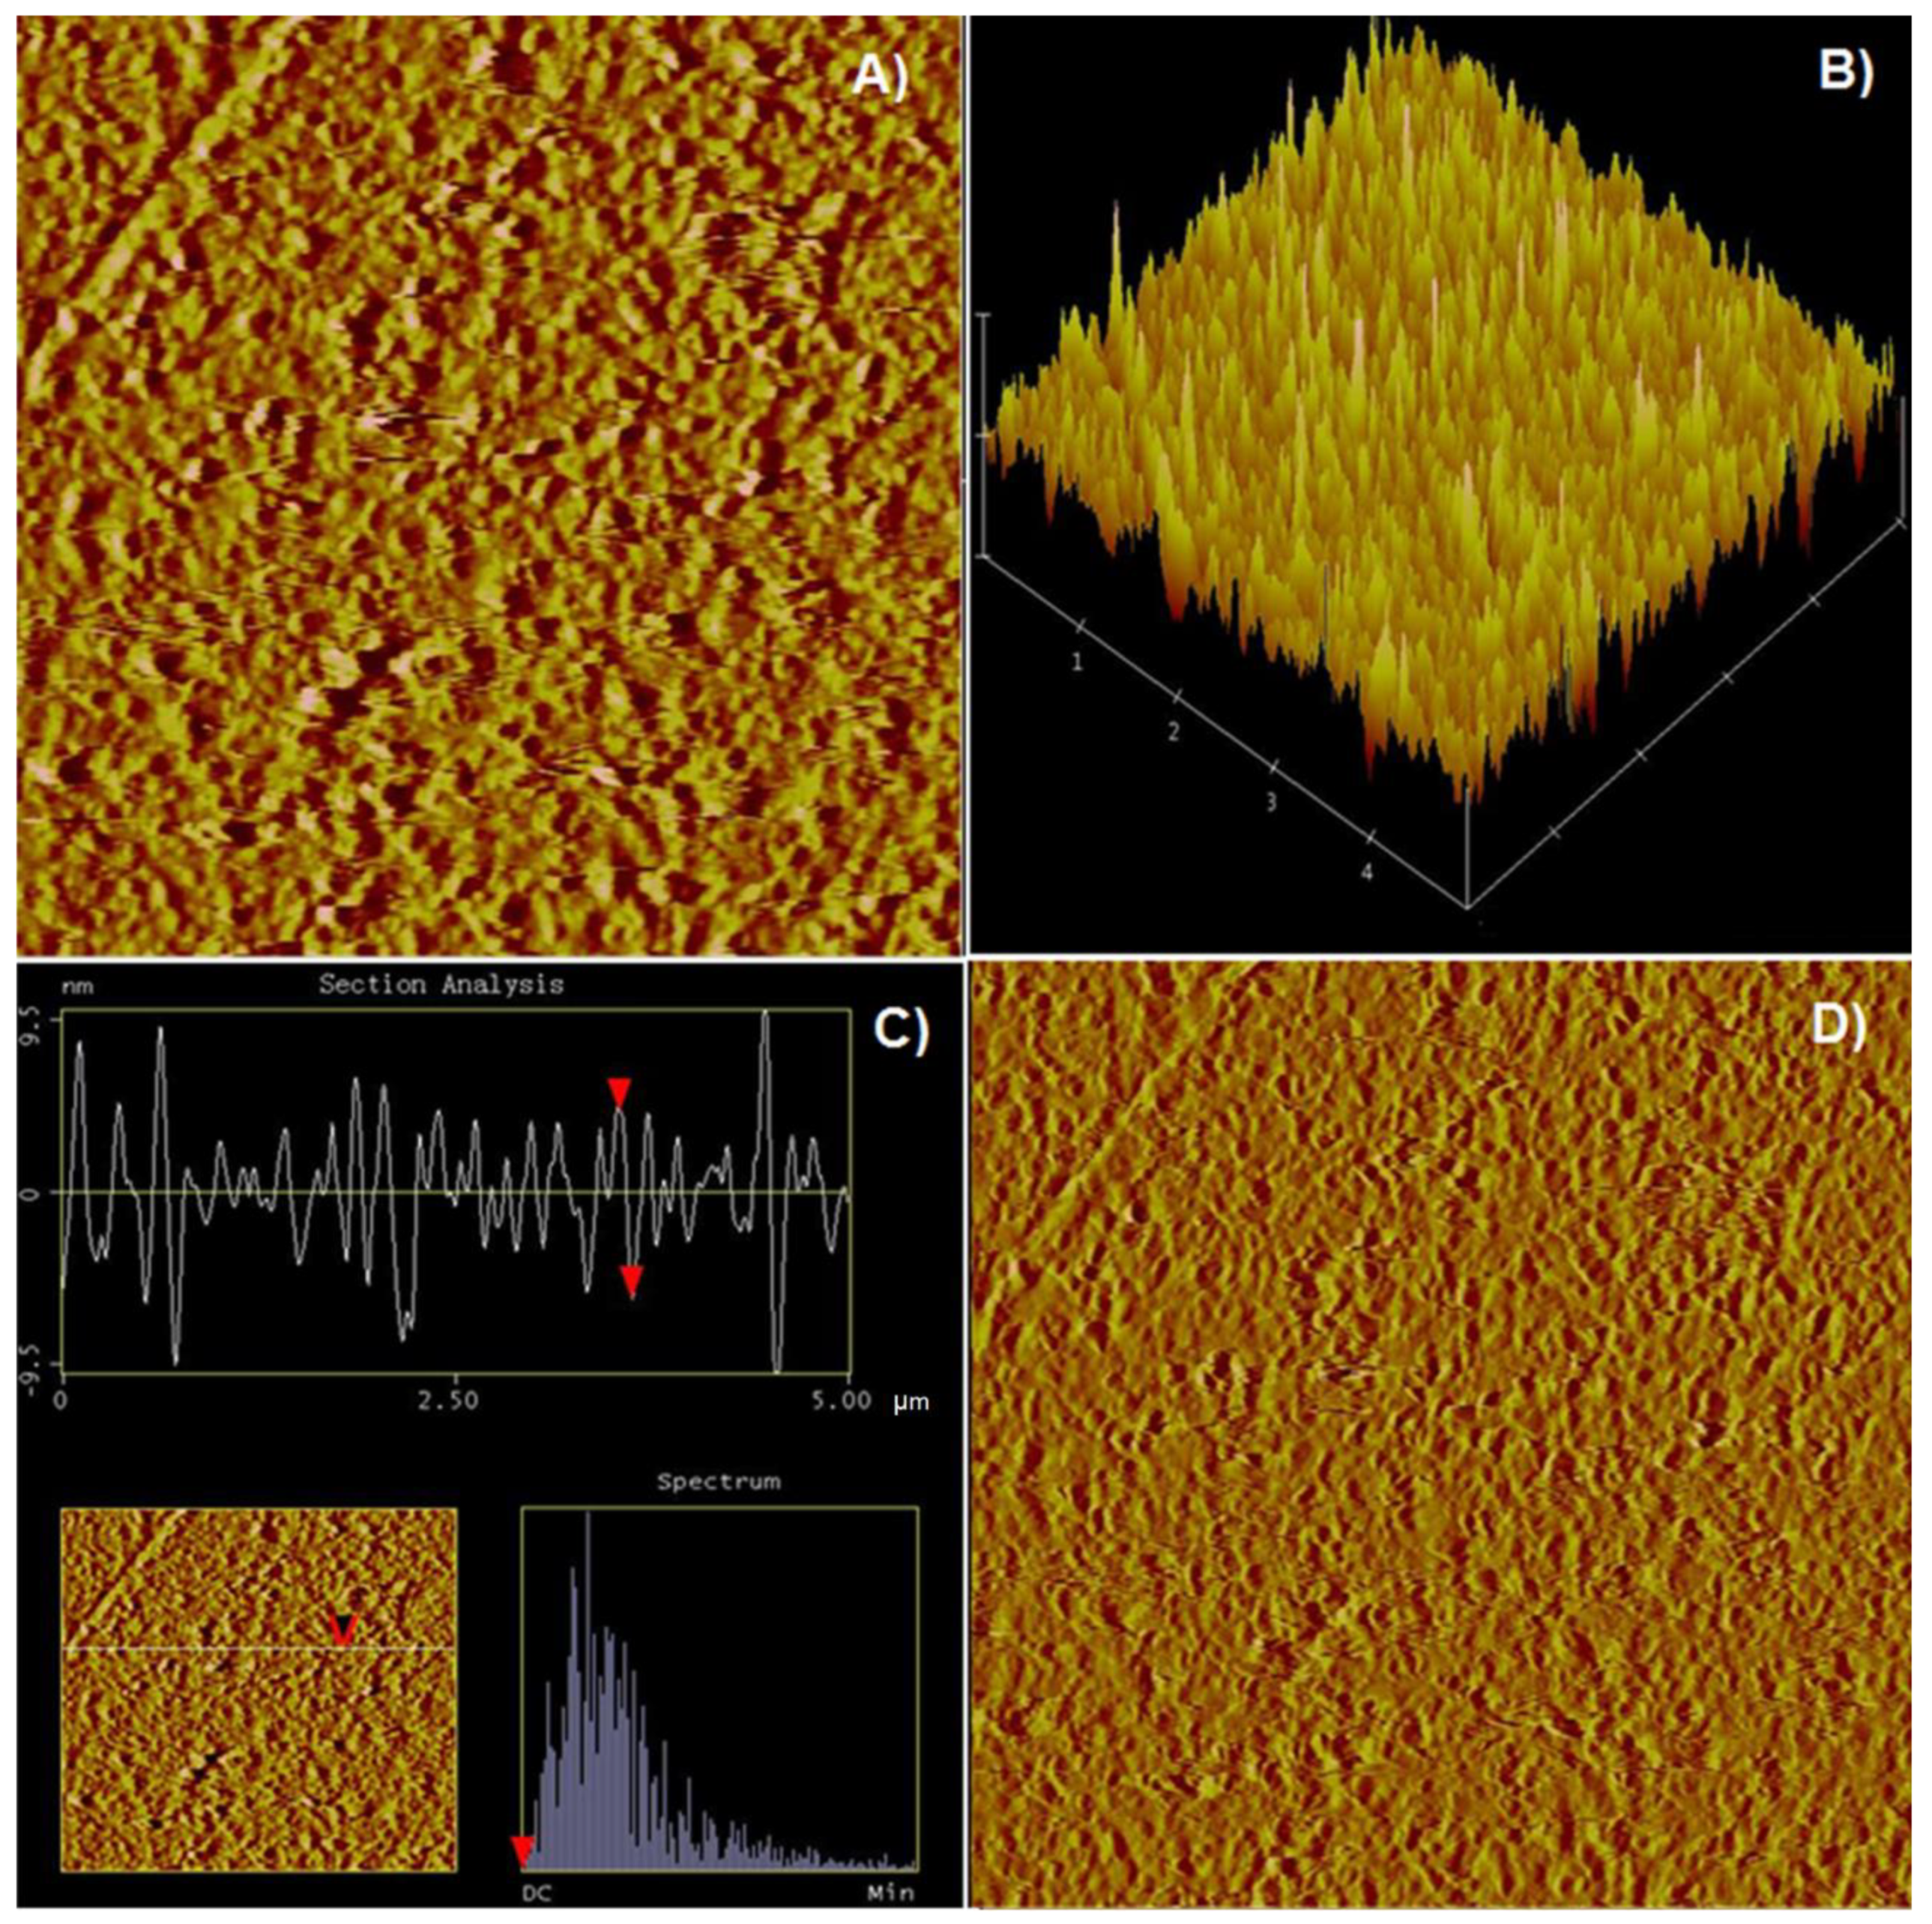
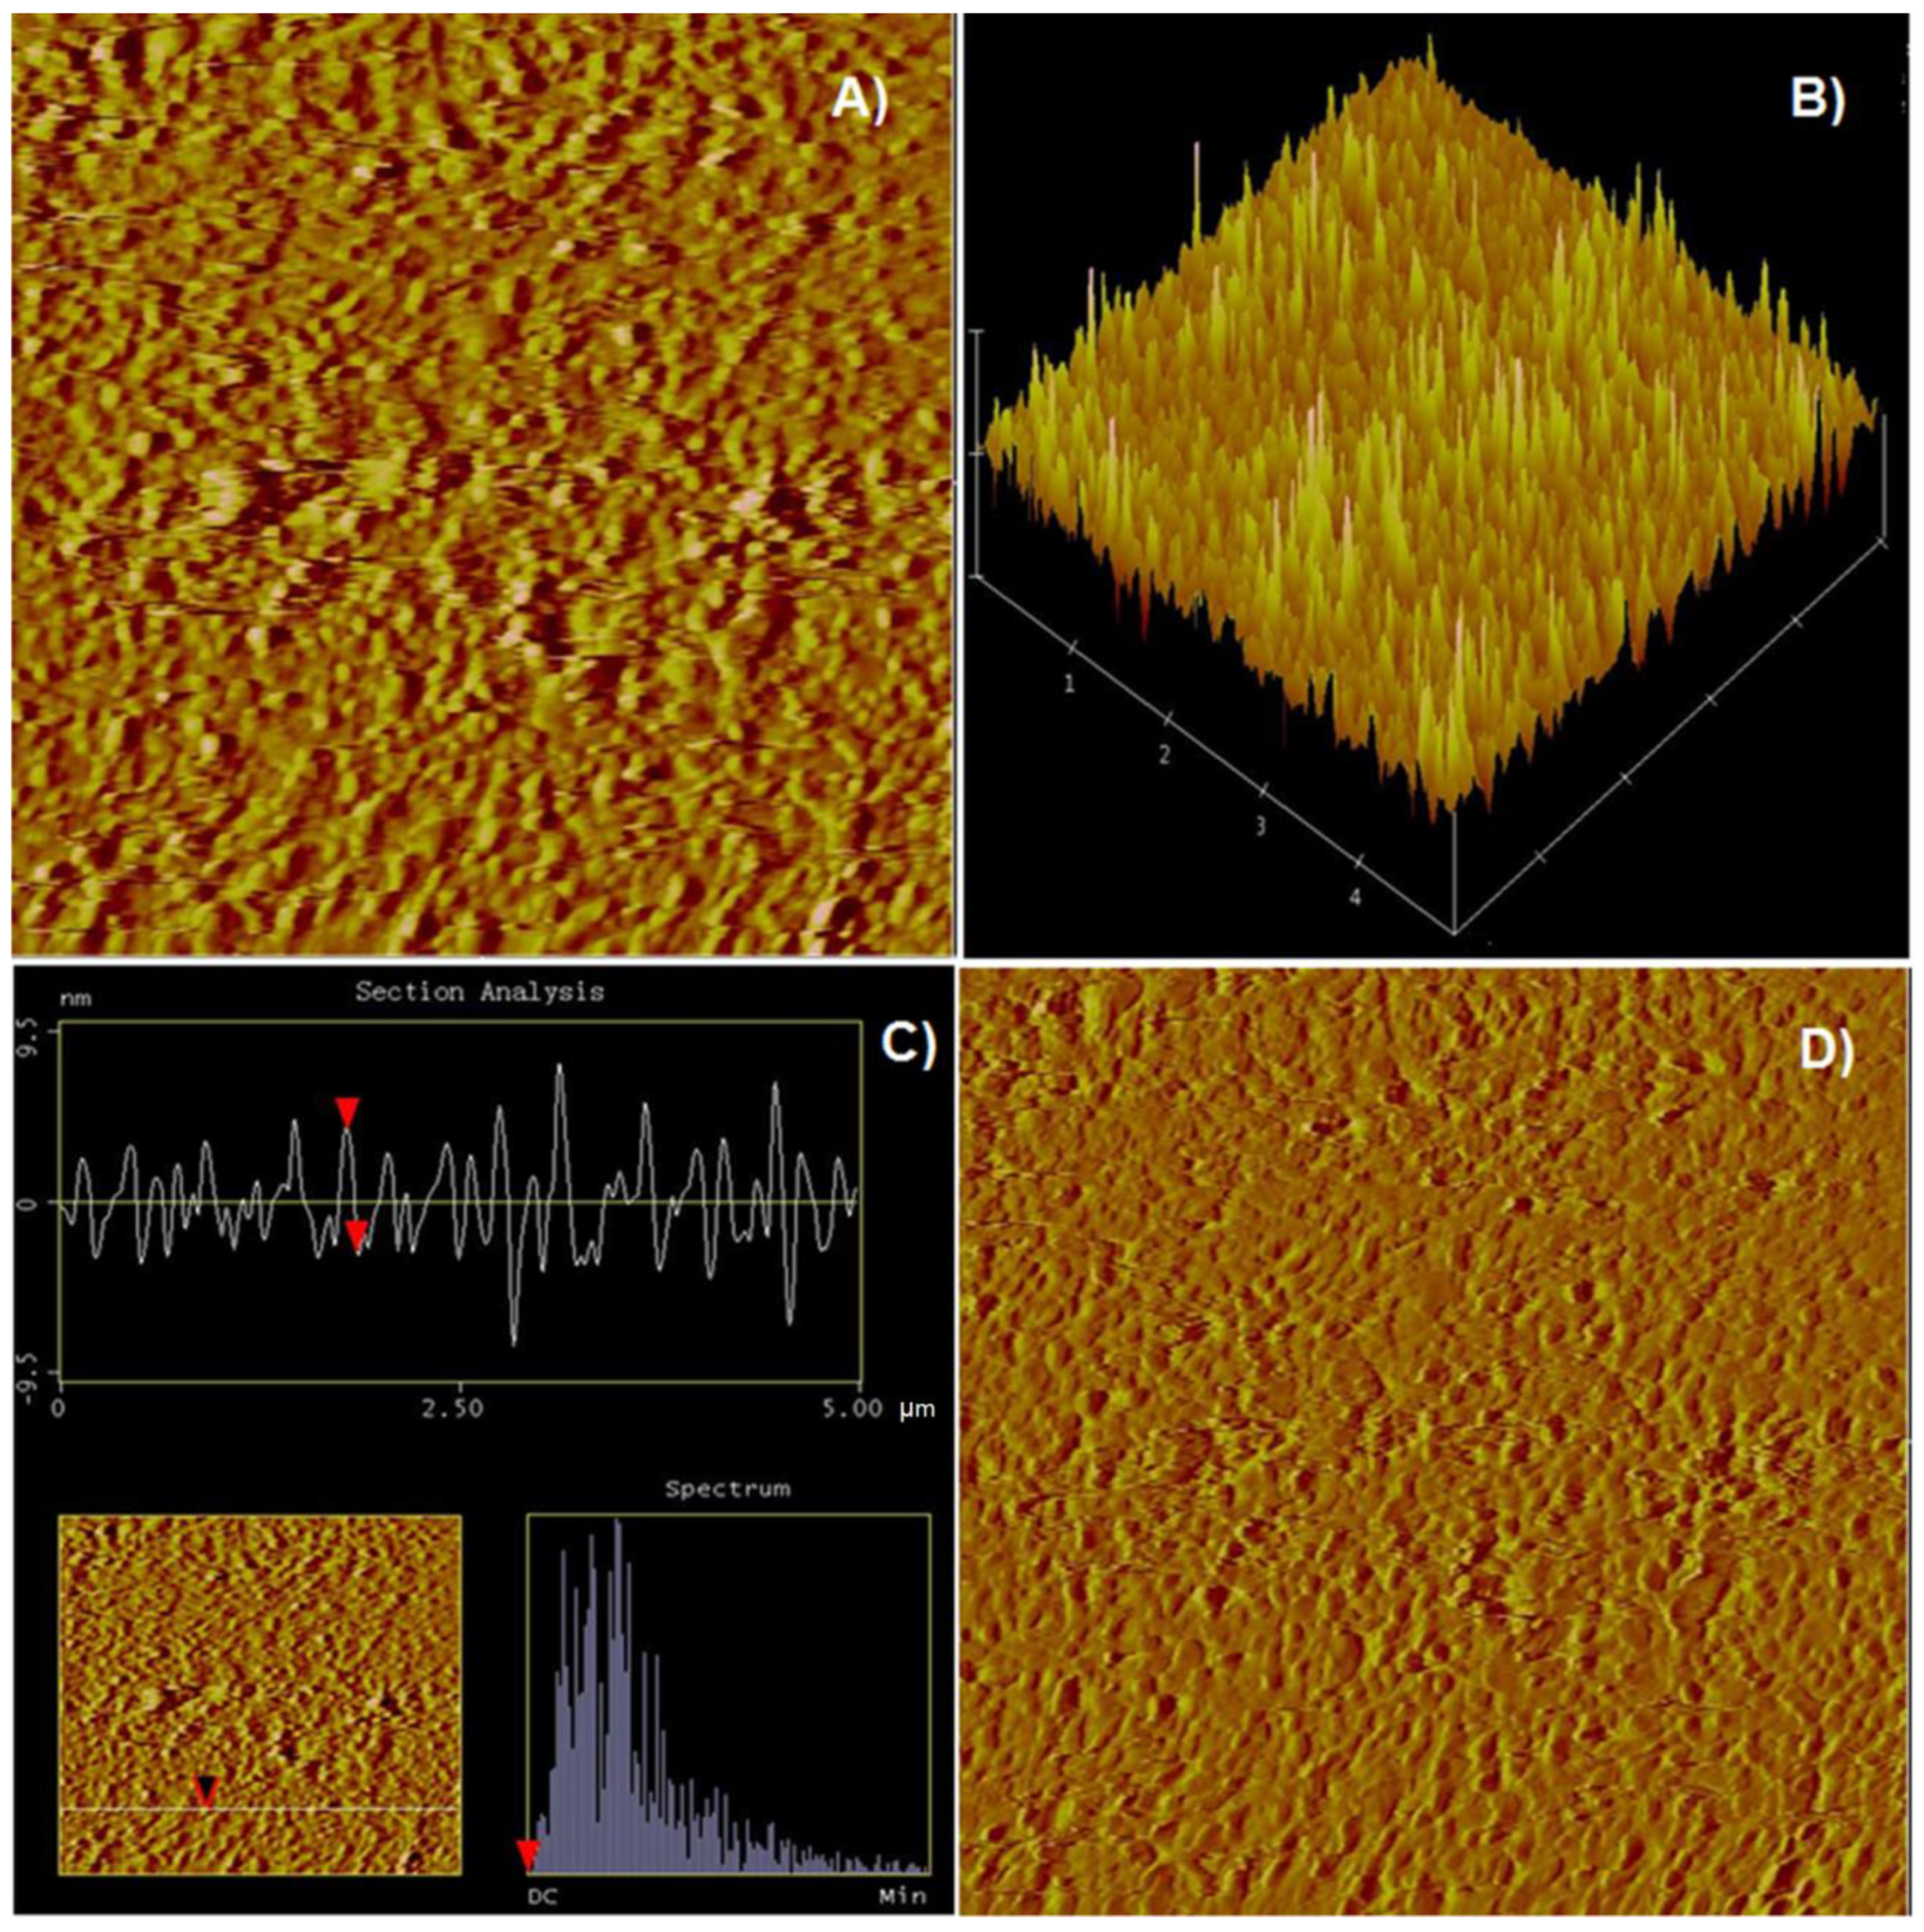
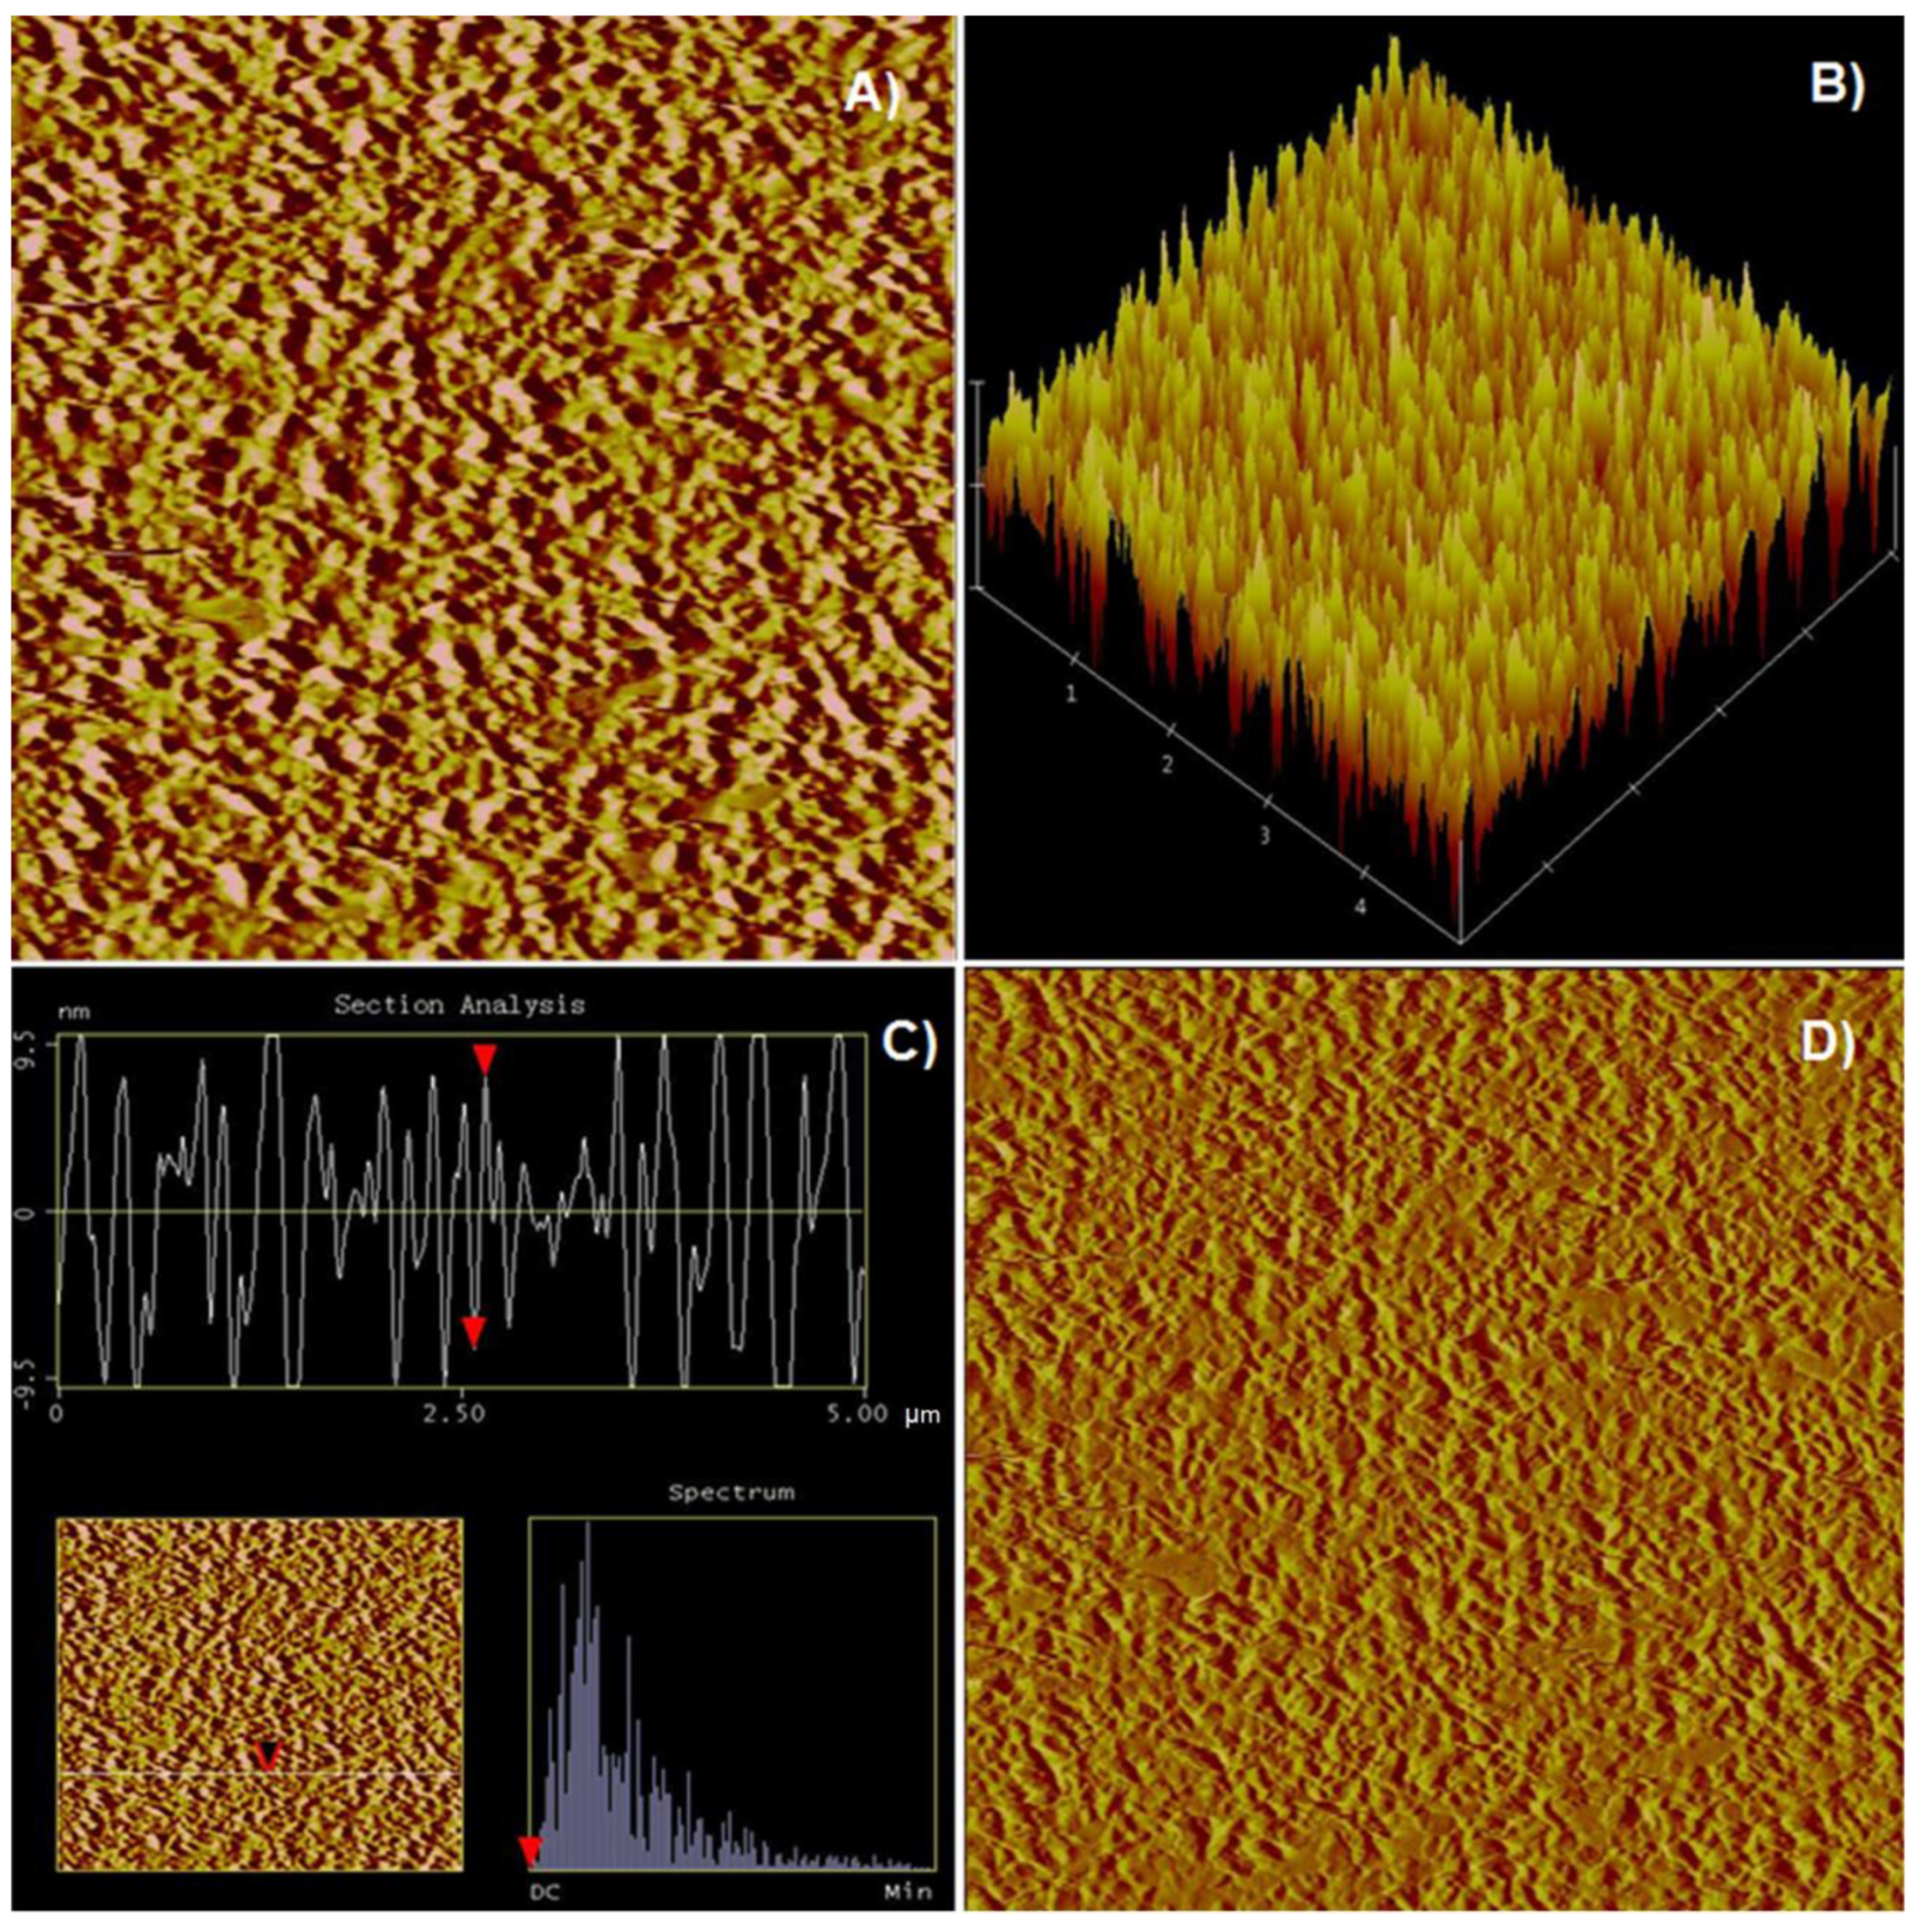
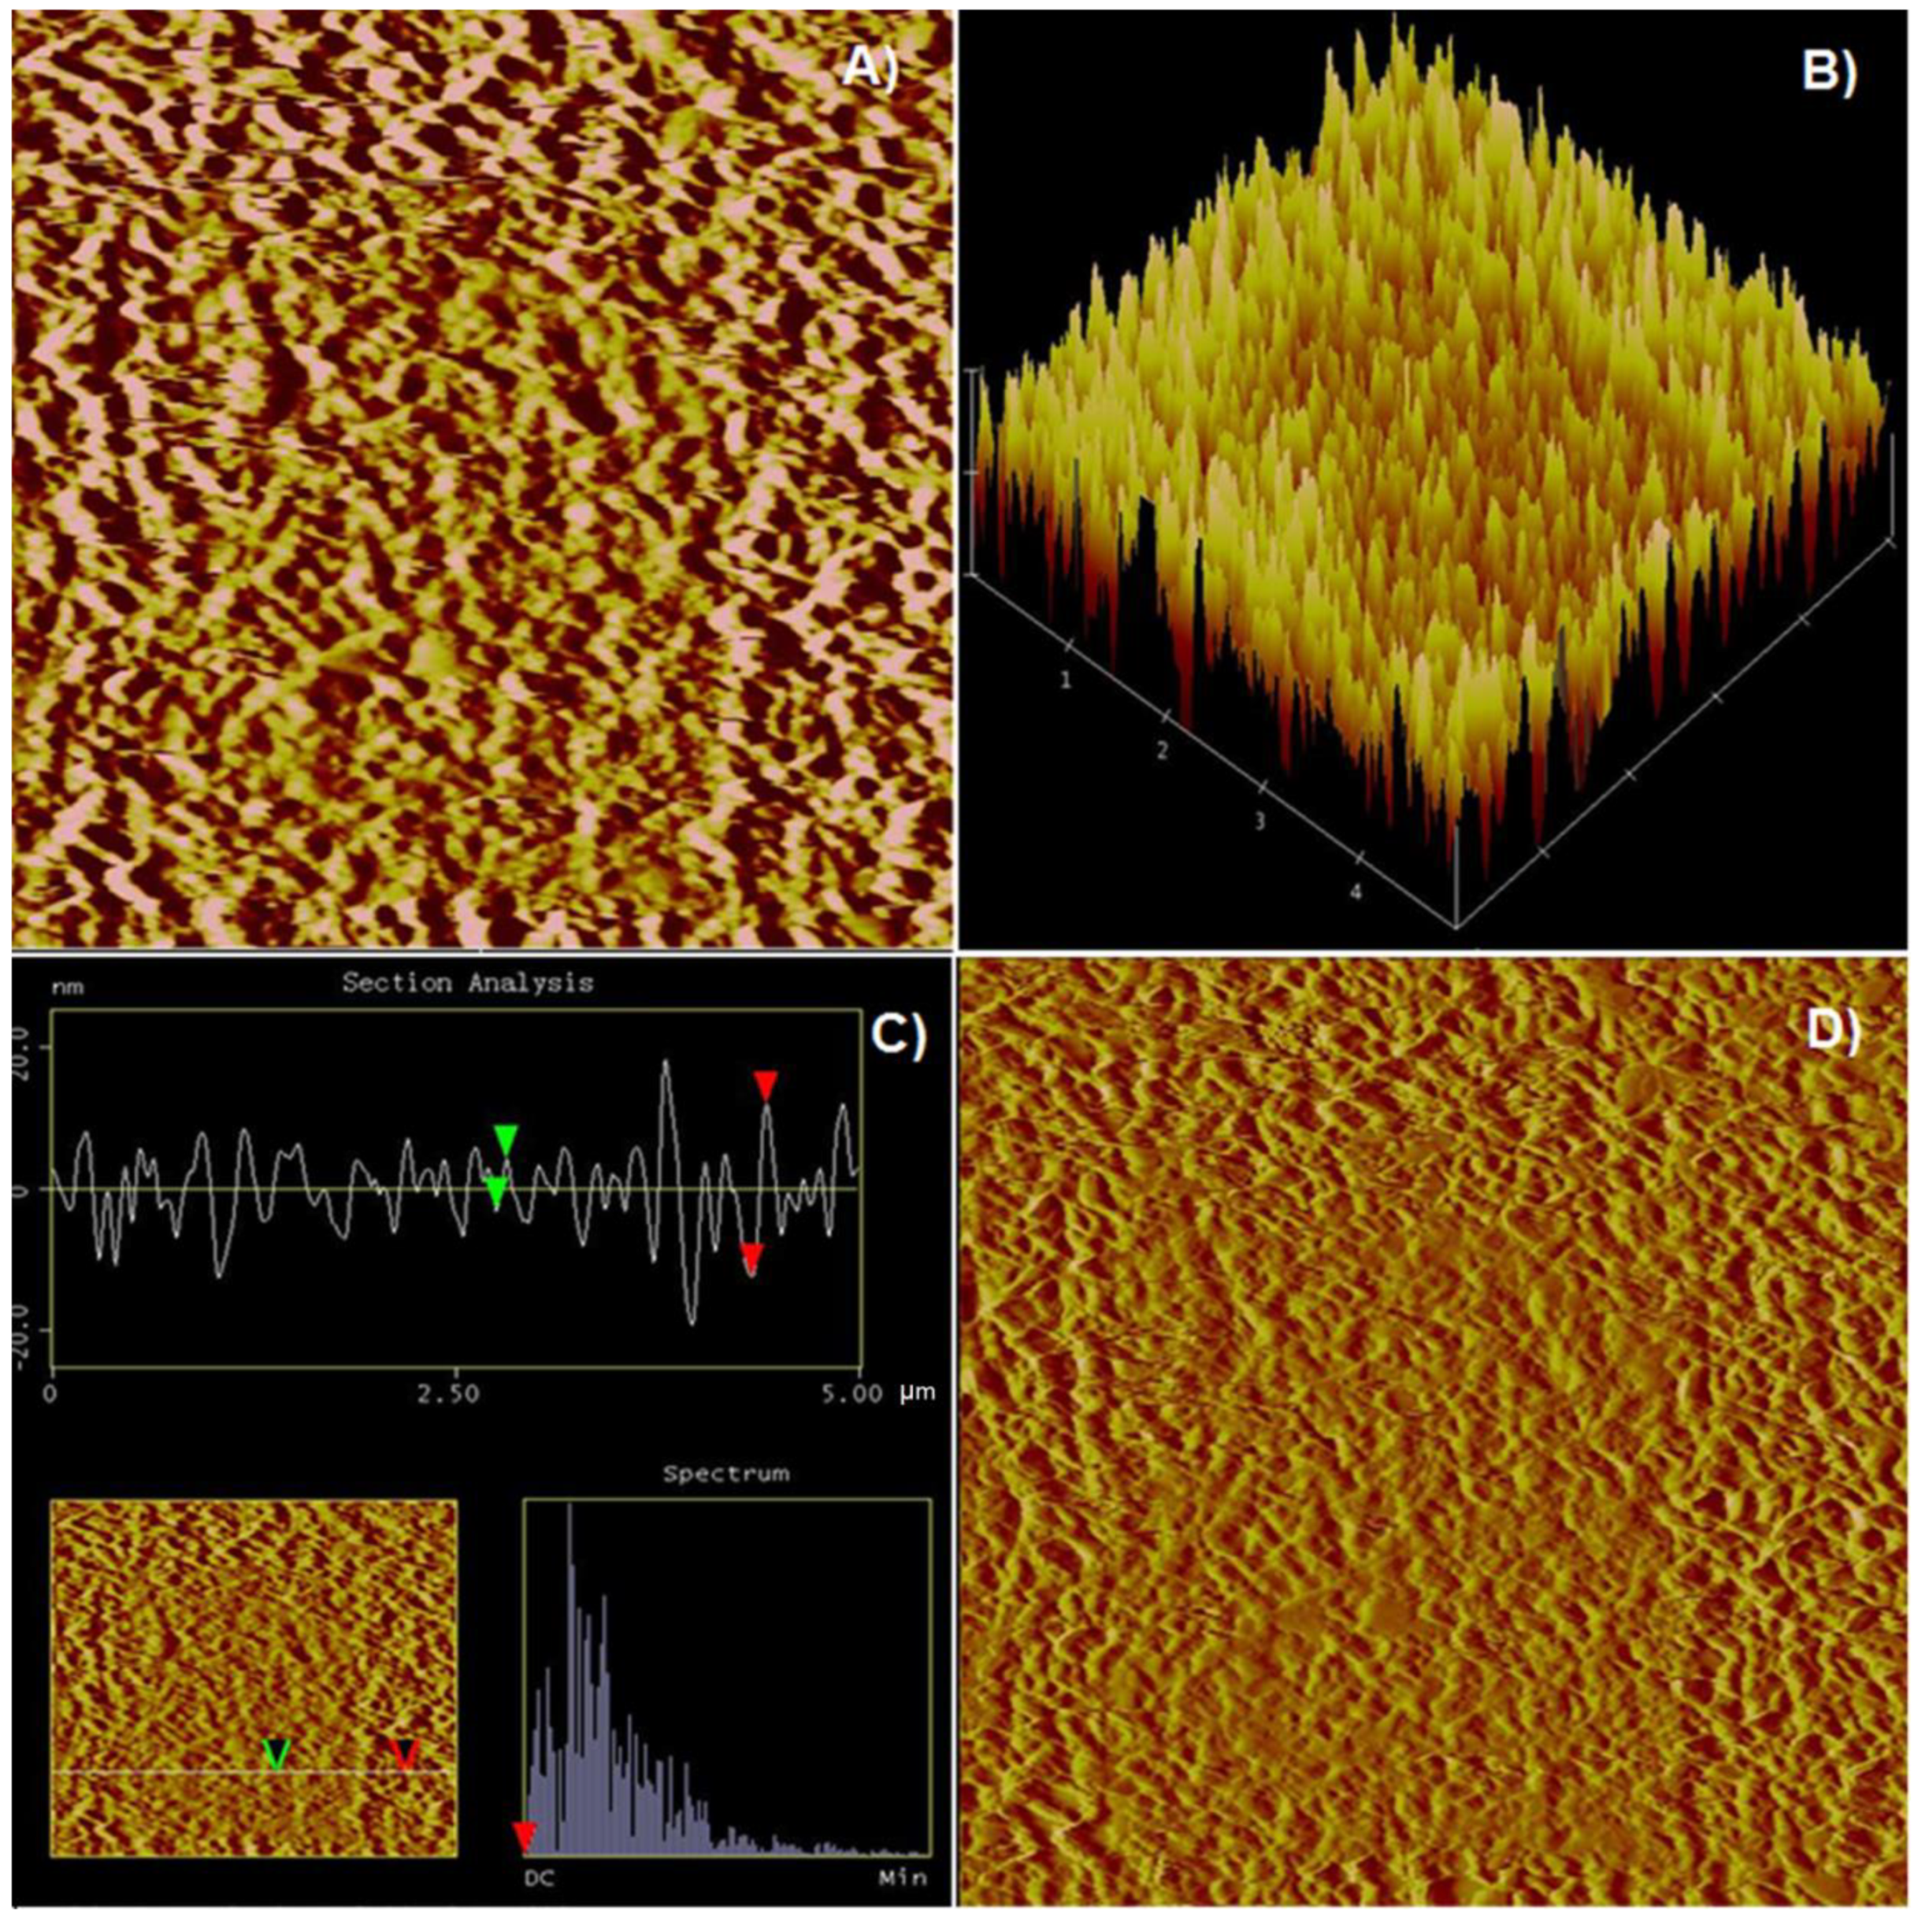
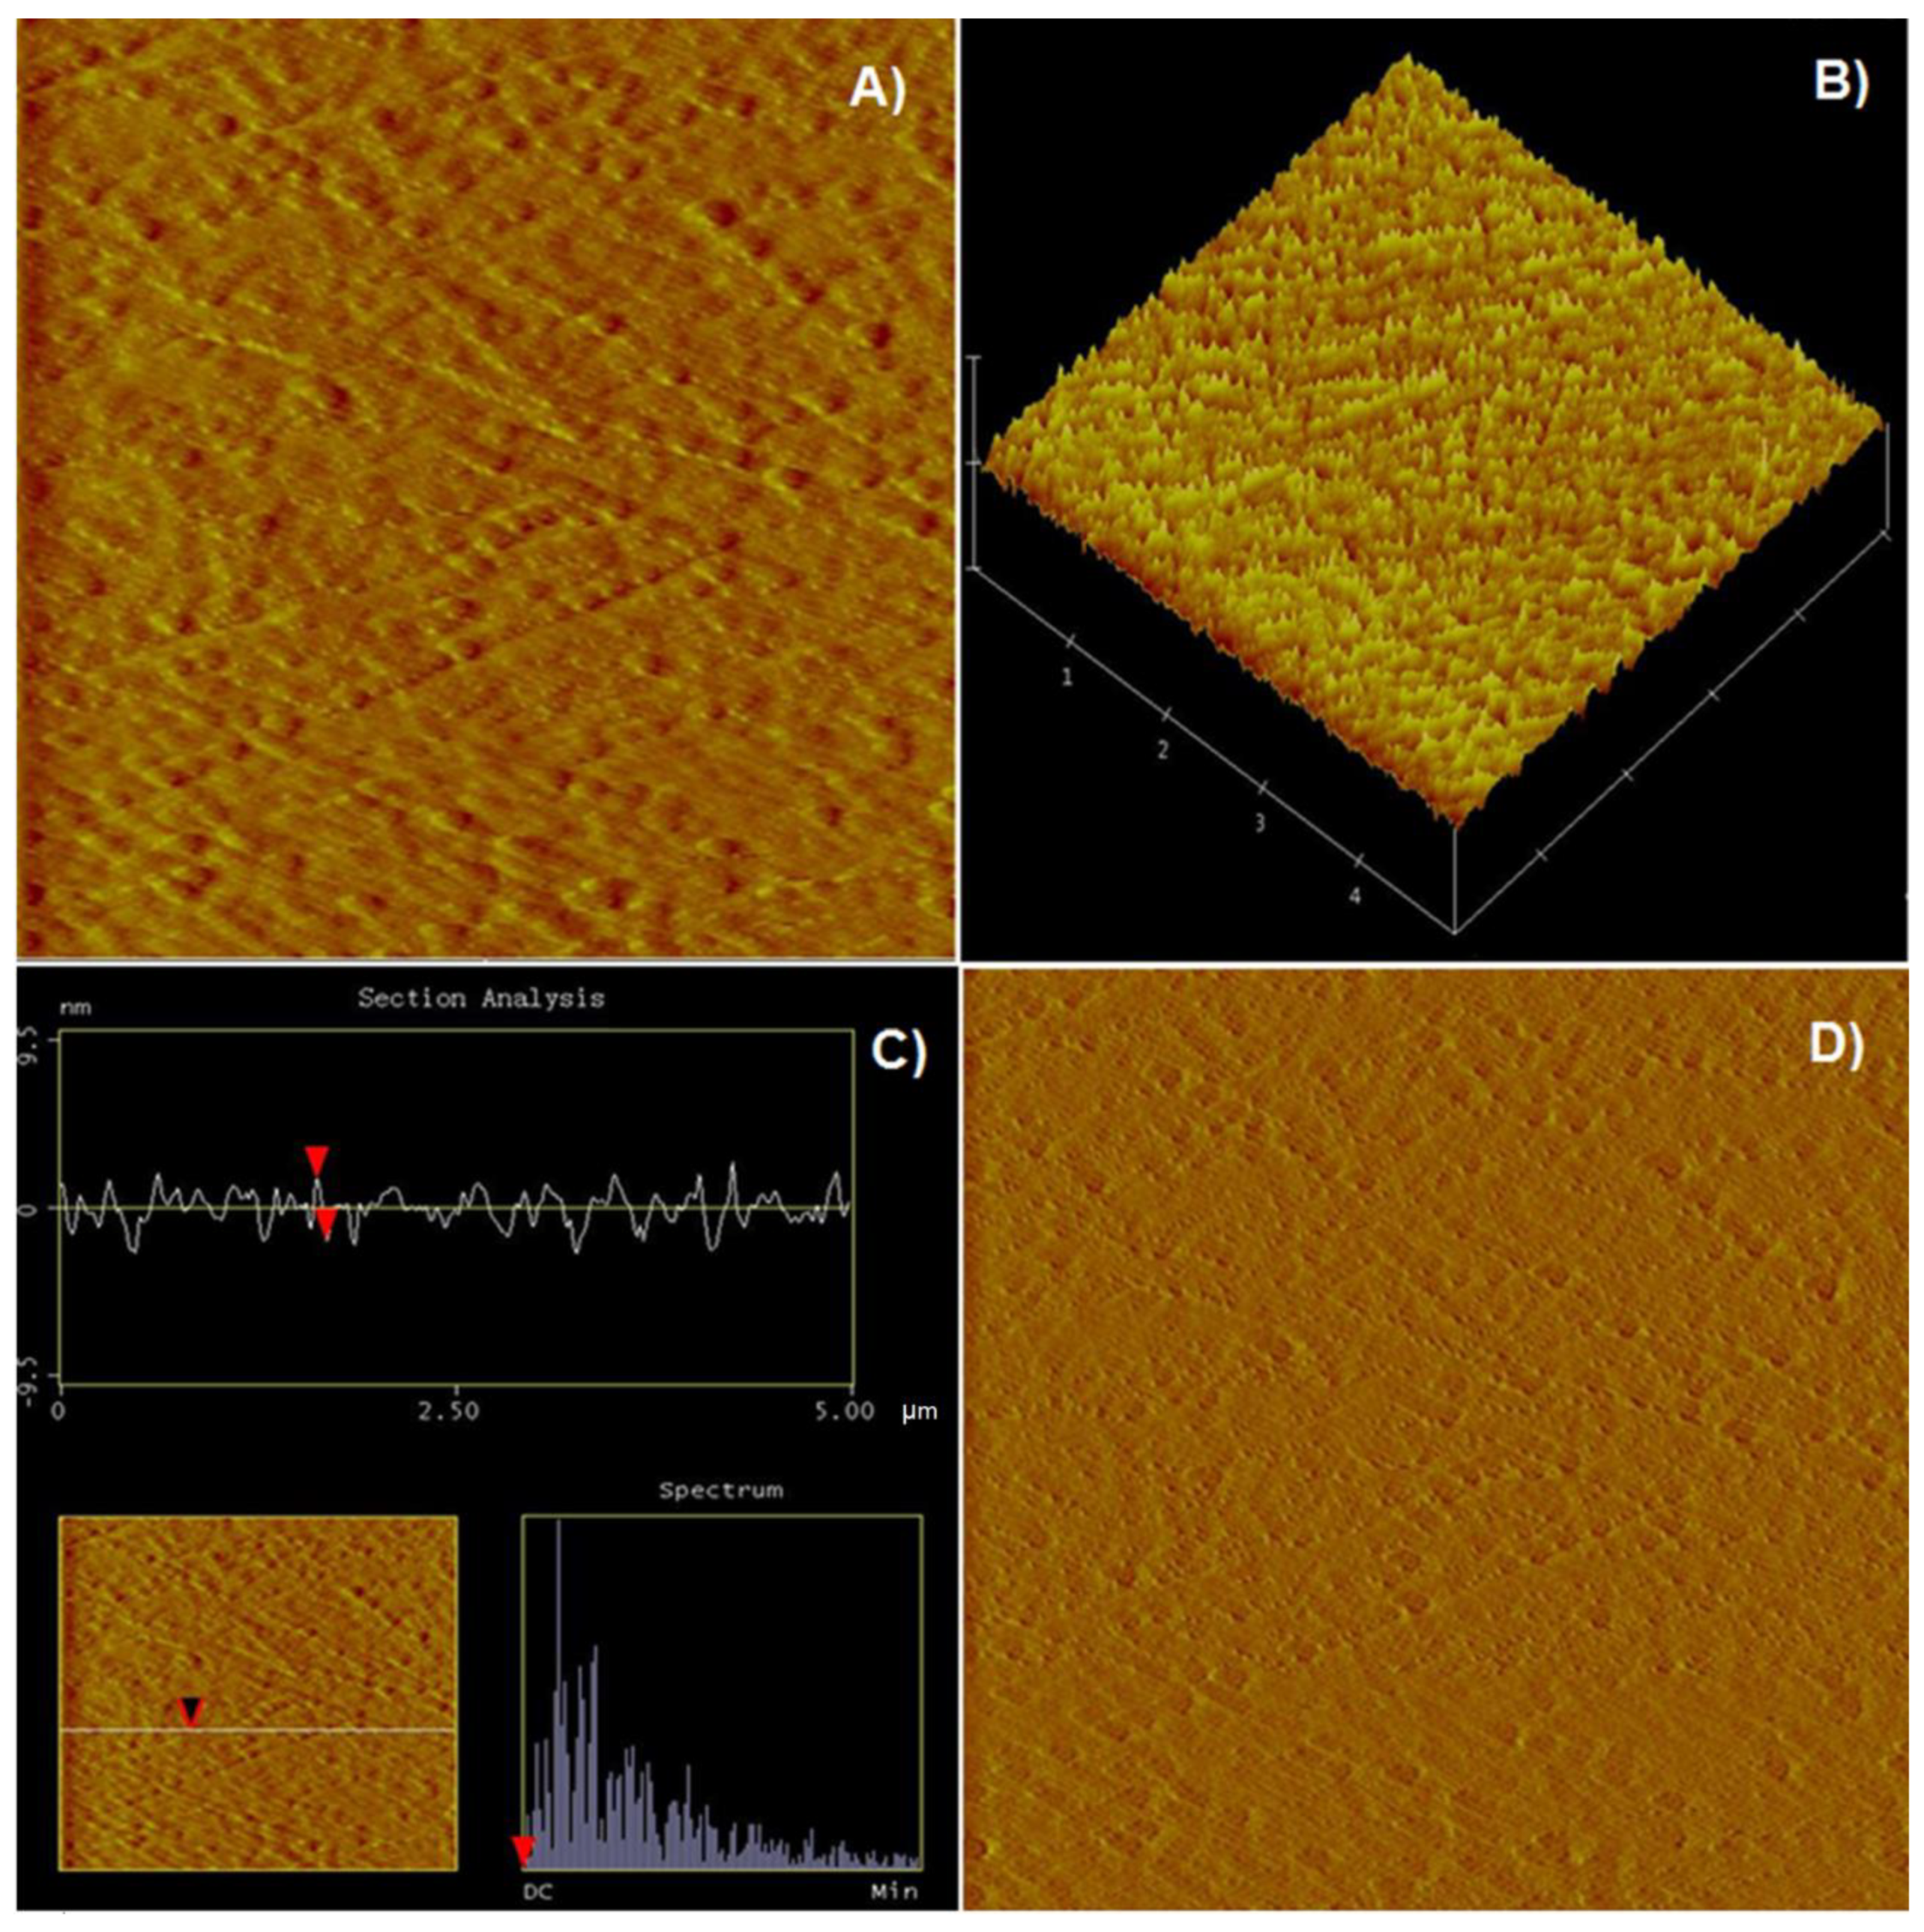
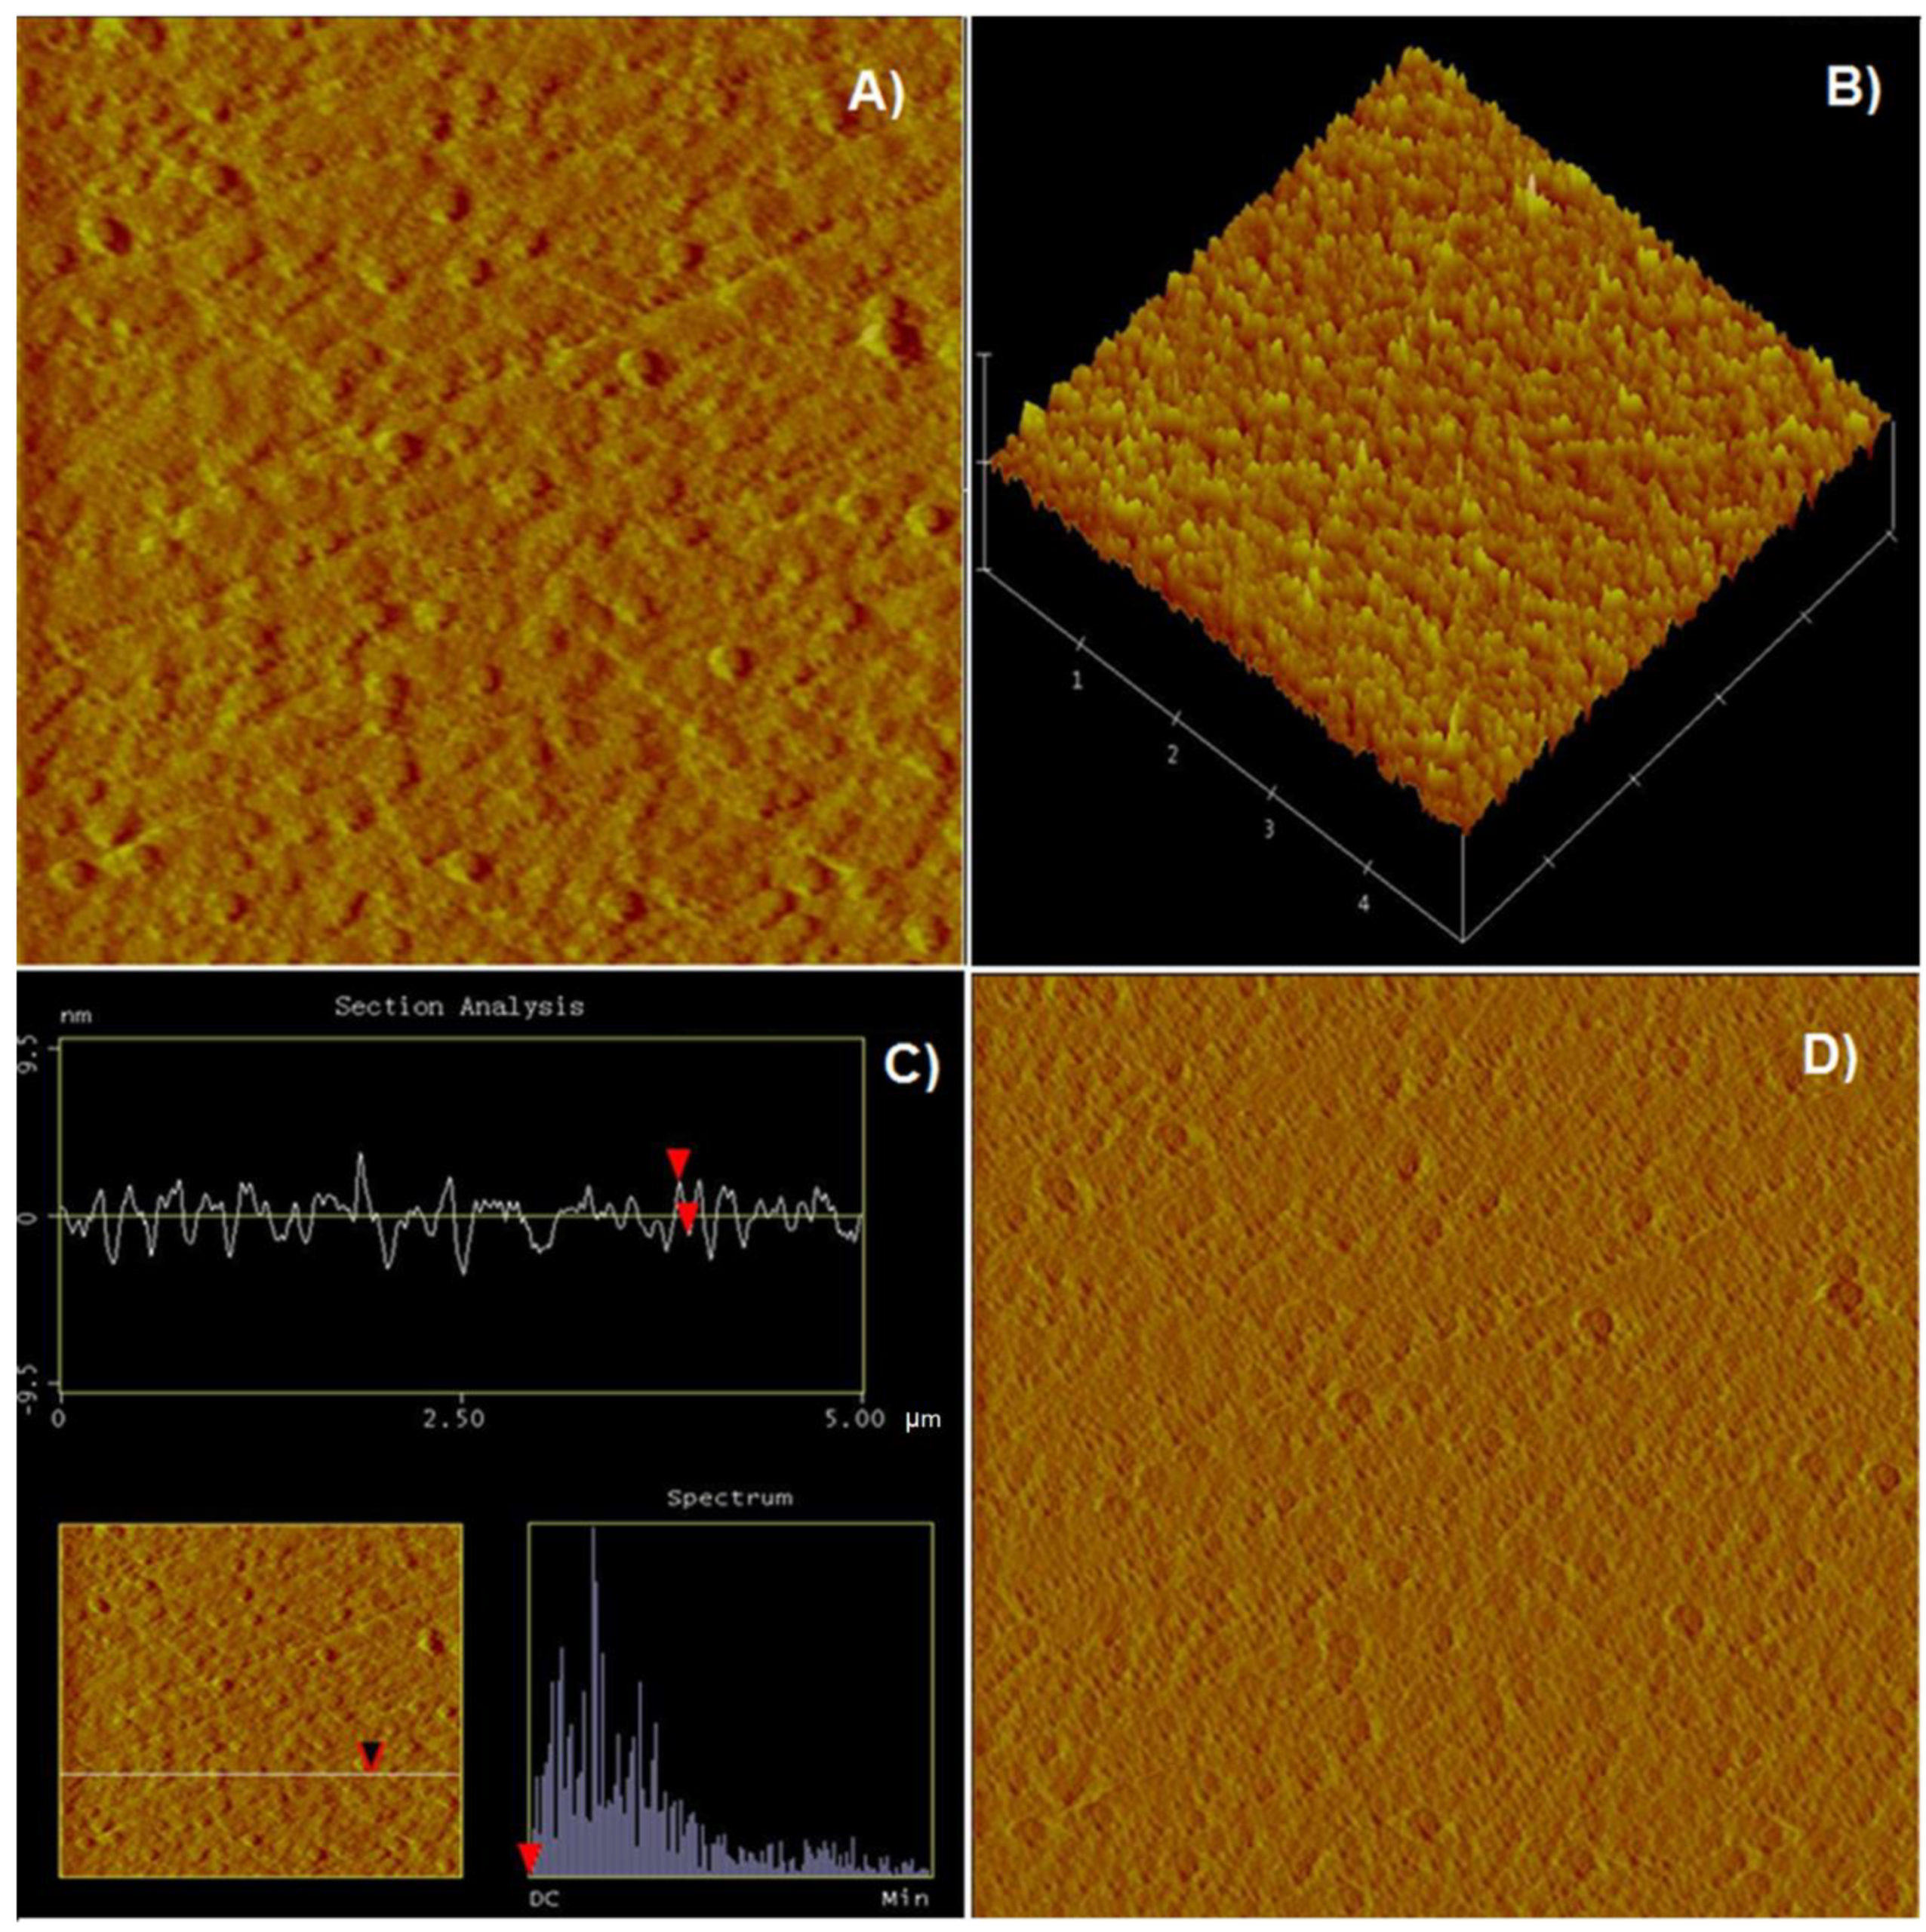
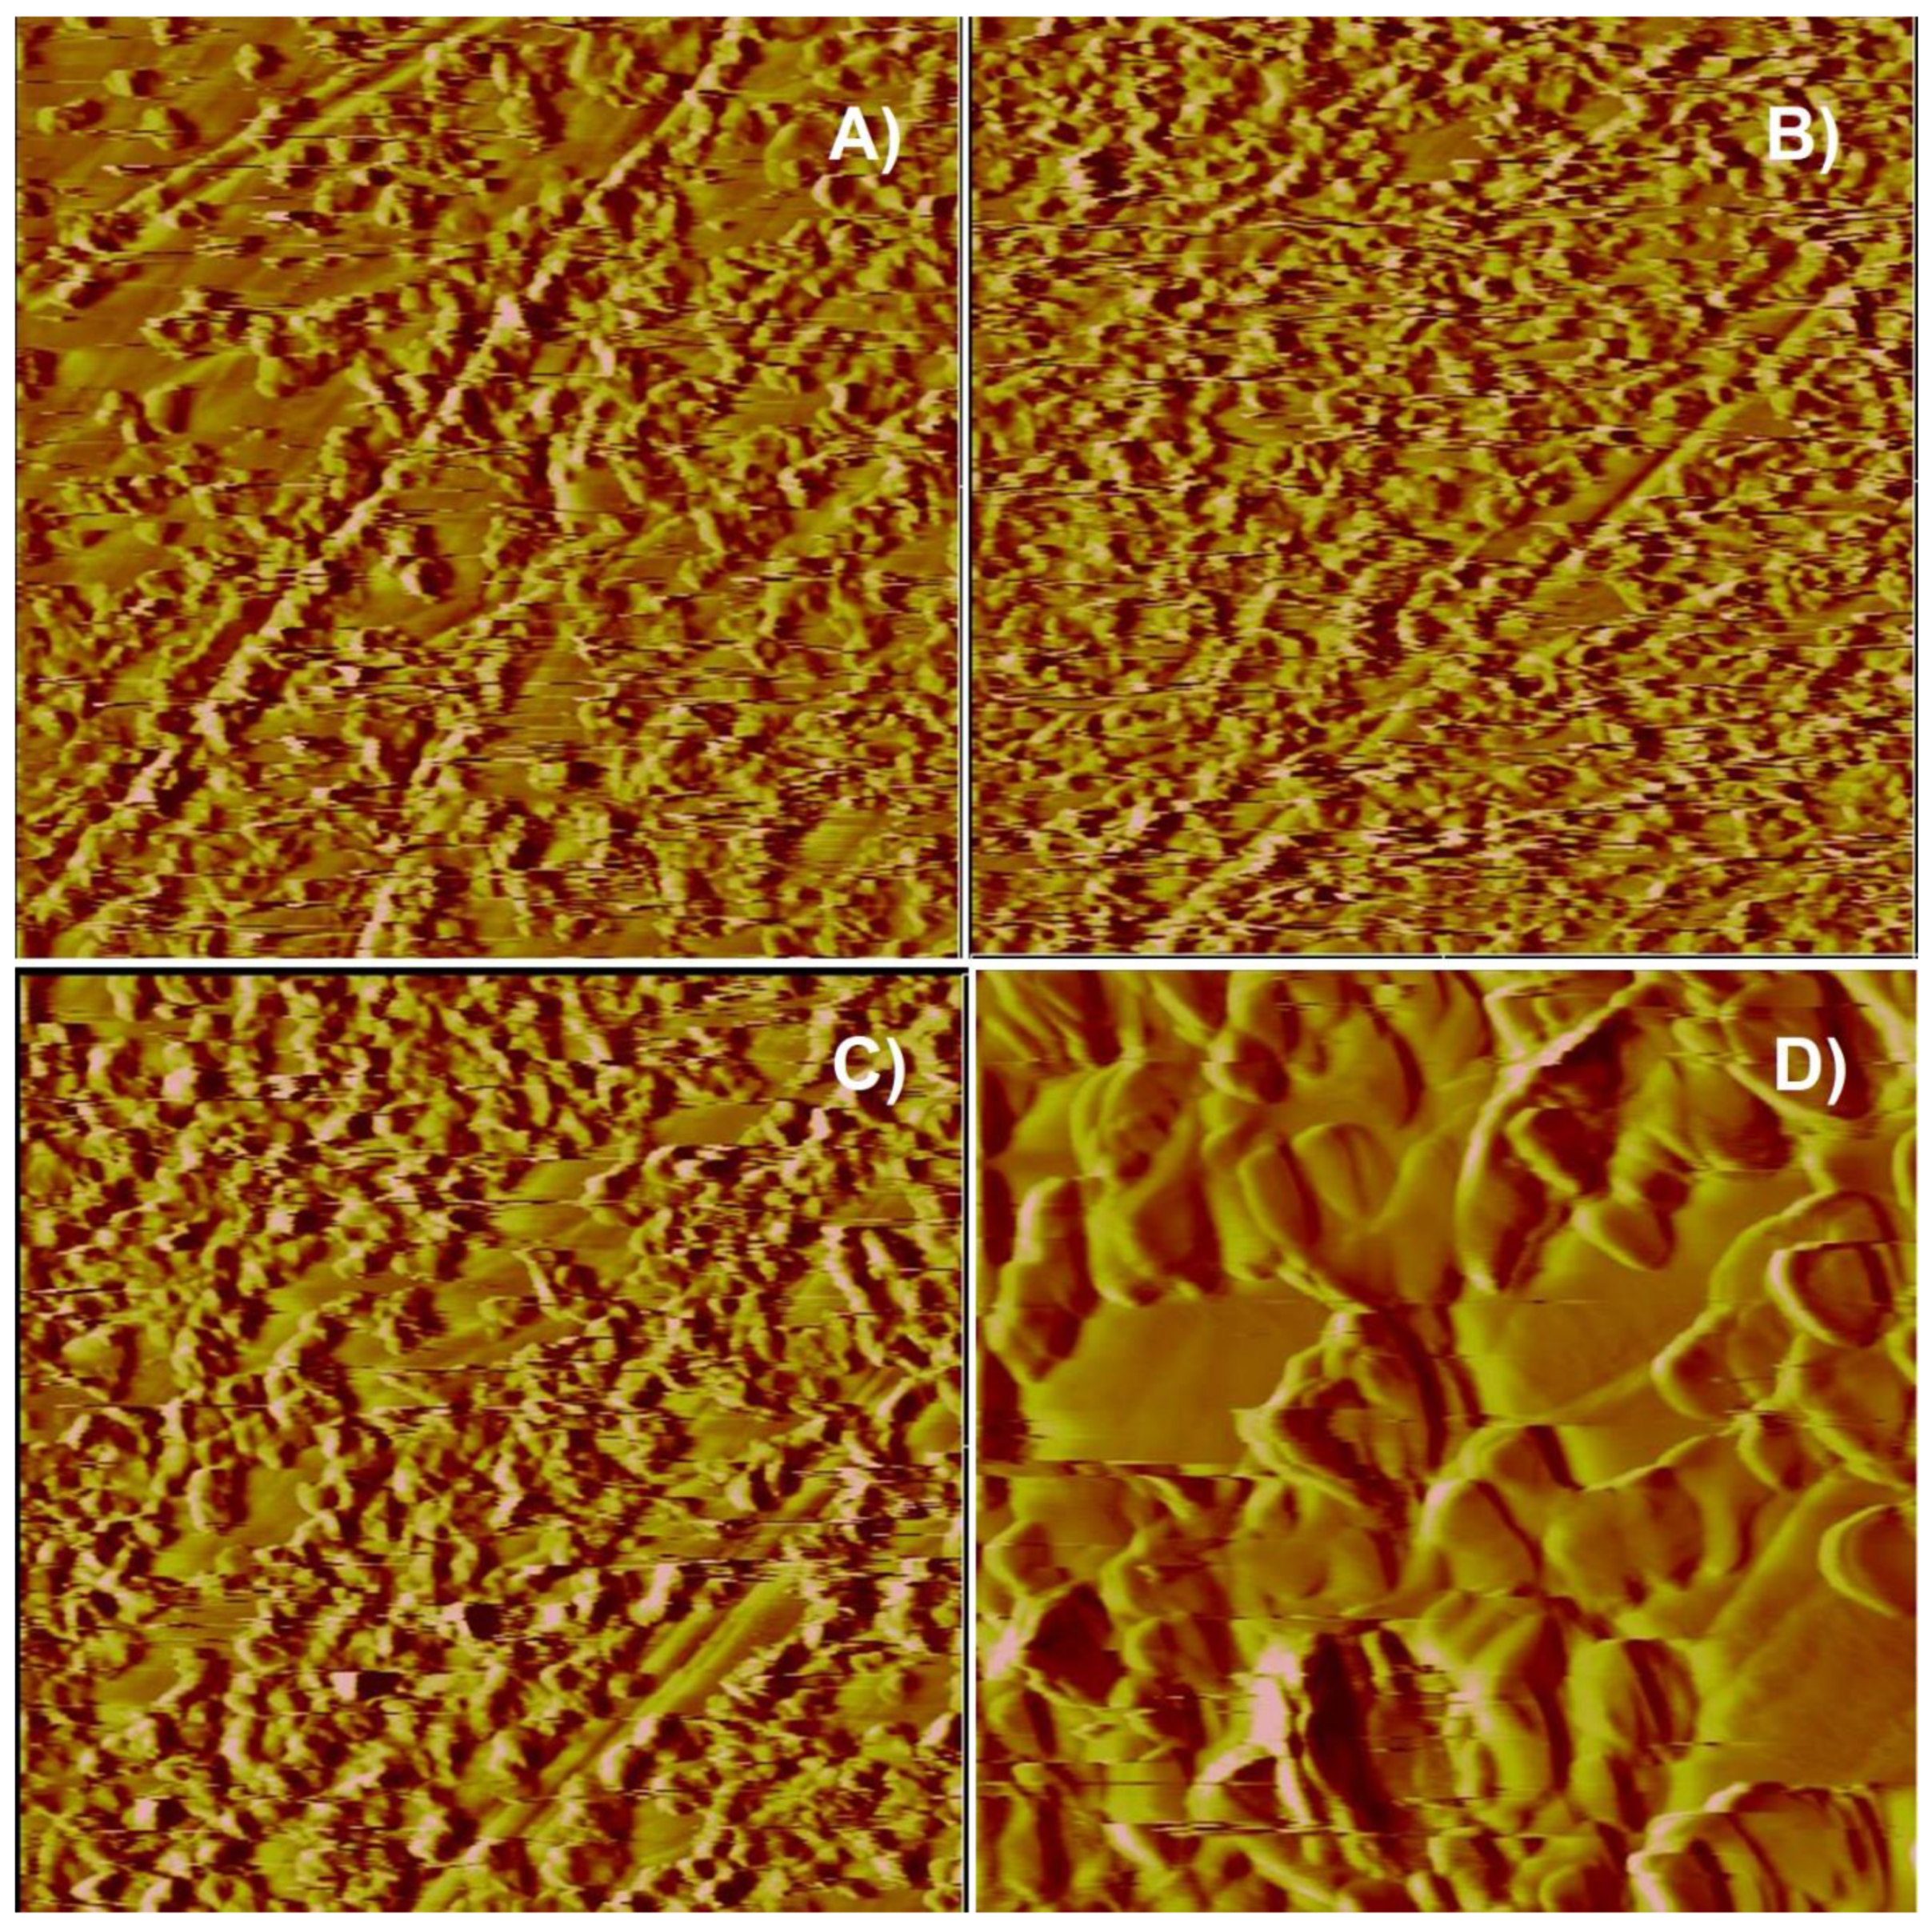
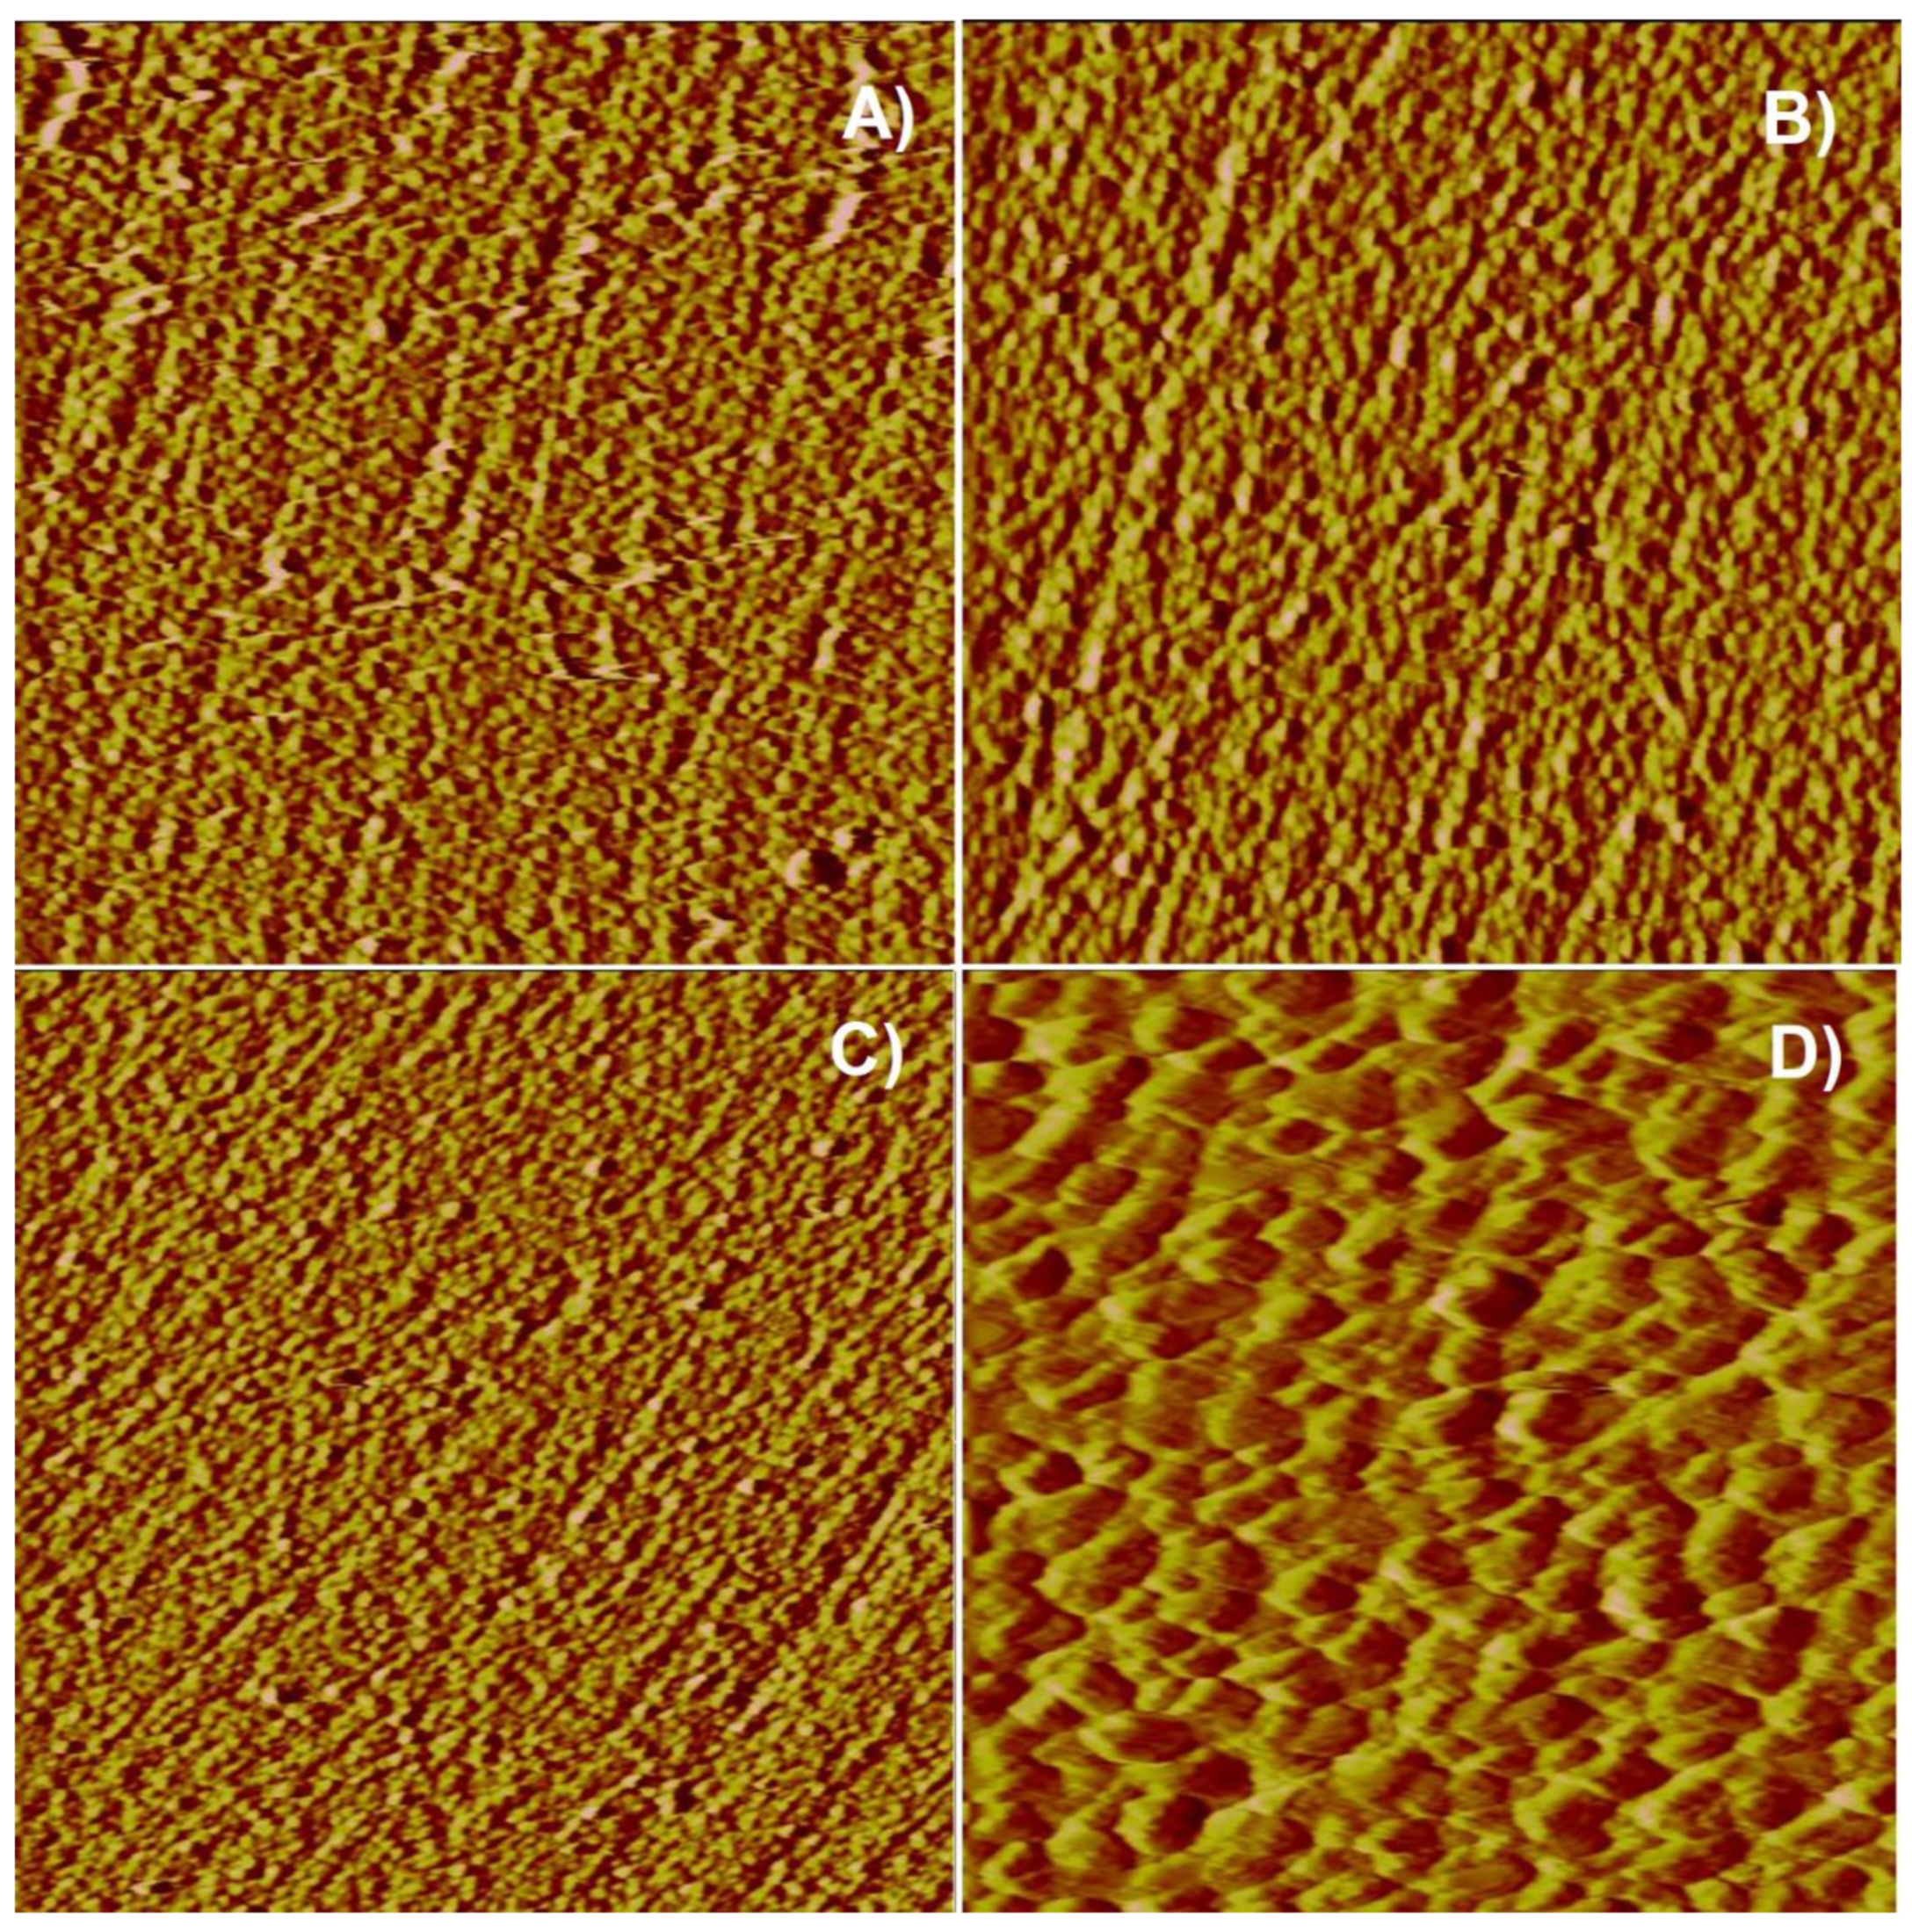
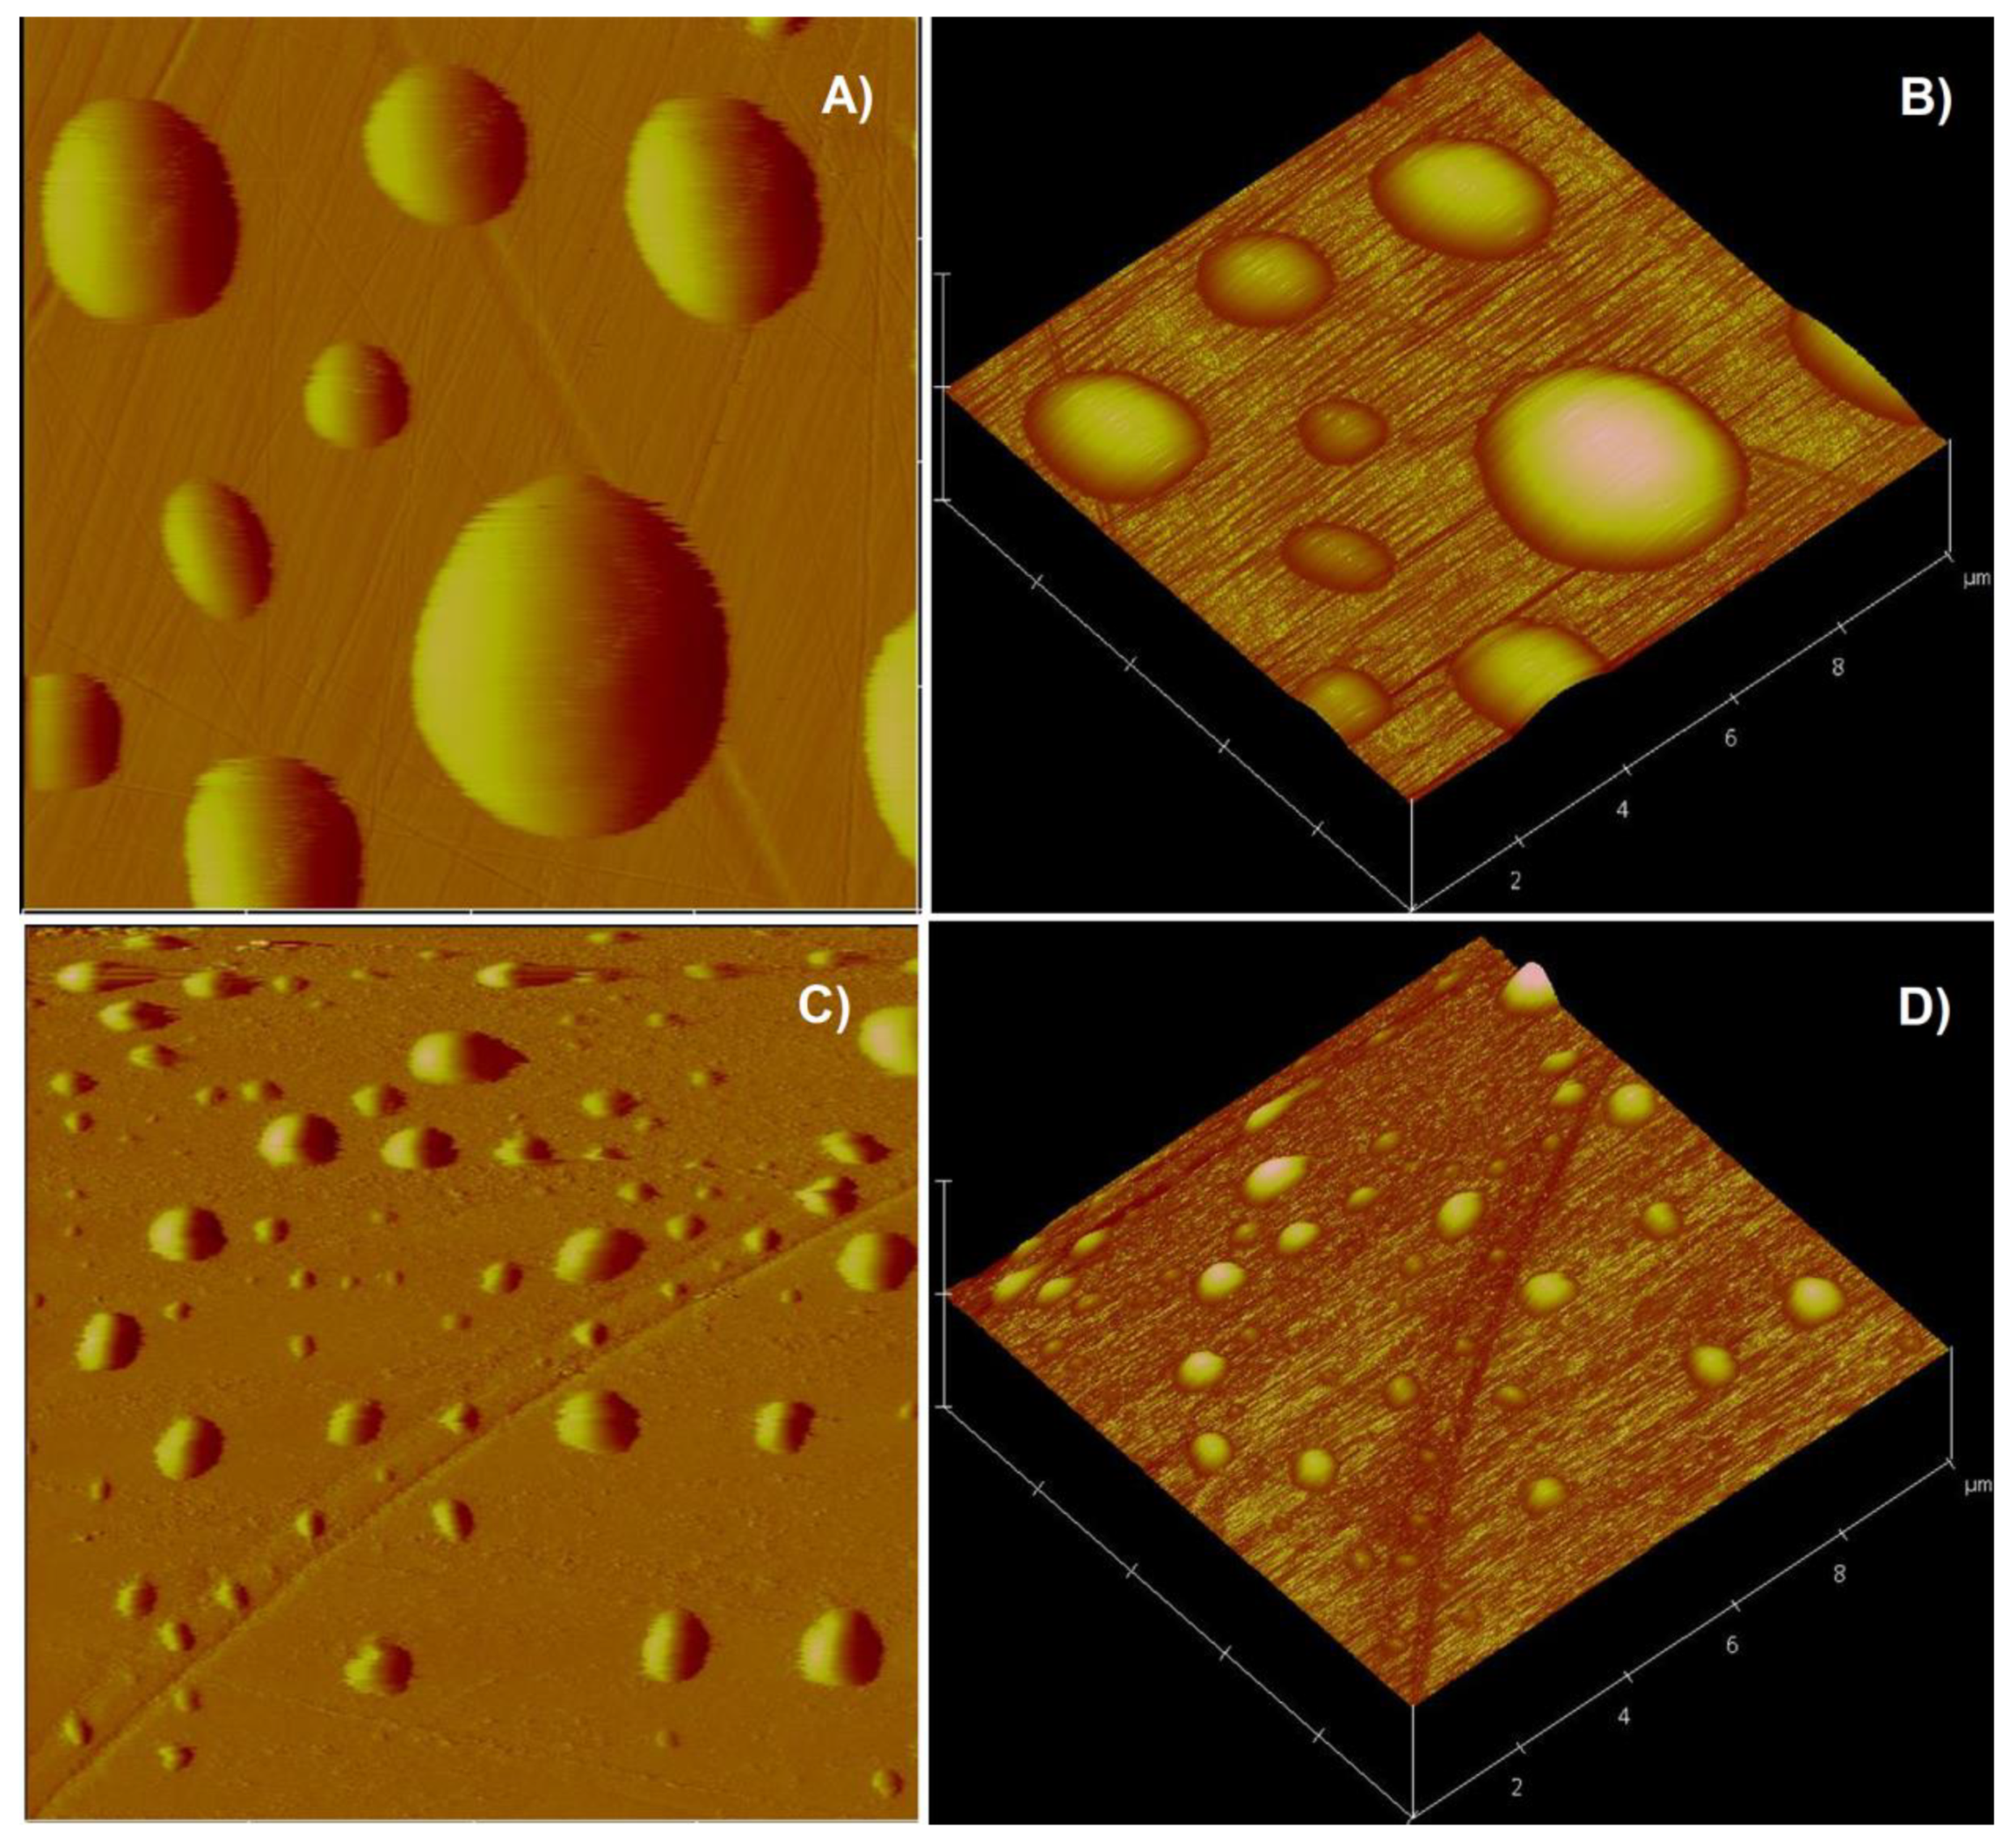
3.1. AFM Image of Minerlal Surface in Various Xanthate Solutions

Figure 1 shows the surface images of a bare bornite surface obtained in air. Figure 1A is the 5 µm × 5 µm height image with a data scale of 20 nm, which shows that the solid surface was quite smooth despite some scratch lines on the sample surface due to surface polishing. A smooth bare mineral surface is beneficial for the identification and analysis of the adsorbate when the surface contacts the solutions of various collectors. Figure 1B is the 3D image of Figure 1A. Figure 1C is the section analysis of Figure 1A, which confirms that the polished bornite surface was quite smooth. Figure 1D is the deflection image of Figure 1A with a 10 nm data scale.
Figure 2 shows the surface images of a bare bornite surface which contacted nanopure water in an AFM liquid cell for 10 min. Figure 2A is the 10 µm × 10 µm height image, which shows that the solid surface was still largely smooth, with little adsorbate on the sample surface detected by the AFM probe. Figure 2B is the 3D image of Figure 2A. Figure 2C is the section analysis of Figure 2A. Figure 2D is the deflection image of Figure 2A with a 10 nm data scale.
Figure 3A is the height image of a bornite surface which contacted the 5 × 10⁻⁵ M KEX solution at pH 6 for 10 min. Compared to Figure 2A, a significant amount of adsorbate can be observed on the bornite when the mineral surface contacted the xanthate solution for 10 min. Figure 3B is the 3D image of Figure 3A. Figure 3C is the section analysis of Figure 3A, which clearly shows that the surface roughness increased due to the adsorption. Figure 3D is the deflection image of Figure 3A with a 10 nm data scale.
Figure 4A is the height image of a bornite surface, which was in contact with the 1 × 10⁻⁴ M KEX solution at pH 6 for 10 min. Compared to Figure 2A, a significant amount of adsorbate can be observed on the bornite when the mineral surface contacted the 1 × 10⁻⁴ M KEX solution for 10 min. In addition, compared to Figure 3A, the mineral surface became rougher, suggesting that more precipitates were formed at the solid/liquid interface when the KEX’s concentration increased from 5 × 10⁻⁵ M to 1 × 10⁻⁴ M. Figure 4B is the 3D image of Figure 4A. Figure 4C is the section analysis of Figure 4A, which confirms that the surface roughness increased due to the adsorption of the collector. Figure 4D is the deflection image of Figure 4A with a 10 nm data scale.
Figure 5A is the height image of a bornite surface soaked in the 1 × 10⁻⁴ M KEX solution at pH 6 for 20 min and further rinsed with 10 mL ethanol and 10 mL water consecutively. The images were finally obtained when the mineral sample contacted the water. Compared to Figure 4A, it can be observed that the precipitates, as observed from Figure 4A, still existed on the bornite surface, and were not dissolved or rinsed off the mineral surface. Figure 5B is the 3D image of Figure 5A. Figure 5C is the section analysis of Figure 5A. Figure 5D is the deflection image of Figure 5A with a 10 nm data scale.
Figure 6 shows the AFM images of a bornite surface soaked in the 5 × 10⁻⁴ M KEX solution at pH 6 for 10 min. By comparing Figure 6A, the height image, to Figure 2A, a significant amount of bornite can be observed after the mineral surface contacted the xanthate solution. In addition, comparing Figure 6A to Figure 3A and Figure 4A, when the KEX’s concentration increased, more precipitates formed at the solid/liquid interface, and the mineral surface became much rougher. Figure 6B is the 3D image of Figure 6A. Figure 6C, the section analysis of Figure 6A, confirms that the surface roughness increased greatly when the bornite surface contacted a high concentration of KEX. Figure 6D is the deflection image of Figure 6A with a 10 nm data scale.
To verify the adsorption of the KEX on bornite in the solution, after Figure 6 was obtained, a 3 µm × 3 µm area was scanned once, applying a much larger scan force to intentionally remove the adsorbate. Further, the same position was scanned again in a 5 µm × 5 µm area, applying a normal scan force. The result is shown in Figure 7. From Figure 7A, the height image, a 3 µm × 3 µm ‘window’ can be observed in the center of the image due to the removal of some adsorbate from mineral surface under the previously applied large scan force. That is, the ‘window’ in the center with a low profile is the bornite surface covered by the adsorbate, which was partially removed by the applied large scan force. The surrounding area with a high profile is the mineral surface covered by the adsorbate, which was not disturbed by the large scan force. By comparing Figure 7B, the 3D image of Figure 7A, to Figure 6B, a pit on the mineral surface can be easily observed, with adsorbate covering the surrounding area. Figure 7C, the section analysis of Figure 7A, shows the height difference between the ‘window’ (as shown by the green markers) and the surrounding area being covered with adsorbate (as shown by the red markers). Figure 7D is the deflection image of Figure 7A with a 10 nm data scale.
Figure 8 shows the AFM images of a bornite surface soaked in the 1 × 10⁻⁵ M PAX solution at pH 6 for 10 min. By comparing Figure 8A, the height image, to Figure 2A, some precipitates can be observed on the bornite when the mineral surface contacted the PAX solution. Figure 8B is the 3D image of Figure 8A. Figure 8C, the section analysis of Figure 8A, shows that the surface roughness increased due to the adsorption of PAX. Figure 8D is the deflection image of Figure 8A with a 10 nm data scale.
Figure 9 shows the AFM images of a bornite surface soaked in 5 × 10⁻⁵ M PAX solution at pH 6 for 10 min. By comparing Figure 9A, the height image, to Figure 2A, a significant amount of adsorbate can be observed on the bornite when the mineral surface contacted the 5 × 10⁻⁵ M PAX solution for 10 min. By comparing Figure 9A to Figure 8A, it can be seen that, when the PAX concentration increased from 1 × 10⁻⁵ M to 5 × 10⁻⁵ M, the mineral surface became much rougher, with more precipitates forming at the solid/liquid interface. Figure 9B is the 3D image of Figure 9A. Figure 9C is the section analysis of Figure 9A, which confirms that the surface roughness increased with the increasing PAX concentration. Figure 9D is the deflection image of Figure 9A with a 10 nm data scale.
Figure 10 shows the AFM images of a bornite surface soaked in the 1 × 10⁻⁴ M PAX solution at pH 6 for 10 min. By comparing Figure 10A, the height image, to Figure 2A, a significant amount of adsorbate can be observed on the bornite when the mineral surface contacted the 1 × 10⁻⁴ M PAX solution for 10 min. By comparing Figure 10A to Figure 8A and Figure 9A, when the PAX concentration increases, the mineral surface became much rougher, with more precipitates forming at the solid/liquid interface. Figure 10B is the 3D image of Figure 10A. Figure 10C, the section analysis of Figure 10A, shows that the surface roughness increased with the increasing PAX concentration. Figure 10D is the deflection image of Figure 10A with a 10 nm data scale.
To verify the adsorption of the PAX on bornite in the solution, after Figure 10 was obtained, a 2 µm × 2 µm area was scanned once, applying a much larger scan force to intentionally remove the adsorbate. Further, the same position was scanned again in a 5 µm × 5 µm area, applying a normal scan force. The result is shown as Figure 11. As shown in Figure 11A, the height image, a 2 µm × 2 µm ‘window’ is shown in the center of the image due to the partial removal of the adsorbate from the mineral surface under the previously applied large scan force. That is, the ‘window’ in the center with a low profile is the bornite surface covered by the adsorbate, which was partially removed by the applied large scan force. The surrounding area with a high profile is the mineral surface covered by the adsorbate, which was not disturbed by the large scan force. This finding is as that shown in Figure 7. By comparing Figure 11B, the 3D image of Figure 11A, to Figure 10B, a pit on mineral surface can be easily observed, with adsorbate covering the surrounding area. Figure 11C is the section analysis of Figure 11A, which shows the height difference between the ‘window’ and the surrounding area covered with adsorbate (indicated by the red markers). Figure 11D is the deflection image of Figure 11A with a 10 nm data scale. The adsorbate strongly combined with the mineral surface strongly, and a quite large scan force had to be applied during the experiment. Therefore, the obtained ‘window’ was slightly deformed, as shown in Figure 11A.
Figure 12 shows the AFM images of a bornite surface soaked in the 5 × 10⁻⁴ M KEX solution at pH 10. Figure 12A–C are the height images with a 20 nm data scale obtained after the mineral surface contacted the KEX solution, respectively, for 5, 10 and 20 min. Similar to Figure 6, in all the images, a significant amount of adsorbate can be observed on the bornite. Figure 12D is the 1 µm × 1 µm (large magnification) height image collected right after Figure 12C was obtained.
Figure 13 shows the AFM images of a bornite surface soaked in the 1 × 10⁻⁴ M PAX solution at pH 10. Figure 13A–C are the height images with a 20 nm data scale obtained after the mineral surface contacted the PAX solution, respectively, for 5, 10 and 20 min. Similar to Figure 10, in all the images, a significant amount of adsorbate can be observed on the bornite. Figure 13D is the 1 µm × 1 µm (large magnification) height image collected right after Figure 13C was obtained.
To clearly show the difference of the adsorbate in the morphologies of bornite and chalcopyrite, the adsorption of xanthate on chalcopyrite was also studied, and the AFM image is shown in Figure 14. Figure 14A,B were obtained with 5 × 10⁻⁴ M KEX. Figure 14C,D were obtained with 5 × 10⁻⁵ M PAX. The AFM images clearly show that there was patch-like adsorbate on the chalcopyrite surface, which was flat with smooth and round edges. This morphology fits well with the fact that oily dialkyl dixanthogen is generally insoluble in water, and the circular boundary is the direct result of the high interfacial tension between the hydrophobic dixanthogen and water [17,18]. In addition, this adsorbate had a completely different morphology as the one shown in Figure 3, Figure 4, Figure 5, Figure 6, Figure 7, Figure 8, Figure 9, Figure 10, Figure 11, Figure 12 and Figure 13.

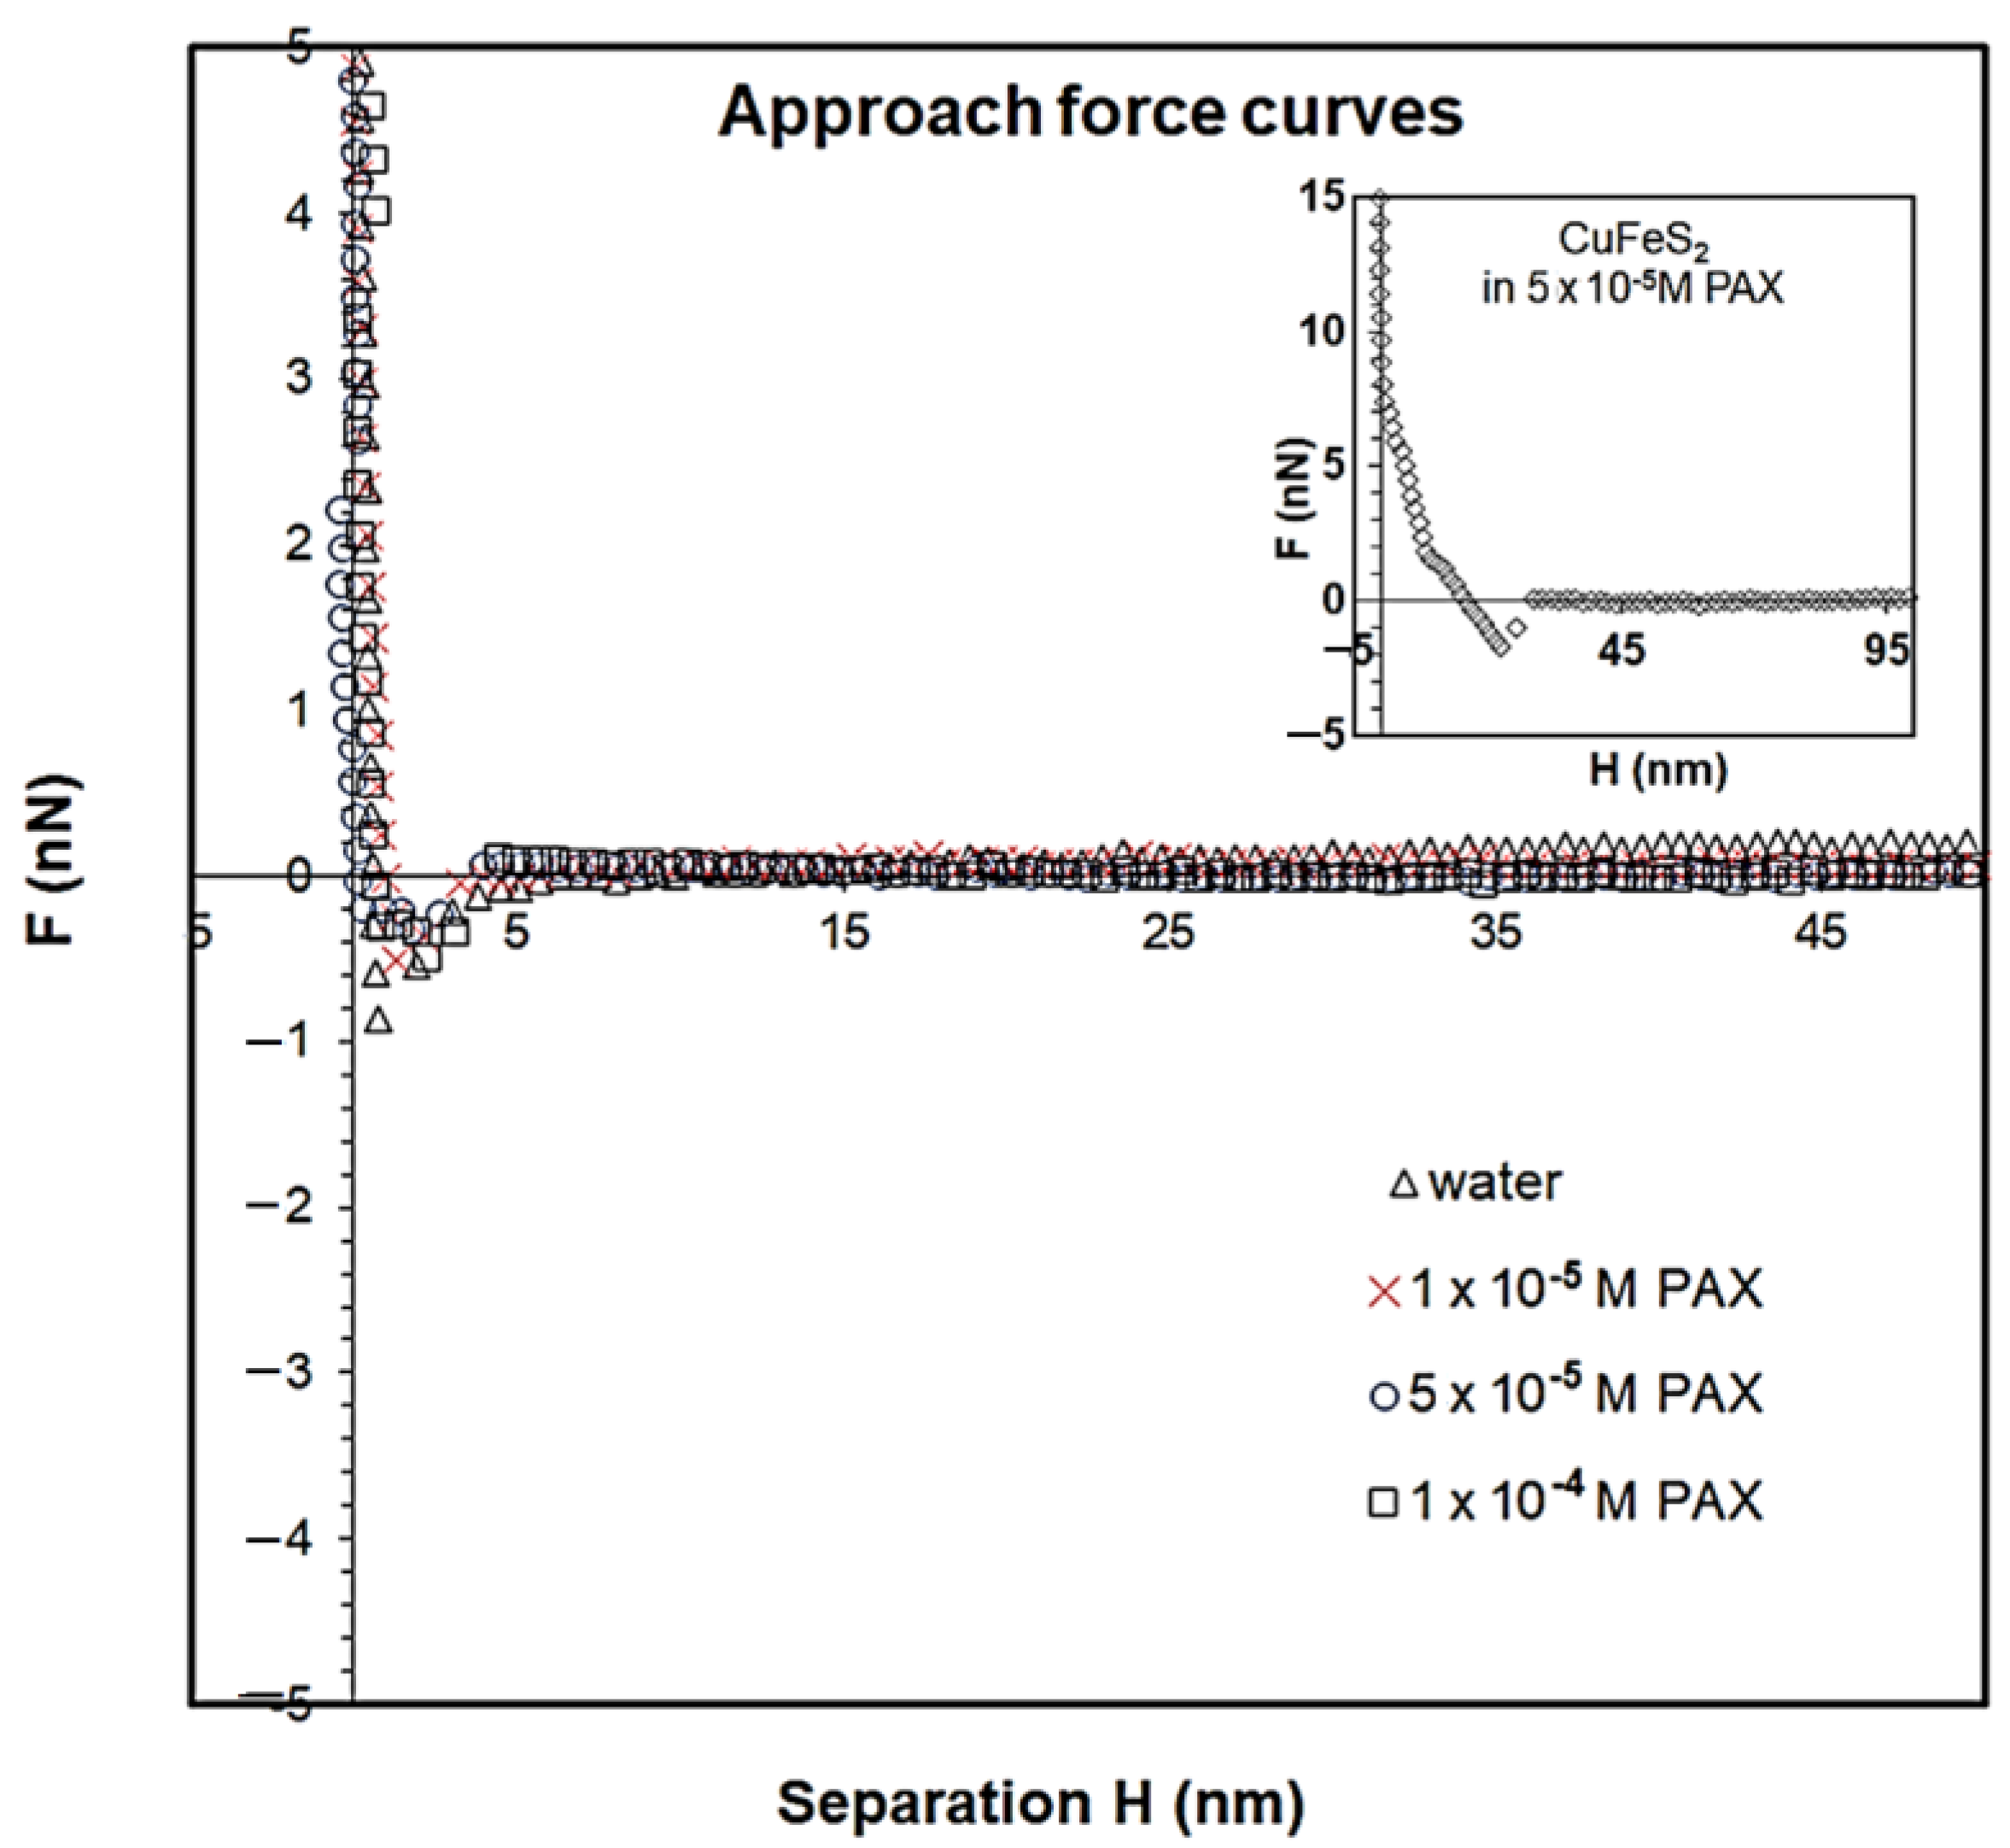
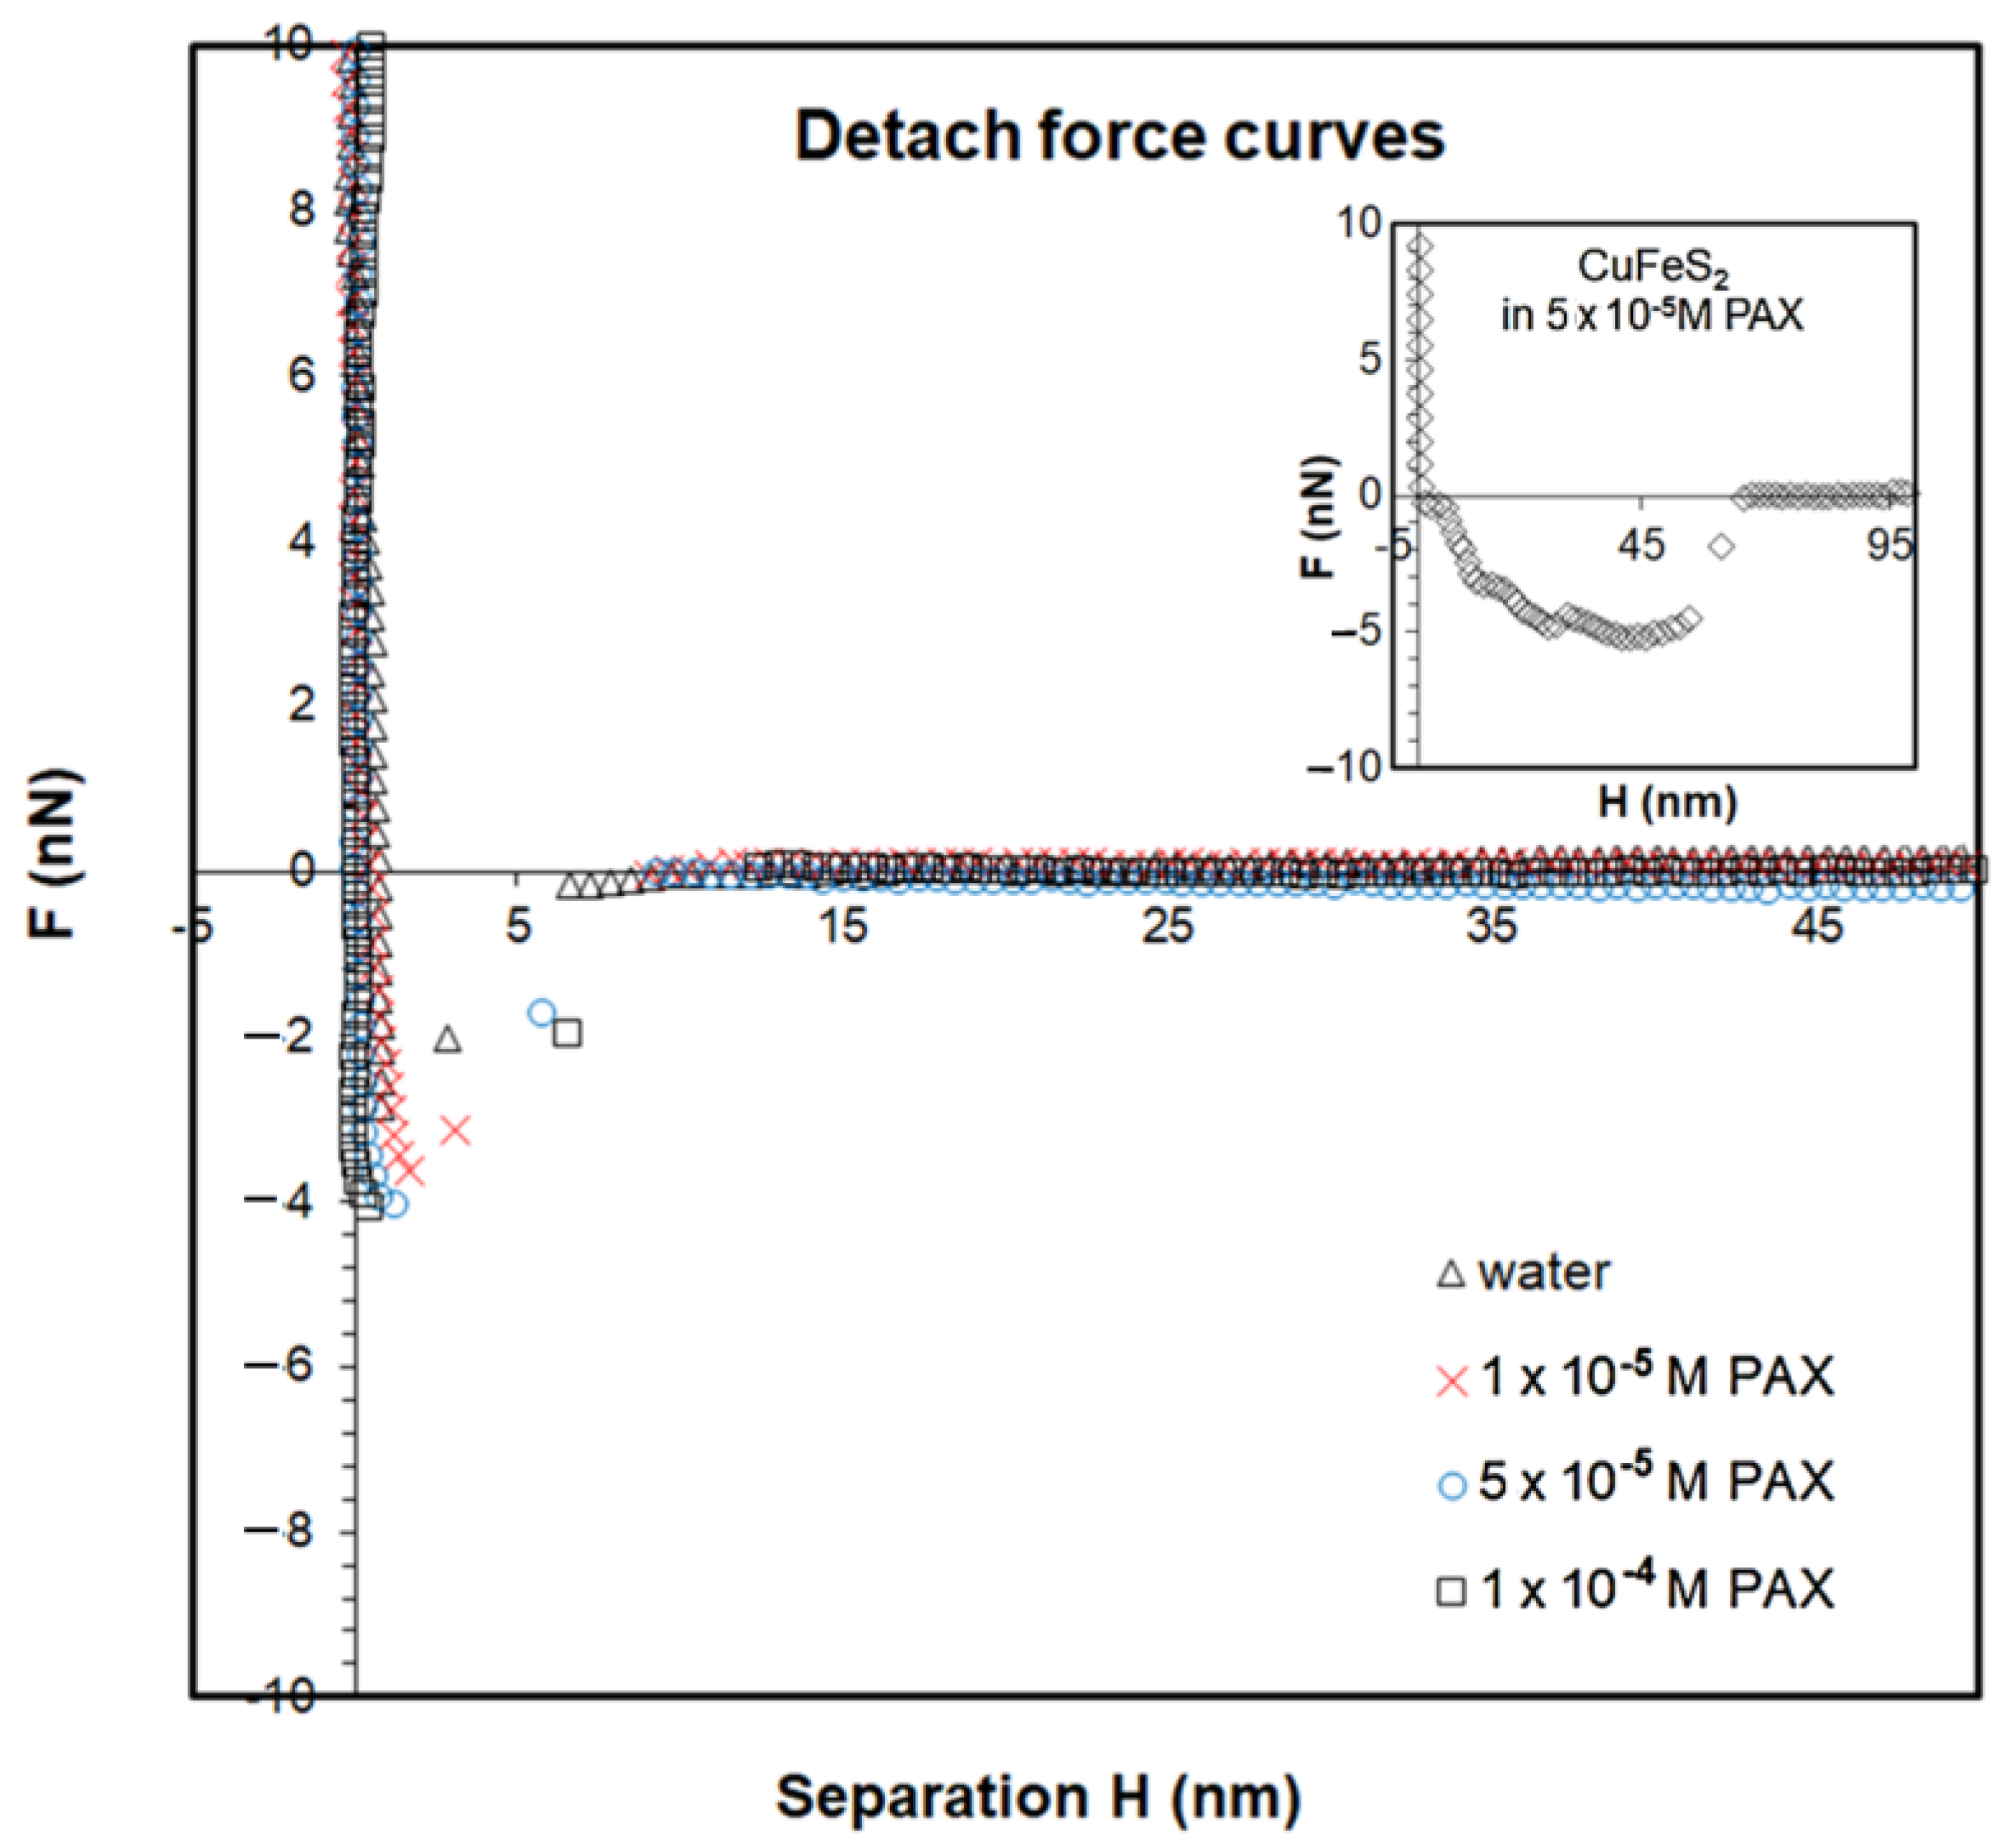
3.2. AFM Surface Force Measurement

The interaction force (F) between an AFM probe and a polished bornite plate is measured when the plate contacts various PAX solutions at pH 6 for 10 min. Using an AFM force measurement, one can obtain both the approach force curve and the retract force curve, which are shown as Figure 15 and Figure 16, respectively.
Figure 15 shows that the approach force curves measured in water and various PAX solutions were similar to each other. The “jump-in” occurred where the separation was less than 5 nm, which was within the range of the van der Waals force. Figure 16 shows that the detach force measured between an AFM probe and bornite surface in water was about 3 nN. The value increased slightly to 4 nN when in the 1 × 10⁻⁵ M PAX solution. Further increasing the concentration of the PAX solution did not significantly change the detach force. The fact that the “jump-off” point was sharp and that the “jump-off” point occurred where the separation was close to 0 nm suggest that the adsorbate is physically rigid in nature. The inlet shows the detach force curve obtained with CuFeS2 in 5 × 10⁻⁵ M PAX solution, and the detach force was about 5.2 nN. The fact that the “jump-off” point was not sharp and that the “jump-off” point occurred at above 50 nm confirms that the oily dixanthogen is deformable.

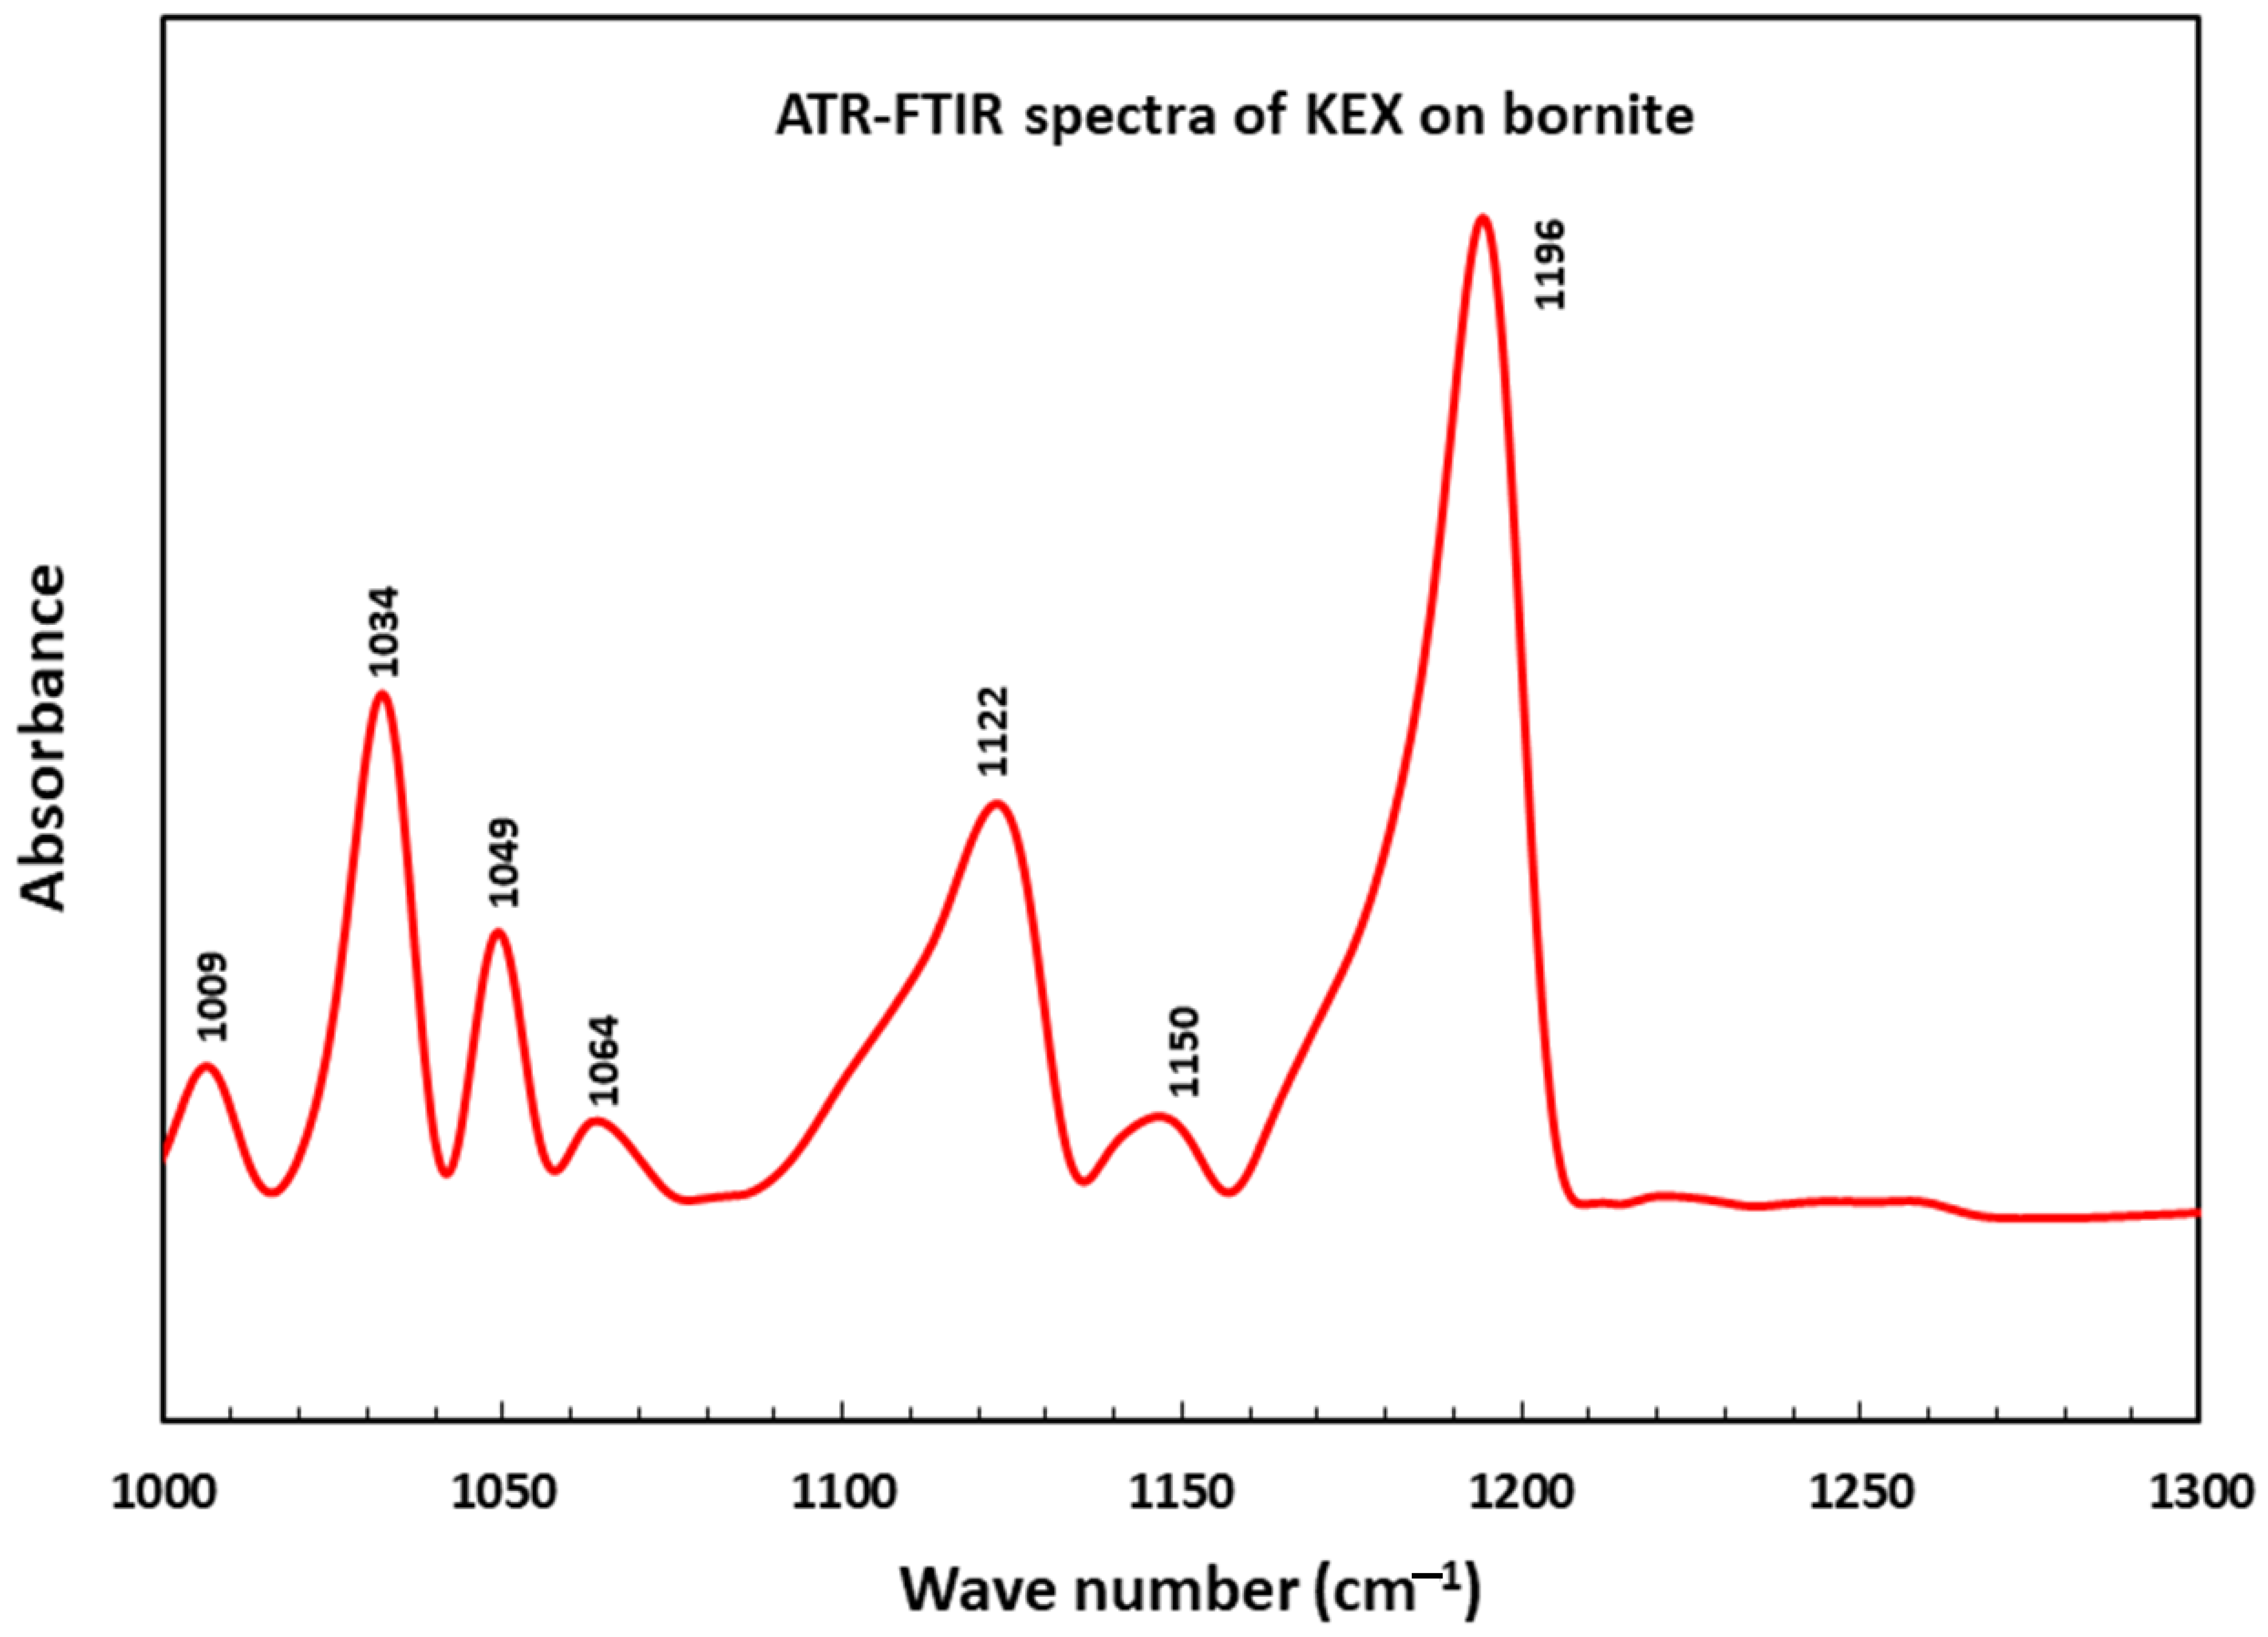
3.3. AFT-FTIR Results

Figure 17 shows the ATR-FTIR spectra of the adsorbate on bornite after the mineral surface 5 × 10⁻⁴ M KEX solution at pH 6 for 1 h. On the spectra, the main peaks shown at 1195 cm−1 and 1126 cm−1 were due to the bonds of C-O-C, and the peaks at 1049 cm−1 and 1032 cm−1 were due to the bonds of S-C-S. The results are in line with the FTIR spectra of cuprous xanthate as reported by Poling [23] and Leppinen et al. [24]. That is, the obtained FTIR spectra, as shown in Figure 17, confirms that the adsorbate on bornite in xanthate solutions is essentially CuX, with no dixanthogen detected.

4. Discussion

4.1. Adsorption of Xanthate on Bornite Surface

As shown in Figure 3, Figure 4, Figure 5, Figure 6, Figure 7, Figure 8, Figure 9, Figure 10, Figure 11, Figure 12 and Figure 13, a significant amount of adsorbate can be observed on the bornite surface when it contacted xanthate solutions for a specific time. The roughness analysis of the AFM images of a bornite surface in xanthate solutions is summarized and listed as Table 1. In general, during the same timeframe, i.e., 10 min, surface roughness increased when the concentration of xanthate increased. For example, at pH 6, when the concentration of KEX increased from 5 × 10⁻⁵ M to 1 × 10⁻⁴ M, the roughness Ra value increased from 1.919 nm to 2.372 nm, and the value increased to 2.412 nm when the concentration was further increased to 5 × 10⁻⁴ M. A similar trend was also observed for the case of PAX, although the change in values was not as significant as the one as obtained with KEX. The change of the morphology of the bornite surface cannot be attributed to the reaction of the mineral surface with water, because the AFM images obtained with the addition of xanthate solutions are completely different from those shown in Figure 2, which were captured within same timeframe. Therefore, the adsorbate shown in Figure 3, Figure 4, Figure 5, Figure 6, Figure 7, Figure 8, Figure 9, Figure 10, Figure 11, Figure 12 and Figure 13 must be due to the adsorption of xanthate at the bornite/liquid interface.
The adsorption of metal xanthate with a low solubility and the oxidation of xanthate into dixanthogen on a sulfide mineral surface in an aqueous solution, as summarized by Leja [5] and Woods [6], are generally considered the main mechanisms for the increase in hydrophobicity of sulfide minerals in flotation. Previous AFM studies with chalcopyrite and pyrite [17,18,19] have shown that the adsorbed dixanthogen on sulfides in an aqueous solution demonstrates patches with smooth and round edges, which fits well with the fact that oily dixanthogen is generally insoluble in water and that the circular boundary is the direct result of the high interfacial tension between hydrophobic dixanthogen and water. In addition, under ambient conditions, i.e., room temperature and normal pressure, dialkyl dixanthogen is usually in a liquid form with a low melting point. [25] During an AFM scanning process, a minimal force must be applied because of the softness of dixanthogen [17,18,19]. In this investigation, as shown in Figure 3, Figure 4, Figure 5, Figure 6, Figure 7, Figure 8, Figure 9, Figure 10, Figure 11, Figure 12 and Figure 13, the adsorbate had no smooth and round edges, and the morphology was completely different compared to that observed for dixanthogen, which is shown in Figure 14. In addition, the adsorbate on the bornite surface was not ‘soft,’ and its morphology was not disturbed, even under an elevated scan force. For example, as shown in Figure 7, Figure 8, Figure 9, Figure 10 and Figure 11, a large scan force must be applied to remove the adsorbate and open a ‘window’ in the center of the AFM image. In addition, Figure 15 and Figure 16 show that the adsorbate on the bornite in the xanthate solution was rigid, with sharp “jump-in” and “jump-off” points on the force curves. Therefore, we ruled out the possibility that observed adsorbate on the bornite was dixanthogen.
This finding, as obtained from the AFM imaging analysis results, is in line with what has been previously reported. For example, Allison et al. [3] reported that xanthate adsorbed on bornite in the form of metal xanthate with low solubility, i.e., CuX. It has been suggested that the final adsorption products on sulfides are highly associated with the semiconductor type of sulfide minerals. That is, dixanthogen is usually formed on n-type minerals, while metal xanthate is observed on p-type minerals. Bornite is classified as a p-type mineral [26], which favors the formation of metal xanthate.
According to Buckley et al. [9], the adsorption of xanthate on bornite is an electrochemical process depending on the potential. When the potential is above −0.35 v, bornite is oxidized in water and yields an iron–free copper sulfide, the reaction of which is shown as follows:
C u 5 F e S 4 + 3 H 2 O = C u 5 S 4 + F e ( O H ) 3 + 3 H + + 3 e
Comparing Figure 1 and Figure 2, the bornite surface that contacted the water was rougher than the surface that contacted air. In the present investigation, the solution potential was not controlled, and the potential value of DI water was higher than −0.35 V. These results suggest that the bornite surface will undertake oxidation reaction to some extent when it contacts water following the reaction, as shown by Equation (1).
Zachwieja et al. [10] also proposed that the adsorption of xanthate on bornite is due to the following simplified anodic reaction simplified, introducing insoluble cuprous xanthate on the bornite surface:
C u 5 S 4 + n X = n C u X + C u 5 n S 4 + n e
That is, xanthate adsorbs on bornite mainly in the form of insoluble cuprous xanthate at a low solution potential. The production of dixanthogen on bornite occurs only when the potential is above the rest potential of X/X2 couple. In the present study, the solution potential was not controlled, and the value was generally below −0.1 V. In addition, as mentioned before, no noticeable dixanthogen was observed from the obtained AFM images. Therefore, the adsorbate, as shown in Figure 3, Figure 4, Figure 5, Figure 6, Figure 7, Figure 8, Figure 9, Figure 10 and Figure 11, is mainly cuprous alkyl xanthate with a low solubility.
In addition, the ATR-FTIR results of the adsorption of KEX on bornite show that the main peaks on the obtained spectra were at 1195 cm−1 (C–O–C), 1126 cm−1 (C–O–C), 1049 cm−1 (S–C–S) and 1032 cm−1 (S–C–S) (Figure 16). The results are almost identical to those that have been reported for the FTIR spectra of CuX by Poling [23] and Leppinen et al. [24]. In addition, the fact that the characteristic peaks of ethyl xanthate dixanthogen (X2), namely those at 1020 cm−1 and 1260 cm−1, were not observed on the spectra as obtained rules out the existence of X2 on the bornite surface. Therefore, the irregular adsorbate, as shown in Figure 3, Figure 4, Figure 5, Figure 6, Figure 7, Figure 8, Figure 9, Figure 10 and Figure 11, is basically insoluble cuprous xanthate (CuX). In this sense, the adsorption behavior of xanthate on the bornite is very similar to the adsorption behavior applicable for the case of chalcocite/xanthate systems [20].

4.2. Effect of the Hydrocarbon Chain of Xanthate

In froth flotation, the rank and concentration of a collector are two important parameters in determining the collectivity and selectivity of the collector. In general, a xanthate collector with a high rank has a high collectivity and, therefore, a low selectivity, and vice versa. In the present work, the effect of the collector’s rank on the adsorption of xanthate on bornite was studied using both KEX and PAX as collectors. Figure 3, Figure 4, Figure 5, Figure 6, Figure 7, Figure 8, Figure 9, Figure 10 and Figure 11 show that, when the collector’s concentration is constant, PAX adsorbs on the bornite surface with a significantly higher surface coverage and a more uniform layer structure. This can be attributed to the fact that the formation of cuprous amyl xanthate occurs at a lower surfactant concentration than that for cuprous ethyl xanthate because of the lower-solubility product of cuprous amyl xanthate. For example, it has been reported that the solubility product of cuprous amyl xanthate and cuprous ethyl xanthate is 8.0 × 10⁻²² and 5.2 × 10⁻²⁰, respectively. [27,28] Allison et al. [3] also reported that the percentage of reacted xanthate increased by one-fold, with the carbon number of xanthate increasing from 2 to 5 at the same surfactant concentration. Therefore, the fact that cuprous amyl xanthate forms a more uniform layer than cuprous ethyl xanthate is due to the longer hydrocarbon chain of the former and, therefore, an increased lateral hydrophobic attraction between hydrocarbon chains. Therefore, the higher-rank xanthate, i.e., PAX, is more powerful than the lower rank-xanthate, i.e., KEX, for adsorption on the bornite surface. Therefore, the higher-rank xanthate provides a highly improved flotation collectivity.
Allison et al. [3] observed that “no product of reaction with the methyl and ethyl homologues could be detected, although both reacted very extensively with the surface.” They further explained this by stating that “the reaction products are not detected because the lower homologues of cuprous xanthate are extremely insoluble in CS2 and most other solvents and consequently are not extracted from the surface.” As shown in Figure 3, Figure 4, Figure 5, Figure 6 and Figure 7 obtained with the present work, the KEX did adsorb on the bornite intensively, with the mineral surface being fully covered. The binding of the adsorbate, i.e., cuprous ethyl xanthate, and bornite is very strong, and the adsorbate was not removed even after applying a large scan force. In addition, Figure 5 shows that the adsorbate was not extracted from the bornite surface by rinsing with ethanol alcohol.

4.3. Effect of the Concentration of Xanthate

According to Equation (2), increasing the concentration of xanthate, i.e., the reactant, makes the reaction moves in the normal direction, resulting in more reaction product, i.e., CuX, produced on mineral surface. This concentration effect of xanthate is clearly shown in the AFM images obtained with the present work. For example, Figure 3, Figure 4 and Figure 6 clearly show that the amount of adsorbate increases greatly in surface coverage and the height of the adsorbate, when the concentration of KEX increases from 5 × 10⁻⁵ M to 5 × 10⁻⁴ M. The same conclusion can also be drawn for the case of PAX. By comparing Figure 8, Figure 9 and Figure 10, one can see that when the concentration of PAX increases from 1 × 10⁻⁵ M to 1 × 10⁻⁴ M, the amount of adsorbate increases at a same contacting time.

4.4. Effect of Adsorption Time

Figure 6Figure 7, Figure 10 and Figure 11 show that the height of the adsorbate and the surface coverage increased when the adsorption time increased from 10 min to 20 min in the xanthate solution at pH 6. In addition, as shown in Figure 12A–C and Figure 13A–C, the adsorption increased when the adsorption time increased from 5 min to 10 min and further to 20 min in the xanthate solution at pH 10. The trend was much more evident in the case of KEX. All these images clearly show that the adsorption of the xanthate on bornite increased with the adsorption time. The finding is in line with a common industrial practice of copper ore beneficiation, which involves adding collectors in a mill to increase the adsorption time, as well as the benefit from the adsorption of the collector on the freshly exposed mineral surface.

4.5. Impact of Xanthate on Bornite Flotation

In froth flotation, specific chemicals, i.e., collectors or promoters, are added to the pulp to increase the surface hydrophobicity of a target mineral. This results in the increase of both the attractive hydrophobic force and the adhesion force between the mineral particles and bubbles. The former can facilitate a particle/bubble attachment, and the latter can retard a particle/bubble detachment, which are both beneficial for froth flotation.
According to Cassie’s equation [29]:
c o s θ = f 1 c o s θ 1 + f 2 c o s θ 2
where θ1 is the contact angle for component 1 with a surface area fraction f1, θ2 is the contact angle for component 2 with surface area fraction f2 and θ is the contact angle of the composite material. In addition, f1 + f2 = 1 for the case of the adsorption of the collector on the bornite surface, assuming that component 1 is the bare bornite and component 2 is the adsorbate, i.e., CuX, θ2 should be larger than θ1. Therefore, increasing f2 and/or θ2 will increase θ, i.e., the hydrophobicity of bornite with adsorbate, resulting in a better flotation.
In the present study, as shown in the AFM images, it is clear that xanthate can effectively adsorb on a bornite surface, as xanthate showed an almost full coverage at a concentration above 1 × 10⁻⁵ M PAX. This suggests that the adsorption of cuprous xanthate resulted in a large f2, which is beneficial for a large θ. Increasing the dosage of xanthate and adsorption time will increase the cuprous xanthate’s surface coverage, i.e., f2, and it is also beneficial for to increase the surface hydrophobicity.
The force measurement results show that the detach forces measured in the xanthate solutions were larger than the force measured with water. In general, a large detach force suggests a large adhesion between a probe and substrate through the media. Following the Derjaguin approximation [30], it is predicted that a larger adhesion force will be achieved when the probe/liquid/bornite interfacial tension increases. In the present investigation, the Si3N4 AFM probe was inert in water, and it did not directly react with xanthate. Therefore, the surface energy of the Si3N4 probe did not change. In addition, in the present study, the surface tension of water media remained the same because the short-chain xanthate surfactant was used at a very low concentration. Therefore, the increase in the detachment force, as shown by the AFM force measurement, was mainly due to the increase of the interfacial tension between bornite and water, suggesting an increase in the hydrophobicity of bornite because of the adsorption of the cuprous xanthate on the mineral surface. We also suggest carrying out an AFM “colloid force” measurement by directly measuring the interaction force between a hydrophobic “colloid probe” and the adsorbate on bornite surface. The results will help to better understand the interaction between a bubble and a bornite particle in xanthate solutions in froth flotation. Such an investigation of force measurement, which is beyond the scope of the present study, is recommended for a future work.

5. Conclusions

AFM surface image measurements were applied to study the adsorption of xanthate on bornite in an aqueous solution in situ. The AFM images showed that the xanthate adsorbed on the mineral surface strongly when bornite contacted the KEX and PAX solution. The ATR-FTIR result confirms that that the adsorbate was essentially cuprous xanthate. Increasing the hydrocarbon chain length of xanthate increased the collectivity of the collector by increasing the surface coverage of the cuprous xanthate on the mineral surface at a lower concentration. Both increasing the chemical dosage and increasing the adsorption time will increase the surface coverage of CuX on mineral surface, which contributes to a better flotation by increasing the surface hydrophobicity of bornite.

Funding

This research received no external funding.

Data Availability Statement

The data presented in this study are available on request from the corresponding author. The data are not publicly available due to ethical.

Acknowledgments

J. Zhang is grateful to Freeport-McMoRan Copper & Gold, Inc. for sponsoring the Freeport McMoRan Copper and Gold Chair in Mineral Processing in the Department of Mining and Geological Engineering in the University of Arizona. Reviewers’ insightful comments and valuable suggestions are greatly appreciated.

Conflicts of Interest

The authors declare no conflict of interest.

References

  1. Gaudin, A.M.; Schuhmann, R., Jr. The action of potassium n-amyl xanthate on chalcocite. J. Phys. Chem. 1936, 40, 257–275. [Google Scholar] [CrossRef]
  2. Poling, G.W.; Leja, J.J. Infrared study of xanthate adsorption on vacuum deposited films of lead sulfide and metallic copper under conditions of controlled oxidation. Phys. Chem. 1963, 67, 2121–2126. [Google Scholar] [CrossRef]
  3. Allison, S.A.; Goold, L.A.; Nicol, M.J.; Granville, A.D. A determination of the products of reaction between various sulfide minerals and aqueous xanthate solution, and a correlation of the products with electrode rest potentials. Metall. Trans. 1972, 3, 2613–2618. [Google Scholar] [CrossRef]
  4. Fuerstenau, M.C. Sulphide mineral flotation. In Principles of Flotation; King, R.P., Ed.; South African Institute of Mining and Metallurgy Monograph Series: Johannesburg, South Africa, 1982; pp. 159–182. [Google Scholar]
  5. Leja, J. Surface Chemistry of Flotation; Plenum Press: New York, NY, USA, 1982. [Google Scholar]
  6. Woods, R. Electrochemistry of sulphide flotation. In Principles of Mineral Flotation, The Wark Symposium; Jones, M.H., Woodcock, J.T., Eds.; AIMM: Melbourne, Victoria, Australia, 1984; pp. 91–115. [Google Scholar]
  7. Mielczarski, J.; Suoninen, E. XPS study of ethyl xanthate adsorbed onto cuprous sulphide. Surf. Interface Anal. 1984, 6, 34–39. [Google Scholar] [CrossRef]
  8. Mielczarski, J. XPS study of ethyl xanthate adsorption on oxidized surface of cuprous sulfide. J. Colloid Interface Sci. 1987, 120, 201–209. [Google Scholar] [CrossRef]
  9. Buckley, A.N.; Hamilton, I.C.; Woods, R. Lnvestigation of the Surface Oxidation of Bornite by Linear Potential Sweep Voltammetry and X-ray Photoelectron Spectroscopy. J. Appl. Electrochem. 1984, 14, 63–74. [Google Scholar] [CrossRef]
  10. Zachwieja, J.B.; Walker, G.W.; Richardson, P.E. Electrochemical flotation of sulfides: The bornite-ethylxanthate system. Miner. Metall. Process. 1987, 4, 146–151. [Google Scholar] [CrossRef]
  11. Hangone, G.; Bradshaw, D.; Ekmekci, Z. Flotation of a copper sulphide ore from Okiep using thiol collectors and their mixtures. J. SAIMM 2005, 105, 199–206. [Google Scholar]
  12. Dhar, P.; Thornhill, M.; Rao Kota, H. Investigation of Copper Recovery from a New Copper Ore Deposit (Nussir) in Northern Norway: Dithiophosphates and Xanthate-Dithiophosphate Blend as Collectors. Minerals 2019, 9, 146. [Google Scholar] [CrossRef] [Green Version]
  13. Polkin, S.I.; Kuzkin, S.F.; Golov, V.M. Application of radiography to studies on the mechanism of interaction between flotation reagents and mineral surfaces. Non-Ferr. Metal: Moscow, Russia, 1955. [Google Scholar]
  14. Plaksin, I.N.; Shafeyev, R.S.; Zaiteseva, S.P. Applications of autoradiography to studies of flotation reagents disposition on mineral surfaces. Proc. Acad. Sci. S.S.S.R. 1956, 108. [Google Scholar]
  15. Kim, B.S.; Hayes, R.A.; Prestidge, C.A.; Ralston, J.; Smart, R.S.C. In-situ scanning tunneling microscopy studies of galena surfaces under flotation-related conditions. Colloids Surf. A 1996, 117, 117–129. [Google Scholar] [CrossRef]
  16. Smart, R.S.C.; Amarantidis, J.; Skinner, W.; Prestidge, C.A.; Vanier, L.L.; Grano, S.R. Surface analytical studies of oxidation and collector adsorption in sulfide mineral flotation, in Wandelt, K. and Thurgate, S. (ed), Solid–Liquid Interfaces. Top. Appl. Phys. 2003, 85, 3–62. [Google Scholar]
  17. Zhang, J.; Zhang, W. An AFM study of chalcopyrite surface in aqueous solution. In Proceedings of the SME Annual Meeting preprint, Phoenix, AZ, USA, 21–24 February 2010. [Google Scholar]
  18. Zhang, J.; Zhang, W. The Adsorption of Collectors on Chalcopyrite Surface Studied by an AFM in ‘Separation Technologies’; Young, C., Luttrell, G., Eds.; SME: Englewood, CO, USA, 2012; pp. 65–73. ISBN 978-0-87335-339-7. [Google Scholar]
  19. Zhang, J.; Zhang, W. An atomic force microscopy study of the adsorption of collectors on chalcopyrite. In Microscopy: Advances in Scientific Research and Education; Méndez-Vilas, A., Ed.; Formatex Research Center: Badajoz, Spain, 2014; Volume 2, pp. 967–973. ISBN 978-84-942134-4-1. [Google Scholar]
  20. Zhang, J.; Zhang, W. An AFM study of the adsorption of collector on chalcocite. In Proceedings of the SME Annual Meeting Preprint 15-138, Denver, CO, USA, 15–18 February 2015. [Google Scholar]
  21. Zhang, J.; An, D.; Withers, J. A Micro-Scale Investigation of the Adsorption of Collectors on Bastnaesite. Min. Metall. Explor. 2019, 36, 957. [Google Scholar]
  22. An, D.; Zhang, J. A Study of Temperature Effect on the Xanthate’s Performance during Chalcopyrite Flotation. Minerals 2020, 10, 426. [Google Scholar] [CrossRef]
  23. Poling, G.W. Infrared Studies of Adsorbed Xanthates. Ph.D. Thesis, University of Alberta, Edmonton, AB, Canada, 1963. [Google Scholar]
  24. Leppinen, J.O.; Basilio, C.I.; Yoon, R.H. In-situ FTIR study of ethyl xanthate adsorption on sulfide minerals under conditions of controlled potential. Int. J. Miner. Process. 1989, 26, 259–274. [Google Scholar] [CrossRef]
  25. Rao, S.R. Xanthate and Related Compounds; Dekker: New York, NY, USA, 1971. [Google Scholar]
  26. Shuey, R.T. Semiconducting Ore Minerals; Elsevier: Amsterdam, The Netherlands, 1975. [Google Scholar]
  27. Kakovsky, I.A. Physiochemical properties of some flotation reagents and their salts with ions of heavy non-ferrous metals. In Proceedings of the Second International Congress of Surface Activity, London, UK, 1 January 1957; pp. 225–237. [Google Scholar]
  28. Ackerman, P.K.; Harris, G.H.; Klimpel, R.R.; Aplan, F.F. Evaluation of flotation collectors for copper sulfides and pyrite, III. Effect of xanthate chain length and branching. Int. J. Miner. Process. 1987, 21, 141–156. [Google Scholar] [CrossRef]
  29. Cassie, A.; Baxter, S. Wettability of porous surfaces. Trans. Faraday Soc. 1944, 40, 546–551. [Google Scholar] [CrossRef]
  30. Derjaguin, B.V. Friction and adhesion. IV. The theory of adhesion of small particles. Kolloid-Zeitschrift 1934, 69, 155–164. [Google Scholar] [CrossRef]
Figure 1. AFM images of a bornite surface in air. (A) The 5 µm × 5 µm height image with a data scale of 20 nm, (B) the 3D image, (C) the section analysis (the red arrows indicate the top and the bottom of an average asperity) and (D) the deflection image with a data scale of 10 nm.
Minerals 11 00906 g001
Figure 2. AFM images of a bornite surface soaked in water for 10 min. (A) The 5 µm × 5 µm height image with a data scale of 20 nm, (B) the 3D image, (C) the section analysis (the red arrows indicate the top and the bottom of an average asperity) and (D) the deflection image with a data scale of 10 nm.
Minerals 11 00906 g002
Figure 3. AFM images of a bornite surface soaked in the 5 × 10⁻⁵ M KEX solution at pH 6 for 10 min. (A) The 5 µm × 5 µm height image with a data scale of 20 nm, (B) the 3D image, (C) the section analysis (the red arrows indicate the top and the bottom of an average asperity) and (D) the deflection image with a data scale of 10 nm.
Minerals 11 00906 g003
Figure 4. AFM images of a bornite surface soaked in the 1 × 10⁻⁴ M KEX solution at pH 6 for 10 min. (A) The 5 µm × 5 µm height image with a data scale of 20 nm, (B) the 3D image, (C) the section analysis (the red arrows indicate the top and the bottom of an average asperity) and (D) the deflection image with a data scale of 10 nm.
Minerals 11 00906 g004
Figure 5. AFM images of a bornite surface soaked in the 1 × 10⁻⁴ M KEX solution at pH 6 for 20 min and further rinsed with ethanol and water. (A) The 5 µm × 5 µm height image with a data scale of 20 nm, (B) the 3D image, (C) the section analysis (the red arrows indicate the top and the bottom of an average asperity) and (D) the deflection image with a data scale of 10 nm.
Minerals 11 00906 g005
Figure 6. AFM images of a bornite surface soaked in the 5 × 10⁻⁴ M KEX solution at pH 6 for 10 min. (A) The 5 µm × 5 µm height image with a data scale of 20 nm, (B) the 3D image, (C) the section analysis (the red arrows indicate the top and the bottom of an average asperity) and (D) the deflection image with a data scale of 10 nm.
Minerals 11 00906 g006
Figure 7. AFM images of a bornite surface soaked in the 5 × 10⁻⁴ M KEX solution at pH 6 for 20 min. (A) The 5 µm × 5 µm height image with a data scale of 20 nm, (B) the 3D image, (C) the section analysis and (D) the deflection image with a data scale of 10 nm.
Minerals 11 00906 g007
Figure 8. AFM images of a bornite surface soaked in the 1 × 10⁻⁵ M PAX solution at pH 6 for 10 min. (A) The 5 µm × 5 µm height image with a data scale of 20 nm, (B) the 3D image, (C) the section analysis (the red arrows indicate the top and the bottom of an average asperity) and (D) the deflection image with a data scale of 10 nm.
Minerals 11 00906 g008
Figure 9. AFM images of a bornite surface soaked in the 5 × 10⁻⁵ M PAX solution at pH 6 for 10 min. (A) The 5 µm × 5 µm height image with a data scale of 20 nm, (B) the 3D image, (C) the section analysis (the red arrows indicate the top and the bottom of an average asperity) and (D) the deflection image with a data scale of 10 nm.
Minerals 11 00906 g009
Figure 10. AFM images of a bornite surface soaked in the 1 × 10⁻⁴ M PAX solution at pH 6 for 10 min. (A) The 5 µm × 5 µm height image with a data scale of 20 nm, (B) the 3D image, (C) the section analysis (the red arrows indicate the top and the bottom of an average asperity) and (D) the deflection image with a data scale of 10 nm.
Minerals 11 00906 g010
Figure 11. AFM images of a bornite surface soaked in 1 × 10⁻⁴ M PAX solution at pH 6 for 20 min. (A) The 5 µm × 5 µm height image with a data scale of 20 nm, (B) the 3D image, (C) the section analysis and (D) the deflection image with a data scale of 10 nm. The 2 µm × 2 µm blank ‘window’ in the center of the image occurred due to the removal of the adsorbate from the mineral surface under the intentionally applied large scan force.
Minerals 11 00906 g011
Figure 12. AFM height images (5 µm × 5 µm) with a data scale of 20 nm of a bornite surface soaked in the 5 × 10⁻⁴ M KEX solution at pH 10 (A) for 5 min, (B) for 10 min, (C) for 20 min and (D) for 20 min (1 µm × 1 µm).
Minerals 11 00906 g012
Figure 13. AFM height images (5 µm × 5 µm) with a data scale of 20 nm of a bornite surface soaked in the 1 × 10⁻⁴ M PAX solution at pH 10 (A) for 5 min, (B) for 10 min, (C) for 20 min and (D) for 20 min (1 µm × 1 µm).
Minerals 11 00906 g013
Figure 14. AFM images of a chalcopyrite surface in the xanthate solution at pH 6 for 30 min. (A) The 10 µm × 10 µm deflection image with a data scale of 200 nm at 5 × 10⁻⁴ M KEX, (B) the 3D image of (A), (C) the 10 µm × 10 µm deflection image with a data scale of 200 nm at 5 × 10⁻⁵ M PAX and (D) the 3D image of (C).
Minerals 11 00906 g014
Figure 15. The approach force (F) measured between an AFM probe and a bornite plate soaked in solutions at pH 6 as a function of the separation (H) between the probe and the plate by applying an AFM force measurement. (Δ) in water; (×) in the 1 × 10⁻⁵ M PAX solution, (o) in the 5 × 10⁻⁵ M PAX solution and (□) in the 1 × 10⁻⁴ M PAX solution. The inlet (◊) shows the approach force curve obtained with CuFeS2 in the 5 × 10⁻⁵ M PAX solution.
Minerals 11 00906 g015
Figure 16. The detach force (F) measured between an AFM probe and a bornite plate soaked in solutions at pH 6 as a function of the separation (H) between the probe and the plate by applying an AFM force measurement. (Δ) in water, (×) in the 1 × 10⁻⁵ M PAX solution, (o) in the 5 × 10⁻⁵ M PAX solution and (□) in the 1 × 10⁻⁴ M PAX solution. The inlet (◊) shows the detach force curve obtained with CuFeS2 in the 5 × 10⁻⁵ M PAX solution.
Minerals 11 00906 g016
Figure 17. ATR-FTIR spectra of a bornite surface after it contacted the 5 × 10⁻⁴ M KEX solution at pH 6 for 1 h.
Minerals 11 00906 g017
Table 1. Roughness analysis of the AFM images of a bornite surface in xanthate solutions.
XanthatepHConcentration (M)Image SourceRa(Sa) (nm) *Rms(Sq) (nm) **
KEX65 × 10−5 MFigure 31.9192.596
KEX61 × 10−4 MFigure 42.3723.072
KEX61 × 10−4 MFigure 52.4123.225
KEX65 × 10−4 MFigure 64.5295.866
PAX61 × 10−5 MFigure 80.6650.861
PAX65 × 10−5 MFigure 90.6840.897
PAX61 × 10−4 MFigure 100.7771.016
KEX105 × 10−4 MFigure 12A2.6643.907
KEX105 × 10−4 MFigure 12B3.1664.441
KEX105 × 10−4 MFigure 12C3.4644.734
PAX101 × 10−4 MFigure 13A2.7373.570
PAX101 × 10−4 MFigure 13B2.8463.723
PAX101 × 10−4 MFigure 13C2.7923.655
Note: * Ra(Sa): arithmetic average of the absolute values of the surface height deviations. ** Rms(Sq): root mean square average of height deviations taken from the mean image data plane.
Publisher’s Note: MDPI stays neutral with regard to jurisdictional claims in published maps and institutional affiliations.

