Article

Interaction of Corroding Iron with Eight Bentonites in the Alternative Buffer Materials Field Experiment (ABM2)

1
Institute of Geological Sciences, University of Bern, 3012 Bern, Switzerland
2
Swedish Nuclear Fuel and Waste Management Co., 169 03 Solna, Sweden
3
Institut des Molécules et Matériaux du Mans IMMM UMR CNRS 6283, Le Mans Université, 72085 Le Mans, France
4
National Cooperative for the Disposal of Radioactive Waste, 5430 Wettingen, Switzerland
*
Author to whom correspondence should be addressed.
Minerals 2021, 11(8), 907; https://doi.org/10.3390/min11080907
Submission received: 30 June 2021 / Revised: 16 August 2021 / Accepted: 18 August 2021 / Published: 22 August 2021

Abstract

:
Bentonite, a common smectite-rich buffer material, is in direct contact with corroding steel in many high-level radioactive waste repository designs. The interaction of iron with the smectite-rich clay may affect its swelling and sealing properties by processes such as alteration, redox reactions and cementation. The chemical interactions were investigated by analysing the Fe/clay interfaces of eight bentonite blocks which had been exposed to temperatures up to 130 °C for five years in the ABM2 borehole at the Äspö Hard Rock Laboratory managed by the Swedish Nuclear Fuel and Waste Management Co (SKB). Eleven interface samples were characterised by high spatial resolution methods, including scanning electron microscopy coupled with energy dispersive X-ray spectroscopy and μ-Raman spectroscopy as well as by “bulk” methods X-ray diffraction, X-ray fluorescence and 57Fe Mössbauer spectrometry. Corrosion induced an iron front of 5–20 mm into the bentonite, except for the high-Fe bentonite where no Fe increase was detected. This Fe front consisted mainly of ferric (oxyhydr)oxides in addition to the structural Fe in the smectite fraction which had been partially reduced by the interaction process. Fe(II) was also found to extend further into the clay, but its nature could not be identified. The consistent behaviour is explained by the redox evolution, which shifts from oxidising to reducing conditions during the experiment. No indication of smectite alteration was found.

1. Introduction

Compacted bentonite is foreseen as a buffer material in many concepts for high-level radioactive waste repositories [1,2,3]. This is due to its favourable sealing properties, which include high swelling capacity and low permeability. In this function the bentonite buffer will be in contact with other materials in the engineered barrier system (EBS) such as cement or steel, which will interact with the clay [4]. Additionally, the buffer will be exposed to heat arising from the radioactive decay of the waste inside the metal canister. In some concepts, the canister consists of carbon steel which will corrode and result in oxidised iron species. These species may interact with the clay by sorption [5], precipitation [6] and complex redox processes [7,8]. This interaction process may affect the functionality of the bentonite barrier, for example by weathering and transformation of smectite, but the details of this process are not yet fully understood.
A considerable amount of experimental work on Fe-bentonite interaction has been conducted, however this has been dedicated to highly simplified batch-type systems (e.g., [9,10] and references therein). Less work has focussed on parameters that are more representative of repository conditions, such as low liquid/solid and low Fe/bentonite ratios, variable redox conditions, higher temperatures (up to 140 °C), realistic dimensions and longer timescales. Examples of such studies are the FEBEX mock-up test [11], the FEBEX in situ test at the Grimsel Test Site [12,13,14,15] or the ABM in situ tests at the Äspö Hard Rock Laboratory [16,17,18,19,20,21,22,23]. In general, similar patterns of neo-formed iron minerals at the Fe/bentonite interface have been observed, notably magnetite, ferric (oxyhydr)oxides (e.g., hematite, goethite, lepidocrocite) and siderite. In contrast to many small-scale batch experiments, little or no smectite alteration has been found. However, minor amounts of trioctahedral smectite were distinguished in some of the blocks in contact with the iron heater contact in the ABM1 experiment [17,18] and the ABM2 experiment [21,22] identified an iron-bearing saponite at the interface from a FEBEX bentonite block in the ABM2 experiment. Corrosion of the steel surface in all samples induced an iron front of variable thickness reaching into the bentonite. Despite these numerous studies the mechanisms of iron transfer, from the corroding steel into the clay and its subsequent diffusion within, are not understood in detail.
This study aims at improving the knowledge base of Fe-bentonite interaction in a repository-type setting. This was done by investigating the changes in iron speciation of eight interface samples of seven bentonite materials with different mineralogical and chemical characteristics. These samples had been exposed to similar conditions at maximum temperatures of 130 °C. The methodology including high spatial resolution profiling developed in a previous study [20] was extended by the use of 57Fe Mössbauer spectrometry. Our work complements previous “bulk” studies on ABM2 samples of [21,22,24].

2. Materials and Experimental Methods

2.1. Description of the Emplaced Bentonite Materials

Eight doughnut shaped blocks with seven different bentonite materials from the ABM2 in situ test (see below) were studied. Details of the origin of the materials are provided by [16].
Granular MX-80 bentonite: MX-80 is a natural Na-rich bentonite mined in Wyomimg (American Colloid Company, Colony, WY, USA). The raw material with a mesh size of 16–200 was purchased from American Colloid Company. The granular bentonite material, which was emplaced in the ABM2 borehole (see following section), consisted of highly compacted MX-80 with very low moisture content (<5 wt %) and a bimodal grain size distribution (8–12 mm and 0.6–3.1 mm) [25]. The smectite content determined from XRD Rietveld analysis is 80.5 ± 3.6 wt % [26]. The cation exchange capacity (CEC) is 0.85 eq/kg [16]. The Fe content determined from XRF is 3.1 wt % (Table 1).
Granular MX-80 bentonite/quartz mixture: This bentonite was the same granular material as that described above to which quartz with a grain size of 0.1–0.5 mm [25] was added to yield a homogeneous MX-80/quartz (70/30) mixture. The smectite content determined from XRD Rietveld analysis is 63.7 ± 2.7 wt % [26].
Ibeco Seal M-90 (Ibecoseal): This natural Na bentonite is mined by S&B Industrial Minerals in the Askana region in Georgia/CIS. It is characterised by a high montmorillonite content, as indicated from the high CEC of 0.88 eq/kg [16]. The Fe content determined by XRF is 3.0 wt % (Table 1).
Ikosorb: This natural white Ca, Mg-rich bentonite from Morocco has a high montmorillonite content, as indicated from the measured CEC (0.90 eq/kg) [16] and a rather low Fe content (2.1 wt %) (Table 1).
Kunigel VI: This natural Na-bentonite is produced by Kunimine Industries Co. It has a comparatively low montmorillonite content (~55 wt %) [27] and a CEC of 0.61 eq/kg [16]. It displays the lowest Fe content (1.3 wt %) (Table 1) of all studied materials.
Rokle: This natural bentonite originates from the Rokle deposit in the Kadan basin of the Czech Republic. It has a moderately high smectite content as indicated from the measured CEC value of 0.74 eq/kg [16]. The Fe content is 11.6 wt % which the highest of all studied materials.
Deponit CAN (Deponit): This natural Ca bentonite is mined on the island of Milos in the South Aegean (Greece). It has a moderately high smectite content of 72 wt % [28] and a CEC of 0.84 eq/kg [16]. The Fe content is rather high, a value of 3.8 wt % was obtained from XRF analyses (Supplementary Materials S3).

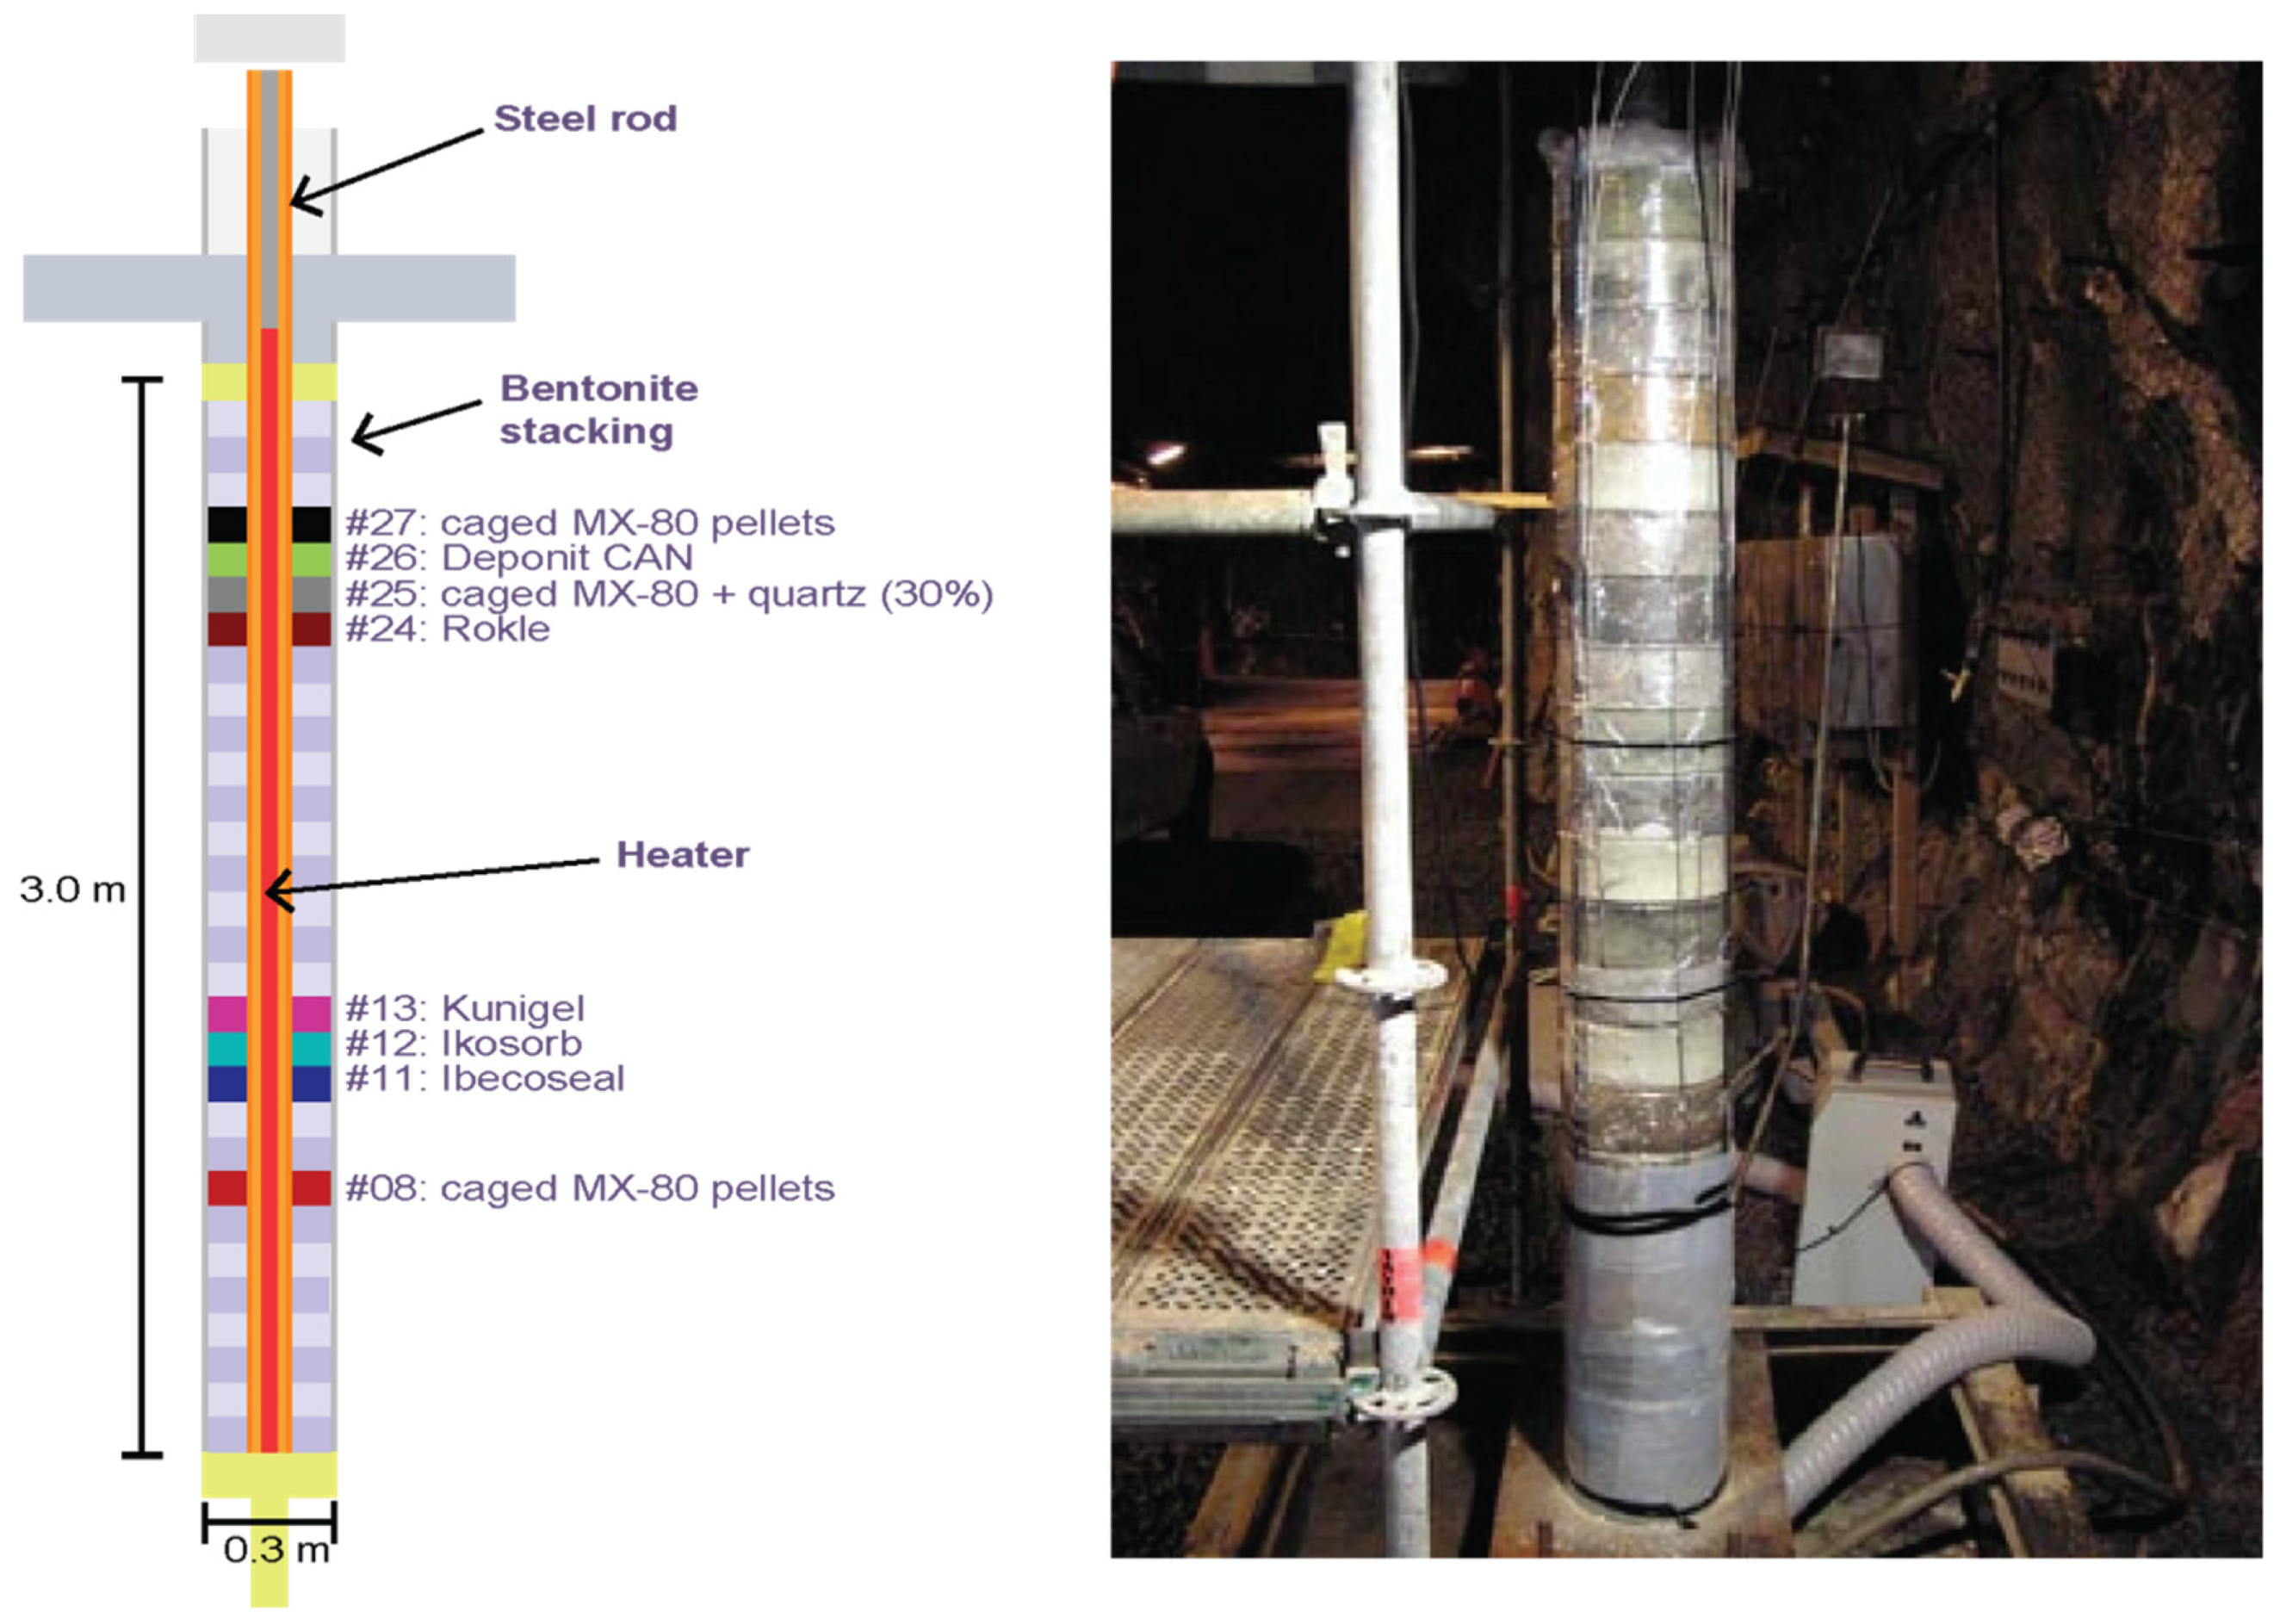
2.2. The ABM2 Test Package, Excavation and On-Site Sampling

The ABM (Alternative Buffer Materials) test is an internationally supported in situ experiment conducted by SKB (Swedish Nuclear Fuel and Waste Management Co., Solna, Sweden) in the Äspö Hard Rock Laboratory (Äspö HRL), Sweden. The main objective of the ABM test is to access the stability of different bentonites under adverse, but representative conditions of the near-field of high-level radioactive waste repositories [16]. Within the ABM test, three test packages (ABM1, ABM2, and ABM3) consisting of various bentonite materials stacked upon each other as blocks were emplaced in three boreholes and heated via a central steel tube composed of common carbon steel, P235TR1 [29]. The layout of the ABM2 test package and the blocks sampled in this study are illustrated in Figure 1.
The “block” materials #11, #12, #13, #24 and #26 consisted of pre-compacted blocks (height 100 mm and diameter 300 mm) emplaced in direct contact with the steel heater. The granular materials of blocks #8, #25 and #26 were inserted in a prefabricated iron-based cage on-site. This circular cage was made of a cylindrical inner steel ring, steel frames, and steel fibre cloth wrapped around the cages. The installation procedure is detailed in [29]. The description of the experiment and its dismantling are presented in [22] and [23]. In short: the experiment was saturated with natural Äspö groundwater for one year via a sand filter previously emplaced between the blocks and the borehole wall. The Äspö groundwater at the location of the ABM test package is of Na-Ca-Cl type with ~180 mM Cl, ~100 mM Na+ and ~50–60 mM Ca2+ including some SO42− (~5 mM), Mg2+ (0.3–2.4 mM), K+ (~0.3 mM) and HCO3 (~0.4 mM) [16,30]. The package was then heated to temperatures of 120–140 °C at the heater contact for a period of three years before allowing subsequent cooling for an additional year. This was followed by retrieval through overcoring and uplifting. Samples were removed in situ from the heater steel tube, unfortunately in some areas the Fe-bentonite interface was damaged during this process. The cages were simply slid off the tube and were thus kept intact during in situ sampling. This resulted in the Fe-bentonite interface being generally better preserved in the caged samples.

2.3. Analysis of Fe-Clay Contact Zone

Sample preparation: Two types of samples were prepared (Figure 2). The first type underwent preparation for microscopic analysis at high spatial resolution (SEM/EDX, µ-Raman). A subsample comprising the Fe-bentonite interface was cut out, freeze-dried, vacuum-embedded in epoxy resin and finally polished (using petroleum). The resulting polished section (Figure 2A) was subsequently stored in a desiccator until further microscopic analyses. The second type consisted of powdered subsamples at different distances from the contact zone (Figure 2B), which were used for bulk analysis (Mössbauer spectrometry, XRD and XRF). These were prepared anaerobically in the glovebox (N2/H2 mixture with Pd catalyst), including separation, drying, milling and storage.
SEM/EDX analysis: The uncoated sample surface was examined in a SEM (EVO-50 XVP, Carl Zeiss AG, Jena, Germany) equipped with an EDAX® Sapphire light-element detector in low vacuum mode (10–20 Pa) with a beam acceleration of 20 kV, a sample current of 500 pA, and a working distance of 8.5 mm. The beam current was adjusted to yield a dead time of 8–15% for EDX analysis. EDX element maps with a resolution of 128 × 100 pixels were acquired using a dwell time of 200 μs/pixel. Mappings were conducted with a magnification of 80, which results in pixel size of ~11 µm2 and maps of ~1.4 mm × 1.1 mm. Mapped elements generally included C, O, Na, Mg, Al, Si, P, S, Cl, K, Ca, Ti, and Fe but only Fe, Ca, S and Al data are reported here. The total grid dimension was usually 30–40 maps along the x axis perpendicular to the interface and 8–10 maps along the y axis parallel to the interface. Given the parameters of analysis (resolution, dwell time), the acquisition time per block was ~12 h. Output data from the operating software (Smartsem® by ZEISS for the SEM part and Genesis® by AMETEK for the EDX) were collected and treated with a MATLAB in-house algorithm in order to establish chemical profiles, large scale elemental mappings, and backscatter images.
The main data obtained from the SEM-EDX survey are presented as “Al-normalized” chemical profiles of the major elements, representing the atomic ratio of a given element over Al as a function of the distance to the interface [15]. The so-called “Al-normalized” values were computed directly from the quantification results [31,32]. For a given element, each point of the profile represents the average ratio of the content in this element over the Al content of a given column parallel to the interface of the analysis grid. Ratios over Al are not sensitive to variations in other elements. Al is assumed to be immobile, based on the lack of clay alteration (major Al carrier) and therefore, the very low Al mobility. This was confirmed by Al profiles showing constant Al perpendicular to the interface (Supplementary Materials S1). The error bars account for twice the standard deviation. Raw EDX data were corrected using individual Standard Element Coefficients (SEC) factors for each element. These factors were determined from the EDX analysis of six different raw bentonites (MX-80, Ibecoseal, Ikosorb, Deponit, Rokle and Kunigel) of very similar composition for which reference XRF data were also available [16].
μ-Raman spectroscopy: Raman spectroscopy was performed with a Jobin Yvon LabRAMHR800 instrument consisting of a BX41 confocal microscope (Olympus) coupled to an 800 mm focal length spectrograph. A non-attenuated He–Ne laser (20 mW, polarized 500:1) with an excitation wavelength of 632.817 nm (red) was focused on the sample surface and the Raman signal was collected in reflection mode. The sampled volume was a few μm3 using a 100x objective lens. Spectra were measured in Raman shift intervals of 150 to 1400 cm–1 in five steps of 250 cm–1. Acquisition time for each step was 2 × 15 s, i.e., 2.5 min in total. Acquisition time was doubled for some analyses in the clay matrix. The spectra were recorded with Labspec V4.14 software (HORIBA Scientific). Identification of the species was done using the spectra library included in the HORIBA Edition of the KnowItAll®. The spectra presented in this report indicate the name(s) of identified species and corresponding reference number(s) in the library, which actually combines several entries for inorganics, minerals, and gemstones from Minlab v3 or RRUFF [33].
XRF analyses: Glass pellets were made by fusing a 1:10 mixture of sample powder and Li-tetraborate at 1150 °C. XRF analyses of major elements were performed on a PW 2400 Philips spectrometer and corrected with the internal Philips software ×40 on the basis of a set of international rock standards. Loss on ignition (LOI) was determined by mass difference before and after fusing. Water content was determined during the same process (105 °C for 2 h).
57Fe Mössbauer spectrometry: Mössbauer spectrometry was employed to measure the iron reduction level and to identify Fe bearing phases present in the sample. The spectra were recorded at room temperature (RT, 300 K) and at 77 K using a constant acceleration transducer and a 57Co source dispersed in a Rh matrix. Velocity calibrations were carried out using an α-Fe foil at RT. The values of the hyperfine parameters were refined using a least-square fitting procedure (MOSFIT in-house unpublished program) with a discrete number of independent quadrupolar doublets and magnetic sextets composed of Lorentzian lines. The values of isomer shift (I.S.) are reported relative to that of the α-Fe spectrum obtained at RT. The fractions of each Fe species are proportional to the relative spectral area. Indeed, the f-Lamb-Mössbauer factors which correspond to the fraction of gamma rays emitted and absorbed without recoil are assumed to be identical for the different phases present in the samples and for the different Fe species present in the same phase [34,35,36]. The fitting strategy consisted in the use of a minimal number of components (quadrupolar doublet or magnetic sextet) for discriminating between high spin octahedral Fe3+ (HS-oct-Fe(III)), high spin octahedral Fe2+ (HS-oct-Fe(II)), low spin octahedral Fe2+ (pyrite) and magnetically ordered species (goethite and hematite). In addition, it is important to emphasize that the quadrupolar component may in part be attributed to superparamagnetic species originating from very fast relaxation phenomena: it is, therefore, necessary to compare Mössbauer spectra recorded at different temperatures. Goethite and hematite in particular display hyperfine structures which are strongly dependent on the crystalline grain size, the distance between close grains, and temperature [37]. In the present study, this temperature dependency was used to discriminate between “large” grains (or aggregates) of goethite or hematite (~>30 nm, magnetically ordered at room temperature and 77 K), “medium-sized” grains (~5–30 nm, paramagnetic at room temperature, but magnetically ordered at 77 K, i.e., superparamagnetic), and “small” grains (~<5 nm, paramagnetic at both temperatures, thus it is much more difficult to discriminate from other species such as the clay structural Fe(III)). In addition, the extent of the hyperfine magnetic field (Bhf) and of quadrupolar shift (2ε) also enables discriminating goethite from hematite (the latter exhibits a higher Bhf).
XRD analyses: Studies were conducted using an Anton Paar domed sample holder (Anton Paar Austria) for air-sensitive materials equipped with a polycarbonate dome. The powdered samples were loaded on the sample holder in the anaerobic chamber, the surface was flattened with a glass slide and the dome was closed before the samples were removed from the chamber. The raw bentonites were also analysed without the dome. The samples were analysed with a X’Pert PRO X-ray and recorded using Cu Kα radiation with a wavelength of 1.54 Å and an X-ray tube operated at 40 mA and 40 kV. The samples were scanned from 5 to 60° 2θ using a step size of 0.0167° 2θ and a time of 10 s per step, with automated divergence slits. Samples were spun during the measurement, at a rate of one revolution every 8 s.

3. Results

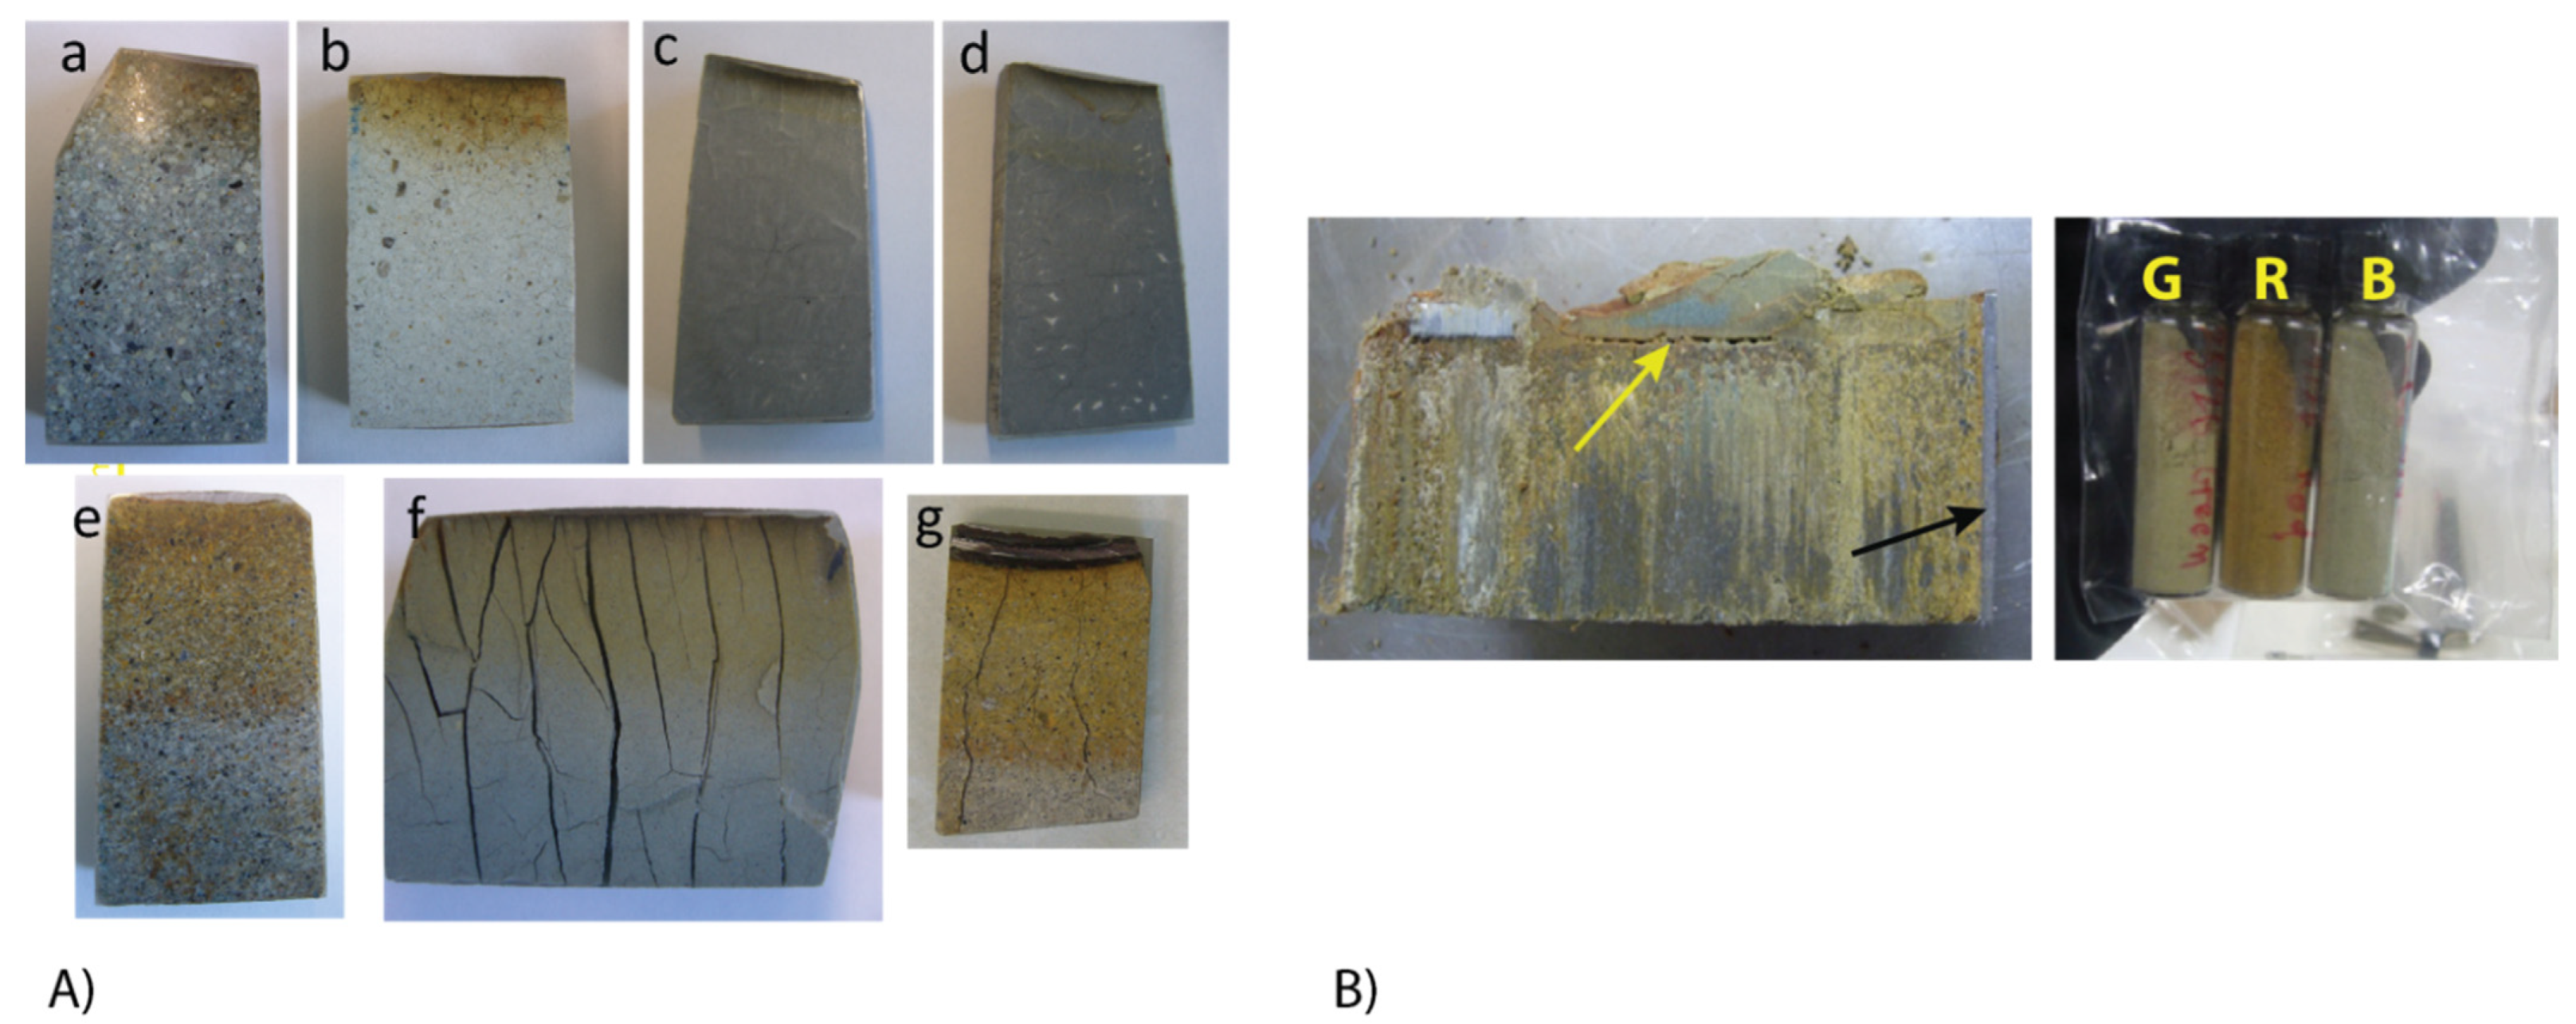
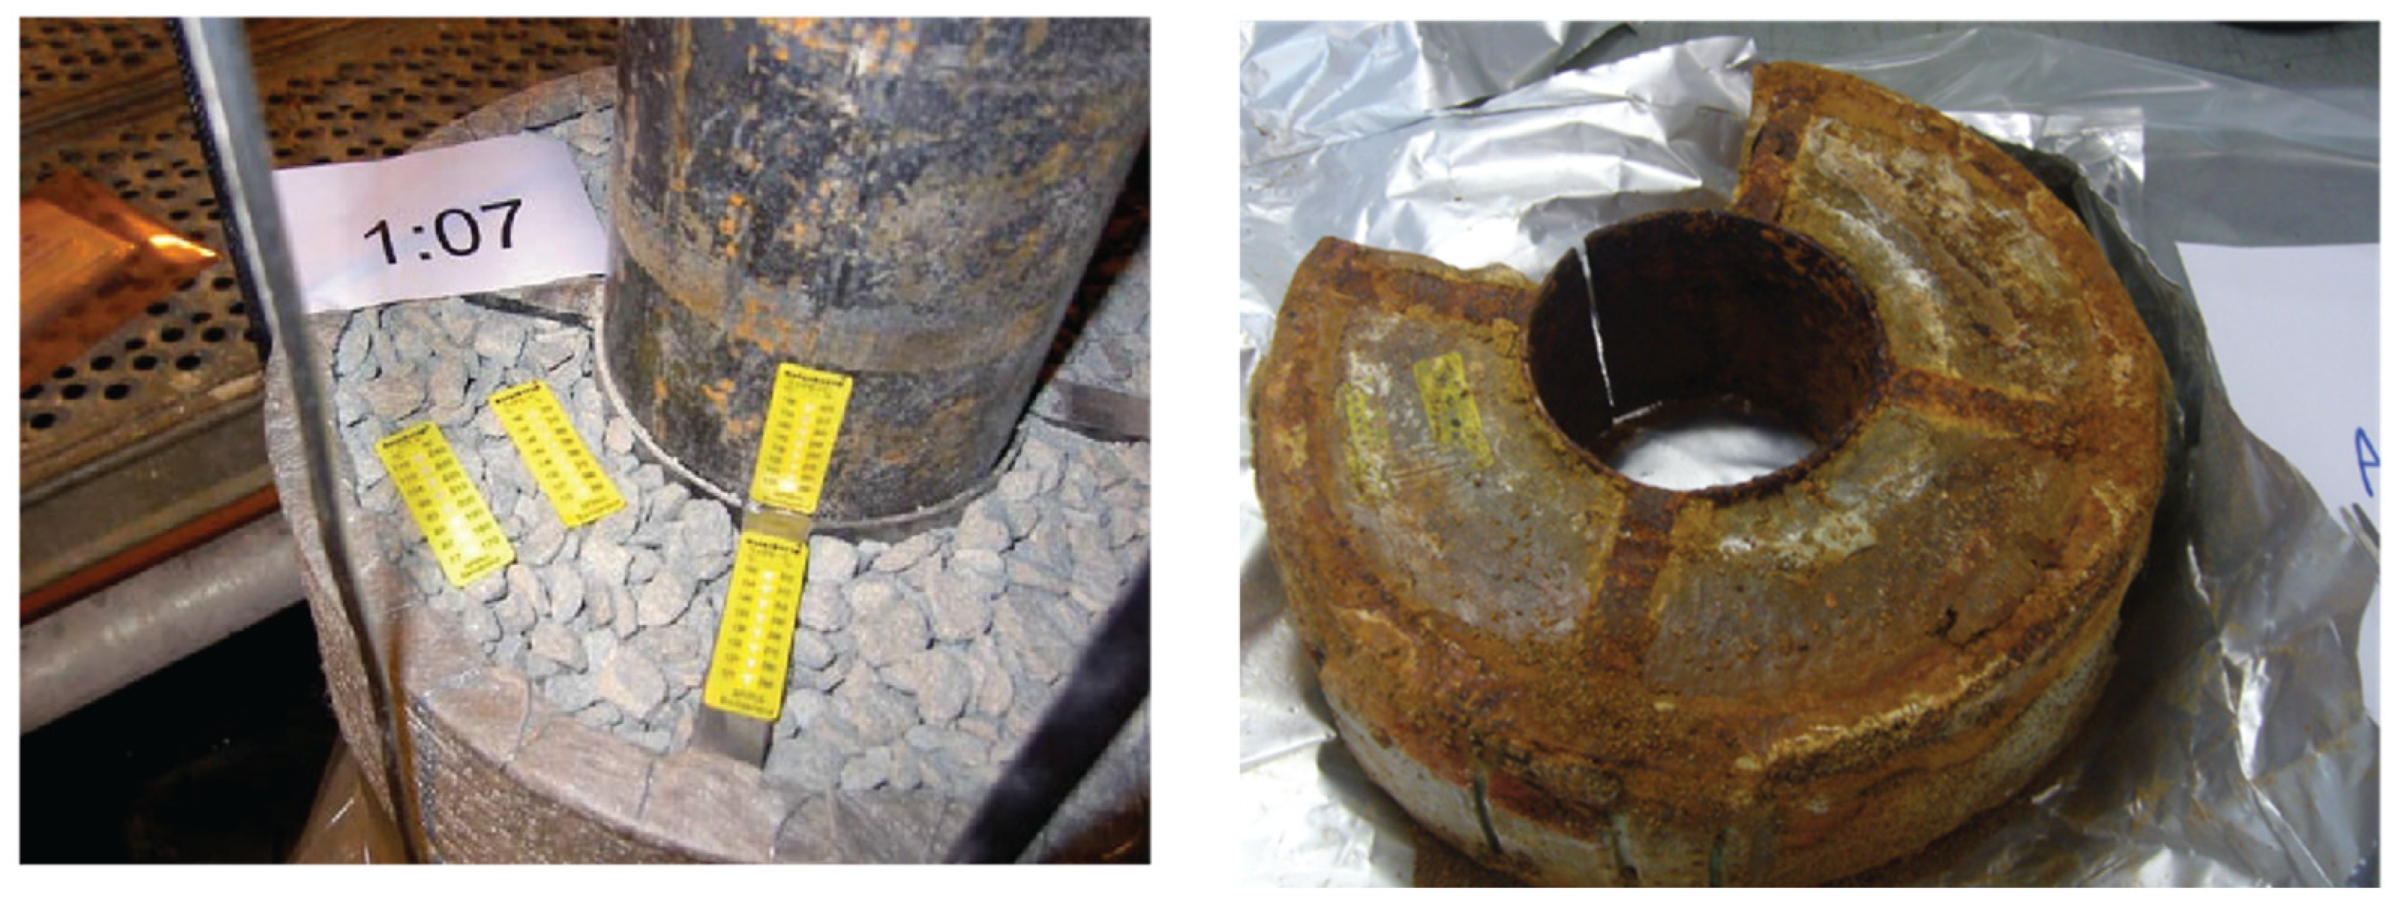
3.1. Macroscopic Observations

The caged blocks which had been filled with compacted granular MX-80 and granular MX-80/quartz (Figure 3 left) were transformed to a homogeneous mass without any visible trace of the original pellet texture (Figure 3 right). This homogenization had been induced by swelling processes during water saturation.
The second obvious feature was the severe corrosion of the steel frame, which also affected the adjacent bentonite (Figure 3 right). The surfaces of the blocks appeared brown-orange contrasting with the grey colour of the unaffected MX-80 material. The impact on the upper caged blocks (#25 and #27) was stronger than that on the lower block (#08) where the grey colour remained visible. The neighbouring blocks were also affected by corrosion of the steel frame of the cage, observable as a brownish rusty front penetrating several mm into the neighbouring blocks.
The extent of the rusty front is larger in the caged granular materials than in the adjacent blocks. It is worth noting that the granular materials have a lower density compared to the “normal” blocks according to data on ABM1 [20]. Cracks filled with iron oxides and pronounced corrosion halos deep inside the caged blocks were observed in caged blocks. The origin of this phenomenon is discussed in Section 4.3.
The upper blocks (#24–#27) had a number of contrasting features compared to the lower blocks. The latter were still humid, had a homogeneous texture with rare fractures, presumably having occurred after sampling and storage, and rather well preserved interfaces to the metal pieces. The former, on the other hand, appeared more altered, drier, with many more fractures as well as poorer preserved interfaces with the heater. From the polished sections (Figure 2A) it can be concluded that the impact of corrosion was more extensive in the upper blocks. A 5–10 mm wide concentric rim of white precipitate, identified as anhydrite, was observed on the surface and fracture walls of the upper caged blocks. The reason for these different features in the upper blocks can be attributed to a boiling event, which probably occurred during the experiment in this area where the maximum temperatures occurred as a result of local pressure release [22,24]. This is possibly related to a local transmissive fracture in the surrounding rock.

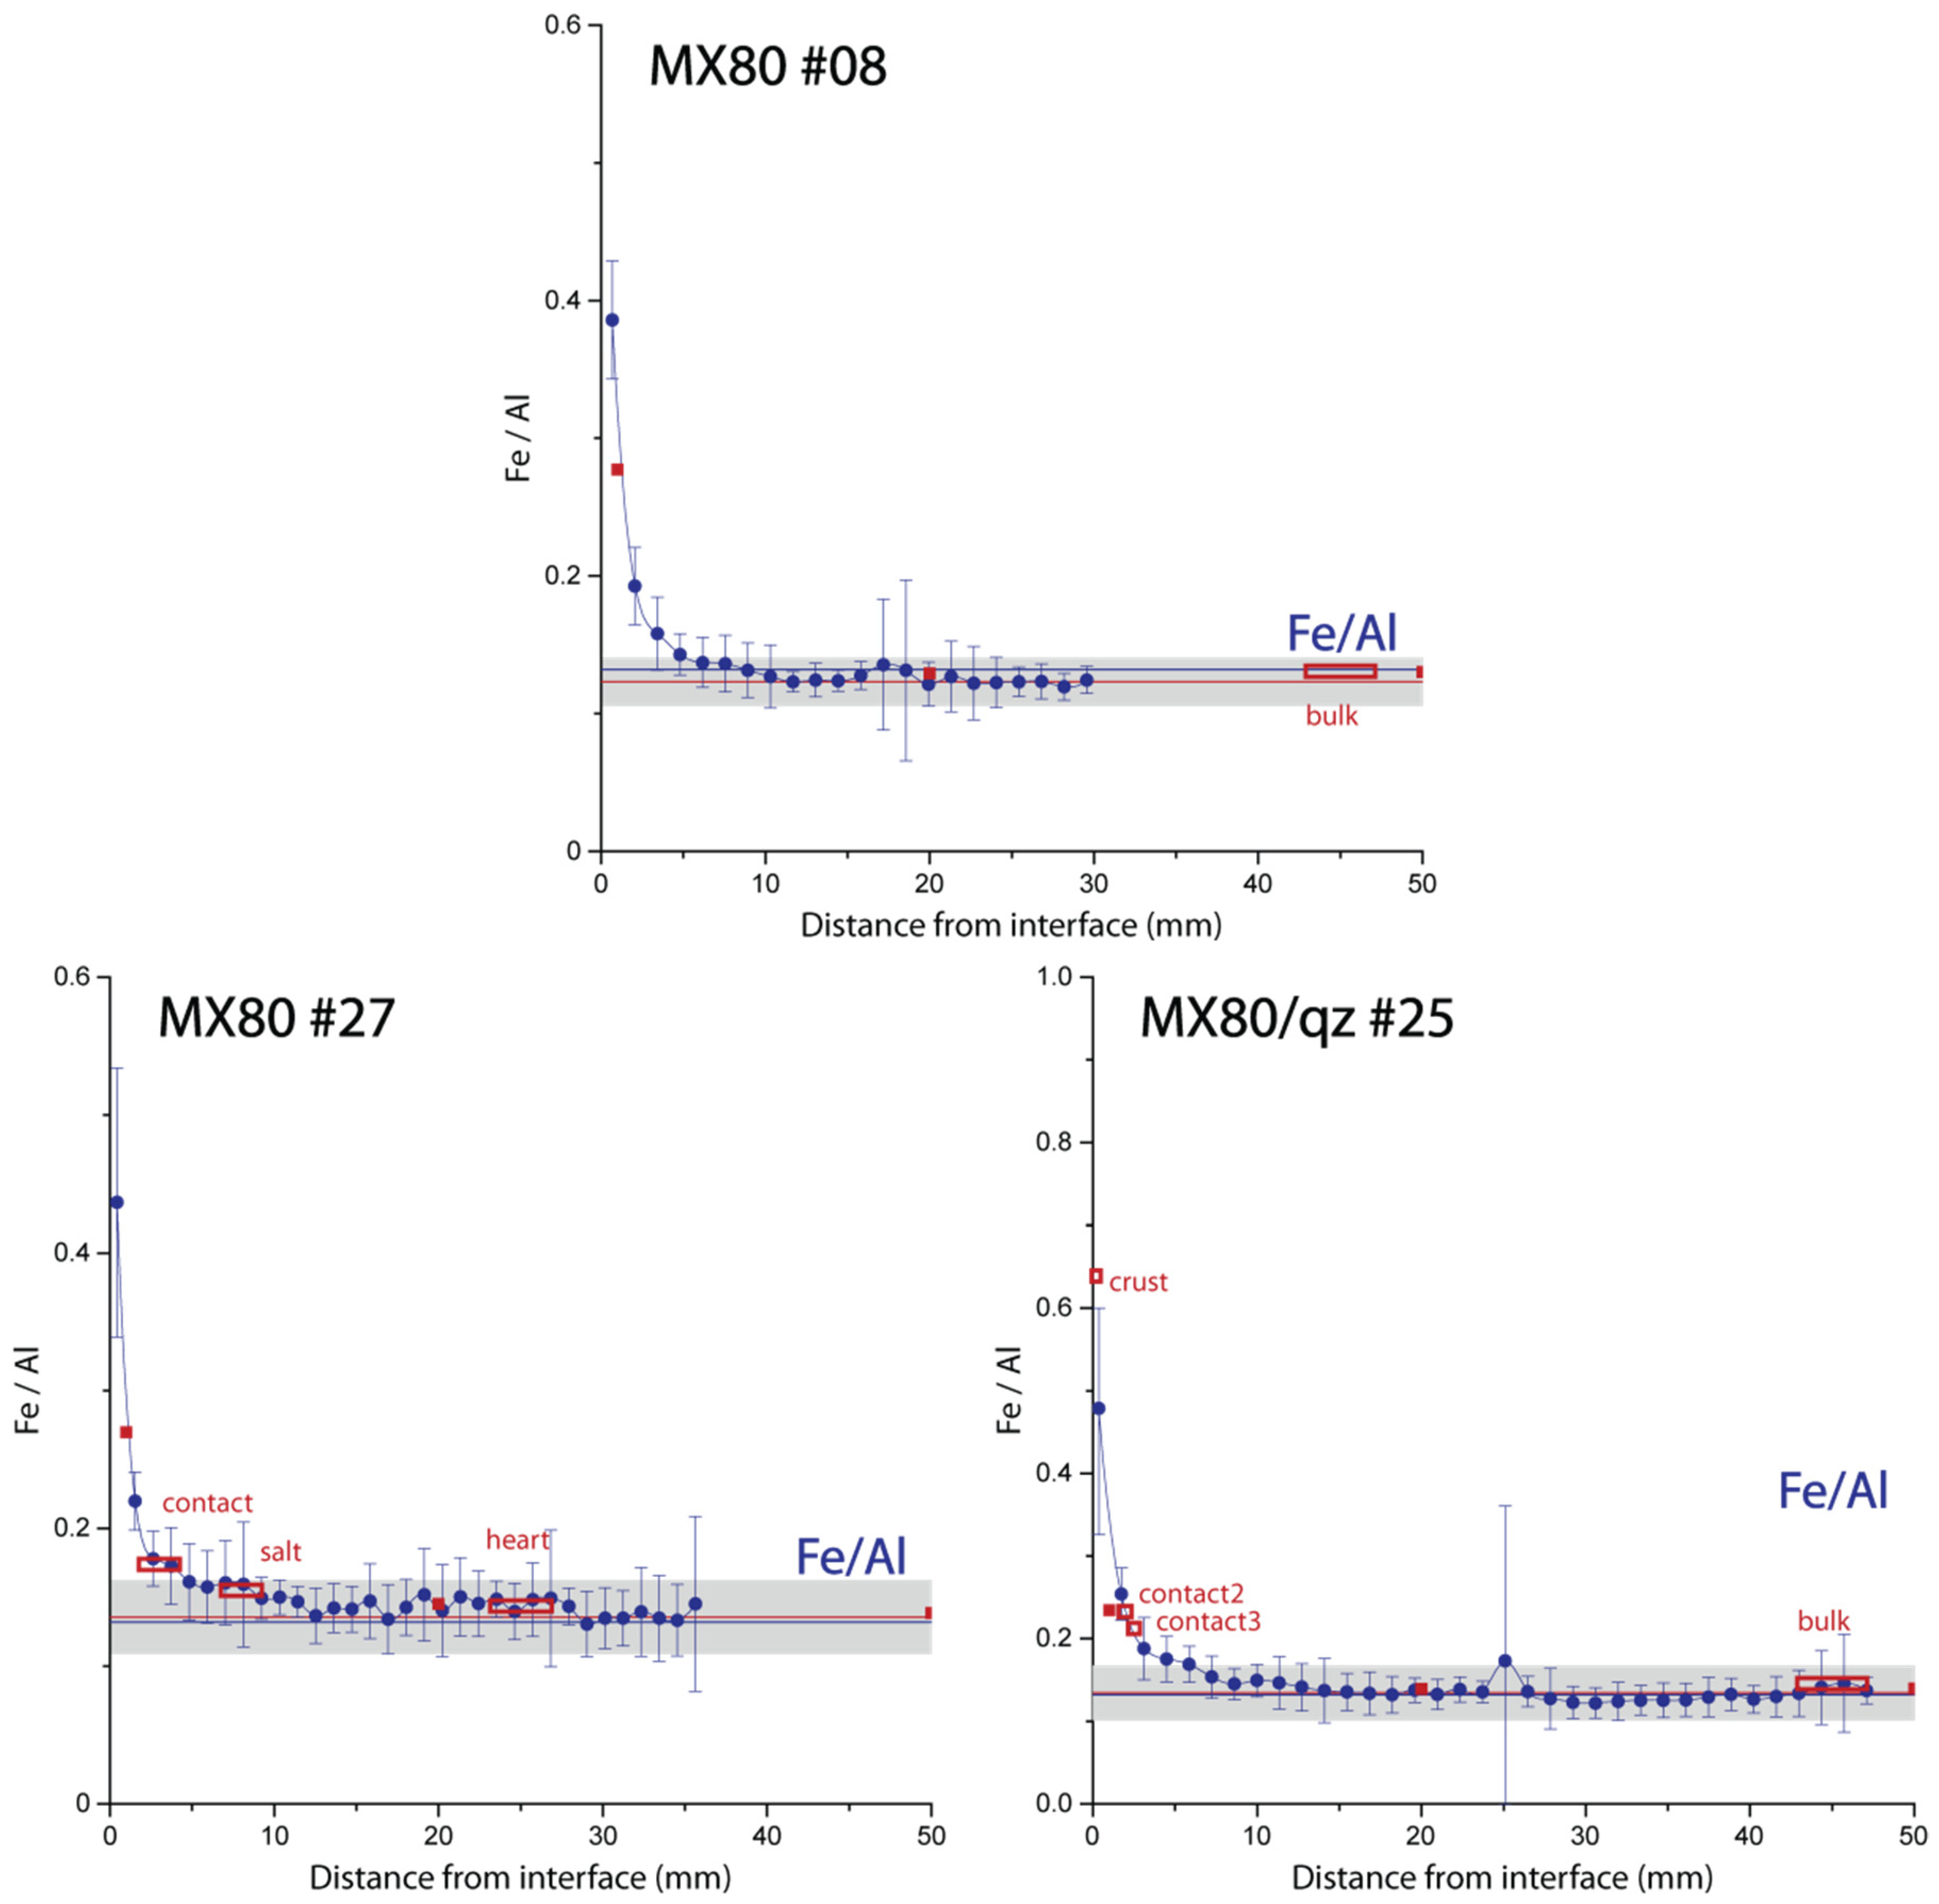
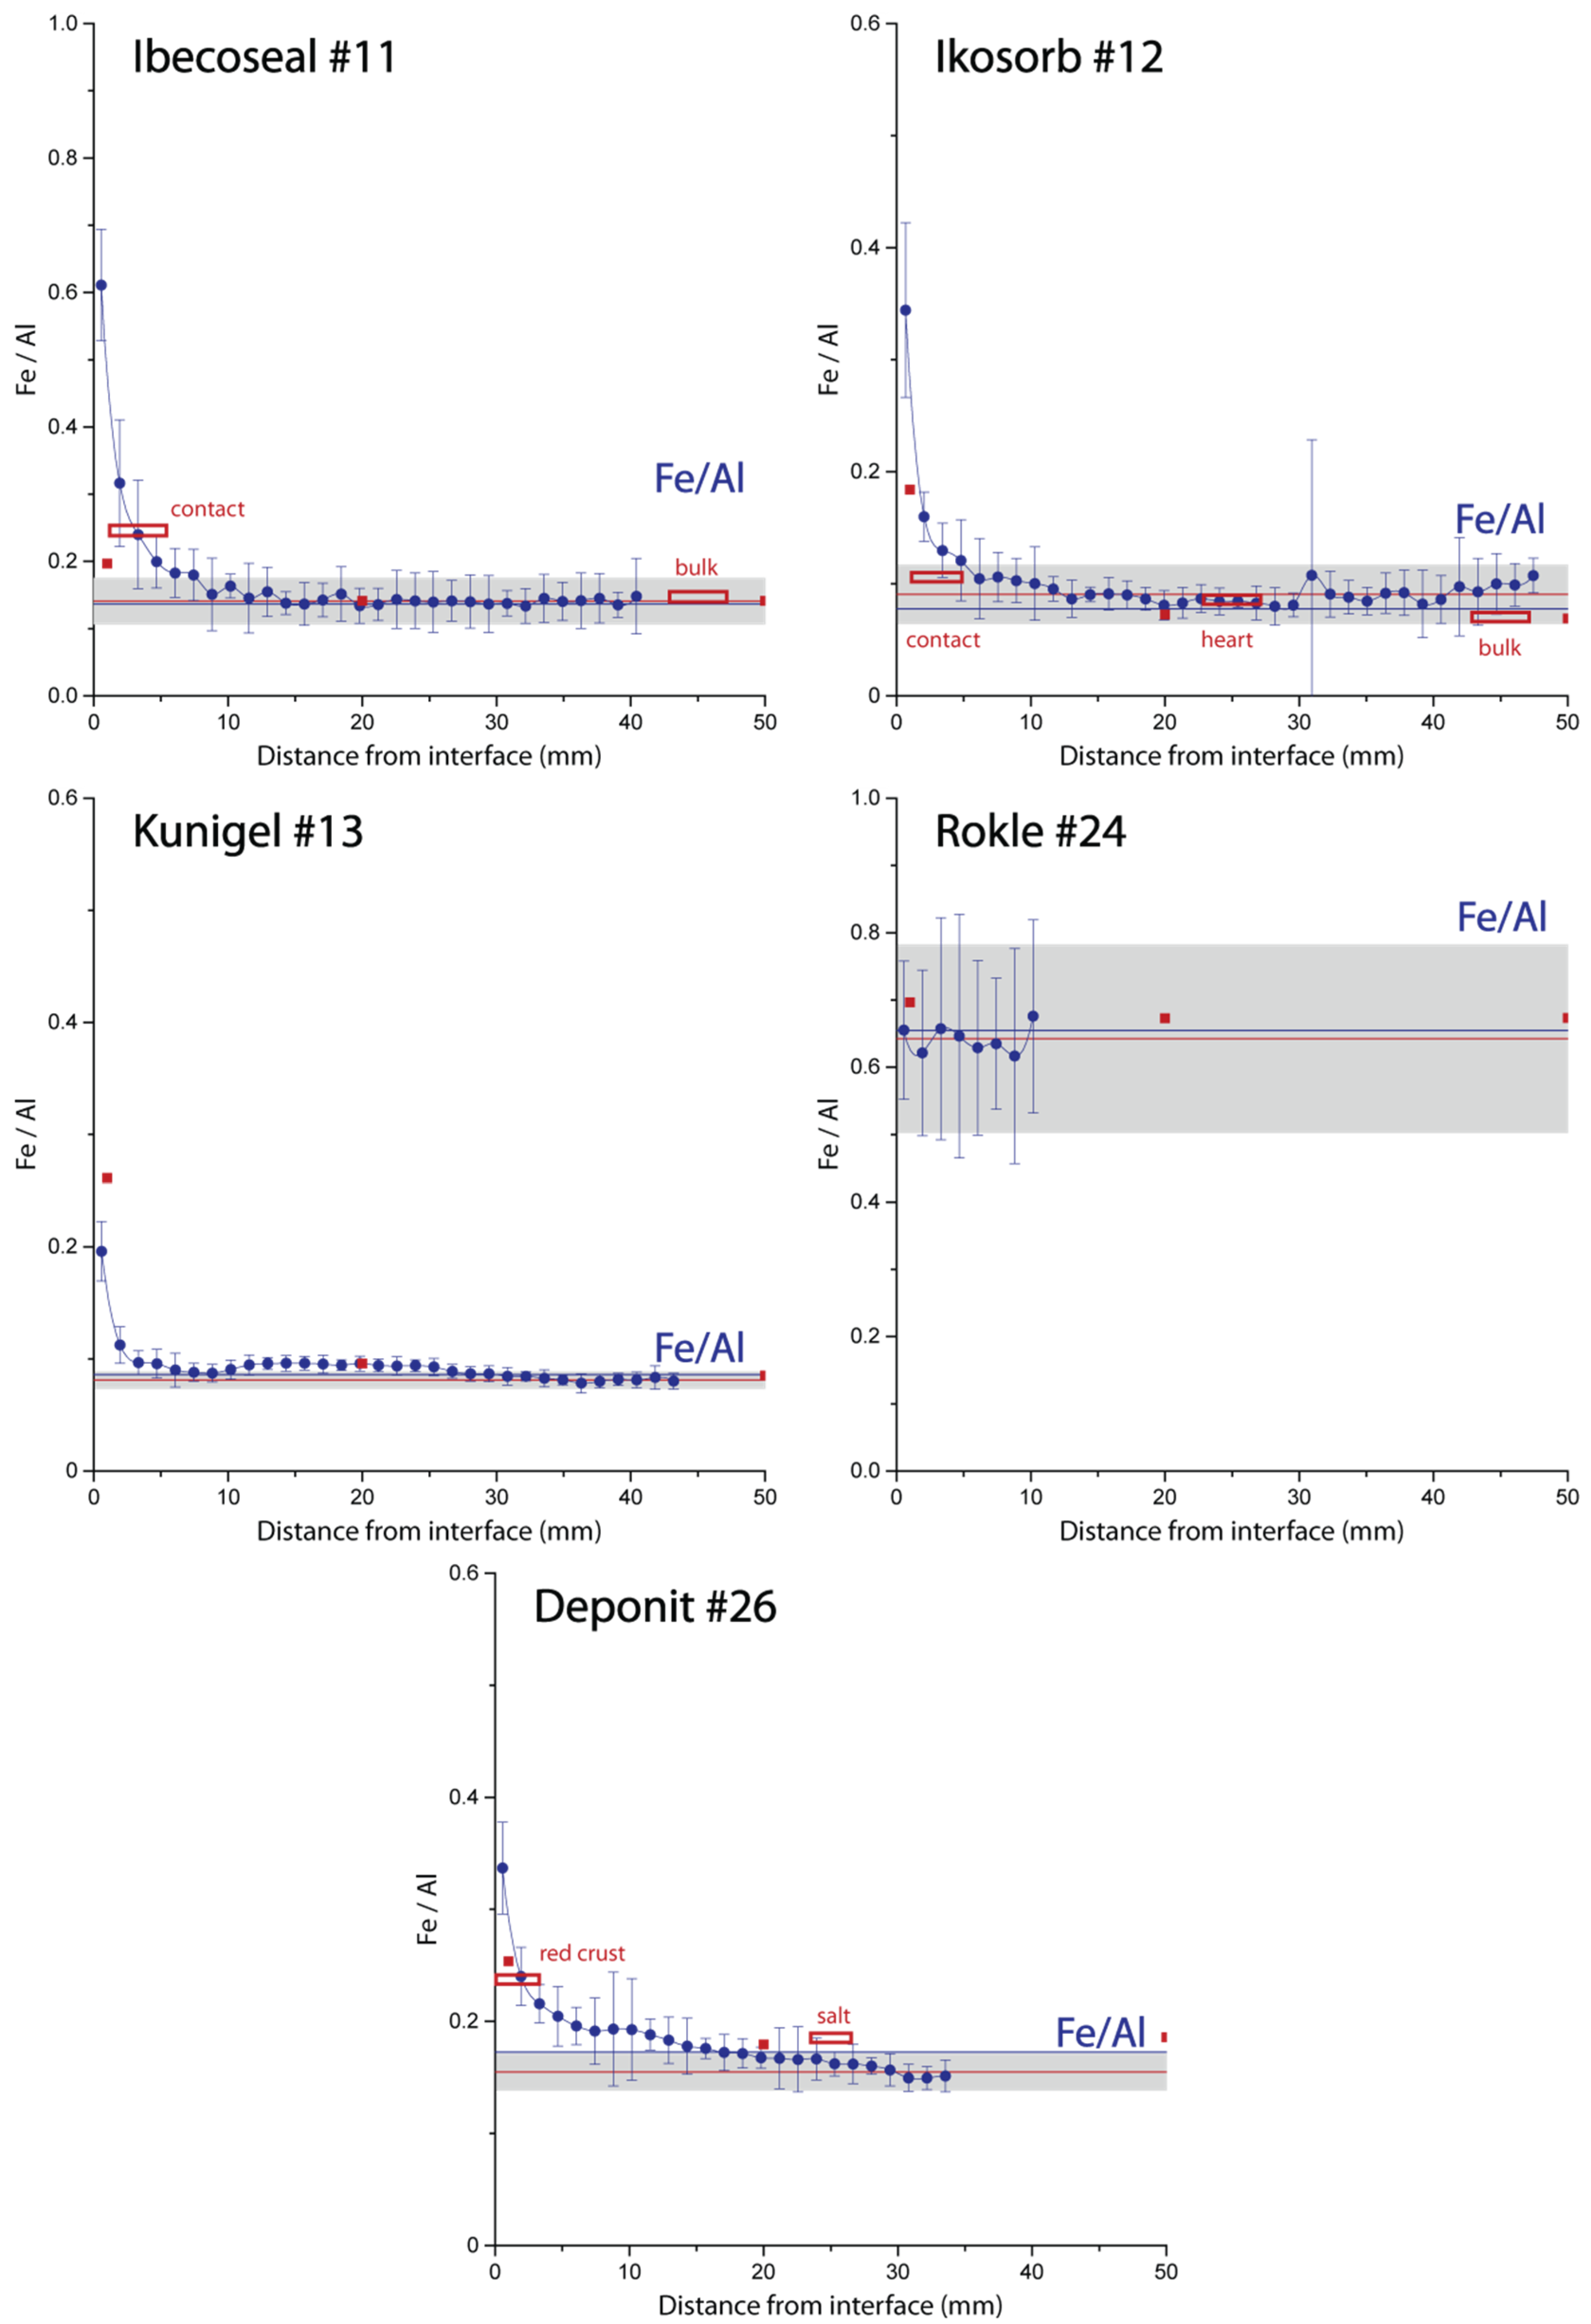
3.2. Quantitative EDX Profiles

The distribution of Fe relative to the adjacent steel surface was studied by quantitative area surface measurements (see Methods section). The total area was divided into 8–10 rows and 30–40 columns, which resulted in 240–400 cells overall. Each cell corresponds to one EDX area measurement. The average EDX analyses of 8–10 individual measurements (referred to “area measurements” below) were calculated for each column. Error bars represent twice the standard deviation. The complete set of profiles is shown in the Supplementary Materials S1).
The Fe content (shown as Fe/Al ratios) in the blocks shows an increase toward the Fe-clay interface. The MX-80 materials exhibit a similar shape of the Fe front (Figure 4). A sharp Fe increase at the contact in a narrow zone (<5 mm) is followed by a zone of more gradual change in the clay (~5–10 mm). The actual steel crust consisting of various corrosion products without bentonite is not part of the profiles. The large variation observed in some locations reflects the local presence of accessory iron minerals, whose distribution is more or less inhomogeneous as indicated from SEM analysis, and which were also observed in the reference material. Blocks #25 (MX80/qz) and #27(MX80) from the upper part of the package, where the boiling event occurred (see below), display slightly higher Fe enrichment and a larger front compared to block #08 (MX80) from the lower part.
The other materials display similar Fe behaviour perpendicular to the Fe-clay contact (Figure 5). An exception is the Rokle bentonite which contains by far the highest Fe content. In this material, there is no indication of an increase in Fe compared to the bulk material. The variations are large which is explained by the inhomogeneous distribution of Fe oxides also observed in the reference materials (see below). In some blocks (Ikosorb, Kunigel) there seems to be an indication of a second front further inside the clay. In the latter material, this front is close to the uncertainty of the measurements.
In summary, the different blocks show similar Fe profiles towards the contact with steel, regardless of the type of material (except for the high-Fe Rokle bentonite). The maximum increase relative to the bulk material varies between a factor of 2.5 to 4. The position in the package does not have a significant effect. Comparing the same materials (MX80) however, it appears that in the upper part where the boiling event occurred, slightly more Fe from the corroding steel migrated into the clay. Using the adequate calibration (see Methods section) the Fe content determined from EDX agrees with that obtained from XRF within the analytical error.

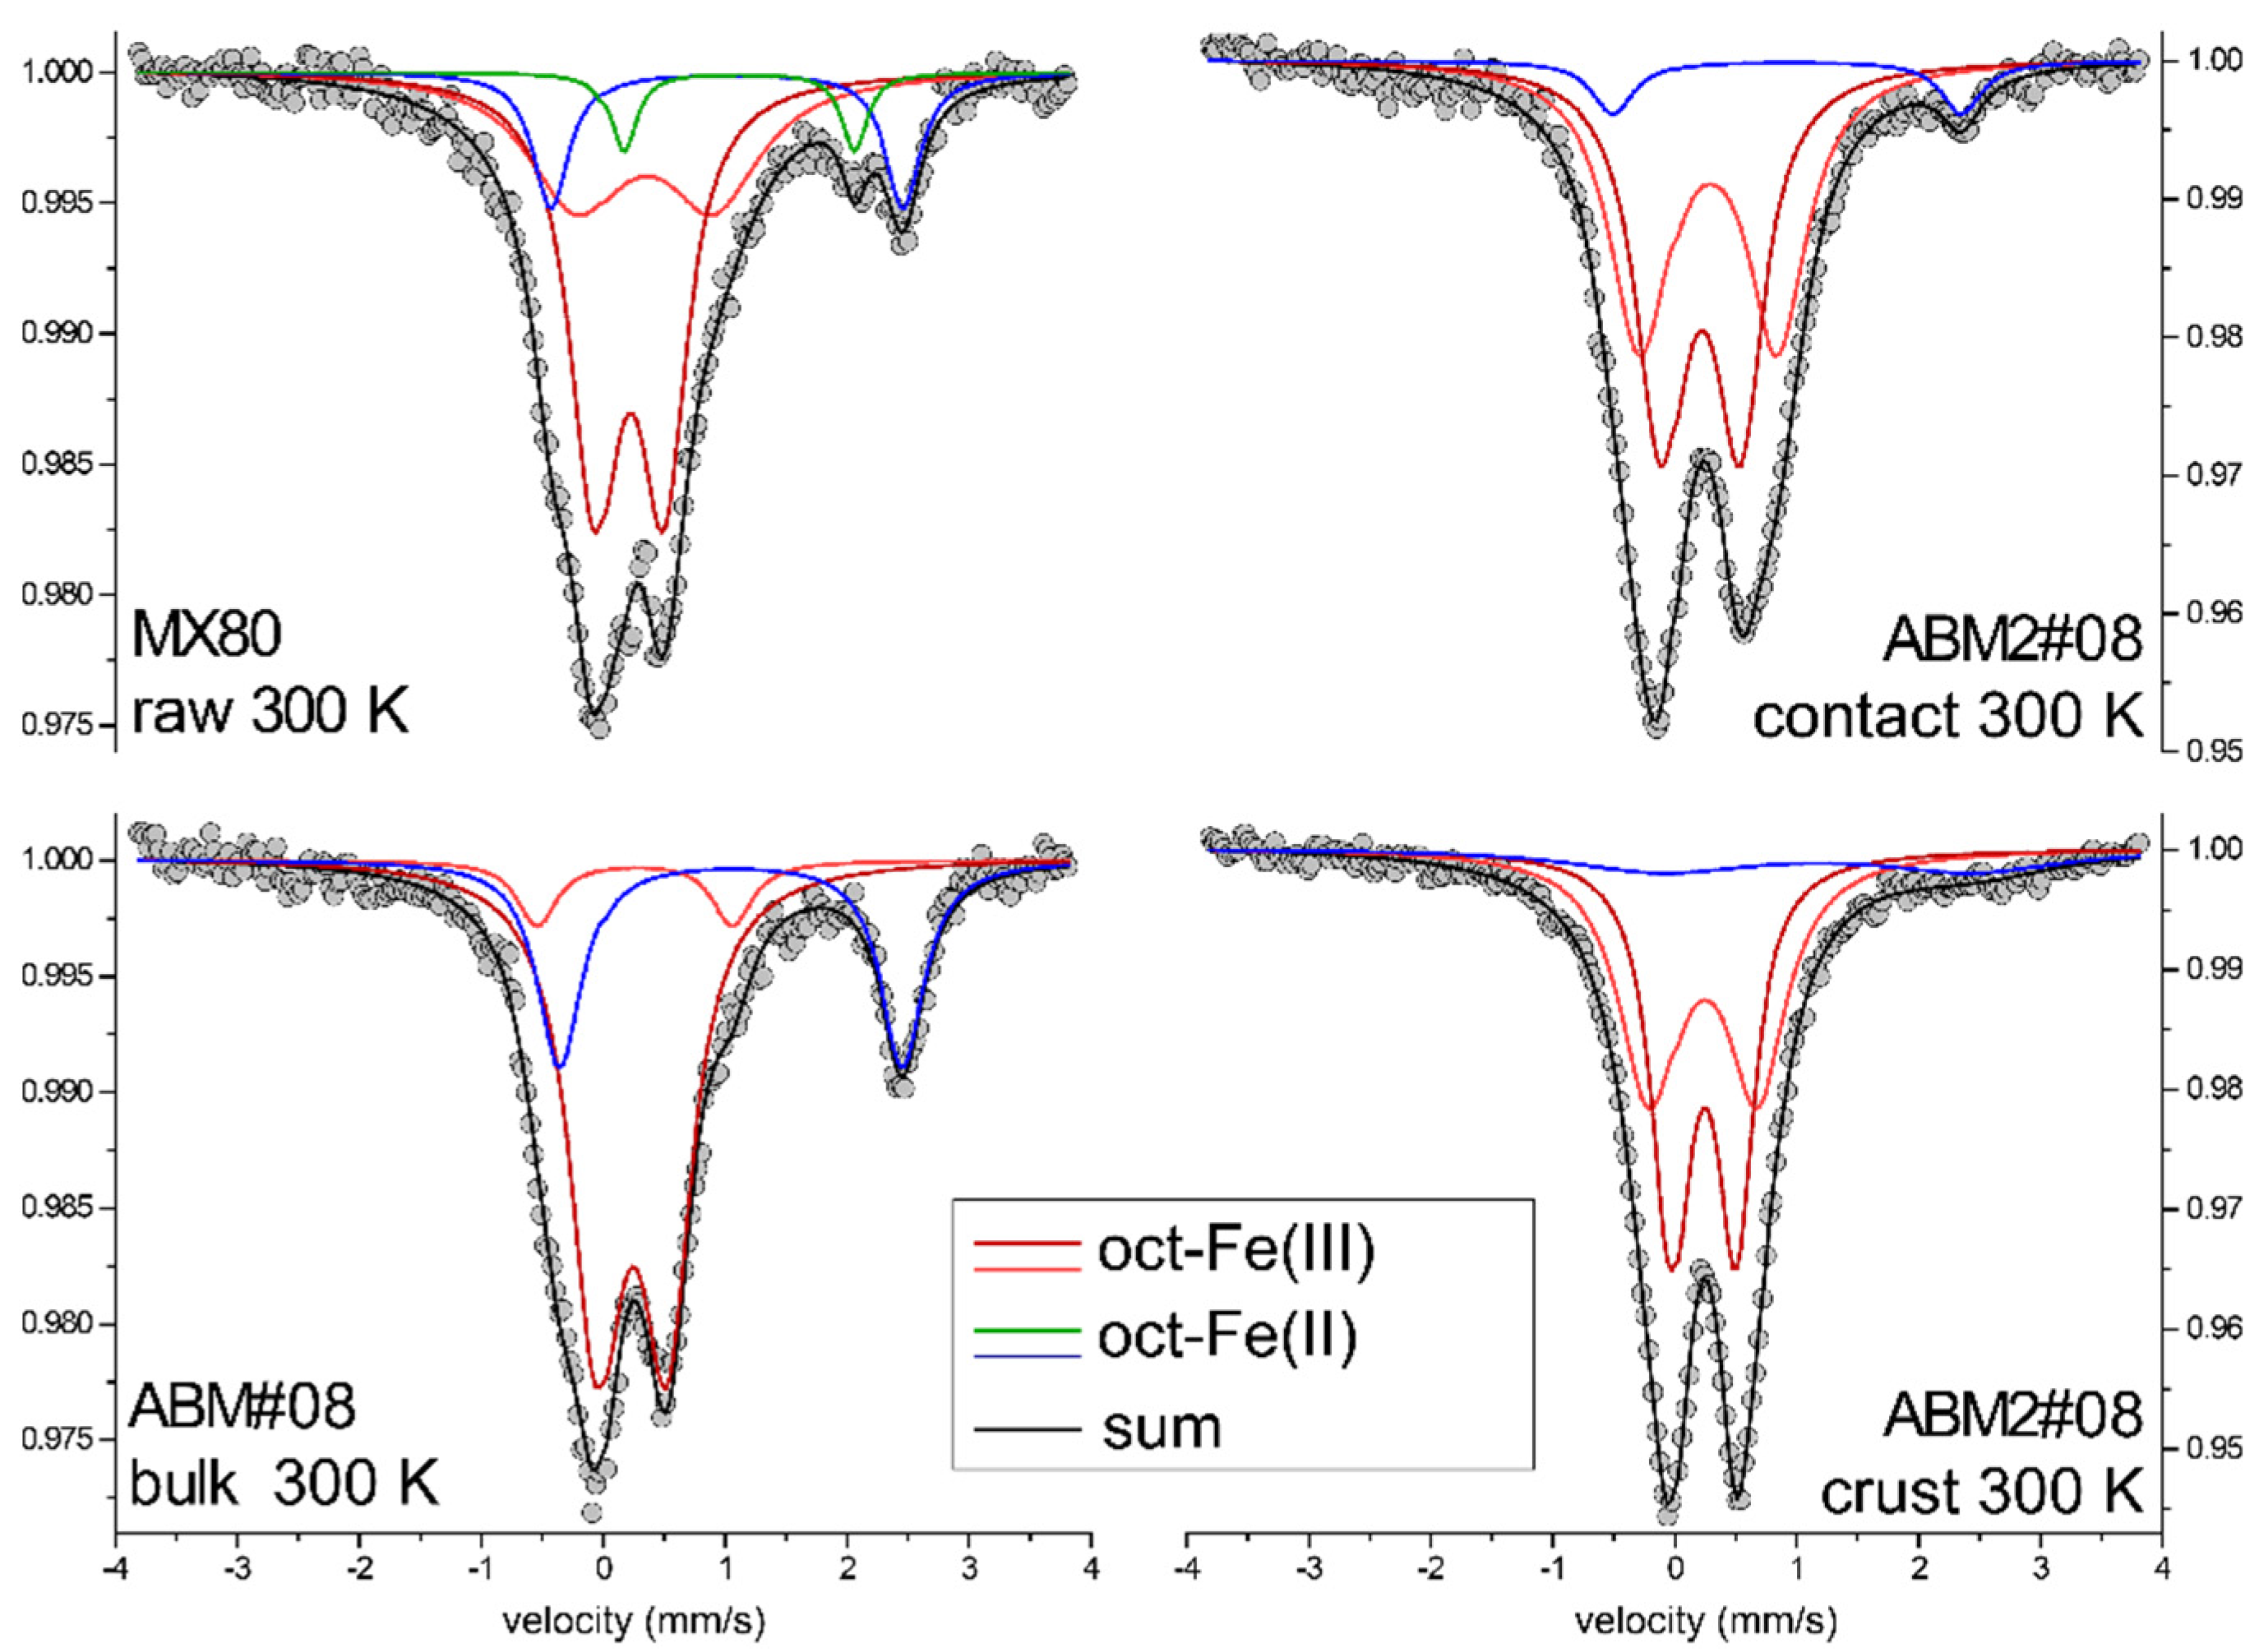
3.3. Identification of Iron Phases

The identification of iron phases in relation to their location relative to the corroding steel source(s) was performed using combined information from SEM/EDX, µ-Raman, XRD and Mössbauer spectrometry. The entire datasets are presented in Supplementary Materials S2 (µ-Raman), S3 (XRD) and S4 (Mössbauer).

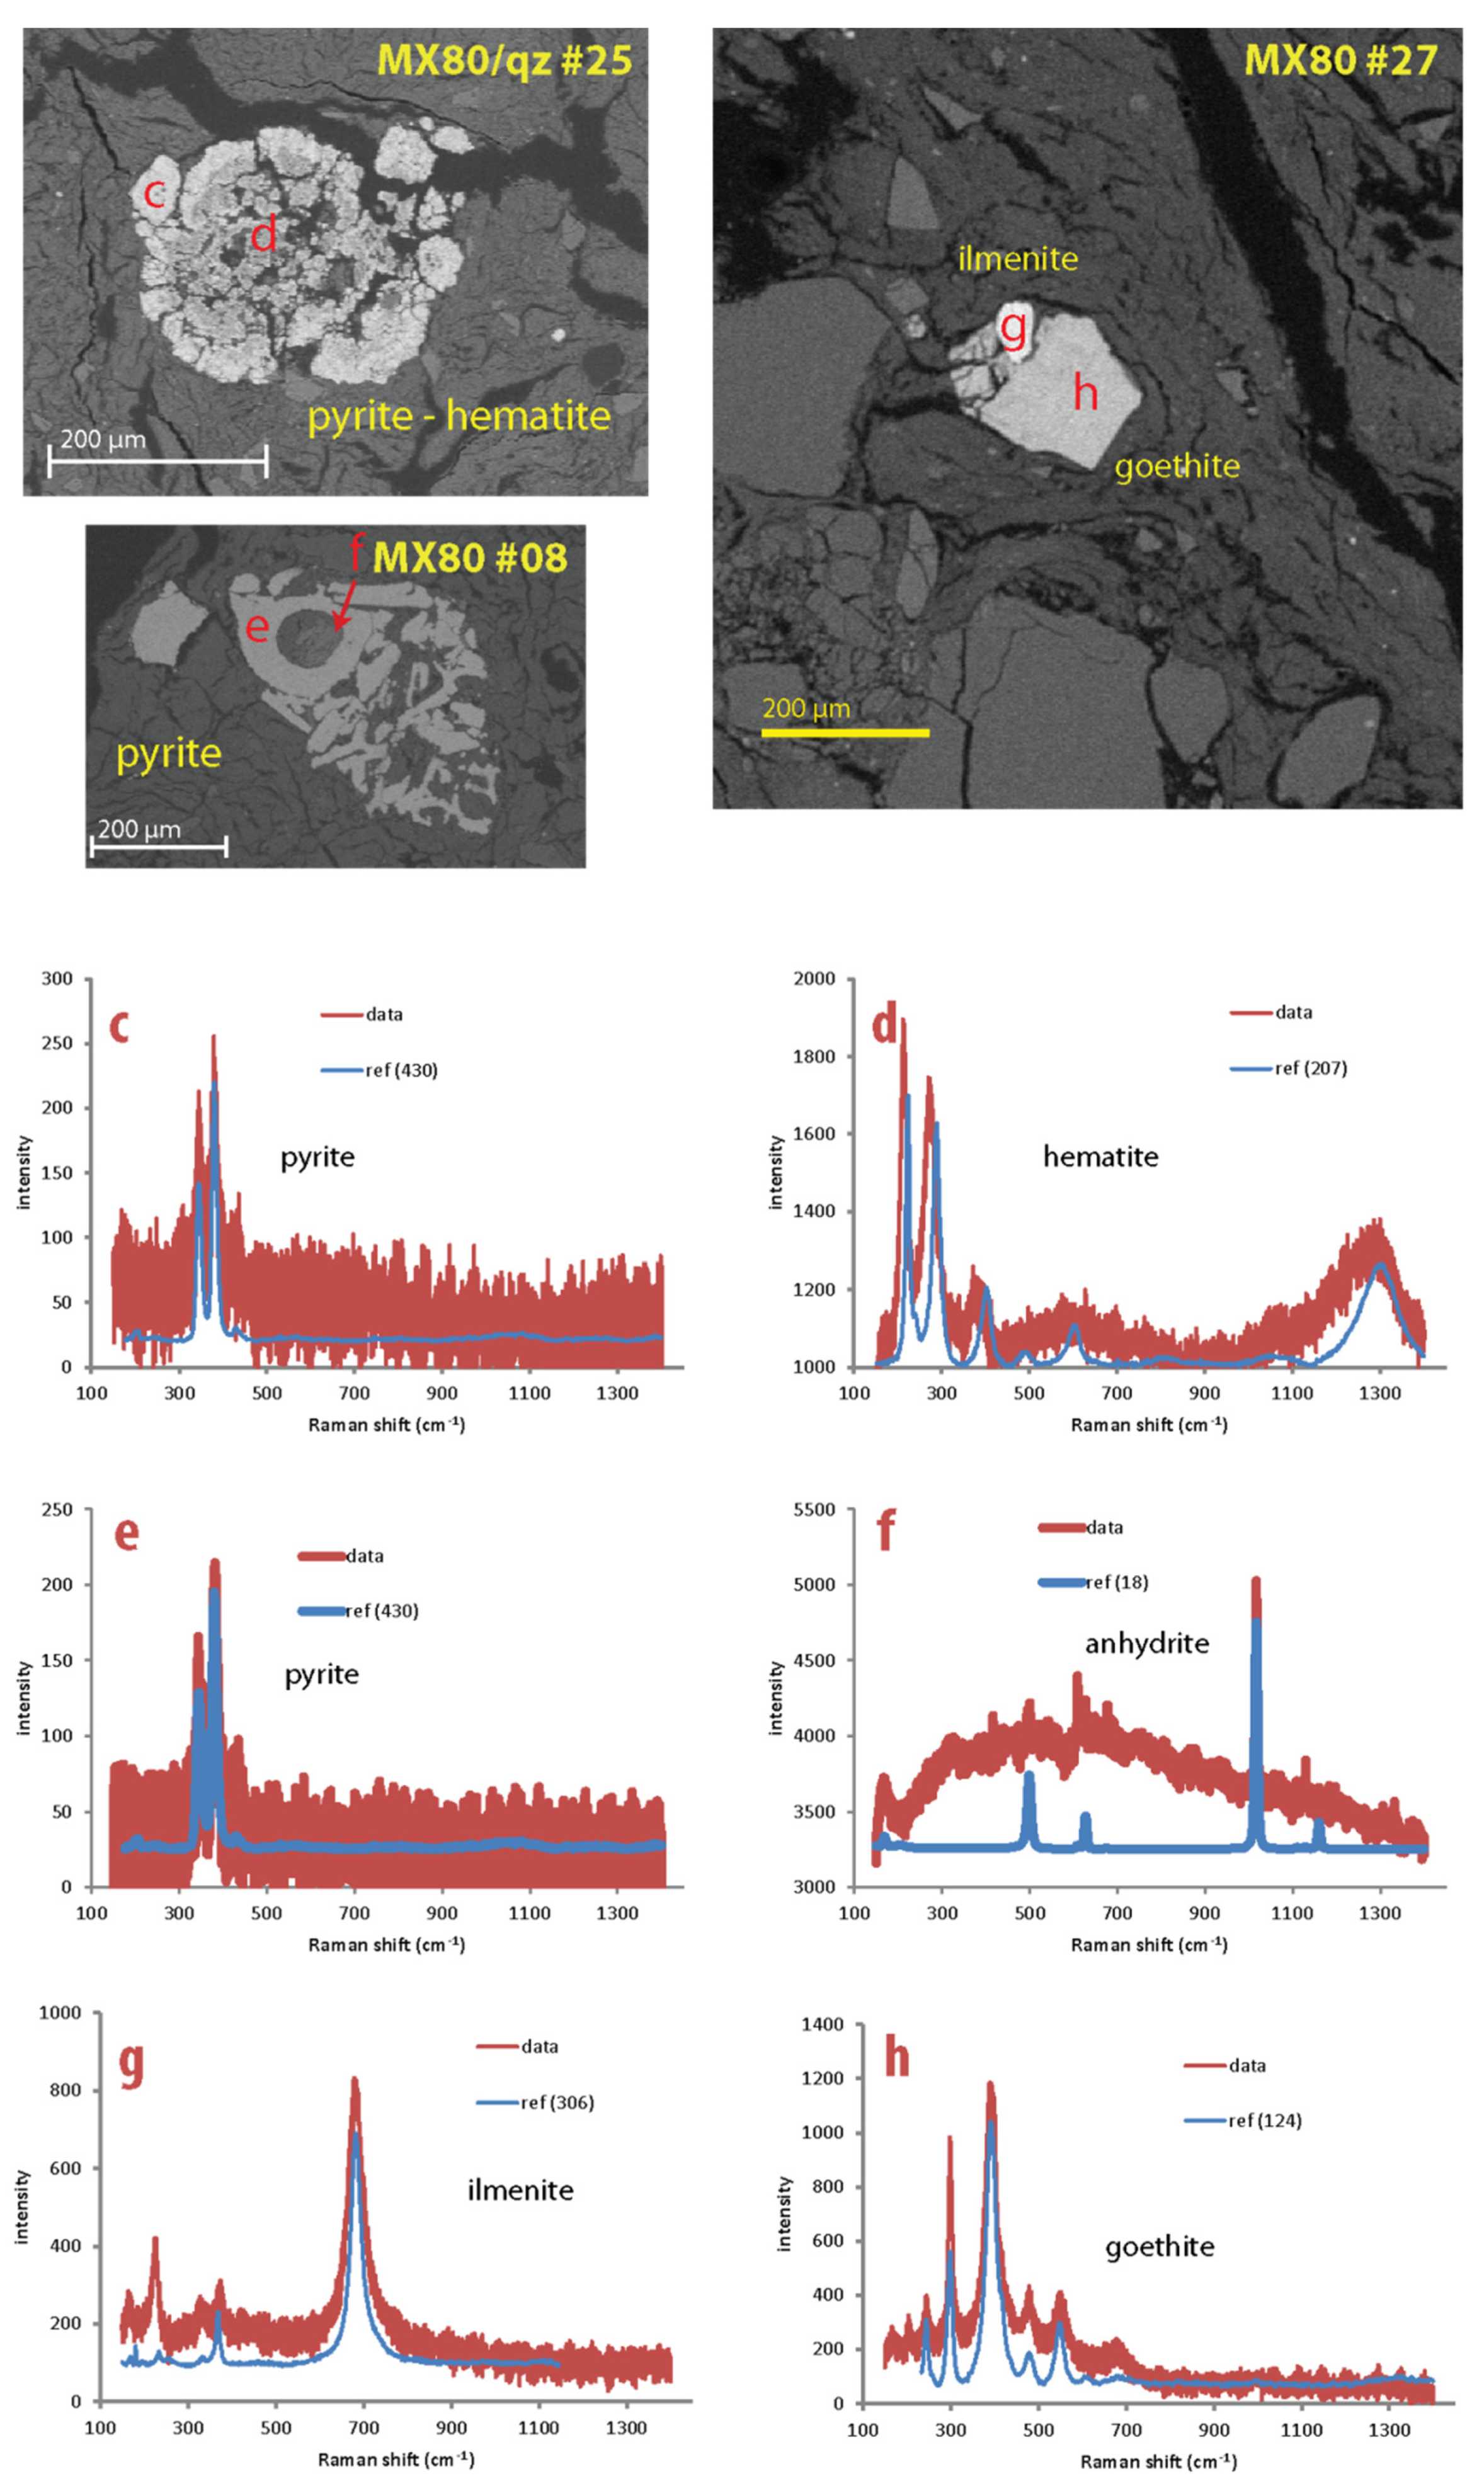
3.3.1. Pre-Existing Iron Mineral Phases

The goal here was to determine the mineral phases both in the raw materials and the bulk samples, which were located far from the metal source in order to facilitate the interpretation of the “interface” samples affected by corrosion phenomena. It should be highlighted that the main iron pool is structural Fe in the smectite except in case of the high Fe Rokle sample.
MX-80: Bulk samples from blocks #08, 25 and #27 revealed pyrite, ilmenite and to a lesser extent Fe(III) oxides as accessory minerals according to combined SEM/EDX and µ-Raman spectroscopy (Figure 6). The grain size distribution is broad, ranging from µm to mm scale.
From XRD diffractograms (full data in Supplementary Materials S3) pyrite, goethite and hematite could be identified (Table 1), thus partly supporting data from µ-Raman.
XRF analyses of the raw sample and the bulk ABM sample do not show difference in Fe content (Supplementary Materials S3). From the Mössbauer spectrometry data obtained at room temperature (Figure 7) (full data in Supplementary Materials S4), only the octahedral structural iron in the clay could be identified in the MX-80 raw and the bulk sample (distant from the heater with no interaction with Fe) from block #08. This indicates that the contents of accessories identified by SEM/EDX, µ-Raman and XRD are too low to be captured by Mössbauer spectrometry. Imposing the presence of pyrite in the fitting procedure did not lead to an improvement of the fits. The two MX-80 samples show reduction levels of 18% and 26% for the raw sample and bulk sample of block #08, respectively. The same difference between raw and bulk sample was observed for the MX-80/quartz block #25. The presence of structural Fe(II) at such levels is not uncommon for MX-80 [38,39]. The reason for the difference in reduction levels between the two samples is not clear, but may be due to the natural variation in the samples.
Ibecoseal: This material contains various Fe accessory minerals which could be identified by combined SEM/EDX and µ-Raman (Supplementary Materials S2). Most phases occur as small aggregates (<10 µm) unevenly distributed in the matrix. According to EDX mapping combined with µ-Raman, marcasite appears to be the main Fe-bearing accessory phase, followed by mixtures of magnetite with either goethite or hematite. The latter two minerals form coatings around magnetite grains. This suggests an oxidative alteration process related to the original feature of the Ibecoseal bentonite.
From XRD diffractograms (Supplementary Materials S3) marcasite and hematite (but not goethite) can be deduced from their main reflection, confirming SEM/μ-Raman data.
The bulk sample of block #11 exhibits a slightly higher Fe content (by 8%) than the reference sample (Table 2). From Mössbauer spectrometry data obtained at room temperature and 77 K (S4), the reference sample only contains structural Fe while the bulk sample also contains some hematite and goethite (together ~9%). This would be consistent with the Fetot increase, but SEM/EDX and µ-Raman analysis suggests that not all of Fe(III) oxides determined in the bulk sample are additional phases. The reduction level of the raw sample is about 31%, thus higher than that of MX-80. This may be attributed to the larger amount of illite/mica in Ibecoseal as suggested from the XRD data (Figure S3). The reduction level of the bulk sample is 34%, in the same range as the reference sample.
Ikosorb: This bentonite has the lowest amount of Fe-bearing accessory minerals of all the studied bentonites as indicated from SEM/EDX, µ-Raman and XRD and XRF analysis (Supplementary Materials S1–S3). Note that because of the limited amount of material no Mössbauer analysis was conducted. Rare large grains (~mm range) of sulphide (marcasite altered from pyrite) and smaller amounts of Fe oxides (probably goethite according to its appearance) were identified.
Kunigel: This bentonite has the lowest Fe content (1.4 wt %) of all studied materials with a significant fraction of pyrite. The pyrite pool is estimated to represent ~20% of the total Fe based on the Fe/S proportion from SEM/EDX maps and XRF (Figures S1 and S3). Pyrite grain sizes are <50 µm in diameter and appear to be homogeneously distributed in the clay matrix. Some rare small grains of goethite were observed. Due to the limited sample amounts no Mössbauer and XRD analyses were carried out.
Rokle: This is the bentonite with the highest Fe content (12 wt %) of all studied materials. A large proportion (~50%) of Fe is contained in Fe(III) oxides (mainly goethite) (Figure S2(9,10)) which display a large grain size distribution (µm–mm scale) and a heterogeneous distribution in the clay material.
Deponit: The main accessory Fe-bearing mineral observed was pyrite which was estimated to constitute up to 19% of the total Fe from EDX profiles and XRF data (Figures S1 and S3). Occasionally, small grains of goethite were found by SEM (Figure S2(11,12). These findings are supported by XRD and Mössbauer data (Figures S3 and S4), the latter indicating that the pyrite fraction represents at most 20% of total Fe.
Summary: From the ensemble of the multi-method data the relative amounts of the different Fe-bearing phases were estimated (Table 2). The major Fe fraction consists of structural Fe in the smectite in all bentonite materials except Rokle where the main fraction is goethite. All samples contain Fe oxyhydroxides (mainly goethite) and pyrite.

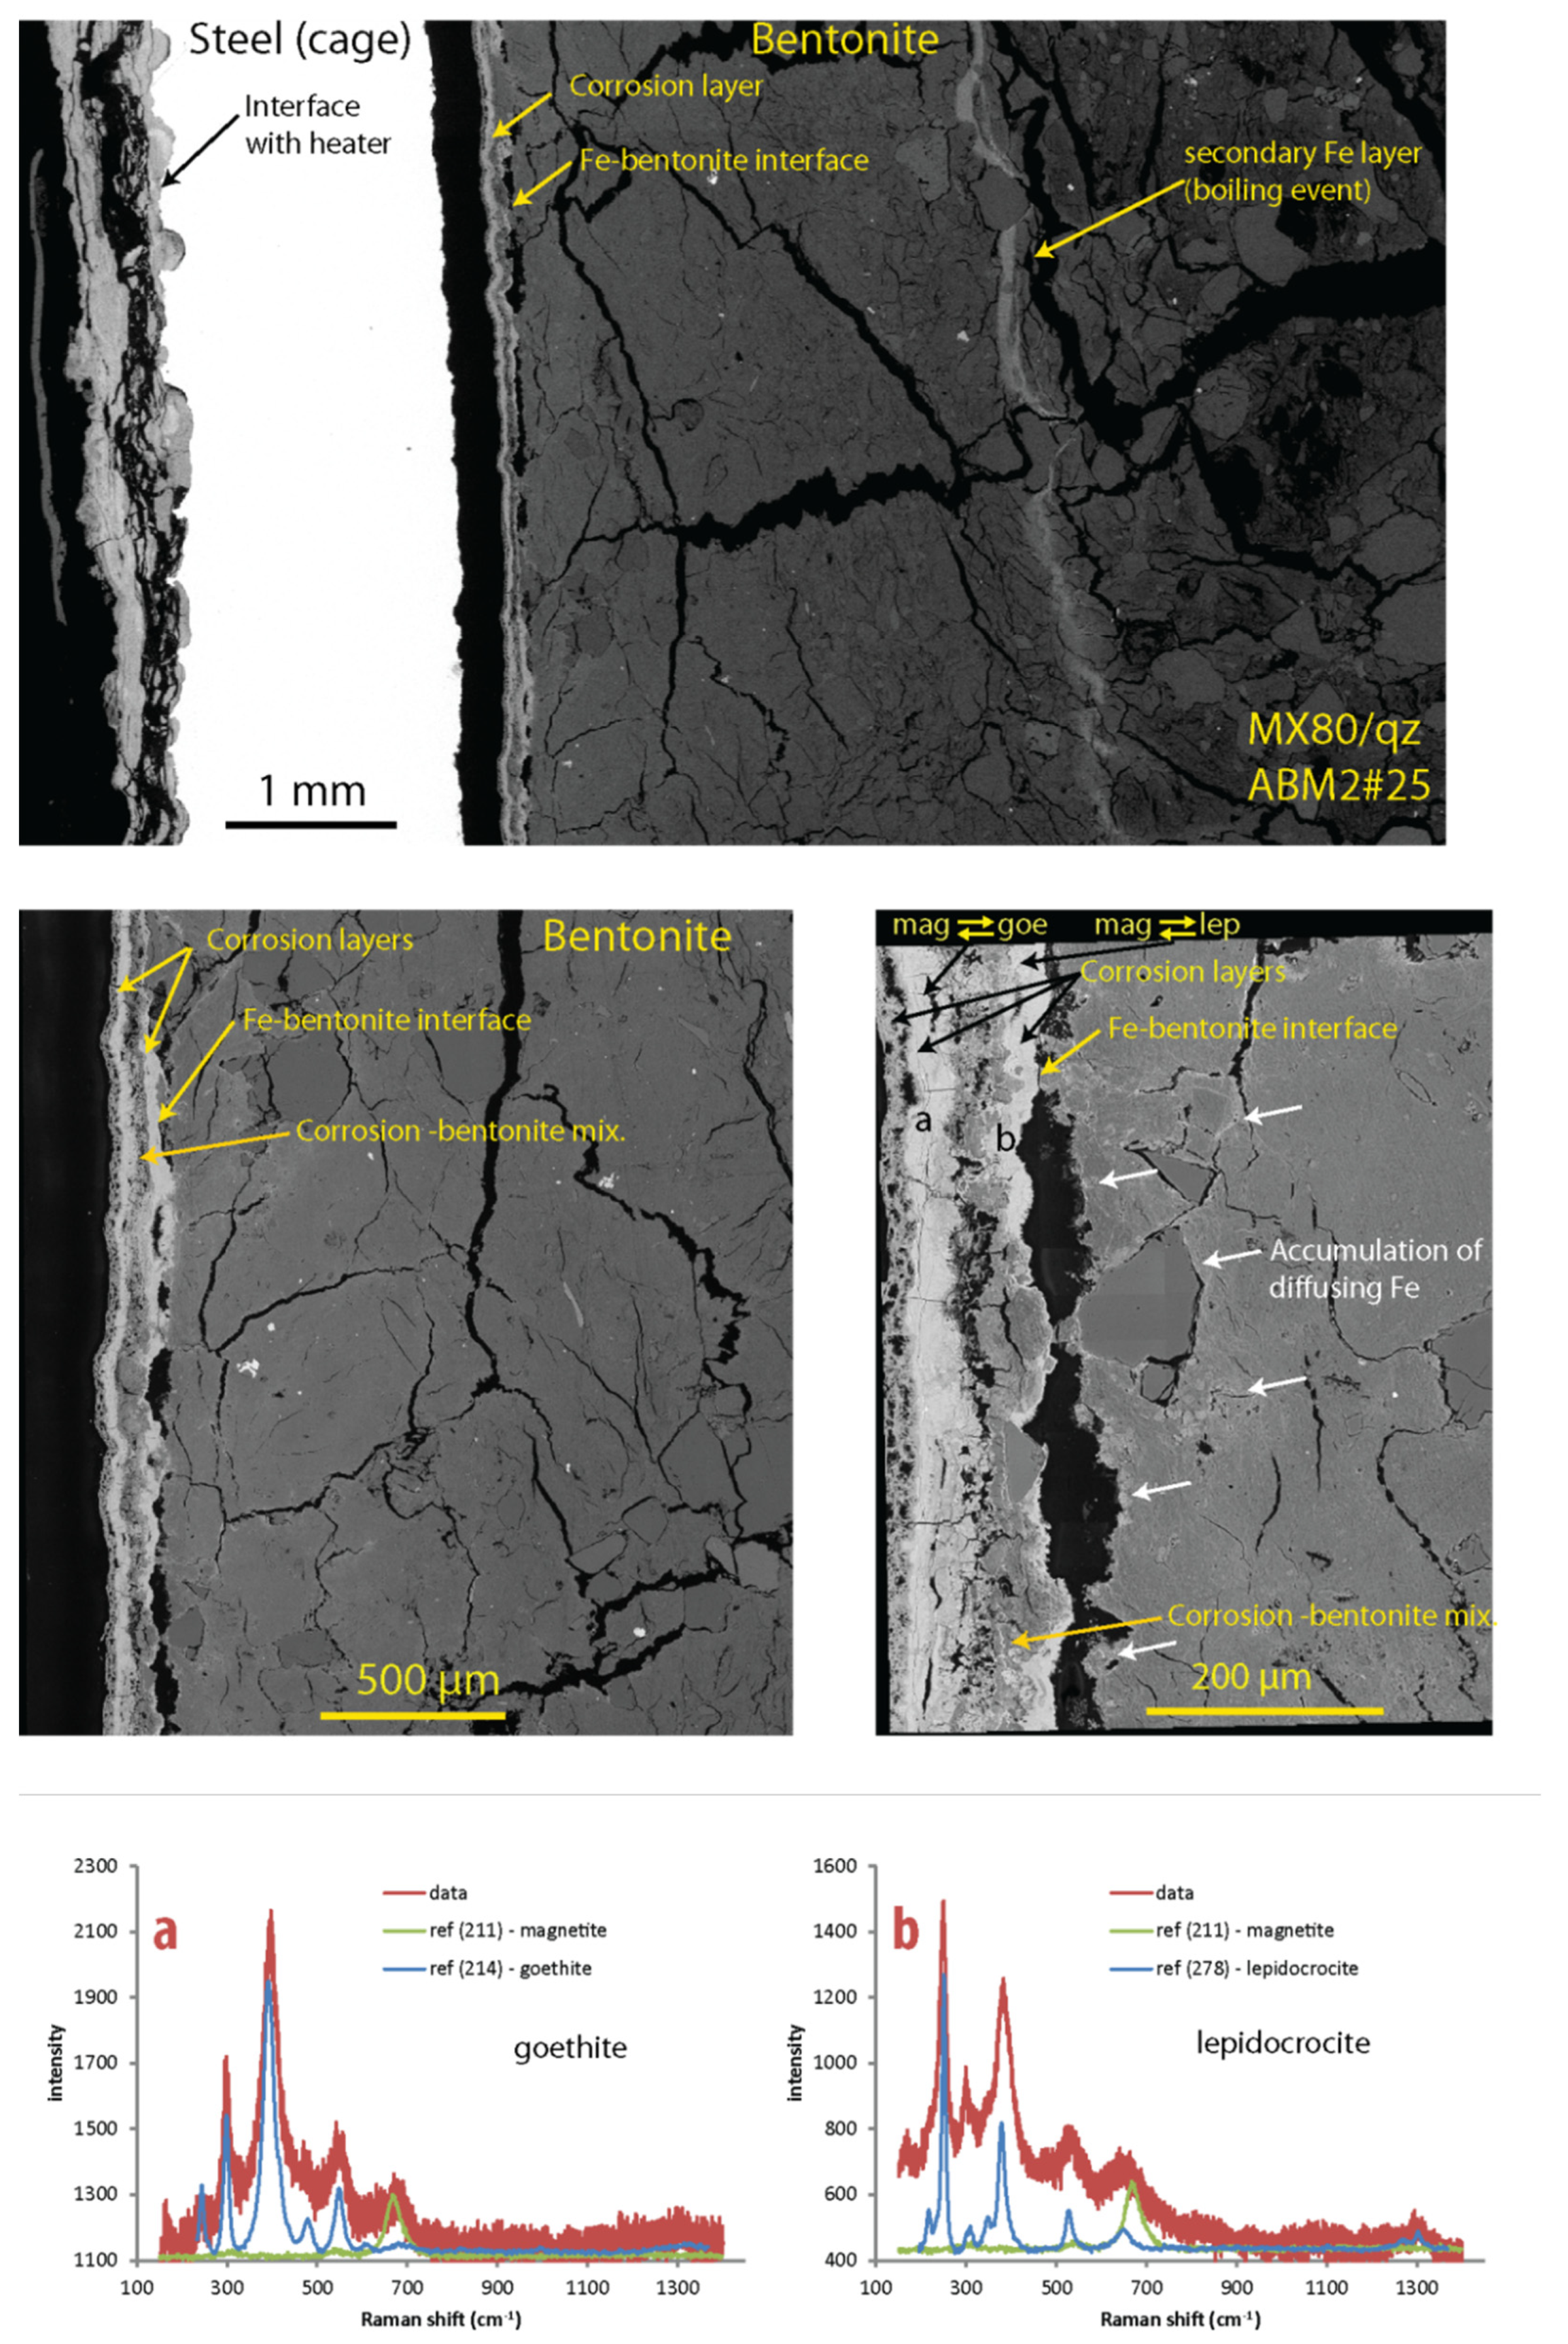
3.3.2. Newly Formed Iron Mineral Phases

The identification of neo-formed Fe phases in the contact zone is not straightforward in view of (i) inherent limitations of the applied analytical methods, (ii) the (at least potentially) microcrystalline character of the precipitates (e.g., Fe hydroxides) [15,20] and (iii) the mechanically disturbed contact zone with very limited amounts of sample material. Nevertheless, valuable information could be obtained from combined Mössbauer-XRF analysis on powdered bulk samples, which was complemented by SEM/µ-Raman analysis on polished samples from the caged blocks.
The well-defined contact areas of the cage frames of blocks #08, #25 and #27 were selected for detailed analysis of iron-bearing phases. The SEM backscatter images and μ-Raman spectra are shown in Figure 8. All interfaces exhibit a similar layered structure: an inner compact layer (50–100 μm) with magnetite and goethite and an outer mechanically disturbed zone (100–500 μm) of a mixture of corrosion products (goethite, lepidocrocite and magnetite) and clay aggregates (Figure 8). The proportion of ferric (oxyhydr)oxides (mainly goethite) increases towards the clay in parallel with the decrease of magnetite. In the case of block #08, siderite crystals were identified in fractures in the outer part of the corrosion layer (Supplementary Materials S2).
Further information was obtained from Mössbauer spectrometry in combination with XRF on powdered samples of clay adjacent to the corrosion layer from blocks #08 (MX-80), #11 (Ibecoseal), #12 (Ikosorb), #25 (MX-80/qz), #26 (Deponit) and #27 (MX-80) Table 2).
The Fe enrichment in the samples closest to the interface of blocks #8, #11, #27 and, to a lesser extent, also #26 parallels the increase in paramagnetic Fe3+ leading to lower reduction levels compared to the raw and bulk samples. According to the Mössbauer data, the increase in Fe3+ is mainly related to goethite precipitation at the interface and some hematite precipitation identified in blocks #11, #12 and #25. It is important to note that, despite the lower reduction levels, Fe2+ content is also increased in the contact zone, which can be attributed to reduced structural Fe in the smectite fraction. In the case of the contact samples from blocks #12 and #25, Fe enrichment is accompanied by a similar increase in paramagnetic Fe3+ and Fe2+, thus no net change in reduction level. The corresponding Mössbauer spectra in these two samples could be reproduced by assuming the additional presence of goethite and of structural Fe2+ in equal amounts.
Further away from the contact, where the Fe content is still above that of the bulk material, the reduction level increases relative to the sample(s) closer to the contact, as indicated for the samples of blocks #11, #12, #25 and #26. This suggests a higher proportion of Fe2+ compared to the immediate contact area. In the case of block #25, this trend is very weak. In the case of block #26, the “blue” sample exhibits a slight increase of Fe compared to the bulk and an even higher reduction level, thus a higher proportion of Fe2+ compared to the other corresponding samples from blocks #08, #11.

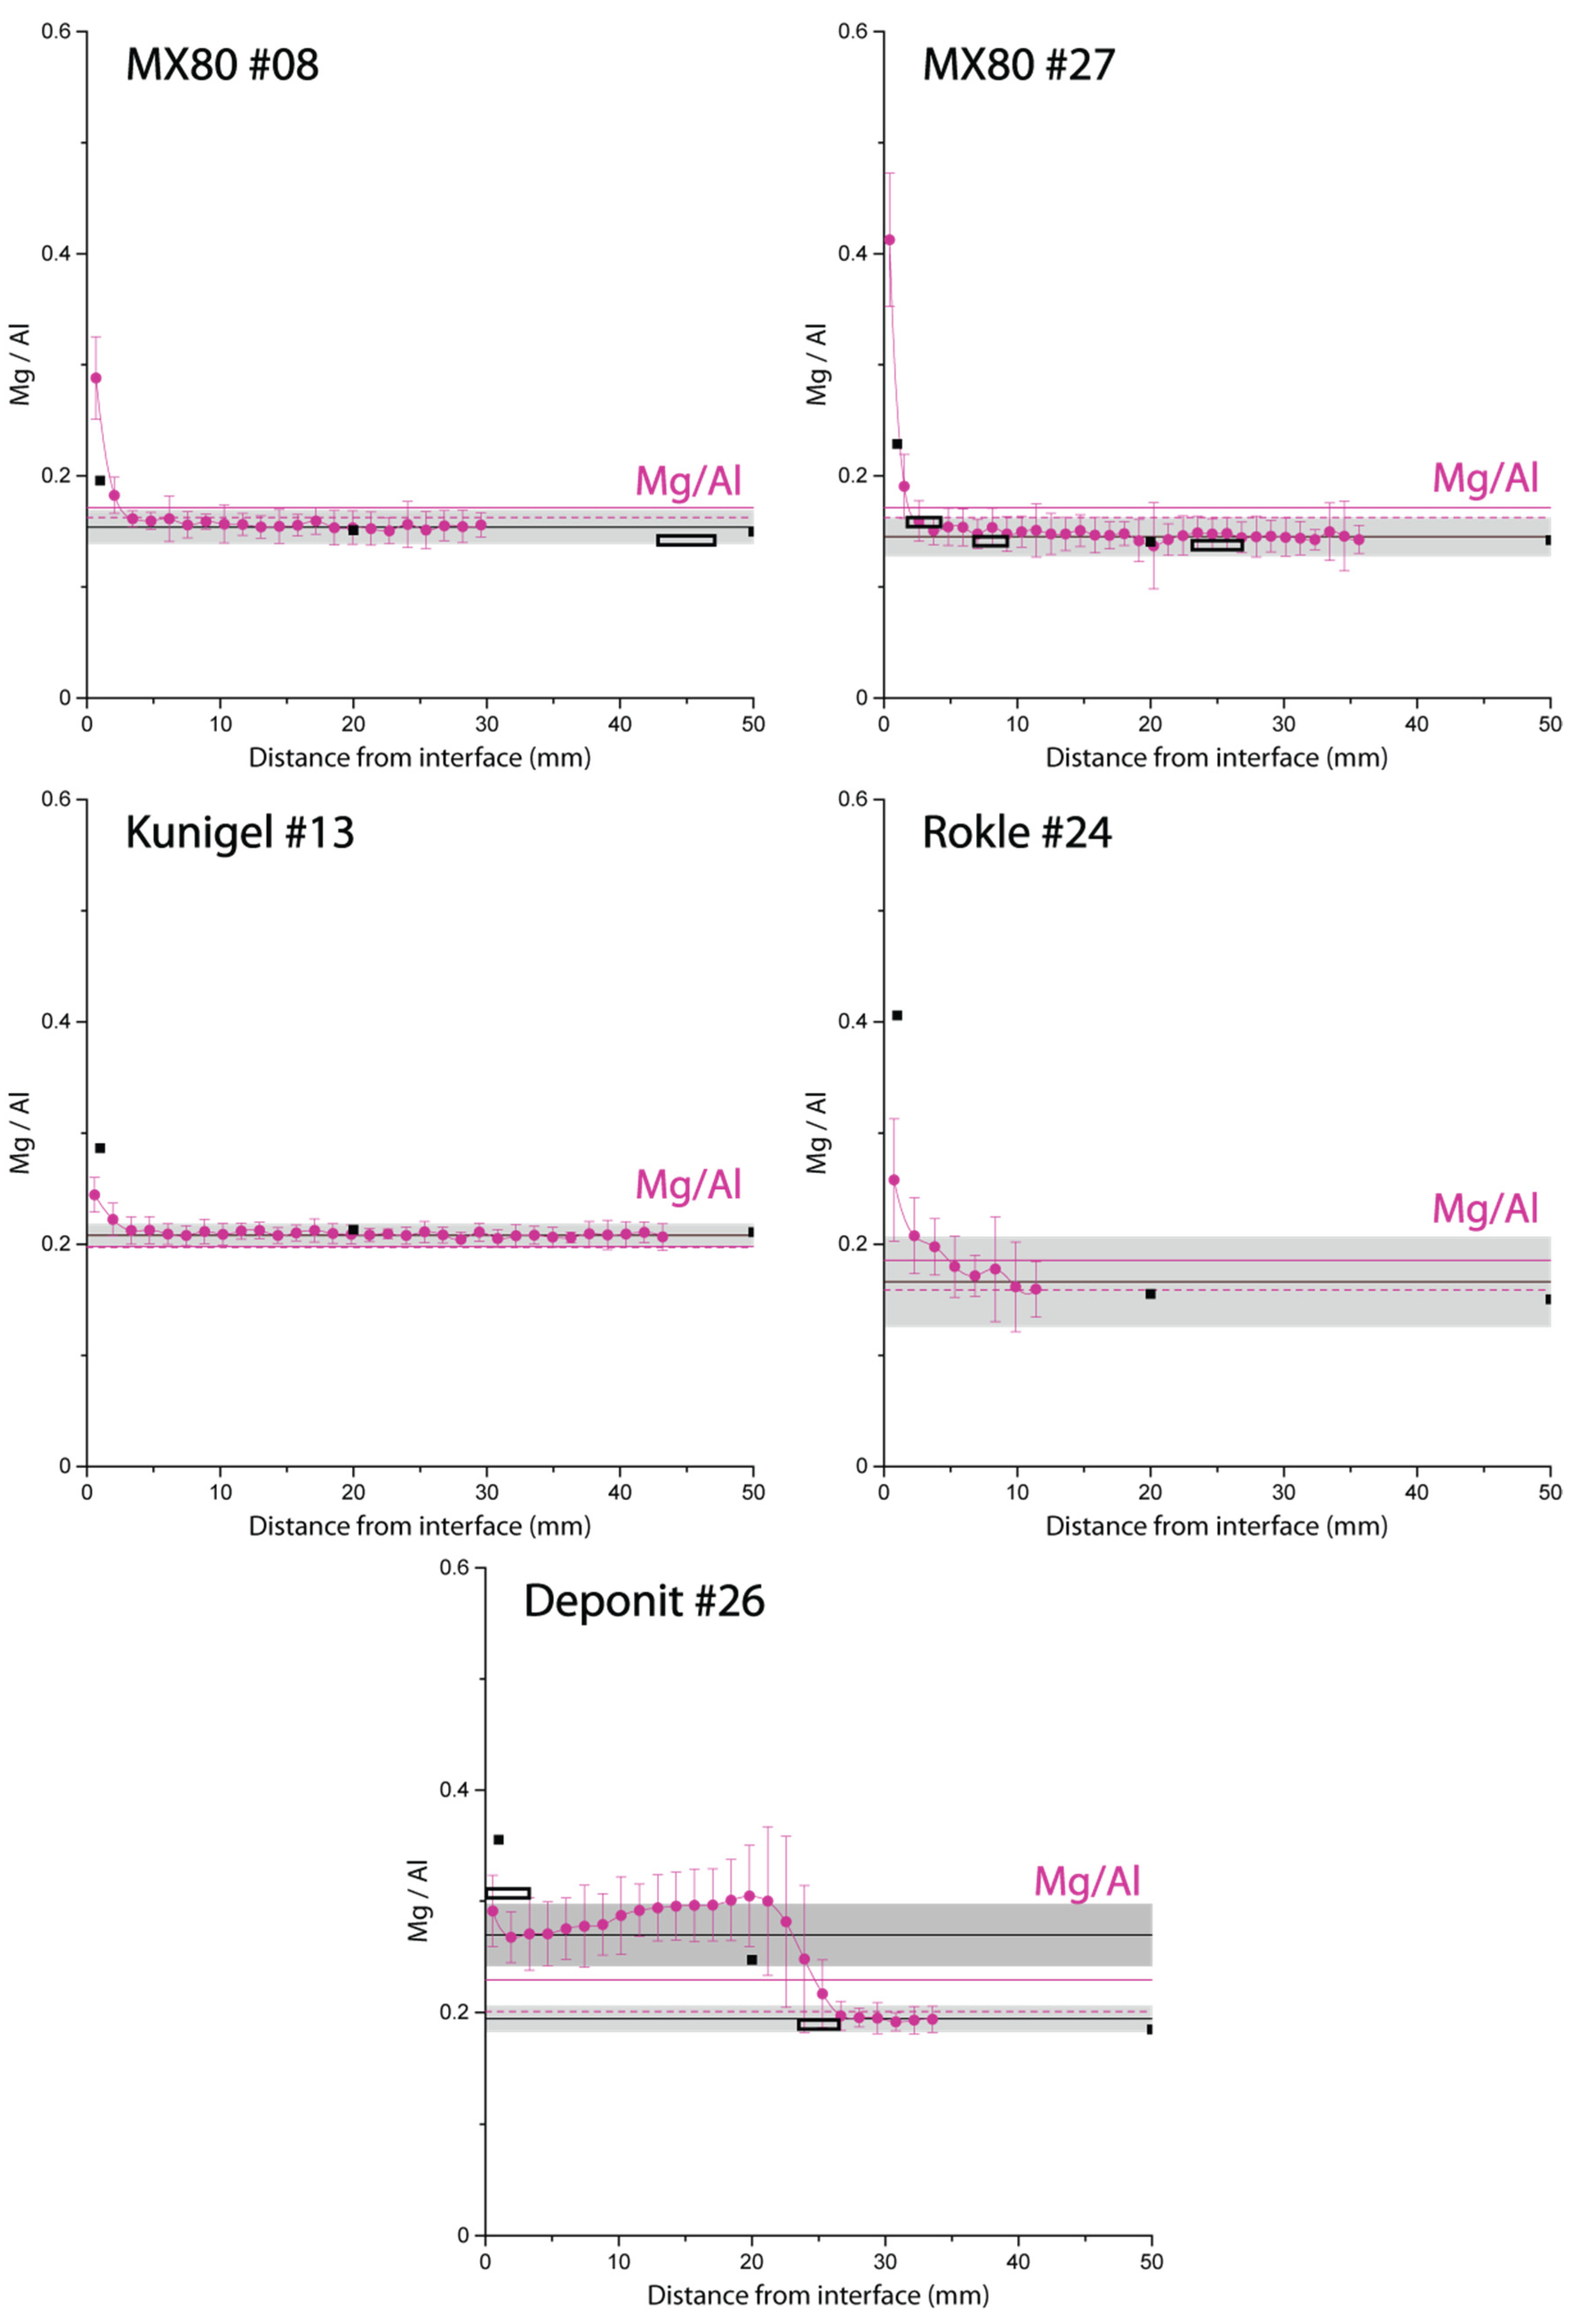
3.4. Profiles of Mg, Ca and S

All samples show an accumulation of Mg in the clay in the first mm from the interface, as illustrated by the increase in the Mg/Al ratio (Figure 9). Thus, the Mg/Al ratio increases by a factor of 1.4–2.5 relative to the background level. The amount of Mg is higher in the upper part, indicated for example in the granular MX-80 blocks (Figure 9). In the case of block #26, (Deponit), the Mg accumulation extends over >20 mm. In this zone, magnesium sulphates were identified by SEM/EDX besides accumulations of gypsum/anhydrite (Figure 10) (see below). This is where the centre of the boiling event is suspected.
Although the Fe content is also increased at the interface, there is no clear correlation between the Fe and Mg profiles. The latter generally exhibit a narrower accumulation front and a “monophasic” shape. An exception is the Deponit block which displays a large front, but a comparatively moderate maximum increase in the Mg/Al ratio. The different shapes and extents indicate that different processes control the profiles of Fe and Mg. While the Fe distribution is obviously related to the corrosion of the adjacent steel, the Mg distribution is related to internal processes and the large temperature gradient in the clay. The distribution of exchangeable cations was clearly affected during the experiment as shown by [24]. Notably, these authors identified a general depletion of exchangeable Mg in the bentonite blocks in parallel with the enrichment close to the heater. This loss was more notable in the upper part which was interpreted as being possibly related to the boiling event.
EDX profiles of Ca and S illustrate the significant accumulation of CaSO4 in the upper part (Figure 10), confirming the macroscopic observations, XRD and μ-Raman spectroscopy data which indicated the neo-formation of anhydrite close to the contact, especially in pre-existing voids (e.g., Figure S2(2)). In the lower part, neo-formation of CaSO4 close to the contact also occurred, but in much smaller amounts.

4. Discussion

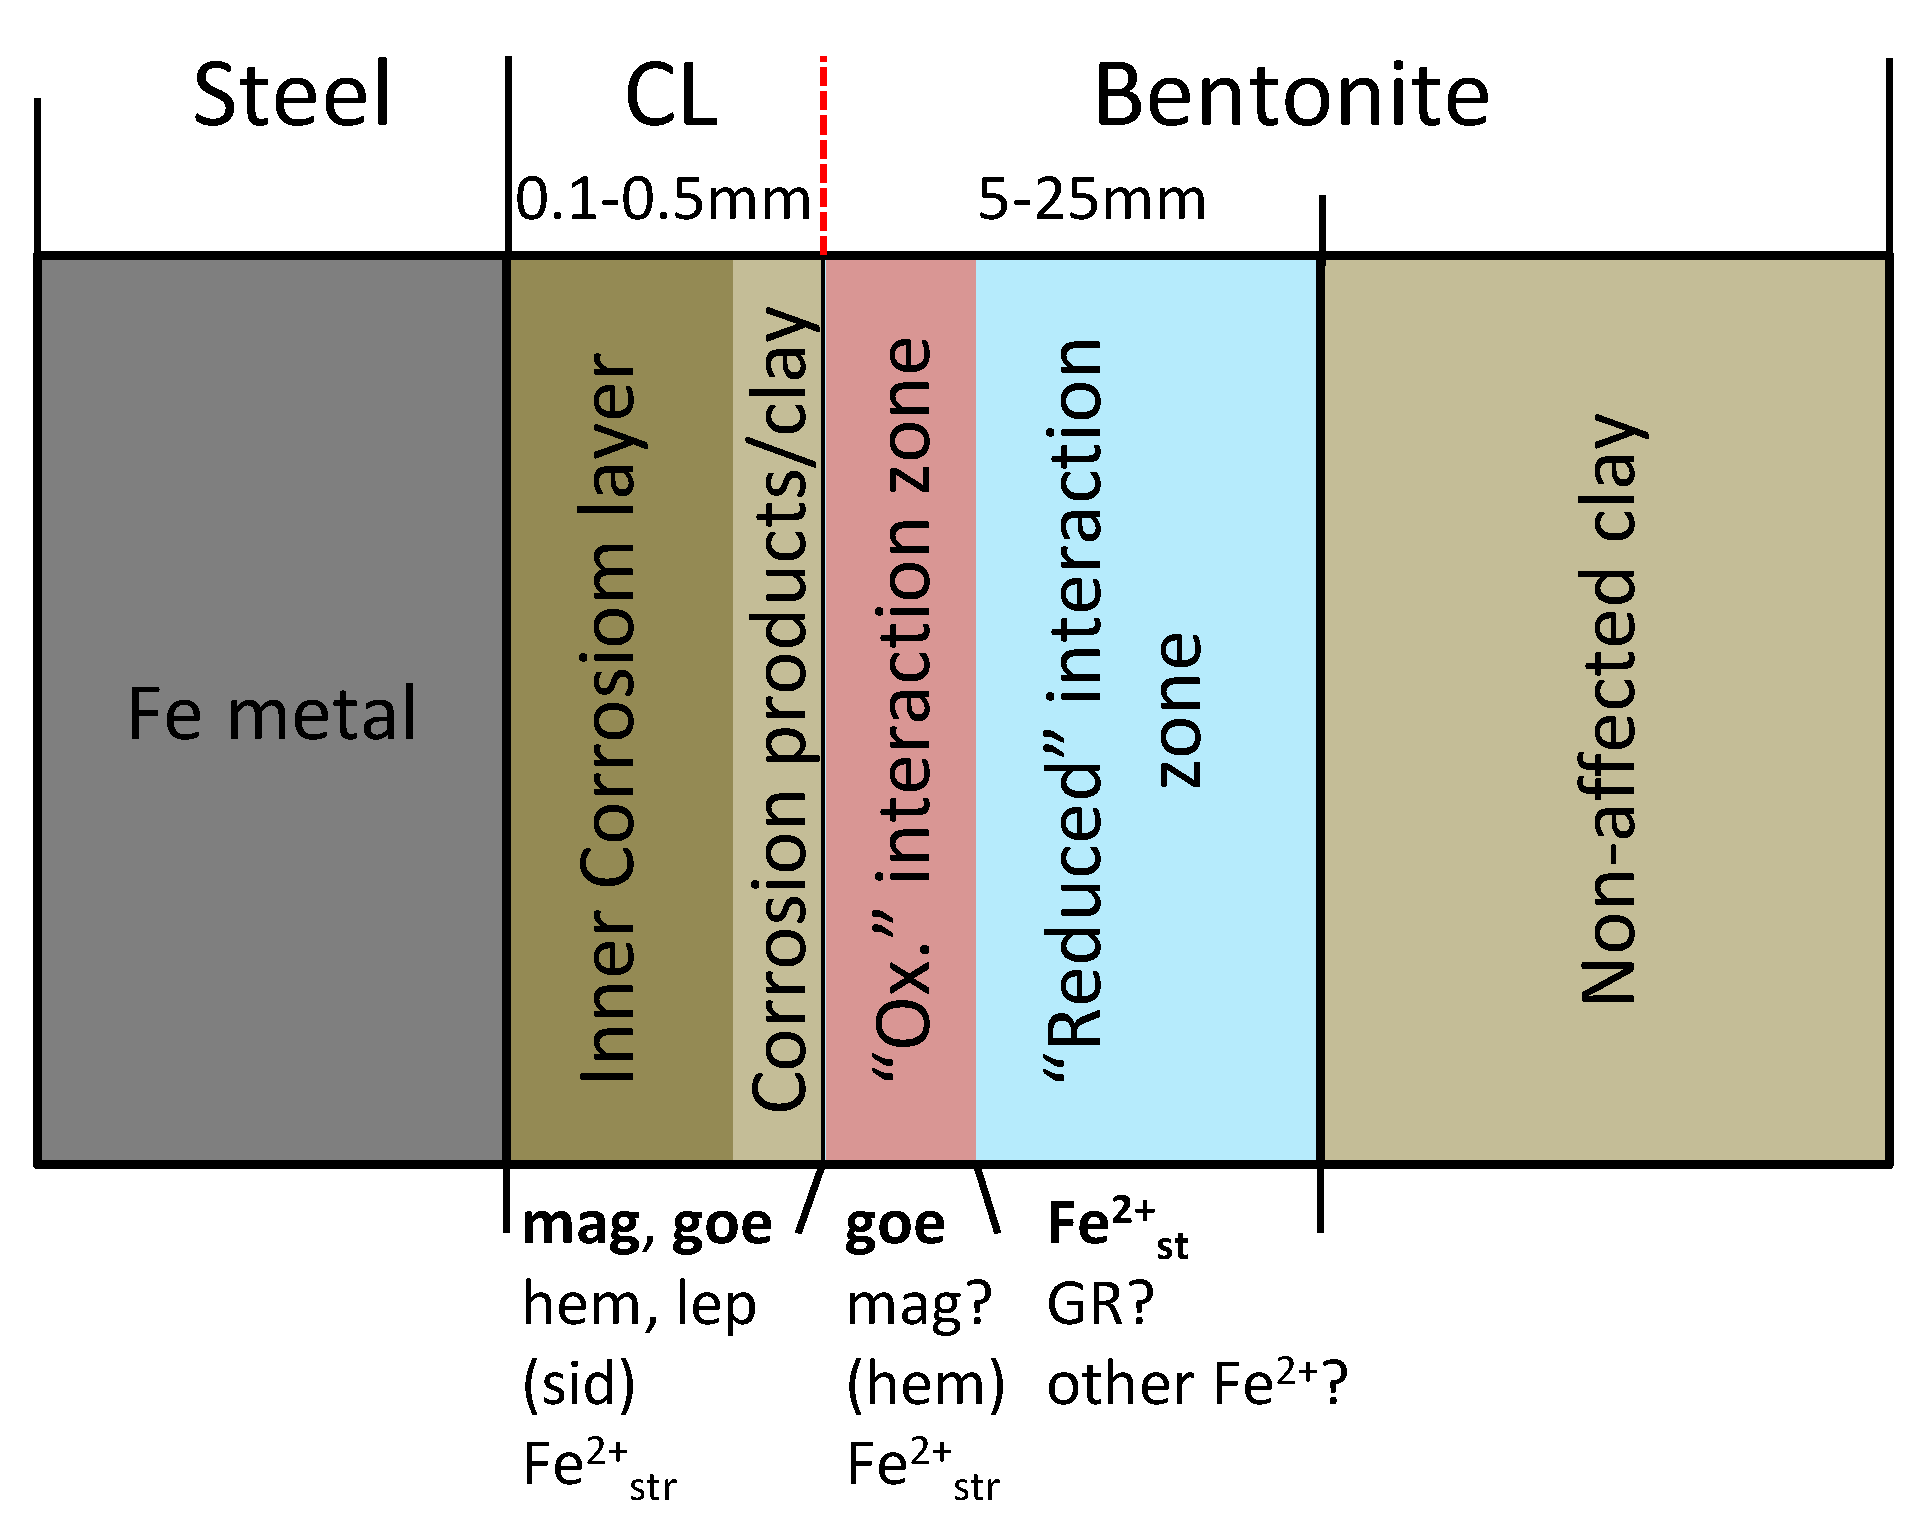
4.1. Corrosion Layer and Fe-Clay Interaction Zone

The microscopic and spectroscopic data yield a consistent picture with regards to the structure and the mineralogical patterns in the metal-clay interface area. The steel surface is covered by a corrosion layer (up to several hundreds of µm) consisting of magnetite, goethite, lepidocrocite and, at least partly, of siderite. Note that siderite was also identified in other samples from MX80 blocks #08, #17, #30 and #31 with differential thermal analysis-mass spectrometry by [22]. The corrosion layer is affected to a variable degree by mechanical disturbances resulting in an outer sublayer of corrosion products mixed with clay material. The corrosion layer was not included in the Fe/Al profiles, which aim at the characterisation of Fe migration in the clay matrix. The same corrosion layer features, although less pronounced, were observed in the ABM1 package which was exposed to similar conditions for a shorter period [20]. An analogous pattern at the Fe-bentonite interface was described for the FEBEX in situ experiment at the Grimsel Test Site [13,15]. The layered structure of the interface area is schematically illustrated in Figure 11.
The presence and spatial distribution of neo-formed magnetite and siderite besides ferric (oxyhydr)oxides (goethite, hematite, lepidocrocite) in the corrosion layer indicates that redox conditions shifted from oxidising to reducing during the experiment. The increase in the proportion of magnetite relative to ferric (oxyhydr)oxides towards the metal surface suggests that reducing conditions started at the metal contact. It should be noted that magnetite was likely present in the original thin corrosion layer, which was at least partly oxidised to ferric (oxyhydr)oxide during initial the aerobic phase [40]. Moreover, partial oxidation of reduced iron phases during dismantling and sampling cannot be ruled out.
The iron accumulation at the interface on the clay side, which is visible in some areas as reddish crust, consists predominantly of Fe(III) oxides (mainly goethite, less hematite) as deduced from Mössbauer spectrometry. An increase of paramagnetic Fe2+ was also identified by this method which was interpreted as structural Fe2+ of the clay. The presence of neo-formed magnetite in the Fe-enriched clay could not be confirmed, but its presence in small quantities cannot be ruled out on the basis of Mössbauer spectrometry. It is noteworthy that the identification of newly formed Fe oxides by μ-Raman in polished samples is difficult due to the high background fluorescence of the clay matrix. The Fe front extending further into the clay (further than about 10 mm from contact), is characterised by a higher reduction level compared to the contact zone according to Mössbauer spectrometry, such as indicated from samples of blocks #12 and #26).
The additional Fe3+ originates mainly from goethite, but the nature of neo-formed Fe(II) phases is uncertain. The diffusion of soluble Fe2+ released from the corrosion layer may undergo different pathways in smectites according to previous studies. Fe2+, may sorb to edge sites of the montmorillonite surface or sorb via cation exchange in the interlayers [41,42]. Simultaneously, redox reactions with structural Fe may occur. This could lead to the reduction of structural Fe3+ and precipitation of Fe(III) oxide or mixed Fe(II)/Fe(III) oxide (green rust) phases [7]. The reduction of structural Fe is confirmed by Mössbauer spectrometry, but no other neo-formed Fe(II) could be identified. This reduction process appears to be most extreme for block #26 (Deponit), where a blue zone reaches far into the clay (~30 mm). In this zone, the reduction level is 30% compared to 12% in the reference sample. It should be noted that in this area the centre of the boiling event is suspected (see above) which may have enhanced the corrosion and Fe-bentonite interaction process.
No indications of montmorillonite alteration other than partial reduction of structural Fe were found. Thus, no neo-formed non-swelling clay phases, such as Fe-rich 1:1 clay minerals (e.g., berthierine, cronstedite) or chlorite minerals [14,43] could not be detected. The absence of notable amounts of such phases is supported by the constant Al/Si ratio (EDX) perpendicular to the Fe/clay contact evidenced by all samples (Supplementary Materials S1). It should be noted that Svensson (2015) identified neo-formed Fe saponite at the direct contact Fe/clay contact by XRD analysis in another ABM2 block (#9) consisting of FEBEX bentonite. The presence of saponite was partly confirmed by XRD and IR analysis by [22]. In our study, no saponite at the Fe/clay interface was detected with the applied methods; its presence in minor amounts, however, cannot be ruled out.
A comparison of the granular MX-80 block in ABM1 [20] with the corresponding one in ABM2 (block #08) reveals a very similar Fe front in both bentonite materials. This suggests on the one hand that the same Fe diffusion and Fe-bentonite interaction processes were active. On the other hand, it suggests very slow further migration of the front in ABM2 which lasted about twice as long as ABM1.
Similar relationships regarding the iron speciation in the bentonite affected by iron corrosion were also deduced from the studied profile in the FEBEX experiment [15]. The Fe front, however, was larger (>140 mm) which was explained by the longer duration of this experiment (18 years) and, in particular, by the longer duration of oxidising conditions.

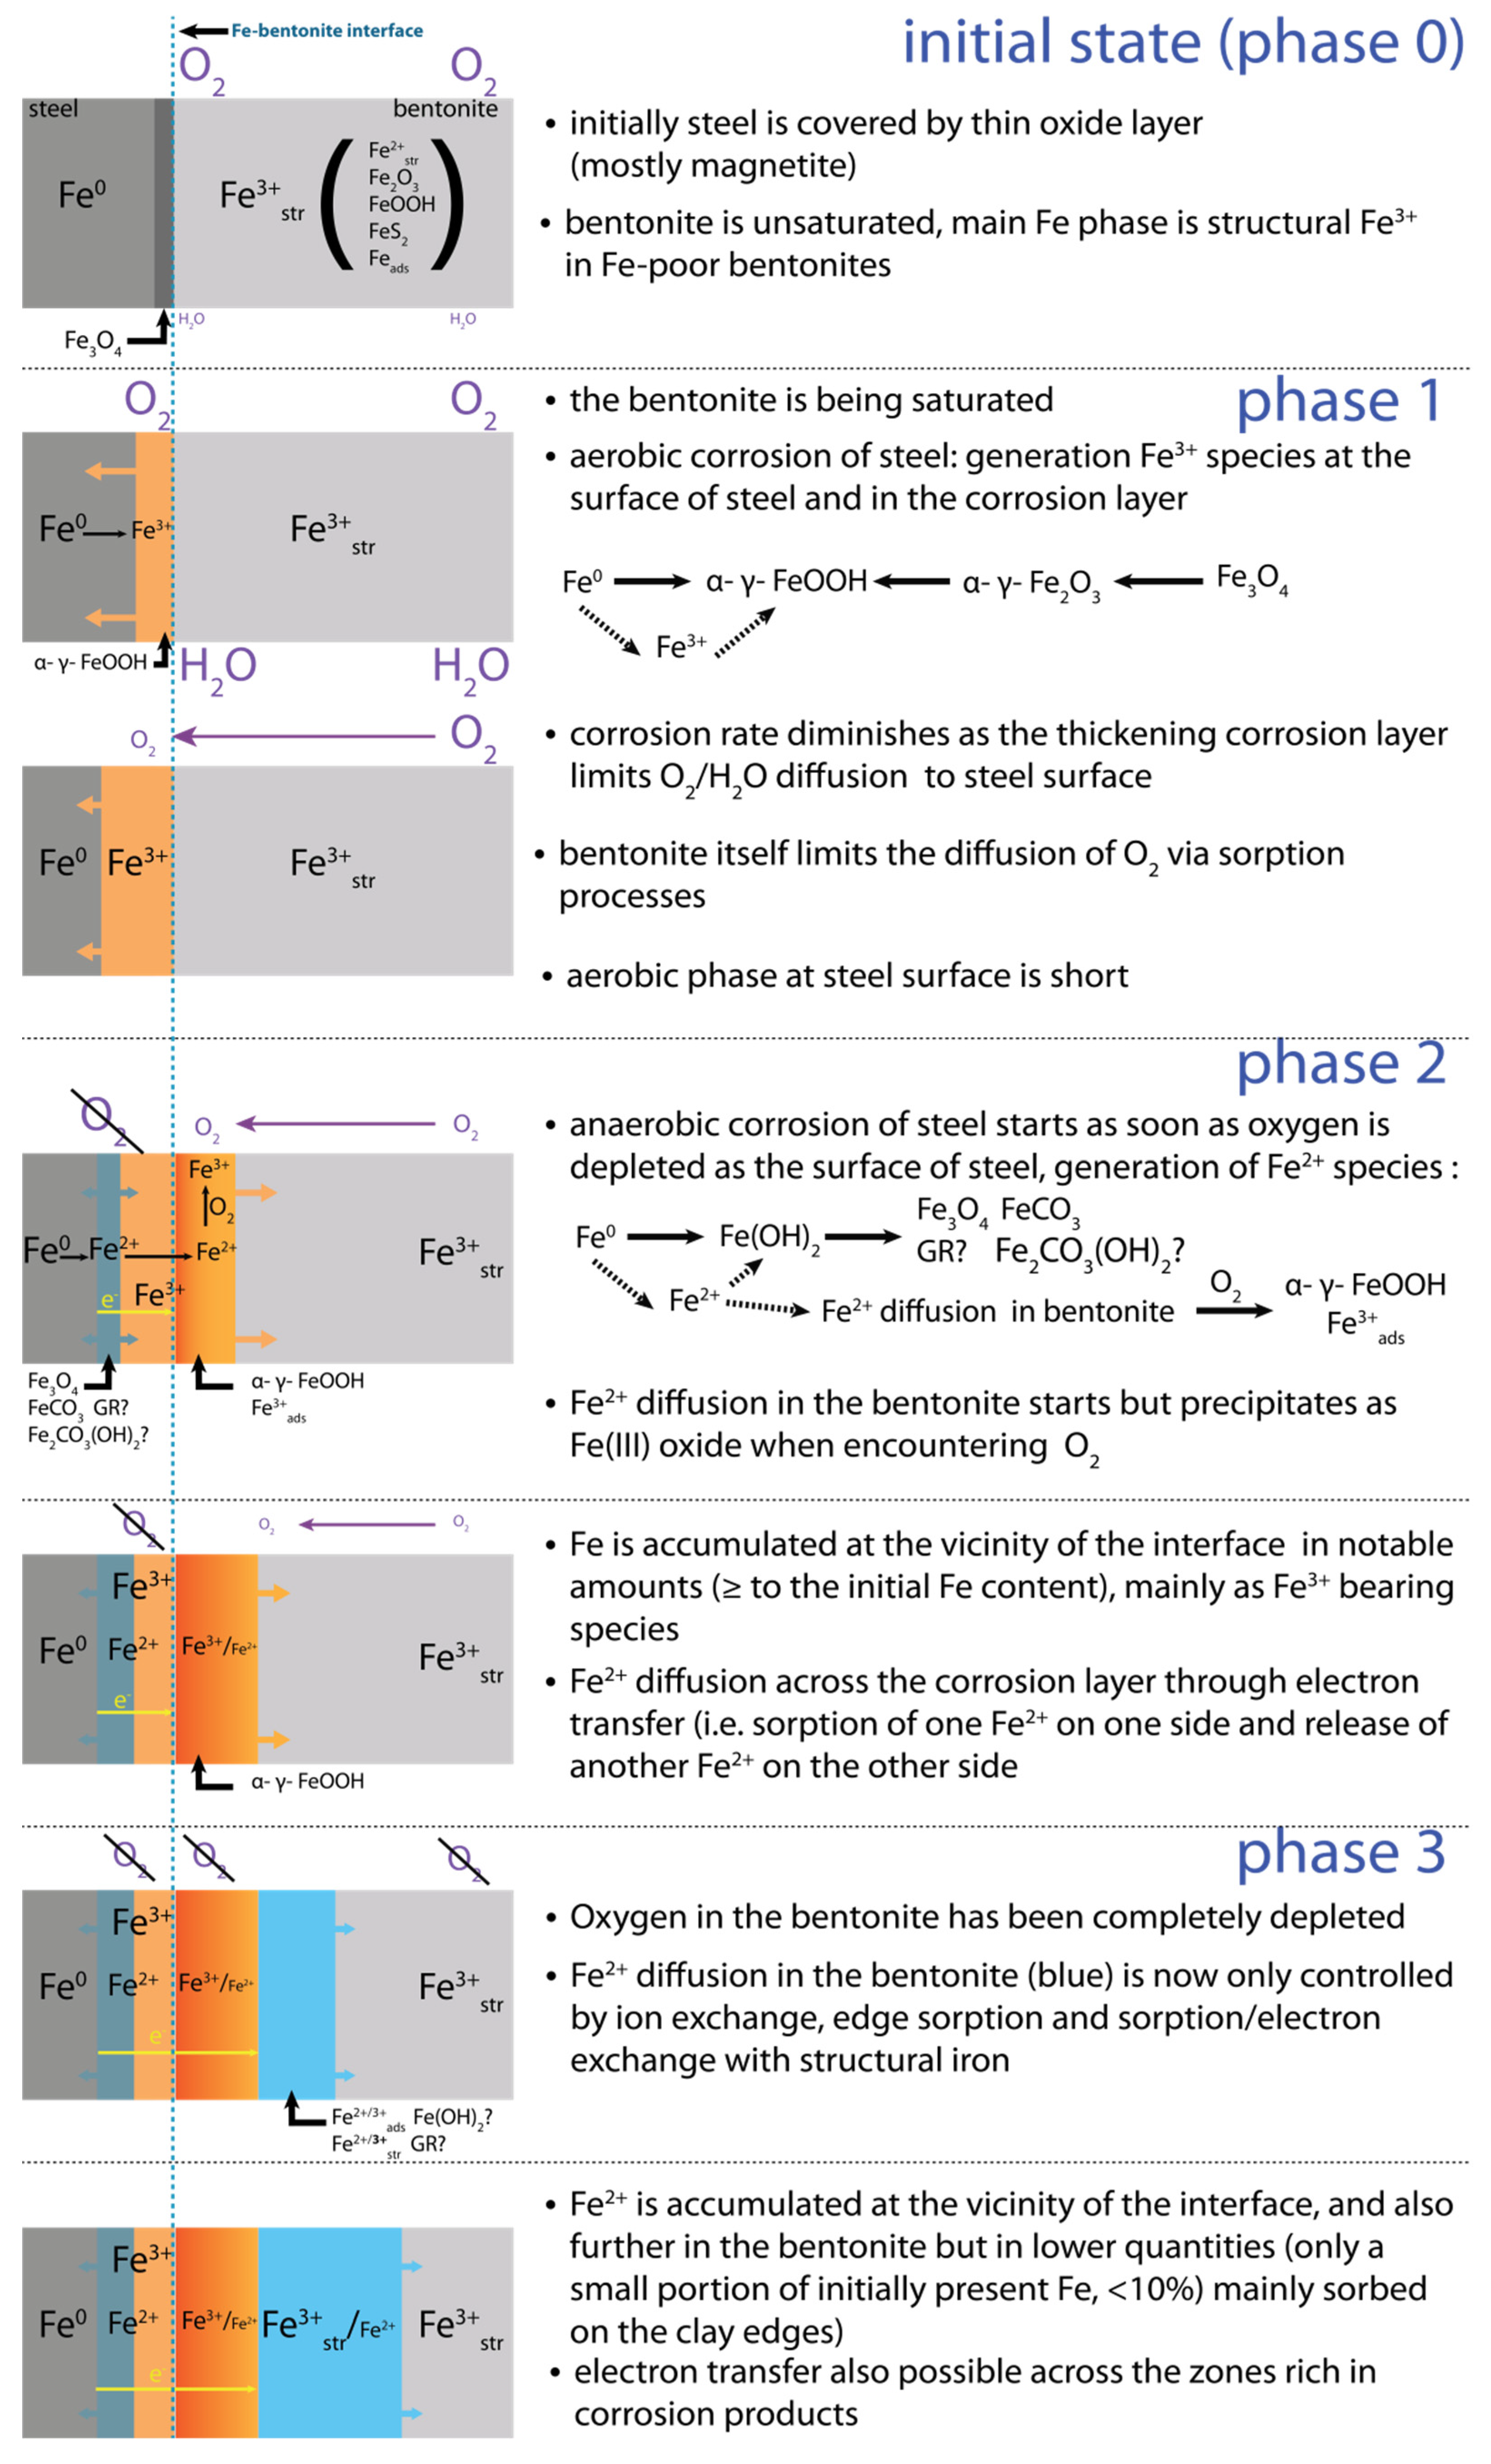
4.2. A Model of the Fe Diffusion Process

The transfer of corroded Fe to the clay is strongly dependent on the redox conditions which affect both the steel corrosion and the diffusion of Fe in the clay. From the previous discussion it can be inferred that the ABM2 package was exposed to oxidising conditions that shifted to reducing conditions over the course of the experiment. The Fe2+/Fe3+ ratio decreases from the metal surface towards the interface, which is followed by an increase of the ratio on the clay side. This detailed analysis of the spatial distribution of the iron species enables a period of variable redox conditions to be distinguished. In this transient period anaerobic corrosion occurred while oxidising conditions still prevailed in the bentonite. In the following, we propose a phenomenological model that integrates the observations in the interface area of the different blocks and separates the evolution into three phases:
Initial state: Steel is coated with a thin iron oxide layer (magnetite and ferric (oxyhydr)oxides) having resulted from atmospheric corrosion [40] which is in contact with unsaturated bentonite containing structural Fe(III) in smectite as main iron pool.
Phase 1: Aerobic corrosion of steel and oxidation of the magnetite layer leads to the formation of Fe(III) oxides. Depending on the moisture content, either the formation of hematite or goethite/lepidocrocite is favoured. O2 and H2O transfer to steel diminishes as the corrosion proceeds and the corrosion layer thickens.
Phase 2: Anaerobic corrosion of the steel within the corrosion layer leads to the generation of Fe2+ and the formation of magnetite and siderite in the corrosion layer. In addition, (fast) electron transfer across the corrosion layer occurs [44,45], generating Fe(II) at the corrosion layer/bentonite interface. This diffusing Fe2+ reacts with the remaining O2 present in the bentonite to further produce Fe(III) oxides accumulating at the vicinity of the interface. Diffusion of O2 in the bentonite may be slowed down by sorption processes [46].
Phase 3: Anaerobic conditions throughout: continued anaerobic corrosion of the steel, production of Fe(II) (and magnetite/siderite) and (fast) electron transfer across the corrosion layer. Diffusion of Fe2+ and accumulation of Fe2+ is observed in the clay. The mechanism of the diffusion and interaction process still needs to be established. It possibly involves a redox reaction with structural Fe3+ leading to an increase of structural Fe2+ and the precipitation of other Fe(III) oxides or green rust phases at the surface of smectite. Figure 12 illustrates this proposed model as simplified scheme.

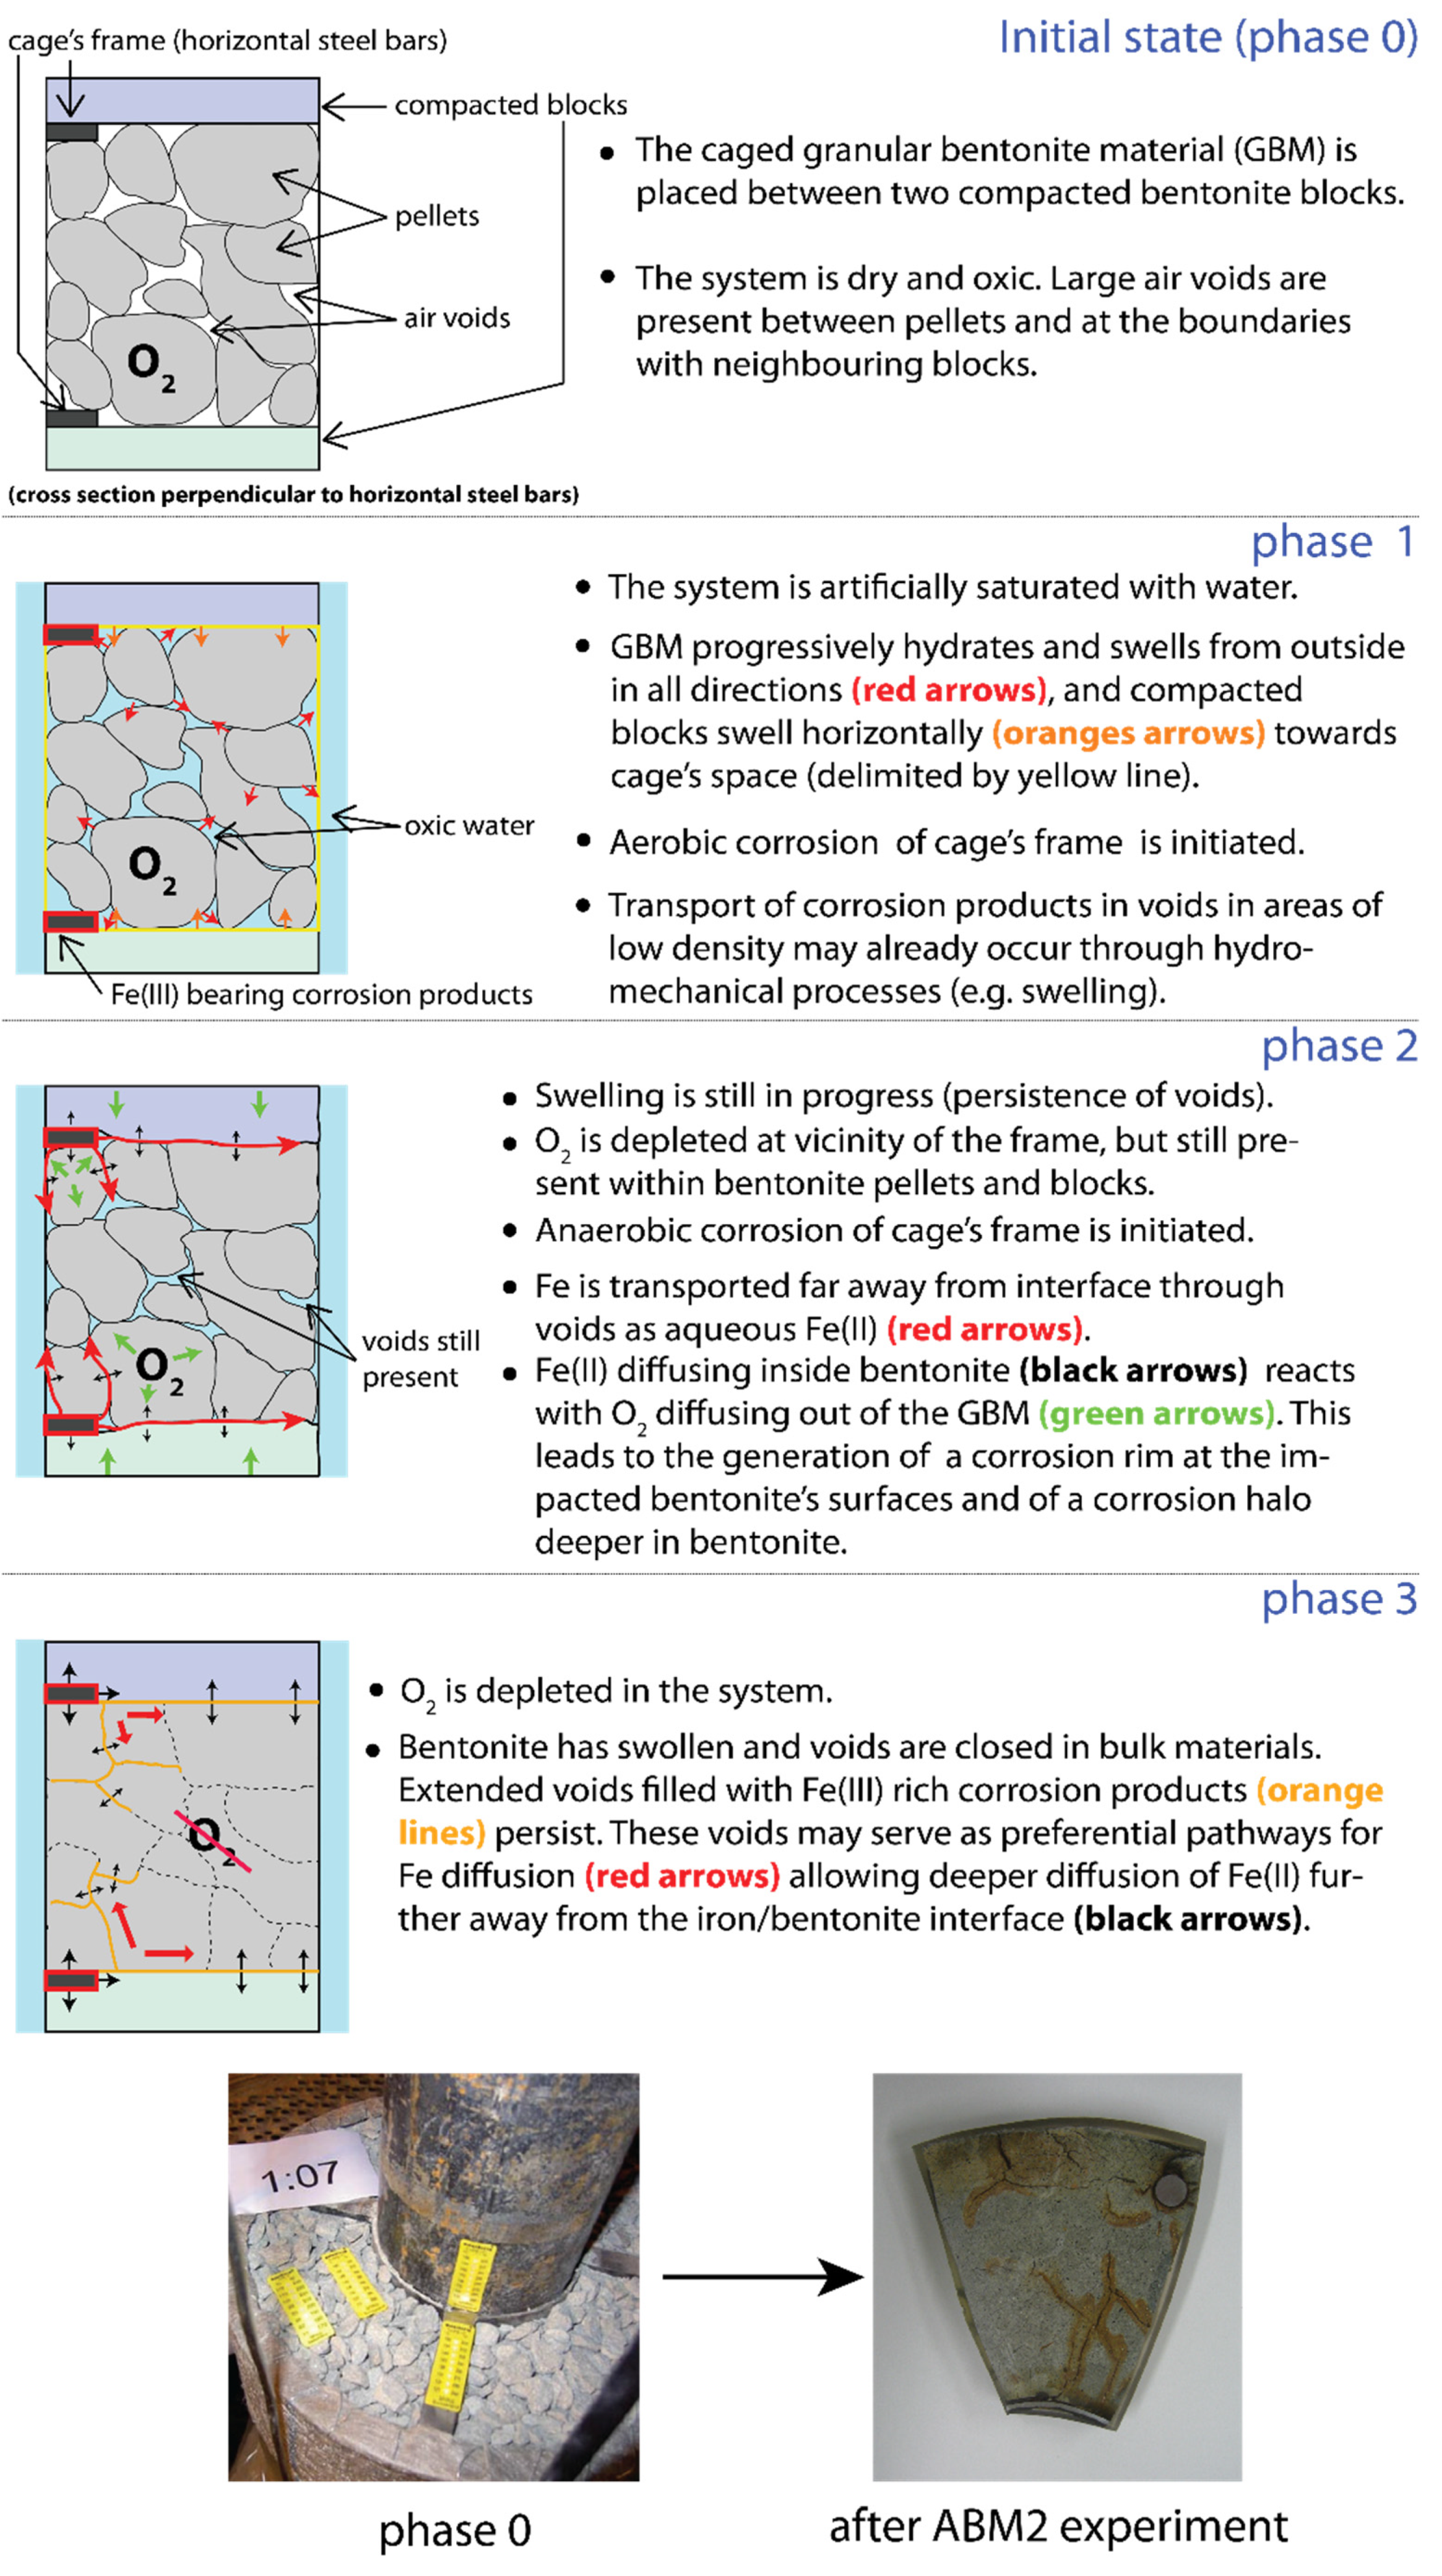
4.3. A Phenomenological Description of Caged Granular Material

As noted in Section 3.1, iron oxides filling former voids between pellet surfaces surrounded by reddish halos (extending several mm into the clay) were observed in the granular materials (MX80 and MX80/qz) which had otherwise formed a homogeneous mass during the experiment (Figure 3). It should be noted that this feature was limited to the granular materials in the metal cages. Based on the previously described above, a sequence of events is proposed in Figure 13.
The geometrical configuration of the fractures mimics the original shapes of the pellets. This suggests that the corrosion-derived iron oxides were formed in the voids between the pellets during the saturation process. This also implies that anaerobic corrosion releasing Fe2+ started when the voids between the pellets were still present. During transport in voids Fe2+ reacted with O2 in the partially saturated bentonite. Transport of O2 in this material was presumably attenuated by sorption to the clay [46]. This led to a “corrosion” halo around the voids and contributed to the gradual depletion of O2 in the clay. The Fe oxide filled voids provided preferential pathways for further transport of Fe2+ away from the steel/clay interface deeper into the clay.

5. Conclusions

The chemical interaction between carbon steel and bentonite was investigated by analysing the Fe/clay interfaces of eight bentonite blocks that had been exposed to temperatures of up to 130 °C for five years in the ABM2 borehole at the Äspö HRL. High spatial resolution methods (SEM/EDX, μ-Raman) were applied in combination with “bulk” methods (XRD, XRF, 57Fe Mössbauer spectrometry) to determine the Fe front and to unravel processes occurring in the clay as a result of steel corrosion.
Corrosion induced an iron front of 5–20 mm into the bentonite, except for the high-Fe bentonite where no Fe increase was detected. The Fe fronts consisted mainly of ferric (oxyhydr)oxides in addition to the structural Fe in the smectite fraction which had been partially reduced by the interaction process. Additional Fe(II) extended further into the clay, but its nature could not be identified. Mg was also found to be enriched at the Fe/clay interface, presumably because of the elevated temperatures and the temperature gradient within the clay. The Mg accumulation was larger in the upper part of the test package where a boiling event had probably occurred during the experiment. In this upper part, precipitates MgSO4 salts as well as large amounts of anhydrite/gypsum were formed. In lower parts of the test package smaller amounts of CaSO4 in the contact zone were also observed.
The corrosion and Fe-clay interaction process is strongly linked to the redox evolution in the borehole. A conceptual model with three phases is proposed, partly based on similar findings in previous in situ experiments. Initially, when conditions were oxidising, aerobic corrosion at the steel surface occurred producing a ferric (oxyhydr)oxide corrosion layer. After depletion of O2 within the corrosion layer, anaerobic corrosion led to the formation of magnetite and some siderite in the inner part of the corrosion layer. However, ferric (oxyhydr)oxides continued to be formed at the contact to the clay where aerobic conditions still prevailed. Once O2 was depleted in this area, Fe2+ diffused into the bentonite and induced a complex interaction process with the clay. The interaction mechanism is not understood in detail but may include Fe2+ sorption, reduction of structural Fe together with the formation of ferric (oxyhydr)oxides and/or mixed Fe(III)/Fe(III) phases (green rust).
The blocks, consisting of granular bentonite material contained in metal cages, exhibited specific corrosion features that were not observed in the other blocks. Such features included iron (oxyhydr)oxides filling former voids along with reddish halos extending into the clay. A phenomenological model for the formation of these features is proposed. The model includes the preferential transport of corrosion-derived Fe2+ through the voids and a still occurring reaction of O2 in the partially saturated bentonite.
No indications of montmorillonite alteration other than the reduction of structural iron were found. It should be noted that the formation of minor amounts of trioctahedral smectite, which was identified at the Fe/clay contact in previous studies in other blocks of the ABM2 experiment, cannot be ruled out.

Supplementary Materials

The following are available online at www.mdpi.com/article/10.3390/min11080907/s1, Supplementary Materials S1: SEM-EDX chemical profiles, Supplementary Materials S2: μ-Raman spectroscopy data of reference materials and contact zone, Supplementary Materials S3: XRD and XRF data, Supplementary Materials S4: Mössbauer spectrometry data.

Author Contributions

Conceptualization, P.W., A.J., D.S., P.S. and O.X.L.; methodology, P.W., J.H. and A.J.; software, J.H.; validation, J.H., P.W. and A.J.; formal analysis, J.H. and J.-M.G.; investigation, J.H.; resources, J.H.; data curation, J.H.; writing—original draft preparation, P.W.; writing—review and editing, P.W. and J.H.; visualization, J.H. and P.W.; supervision, P.W.; project administration, P.W.; funding acquisition, P.W. All authors have read and agreed to the published version of the manuscript.

Funding

This research was partially funded by Nagra (Switzerland) and SKB (Sweden).

Data Availability Statement

The data used in this study is available from the corresponding author upon request.

Acknowledgments

We would like to acknowledge Nadine Lötscher, Thomas Aebi and Stephan Brechbühl (University of Bern) for their cautious preparation of the polished surfaces. We thank Stephan Kaufhold and Reiner Dohrmann from BGR (Germany) for providing the large CEC/XRF data set on the ABM2 samples. The whole team involved in ABM2 is thanked for fruitful discussions. Josh Richards (University of Bern) is acknowledged for editing of language and style. The reviews of two anonymous reviewers significantly helped to improve the manuscript.

Conflicts of Interest

The authors declare no conflict of interest.

References

  1. Nagra. Project Opalinus Clay: Safety Report. Demonstration of Disposal Feasibility for Spent Fuel, Vitrified High-Level Waste and Long-Lived Intermediate-Level Waste (Entsorgungsnachweis); Nagra Technischer Bericht NTB 02-05; Nagra: Wettingen, Switzerland, 2002. [Google Scholar]
  2. SKB. Long-Term Safety for the Final Repository for Spent Nuclear Fuel at Forsmark. Main Report of the SR-Site Project. Volume II; SKB Tecnical Reports TR 11-01; SKB: Stockholm, Sweden, 2011. [Google Scholar]
  3. Posiva. Safety Case for the Disposal of Spent Nuclear Fuel at Olkiluoto—Synthesis 2012; Posiva Reports 2012-12; Posiva: Olkiluoto, Finland, 2013. [Google Scholar]
  4. Jenni, A.; Wersin, P.; Mäder, U.K.; Gimmi, T.; Thoenen, T.; Baeyens, B.; Hummel, W.; Gimmi, T.; Ferrari, A.; Marschall, P.; et al. Bentonite Backfill Performance in a High-Level Waste Repository: A Geochemical Perspective; Nagra Technischer Bericht NTB 19-03; Nagra: Wettingen, Switzerland, 2019. [Google Scholar]
  5. Muurinen, A.; Tournassat, C.; Hadi, J.; Greneche, J.M. Sorption and Diffusion of Fe(II) in Bentonite; Posiva Working Reports WR 2014-04; Posiva: Olkiluoto, Finland, 2014. [Google Scholar]
  6. Carlson, L.; Karnland, O.; Oversby, V.; Rance, A.; Smart, N.; Snellman, M.; Vähänen, M.; Werme, L. Experimental studies of the interactions between anaerobically corroding iron and bentonite. Phys. Chem. Earth. 2007, 32, 334–345. [Google Scholar] [CrossRef]
  7. Latta, D.E.; Neumann, A.; Premaratne, W.A.P.J.; Scherer, M.M. Fe(II)–Fe(III) Electron Transfer in a Clay Mineral with Low Fe Content. ACS Earth Space Chem. 2017, 1, 197–208. [Google Scholar] [CrossRef] [Green Version]
  8. Hadi, J.; Tournassat, C.; Ignatiadis, I.; Greneche, J.M.; Charlet, L. Modelling CEC variations versus structural iron reduction levels in dioctahedral smectites. Existing approaches, new data and model refinements. J. Colloid Interface Sci. 2013, 407, 397–409. [Google Scholar] [CrossRef] [PubMed]
  9. Wersin, P.; Birgersson, M.; Olsson, S.; Karnland, O.; Snellman, M. Impact of Corrosion-Derived Iron on the Bentonite Buffer within the KBS-3H Disposal Concept The Olkiluoto Site as Case Study; Posiva Reports 2007-11; Posiva: Olkiluoto, Finland, 2007. [Google Scholar]
  10. Bradbury, M.; Berner, U.; Curti, E.; Hummel, W.; Kosakowski, G.; Thoenen, T. The Long Term Geochemical Evolution of the Nearfield of the HLW Repository; Nagra Technical Reports NTB 12-01; Nagra: Villingen, Switzerland, 2014. [Google Scholar]
  11. Martin, P.-L.; Barcala, J.M.; Huertas, F. Large-scale and long-term coupled thermo-hydro-mechanic experiments with bentonite: The FEBEX mock-up test. J. Iber. Geol. 2006, 32, 259–282. [Google Scholar]
  12. Fernandez, A.M.; Villar, M.V. Geochemical behaviour of a bentonite barrier in the laboratory after up to 8 years of heating and hydration. Appl. Geochem. 2010, 25, 809–824. [Google Scholar] [CrossRef]
  13. Wersin, P.K.; Kober, F. (Eds.) FEBEX-DP. Metal Corrosion and Iron-Bentonite Interaction Studies; Nagra Arbeitsbericht NAB 16-16; Nagra: Wettingen, Switzerland, 2017. [Google Scholar]
  14. Fernandez, A.M.; Kaufhold, S.; Sanchez-Ledesma, D.M.; Rey, J.J.; Melon, A.; Robredo, L.M.; Fernandez, S.; Labajo, M.A.; Clavero, M.A. Evolution of the THC conditions in the FEBEX in situ test after 18 years of experiment: Smectite crystallochemical modifications after interactions of the bentonite with a C-steel heater at 100 degrees C. Appl. Geochem. 2018, 98, 152–171. [Google Scholar] [CrossRef]
  15. Hadi, J.; Wersin, P.; Serneels, V.; Greneche, J.M. Eighteen years of steel-bentonite interaction in the FEBEX “in situ” test at the Grimsel Test Site in Switzerland. Clays Clay Miner. 2019, 67, 111–131. [Google Scholar] [CrossRef] [Green Version]
  16. Svensson, D.; Dueck, A.; Nilsson, U.; Olsson, S.; Sandén, T.; Lydmark, S.; Jägerwall, S.; Pedersen, K.; Hansen, S. Alternative Buffer Material—STATUS of the Ongoing Laboratory Investigation of Reference Materials and Test Package 1; SKB Technical Reports TR 11-06; SKB: Stockholm, Sweden, 2011. [Google Scholar]
  17. Svensson, P.D.; Hansen, S. Redox chemistry in two iron-bentonite field experiments at Äspö Hard Rock Laboratory, Sweden: An XRD and Fe k-edge XANES study. Clays Clay Miner. 2013, 61, 566–579. [Google Scholar] [CrossRef]
  18. Kaufhold, S.; Dohrmann, R.; Sandén, T.; Sellin, P.; Svensson, D. Mineralogical investigations of the first package of the alternative buffer material test—I. Alteration of bentonites. Clay Miner. 2013, 48, 199–213. [Google Scholar] [CrossRef]
  19. Dohrmann, R.; Olsson, S.; Kaufhold, S.; Sellin, P. Mineralogical investigations of the first package of the alternative buffer material test—II. Exchangeable cation population rearrangement. Clay Miner. 2013, 48, 215–233. [Google Scholar] [CrossRef]
  20. Wersin, P.; Jenni, A.; Mäder, U.K. Interaction of corroding iron with bentonite in the ABM1 experiment at Äspö, Sweden: A microscopic approach. Clays Clay Miner. 2015, 63, 51–68. [Google Scholar] [CrossRef]
  21. Svensson, D. The Bentonite Barrier—Swelling Properties, Redox Chemistry and Mineral Evolution. Ph.D. Thesis, Lund University, Lund, Sweden, 2015. [Google Scholar]
  22. Kaufhold, S.; Dohrmann, R.; Götze, N.; Svensson, D. Characterization of the Second Parcel of the Alternative Buffer Material (ABM) Experiment—I Mineralogical Reactions. Clays Clay Miner. 2017, 65, 27–41. [Google Scholar] [CrossRef]
  23. Hadi, J.; Wersin, P.; Jenni, A.; Greneche, J.M. Redox Evolution and Fe-Bentonite Interaction in the ABM2 Experiment, Äspö Hard Rock Laboratory; Nagra Technischer Bericht NTB 17-10; Nagra: Wettingen, Switzerland, 2017. [Google Scholar]
  24. Dohrmann, R.; Kaufhold, S. Characterization of the second package of the Alternative Buffer Material (ABM) experiment—II Exchangeable cation population rearrangement. Clays Clay Miner. 2017, 65, 104–121. [Google Scholar] [CrossRef]
  25. Wollenberg, R.; Schroeder, H. Herstellung und Charakterisierung von Bentonitsystemen für den Einsatz als Versiegelungsmaterial; Nagra Arbeitsbericht NAB 06-20; Nagra: Wettingen, Switzerland, 2006. [Google Scholar]
  26. Nagra. Alternative Buffer Material–Status Report; Nagra Arbeitsbericht NAB 11-19; Nagra: Wettingen, Switzerland, 2011. [Google Scholar]
  27. Leal Olloqui, M. A Study of Alteration Processes in Bentonite; University of Bristol: Bristol, UK, 2019; Available online: https://research-information.bris.ac.uk/en/studentTheses/a-study-of-alteration-processes-in-bentonite (accessed on 10 October 2020).
  28. Kumpulainen, S.; Kiviranta, L. Mineralogical, Chemical and Physical Study of Potential Buffer and Backfill Materials from ABM Test Package 1; Posiva Working Reports WR 2011-41; Posiva: Olkiluoto, Finland, 2011. [Google Scholar]
  29. Eng, A.N.U.; Svensson, D. Äspö Hard Rock Laboratory—Alternative Buffer Material—Installation Report; SKB International Progress Report IPR-07-15; SKB: Stockholm, Sweden, 2007. [Google Scholar]
  30. Muurinen, A. Chemical Conditions in the AO Parcel of the Long-Term Test of Buffer Material in Äspö (LOT); Posiva Working Report WR 2003-32; Posiva: Olkiluoto, Finland, 2003. [Google Scholar]
  31. Lábár, J.L.; Török, S. A peak-to-background method for electron probe X-ray micro-analysis applied to individual small particles. X-ray Spectrom. 1992, 21, 183–190. [Google Scholar] [CrossRef]
  32. Trincavelli, J.; Limandri, S.; Bonetto, R. Standardless quantification methods in electron probe microanalysis. Spectrochim. Acta Part B At. Spectrosc. 2014, 101, 76–85. [Google Scholar] [CrossRef]
  33. Lafuente, B.; Drowns, R.T.; Yang, H.; Stone, N. The Power of Databases: The RRUFF Project. In Highlights in Mineralogical Chrystallography; Armbruster, T., Danisi, R.M., Eds.; De Gruyter: Berlin, Germany, 2015; pp. 1–30. [Google Scholar]
  34. Mössbauer, R.L. Kernresonanzabsorption von Gammastrahlung in Ir191. Naturwissenschaften 1958, 45, 538–539. [Google Scholar] [CrossRef]
  35. Tzara, C. Diffusion des photons sur les atomes et les noyaux dans les cristaux. J. De Phys. Radium 1961, 22, 303–307. [Google Scholar] [CrossRef]
  36. Gütlich, P.; Bill, E.; Trautwein, A.X. Mössbauer Spectroscopy and Transition Metal Chemistry; Springer: Berlin Heidelberg, Germany, 2011; p. 569. [Google Scholar]
  37. Vandenberghe, R.; De Grave, E. Application of Mössbauer Spectroscopy in Earth Sciences. In Mössbauer Spectroscopy—Tutorial Book; Yoshida, Y., Langouche, G., Eds.; Springer: Berlin/Heidelberg, Germany, 2013; pp. 91–185. [Google Scholar]
  38. Grim, R.E.; Güven, N. Bentonites—Geology, Mineralogy, Properties and Uses; Elsevier Scientific Publishing Company: Amsterdam, The Netherland, 1978; Volume 24, p. 256. [Google Scholar]
  39. Sitek, J.; Araiova, B.; Toth, I. Reduction of Fe in montmorillonite. Acta Phys. Slovaca 1995, 45, 67–70. [Google Scholar]
  40. King, F. Corrosion of Carbon Steel under Anaerobic Conditions in a Repository for SF and HLW in Opalinus Clay; Nagra Technischer Bericht NTB 08-12; Nagra: Wettingen, Switzerland, 2008. [Google Scholar]
  41. Tournassat, C. Interactions cations—Argiles: Le cas du Fe(II). Application au contexte de stockage profond des déchets radioactifs; Université Joseph Fourier: Saint-Martin-d’Hères, France, 2003. [Google Scholar]
  42. Soltermann, D.; Fernandes, M.M.; Baeyens, B.; Dahn, R.; Joshi, P.A.; Scheinost, A.C.; Gorski, C.A. Fe(II) uptake on natural montmorillonites. I. Macroscopic and spectroscopic characterization. Environ. Sci. Technol. 2014, 48, 8688–8697. [Google Scholar] [CrossRef]
  43. Mosser-Ruck, R.; Cathelineau, M.; Guillaume, D.; Charpentier, D.; Rousset, D.; Barres, O.; Michau, N. Effects of Temperature, pH, and Iron/Clay and Liquid/Clay Ratios on Experimental Conversion of Dioctahedral Smectite to Berthierine, Chlorite, Vermiculite, or Saponite. Clays Clay Miner. 2010, 58, 280–291. [Google Scholar] [CrossRef]
  44. Yanina, S.V.; Rosso, K.M. Linked reactivity at mineral-water interfaces through bulk crystal conduction. Science 2008, 320, 218–222. [Google Scholar] [CrossRef] [PubMed] [Green Version]
  45. Handler, R.M.; Frierdich, A.J.; Johnson, C.M.; Rosso, K.M.; Beard, B.L.; Wang, C.; Latta, D.E.; Neumann, A.; Pasakarnis, T.; Premaratne, W.A.P.J. Fe(II)-Catalyzed recrystallization of goethite revisited. Environ. Sci. Technol. 2014, 48, 11302–11311. [Google Scholar] [CrossRef] [PubMed]
  46. Leupin, O.X.; Smart, N.R.; Zhang, Z.; Stefanoni, M.; Angst, U.; Papafotiou, A.; Diomidis, N. Anaerobic corrosion of carbon steel in bentonite: An evolving interface. Corros. Sci. 2021, 187, 109523. [Google Scholar] [CrossRef]
Figure 1. ABM2 borehole with stacked blocks and caged pellets surrounding the central steel heater [29].
Minerals 11 00907 g001
Figure 2. (A) Polished samples obtained from bentonite blocks/cages used for SEM and μ-Raman analysis: (a) Ibecoseal #11, (b) Ikosorb #12, (c,d) Kunigel #13, (e) MX-80+quartz #25, (f) Deponit #26, (g) MX-80 with steel part #27. (B) Cross section of upper part of caged pellets #25 and powdered samples obtained neighbouring Deponit material. Yellow arrow shows interface with heater, black arrow shows attached Deponit bentonite with interesting shades of red, green and blue. (G) grey, (R) red, (B) blue.
Minerals 11 00907 g002
Figure 3. Example of caged pellets before installation (left) and after dismantling (right) [29].
Minerals 11 00907 g003
Figure 4. Al-normalised Fe profile perpendicular to steel-clay contact for blocks with MX-80. Points: EDX measurements, squares: XRF bulk data from [22], empty rectangles: XRF measurements on powdered samples, grey area: range of bulk.
Minerals 11 00907 g004
Figure 5. Al-normalised Fe profile perpendicular to steel/clay contact for other blocks. Points: EDX measurements, squares: XRF bulk data from [22], empty rectangles: XRF measurements on powdered samples; grey area: range of bulk.
Minerals 11 00907 g005
Figure 6. SEM micrographs (upper) and μ-Raman spectra (lower) at indicated locations of unaffected MX-80 bentonite blocks #8 and #27 and MX-80/quartz block #25. Note that further μ-Raman spectra are shown in Figure S2(1).
Minerals 11 00907 g006
Figure 7. Room temperature Mössbauer spectra of raw, reacted and bulk MX80 from block #08. The refined values of hyperfine parameters are listed in Tables of Supplementary Materials S4.
Minerals 11 00907 g007
Figure 8. SEM micrographs (upper) of steel-clay interface of block #25 (MX-80/qz) and μ-Raman spectra of two areas (lower, a,b).
Minerals 11 00907 g008
Figure 9. Al-normalised Mg profile perpendicular to steel/clay contact for five different blocks. Points: EDX measurements, squares: XRF bulk data from [22], empty rectangles: XRF measurements on powdered samples; grey area: range of bulk.
Minerals 11 00907 g009
Figure 10. Al-normalised excess Ca and S profiles (bulk content has been subtracted) perpendicular to steel/clay contact for blocks with MX-80. EDX measurements with range, grey horizontal area: range of bulk. Light purple area: range of Ca/Al values. Red shaded area: range of S/Al values.
Minerals 11 00907 g010
Figure 11. Sketch of steel-bentonite interface with neo-formed iron phases (not to scale). CL: corrosion layer. mag: magnetite, hem: hematite, lep: lepidocrocite, sid: siderite, GR: green rust, Fe2+str: structural Fe2+ in smectite.
Minerals 11 00907 g011
Figure 12. Conceptual model of corrosion and Fe-clay interaction process in the ABM2 in situ experiment [15].
Minerals 11 00907 g012
Figure 13. Proposed sequence of processes inside caged pellets based on macroscopic observations.
Minerals 11 00907 g013
Table 1. Fe content and iron species in raw samples.
BentoniteTotal FeDistribution (% of Total Fe)
wt %Festr in SmectiteFe in Oxy-HydroxidesFe in PyriteFe in Other
MX803.1>901 < 5 (goe)<5<5 (ilm)
Ibecoseal3.0>91<5 (goe/hem/mag)<5<5 (mar)
IKosorb2.1>92<5 (goe)<5<5 (mar, mic)
Kunigel1.5>75<2 (goe)<25
Rokle11.64060 (goe)
Deponit3.8>75<5 (goe)<20
Table 2. Fe content, reduction level and Fe2+/Fe3+ ratio of raw, bulk and interface samples (crust: direct contact to Fe/clay interface; contact: sample ≥0.3 mm from interface; red/green/blue: samples with reddish/greenish and blueish appearance, respectively; salt: sample containing white precipitate; goe: goethite, hem: hematite; n.a.: not analysed). Error on reduction level from Mössbauer spectrometry is about 4%.
Block #MaterialSample TypeDistance InterfaceTotal FeIncrease Total FeReduction LevelFe(II)/Fe(III)Fe Oxides from 77 K Mössbauer
(mm)mmol/kg%%(-)
#08MX-80rawraw490 180.22n.a.
contact0.3–5610 a25130.14n.a.
bulk>45485−1260.36n.a.
#11Ibecosealrawraw476 310.45n.a.
crust<0.32128 a347240.31goe
contact0.3–585680330.48goe, hem
bulk>455128340.51goe, hem
#12Ikosorbrawraw321 n.a.
crust<0.31420 a34390.10goe, hem
contact0.3–543636100.11goe, hem
heart15–2535310210.27
bulk>45290−10100.11
#13Kunigelrawraw232 n.a.
crust<0.329025 n.a.
#25MX80+quartz raw343 180.22n.a.
crust<0.31989480190.23goe
contact 11.51658384210.27goe, (hem)
contact 2360476220.28goe
contact 34.5552 a61210.27goe, (hem)
bulk4537810270.37goe, hem
#26Deponit raw581 90.13n.a.
redn.a.123111280.10goe
greenn.a.69420170.25goe
bluen.a.75229220.38goe
#27MX-80 raw490 180.22n.a.
crust<0.364532150.18n.a.
salt757618110.12goe
bulk25533 a)9 n.a.
a Amount of material insufficient for XRF analysis, thus inferred from the EDX chemical profiles.
Publisher’s Note: MDPI stays neutral with regard to jurisdictional claims in published maps and institutional affiliations.

