
Towards Sustainability Pathway with Bio-Derived Platinum and Palladium Catalyst for Furfural Hydrogenation—A Novel Greener Approach in Catalysis


Abstract
:1. Introduction
2. Experimental
2.1. Materials and Chemicals
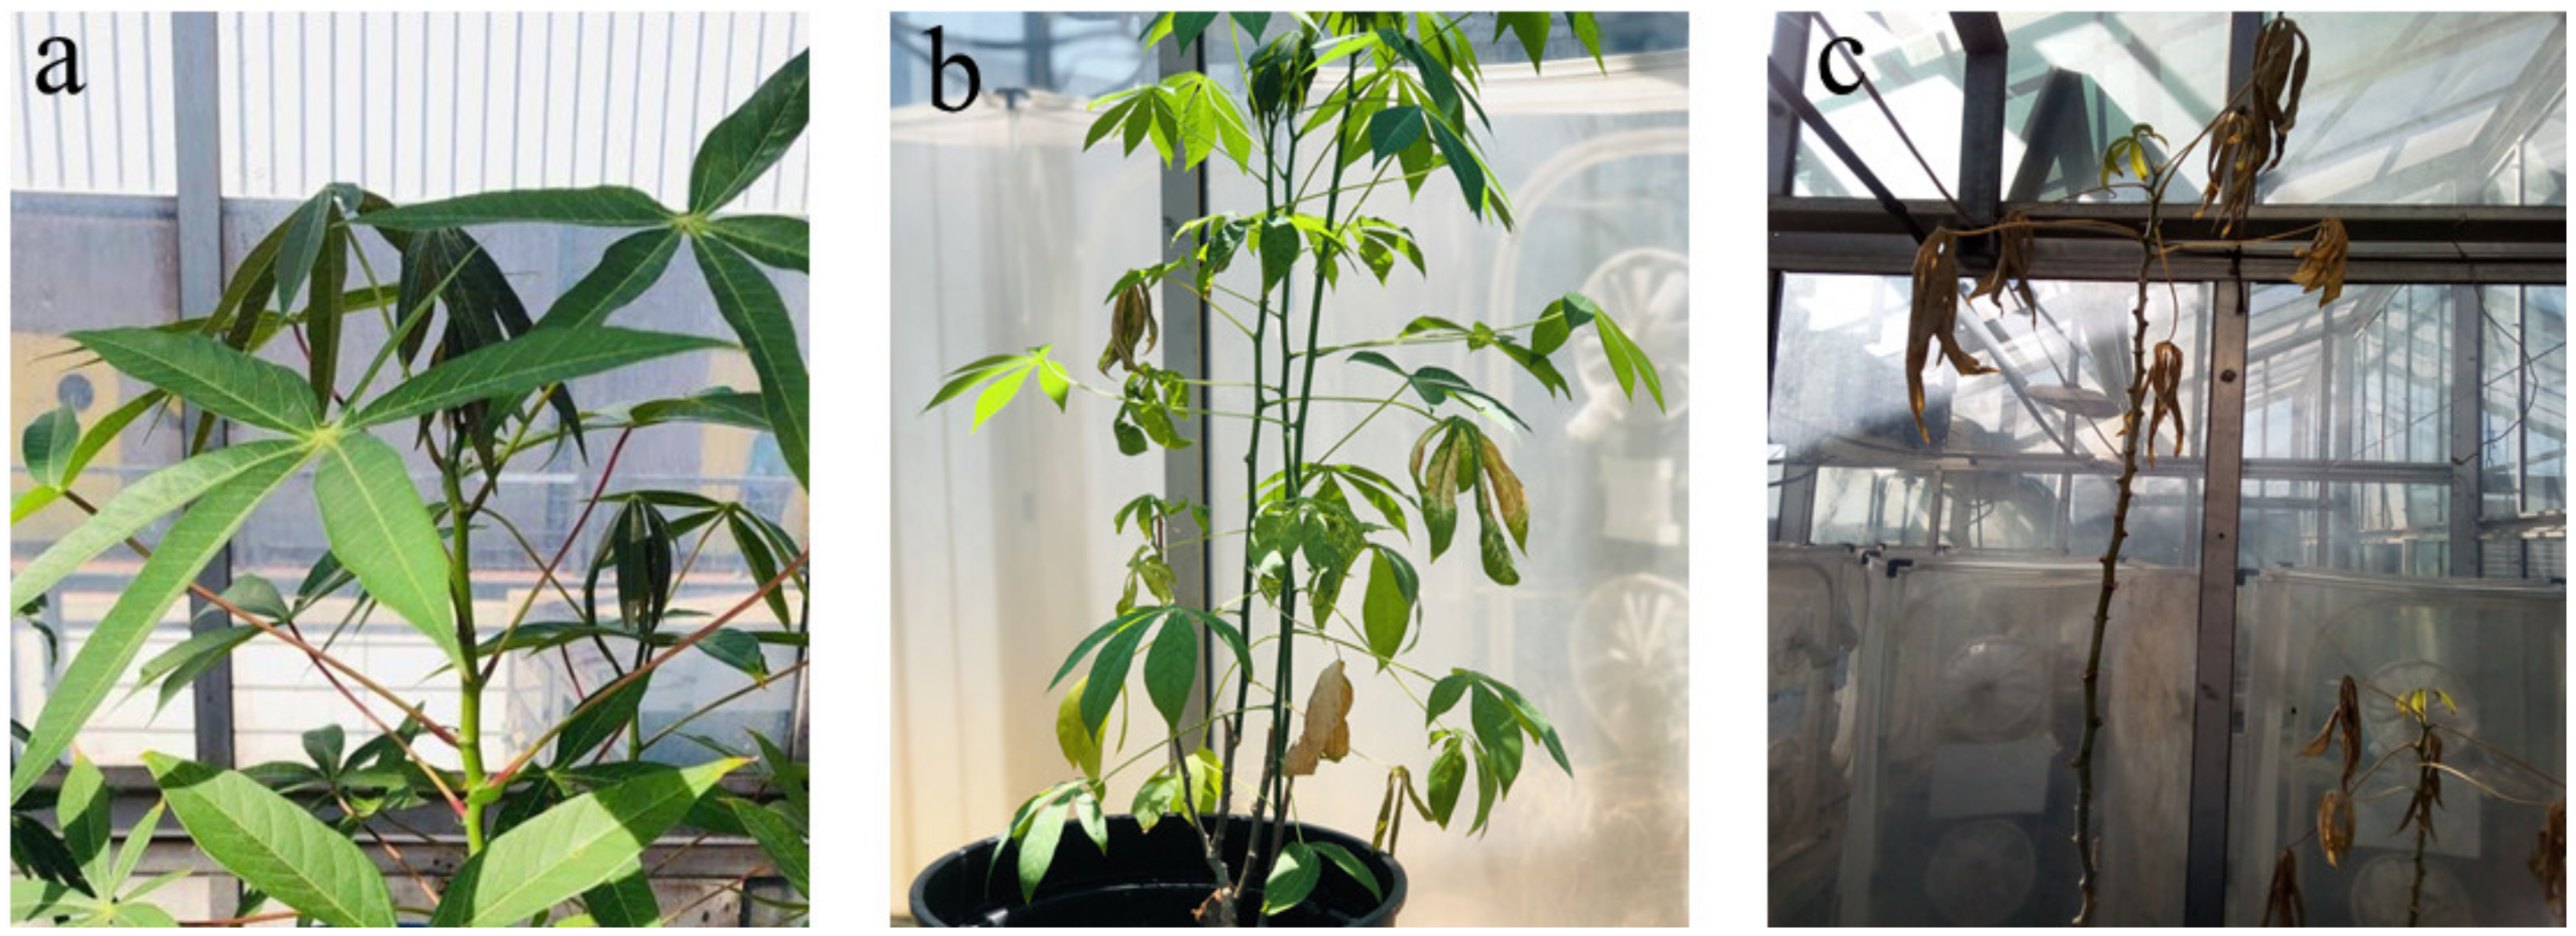
2.2. Plant Growth
2.3. Digestion Procedures
2.4. Formation of the Catalyst
2.5. Digestion of Calcinated Plant Samples
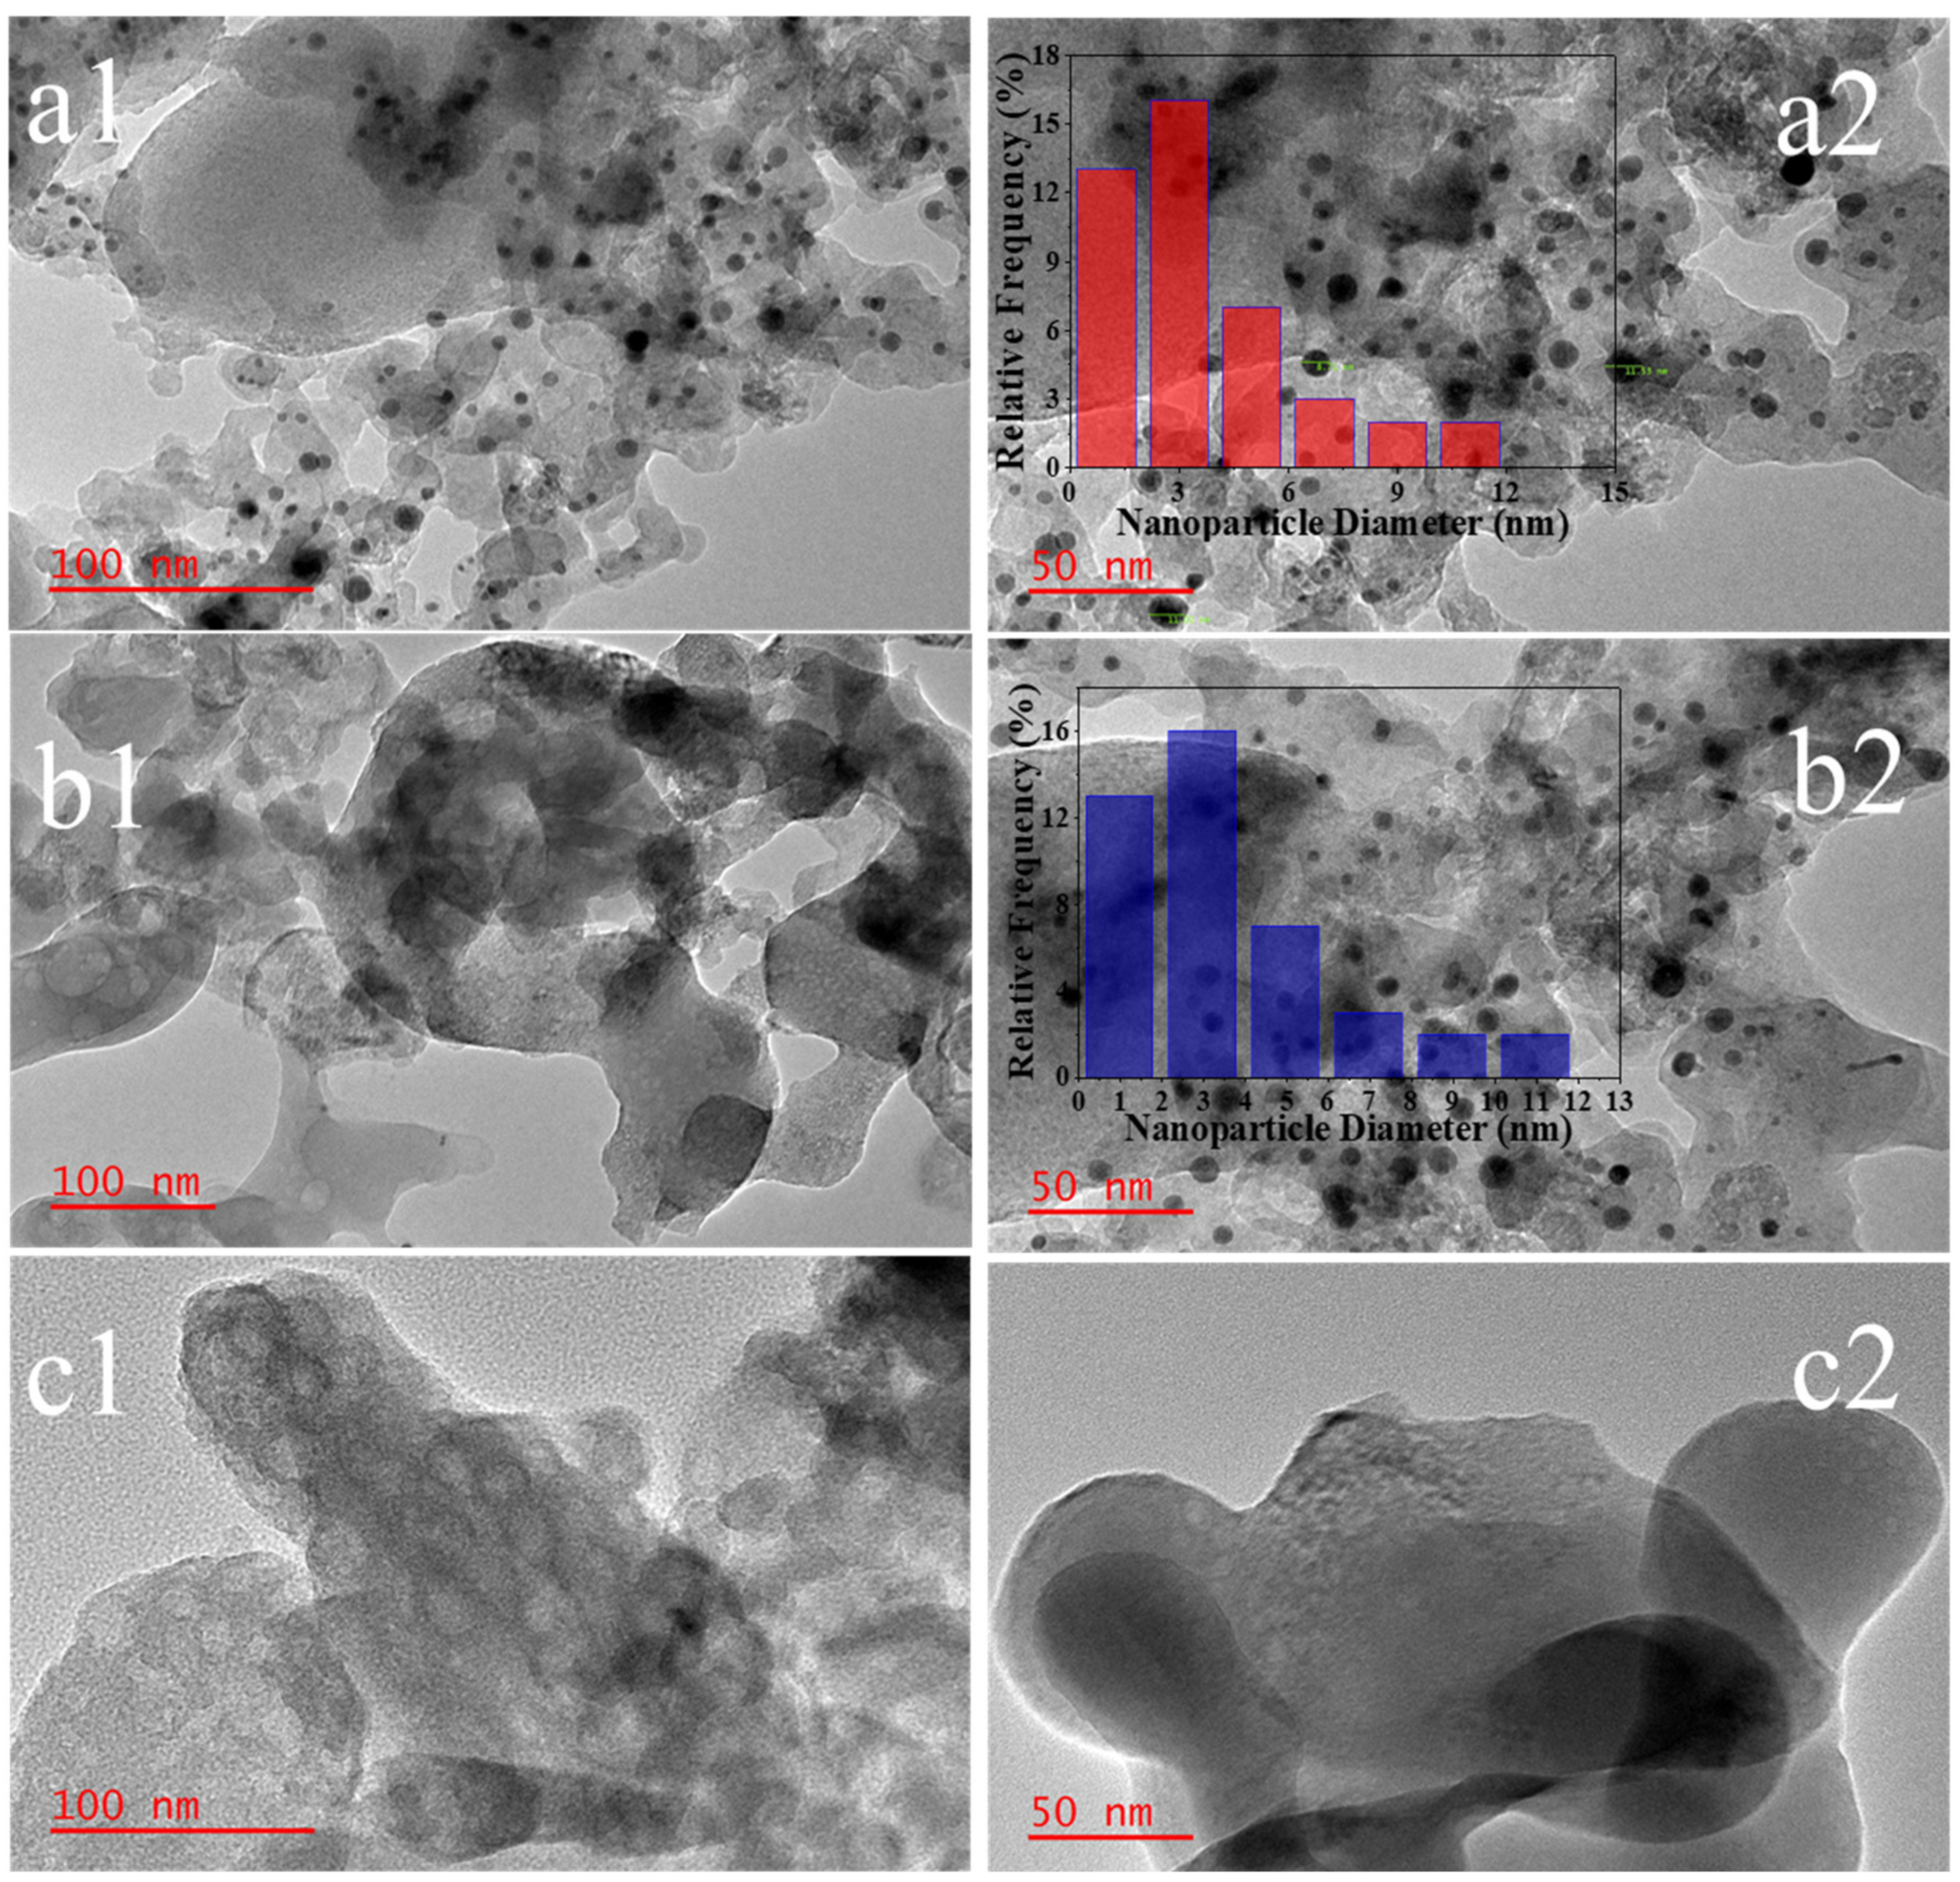
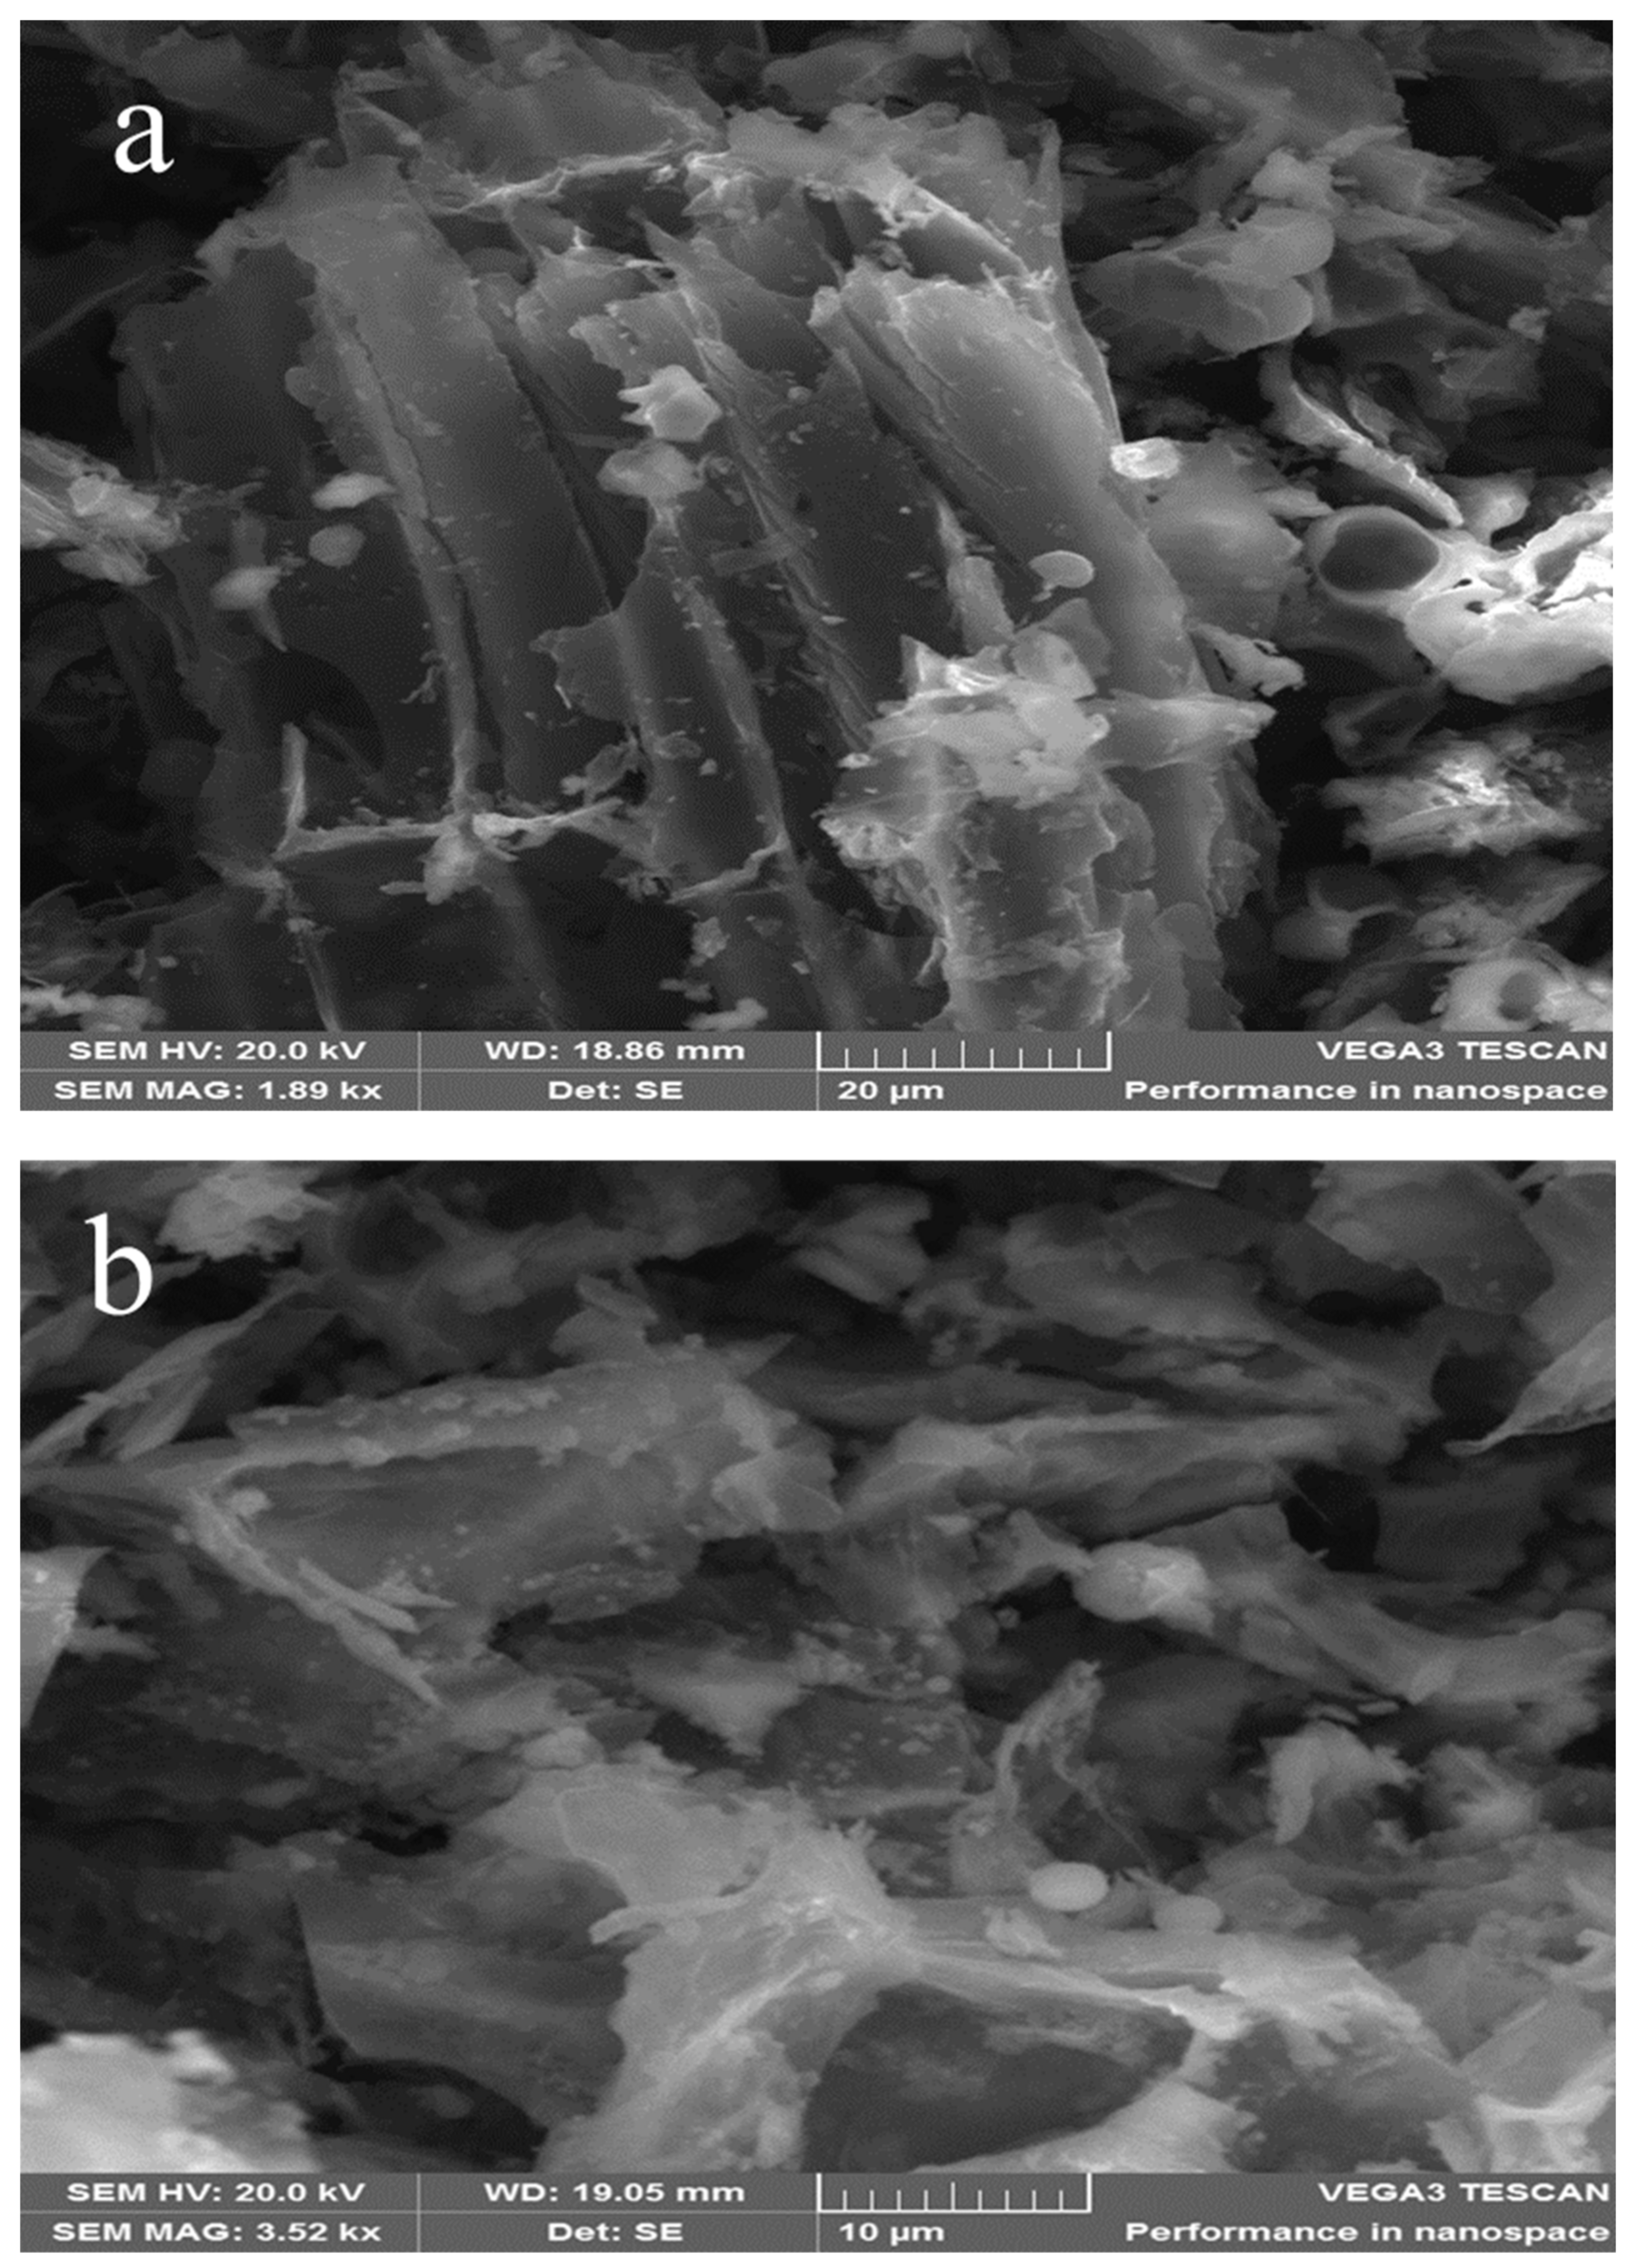
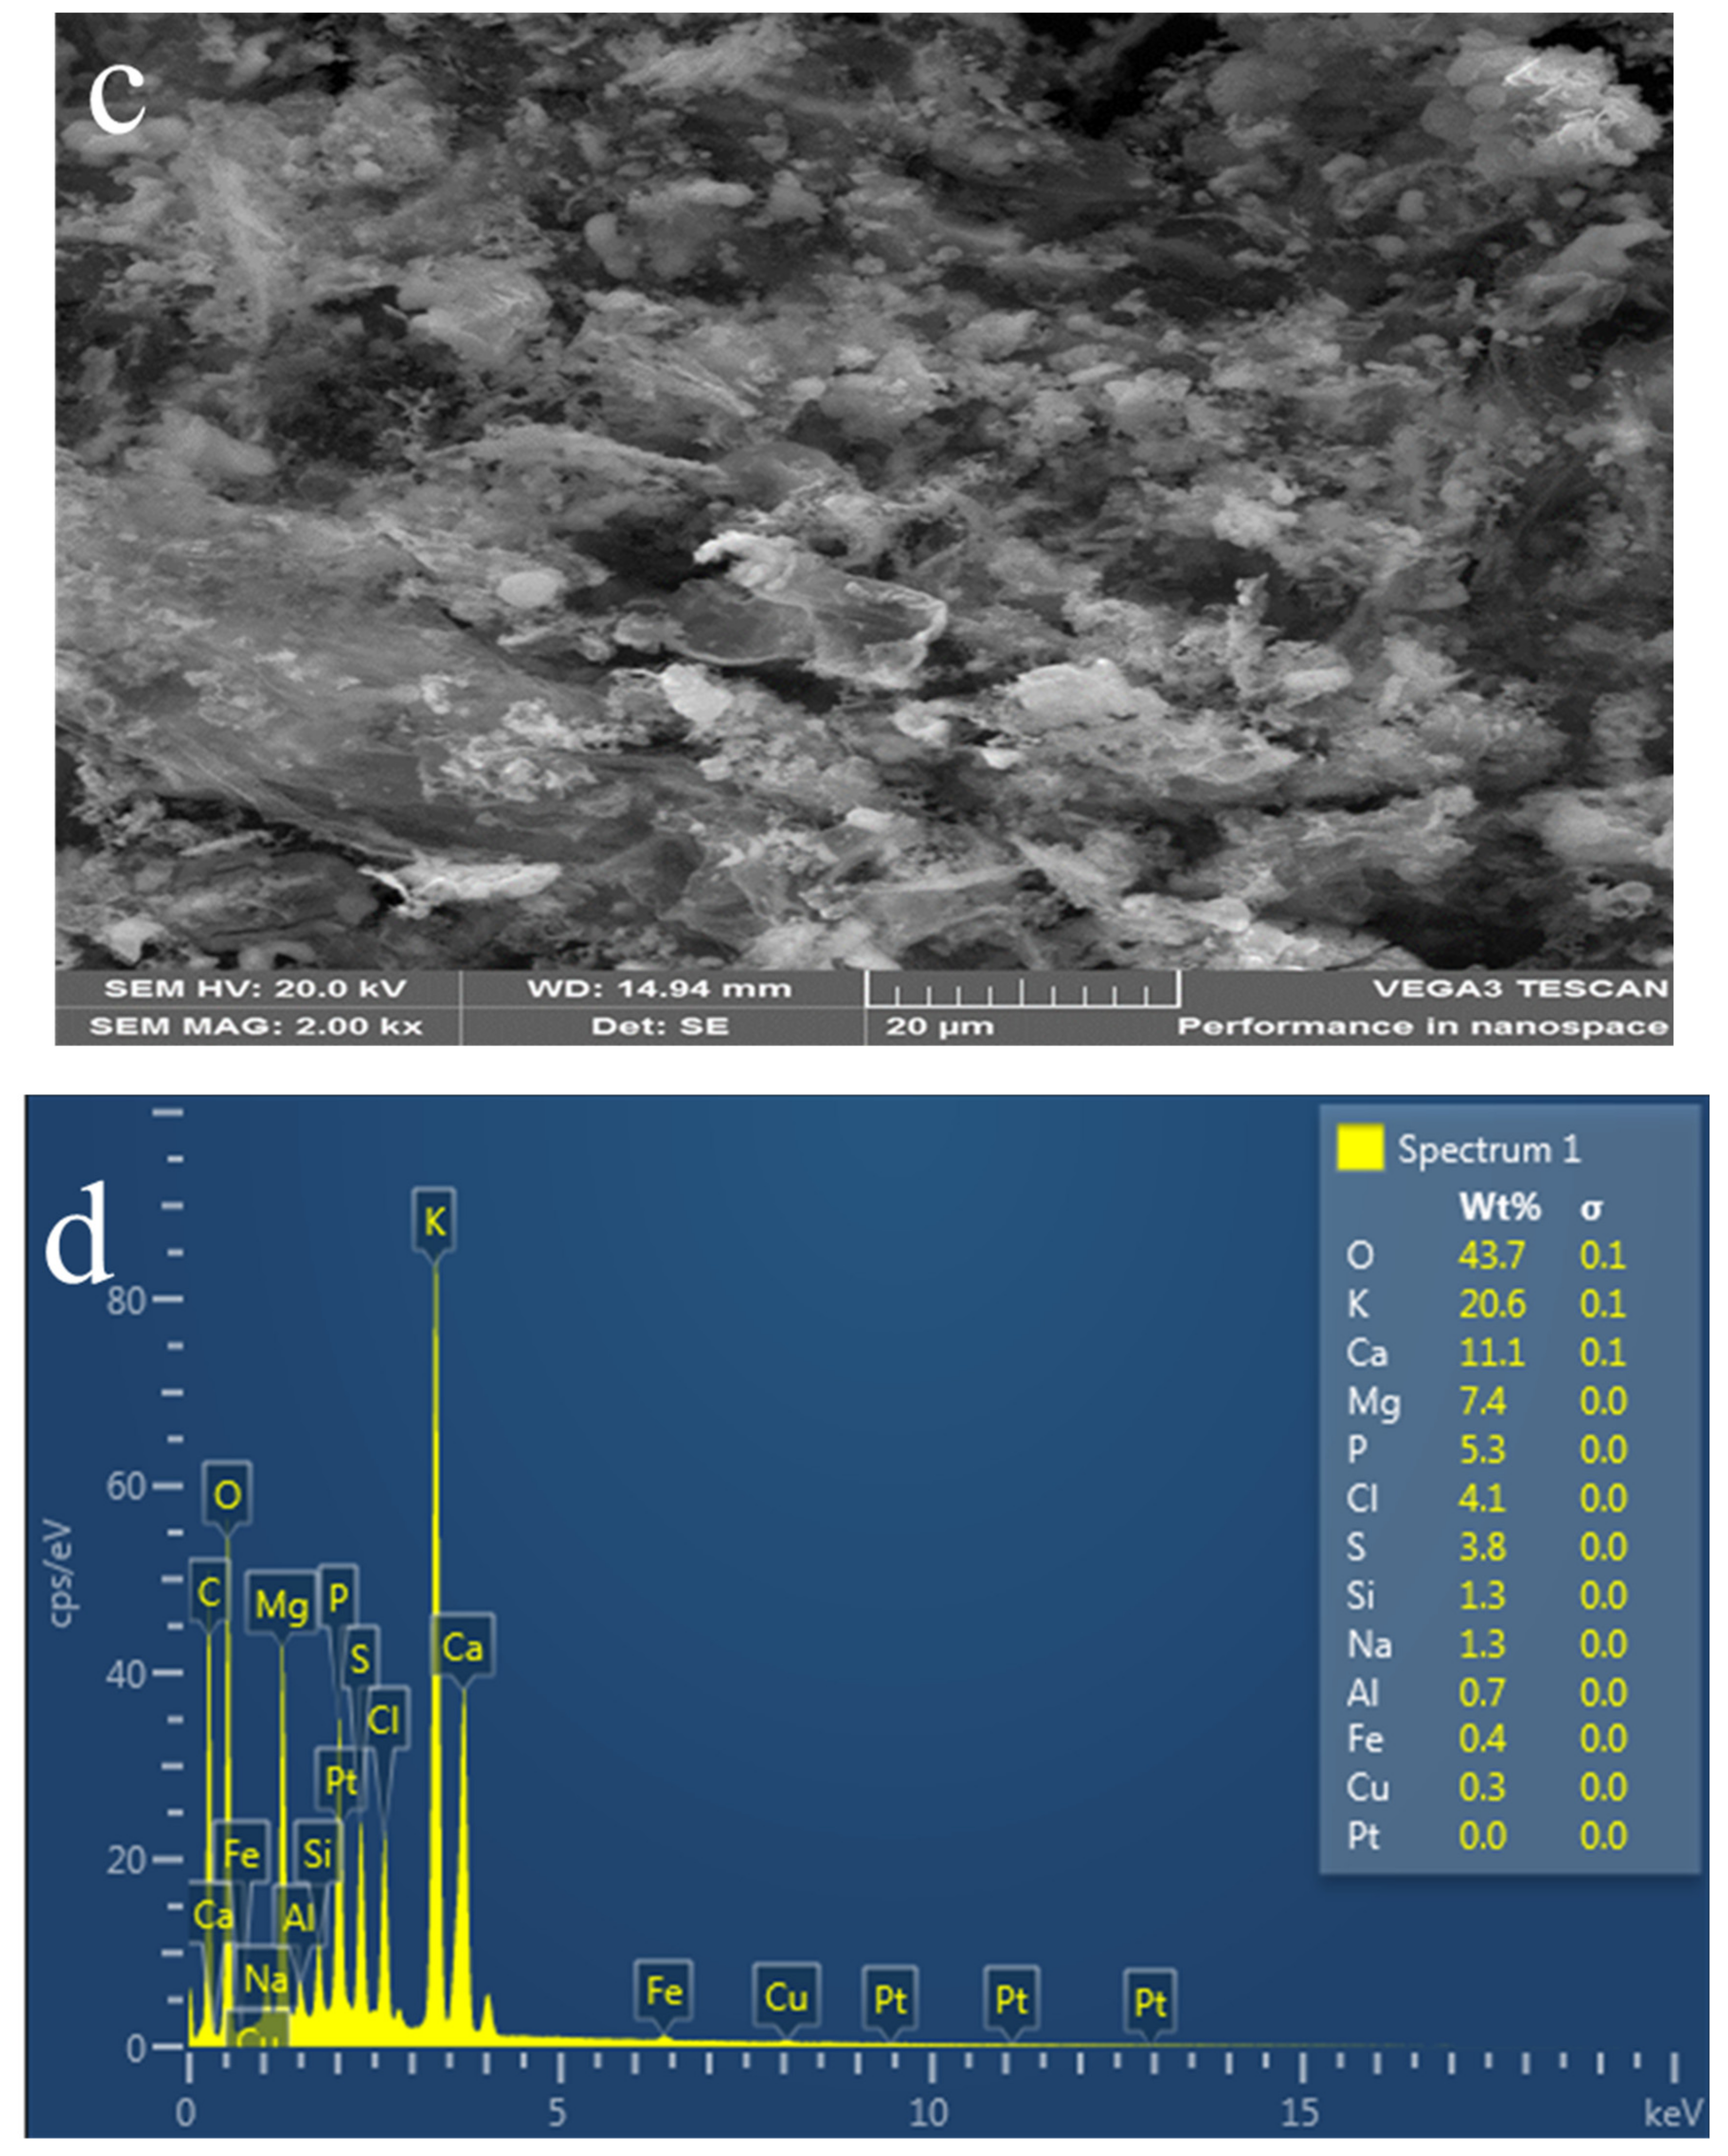
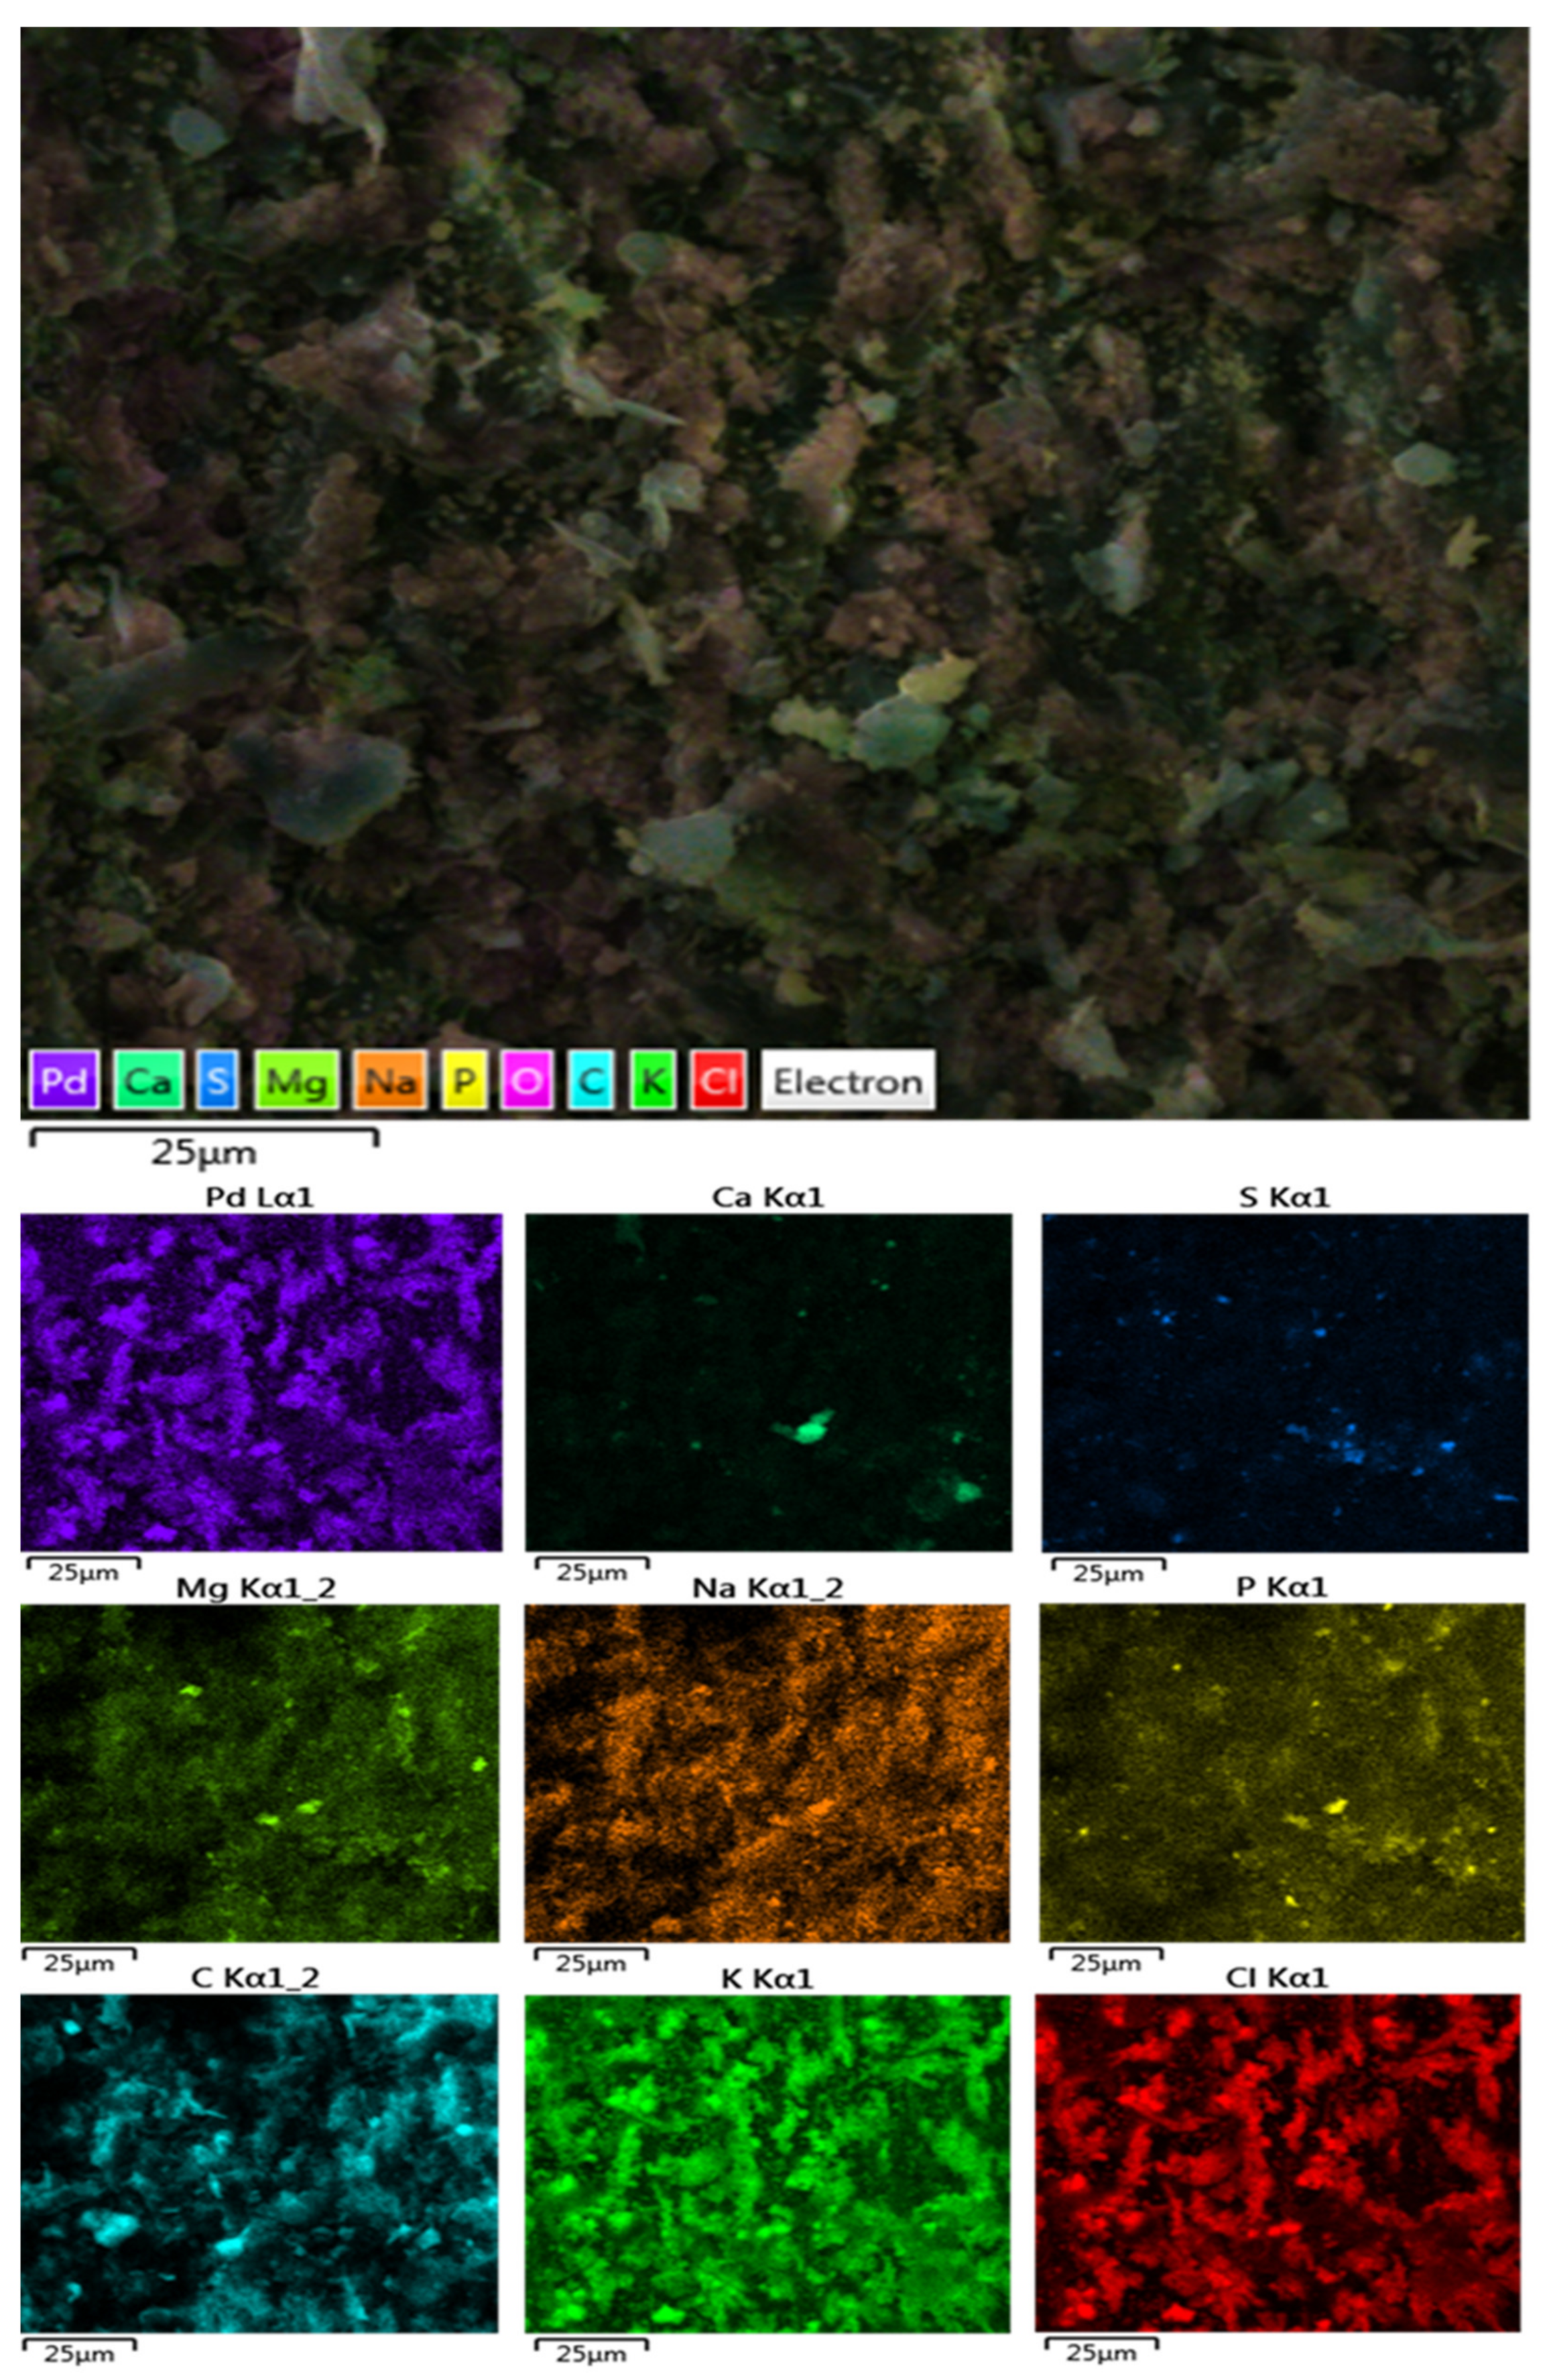
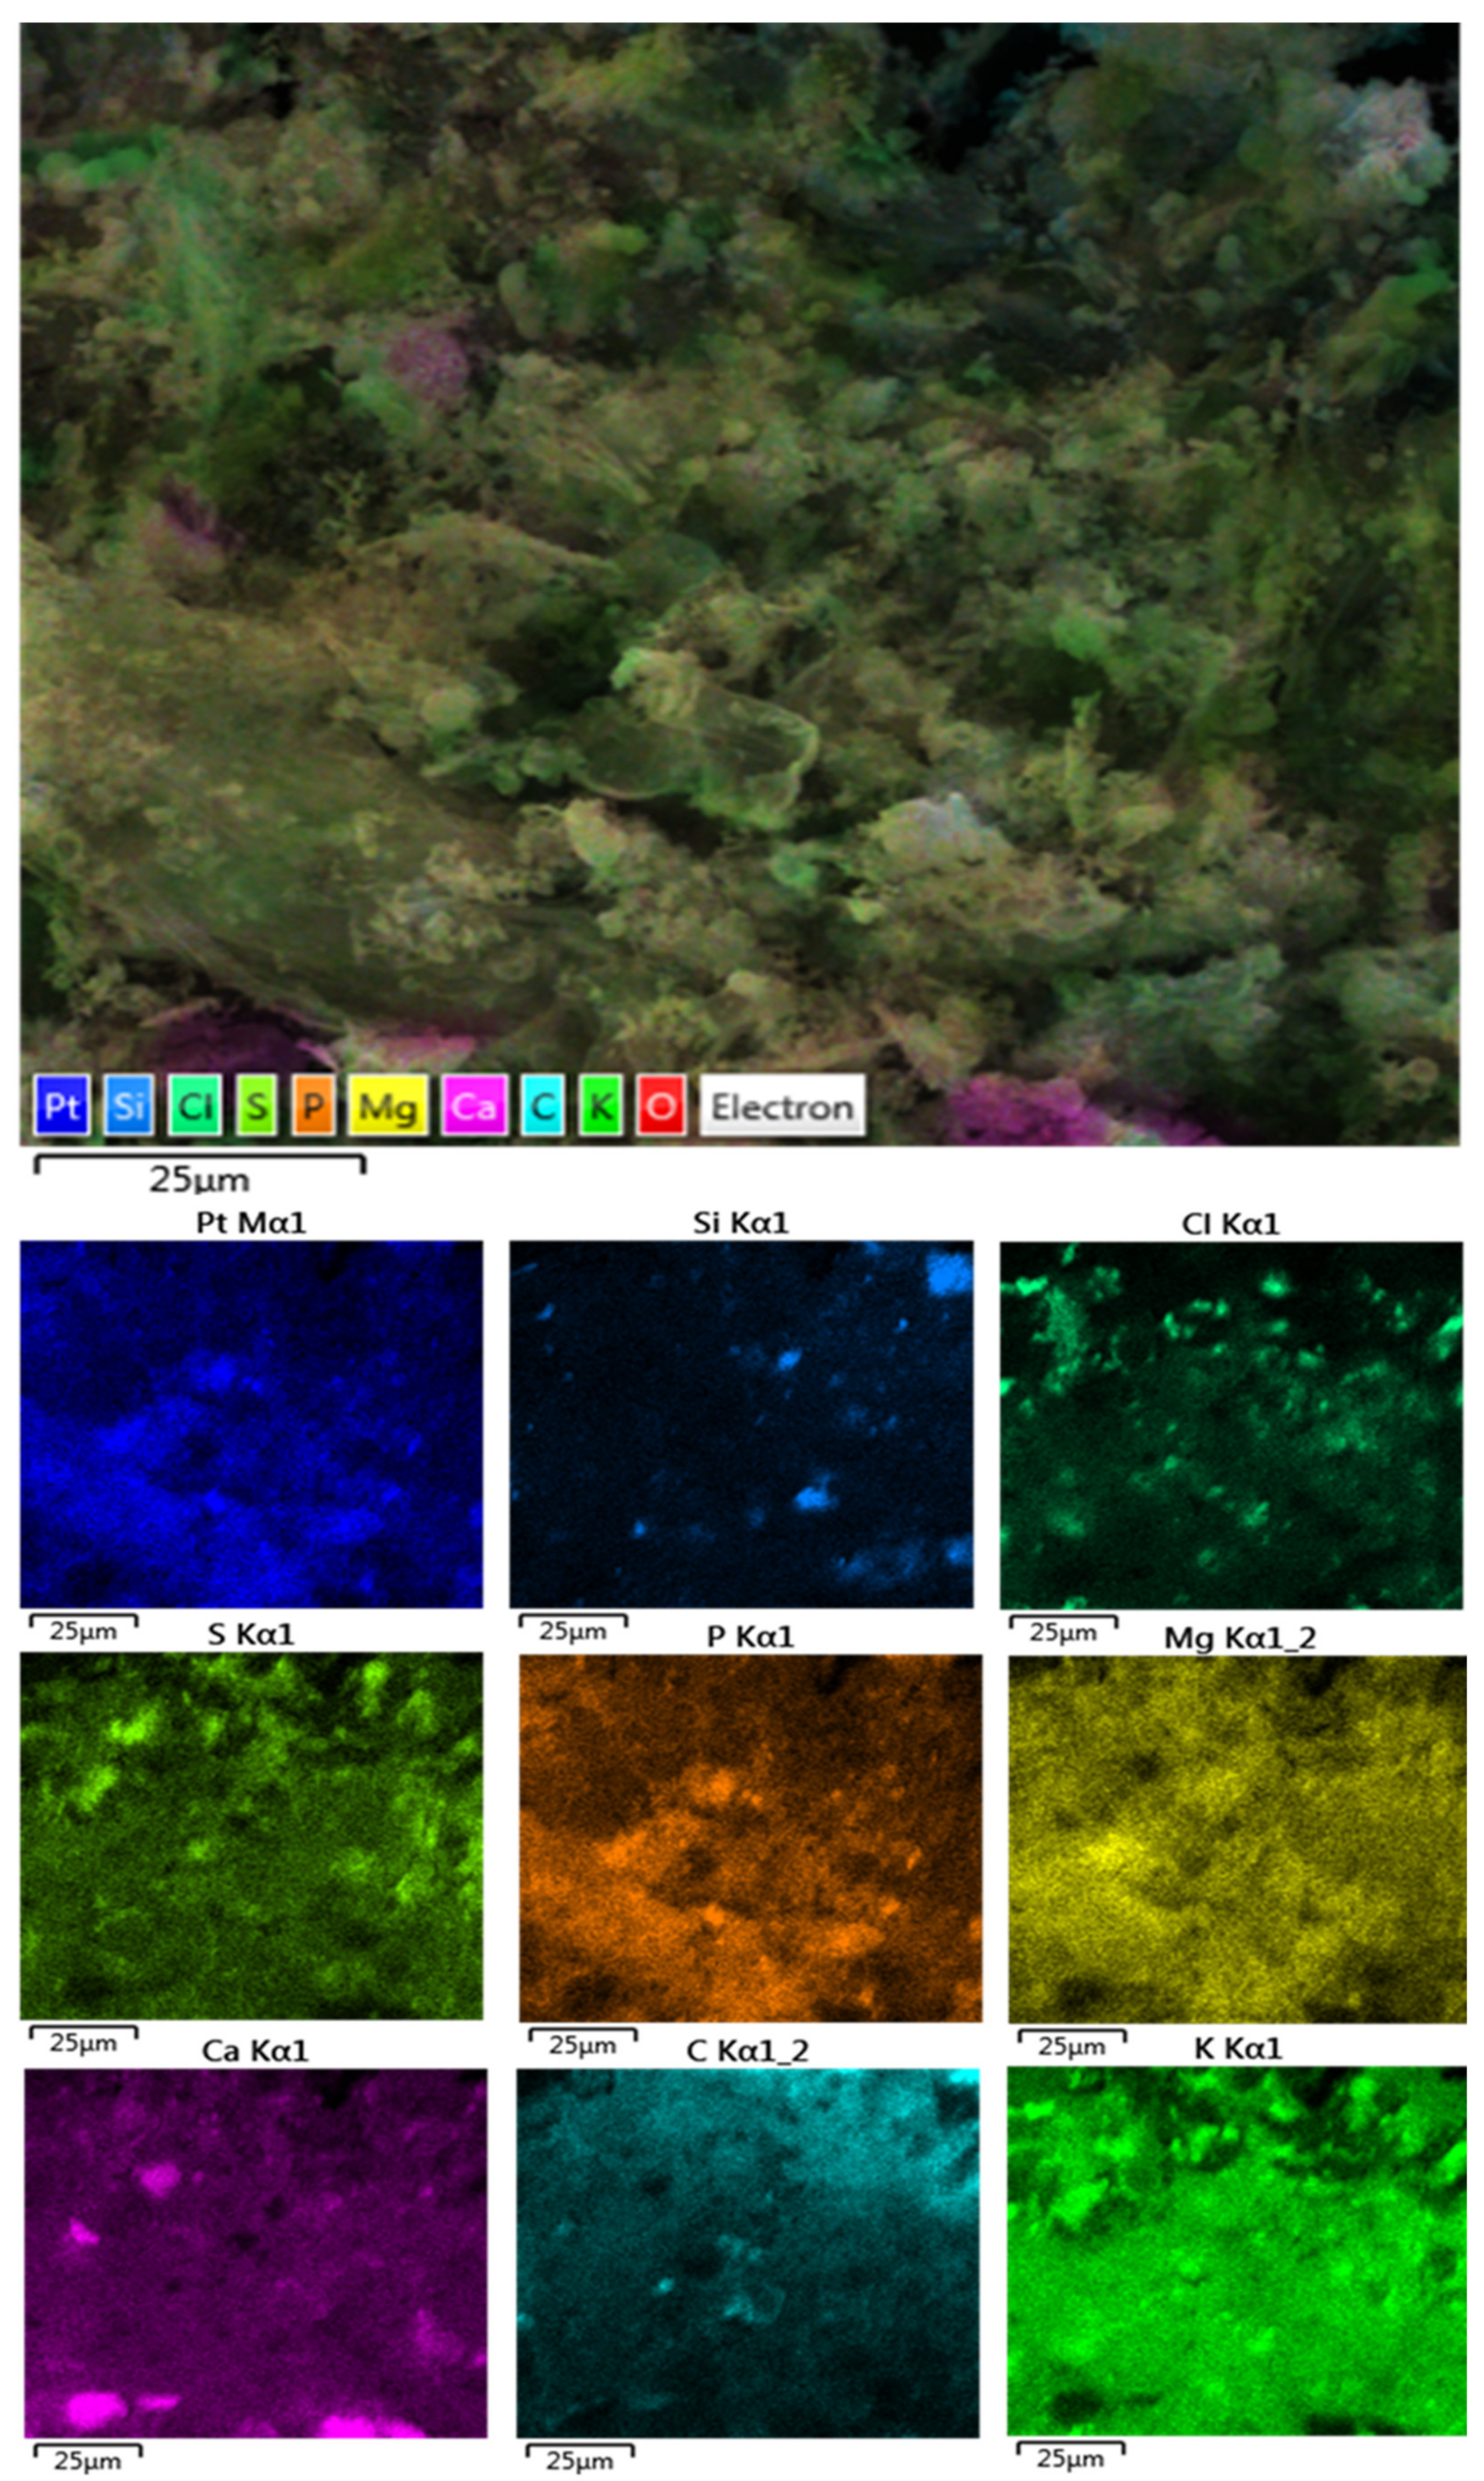
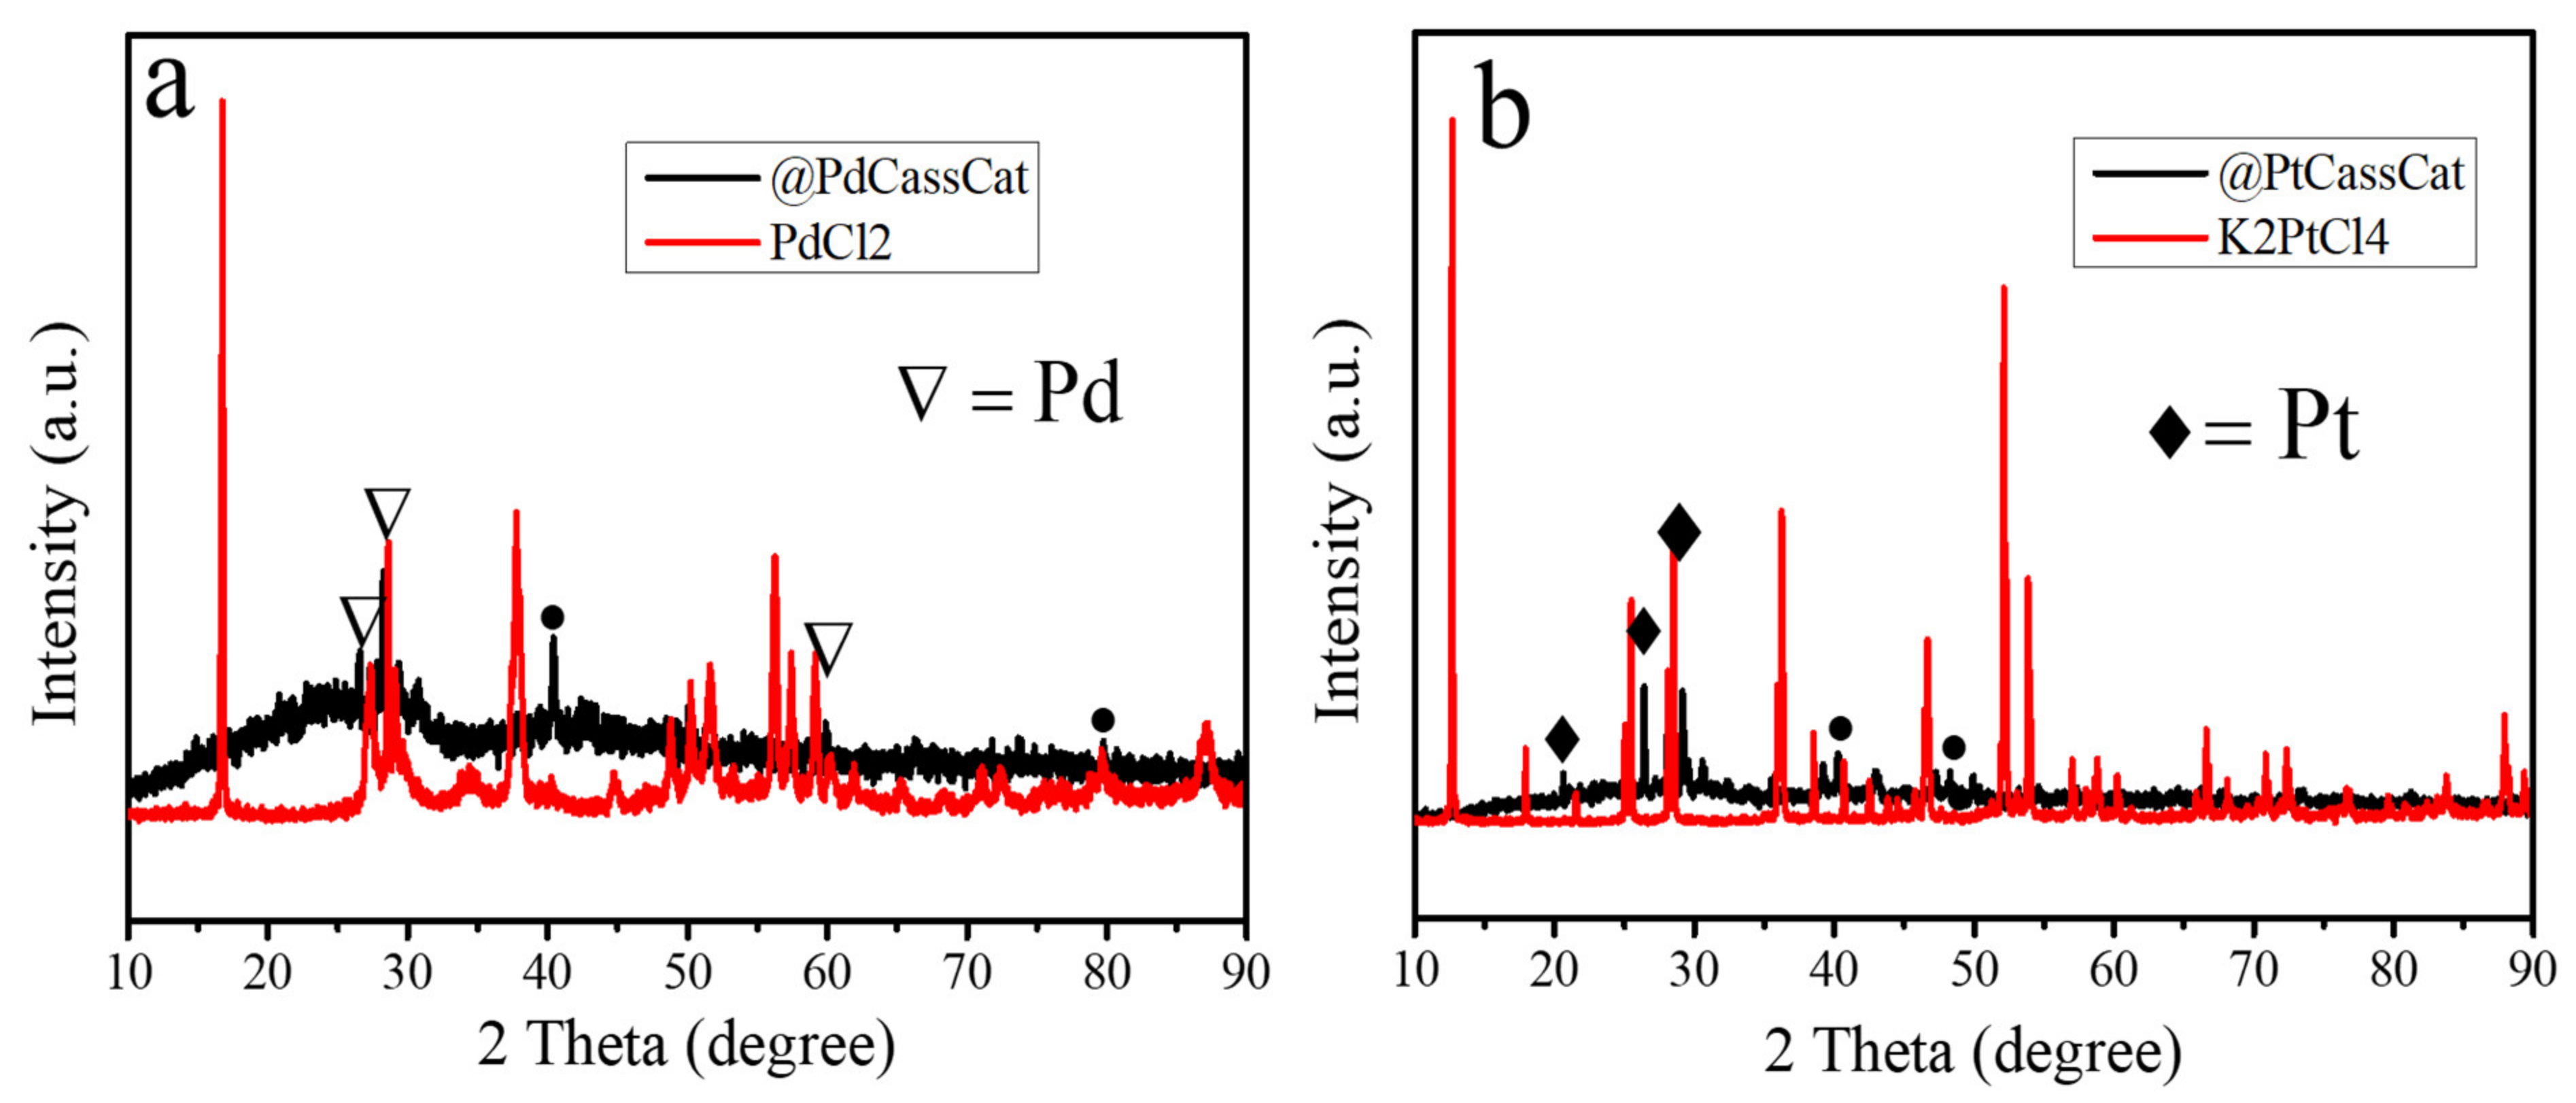
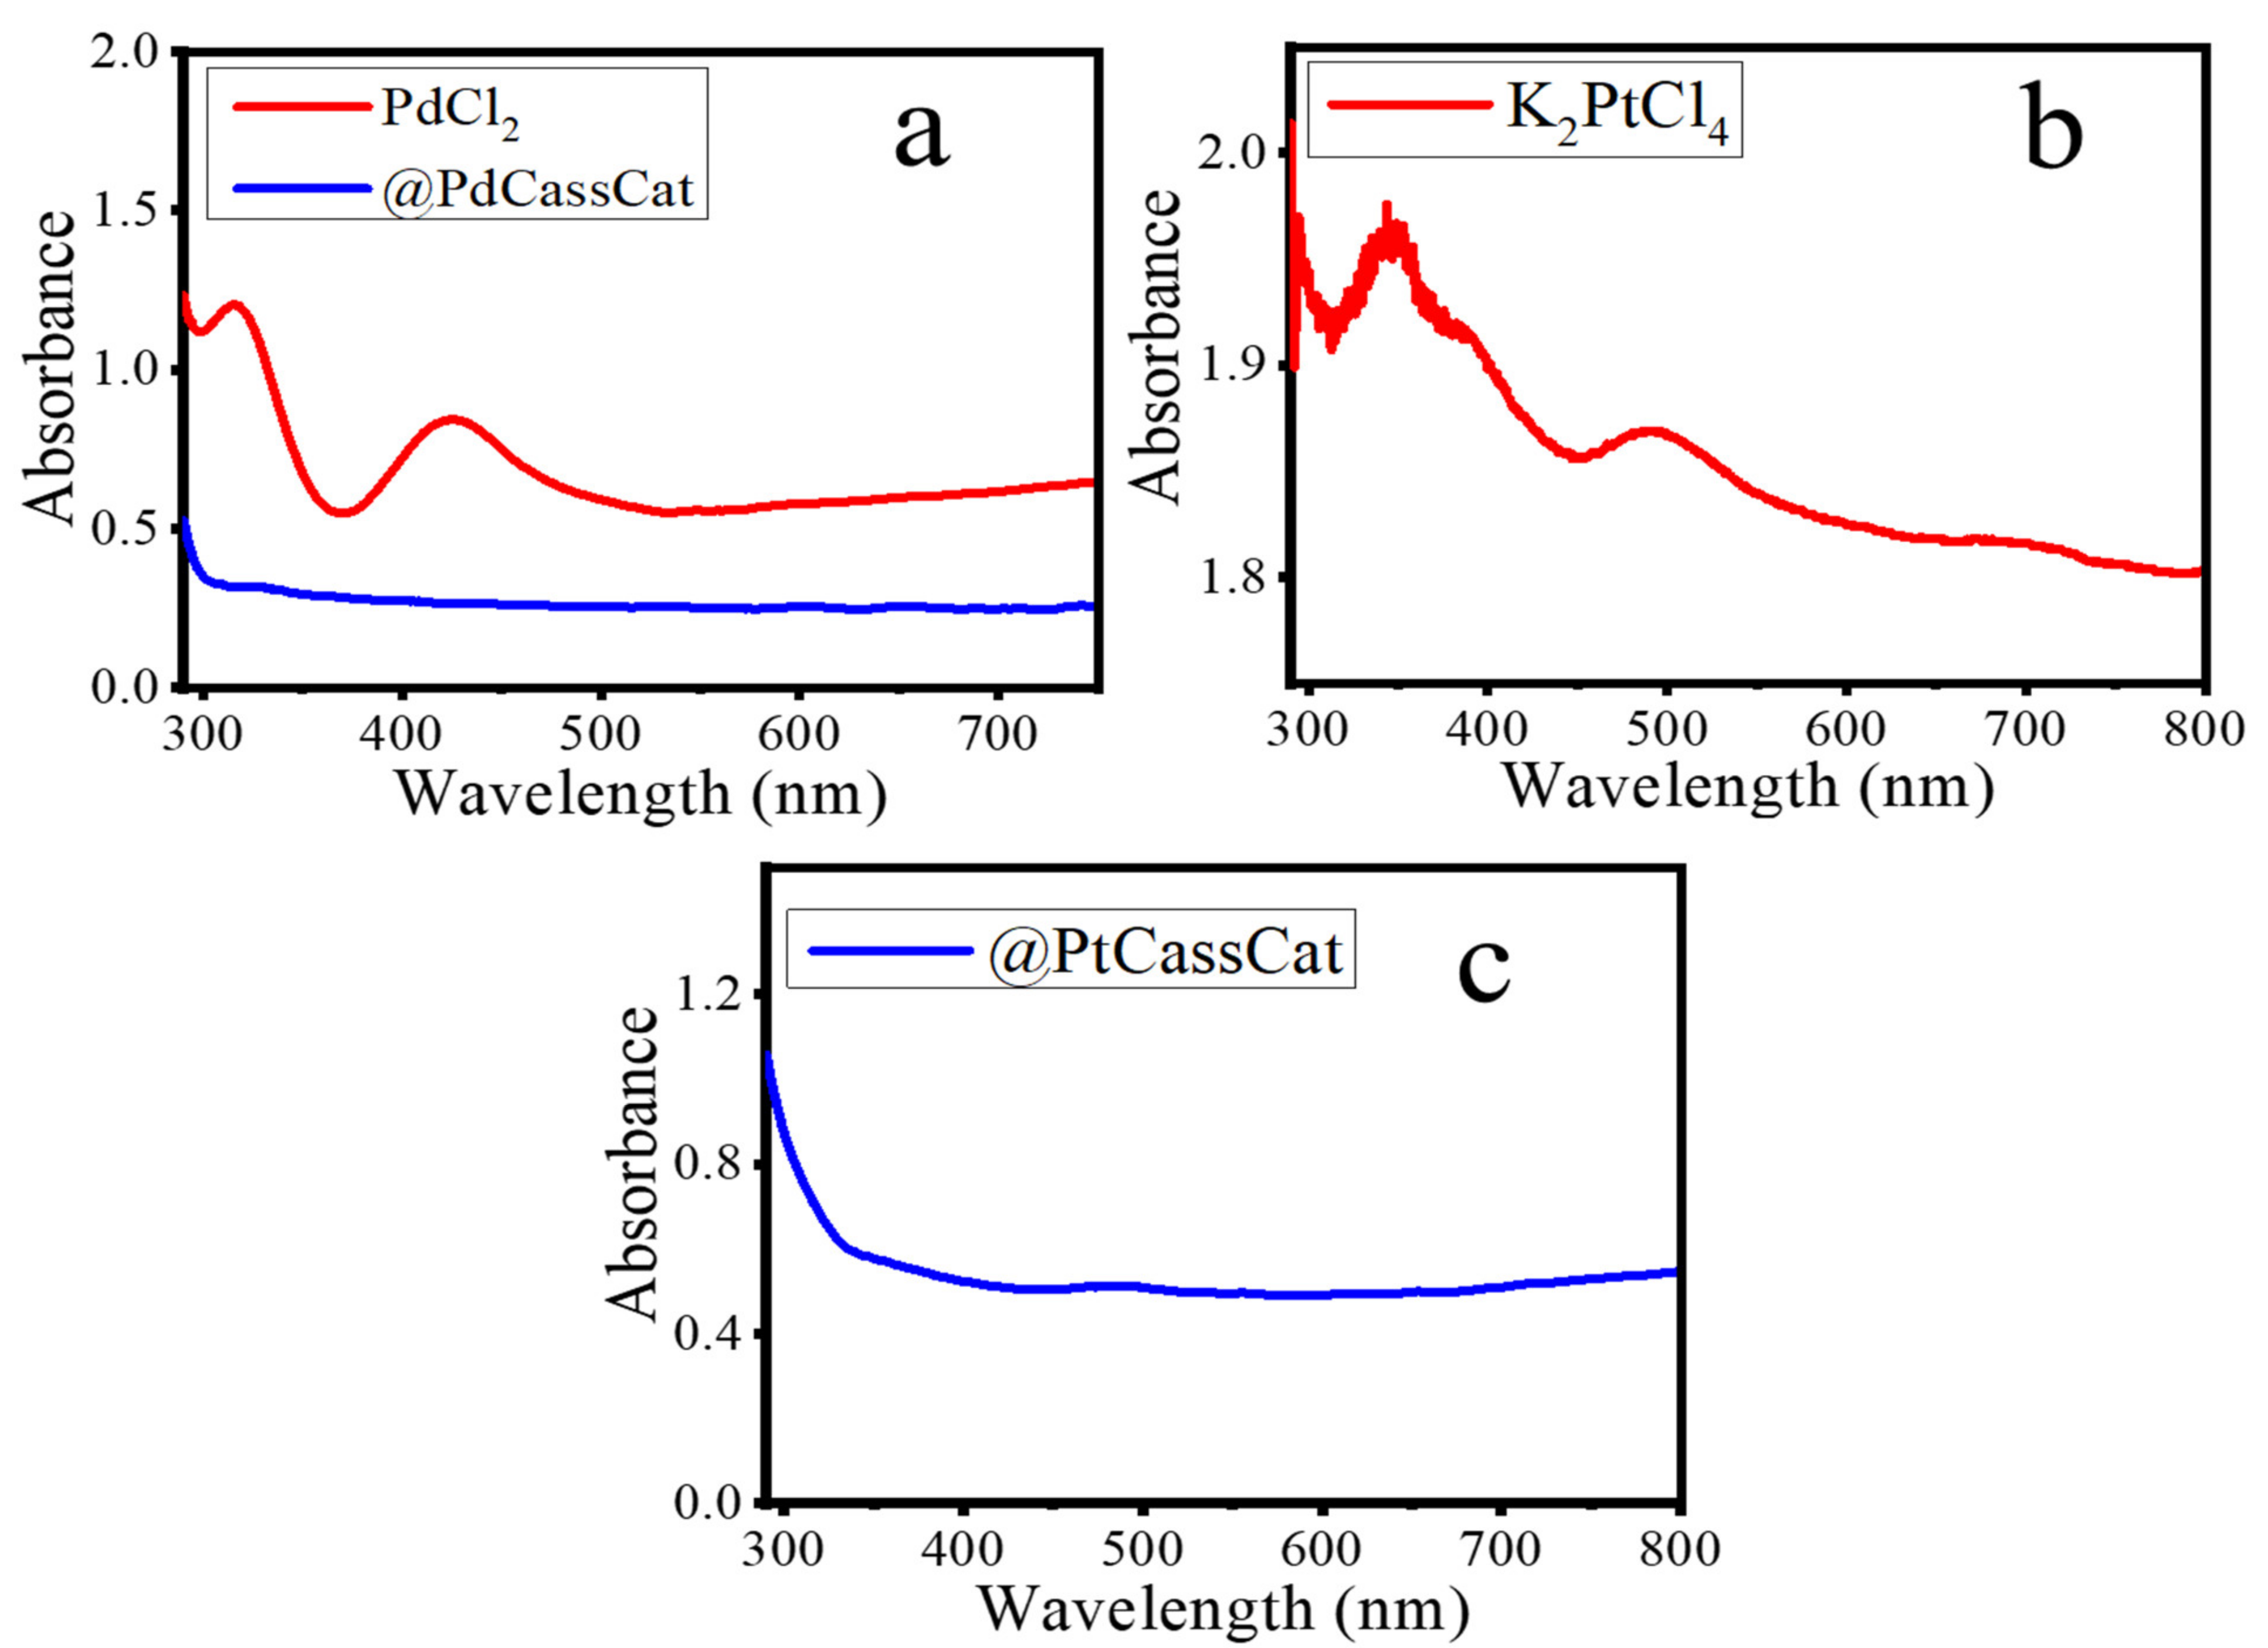
2.6. Catalyst Characterization
2.7. Catalytic Reactions
2.7.1. Catalytic Reaction Procedure for Transfer Hydrogenation Reaction
2.7.2. NMR Studies
2.7.3. Catalyst Recycling Study
3. Results and Discussion
3.1. Catalysis: Transfer Hydrogenation of Furfural
3.1.1. Catalytic Activity of @PdCassCat and @PtCassCat
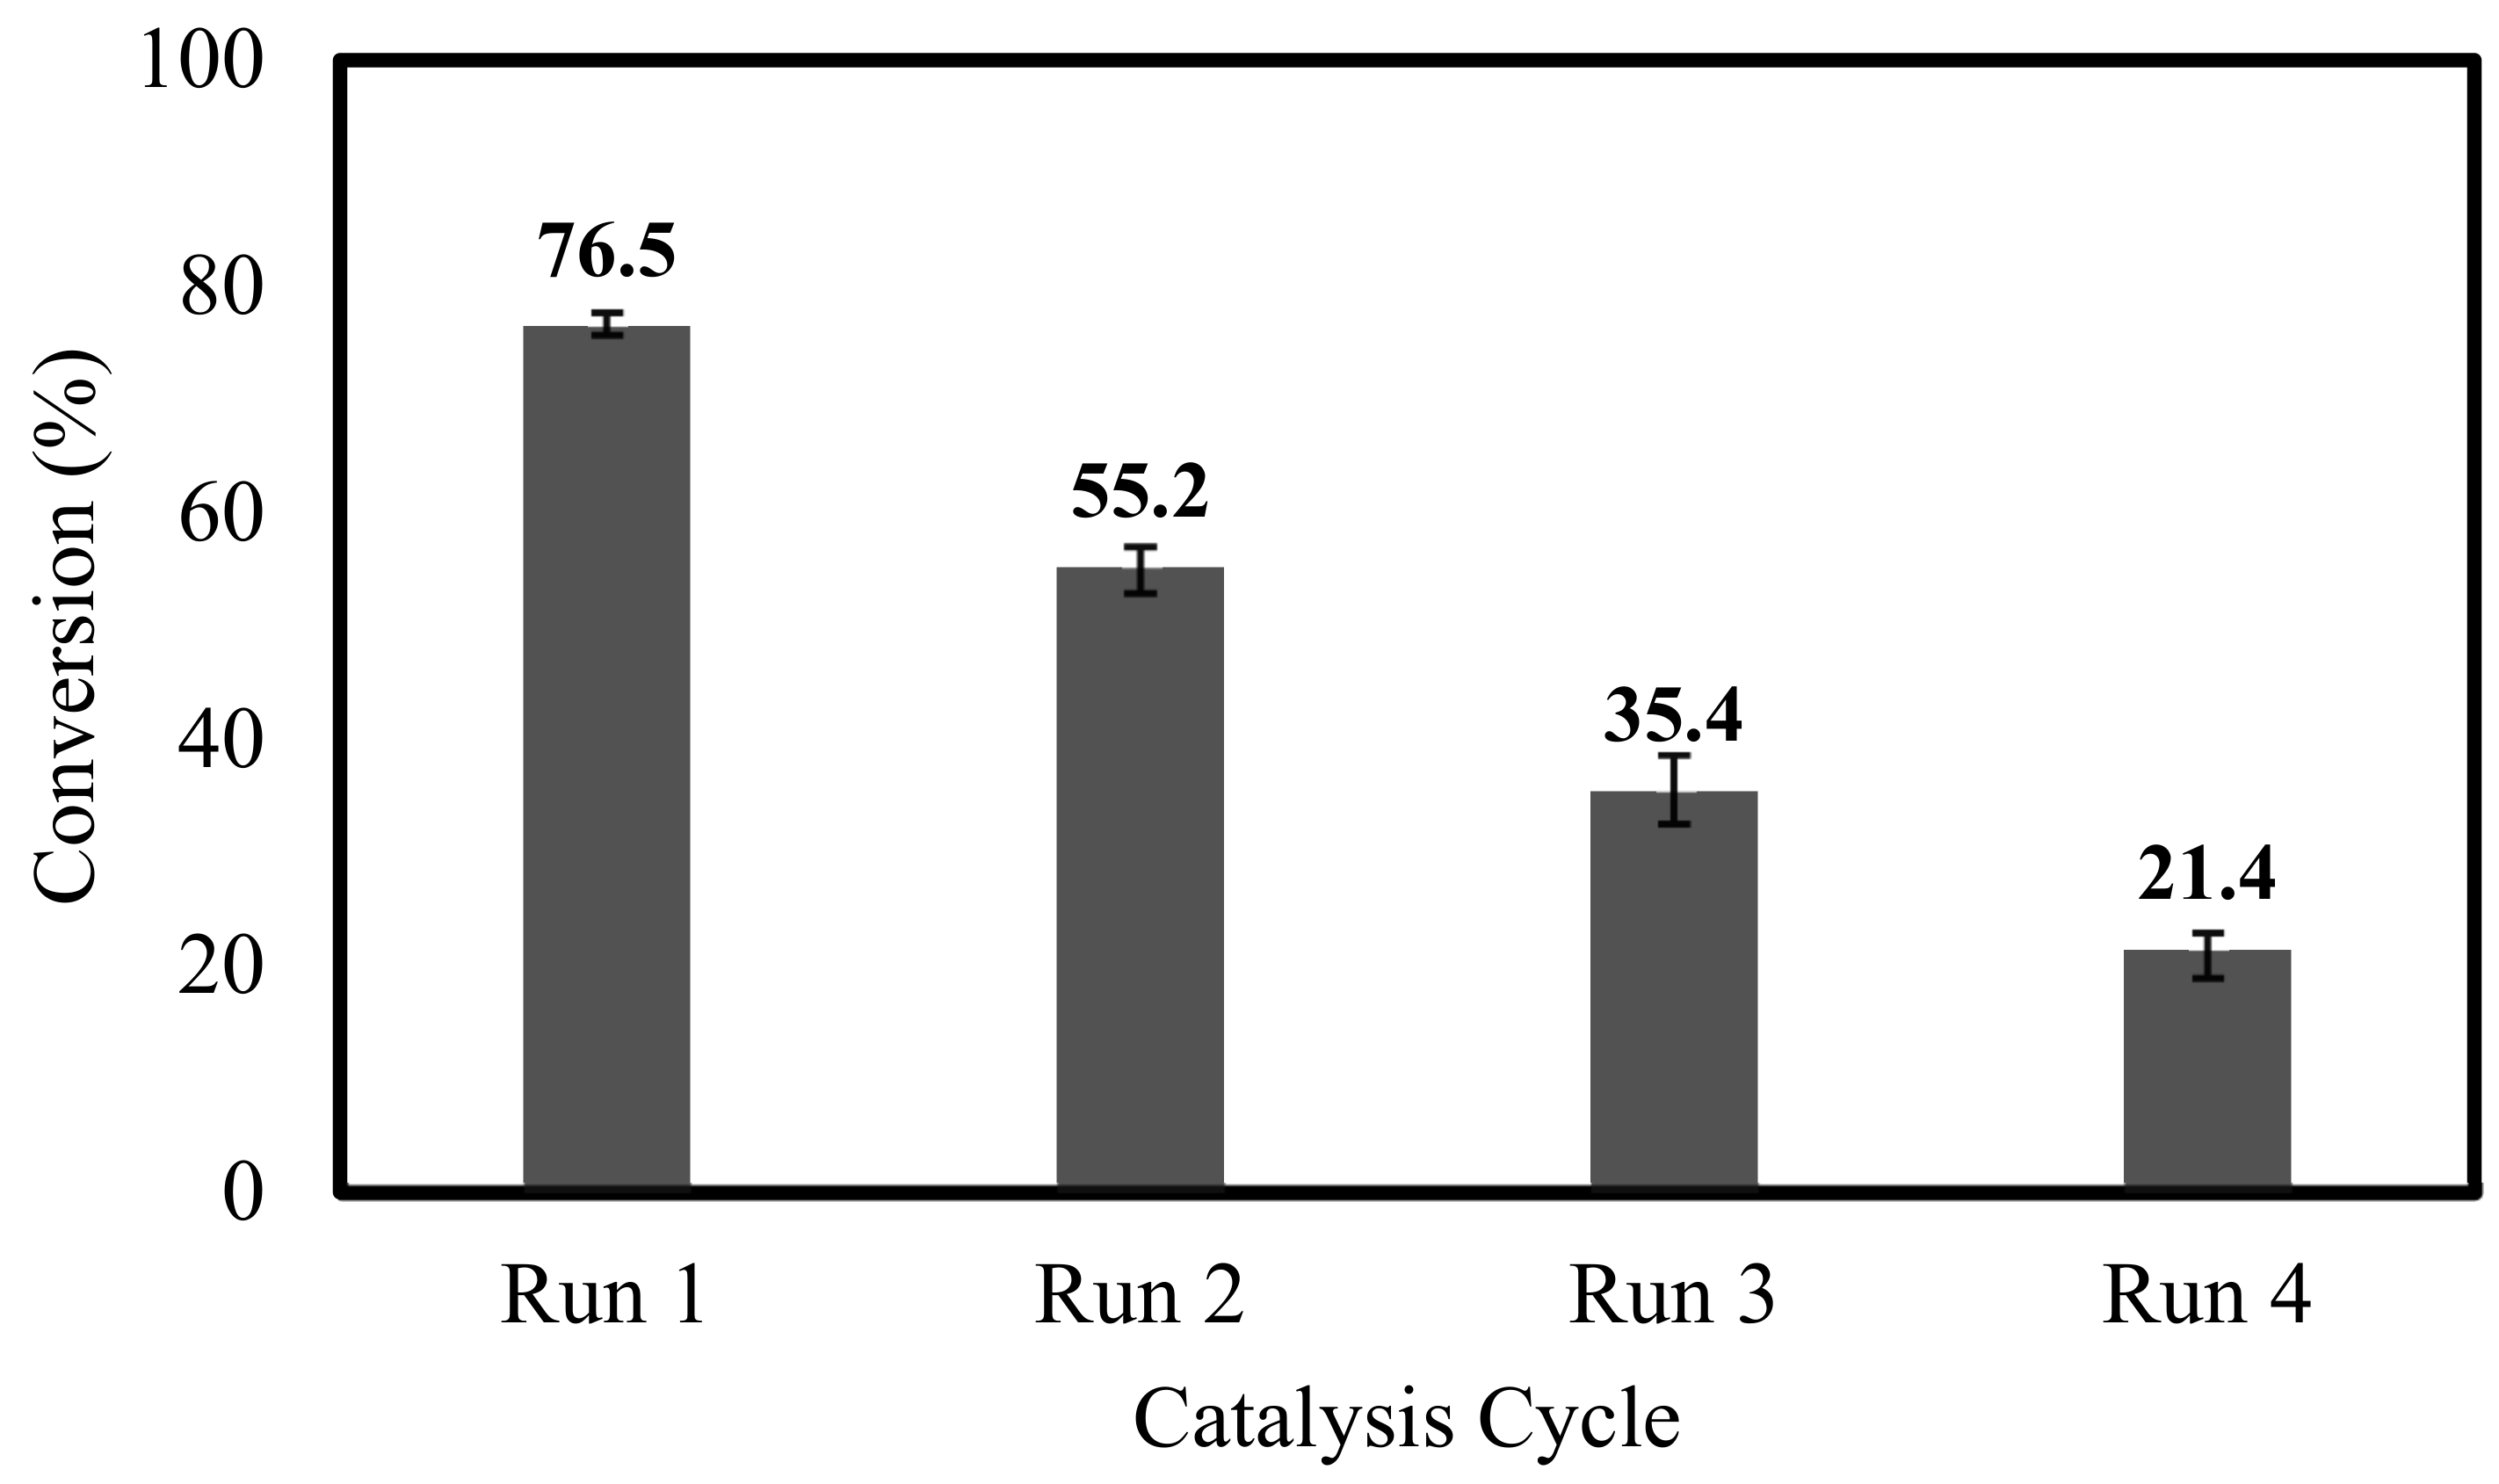
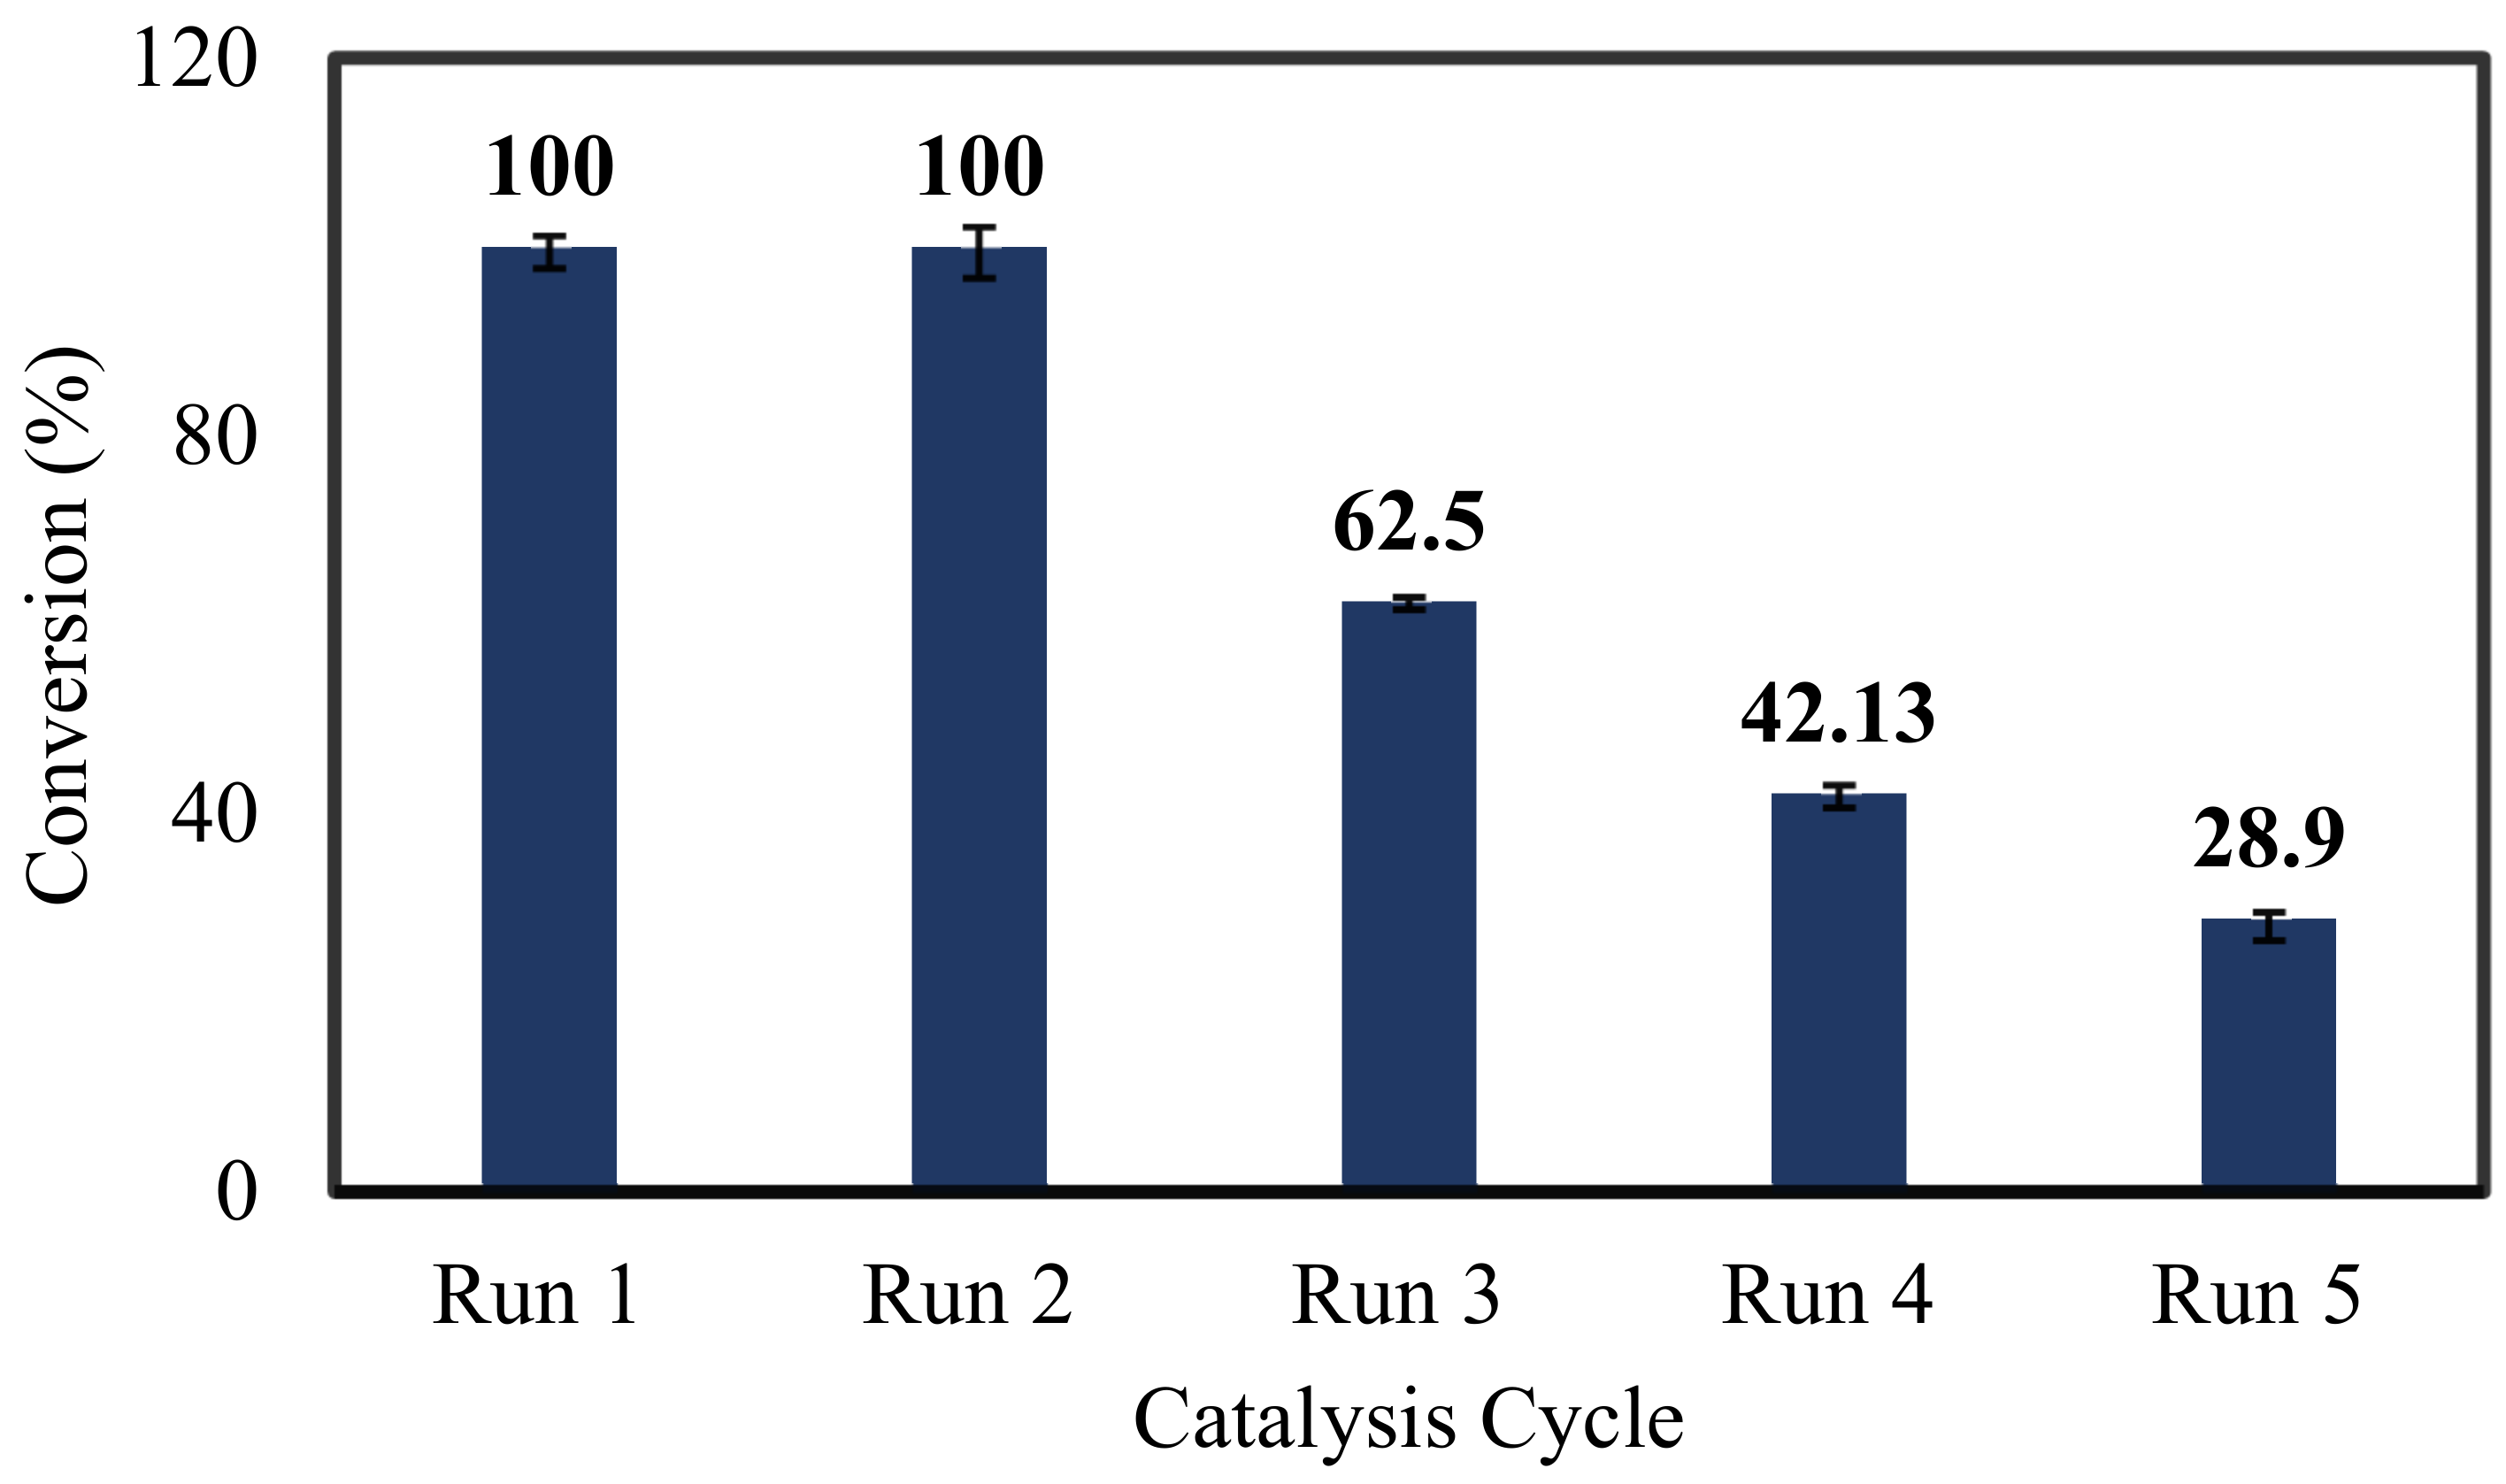
3.1.2. Catalyst Reusability
4. Conclusions
Supplementary Materials
Author Contributions
Funding
Data Availability Statement
Conflicts of Interest
References
- Bini, C.; Maleci, L.; Wahsha, M. Mine Waste: Assessment of Environmental Contamination and Restoration; Elsevier Inc.: Amsterdam, The Netherlands, 2017; ISBN 9780128095881. [Google Scholar]
- Mhlongo, S.E.; Dacosta, F.A.; Mphephu, N.F. In search of appropriate rehabilitation strategies for abandoned Nyala magnesite mine, Limpopo province of south Africa. Int. J. Eng. Appl. Sci. 2013, 2, 18–30. [Google Scholar]
- Pollmann, O.; Meyer, S.; Blumenstein, O.; Van Rensburg, L. Mine tailings: Waste or valuable resource? Waste Biomass Valoriz. 2010, 1, 451–459. [Google Scholar] [CrossRef]
- Stacey, J.; Naude, A.; Hermanus, M. The socio-economic aspects of mine closure and sustainable development Scope of work and approach. J. S. Afr. Inst. Min. Metall. 2010, 110, 378–394. [Google Scholar]
- Brooks, R.R. Plants that Hyperaccumulate Heavy Metals, Their Role in Phytoremediation, Microbiology, Archaeology, Mineral Exploration and Phytomining; CAB International: New York, NY, USA, 1998; p. 289. [Google Scholar]
- Anderson, C.W.N.; Brooks, R.R.; Stewart, R.B.; Simcock, R. Harvesting a crop of gold in plants. Nature 1998, 395, 553–554. [Google Scholar] [CrossRef]
- Anderson, C.W.N. Hyperaccumulation by plants. RSC Green Chem. 2013, 22, 114–139. [Google Scholar]
- Anderson, C.W.N.; Brooks, R.R.; Chiarucci, A.; Lacoste, C.J.; Leblanc, M.; Robinson, B.H.; Simcock, R.; Stewart, R.B. Phytomining for nickel, thallium and gold. J. Geochem. Explor. 1999, 67, 407–415. [Google Scholar] [CrossRef]
- McGrath, S.P.; Sidoli, C.M.D.; Baker, A.J.M.; Reeves, R.D. The Potential for the Use of Metal-Accumulating Plants for the In Situ Decontamination of Metal-Polluted Soils; Springer: Dordrecht, The Netherlands, 1993; pp. 673–676. [Google Scholar]
- Piccinin, R.C.R.; Ebbs, S.D.; Reichman, S.M.; Kolev, S.D.; Woodrow, I.E.; Baker, A.J.M. A screen of some native Australian flora and exotic agricultural species for their potential application in cyanide-induced phytoextraction of gold. Miner. Eng. 2007, 20, 1327–1330. [Google Scholar] [CrossRef]
- Harumain, Z.A.S.; Parker, H.L.; Muñoz García, A.; Austin, M.J.; McElroy, C.R.; Hunt, A.J.; Clark, J.H.; Meech, J.A.; Anderson, C.W.N.; Ciacci, L.; et al. Toward Financially Viable Phytoextraction and Production of Plant-Based Palladium Catalysts. Environ. Sci. Technol. 2017, 51, 2992–3000. [Google Scholar] [CrossRef]
- Lamb, A.E.; Anderson, C.W.N.; Haverkamp, R.G. The Induced Accumulation of Gold in the Plants. Brassica juncea, Berkheya coddii and Chicory. Chem. New Zealand 2001, 9, 34–36. [Google Scholar]
- Alcantara, H.J.P.; Doronila, A.I.; Kolev, S.D. Phytoextraction potential of Manihot esculenta Crantz. (cassava) grown in mercury- and gold-containing biosolids and mine tailings. Miner. Eng. 2017, 114, 57–63. [Google Scholar] [CrossRef]
- Adjorlolo-Gasokpoh, A.; Golow, A.A.; Kambo-Dorsa, J. Mercury in the Surface Soil and Cassava, Manihot esculenta (Flesh, Leaves and Peel) Near Goldmines at Bogoso and Prestea, Ghana. Bull. Environ. Contam. Toxicol. 2012, 89, 1106–1110. [Google Scholar] [CrossRef] [Green Version]
- Hunt, A.J.; Anderson, C.W.N.; Bruce, N.; García, A.M.; Graedel, T.E.; Hodson, M.; Meech, J.A.; Nassar, N.T.; Parker, H.L.; Rylott, E.L.; et al. Phytoextraction as a tool for green chemistry. Green Process. Synth. 2014, 3, 3–22. [Google Scholar] [CrossRef]
- Parker, H.L.; Rylott, E.L.; Hunt, A.J.; Dodson, J.R.; Taylor, A.F.; Bruce, N.C.; Clark, J.H. Supported palladium nanoparticles synthesized by living plants as a catalyst for Suzuki-Miyaura reactions. PLoS ONE 2014, 9, e29590. [Google Scholar] [CrossRef] [PubMed]
- Makhubela, B.C.E.; Darkwa, J. The Role of Noble Metal Catalysts in Conversion of Biomass and Bio-derived Intermediates to Fuels and Chemicals. Johns. Matthey Technol. Rev. 2018, 62, 4–31. [Google Scholar] [CrossRef]
- Tukacs, J.M.; Bohus, M.; Dibó, G.; Mika, L.T. Ruthenium-catalyzed solvent-free conversion of furfural to furfuryl alcohol. RSC Adv. 2017, 7, 3331–3335. [Google Scholar] [CrossRef] [Green Version]
- Gong, W.; Chen, C.; Fan, R.; Zhang, H.; Wang, G.; Zhao, H. Transfer-hydrogenation of furfural and levulinic acid over supported copper catalyst. Fuel 2018, 231, 165–171. [Google Scholar] [CrossRef]
- Parikh, J.; Srivastava, S.; Jadeja, G.C. Selective Hydrogenation of Furfural to Tetrahydrofurfuryl Alcohol Using Supported Nickel-Cobalt Catalysts. Ind. Eng. Chem. Res. 2019, 58, 16138–16152. [Google Scholar] [CrossRef]
- Sitthisa, S.; An, W.; Resasco, D.E. Selective conversion of furfural to methylfuran over silica-supported NiFe bimetallic catalysts. J. Catal. 2011, 284, 90–101. [Google Scholar] [CrossRef]
- Wang, Y.; Zhao, D.; Liang, R.; Triantafyllidis, K.S.; Yang, W.; Len, C. Transfer hydrogenation of furfural to furfuryl alcohol over modified Zr-based catalysts using primary alcohols as H-donors. Mol. Catal. 2021, 499, 111199. [Google Scholar] [CrossRef]
- Rao, R.S.; Baker, R.T.K.; Vannice, M.A. Furfural hydrogenation over carbon-supported copper. Catal. Lett. 1999, 60, 51–57. [Google Scholar] [CrossRef]
- Gong, W.; Chen, C.; Zhang, Y.; Zhou, H.; Wang, H.; Zhang, H.; Zhang, Y.; Wang, G.; Zhao, H. Efficient Synthesis of Furfuryl Alcohol from H2-Hydrogenation/Transfer Hydrogenation of Furfural Using Sulfonate Group Modified Cu Catalyst. ACS Sustain. Chem. Eng. 2017, 5, 2172–2180. [Google Scholar] [CrossRef]
- Zhang, H.; Canlas, C.; Jeremy Kropf, A.; Elam, J.W.; Dumesic, J.A.; Marshall, C.L. Enhancing the stability of copper chromite catalysts for the selective hydrogenation of furfural with ALD overcoating (II)—Comparison between TiO2 and Al2O3 overcoatings. J. Catal. 2015, 326, 172–181. [Google Scholar] [CrossRef] [Green Version]
- Nagaraja, B.M.; Siva Kumar, V.; Shasikala, V.; Padmasri, A.H.; Sreedhar, B.; David Raju, B.; Rama Rao, K.S. A highly efficient Cu/MgO catalyst for vapour phase hydrogenation of furfural to furfuryl alcohol. Catal. Commun. 2003, 4, 287–293. [Google Scholar] [CrossRef]
- Taylor, M.J.; Durndell, L.J.; Isaacs, M.A.; Parlett, C.M.A.; Wilson, K.; Lee, A.F.; Kyriakou, G. Highly selective hydrogenation of furfural over supported Pt nanoparticles under mild conditions. Appl. Catal. B Environ. 2016, 180, 580–585. [Google Scholar] [CrossRef]
- Vaidya, P.D.; Mahajani, V.V. Kinetics of liquid-phase hydrogenation of furfuraldehyde to furfuryl alcohol over a Pt/C catalyst. Ind. Eng. Chem. Res. 2003, 42, 3881–3885. [Google Scholar] [CrossRef]
- Fulajtárova, K.; Soták, T.; Hronec, M.; Vávra, I.; Dobročka, E.; Omastová, M. Aqueous phase hydrogenation of furfural to furfuryl alcohol over Pd-Cu catalysts. Appl. Catal. A Gen. 2015, 502, 78–85. [Google Scholar] [CrossRef]
- Mekonnen, K.N.; Ambushe, A.A.; Chandravanshi, B.S.; Redi-Abshiro, M. Assessment of potentially toxic elements in Swiss chard and sediments of Akaki River, Ethiopia. Toxicol. Environ. Chem. 2014, 96, 1501–1515. [Google Scholar] [CrossRef]
- Moyo, P.S.; Matsinha, L.C.; Makhubela, B.C.E. Pd(II) and Pt(II) catalysed selective synthesis of furfuryl alcohol: Solvent effects and insights into the mechanism. J. Organomet. Chem. 2020, 922, 121362. [Google Scholar] [CrossRef]
- Wu, W.; Zhao, W.; Fang, C.; Wang, Z.; Yang, T.; Li, H.; Yang, S. Quantitative hydrogenation of furfural to furfuryl alcohol with recyclable KF and hydrosilane at room temperature in minutes. Catal. Commun. 2018, 105, 6–10. [Google Scholar] [CrossRef]
- Gawrońska, H.; Przybysz, A.; Szalacha, E.; Pawlak, K.; Brama, K.; Miszczak, A.; Stankiewicz-Kosyl, M.; Gawroński, S.W. Platinum uptake, distribution and toxicity in Arabidopsis thaliana L. plants. Ecotoxicol. Environ. Saf. 2018, 147, 982–989. [Google Scholar] [CrossRef]
- Lesniewska, B.A.; Messerschmidt, J.; Jakubowski, N.; Hulanicki, A. Bioaccumulation of platinum group elements and characterization of their species in Lolium multiflorum by size-exclusion chromatography coupled with ICP-MS. Sci. Total Environ. 2004, 322, 95–108. [Google Scholar] [CrossRef] [PubMed]
- Schäfer, J.; Hannker, D.; Eckhardt, J.D.; Stüben, D. Uptake of traffic-related heavy metals and platinum group elements (PGE) by plants. Sci. Total Environ. 1998, 215, 59–67. [Google Scholar] [CrossRef]
- Arsiya, F.; Sayadi, M.H.; Sobhani, S. Green synthesis of palladium nanoparticles using Chlorella vulgaris. Mater. Lett. 2017, 186, 113–115. [Google Scholar] [CrossRef]
- Ha, C.; Zhu, N.; Shang, R.; Shi, C.; Cui, J.; Sohoo, I.; Wu, P.; Cao, Y. Biorecovery of palladium as nanoparticles by Enterococcus faecalis and its catalysis for chromate reduction. Chem. Eng. J. 2016, 288, 246–254. [Google Scholar] [CrossRef]
- Targhan, H.; Hassanpour, A.; Sohrabnezhad, S.; Bahrami, K. Palladium Nanoparticles Immobilized with Polymer Containing Nitrogen-Based Ligand: A Highly Efficient Catalyst for Suzuki–Miyaura and Mizoroki–Heck Coupling Reactions. Catal. Lett. 2020, 150, 660–673. [Google Scholar] [CrossRef]
- Shaik, M.R.; Ali, Z.J.Q.; Khan, M.; Kuniyil, M.; Assal, M.E.; Alkhathlan, H.Z.; Al-Warthan, A.; Siddiqui, M.R.H.; Khan, M.; Adil, S.F. Green Synthesis and Characterization of Palladium Nanoparticles Using Origanum vulgare L. Extract and Their Catalytic Activity. Molecules 2017, 22, 165. [Google Scholar] [CrossRef]
- Bendre, A.D.; Patil, V.P.; Terdale, S.S.; Kodam, K.M.; Waghmode, S.B. A simple, efficient and green approach for the synthesis of palladium nanoparticles using Oxytocin: Application for ligand free Suzuki reaction and total synthesis of aspongpyrazine A. J. Organomet. Chem. 2020, 909, 121093. [Google Scholar] [CrossRef]
- Siddiqi, K.S.; Husen, A. Green Synthesis, Characterization and Uses of Palladium/Platinum Nanoparticles. Nanoscale Res. Lett. 2016, 11, 1–13. [Google Scholar] [CrossRef] [Green Version]
- Al-Marri, A.H.; Khan, M.; Shaik, M.R.; Mohri, N.; Adil, S.F.; Kuniyil, M.; Alkhathlan, H.Z.; Al-Warthan, A.; Tremel, W.; Tahir, M.N.; et al. Green synthesis of Pd@graphene nanocomposite: Catalyst for the selective oxidation of alcohols. Arab. J. Chem. 2016, 9, 835–845. [Google Scholar] [CrossRef] [Green Version]
- Jameel, M.S.; Aziz, A.A.; Dheyab, M.A.; Mehrdel, B.; Khaniabadi, P.M. Rapid sonochemically-assisted green synthesis of highly stable and biocompatible platinum nanoparticles. Surf. Interfaces 2020, 20, 100635. [Google Scholar] [CrossRef]
- Asztemborska, M.; Steborowski, R.; Kowalska, J.; Bystrzejewska-Piotrowska, G. Accumulation of platinum nanoparticles by Sinapis alba and Lepidium sativum plants. Water Air Soil Pollut. 2015, 226, 126. [Google Scholar] [CrossRef] [PubMed] [Green Version]
- Bali, R.; Siegele, R.; Harris, A.T. Biogenic Pt uptake and nanoparticle formation in Medicago sativa and Brassica juncea. J. Nanopart. Res. 2010, 12, 3087–3095. [Google Scholar] [CrossRef]
- Sing, K.S.W.; Everett, D.H.; Haul, R.A.W.; Moscou, L.; Pierotti, R.A.; Rouquerol, J.; Siemieniewska, T. Reporting Physisorption Data for Gas/Solid Systems with Special Reference to the Determination of Surface Area and Porosity. Pure Appl. Chem. 1985, 57, 603–619. [Google Scholar] [CrossRef]
- Thommes, M.; Kaneko, K.; Neimark, A.V.; Olivier, J.P.; Rodriguez-Reinoso, F.; Rouquerol, J.; Sing, K.S.W. Physisorption of gases, with special reference to the evaluation of surface area and pore size distribution (IUPAC Technical Report). Pure Appl. Chem. 2015, 87, 1051–1069. [Google Scholar] [CrossRef] [Green Version]
- Ramana, D.V.; Pillai, C.N. Hydrogen transfer reactions. I. Reduction of carbonyl compounds by alcohols catalyzed by alumina. Can. J. Chem. 1969, 47, 3705–3707. [Google Scholar] [CrossRef]
- Xu, Y.; Qiu, S.; Long, J.; Wang, C.; Chang, J.; Tan, J.; Liu, Q.; Ma, L.; Wang, T.; Zhang, Q. In situ hydrogenation of furfural with additives over. RSC Adv. 2015, 5, 91190–91195. [Google Scholar] [CrossRef]
- Nguyen, L.T.M.; Park, H.; Banu, M.; Kim, J.Y.; Youn, D.H.; Magesh, G.; Kim, W.Y.; Lee, J.S. Catalytic CO2 hydrogenation to formic acid over carbon nanotube-graphene supported PdNi alloy catalysts. RSC Adv. 2015, 5, 105560–105566. [Google Scholar] [CrossRef]
- Silva, W.R.; Matsubara, E.Y.; Rosolen, J.M.; Donate, P.M.; Gunnella, R. Pd catalysts supported on different hydrophilic or hydrophobic carbonaceous substrate for furfural and 5-(hydroxymethyl)-furfural hydrogenation in water. Mol. Catal. 2021, 504, 111496. [Google Scholar] [CrossRef]


| Parameters | Setting |
|---|---|
| RF generator power | 1400 W |
| Generator of radio frequency | 40 MHz |
| Plasma argon flow rate | 12.02 L/min |
| Auxiliary argon flow rate | 1.00 L/min |
| Nebulizer argon flow rate | 0.80 L/min |
| Sample uptake rate | 1.00 mL/min |
| Inner diameter of the torch injector | 2.00 mm |
| Nebulizer type | Perkin-Elmer cross flow |
| Type of spray chamber | Double pass Scott spray chamber |
| Measurement replicates | 3 |
| Element | Pd 340.458 nm |
| Pt 214.423 nm |
| Plant Organs | Amount Uptake (µg/g) | Percentage Uptaken | Control |
|---|---|---|---|
| Leaf | ≤0.0026 | ≤0.0026 | ≤0.0026 |
| Stem | ≤0.0026 | ≤0.0026 | ≤0.0026 |
| Adventitious root | 78 ± 0.047 | 22 | ≤0.0026 |
| Soil | 356 ± 0.091 | __ | ≤0.0326 |
| Total Uptaken by Plant | 78 ± 0.047 | 22% |
| Plant Organs | Amount Uptake (µg/g) | Percentage Uptaken (%) | Control |
|---|---|---|---|
| Leaf | 264 ± 0.071 | 11 | ≤0.036 |
| Stem | 106 ± 0.005 | 4.4 | ≤0.036 |
| Adventitious root | 1276 ± 0.035 | 53 | ≤0.036 |
| Soil | 2408 ± 0.046 | __ | ≤0.042 |
| Total Uptaken by Plant | 1646 ± 0.111 | 68.4 |
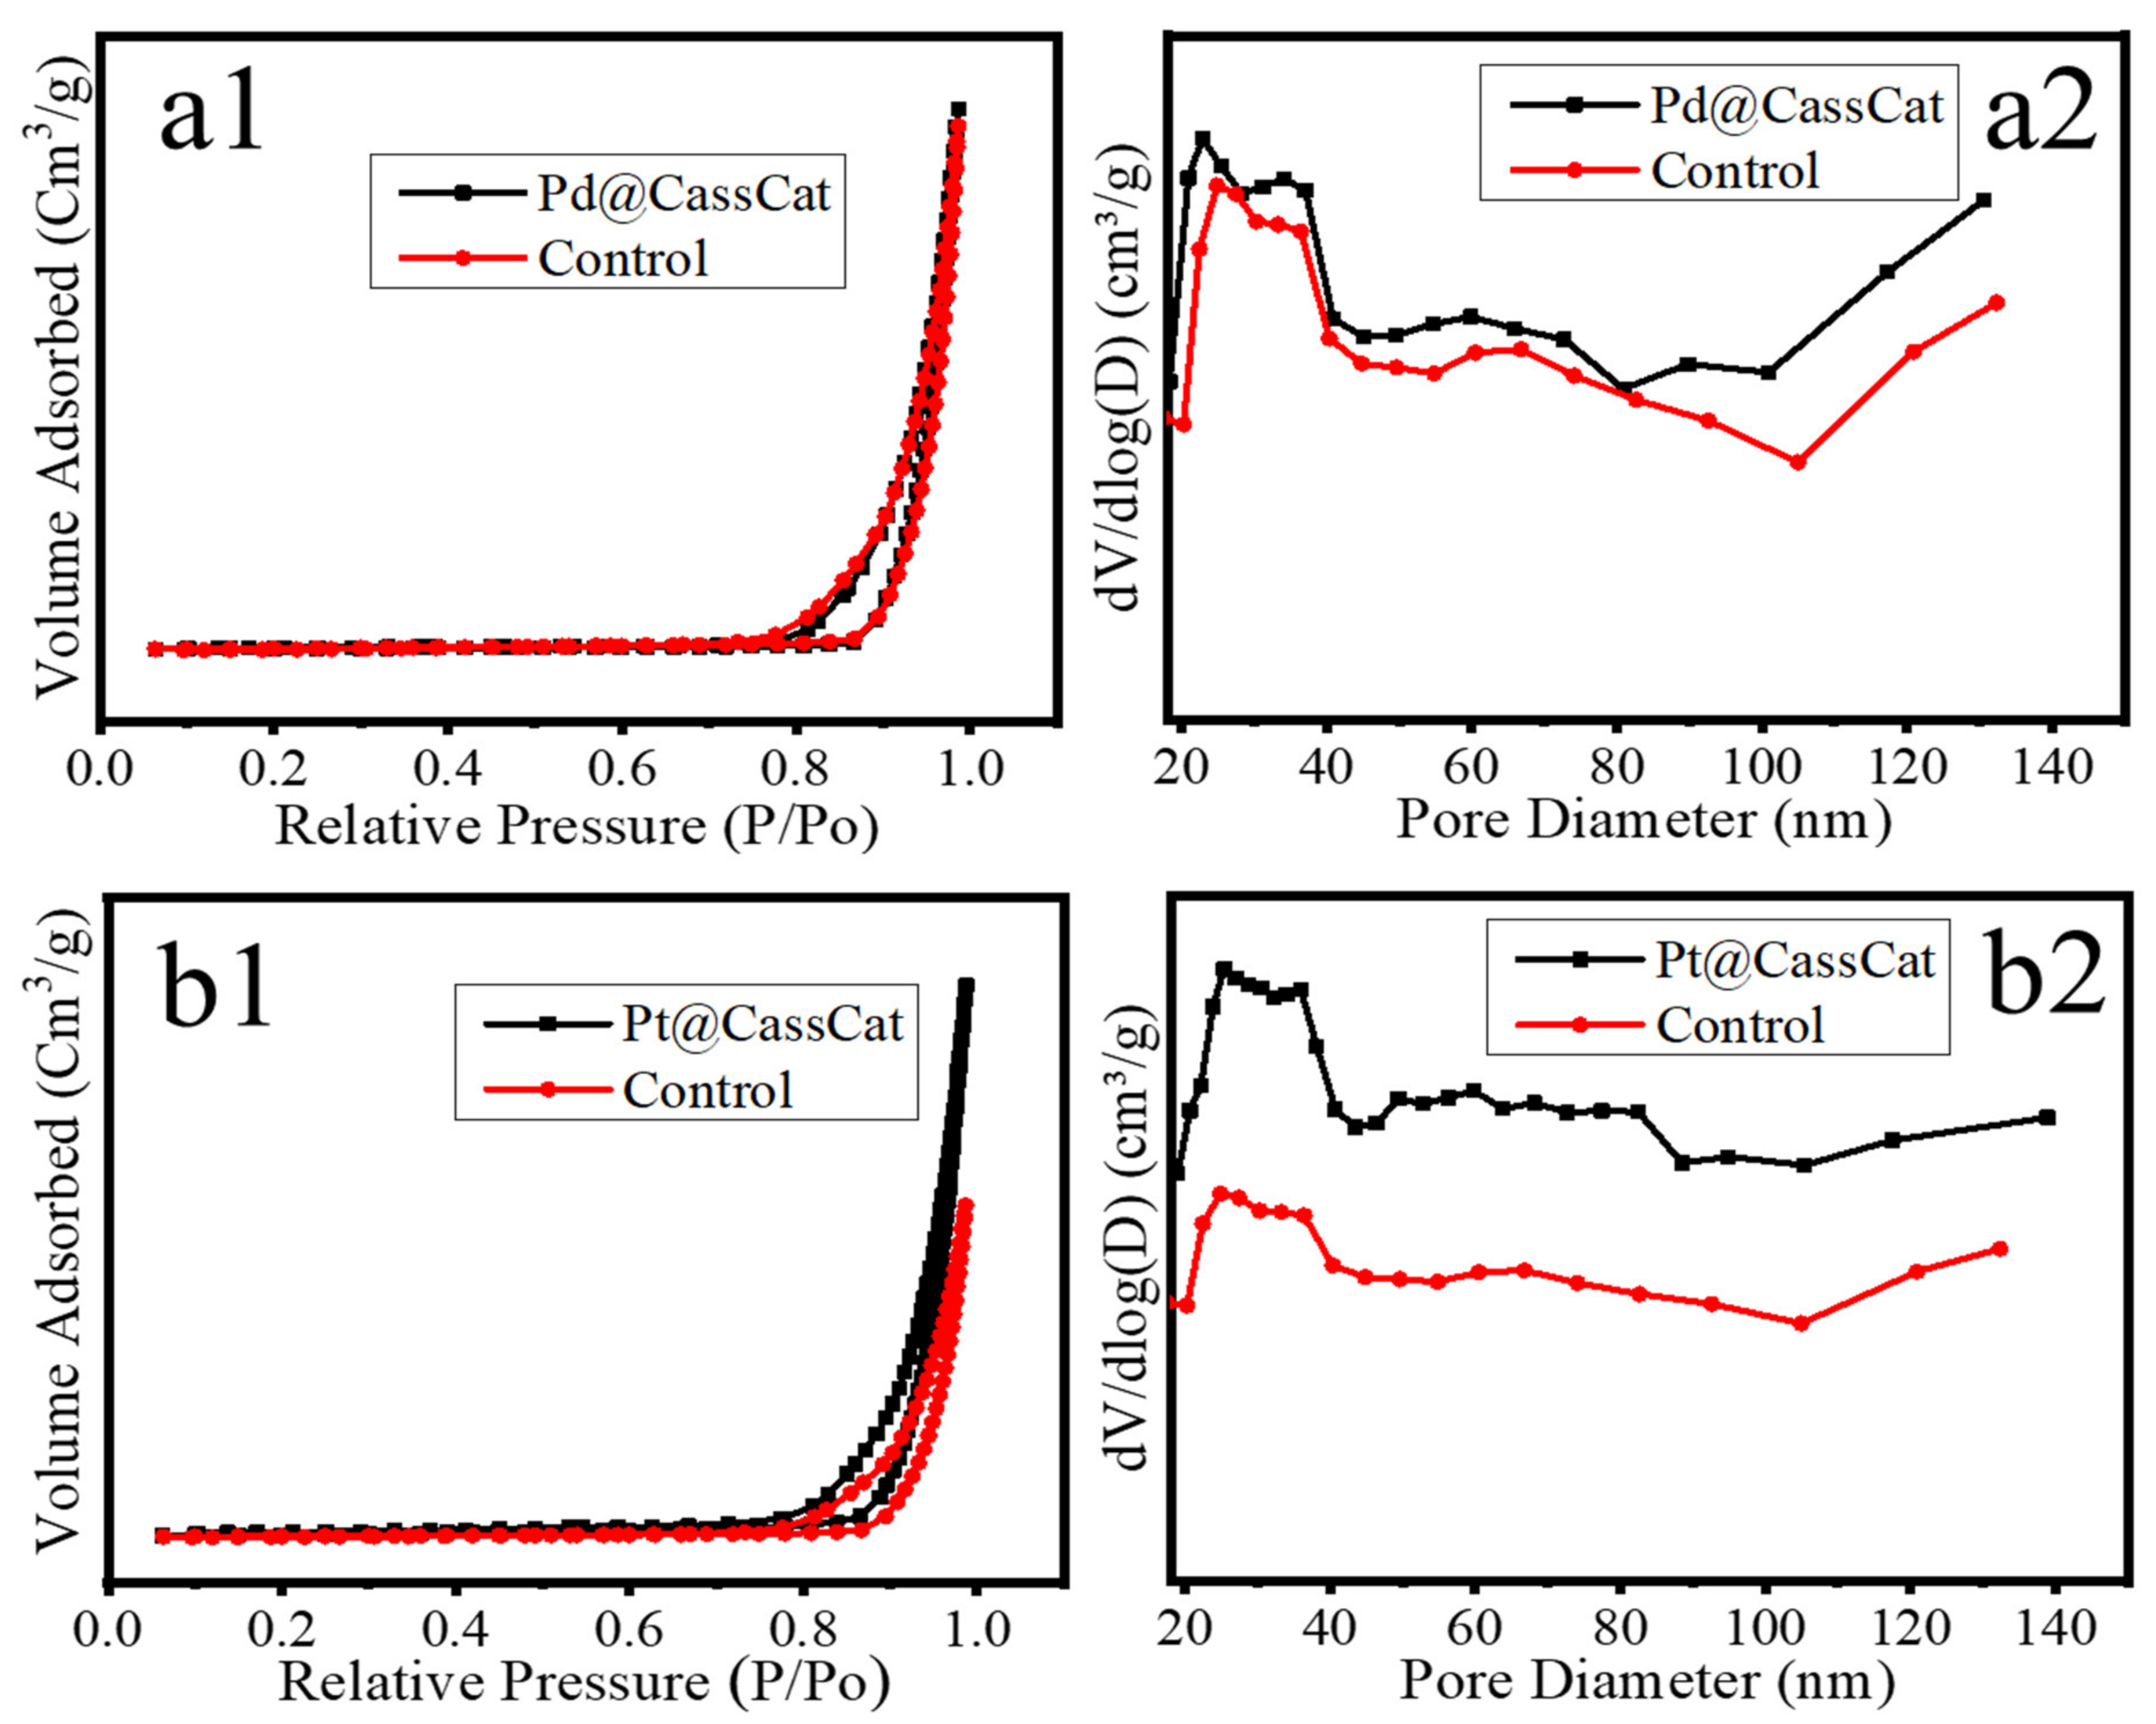
| Sample | SBET (m2/g) | Pore Volume (cm3/g) | Pore Diameter (nm) | Metal Loading *(wt%) |
|---|---|---|---|---|
| @PtCassCat | 12.50 | 0.933 | 30.39 | 0.24 |
| @PdCassCat | 4.92 | 0.579 | 29.70 | 7.8 × 10⁻³ |
| Control | 3.96 | 0.560 | 28.40 | 0 |
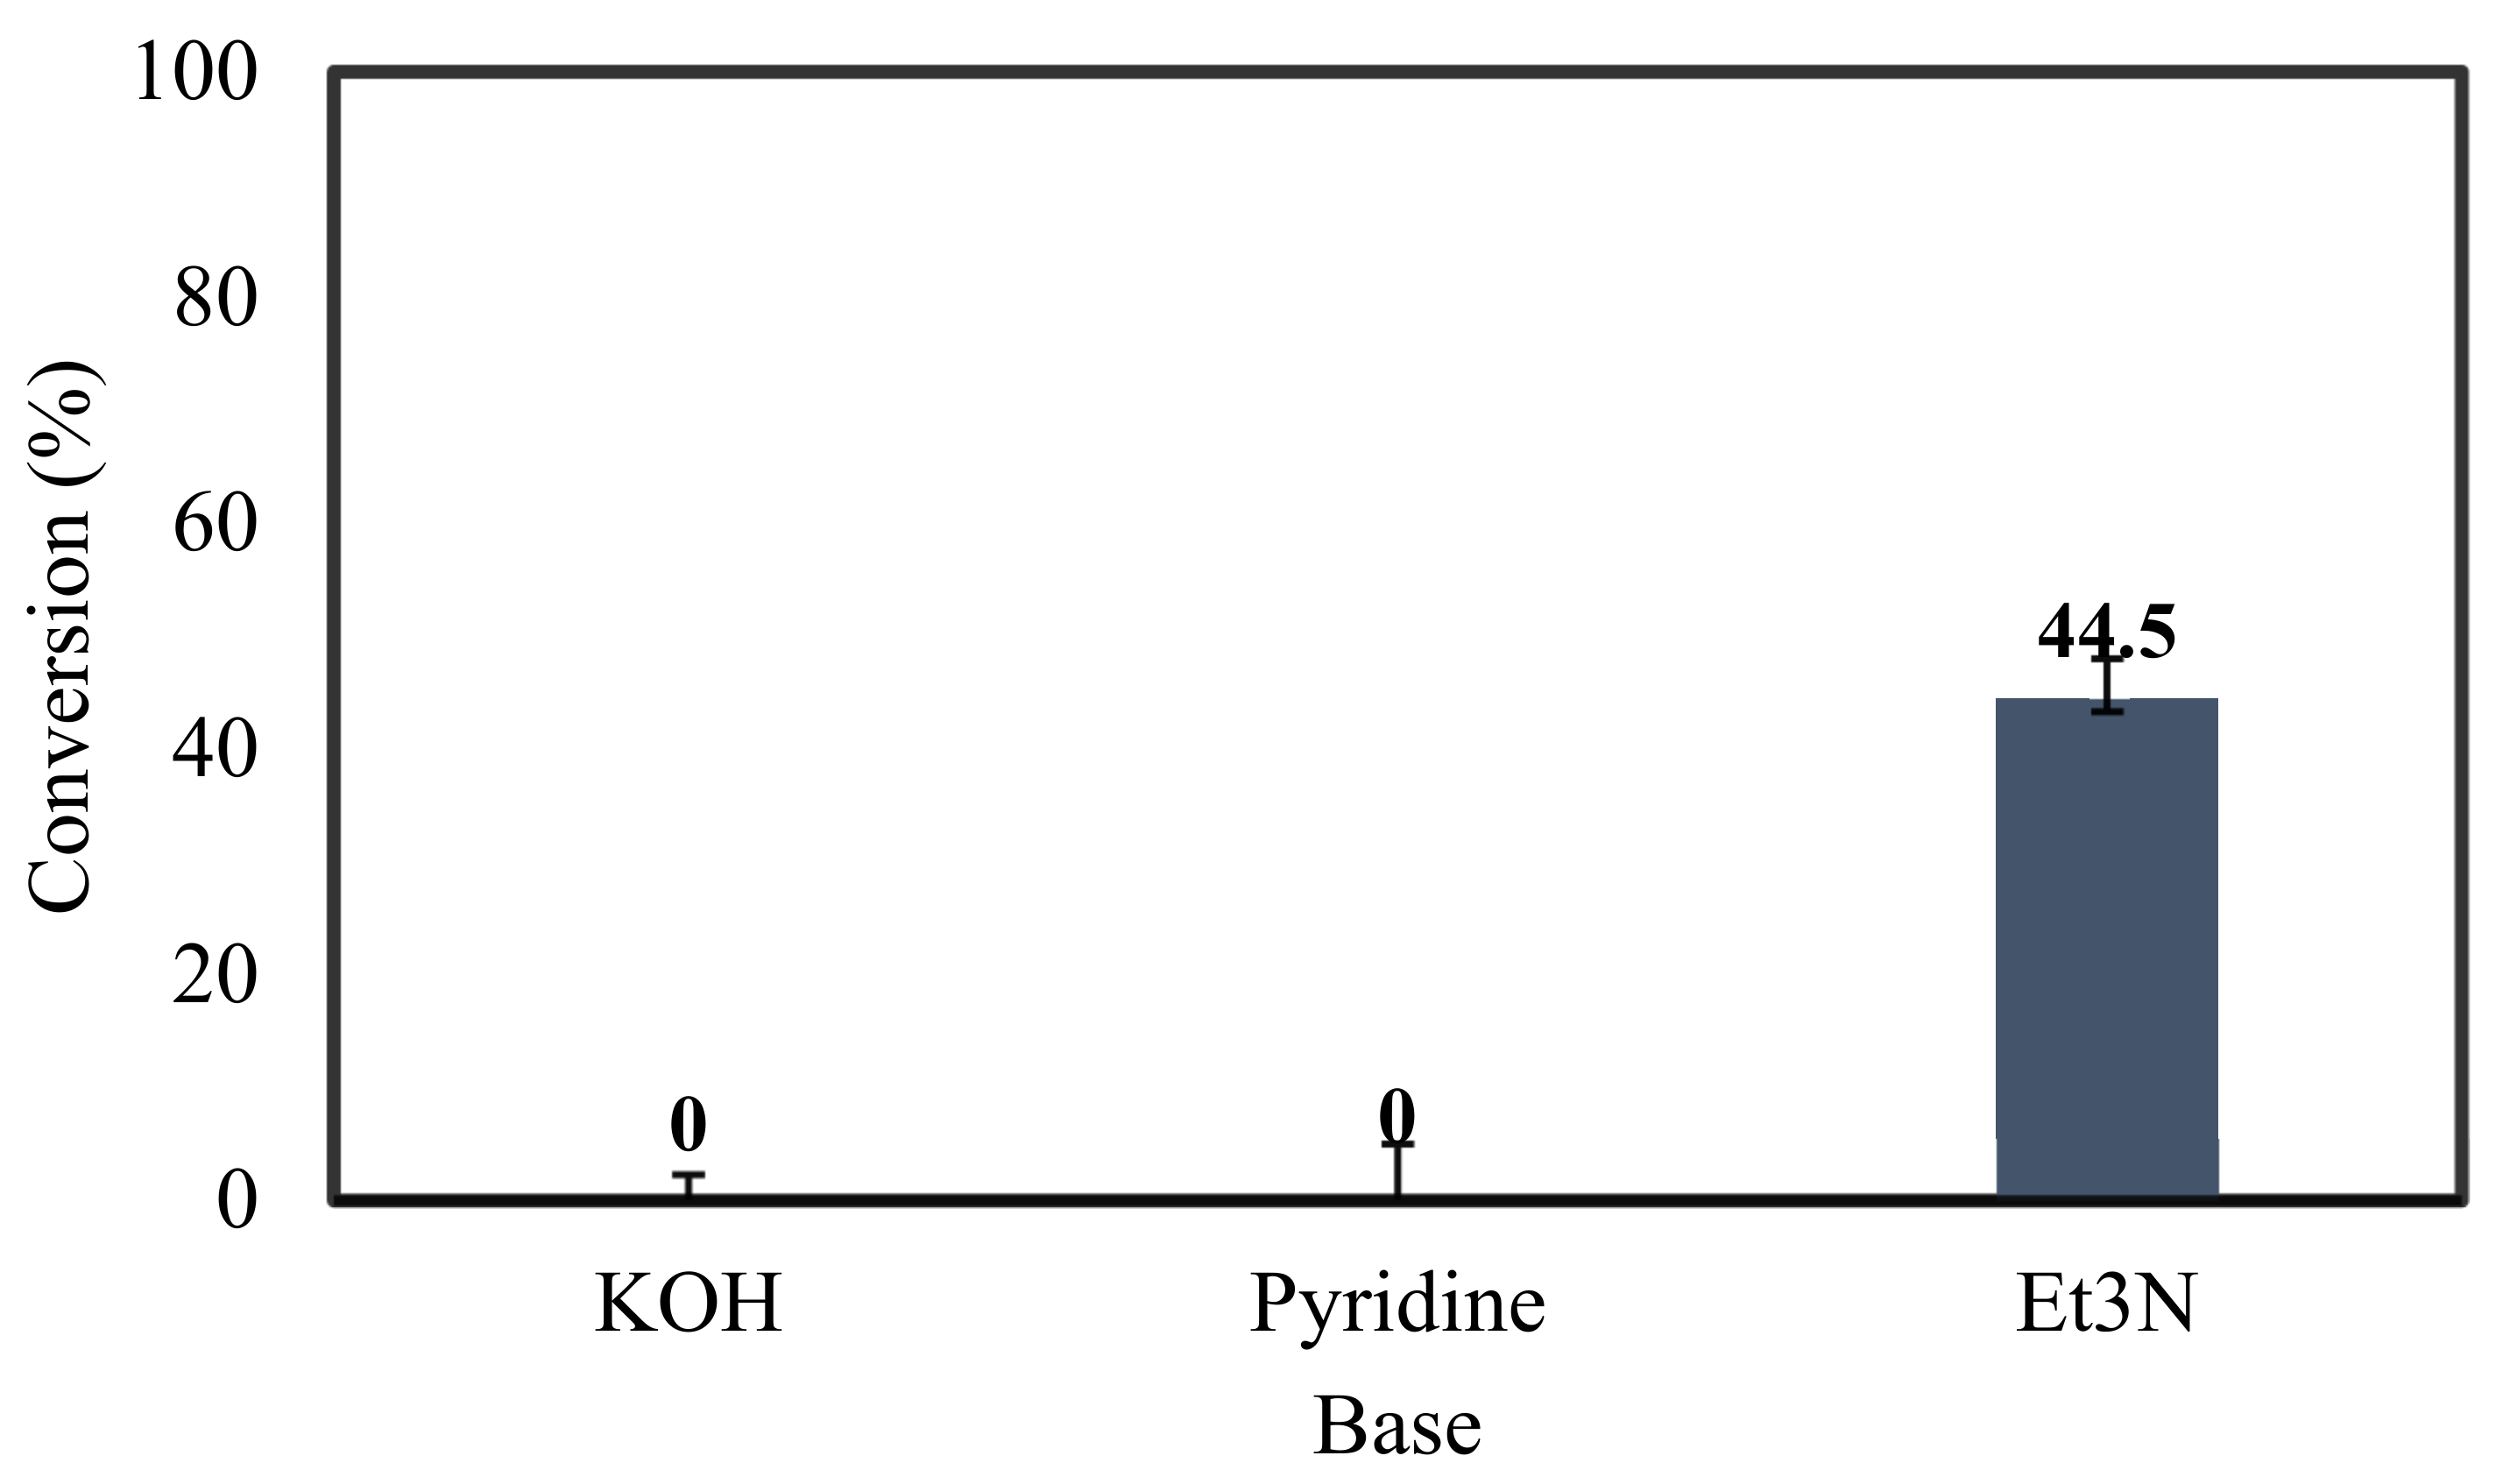
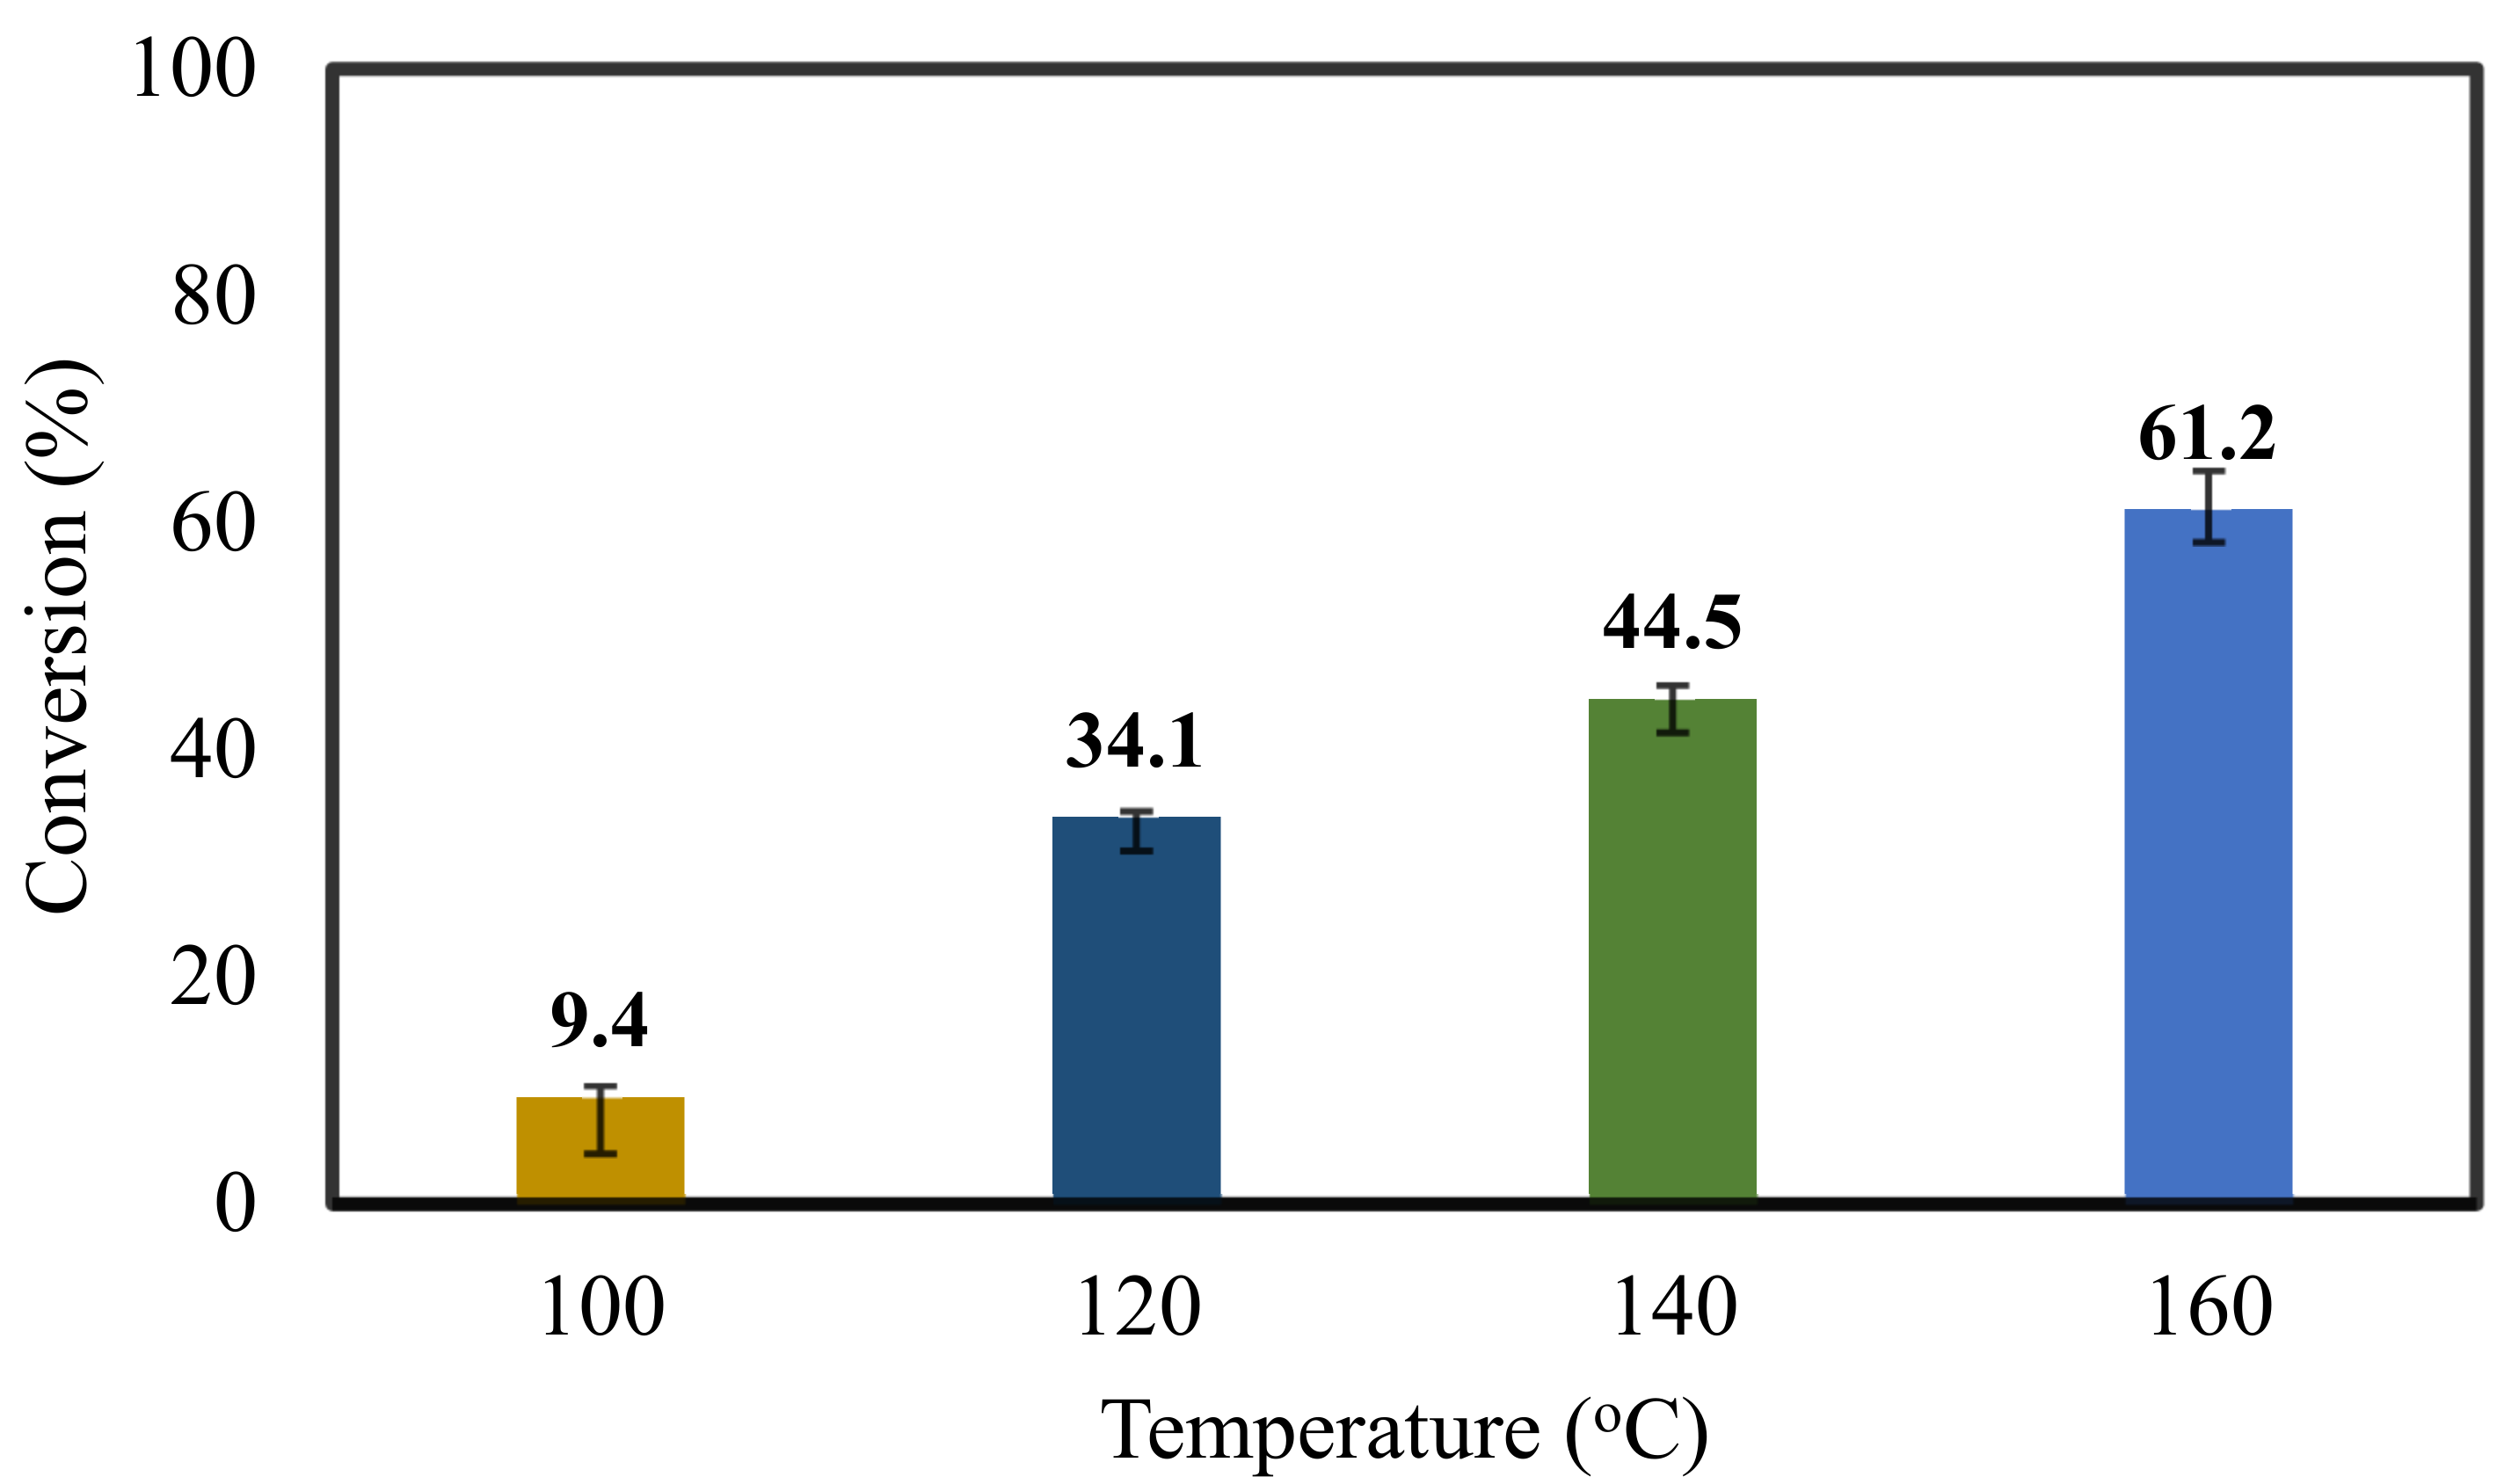
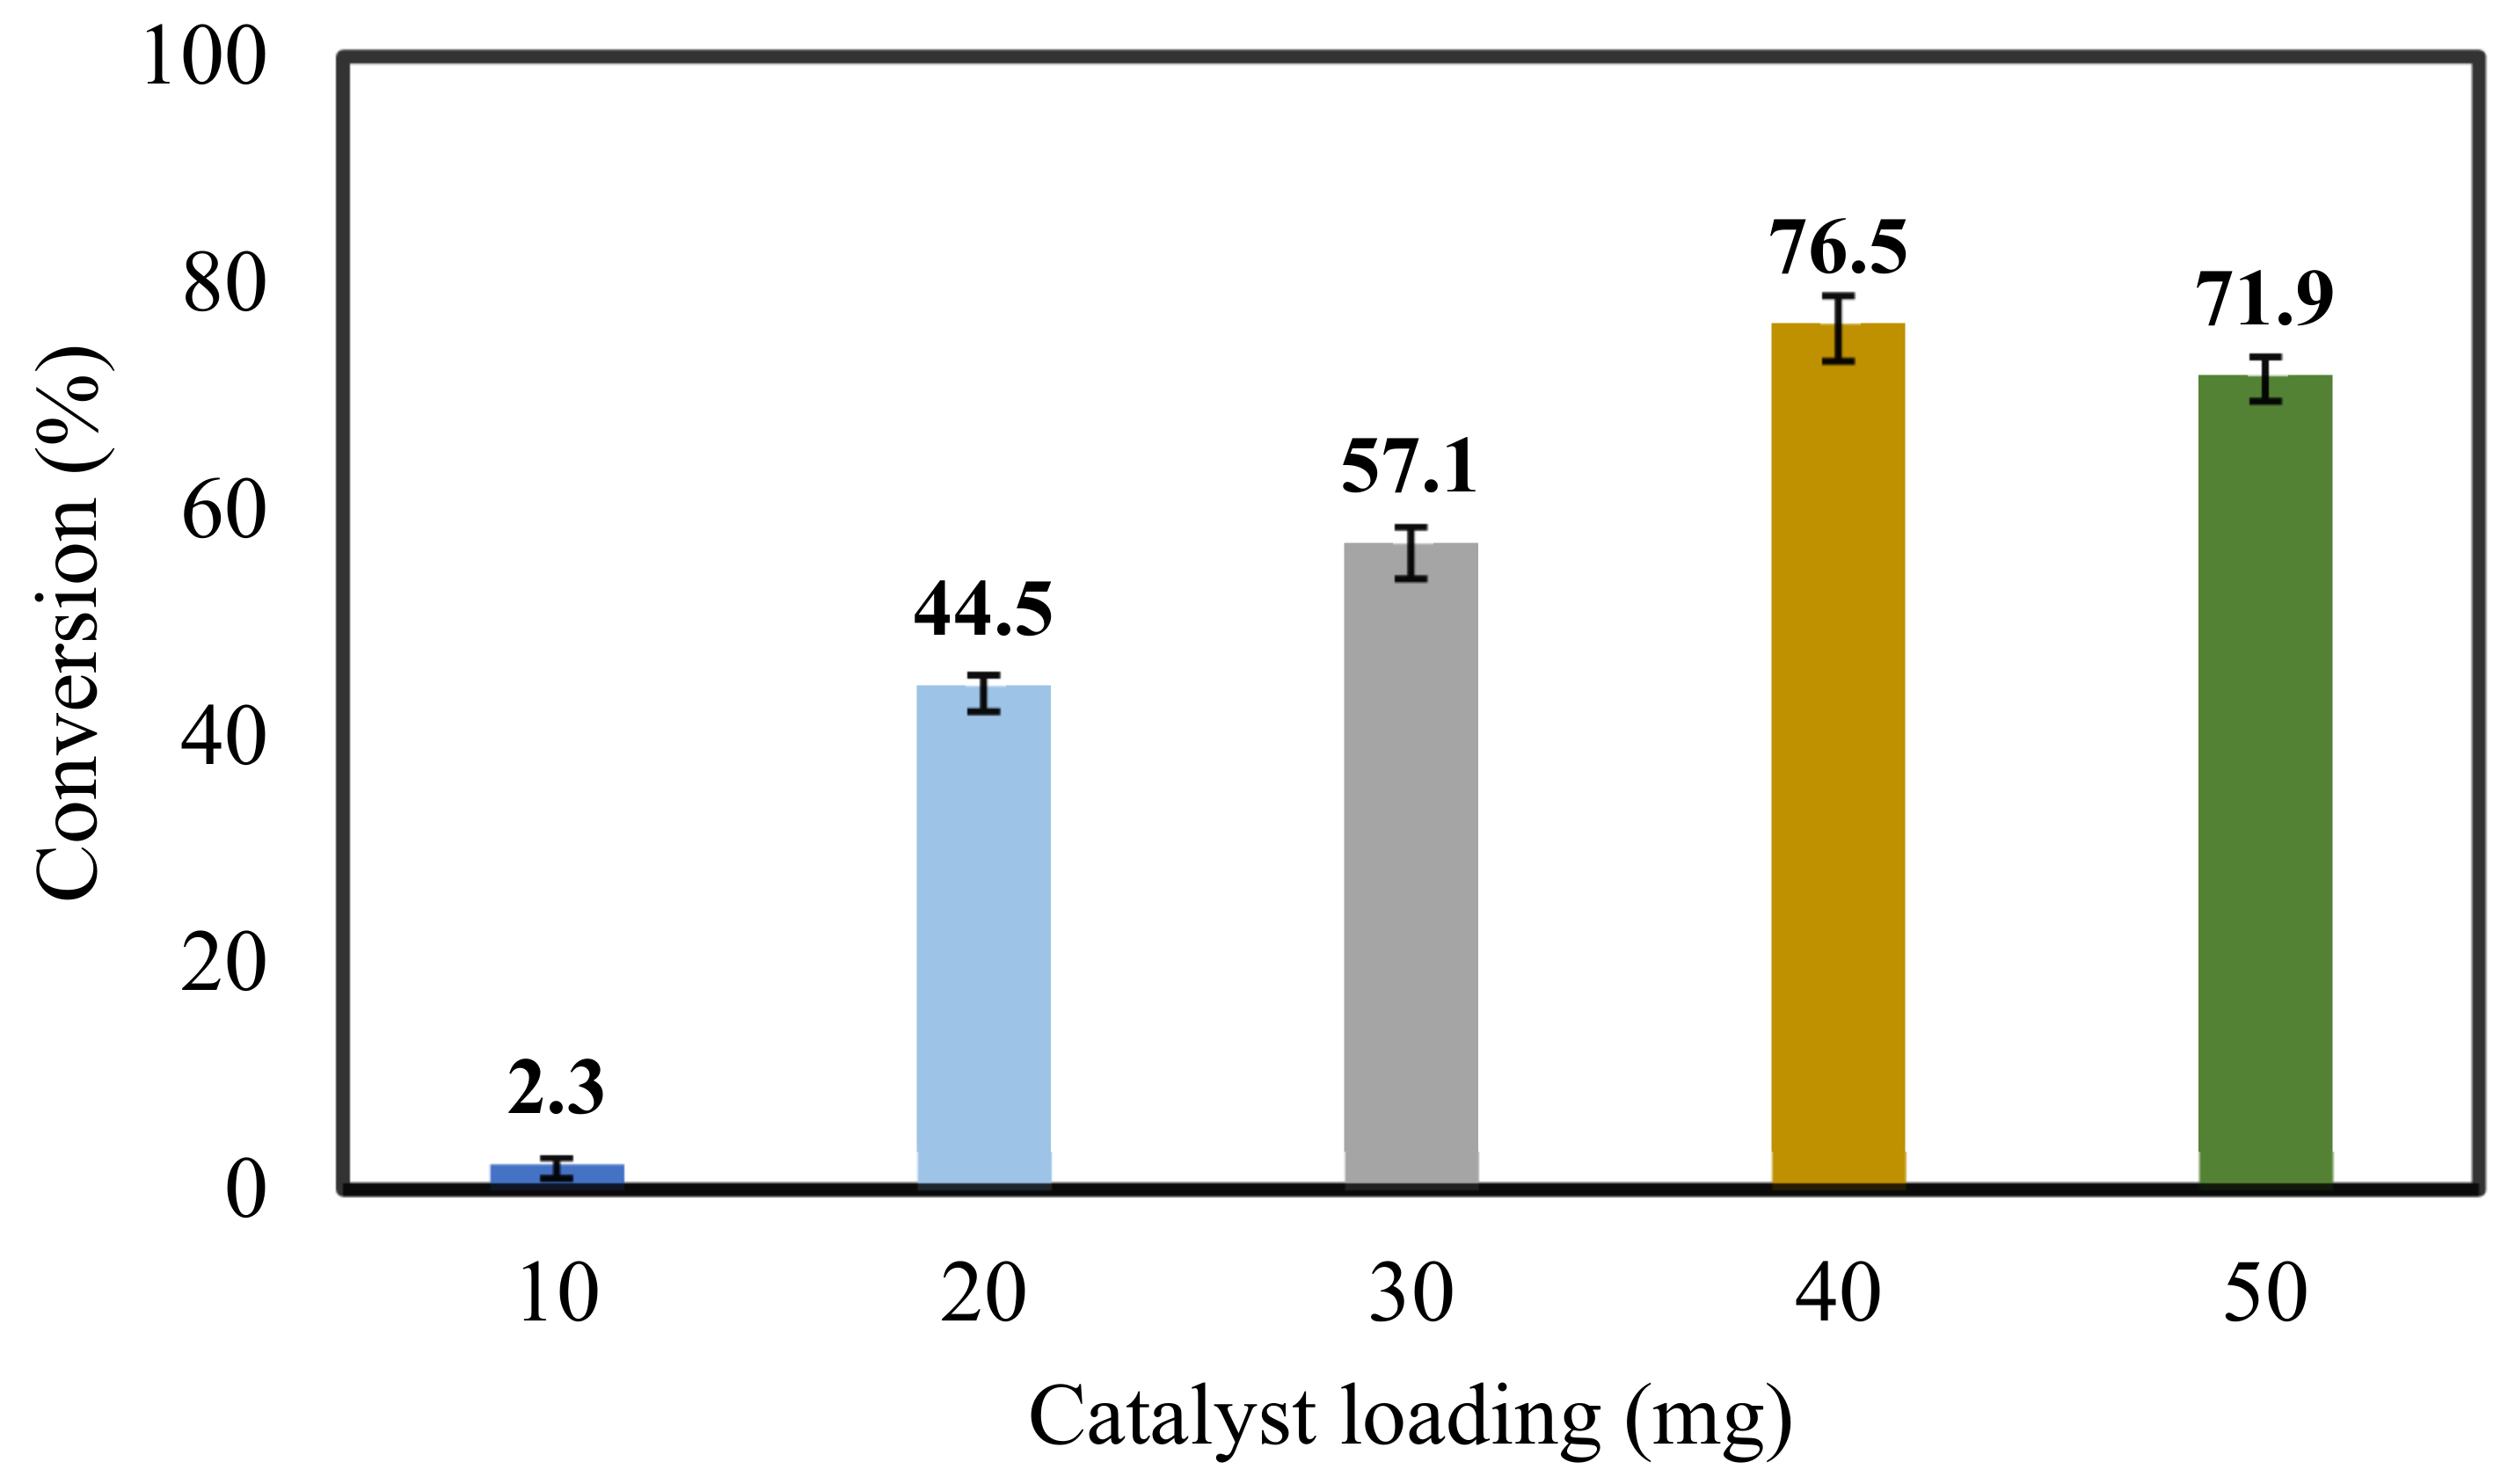
| Entry | Catalyst | Base | Temperature (°C) | Reaction Time (h) | Catalyst Amount (mg) | Conversion (%) | TON | TOF (h−1) |
|---|---|---|---|---|---|---|---|---|
| 1 | @PdCassCat | KOH | 140 | 24 | 20 | 0 | 0 | 0 |
| 2 | @PdCassCat | Pyridine | 140 | 24 | 20 | 0 | 0 | 0 |
| 3 | @PdCassCat | Et3N | 140 | 24 | 20 | 44.5 | 305,358 | 25,446 |
| 4 | @PtCassCat | Et3N | 140 | 24 | 20 | 100 | 40,607 | 1692 |
| 5 | @PdCassCat | Et3N | 100 | 24 | 20 | 9.4 | 64,384 | 2683 |
| 6 | @PdCassCat | Et3N | 120 | 24 | 20 | 34.1 | 233,762 | 9740 |
| 7 | @PdCassCat | Et3N | 160 | 24 | 20 | 61.2 | 419,304 | 23,294 |
| 8 | @PdCassCat | Et3N | 160 | 24 | 10 | 2.3 | 31,369 | 1307 |
| 9 | @PdCassCat | Et3N | 160 | 24 | 30 | 57.1 | 258,447 | 10,769 |
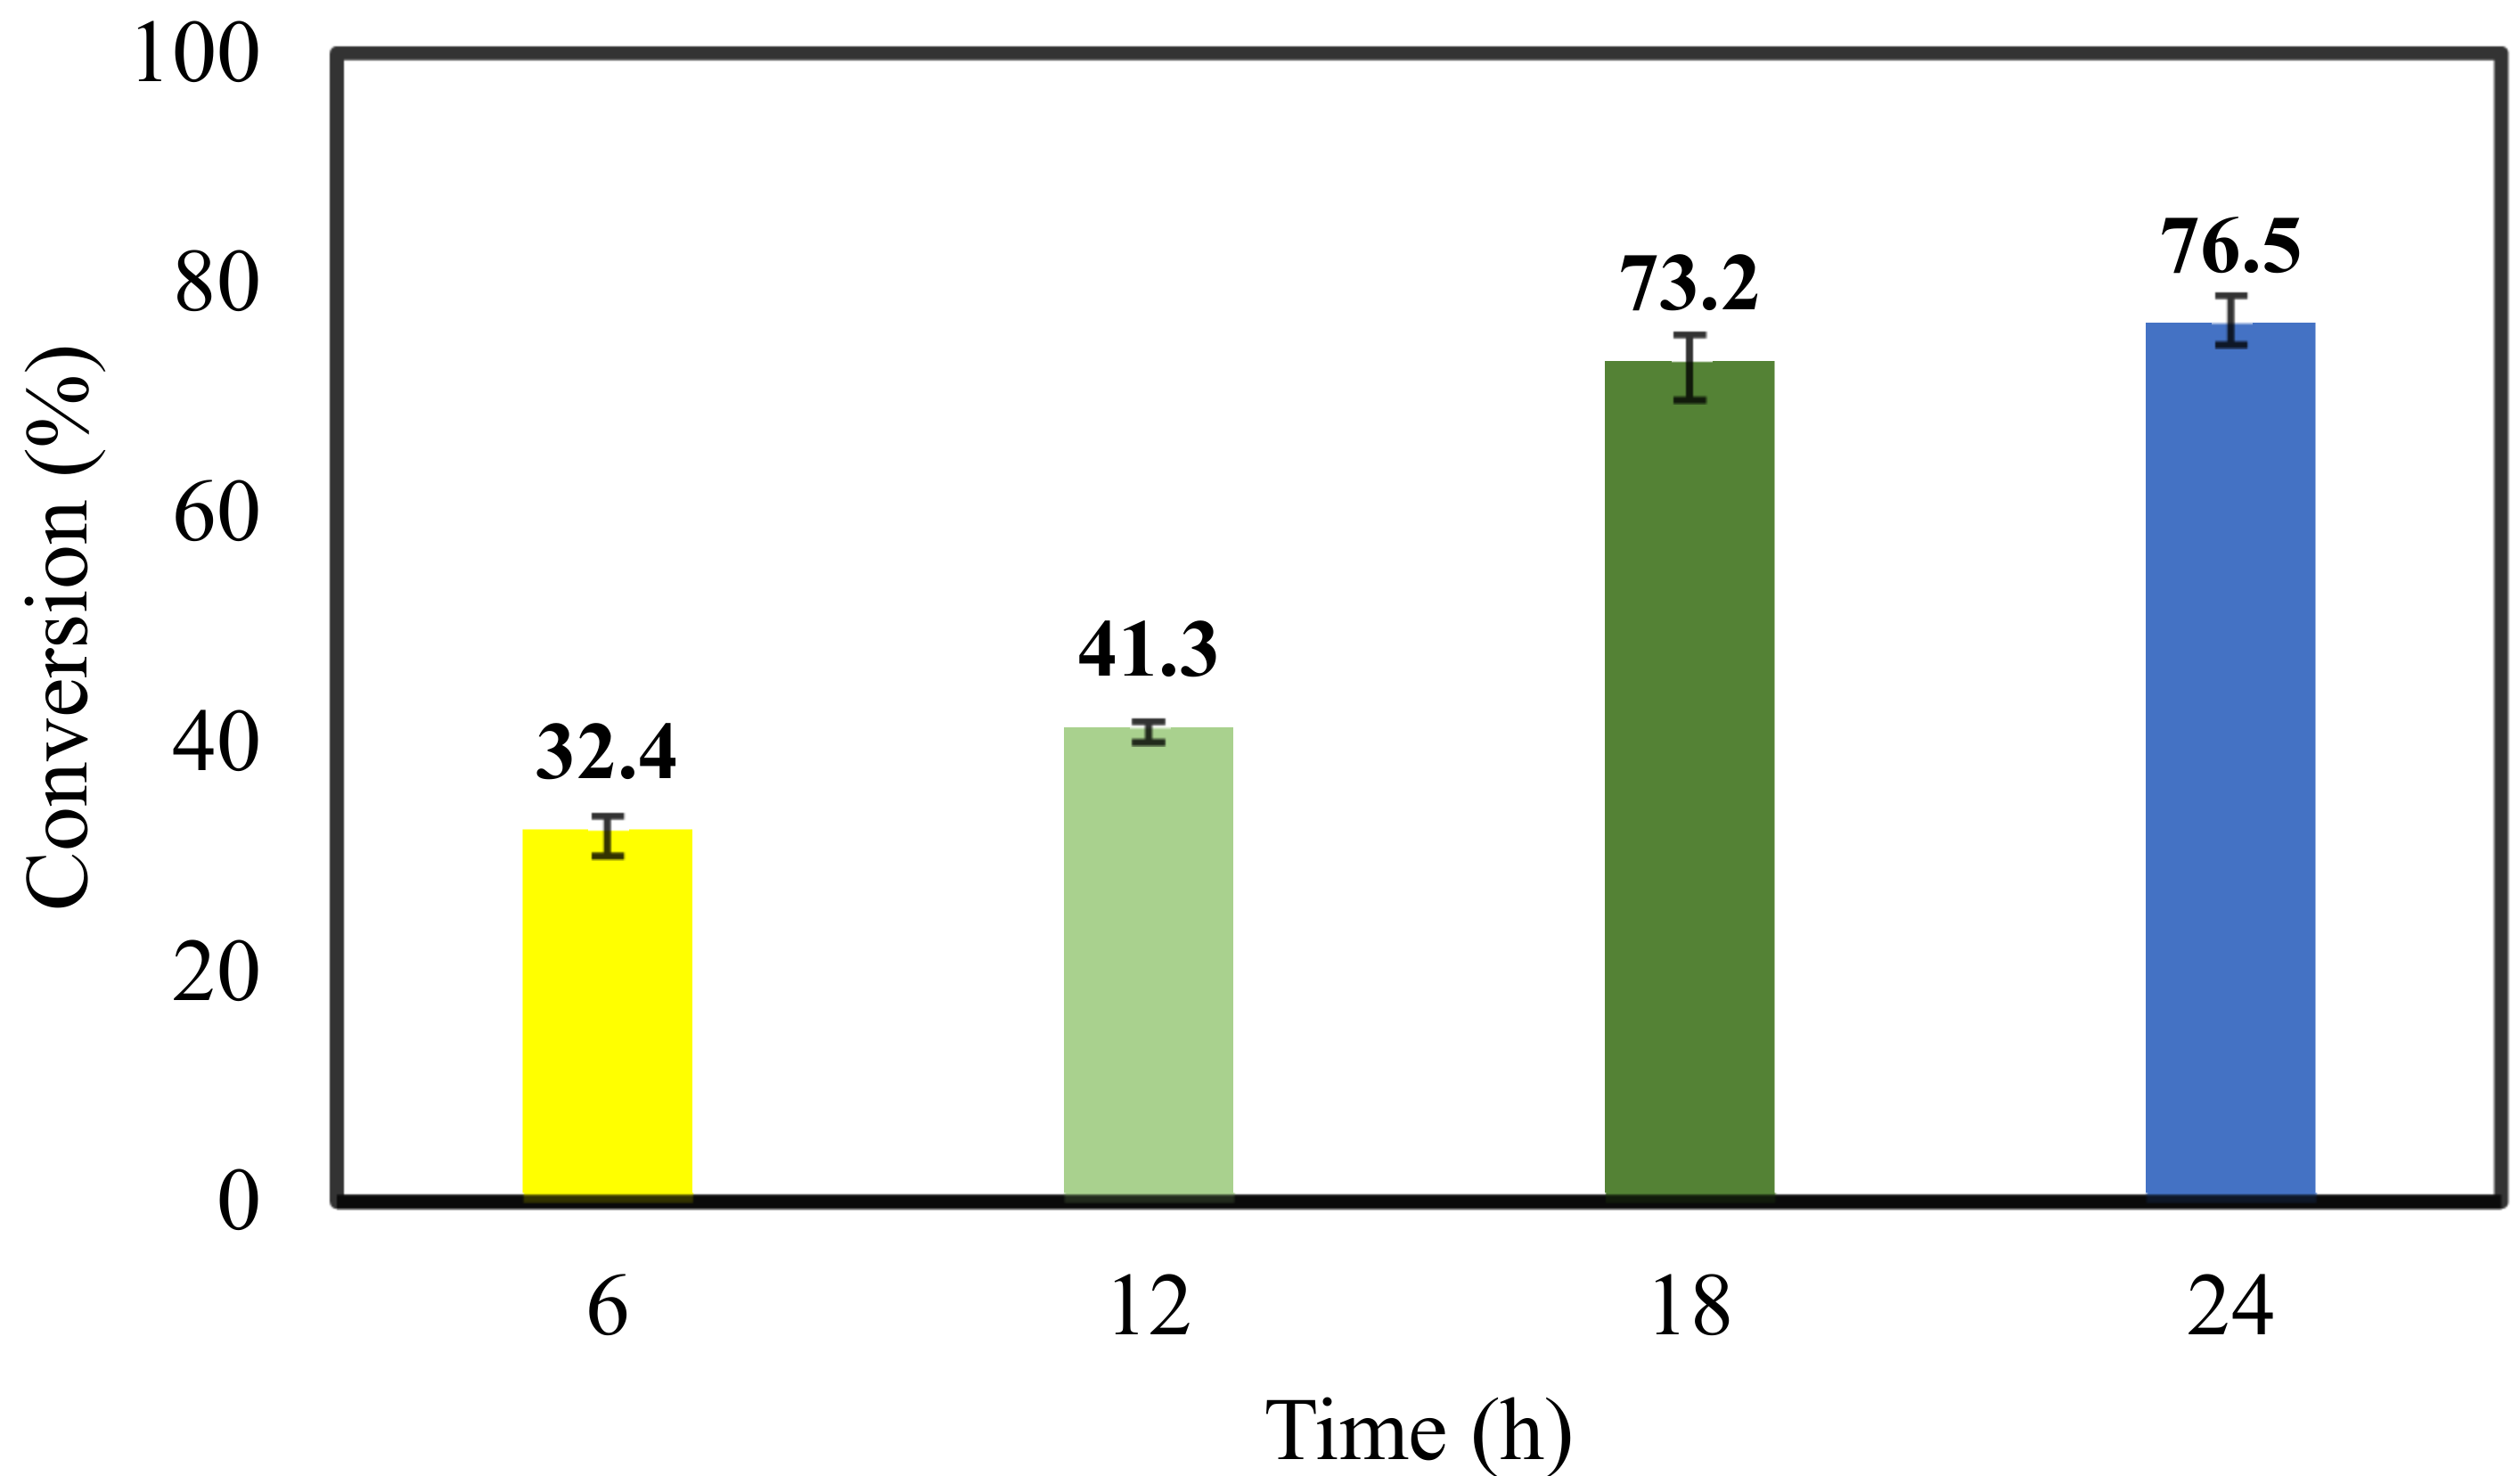
| 10 | @PdCassCat | Et3N | 160 | 24 | 40 | 76.5 | 261,986 | 10,916 |
| 11 | @PdCassCat | Et3N | 160 | 24 | 50 | 71.9 | 196,986 | 8207 |
| 12 | @PdCassCat | Et3N | 160 | 6 | 40 | 32.4 | 11,113 | 1852 |
| 13 | @PtCassCat | Et3N | 160 | 6 | 40 | 100 | 20,852 | 3475 |
| 14 | @PdCassCat | Et3N | 160 | 12 | 40 | 41.3 | 141,438 | 11,786 |
| 15 | @PdCassCat | Et3N | 160 | 18 | 40 | 73.2 | 250,684 | 13,927 |
Publisher’s Note: MDPI stays neutral with regard to jurisdictional claims in published maps and institutional affiliations. |
© 2021 by the authors. Licensee MDPI, Basel, Switzerland. This article is an open access article distributed under the terms and conditions of the Creative Commons Attribution (CC BY) license (https://creativecommons.org/licenses/by/4.0/).
Share and Cite
Akinbile, B.J.; Matsinha, L.C.; Makhubela, B.C.E.; Ambushe, A.A. Towards Sustainability Pathway with Bio-Derived Platinum and Palladium Catalyst for Furfural Hydrogenation—A Novel Greener Approach in Catalysis. Minerals 2021, 11, 895. https://doi.org/10.3390/min11080895
Akinbile BJ, Matsinha LC, Makhubela BCE, Ambushe AA. Towards Sustainability Pathway with Bio-Derived Platinum and Palladium Catalyst for Furfural Hydrogenation—A Novel Greener Approach in Catalysis. Minerals. 2021; 11(8):895. https://doi.org/10.3390/min11080895
Chicago/Turabian StyleAkinbile, Babatunde J., Leah C. Matsinha, Banothile C. E. Makhubela, and Abayneh A. Ambushe. 2021. "Towards Sustainability Pathway with Bio-Derived Platinum and Palladium Catalyst for Furfural Hydrogenation—A Novel Greener Approach in Catalysis" Minerals 11, no. 8: 895. https://doi.org/10.3390/min11080895