Article

Research on Strength Prediction Model and Microscopic Analysis of Mechanical Characteristics of Cemented Tailings Backfill under Fractal Theory

School of Resources and Safety Engineering, Central South University, Changsha 410083, China
*
Author to whom correspondence should be addressed.
Minerals 2021, 11(8), 886; https://doi.org/10.3390/min11080886
Submission received: 10 July 2021 / Revised: 10 August 2021 / Accepted: 14 August 2021 / Published: 16 August 2021

Abstract

:
In order to further study the internal relationship between the microscopic pore characteristics and macroscopic mechanical properties of cemented tailings backfill (CTB), in this study, mine tailings and ordinary Portland cement (PC32.5) were selected as aggregate and cementing materials, respectively, and different additives (anionic polyacrylamide (APAM), lime and fly ash) were added to backfill samples with mass concentration of 74% and cement–sand ratios of 1:4, 1:6 and 1:8. After 28 days of curing, based on the uniaxial compressive strength test, nuclear magnetic resonance (NMR) porosity test and the fractal characteristics of pore structure, the relationships of the compressive strength with the proportion and fractal dimension of pores with different radii were analyzed. The uniaxial compressive strength prediction model of the CTB with the proportion of harmless pores and the fractal dimension of harmful pores as independent variables was established. The results show that the internal pores of the material are mainly the harmless and less harmful pores, and the sum of the average proportions of the two reaches 73.45%. Some characterization parameters of pore structure have a high correlation with the compressive strength. Among them, the correlation coefficients of compressive strength with the proportion of harmless pores and fractal dimension of harmful pores are 0.9219 and 0.9049, respectively. The regression results of the strength prediction model are significant, and the correlation coefficient is 0.9524. The predicted strength value is close to the actual strength value, and the predicted results are accurate and reliable.

1. Introduction

Based on the background of vigorously advocating for the construction of “green mines”, mining will always develop around the direction of “green, low carbon, safety and environmental protection”. In order to meet this development keynote, a Minerals Special Issue recently focused on “Valorization of Metallurgical and Mining Residues and Wastes”. Rybak et al. [1], considering artificial wastes instead of traditional backfill components, indicated that resource-reproducing technologies allow mining and processing enterprises to make full use of industrial mineral resources, resulting in multiple ecological and economic effects. Bagani et al. [2] discussed the possible use of nepheline syenite as a mine by-product in leaching alumina from azeotropic HCl solution. Tsaousi et al. [3] demonstrated that the industrial slag (copper slag) of the Swedish mining and smelting company “Boliden” was converted into advanced building materials through geological polymerization. Dentoni et al. [4] introduced the processing method of red mud in bauxite processing in the alumina industry. In addition, the filling mining method is highlighted in many mining methods by virtue of its unique advantages and has increasingly become the preferred method for the mining of metal and nonmetal underground mines [5]. At present, the strength of cemented backfill is one of the hot areas studied by scholars worldwide and is also an important index for judging the quality of backfill [6,7]. It has been found that the microscopic pore structure of backfill is closely related to its strength. The different pore microstructure characteristics of cemented backfill have an important impact on the mechanical properties of backfill. Therefore, it is of great practical significance to study the relationship between the microscopic pore structure of cemented backfill and the macroscopic mechanical properties to guide the actual production of mines.
Many scholars used different microscopic detection techniques to study the pore structure of backfill materials and established its relationship with macroscopic mechanical properties from different perspectives. Zhang [8] studied the effect of pore change on strength of cemented foam backfill (CFB) by mercury intrusion porosimetry (MIP). The results showed that the change of aggregate gradation and foaming agent dosage mainly affects the large pore volume of CFB and then affects the overall porosity of CFB, resulting in strength change. Deng [9] studied the variation of porosity and strength growth rate of three groups of CTB with different additives at different curing ages and established the corresponding strength evolution model of CTB. Liu [10] also studied the pore structure of backfill using NMR and scanning electron microscope (SEM) techniques and found that the pores of backfill were mainly small and harmless pores, also studying the internal relationship between the pore structure of backfill and unconfined compressive strength. Xin Jie [11] used digital image technology to quantify the pore characteristics of backfill materials and studied the relationship between the microstructure and mechanical properties of backfill materials. Yilmaz [12] analyzed the porosity of backfill materials of construction demolition waste (CDW) as a partial substitute for sulfide tailings by MIP and found that CDW can reduce the porosity to increase the strength of the backfills. Hu [13] studied the pore characteristics of backfill under four different humidity conditions through NMR and SEM techniques and established the relationship between the permeability of backfill materials and the uniaxial compressive strength. Yilmaz et al. [14] used an improved laboratory apparatus called CUAPS (pressure curing) and conventional plastic molds to study the effects of curing conditions on microstructure changes and corresponding unconfined compressive strength (UCS) of cemented paste backfill (CPB). Rubashkina et al. [15] added blast-furnace granular slag screenings 0-5 mm in size in the preparation of cemented filling mixture to optimize the gradation of low-quality fine sand and ultrafine sand. In addition, Chen Q [16,17,18] and Zhang Q [19] et al. also conducted in-depth research from the perspectives of environmental effects, rheological properties and so on of CPB, and achieved corresponding results.
In order to better describe the complexity and variability of the pore structure of porous materials, fractal theory has been applied to the study of the pore structure of porous materials in more and more research. Hu [20] studied the pore structure of stone powder CTB, quantified the fractal dimension of pores, calculated the grading index of mixed aggregate and studied the relationships of strength with grading index and pore structure. Deng [21] studied and analyzed the microscopic characteristics such as porosity and pore size distribution of sandstone-like materials and established a compressive strength prediction model with the proportion of macropores and the fractal dimension of macropores as independent variables. Zhang [22] studied the pore structure of electrically broken coal samples by using NMR and fractal theory and quantitatively studied the relationship between porosity growth and breakdown capacity. Chen Bowen [23] studied and analyzed the compressive strength characteristics of phosphogypsum cemented backfills by activity rate, particle size fractal dimension and pore fractal dimension.
In summary, the microscopic pore characteristics of backfill materials and the internal relationship between pore structure and strength of backfill materials have been tested by many scholars through different technical methods. In addition, with the in-depth study of rock materials, it has been found that the pore distribution of different internal radii in rock materials has a great influence on its mechanical properties [24,25]. However, it can be seen from the existing research results that there are still few studies on CTB in this regard. In view of this, the uniaxial compressive strength test and NMR porosity test were carried out on the backfill samples with different additives, and the internal relationships of the compressive strength of the CTB with the proportion and the fractal dimension of pores with different radii were analyzed. Based on the proportion of pores and fractal dimension of pores, the uniaxial compressive strength prediction model of the CTB was established.

2. Experiment Description

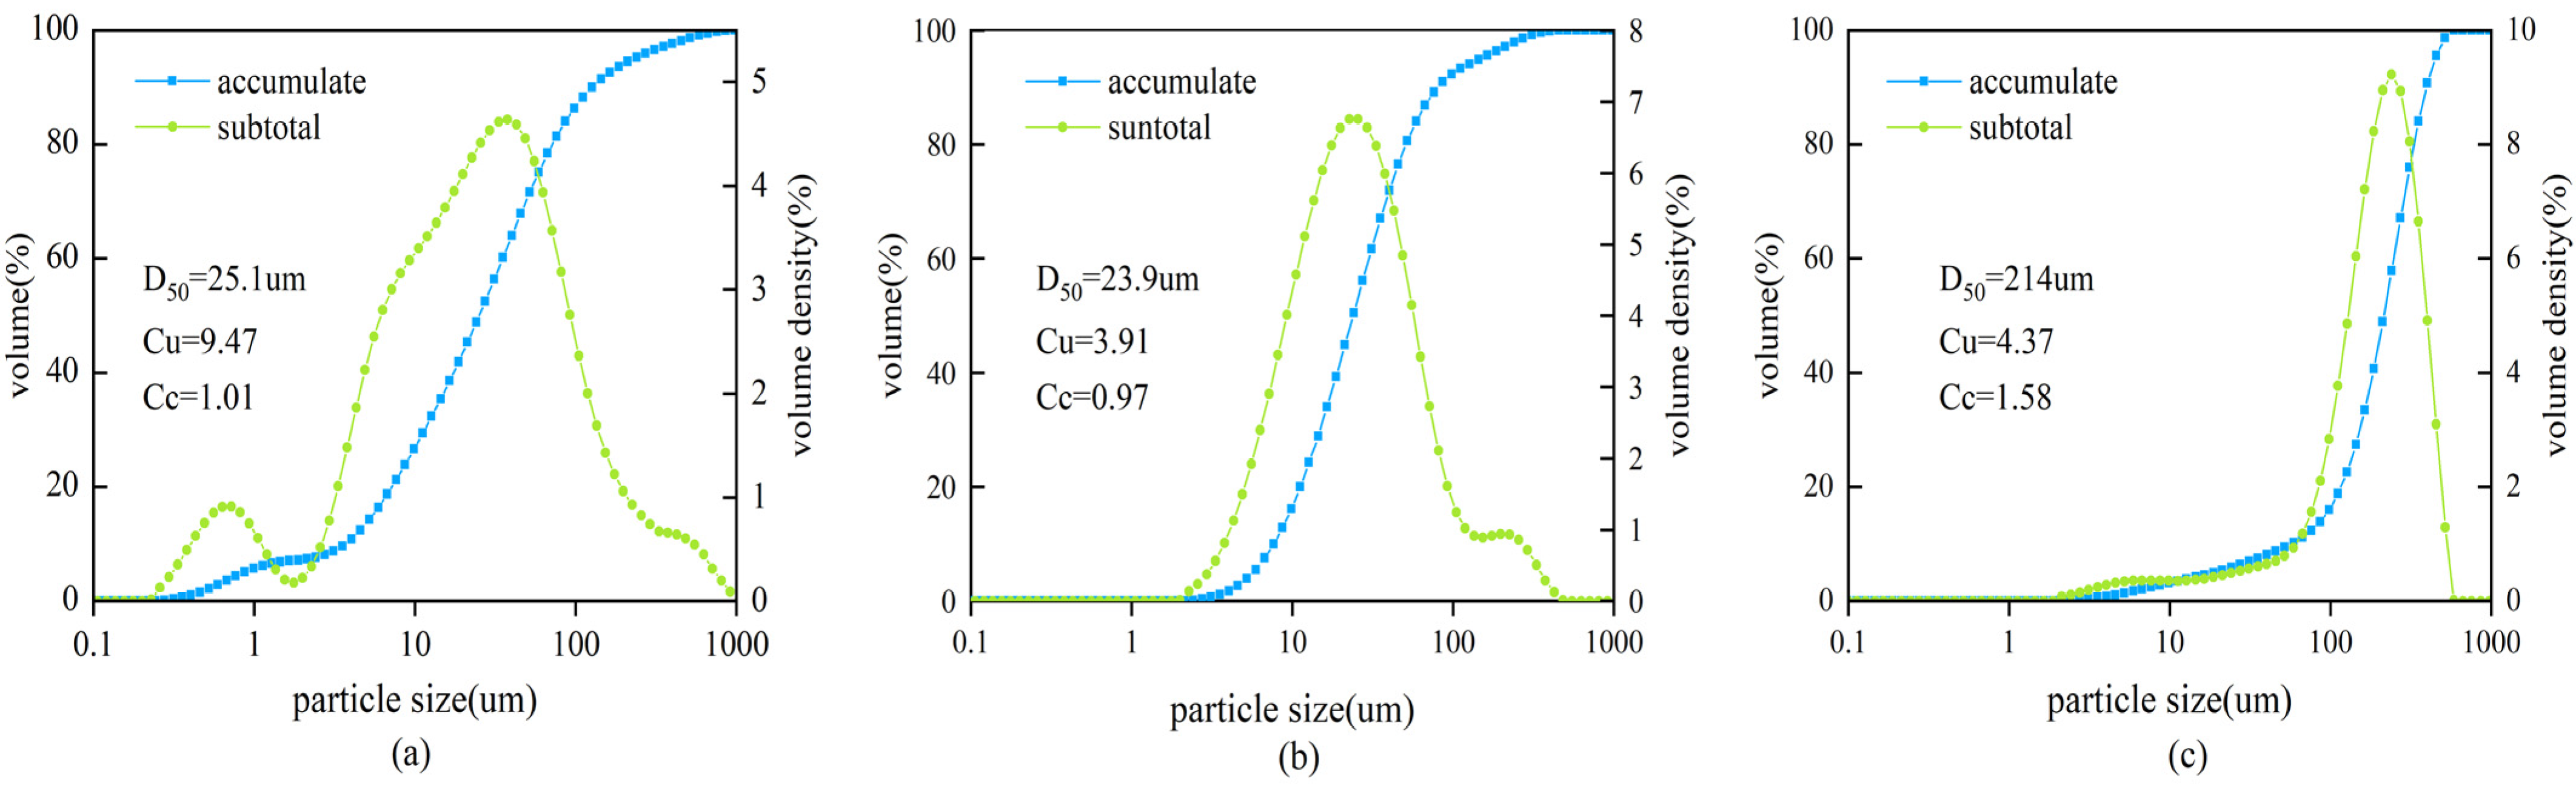
2.1. Experimental Materials and Scheme

In order to study the influence of different additives and different cement–sand ratios on the mechanical properties and pore structure of backfill materials, the aggregate selected in the experiment was tailings from a copper mine in Guangxi Province, China. Ordinary Portland cement (PC32.5) was selected as the cementing material for the experiment, and different additives (APAM, lime and fly ash) were added. Four groups of backfill samples with mass concentration of 74% and cement–sand ratios of 1:4, 1:6 and 1:8 were prepared: group A (only adding cement), group B (APAM (1% of cement content) and cement), group C (lime (5% of cement content) and cement) and group D (fly ash (10% of cement content) and cement). The experimental water was tap water in the laboratory. The basic physical parameters of tailings are shown in Table 1. The main chemical components of raw materials are shown in Table 2. The particle size distribution and cumulative curve are shown in Figure 1.

2.2. Sample Preparation and Test

According to the above experimental scheme, combined with the specific sample size requirements (cylinder with diameter of 50 mm × height of 100 mm) of “Rock Test Procedures for Water Conservancy and Hydropower Engineering” [26] and “Test Specification for Hydraulic Concrete” [27], the experimental preparation steps and experimental tests of the samples were as follows:
(1)
Pre-preparation: The recovered tailings were naturally air-dried for 1 to 2 days. After evaporation of water on the surface of the tailings, the tailings were put into the drying box for drying. This step also includes screening impurities, mold cleaning and other work.
(2)
Stirring into the mold: The experimental raw materials were weighed well and fully stirred for about 5 min. After the filling slurry was uniform, and no bubbles were generated; it could be put into the mold with lubricating oil on the inner wall and stabbed evenly with a glass rod.
(3)
Demolding and maintenance: The filling slurry with mold was maintained for 1 to 2 days in the laboratory. After the initial setting of the filling slurry with a certain strength that can maintain self-support, the backfill samples were demolded and numbered and finally put into the concrete standard curing box with 20 °C temperature and 99% relative humidity for 28 days.
(4)
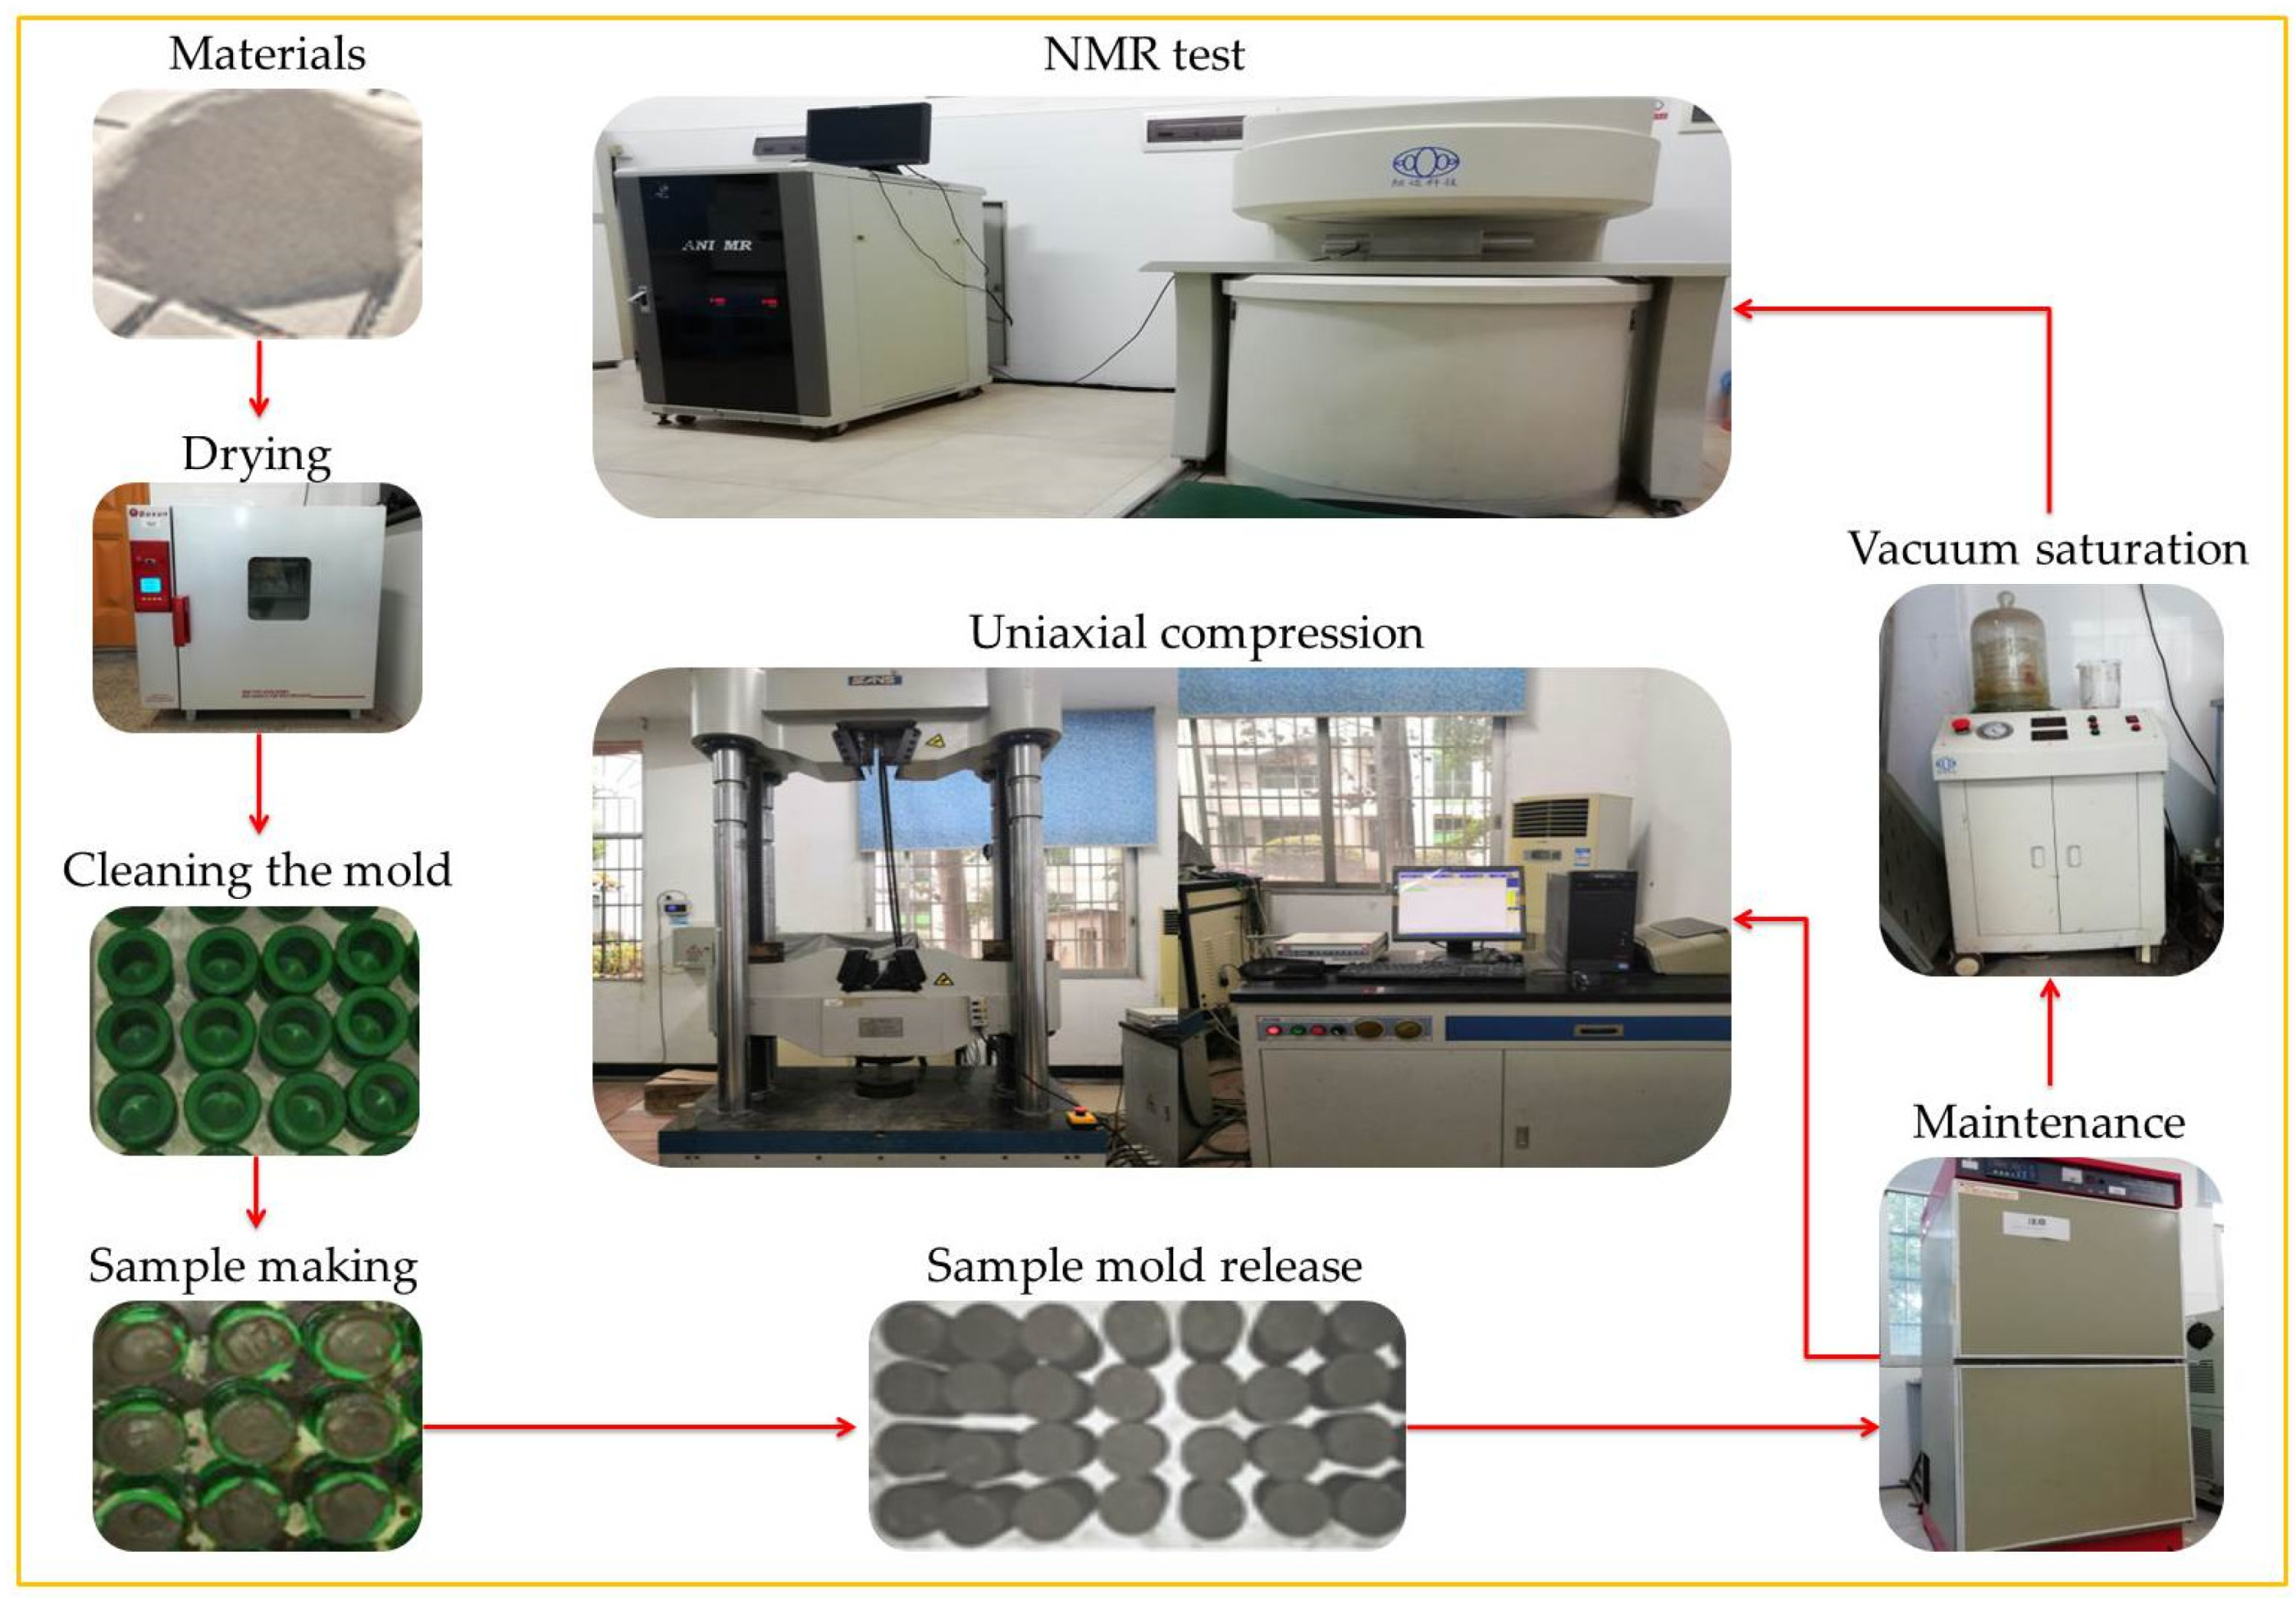
Experimental test: The size, weight and acoustic wave velocity of the curing backfill samples were measured. AniMR-150 rock NMR analysis system (NIUMAG, Suzhou, China) was used to obtain the porosity of backfill samples and pore distribution parameters of different internal radii. Before the porosity test, in order to fill the pores in the backfill samples with water, the rock vacuum saturation device was used for saturation treatment. In addition, in order to ensure that the backfill samples were fully saturated, it was necessary to soak them in distilled water for about 1 h, and the saturated backfill samples were wrapped with preservative film to test their porosity. In order to obtain the uniaxial compressive strength of backfill samples, SHT4206 microcomputer-controlled electro-hydraulic servo universal material testing machine (SANS, Shanghai, China) was used in the test, and the backfill samples were pressurized by force control, with the loading speed of 100 N/s. The specific experimental process is shown in Figure 2.

2.3. Pore Radius Division and Fractal Dimension Calculation

According to the basic principle of NMR [28], the surface relaxation of pore water inside the backfill can be expressed by Formula (1) as follows:
1 T 2 = ρ 2 S V
In Formula (1), ρ 2 is surface relaxation strength. S / V is the ratio of pore surface area to fluid volume.
Since the pore radius is proportional to the pore throat diameter [29], the formula (1) can be simplified to:
1 T 2 = ρ 2 F s R
In Formula (2), F s is the geometric factor (for cylindrical pores, F s is 2) and R is the pore radius. Due to the lack of corresponding research on ρ 2 , a relatively accurate value cannot be obtained. Considering that the mineral and material components of the backfill are similar to those of concrete cement, according to the study in [30], the surface relaxation rate ρ 2 of the backfill can be selected as 12 nm/ms. Therefore, Formula (2) can be simplified as:
R = 24 T 2
According to formula (3), the relationship between pore radius and relaxation time is a one-to-one correspondence; that is, the T 2 value obtained by NMR test can be converted into the pore radius of the backfill.
According to the existing research results [31], the pore radius of backfill can be divided into four categories: harmless pores (pore radius < 20nm, a type of pores having no effect on strength), less harmful pores (20 nm < pore radius < 100 nm, a type of pores having little effect on strength), harmful pores (100 nm < pore radius < 200 nm, a type of pores having effect on strength) and more harmful pores (pore radius > 200 nm, a type of pores having great influence on strength). Combined with the relaxation time of NMR detection, the pore radius in the material was divided into harmless pores, less harmful pores, harmful pores and more harmful pores. The pore radius division is shown in Figure 3.
The proportion of pores with different radii can be expressed as:
P r = V r V t × 100 % = V i - V i - 1 V 4 × 100 %   ( i = 1 , 2 , 3 , 4 )
In Formula (4), V r is the cumulative volume fraction of pores smaller than r, V t is the total porosity, V 0 = 0 , V 1 is the cumulative volume fraction of pores smaller than 20 nm, V 2 is the cumulative volume fraction of pores smaller than 100 nm, V 3 is the cumulative volume fraction of pores smaller than 200 nm and V 4 is the total porosity. The calculation results are shown in Table 3.
In recent years, in order to fully describe and show the variability and complexity of pore structure of backfill, many experts and scholars have introduced fractal theory to characterize the complex microscopic pore structure inside the material. According to the existing research results of fractal theory [32,33], T 2 relaxation time distribution and fractal dimension can be expressed as follows:
lg ( V ) = ( 3 - D ) lgT 2 + ( D - 3 ) lgT 2 max
In Formula (5), V is the cumulative volume fraction of pores smaller than r, and D is the fractal dimension. If the pores of backfill have self-similar structure and fractal characteristics, there is a linear relationship between lg ( V ) and lgT 2 . Combined with the above classification basis of pores with different radii, the fractal dimension corresponding to different pores can be calculated. The calculation results are shown in Table 4.

3. Analysis of Experimental Results

3.1. Analysis of Pore Structure Characterization Parameters

Table 3 shows that the porosity of the backfill material ranges from 8.509 to 21.578%, and the variation range is relatively large, which is mainly related to the previous sample preparation process. In general, the internal pores of the backfill material are mainly the harmless pores and less harmful pores, and the sum of the average proportions of the two reaches 73.45%. However, there are fewer harmful pores and more harmful pores, and the sum of their average proportions is only 26.55%. Among them, the proportion of less harmful pores varies from 36.34 to 63.23%, and the average proportion of pores is the largest, reaching 52.47%. The second is the average proportion of harmless pores, which is 20.98%, and the proportion ranges from 2.33 to 59.51%. However, the proportions of harmful pores and more harmful pores are relatively small, and the average proportions of the two pore types are 14.10% and 12.45%, respectively. The variation ranges of the proportions of the two pore types are 0.13–26.38% and 1.68–28.59%, respectively.
The above analysis of pore distribution of backfill samples has similar results to the published related research. Liu [10] found that the pores of CPB samples are mainly non-damaging pores, and the total volume proportion of “less-damaging” pores and “non-damaging” pores is more than 80%. In addition, Ruidong Wu [34] studied the change of pore structure before and after freeze–thaw of iron tailings powder concrete. It was also found that before freeze–thaw of concrete samples, the porosity of the samples was mainly composed of harmless pores and less harmful pores, while there were fewer harmful pores and more harmful pores. Similarly, in [35], when studying the effect of fly ash with different particle sizes on concrete, it was found that among the pores of concrete samples with different particle sizes and fly ash contents, the porosity of the samples was mainly composed of harmless pores and less harmful pores.
Table 4 shows that in the pore fractal dimension of the backfill materials, the fractal dimension calculated by curve fitting is very low due to the pore division of harmless pores being too small (<20 nm) and the corresponding transverse relaxation time T 2 being less than 1 ms, so the fractal dimension of harmless pores is not considered. It is also mentioned in [10] that “when the pore radius was smaller than 20nm or larger than 1um, the fitting goodness was very poor, indicating that within these size ranges, the pores did not have fractal features”. The fractal dimension analysis results of the other three types of pores are as follows: The fractal dimension of less harmful pores ranges from 1.4423 to 2.7270, with an average of 2.0985, and the correlation coefficient of their fractal dimension ranges from 0.9052 to 0.9742, with an average of 0.9520, indicating that the fractal dimension of less harmful pores has high reliability. The second is the fractal dimension of harmful pores, whose fractal dimension ranges from 2.5380 to 2.9987 with an average value of 2.7633, and their average correlation coefficient is 0.9510 with a range of 0.6203 to 0.9904, which is also reliable. The correlation coefficient of the fractal dimension of more harmful pores ranges from 0.5668 to 0.8936, with an average of 0.7322, and is lower than that of the first two types of pores, but their fractal dimension ranges from 2.9631 to 2.9976, with an average of 2.9837. From the above analysis, three types of pores in the backfill material all have obvious fractal characteristics.

3.2. Correlation Analysis between Pore Structure Characterization Parameters and Compressive Strength

In order to analyze the relationships of the compressive strength of the backfill material with the porosity, the proportion of different pores and the fractal dimension of different pores, the calculation results of the correlation coefficients are shown in Table 5.
Table 5 shows that the absolute values of correlation coefficients of the compressive strength of the backfill material with the porosity and the proportion of different pores are all greater than 0.5655. Among them, the correlation coefficient between the proportion of harmless pores and the compressive strength is the highest, reaching up to 0.9219, and the correlation is positive, indicating that the proportion of harmless pores has a high correlation with the compressive strength. The second is the proportion of the porosity and the proportion of harmful pores, and the corresponding correlation coefficients are 0.9086 and 0.8477, respectively, with negative correlation. However, the proportion of less harmful pores and the proportion of harmful pores are not highly correlated with the compressive strength, and both of them are negatively correlated. In addition, the correlation coefficients of the compressive strength with the fractal dimension of less harmful pores, the fractal dimension of harmful pores and the fractal dimension of more harmful pores are all greater than 0.6283, and they are all positively correlated. Among them, the fractal dimension of less harmful pores and the fractal dimension of harmful pores have large correlation coefficients with the compressive strength, which are 0.9062 and 0.9049, respectively, indicating that they have a high correlation with the compressive strength. However, the correlation coefficient between the fractal dimension of more harmful pores and the compressive strength is lower than that of the first two types of pores, which is only 0.6283. The analysis results of the relationship between the fractal dimensions of pores with different radii and the compressive strength are consistent with the conclusion in [21].

4. Strength Prediction Model

4.1. Selection of Model Parameters

The selection of accurate and reasonable parameters will have a direct impact on the reliability and simplicity of the compressive strength prediction model. Based on the analysis of the above experimental results, the characterization methods of the microscopic pore structure of the backfill are diverse. In order to avoid the complexity of the model due to the selection of too many independent variables, the single-factor variance analysis of the pore structure characterization parameters and the compressive strength is carried out. The analysis results are shown in Table 6.
Table 6 shows that the correlation coefficients of the compressive strength with the porosity and the proportion of different pores are quite different. Among them, the porosity and the proportion of harmless pores are highly correlated with the compressive strength, and the correlation coefficients are 0.8256 and 0.8500, respectively. The correlation coefficient between the proportion of harmful pores and the compressive strength is 0.7186, which is the next highest. However, the proportion of less harmful pores and the proportion of more harmful pores have low correlations with the compressive strength. In addition, the fractal dimension of less harmful pores and the fractal dimension of harmful pores have a high correlation with the compressive strength, and the correlation coefficients are 0.8212 and 0.8189, respectively. However, the correlation between the fractal dimension of more harmful pores and the compressive strength is low. All of the test coefficient P values of the pore structure characterization parameters and the compressive strength are less than 0.05, indicating that the pore structure characterization parameters have a significant relationship with the compressive strength.
The analysis results of Table 6 show that the proportion of harmless pores and the fractal dimension of harmful pores are highly correlated with the compressive strength. Therefore, based on the above analysis, it is reasonable to select the proportion of harmless pores and the fractal dimension of harmful pores as the independent variables of the strength prediction model.

4.2. Establishment of Strength Prediction Model

The strength prediction model of the backfill is established by the proportion of harmless pores and the fractal dimension of harmful pores selected from the above analysis. The linear fitting relationships of the compressive strength with the proportion of harmless pores and the fractal dimension of harmful pores are obtained. The results are shown in Figure 4 and Figure 5. It can be seen from the two figures that the proportion of harmless pores and the fractal dimension of harmful pores are positively linearly correlated with the compressive strength, and the correlation coefficients are 0.8500 and 0.8189, respectively. This shows that the linear correlation between the two pore structure characterization parameters and the compressive strength is very good.
Based on the above analysis, the strength prediction model to be established is a quadratic function of the two independent variables of the proportion of harmless pores and the fractal dimension of harmful pores. By repeatedly adjusting the expression of the model and referring to the relevant literature [21], the preset strength prediction model is expressed as:
M c = β 0   + β 1 R 1   + β 2 D 2   + β 3 R 1 D 2
In Formula (6), M c is the uniaxial compressive strength of the materials, R 1 is the proportion of harmless pores and D 2 is the fractal dimension of harmful pores. The calculation results of multiple regression analysis of the above expression are shown in Table 7.
Table 7 shows that the correlation coefficient of the strength prediction model is 0.9524, which indicates that the multiple regression equation has a good fitting degree and the degree of closeness to the real values is also very high. In addition, the P value of the equation is far less than the given significance level of 0.05, indicating that the regression results of the strength prediction model are significant; that is, the relationships of the compressive strength with the proportion of harmless pores and the fractal dimension of harmful pores are significant. Substituting the estimated values of the regression coefficients calculated in Table 7 into the Formula (6), the equation of the backfill material strength prediction model can be expressed as follows:
M c = 5.0708 30.9799 R 1 + 2.3595 D 2 + 12.0689 R 1 D 2

4.3. Model Rationality Verification

In order to verify the accuracy of the strength prediction model, this paper uses the prediction model to calculate the uniaxial compressive strength of some backfill samples and compares it with the uniaxial compressive strength measured by the actual test. The analysis results are shown in Table 8 and Figure 6.
It can be seen from Table 8 and Figure 6 that the strength value calculated by the strength prediction model is very close to the strength value measured by the test, and the error is small, indicating that the established strength prediction model of the backfill material has high accuracy and reliability and can thus be used to predict the uniaxial compressive strength of relevant backfill materials.

5. Conclusions

In the experiment, four groups of backfill samples with different cement–sand ratios were made with raw materials. Based on uniaxial compressive strength test, NMR porosity test and fractal characteristics of pore structure, a compressive strength prediction model with the proportion of harmless pores and the fractal dimension of harmful pores as independent variables was established. The experimental conclusions are as follows:
(1)
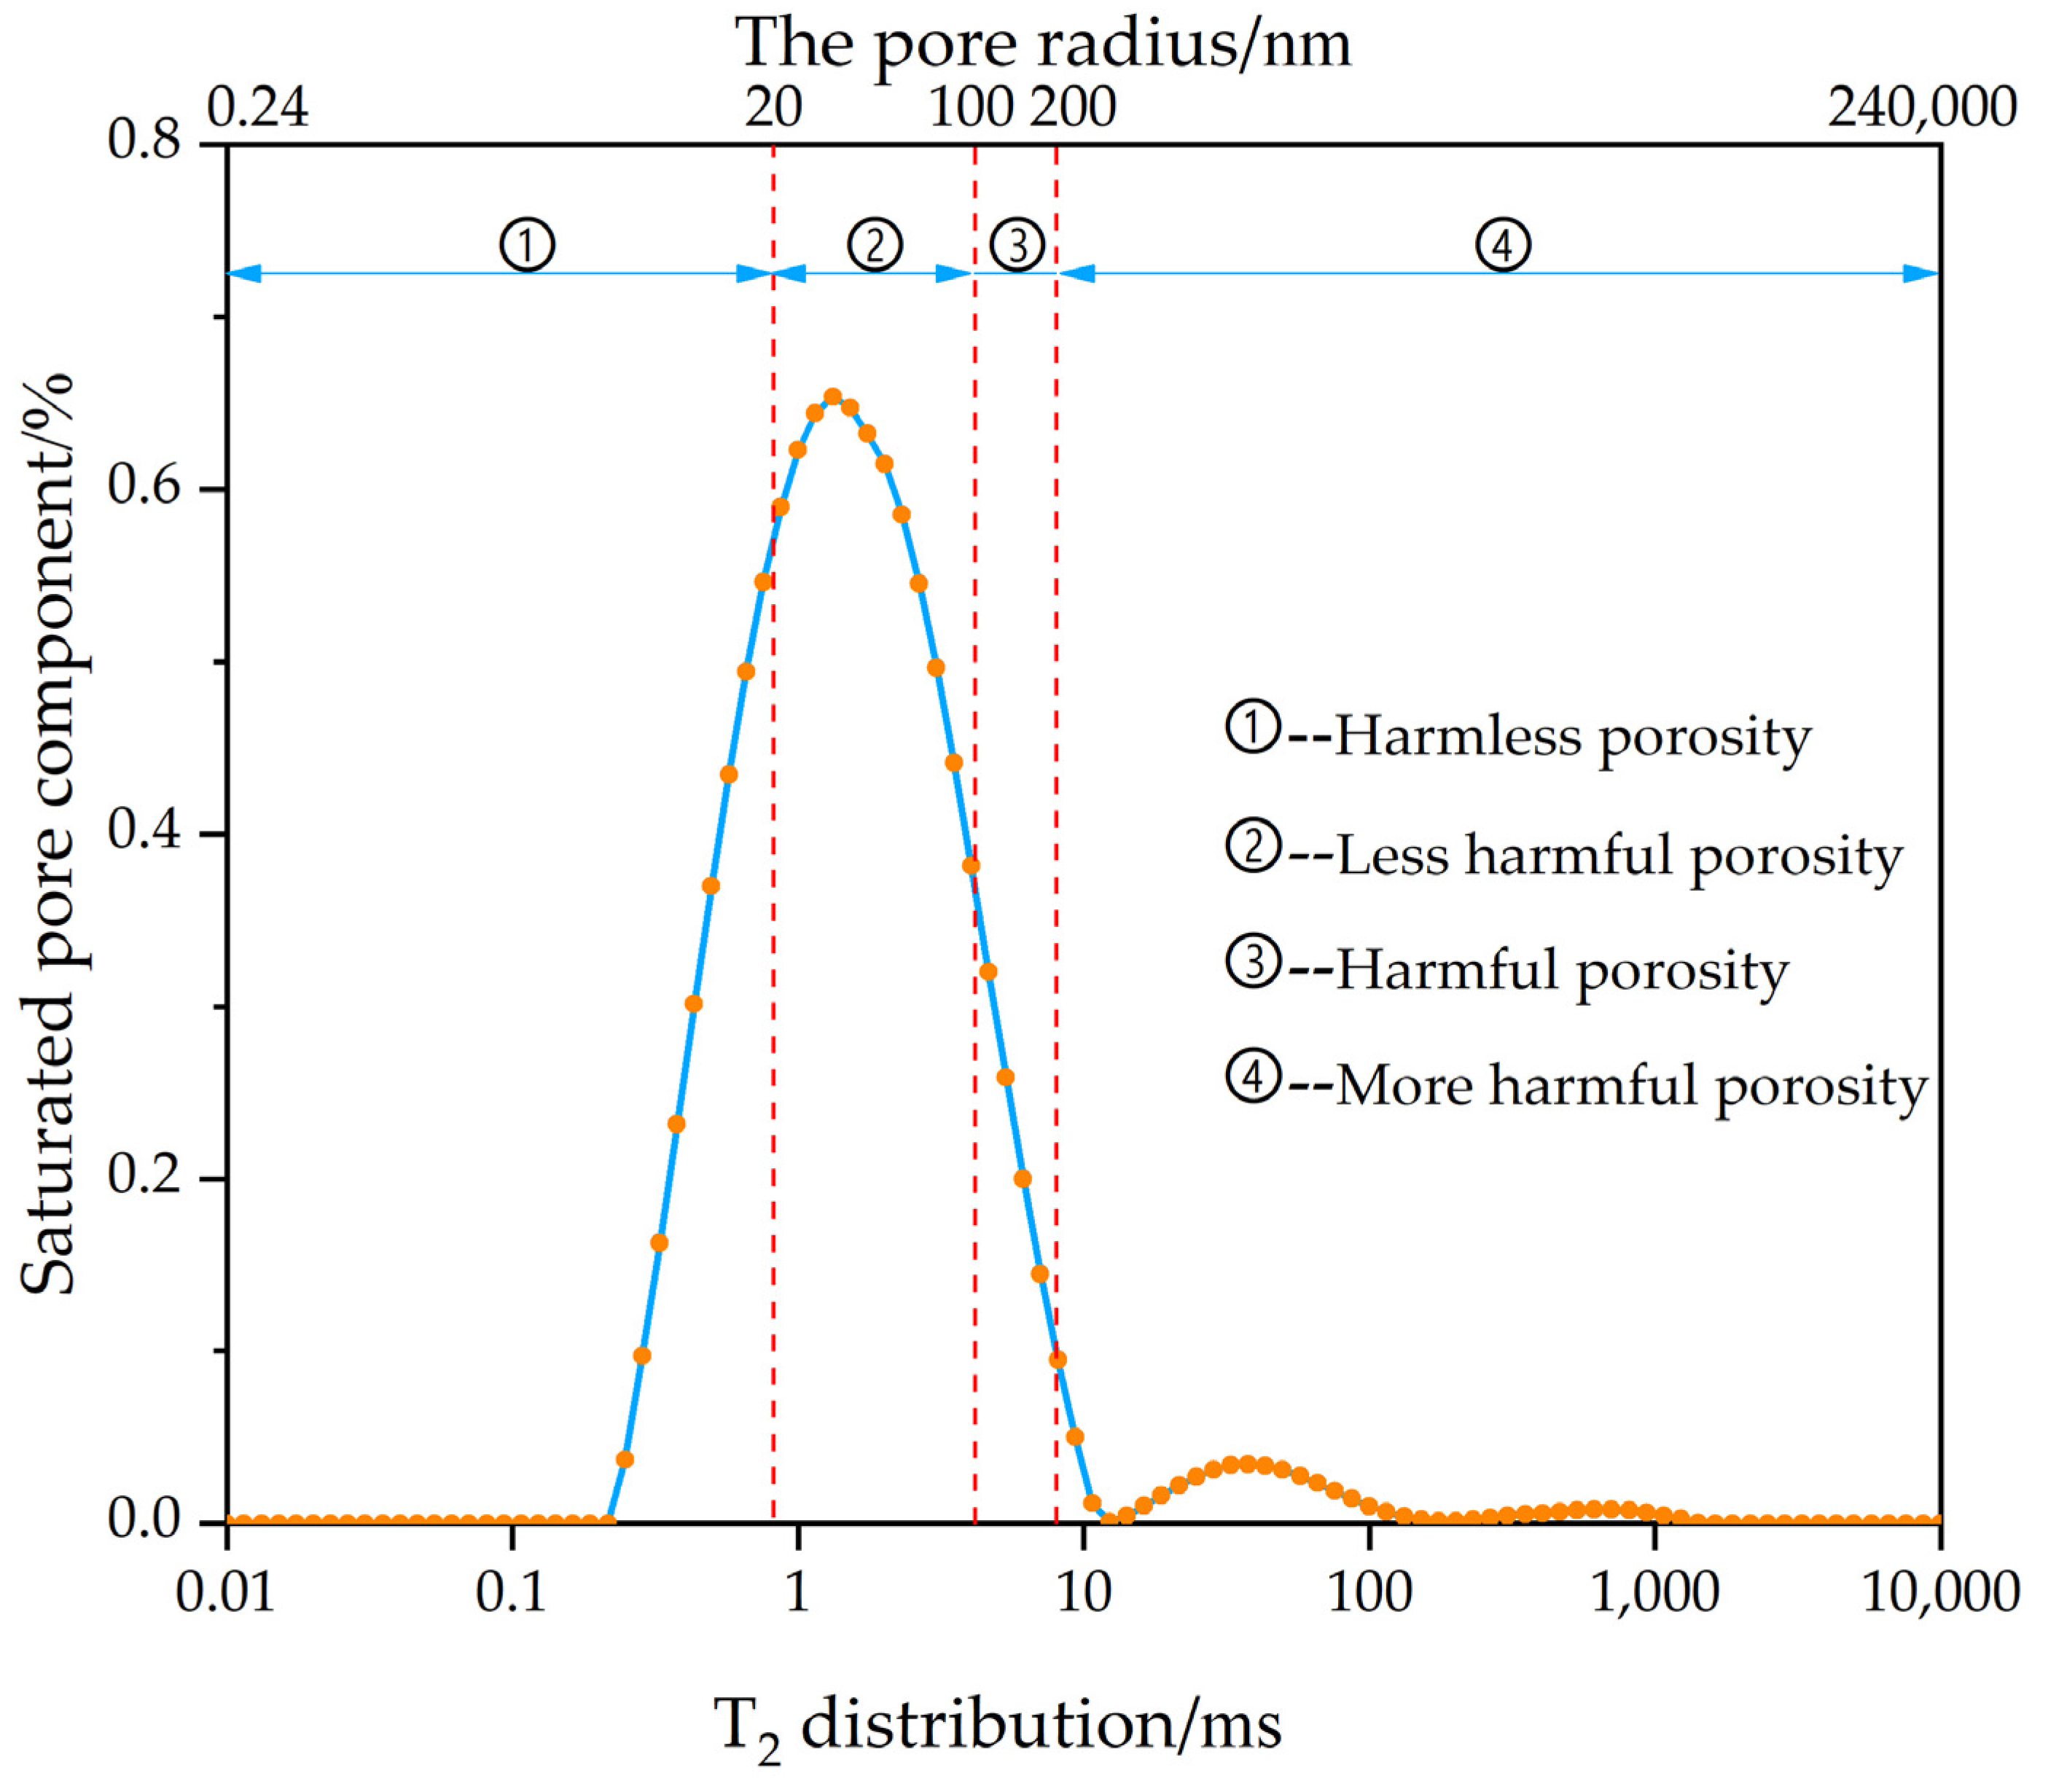
The internal pore distributions of the backfill material are mainly the harmless and less harmful pores, while the harmful and more harmful pores are less prevalent. The fractal dimensions of the three types of pores have obvious fractal characteristics. Among them, the correlation coefficient of the fractal dimension of less harmful and harmful pores is higher, while that of more harmful pores is lower than that of the first two types of pores.
(2)
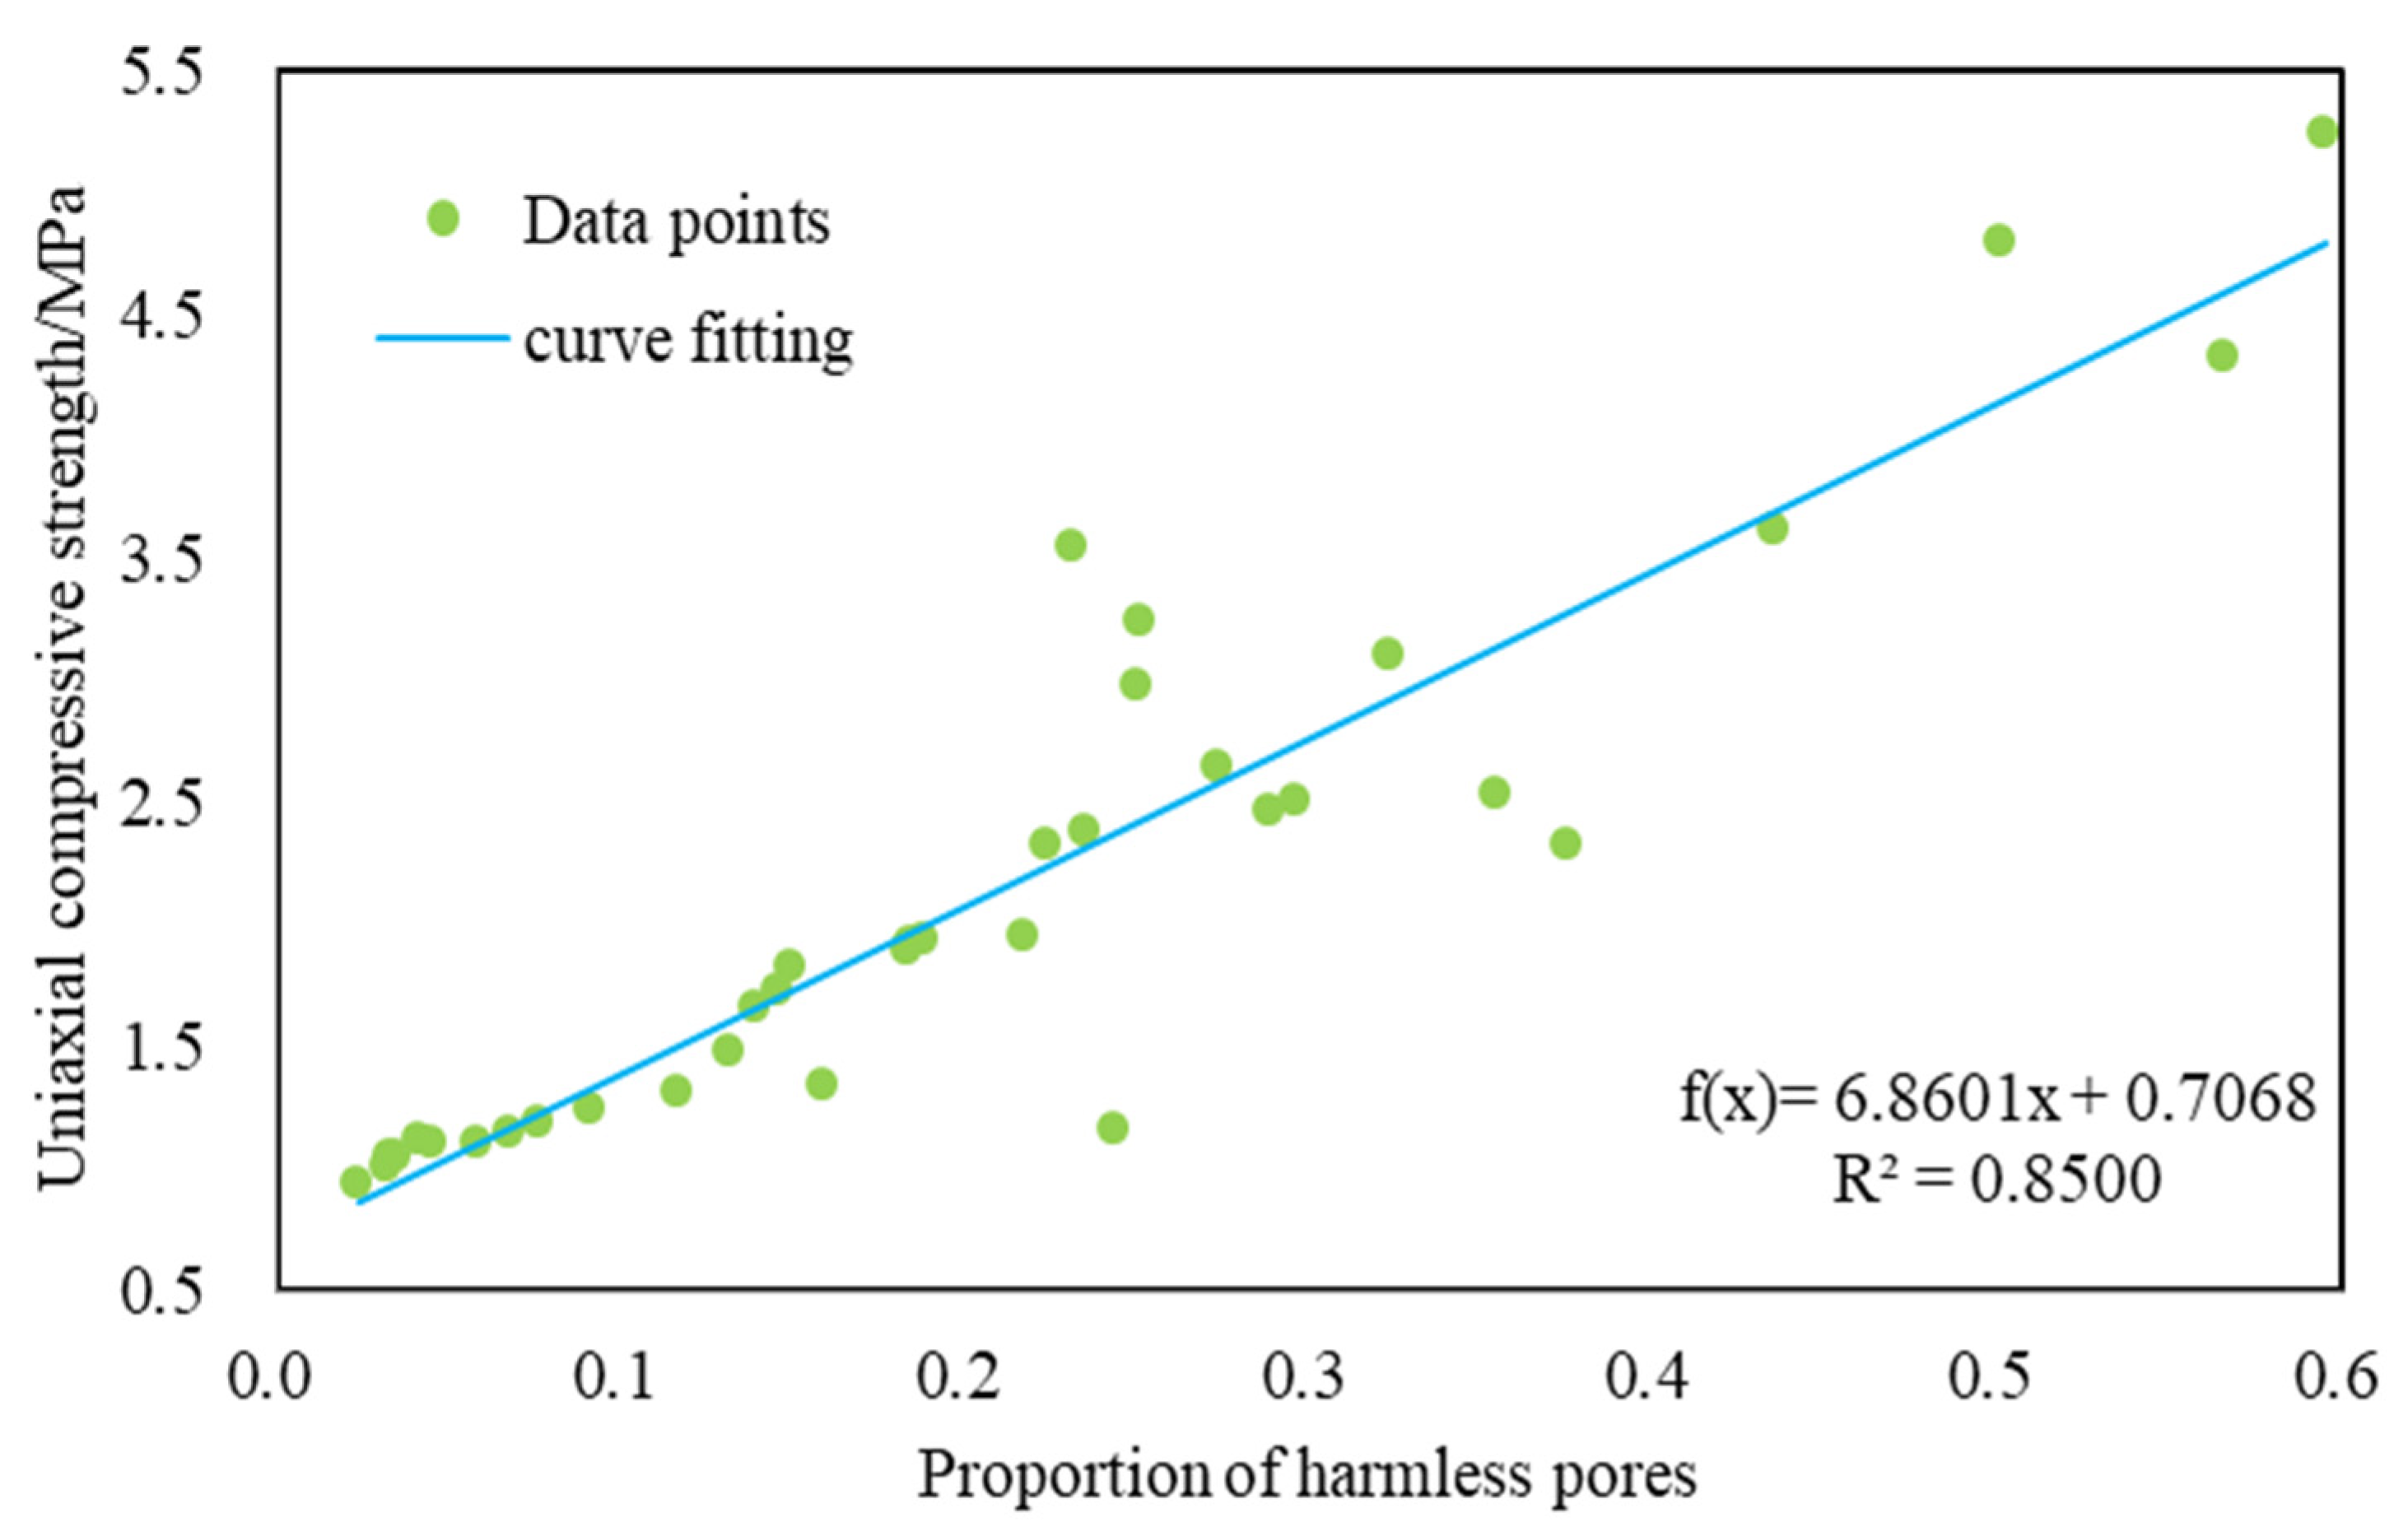
The porosity, the proportion of harmless pores, the proportion of harmful pores, the fractal dimension of less harmful pores and the fractal dimension of harmful pores all have a high correlation with the compressive strength. Therefore, it is reasonable to select the proportion of harmless pores and the fractal dimension of harmful pores as the independent variables of the strength prediction model.
(3)
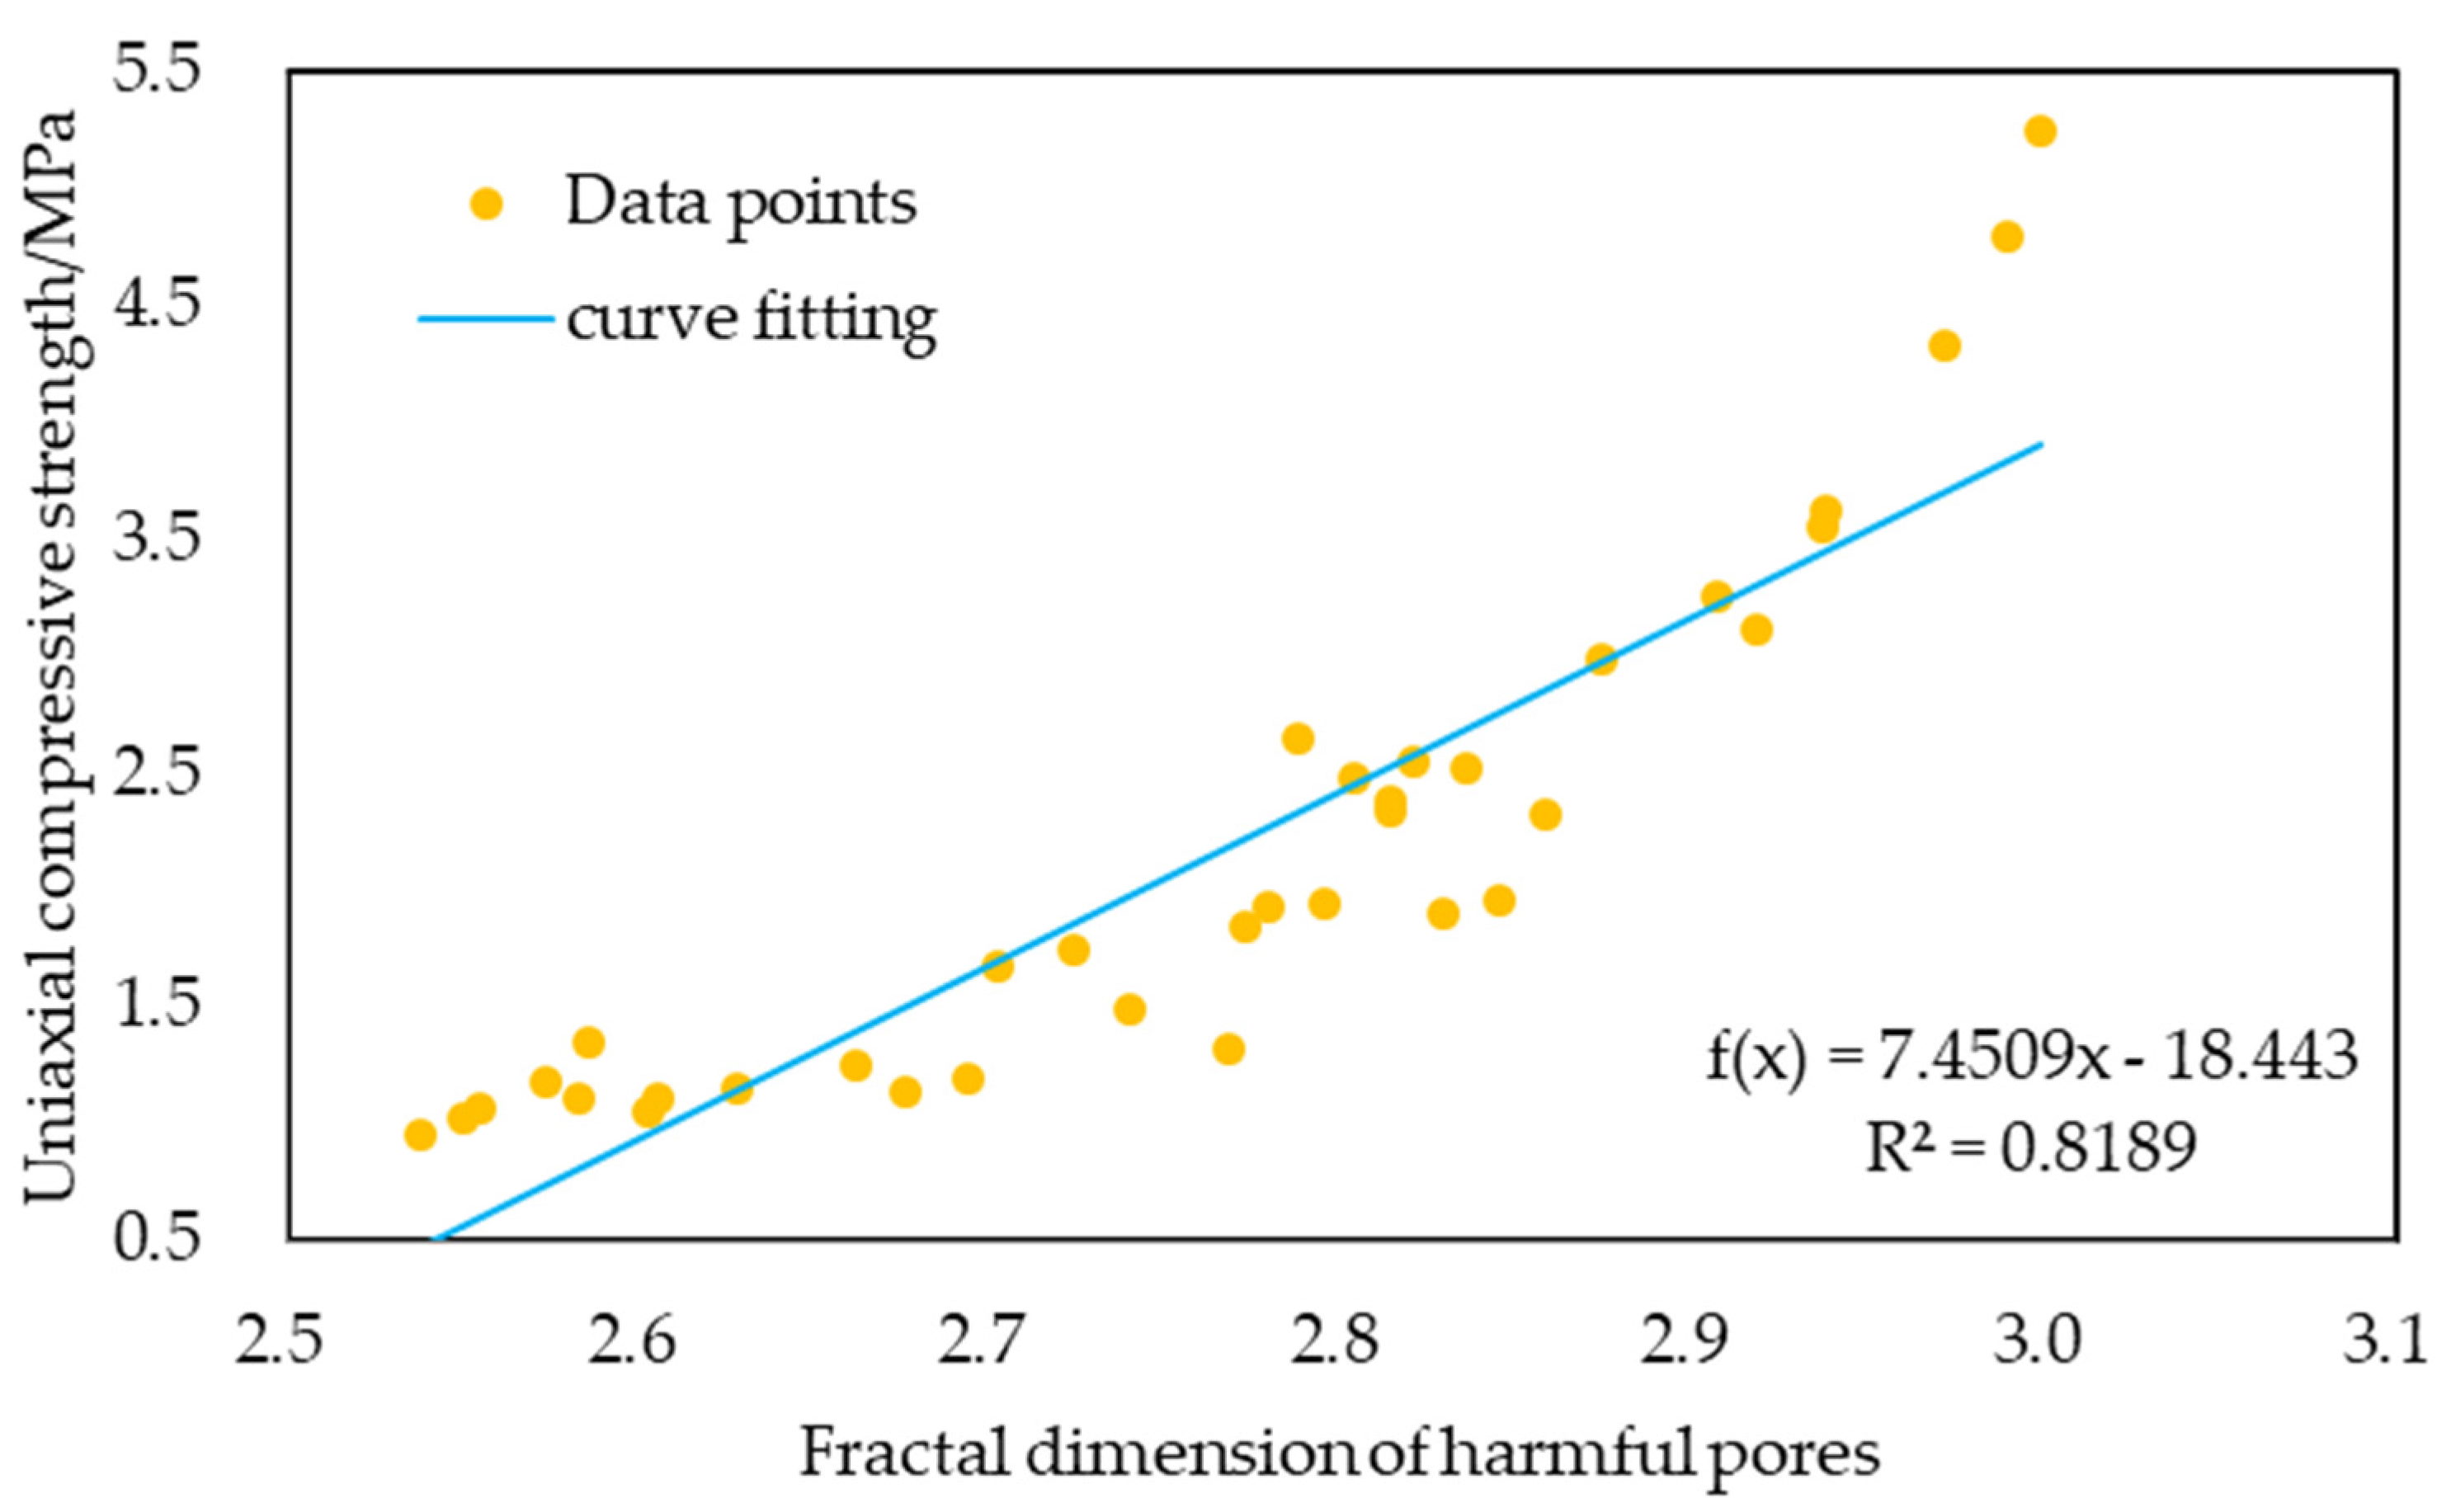
The compressive strength has strong linear relationships with the proportion of harmless pores and the fractal dimension of harmful pores, and they are positively linearly correlated.
(4)
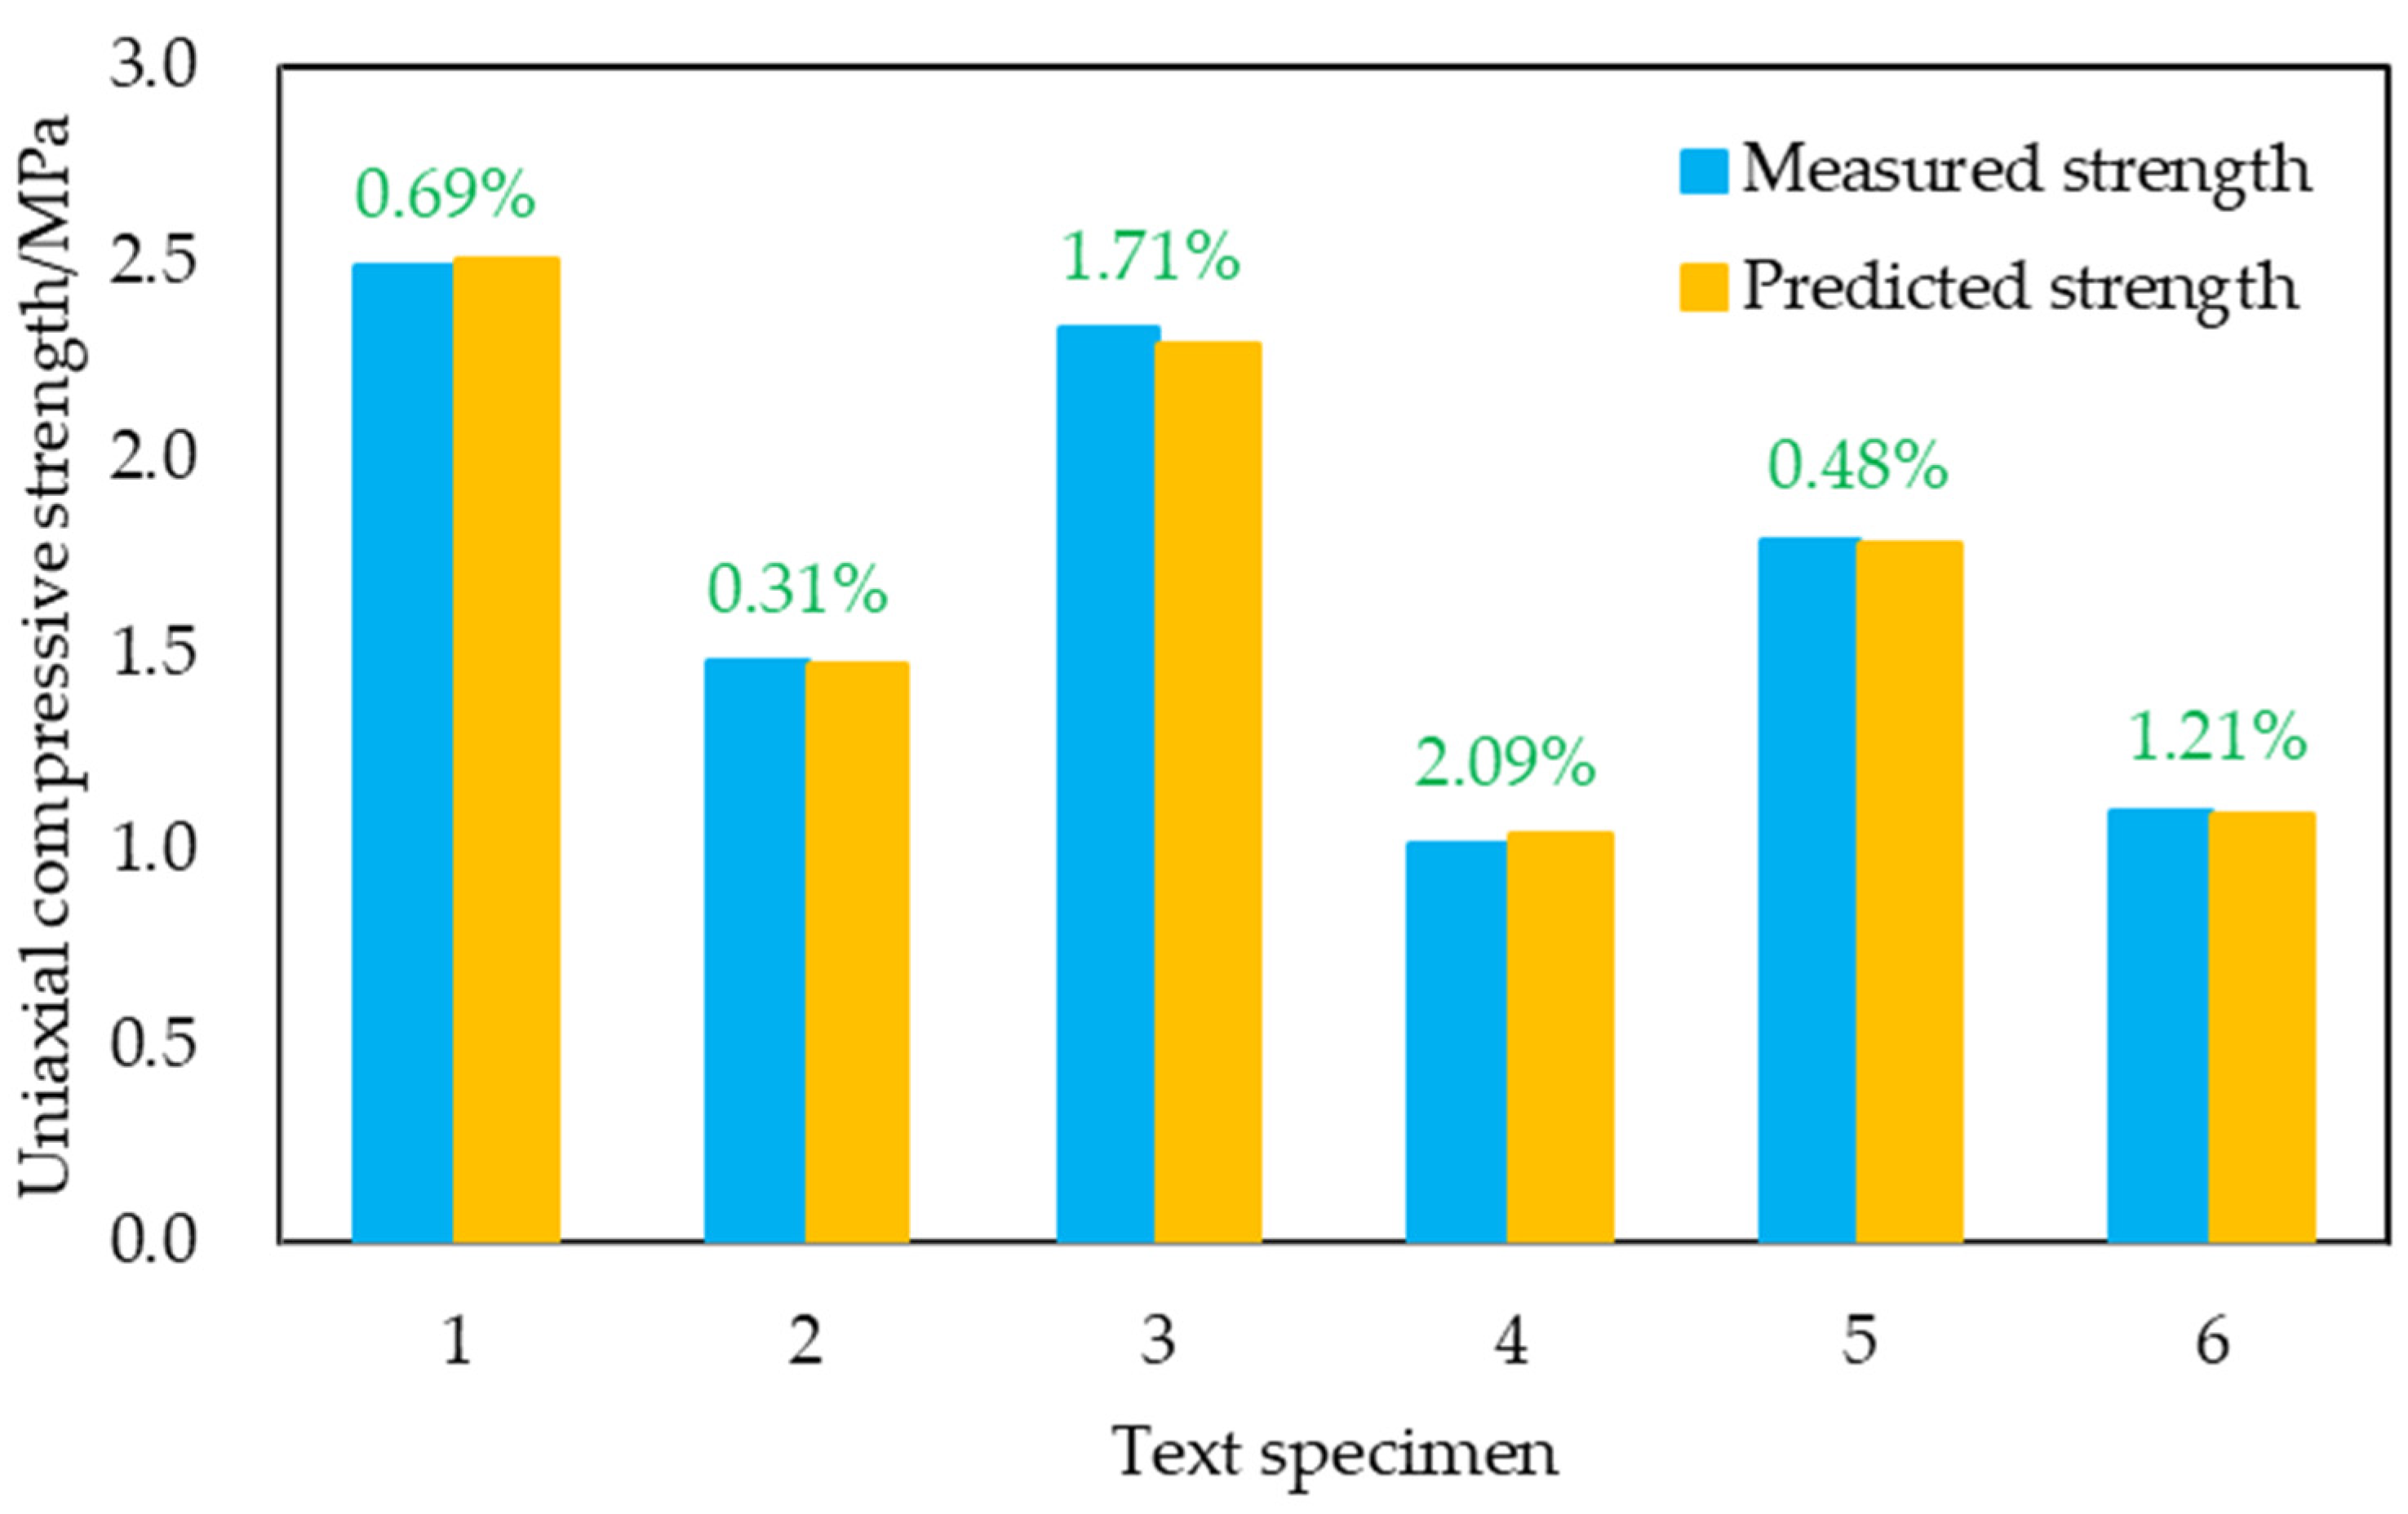
The regression results of the backfill strength prediction model established in this paper are very significant. The strength value calculated by the established prediction model is very close to the actual strength value measured by the test, and the error is small, indicating that the established model is reliable.

Author Contributions

H.D. and G.T. provided experimental ideas; Y.L. and T.D. carried out the experiment; W.Z. and G.T. directed the experiment; T.D. wrote the paper. All authors have read and agreed to the published version of the manuscript.

Funding

This work was financially supported by the National Natural Science Foundation of China under Grant number 51874352.

Data Availability Statement

The source data can be obtained in the article.

Acknowledgments

Not applicable.

Conflicts of Interest

The authors declare no conflict of interest.

References

  1. Rybak, J.; Kongar-Syuryun, C.; Tyulyaeva, Y.; Khayrutdinov, A.M. Creation of Backfill Materials Based on Industrial Waste. Minerals 2021, 11, 739. [Google Scholar] [CrossRef]
  2. Bagani, M.; Balomenos, E.; Panias, D. Nepheline Syenite as an Alternative Source for Aluminum Production. Minerals 2021, 11, 734. [Google Scholar] [CrossRef]
  3. Tsaousi, G.-M.; Panias, D. Production, Properties and Performance of Slag-Based, Geopolymer Foams. Minerals 2021, 11, 732. [Google Scholar] [CrossRef]
  4. Dentoni, V.; Grosso, B.; Pinna, F. Experimental Evaluation of PM Emission from Red Mud Basins Exposed to Wind Erosion. Minerals 2021, 11, 405. [Google Scholar] [CrossRef]
  5. Zhang, J.; Ma, C.; Jin, A.; Chen, S. Experimental study on strength characteristics of cemented backfill. Min. Res. Dev. 2021, 41, 124–129. [Google Scholar]
  6. Liu, T. Technology and Application of Filling Mining; Metallurgical Industry Press: Beijing, China, 2001. [Google Scholar]
  7. Liu, C.; Han, B.; Sun, W.; Wu, J.; Yao, S.; Hu, H. Experimental study on strength characteristics of waste rock crushing cemented backfill in alpine area and its industrial application. Chin. J. Rock Mech. Eng. 2015, 34, 139–147. [Google Scholar]
  8. Zhang, S.; Yang, L.; Qiu, J.; Hou, C.; Guo, Z. Fluidity and strength behaviors of cemented foam backfill: Effect of particle size distribution and foaming agent dosage. Bull. Eng. Geol. Environ. 2021, 80, 3177–3191. [Google Scholar] [CrossRef]
  9. Deng, H.; Liu, Y.; Zhang, W.; Yu, S.; Tian, G. Study on the Strength Evolution Characteristics of Cemented Tailings Backfill from the Perspective of Porosity. Minerals 2021, 11, 82. [Google Scholar] [CrossRef]
  10. Liu, L.; Fang, Z.; Qi, C.; Zhang, B.; Guo, L.; Song, K.-I. Experimental investigation on the relationship between pore characteristics and unconfined compressive strength of cemented paste backfill. Constr. Build. Mater. 2018, 179, 254–264. [Google Scholar] [CrossRef]
  11. Xin, J. Study on Microstructure and Mechanical Properties of Cemented Tailings Filling Material; Xi’an University of Science and Technology: Xi’an, China, 2020. [Google Scholar]
  12. Yilmaz, T.; Ercikdi, B.; Deveci, H. Utilisation of construction and demolition waste as cemented paste backfill material for underground mine openings. J. Environ. Manag. 2018, 222, 250–259. [Google Scholar] [CrossRef] [PubMed]
  13. Jianhua, H.U.; Zhao, F.; Ren, Q.; Kuang, Y.; Zhou, T.; Luo, Z. Microscopic characterization and strength characteristics of cemented backfill under different humidity curing conditions. R. Soc. Open Sci. 2019, 6, 191227. [Google Scholar]
  14. Yilmaz, E.; Belem, T.; Bussière, B.; Benzaazoua, M. Relationships between microstructural properties and compressive strength of consolidated and unconsolidated cemented paste backfills. Cem. Concr. Compos. 2011, 33, 702–715. [Google Scholar] [CrossRef]
  15. Rubashkina, I.T.; Korneichuk, M.A. Optimization of grading of sand in backfill using metallurgical waste. J. Min. Sci. 2021, 56, 130–139. [Google Scholar]
  16. Chen, Q.; Tao, Y.; Zhang, Q.; Qi, C. The rheological, mechanical and heavy metal leaching properties of cemented paste backfill under the influence of anionic polyacrylamide. Chemosphere 2021, 286, 131630. [Google Scholar] [CrossRef]
  17. Chen, Q.; Sun, S.; Liu, Y.; Qi, C.; Zhou, H.; Zhang, Q. Immobilization and leaching characteristics of fluoride from phosphogypsum-based cemented paste backfill. Int. J. Miner. Metall. Mater. 2021. [Google Scholar] [CrossRef]
  18. Chen, Q.; Tao, Y.; Feng, Y.; Zhang, Q.; Liu, Y. Utilization of modified copper slag activated by Na2SO4 and CaO for unclassified lead/zinc mine tailings based cemented paste backfill. J. Environ. Manag. 2021, 290, 112608. [Google Scholar] [CrossRef]
  19. Zhang, Q.; Li, Y.; Chen, Q.; Liu, Y.; Feng, Y.; Wang, D. Effects of temperatures and pH values on rheological properties of cemented paste backfill. J. Cent. South Univ. 2021, 28, 1707–1723. [Google Scholar] [CrossRef]
  20. HU, J.-H.; Ren, Q.-F.; Yang, D.-J.; Ma, S.-W.; Shang, J.-L.; Ding, X.-T.; Luo, Z.-Q. Cross-scale characteristics of backfill material using NMR and fractal theory. Trans. Nonferr. Met. Soc. China 2020, 30, 1347–1363. [Google Scholar] [CrossRef]
  21. Deng, H.; Tian, G.; Yu, S.; Jiang, Z.; Zhong, Z.; Zhang, Y. Research on Strength Prediction Model of Sand-Like Material Based on Nuclear Magnetic Resonance and Fractal Theory. Appl. Sci. 2020, 10, 6601. [Google Scholar] [CrossRef]
  22. Zhang, X.; Lin, B.; Li, Y.; Zhu, C.; Li, Q. Analysis of fractal dimension of coal subjected to electrical breakdown based on nuclear magnetic resonance. J. Nat. Gas Sci. Eng. 2020, 79, 103345. [Google Scholar] [CrossRef]
  23. Chen, B.; Wang, H.; Hu, H.; Jiang, B. Strength model of phosphogypsum backfill based on activity rate and fractal dimension. Ind. Miner. Process. 2021, 06, 1–10. [Google Scholar]
  24. Jin, S.; Zhang, J.; Han, S. Fractal analysis of relation between strength and pore structure of hardened mortar. Constr. Build. Mater. 2017, 135, 1–7. [Google Scholar] [CrossRef]
  25. Deo, O.; Neithalath, N. Compressive Behavior of Pervious Concretes and a Quantification of the Influence of Random Pore Structure Features. Mater. Sci. Eng. A 2010, 528, 402–412. [Google Scholar] [CrossRef]
  26. Changjiang Academy of Sciences. Yangtze River Water Conservancy Commission, Rock Test. Rules for Water Conservancy and Hydropower Projects; Changjiang Academy of Sciences: Wuhan, China, 2001. [Google Scholar]
  27. China Institute of Water Resources and Hydropower Research. Nanjing Institute of Water Resources Science, Hydraulic Concrete Test. Rules; China Institute of Water Resources and Hydropower Research: Beijing, China, 2006. [Google Scholar]
  28. Li, J.; Zhou, K.; Zhang, Y.; Xu, Y. Experimental study on freeze-thaw damage of rock pore structure based on nuclear magnetic resonance technique. Chin. J. Rock Mech. Eng. 2012, 31, 1208–1214. [Google Scholar]
  29. Li, J.; Zhu, L.; Zhou, K.; Liu, H.; Cao, S. The damage characteristics of sandstone pore structure under freeze-thaw action. Rock Soil Mech. 2019, 40, 3524–3532. [Google Scholar]
  30. She, A. Evolution of Water State in Cement Slurry and the Relationship between Water Process and Microstructure of Slurr; Tongji University: Shanghai, China, 2011. [Google Scholar]
  31. Zhongwei, W.U. High Performance Concrete; China Railway Publishing House: Beijing, China, 1999; p. 24. [Google Scholar]
  32. Sun, W.; Zuo, Y.; Wu, Z.; Liu, H.; Xi, S.; Shui, Y.; Wang, J.; Liu, R.; Lin, J. Fractal analysis of pores and the pore structure of the Lower Cambrian Niutitang shale in northern Guizhou province: Investigations using NMR, SEM and image analyses. Mar. Pet. Geol. 2018, 99, 416–428. [Google Scholar] [CrossRef]
  33. Zhao, Y.; Zhu, G.; Dong, Y.; Danesh, N.N.; Chen, Z.; Zhang, T. Comparison of low-field NMR and microfocus X-ray computed tomography in fractal characterization of pores in artificial cores. Fuel 2017, 210, 217–226. [Google Scholar] [CrossRef]
  34. Wu, R. Performance and Mechanism Analysis of Quartz-Type Iron Tailings Powder and Waste Rock in Cement-Based Materials; University of Science and Technology Beijing: Beijing, China, 2020. [Google Scholar]
  35. Liu, J.; Zhang, Y.; Liu, R.; Duan, C. Effect of fly ash on the structure and strength of concrete. ICEEP 2017, 143, 56–63. [Google Scholar]
Figure 1. Material particle size distribution and accumulation curve: (a) fly ash; (b) cement; (c) tailings (source: elaborated by authors).
Minerals 11 00886 g001
Figure 2. Experimental steps (source: elaborated by authors).
Minerals 11 00886 g002
Figure 3. Pore radius division of backfill (source: elaborated by authors).
Minerals 11 00886 g003
Figure 4. The fitting relationship between the proportion of harmless pores and strength (source: elaborated by authors).
Minerals 11 00886 g004
Figure 5. Fitting relationship between fractal dimension of harmful pores and strength (source: elaborated by authors).
Minerals 11 00886 g005
Figure 6. Comparison results of measured strength and predicted strength of backfill (source: elaborated by authors).
Minerals 11 00886 g006
Table 1. Basic physical parameters of tailings (source: elaborated by authors).
Tailing TypeSpecific WeightLoose Density (t × m−3)Tap Density (t × m−3)Maximum Porosity
(%)
Minimum Porosity
(%)
Natural Repose Angle (°)
Graded tailings2.7271.4661.7020.4620.37639
Table 2. Main chemical compositions of the materials (source: elaborated by authors).
MaterialTailingCementLimeFly Ash
Main ComponentSiO2 (79.27%)CaO (63.34%)CaO (73.56%)SiO2 (46.31%)
CaO (5.54%)SiO2 (23.53%)SiO2 (2.14%)Al2O3 (28.45%)
Fe2O3 (5.34%)Al2O3 (4.23%)MgO (2.14%)CaO (9.24%)
Al2O3 (4.16%)Fe2O3 (3.45%)Al2O3 (1.47%)Fe2O3 (4.25%)
SO3 (2.62%)MgO (2.83%)Fe2O3 (0.98%)Ti2O (1.30%)
K2O (0.82%)Na2O (0.03%)K2O (0.23%)SO3 (0.85%)
Table 3. Table of pore radius distribution and strength of backfill samples (source: elaborated by authors).
GroupCement–Sand
Ratio
Porosity (%)Proportion of Harmless Pores (%)Proportion of Less Harmful Pores (%)Proportion of Harmful Pores (%)Proportion of More Harmful Pores (%)Uniaxial Compressive Strength (MPa)
Group A1:412.28029.5856.779.693.962.513
8.50959.5138.070.132.295.245
15.53918.4352.8014.5814.191.919
1:610.35725.1157.0813.454.363.244
16.71413.1144.8314.2127.851.486
18.2914.4750.4923.1321.911.105
1:815.43118.7659.3614.787.101.936
17.9286.7251.8721.5819.831.146
21.5782.3353.0926.3818.200.942
Group B1:410.26143.5143.944.747.813.623
13.19837.5250.254.887.352.327
17.5399.0554.3320.9115.711.247
1:616.37714.5450.9017.1617.401.730
11.08435.4248.766.938.892.539
16.46313.9352.4018.9514.721.664
1:821.3613.2154.0526.3716.371.010
10.27723.1453.1812.9610.723.552
19.4463.2456.8723.9515.941.045
Group C1:410.54032.3554.476.286.903.101
12.32823.5246.5211.9118.052.376
12.76228.8754.359.587.202.465
1:615.73414.9156.0315.0514.011.831
10.19150.0945.872.361.684.792
18.6355.7954.2318.8821.101.102
1:816.84511.6060.8515.7511.801.316
17.62315.8357.3613.7113.101.342
15.48324.3255.4312.218.041.166
Group D1:411.03627.3347.6114.6510.412.647
14.15322.3956.0310.1011.482.323
10.23456.5336.340.986.154.322
1:611.02425.0050.2011.2013.602.980
14.76221.7060.1211.526.661.952
17.8437.5757.1219.1216.191.190
1:815.66918.3263.2312.705.751.899
18.8523.4645.6222.3328.591.054
18.2594.1058.3624.6512.891.126
Table 4. Fractal dimension of backfill samples (source: elaborated by authors).
GroupCement–Sand RatioLess Harmful PoresHarmful PoresMore Harmful Pores
DR2DR2DR2
Group A1:42.34670.96782.83610.96492.97930.8767
2.71990.91002.99870.62032.99760.6508
2.21630.96262.77950.97772.98290.7553
1:62.49760.95202.90730.95832.98780.8106
2.15410.95642.74030.99042.96440.6861
1.62540.95322.58310.98412.97730.6075
1:82.16560.96552.79510.95742.98980.8799
1.71970.95692.62800.97962.97650.7502
1.50540.95852.53800.98042.98190.6950
Group B1:42.60080.94302.93840.94552.98890.8755
2.29890.96592.81450.97092.98570.8304
1.89070.96192.66160.98072.98410.6421
1:62.13280.96412.72380.98572.98260.5916
2.29490.96992.82050.95822.99490.6776
1.96670.96142.70200.97712.98320.7415
1:81.44230.94902.55020.98122.98560.5668
2.51120.94702.93730.89952.98910.8378
1.61440.95642.60260.97712.98350.7184
Group C1:42.42940.95142.91860.90452.98960.8226
2.35990.96412.81410.98192.97460.8308
2.26370.91062.80340.97162.98910.7439
1:62.10910.95522.77260.97582.98430.6803
2.72700.90522.98960.91042.99370.6295
1.51930.94832.60550.97622.98810.6065
1:81.96780.95092.76790.96542.98560.7453
1.72340.95392.58640.98682.96310.6467
1.65310.93622.57360.98762.97350.6013
Group D1:42.39660.97422.78790.98472.99030.6127
2.27650.95362.85780.95342.98400.8327
2.60910.93242.97210.80732.99350.6249
1:62.36800.96432.87470.92712.99430.7766
2.22990.95982.84490.93892.98930.8936
1.79330.95462.69350.97042.97850.8181
1:82.14230.95432.82950.94492.99250.6983
1.55800.95142.55470.98602.96470.7478
1.71470.94952.67640.97442.97070.8522
Table 5. Table of correlation coefficients (source: elaborated by authors).
Correlation
Coefficient
PorosityProportion of
Harmless Pores
Proportion of Less Harmful PoresProportion of Harmful PoresProportion of More Harmful PoresFractal Dimension of Less Harmful PoresFractal Dimension of Harmful PoresFractal Dimension of More Harmful Pores
Uniaxial Compressive Strength−0.90860.9219−0.5655−0.8477−0.68080.90620.90490.6283
Table 6. Single-factor variance analysis of pore structure parameters and compressive strength (source: elaborated by authors).
Parameter TypesPore Structure ParametersR2FP
Porosity and
Proportions
Porosity0.8256160.91890.0000
Proportion of Harmless Pores0.8500192.61010.0000
Proportion of Less Harmful Pores0.319815.98660.0003
Proportion of Harmful Pores0.718686.84090.0000
Proportion of More Harmful Pores0.463529.37930.0000
Fractal DimensionFractal Dimension of Less Harmful Pores0.8212156.19360.0000
Fractal Dimension of Harmful Pores0.8189153.70630.0000
Fractal Dimension of More Harmful Pores0.394722.17450.0000
Table 7. Calculation results of multiple regression analysis (source: elaborated by authors).
Regression CoefficientsEstimated ValueConfidence Interval
β0−5.0708[−8.4638,−1.6778]
β1−30.9799[−44.3521,−17.6077]
β22.3595[1.0801,3.6390]
β312.0689[7.4814,16.6564]
R2 = 0.9524, F = 213.5310, P = 0.0000
Table 8. Verification results of backfill strength prediction model (source: elaborated by authors).
Serial NumberProportion of
Harmless Pores (%)
Fractal Dimension of Harmful PoresMeasured Strength (MPa)Predicted Strength (MPa)Error (%)
146.072.75892.4892.5060.69
223.152.66251.4831.4780.31
365.702.69362.3292.2891.71
427.312.57691.0211.0422.09
539.822.67851.7941.7850.48
623.462.58711.1041.0911.21
Publisher’s Note: MDPI stays neutral with regard to jurisdictional claims in published maps and institutional affiliations.

