Article

Ore Genesis of the Takatori Tungsten–Quartz Vein Deposit, Japan: Chemical and Isotopic Evidence

by
Yuichi Morishita
1,2,3,* and
Yoshiro Nishio
4
1
Shizuoka University, 836 Ohya, Shizuoka 422-8529, Japan
2
Geological Survey of Japan, National Institute of Advanced Industrial Science and Technology (AIST), Tsukuba 305-8567, Japan
3
Museum of Natural and Environmental History, Shizuoka 422-8017, Japan
4
Faculty of Agriculture and Marine Science, Kochi University, Monobe B200, Nankoku, Kochi 783-8502, Japan
*
Author to whom correspondence should be addressed.
Minerals 2021, 11(7), 765; https://doi.org/10.3390/min11070765
Submission received: 11 June 2021 / Revised: 9 July 2021 / Accepted: 11 July 2021 / Published: 15 July 2021

Abstract

:
The Takatori hypothermal tin–tungsten vein deposit is composed of wolframite-bearing quartz veins with minor cassiterite, chalcopyrite, pyrite, and lithium-bearing muscovite and sericite. Several wolframite rims show replacement textures, which are assumed to form by iron replacement with manganese postdating the wolframite precipitation. Lithium isotope ratios (δ7Li) of Li-bearing muscovite from the Takatori veins range from −3.1‰ to −2.1‰, and such Li-bearing muscovites are proven to occur at the early stage of mineralization. Fine-grained sericite with lower Li content shows relatively higher δ7Li values, and might have precipitated after the main ore forming event. The maximum oxygen isotope equilibrium temperature of quartz–muscovite pairs is 460 °C, and it is inferred that the fluids might be in equilibrium with ilmenite series granitic rocks. Oxygen isotope ratios (δ18O) of the Takatori ore-forming fluid range from +10‰ to +8‰. The δ18O values of the fluid decreased with decreasing temperature probably because the fluid was mixed with surrounding pore water and meteoric water. The formation pressure for the Takatori deposit is calculated to be 160 MPa on the basis of the difference between the pressure-independent oxygen isotope equilibrium temperature and pressure-dependent homogenization fluid inclusions temperature. The ore-formation depth is calculated to be around 6 km. These lines of evidence suggest that a granitic magma beneath the deposit played a crucial role in the Takatori deposit formation.

1. Introduction

Tin–tungsten deposits form in association with magmatic intrusions, and magmatic hydrothermal fluids are the most probable source for the deposits [1,2,3,4]. Oxygen isotopes are used to constrain the ore genesis [1], and magmatic fluid evolution by meteoric water incorporation was discussed [2]. Japan is divided into two metallogenic provinces, molybdenum and tin–tungsten. The granitoids in the tin–tungsten province are magnetite-free granitic rocks of the ilmenite series (similar to S-type rather than I-type), whereas those within the molybdenum province are magnetite series (similar to I-type) based on their chemical and mineralogical compositions [5]. The Takatori deposit is located about 100 km north of Tokyo, in the tin–tungsten province (Figure 1).
We have applied oxygen isotope thermometry to the Takatori hypothermal tin–tungsten–quartz vein deposit to determine whether the ore-forming fluid was magmatic. The fluid evolution is discussed based on the calculations of the oxygen isotope ratio of the estimated ore-forming fluid. We also determined a formation pressure for the Takatori deposit by considering isotope and fluid inclusion studies. Lithium-bearing micas are characteristic minerals of the Takatori deposit, and their lithium isotope ratios were determined to examine their identity. Here, we discuss the genesis of the deposit by estimating its formation conditions based on chemical and isotopic analyses.

2. Geology and Mineralogy in the Takatori Mining Area

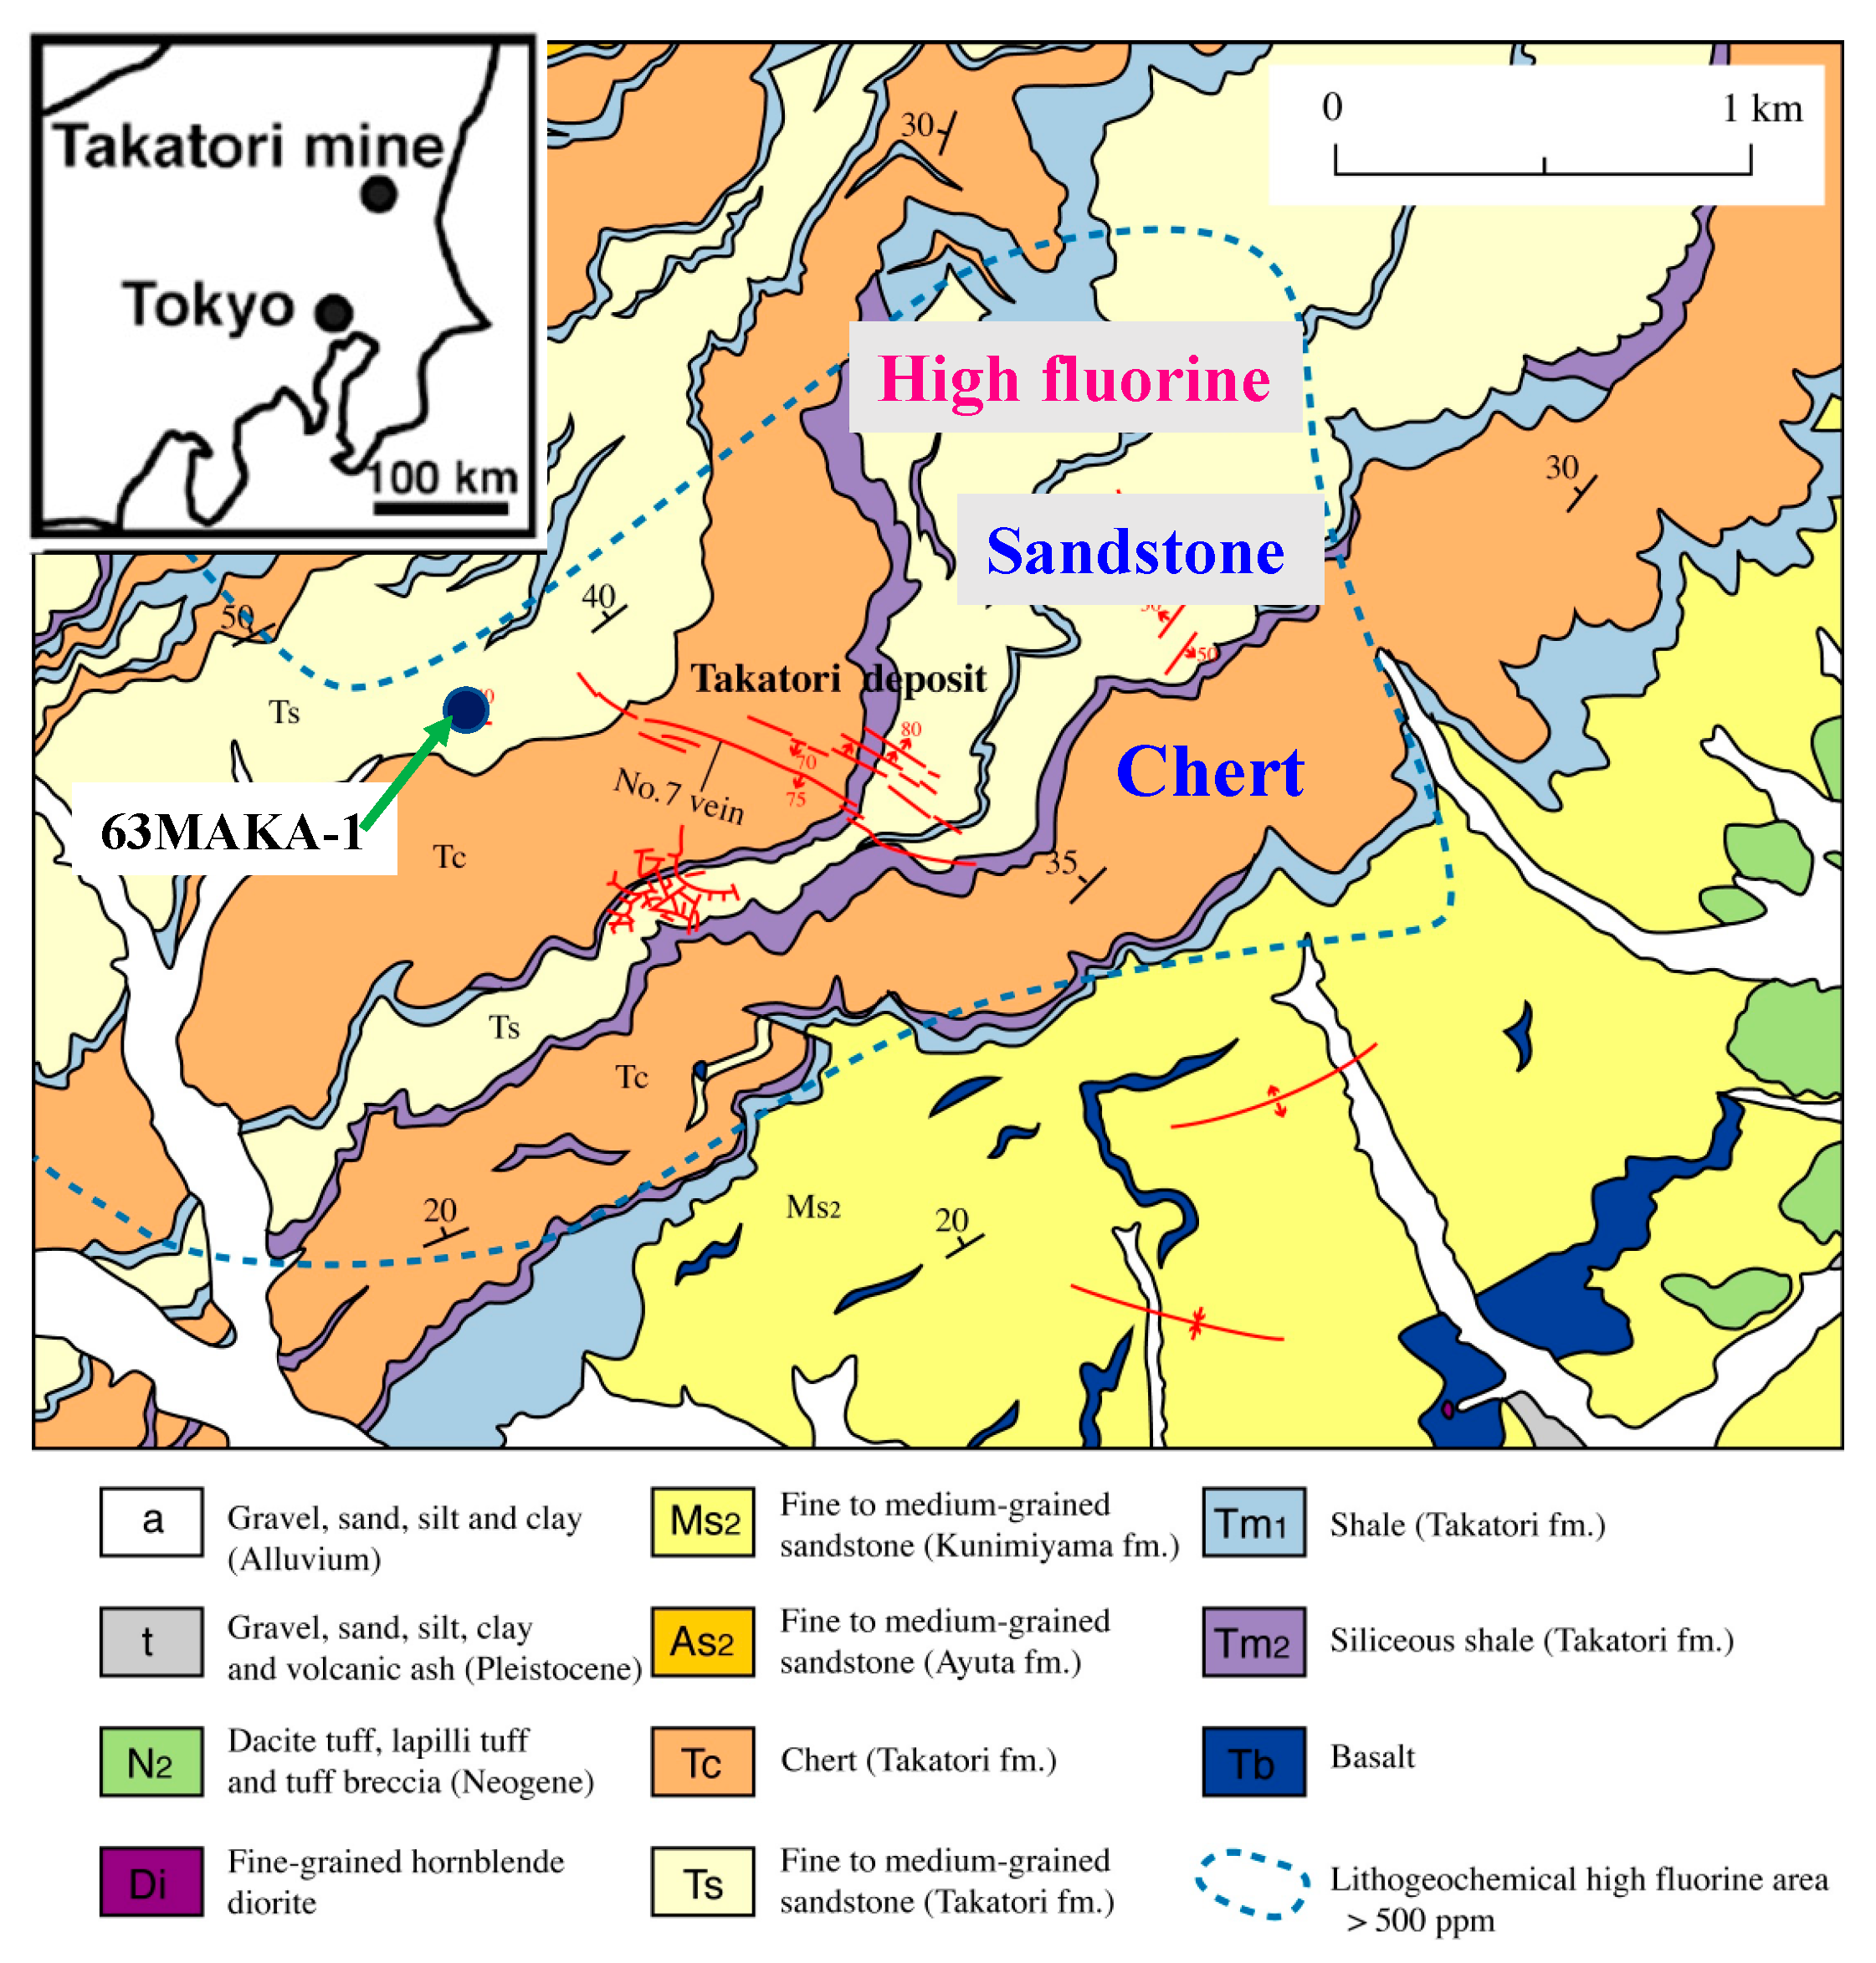
2.1. Geologic Setting

The Takatori mining area is covered by the Jurassic Yamizo group accretionary sedimentary rocks comprising chert, sandstone, and shale (Figure 1). The sedimentary rocks in the Takatori mining area are partly metamorphosed to hornfels facies. The degree of graphitization of carbonaceous compounds in the rocks increases with depth [7], and it is therefore inferred that a granitic stock lies beneath the deposit. Coarse-grained biotite granodiorite is exposed 12 km south of the deposit [8,9]; however, no granitic rocks outcrop in the mining area. Aplitic veins, however, were found in drill hole 63MAKA-1 [10] that is located 350 m west of the No. 7 vein (main vein) of the Takatori deposit (Figure 1). The presence of aplitic veins implies that a granitoid body could be present at depth. The center of a Bouguer low-gravity anomaly is located 2 km southwest of the deposit [6], also suggesting the existence of a latent granitic stock at depth.

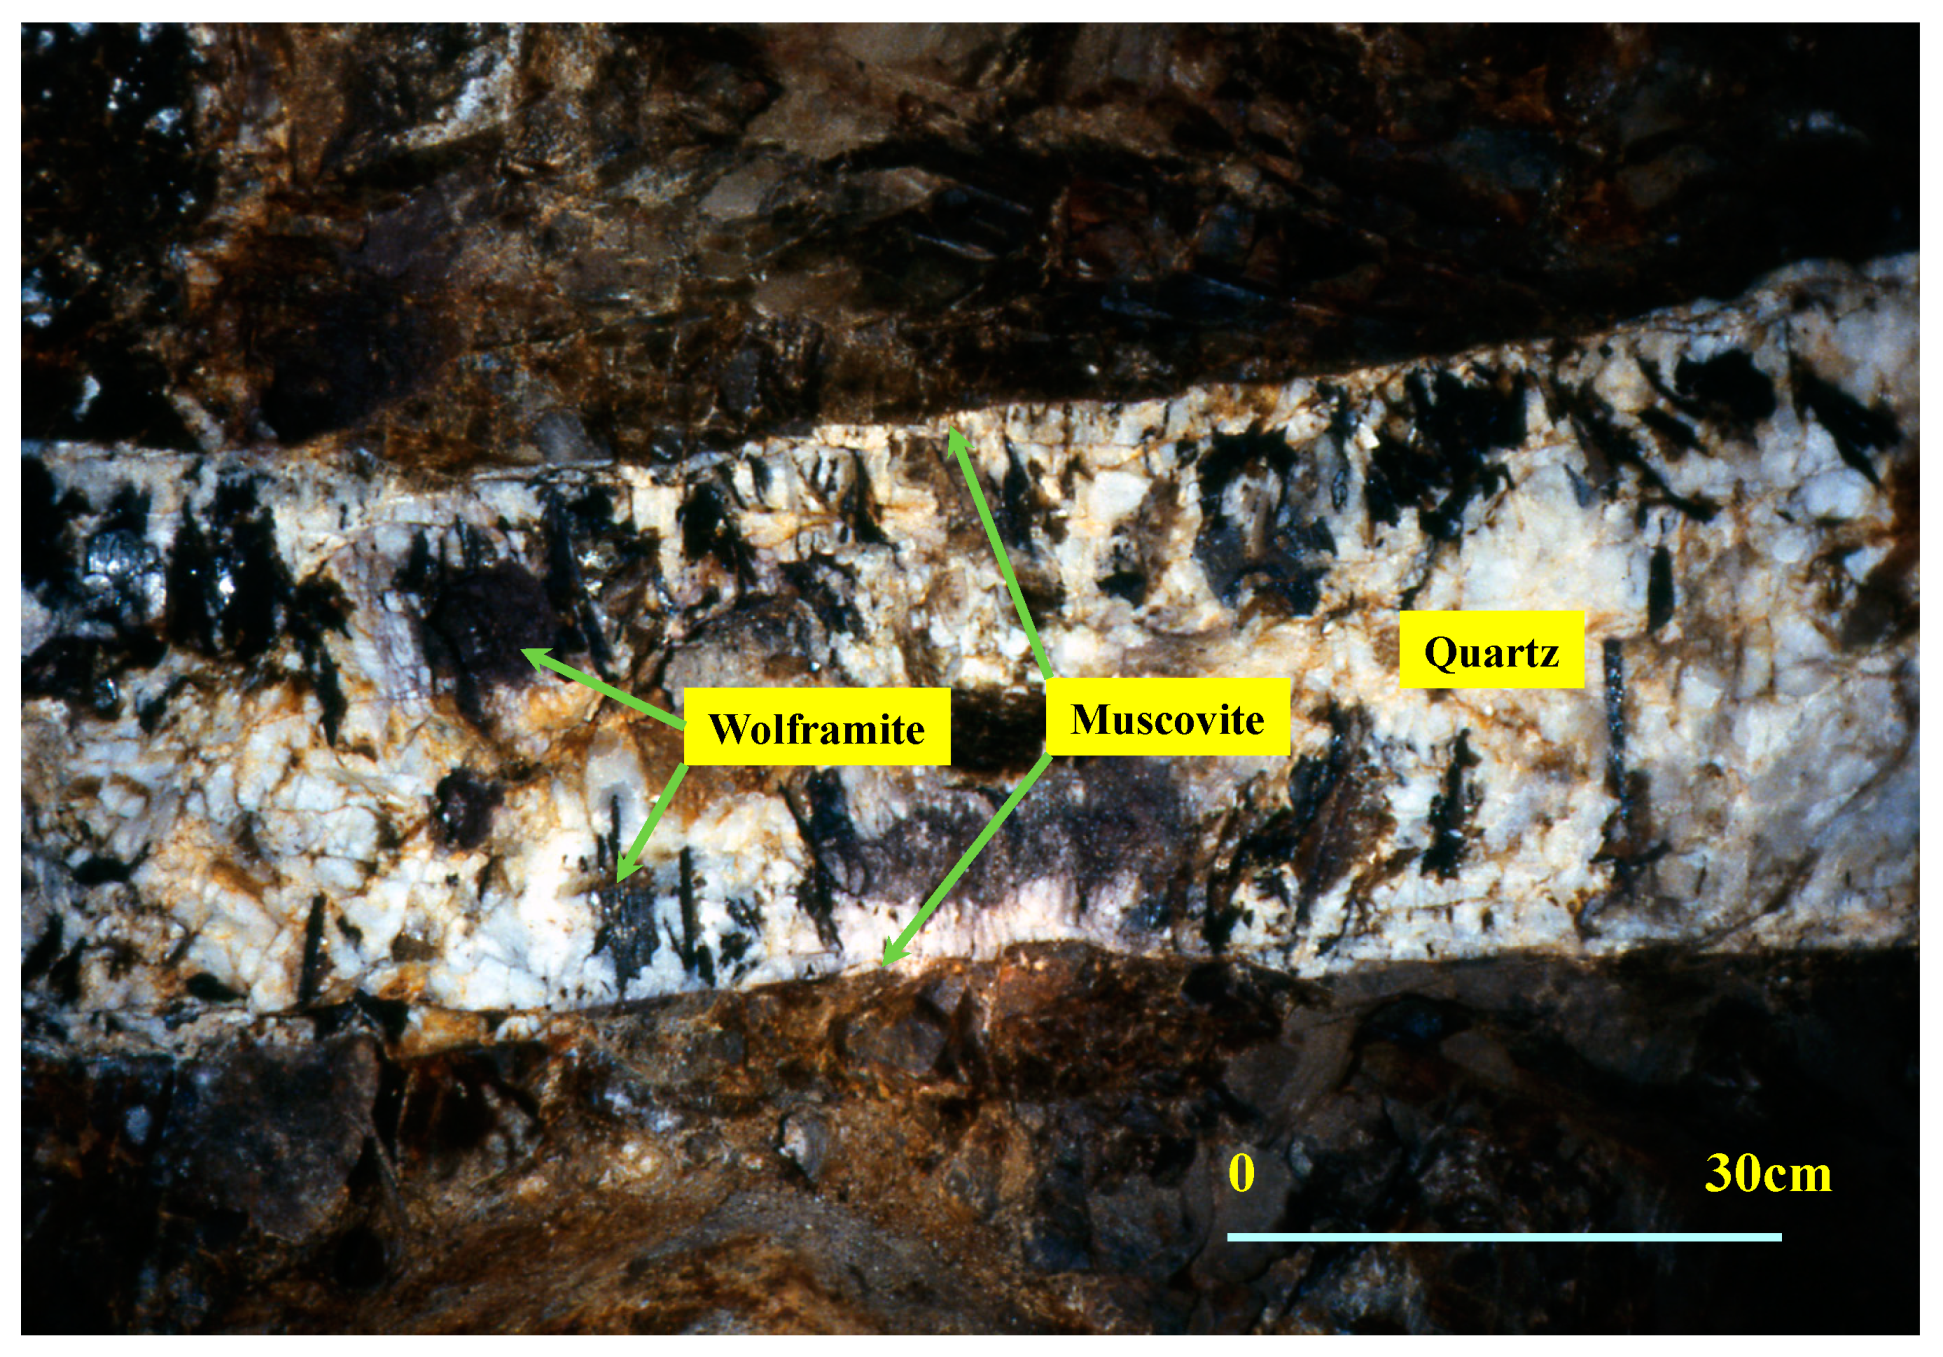
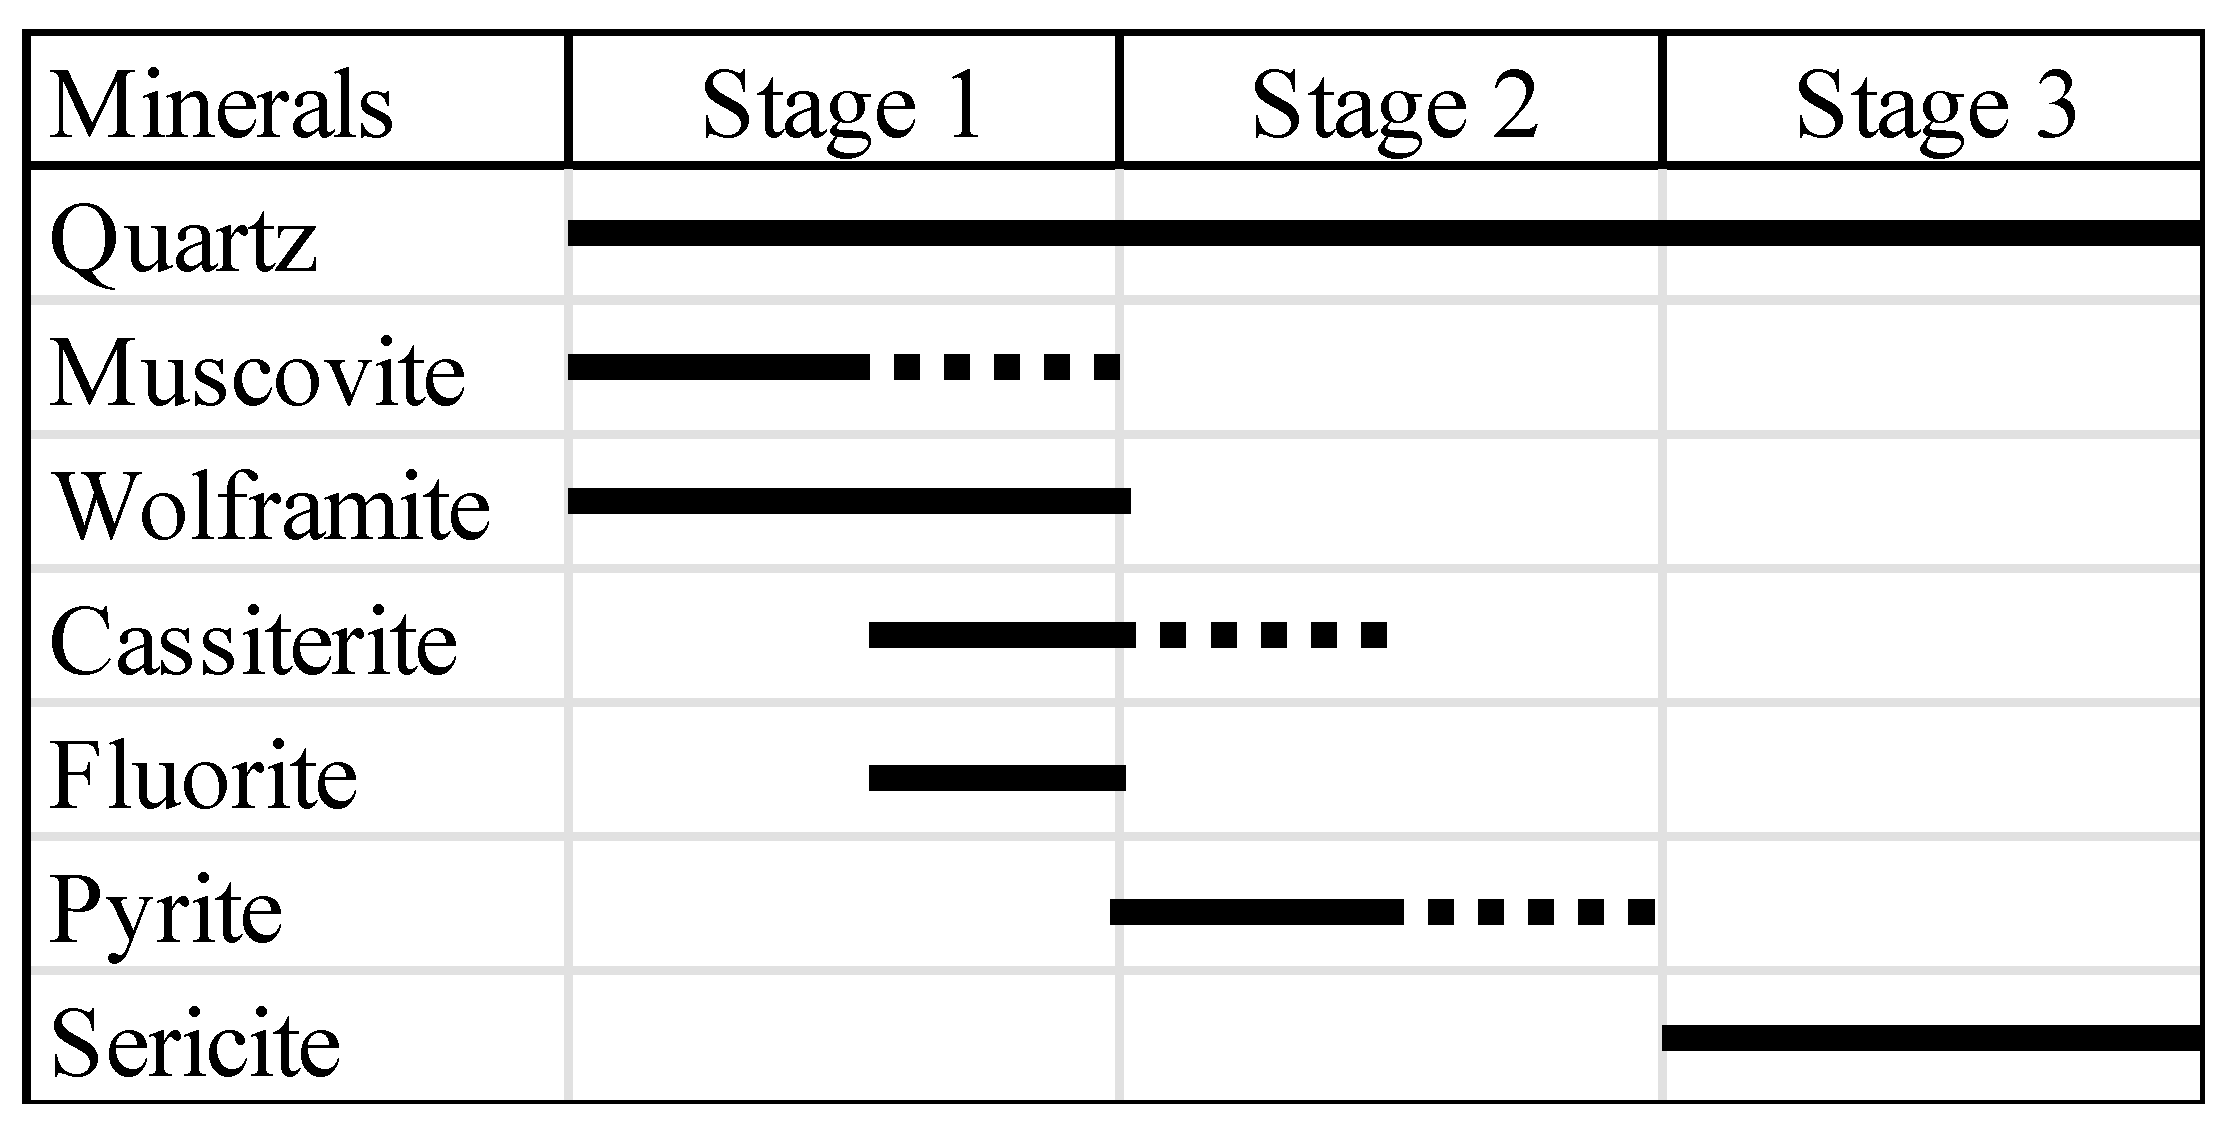
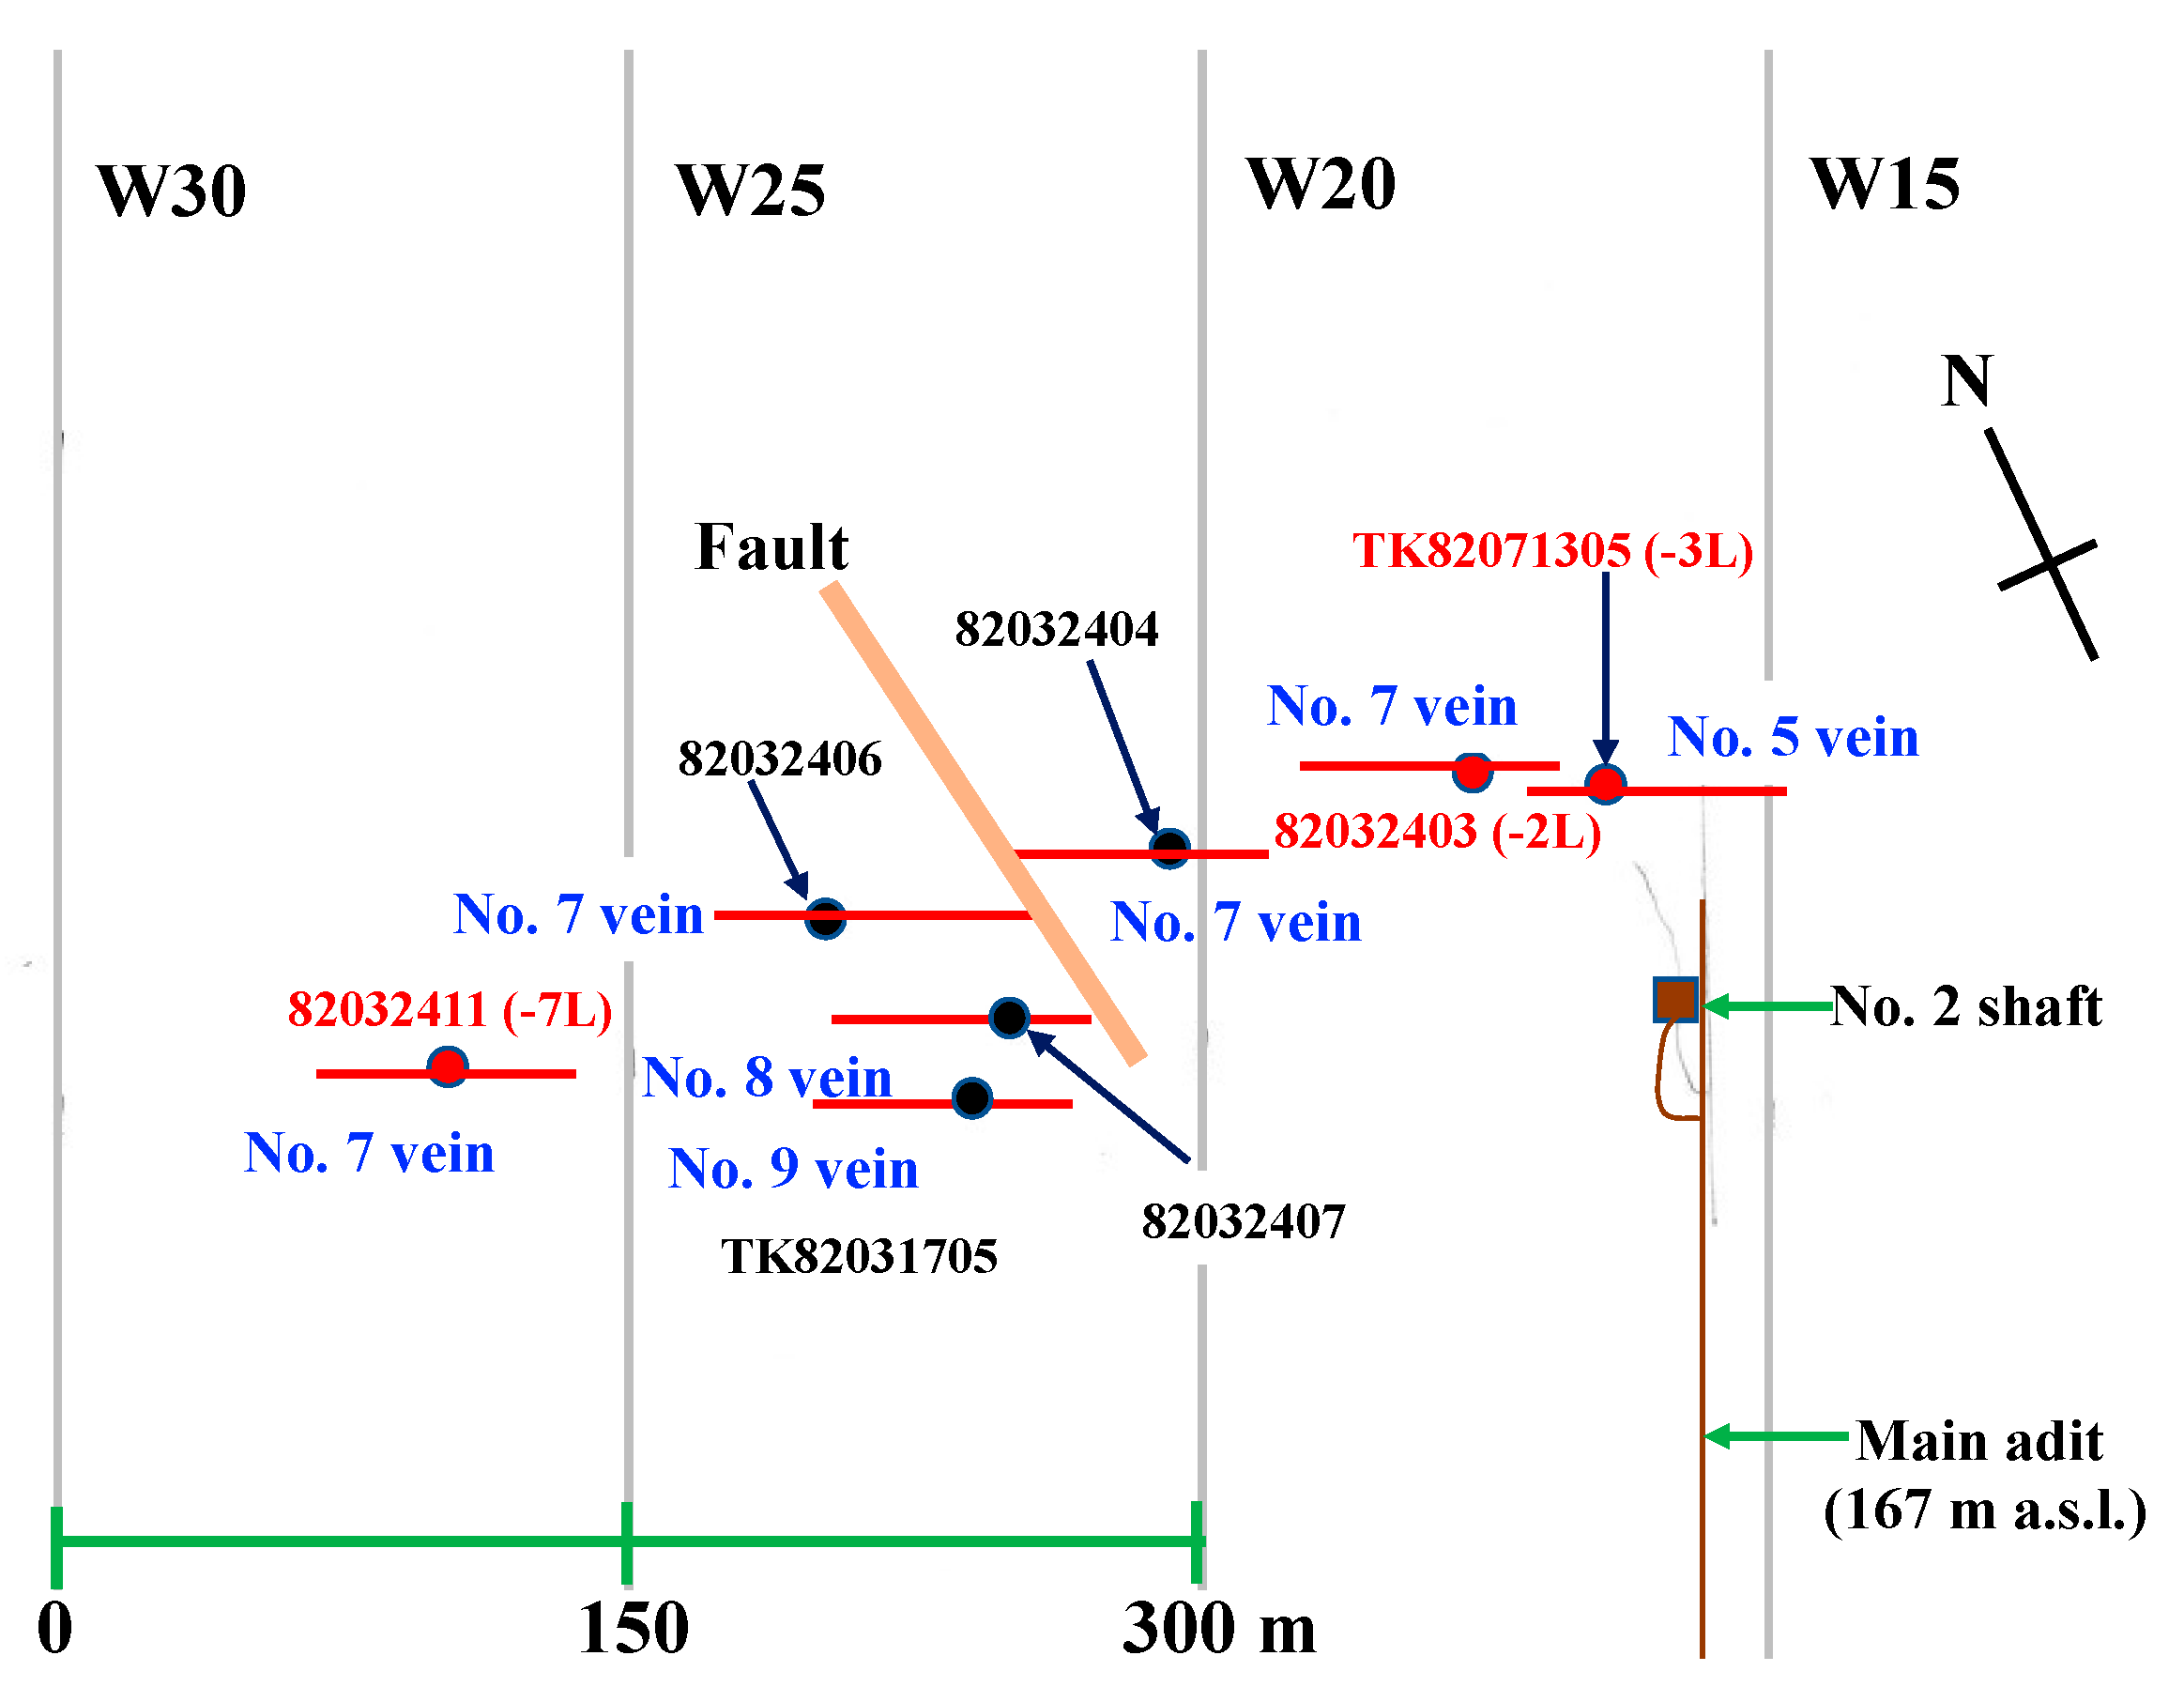
2.2. Takatori Deposit

The Takatori deposit is composed of several veins that extend in a 900 m × 500 m area. The principal veins of the Takatori deposit strike N60° W and dip 75° S. The Takatori veins (e.g., Figure 2) are composed of quartz and wolframite with minor amounts of cassiterite, chalcopyrite, pyrite, and two kinds of potassium mica (one is a coarse-grained lithium-rich muscovite that co-exists with wolframite, and the other is a fine-grained lithium-poor sericite). A K–Ar age of 68.7 ± 2.1 Ma [11] was obtained for the coarse-grained Li-bearing muscovite. A later recalculation of the age using newer decay constants [12] resulted in an age of 70.6 Ma. The rocks in the vicinity of the Takatori veins are intensively contaminated with fluorine (F > 500 ppm; Figure 1), and the fluorine content of the muscovite is high.
Ikeda et al. [8] classified the vein mineralization of the Takatori deposit into three stages based on mineral parageneses. Sakamoto [13] classified the No. 7 vein of the deposit into three stages based on observed crosscutting relationships. Masukawa et al. [14] classified the No. 7 vein into four stages based on a modification of [8]. Quartz, Li-bearing muscovite, and wolframite are the principal minerals in the earliest stage of all the classification schemes. Figure 3 shows the sequence of mineral paragenesis discussed in this paper. The criteria for the classification are based on our field observation and after consideration of Ikeda et al. (1983) and Masukawa et al. (2013).
Wolframite is the main ore mineral. The average tungsten content (as WO3) is 0.5–3%. Wolframite and Li-bearing muscovite together with quartz are abundant in the outer part of the veins (early-stage precipitation), though quartz is ubiquitous in the Takatori veins. The Mn/Fe ratio of the Takatori wolframite is fairly variable [13].

3. Materials and Methods

Samples used in this study were obtained from Takatori veins at levels between −2L (117 m above sea level) and −7L (−33 m below sea level). Table 1 lists the vein numbers and levels of the samples and the description of the mineral paragenesis in the samples. Sample localities are shown on the vein map of the Takatori mine (Figure 4).

3.1. Chemical Analysis

Scanning electron microscope (SEM) observations of sample textures were conducted using a Hitachi S-3400N (Hitachi High-Tech, Tokyo, Japan) with energy-dispersive X-ray spectroscopy (EDS) for qualitative Mn and Fe elemental mapping. Mn and Fe analyses of wolframite were performed using a JEOL JXA-8900R (JEOL Ltd., Akishima, Tokyo, Japan) electron probe microanalyzer (EPMA) at Shizuoka University. The operating conditions were 20 kV accelerating voltage and 12 nA intensity, with 5 μm probe diameter.

3.2. Lithium Isotope Analysis

Chemical compositions of muscovite are shown in Table 2. Li was extracted from three Li-bearing muscovites and two sericite samples, and Li isotope ratios (7Li/6Li) were measured using multi-collector inductively coupled plasma mass spectrometry (Neptune). The analytical procedures used in this work are documented in [15]. The measured 7Li/6Li ratios are expressed as per mill deviations (δ7Li) from the NIST L-SVEC (SRM-8545) standard [16]. The analytical δ7Li uncertainty was ±0.3‰ (2σ).

3.3. Oxygen Isotope Analysis

Quartz, muscovite, wolframite, and cassiterite grains were handpicked under the binocular microscope from samples crushed to 1 mm in diameter, and they were analyzed to determine their oxygen isotope ratios by extracting oxygen with BrF5 at 550 °C for 12 h. The extracted oxygen was then converted into carbon dioxide by passage over graphite heated to 700 °C [17]. Oxygen isotope analyses were performed on a Finnigan MAT 251 mass spectrometer at the Geological Survey of Japan. Oxygen isotope ratios are reported in standard δ notation in per mill (‰) relative to Vienna standard mean ocean water (V-SMOW). The total analytical error of the preparation and measurement is ±0.1‰ (2σ) for δ18O values.
Experimentally determined calibration curves of oxygen isotope fractionations for mineral pairs are taken from previously published papers. The quartz–muscovite curve is based on a combination of laboratory experiments ([18] for quartz and [19] for muscovite). Quartz–wolframite and quartz–cassiterite curves are constructed by combining separate experiments [20,21].

4. Results

4.1. Chemical Analysis

Figure 5a shows a photomicrograph of a wolframite-bearing quartz vein with pyrite and fluorite. Figure 5b,c show wolframite Mn and Fe elemental mappings by SEM-EDS. The wolframite rims show Mn enrichment and Fe depletion.
Quantitative analyses of a wolframite grain (82032404, Table 1) from the No. 7 vein at −4L (57 m above sea level, Figure 4) for Mn and Fe by EPMA are shown in Table 3 and Figure 6. The MnO/(MnO + FeO) ratio ranges from 42 to 65 mol%. The ratio in the center of the wolframite grain is around 43 mol%, while it increases to 65 mol% at the rims (Figure 6). Wolframite grains without replacement textures also exist. An example of a wolframite grain (82032411, Table 1) from the No. 7 vein at −7L (−33 m below sea level, Figure 4) has a MnO/(MnO + FeO) ratio of 43 mol%, and no Mn enrichment is found in the rim.

4.2. Lithium Isotope Analysis

Table 4 lists the δ7Li values of Li-bearing mica samples and their Li concentrations. Three of the five samples have high Li concentrations and are designated as Li-bearing muscovite. The δ7Li values of whole micas from the Takatori deposit (No. 5, No. 7, No. 8, and No.9 veins at elevations between −33 and 117 m, Table 1; Figure 4) range from −3.1‰ to +2.1‰. The δ7Li values of Li-rich muscovites range from −3.1‰ to −2.1‰, and δ7Li values of Li-poor sericites range from −0.6‰ to +2.1‰, which are relatively higher than those of muscovites.

4.3. Oxygen Isotope Analysis

Oxygen isotope ratios were measured on coexisting quartz–muscovite, quartz–wolframite, and quartz–cassiterite mineral pairs from the Takatori deposit (Table 5). The δ18O values of quartz are about +13‰, and those of muscovite are around +10‰. Wolframite and cassiterite have low δ18O values, ranging from +5‰ to +6‰ (Table 5). The δ18O value of fine-grained sericite (82032403, Table 1; Figure 4) is +5.4‰ (not in Table 5).
Table 5 shows the oxygen isotope equilibrium temperature for each mineral pair using a corresponding calibration curve, on the assumption that we take only equilibrium pairs in calculating equilibrium temperatures. The muscovite (Figure 2), wolframite (Figure 2 and Figure 5a), and cassiterite (Figure 7) samples analyzed in this study exhibit intricate intergrowths with quartz. A temperature of 140°C is calculated for the quartz–sericite pair, but the sericite in the 82032403 sample might not be equilibrated with quartz according to its occurrence (later stage monomineralic lump). The monomineralic sericite might have precipitated later than muscovite [8,13,14]. Therefore, the temperature of 140 °C is not an equilibrium temperature.

5. Discussion

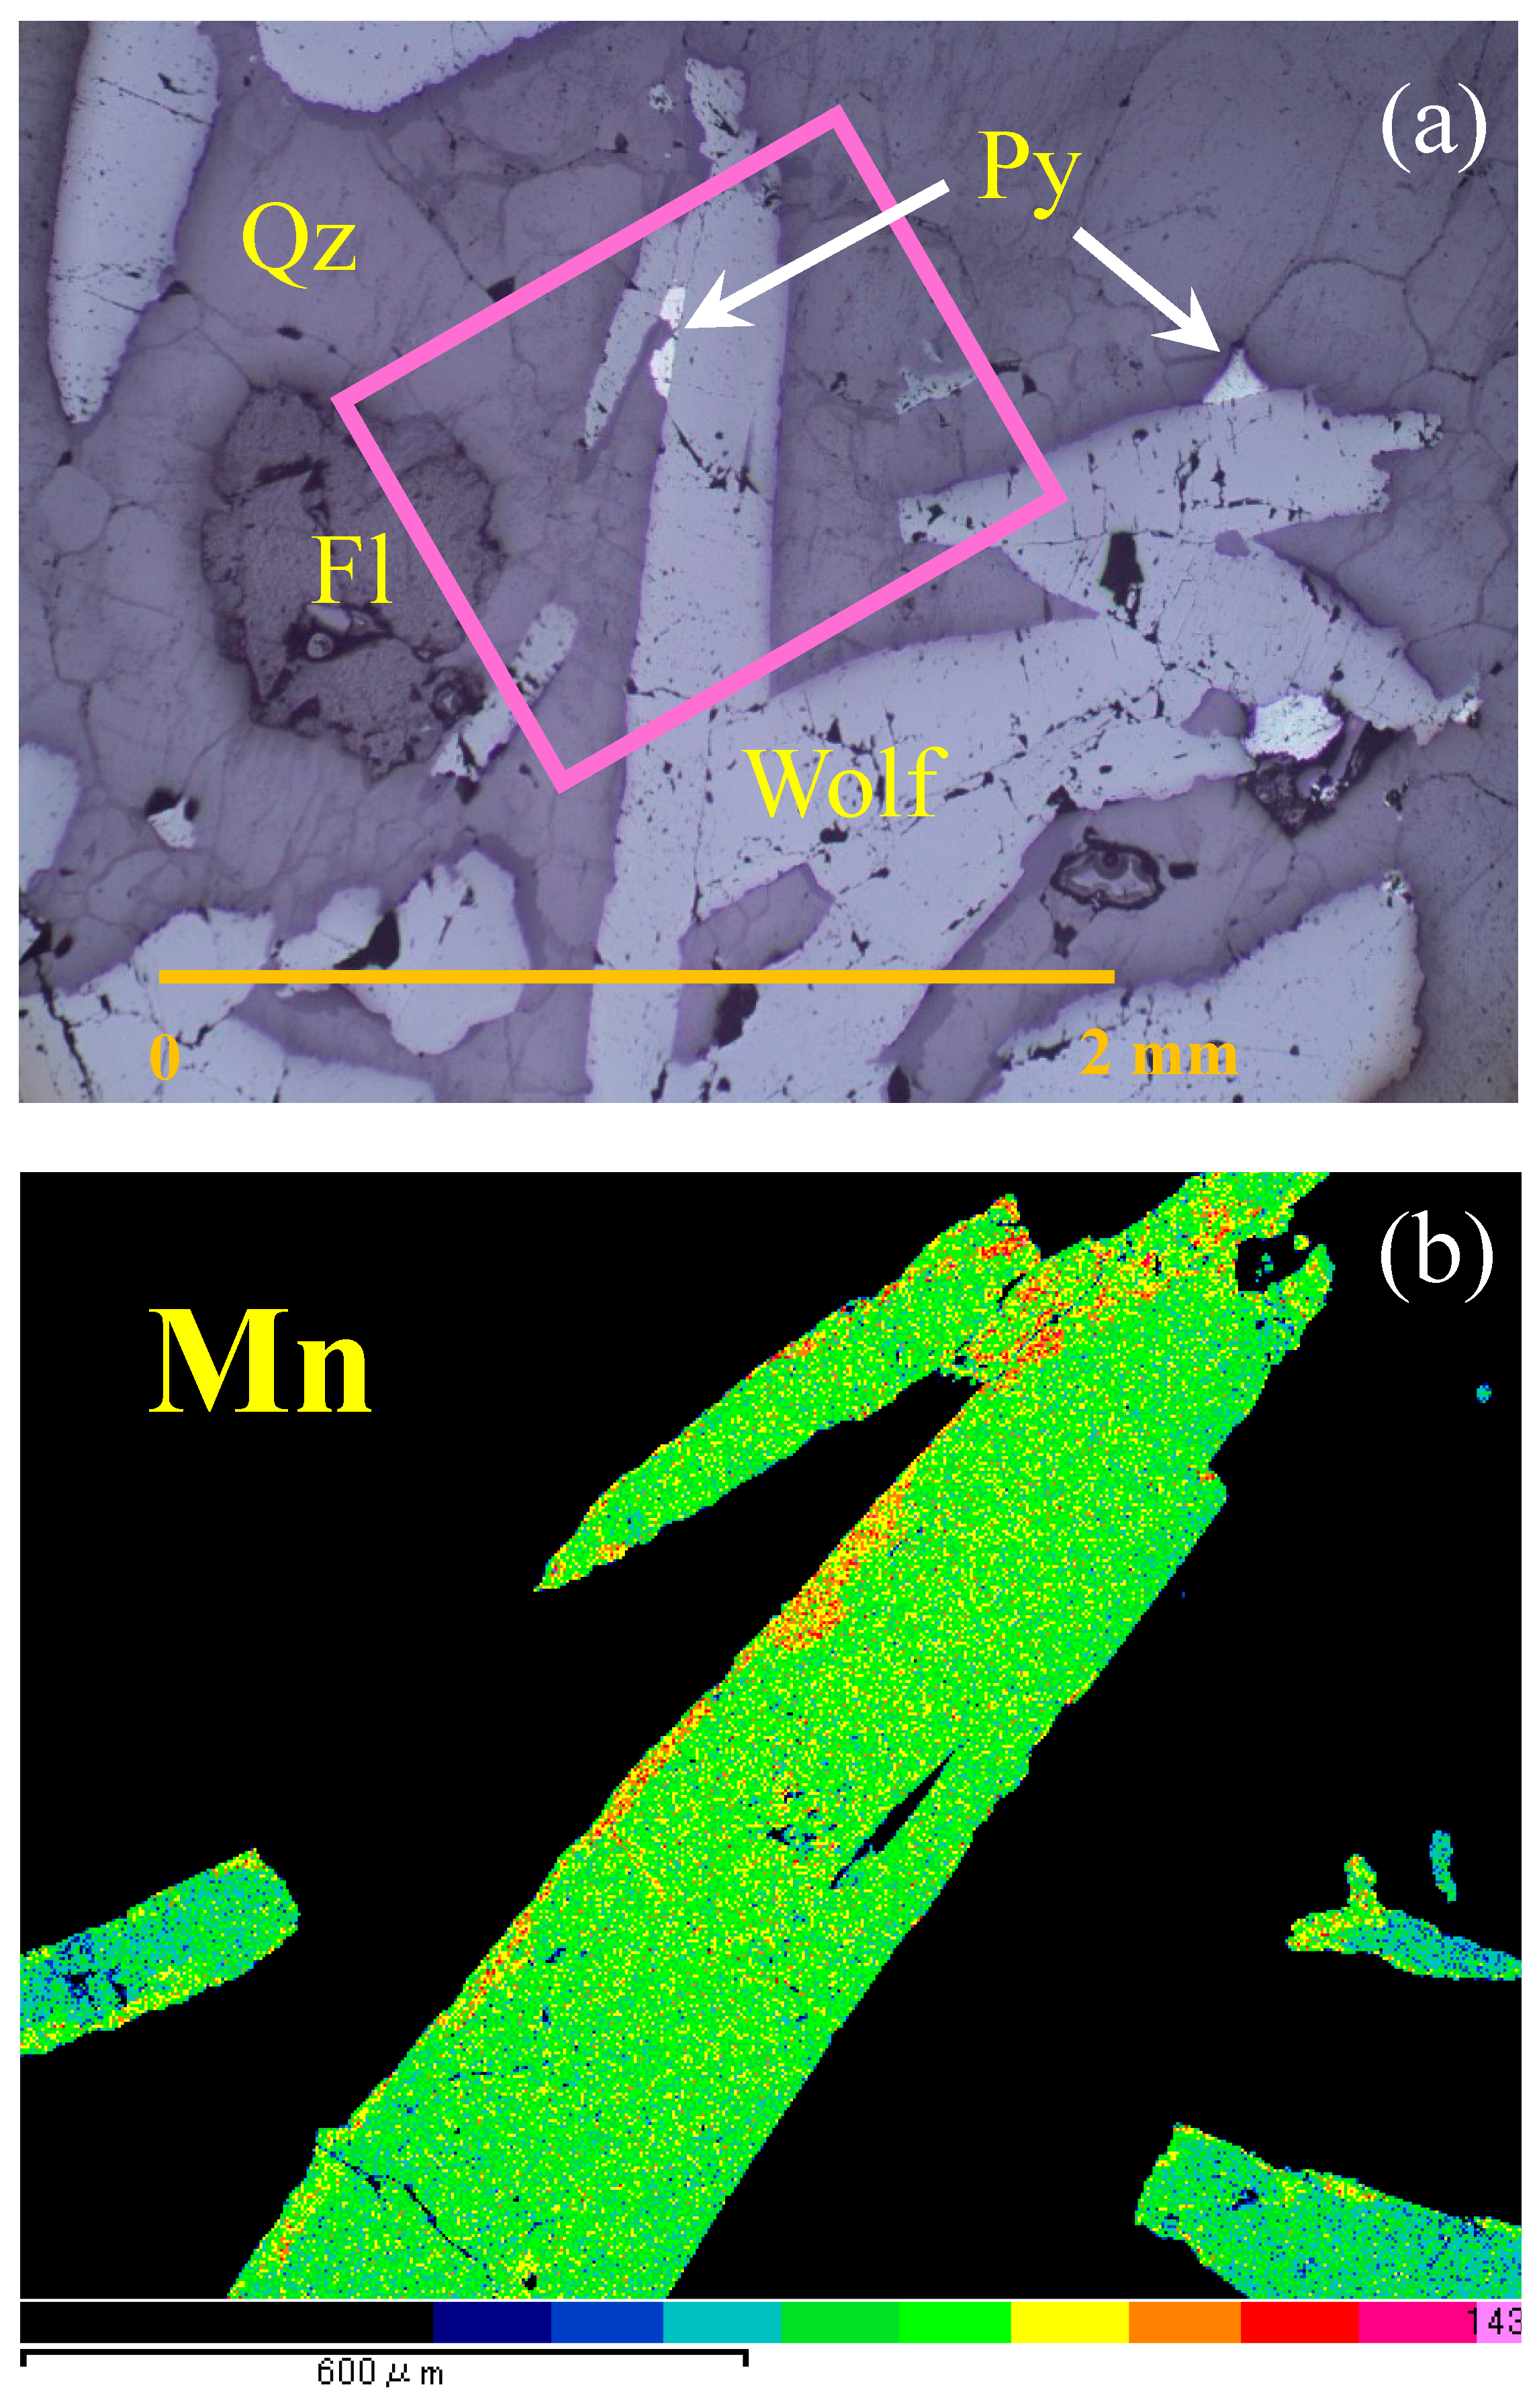
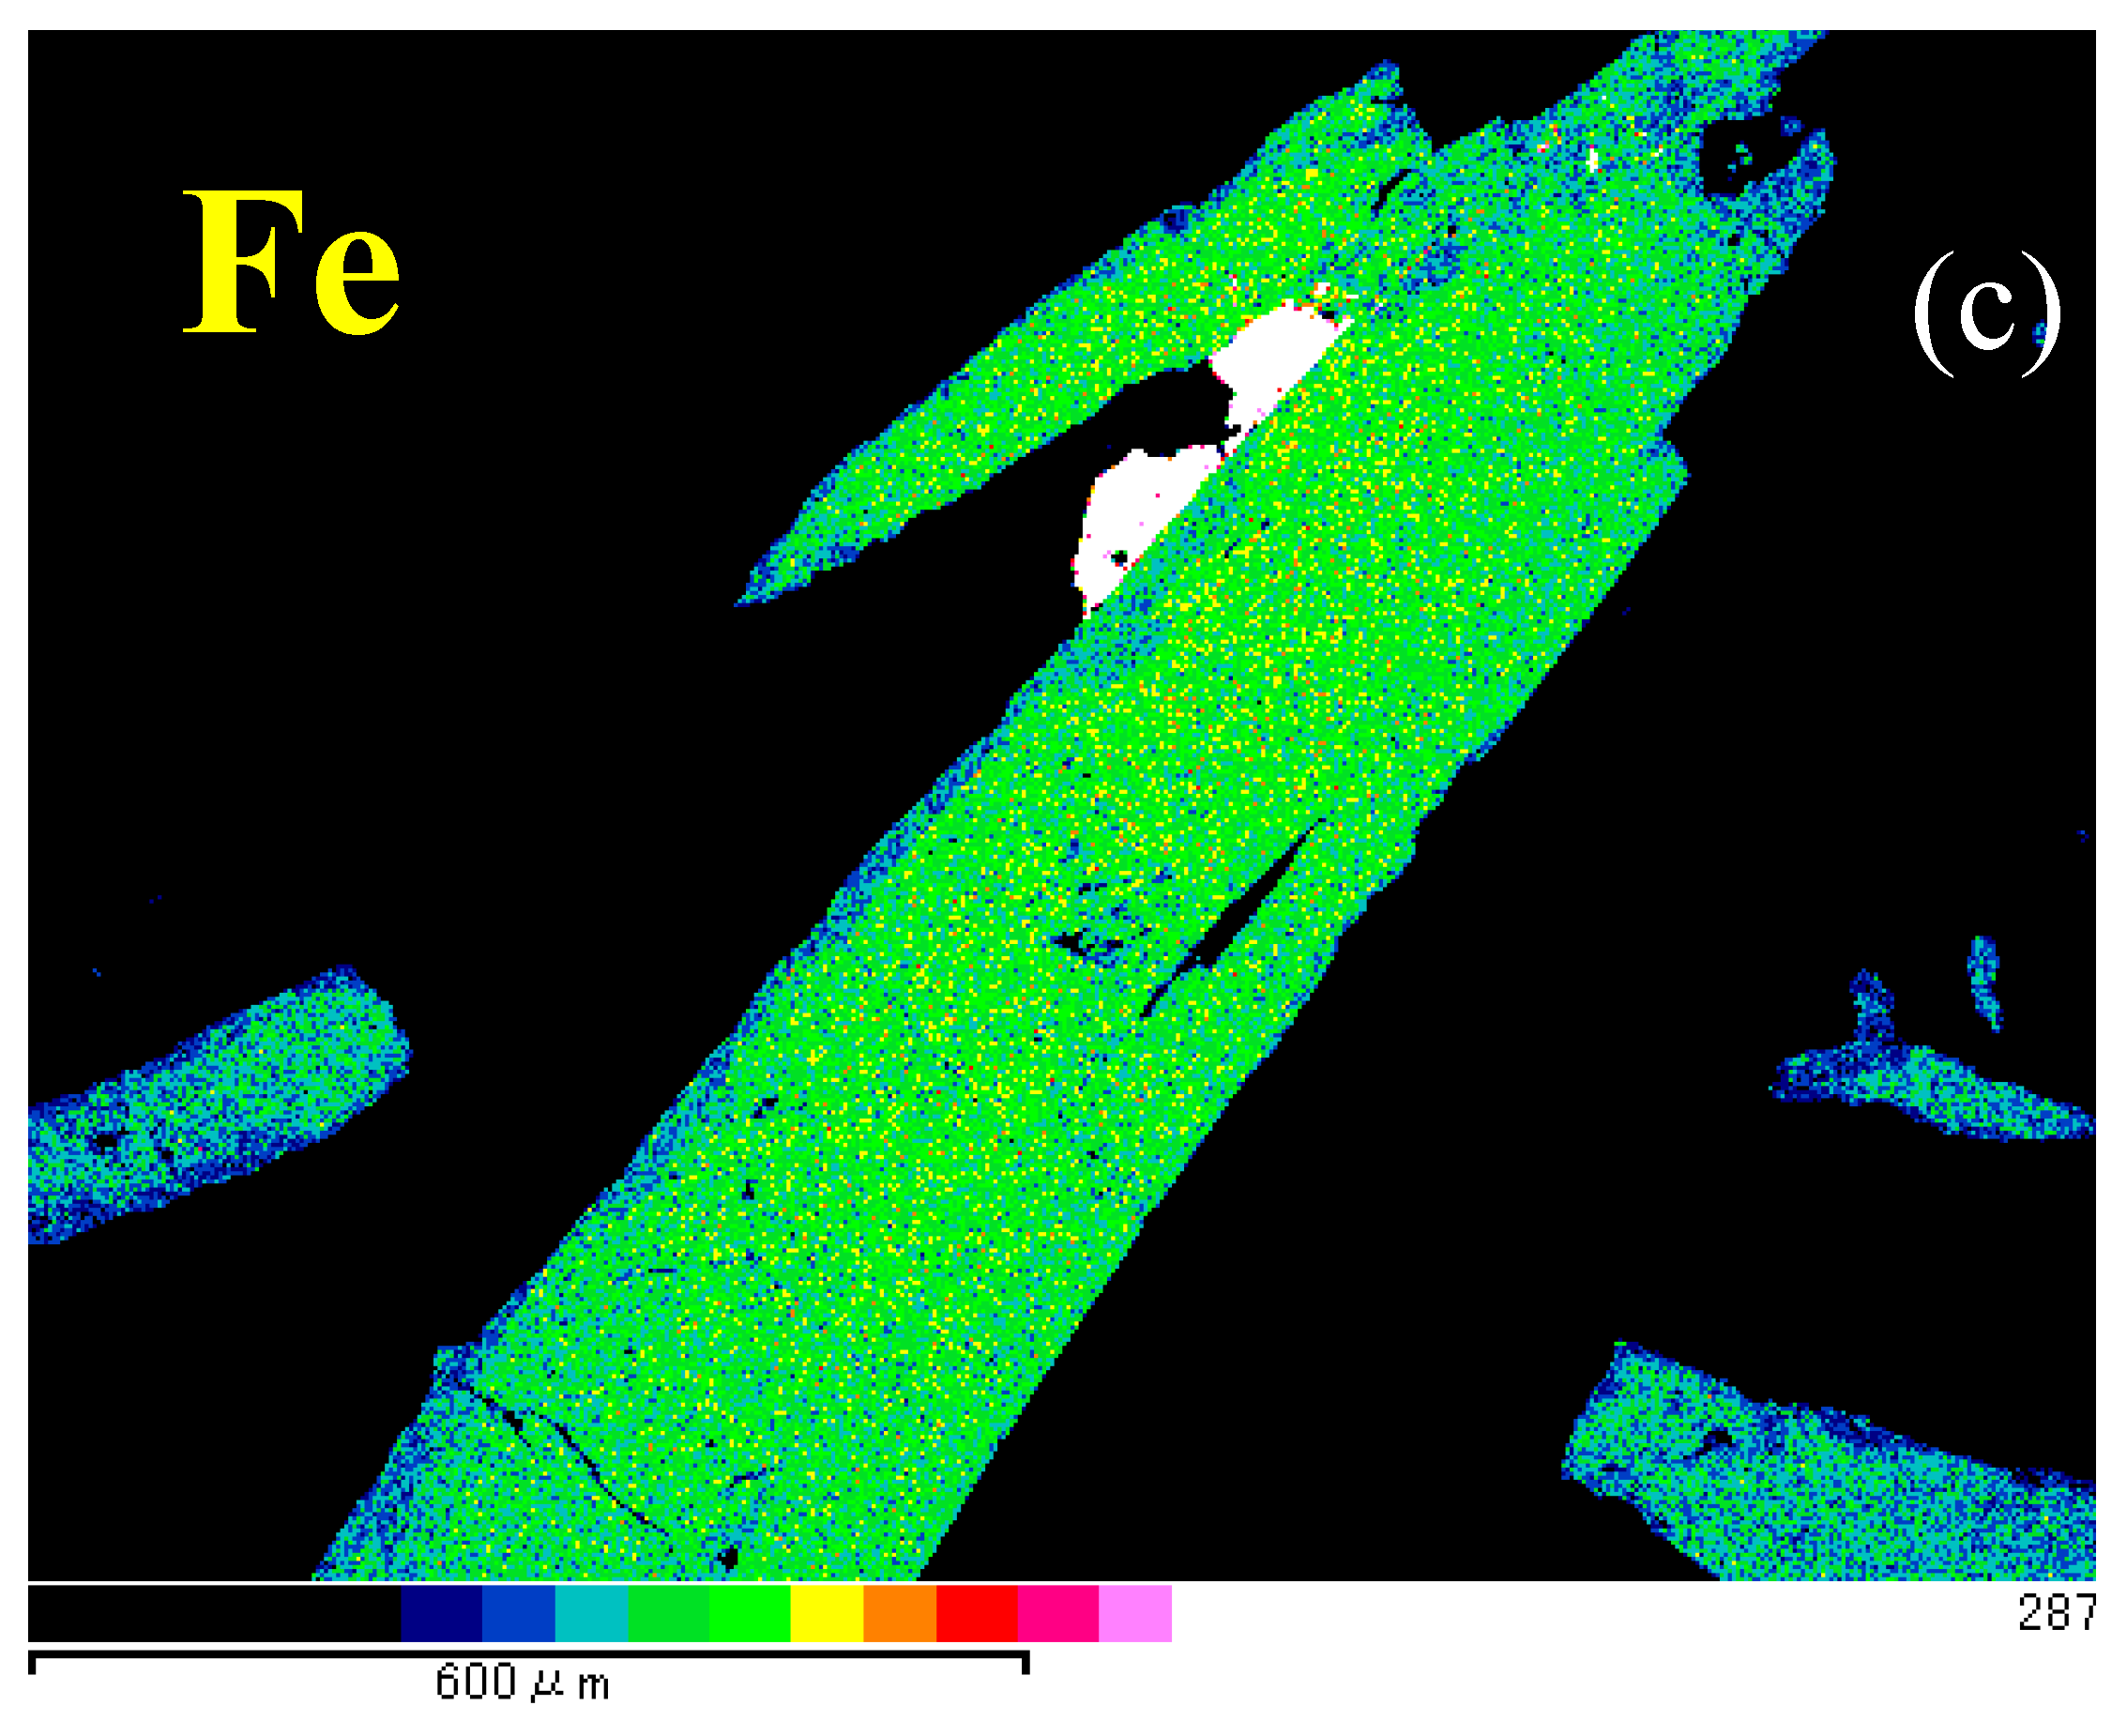
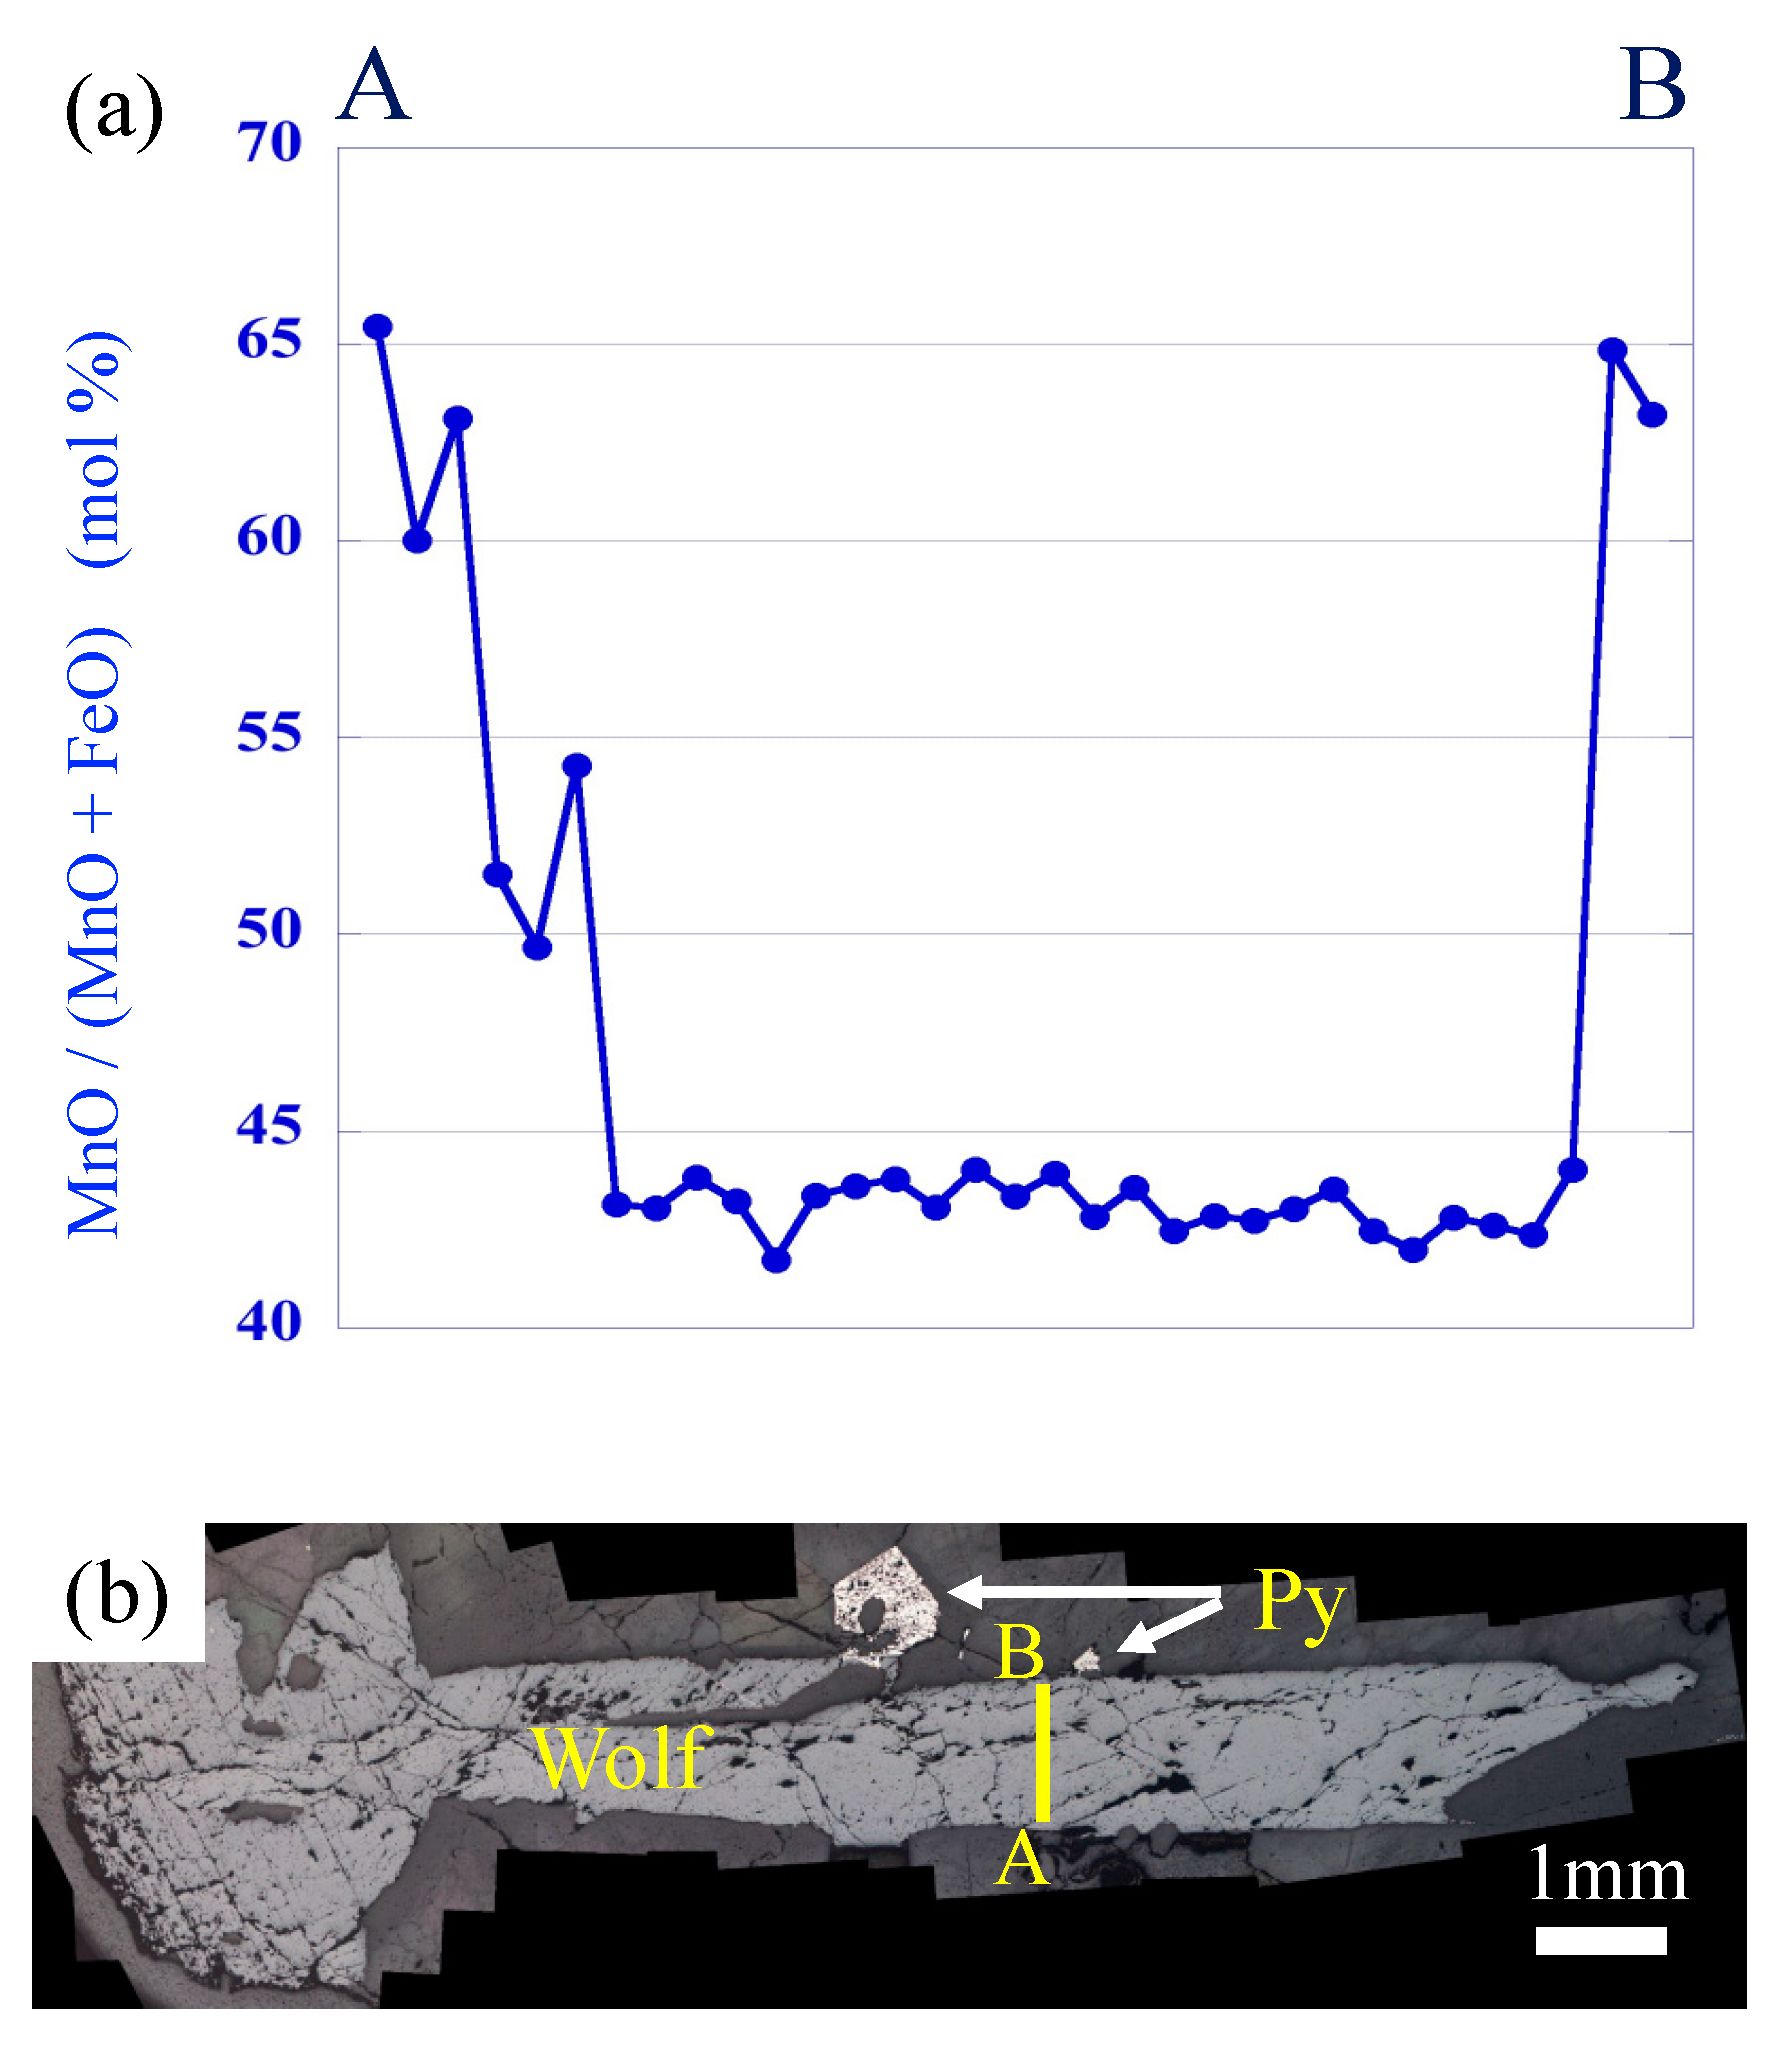
5.1. Replacement Textures in Wolframite

Rims of several wolframite grains in the Takatori quartz veins show replacement textures with Mn and Fe (Figure 5). Mn is enriched in the wolframite rim, which is evident in the chemical composition of (Fe, Mn)WO4, with accompanying Fe depletion. Quantitative EPMA analyses clearly show the chemical replacement texture by the MnO/(MnO + FeO) ratio in wolframite (Table 3; Figure 6). The ratio in the center of wolframite was fairly stable around 43 mol%, which is inferred to be an original value. The ratio increased up to 65 mol% on the wolframite rim with coexisting pyrite. This texture is assumed to form by iron replacement with manganese postdating the wolframite precipitation.
Wolframite was formed in the earliest stage, whereas pyrite was precipitated later [8,13,14]. The fluid inclusion homogenization temperature in the later stage is around 250 °C [22]. Then, we examined mineral stabilities on oxygen fugacity–pH diagrams for the system Fe–W–O–H–S at 250 °C [23]. There is a pyrite stability region between the two ferberite (FeWO4) regions at 250 °C [23] (p. 128). The pyrite stability region disappears above 300 °C under ∑S = 10−3 or is very small under ∑S = 10−2 [23] (p. 128). Conversely, Mn-wolframite (MnWO4; huebnerite) is stable from 250 °C to 300 °C [23] (p. 128). When wolframite forms at temperatures above 300 °C, pyrite might not precipitate from the fluid. After a low-temperature fluid is incorporated into the hydrothermal system, pyrite might be stable in the later stage. The gradual enrichment of fluids in Fe and S species during temperature decrease is possible, but Fe contents in the fluid were proved to be very low after Stage 1 [24].
We have to consider the possibility of wolframite precipitation in a later stage, but previous papers in addition to this study (Figure 3) described wolframite formation exclusively at the earliest stage of Takatori mineralization. Wolframite occurred in Stage 1 (Figure 3). Hayashi [24] performed quantitative analyses of tungsten content in a single fluid inclusion from the Takatori veins by synchrotron radiation X-ray fluorescence analysis (SXRF). He confirmed that tungsten concentration was high in the earliest stage (Stage I) of the Takatori fluid and drastically decreased at the beginning of Stage II. The tungsten concentration was less than the detection limit in subsequent stages (Stage II to Stage IV). This suggests that wolframite precipitation in a later stage of mineralization would not be possible; however, the replacement of Fe with Mn in wolframite in a later stage was plausible.
Therefore, it is inferred that Fe in Fe-rich wolframite that formed in the earliest stage could be replaced by Mn, and the released Fe2+ is associated with pyrite (FeS2) in a later stage at lower temperatures (~250 °C). The coexistence of pyrite with altered wolframite rims (Figure 5) is commonly observed and might be proof of the replacement reaction. Such replacement textures are not present in wolframite grain (82032411, Section 4.1), suggesting that the alteration occurred locally [13].

5.2. Li Isotopes of Li-Bearing Mica Samples

Masukawa et al. [14] measured δ7Li values of quartz fluid inclusions from the No. 7 vein of the Takatori deposit. The δ7Li values of the fluid were between −2.6‰ and +7.9‰. They divided the Takatori mineralization into four stages at the No. 7 vein. The early wolframite–topaz–fluorite–muscovite stage was designated as Stage I, and the δ7Li values ranged from −2.6‰ to +1.2‰. These values are consistent with those of S-type granites [14]. The δ7Li values increased in later stages of mineralization [14].
The δ7Li values of Li-rich muscovite (Stage 1 in Figure 3) from the Takatori deposit range from −3.1‰ to −2.1‰ (Table 4), which correspond to Stage I of Masukawa et al. [14]. Wunder et al. [25] determined the Li isotope fractionation between Li-mica and fluid at 2.0 GPa and between 300 °C and 500 °C. Δ7Limica-fluid is −2.00‰ at 400 °C. The δ7Li value of the Takatori fluid was about −1‰ to 0‰ when the fluid temperature was assumed to be around 400 °C [26]. Two sericites with relatively higher δ7Li values of −0.6‰ and +2.1‰ have lower lithium concentrations of 0.045 and 0.020 wt.%, respectively (Table 4). Sericites with higher δ7Li values and lower Li concentrations might have precipitated in Stage 3 (Figure 3).

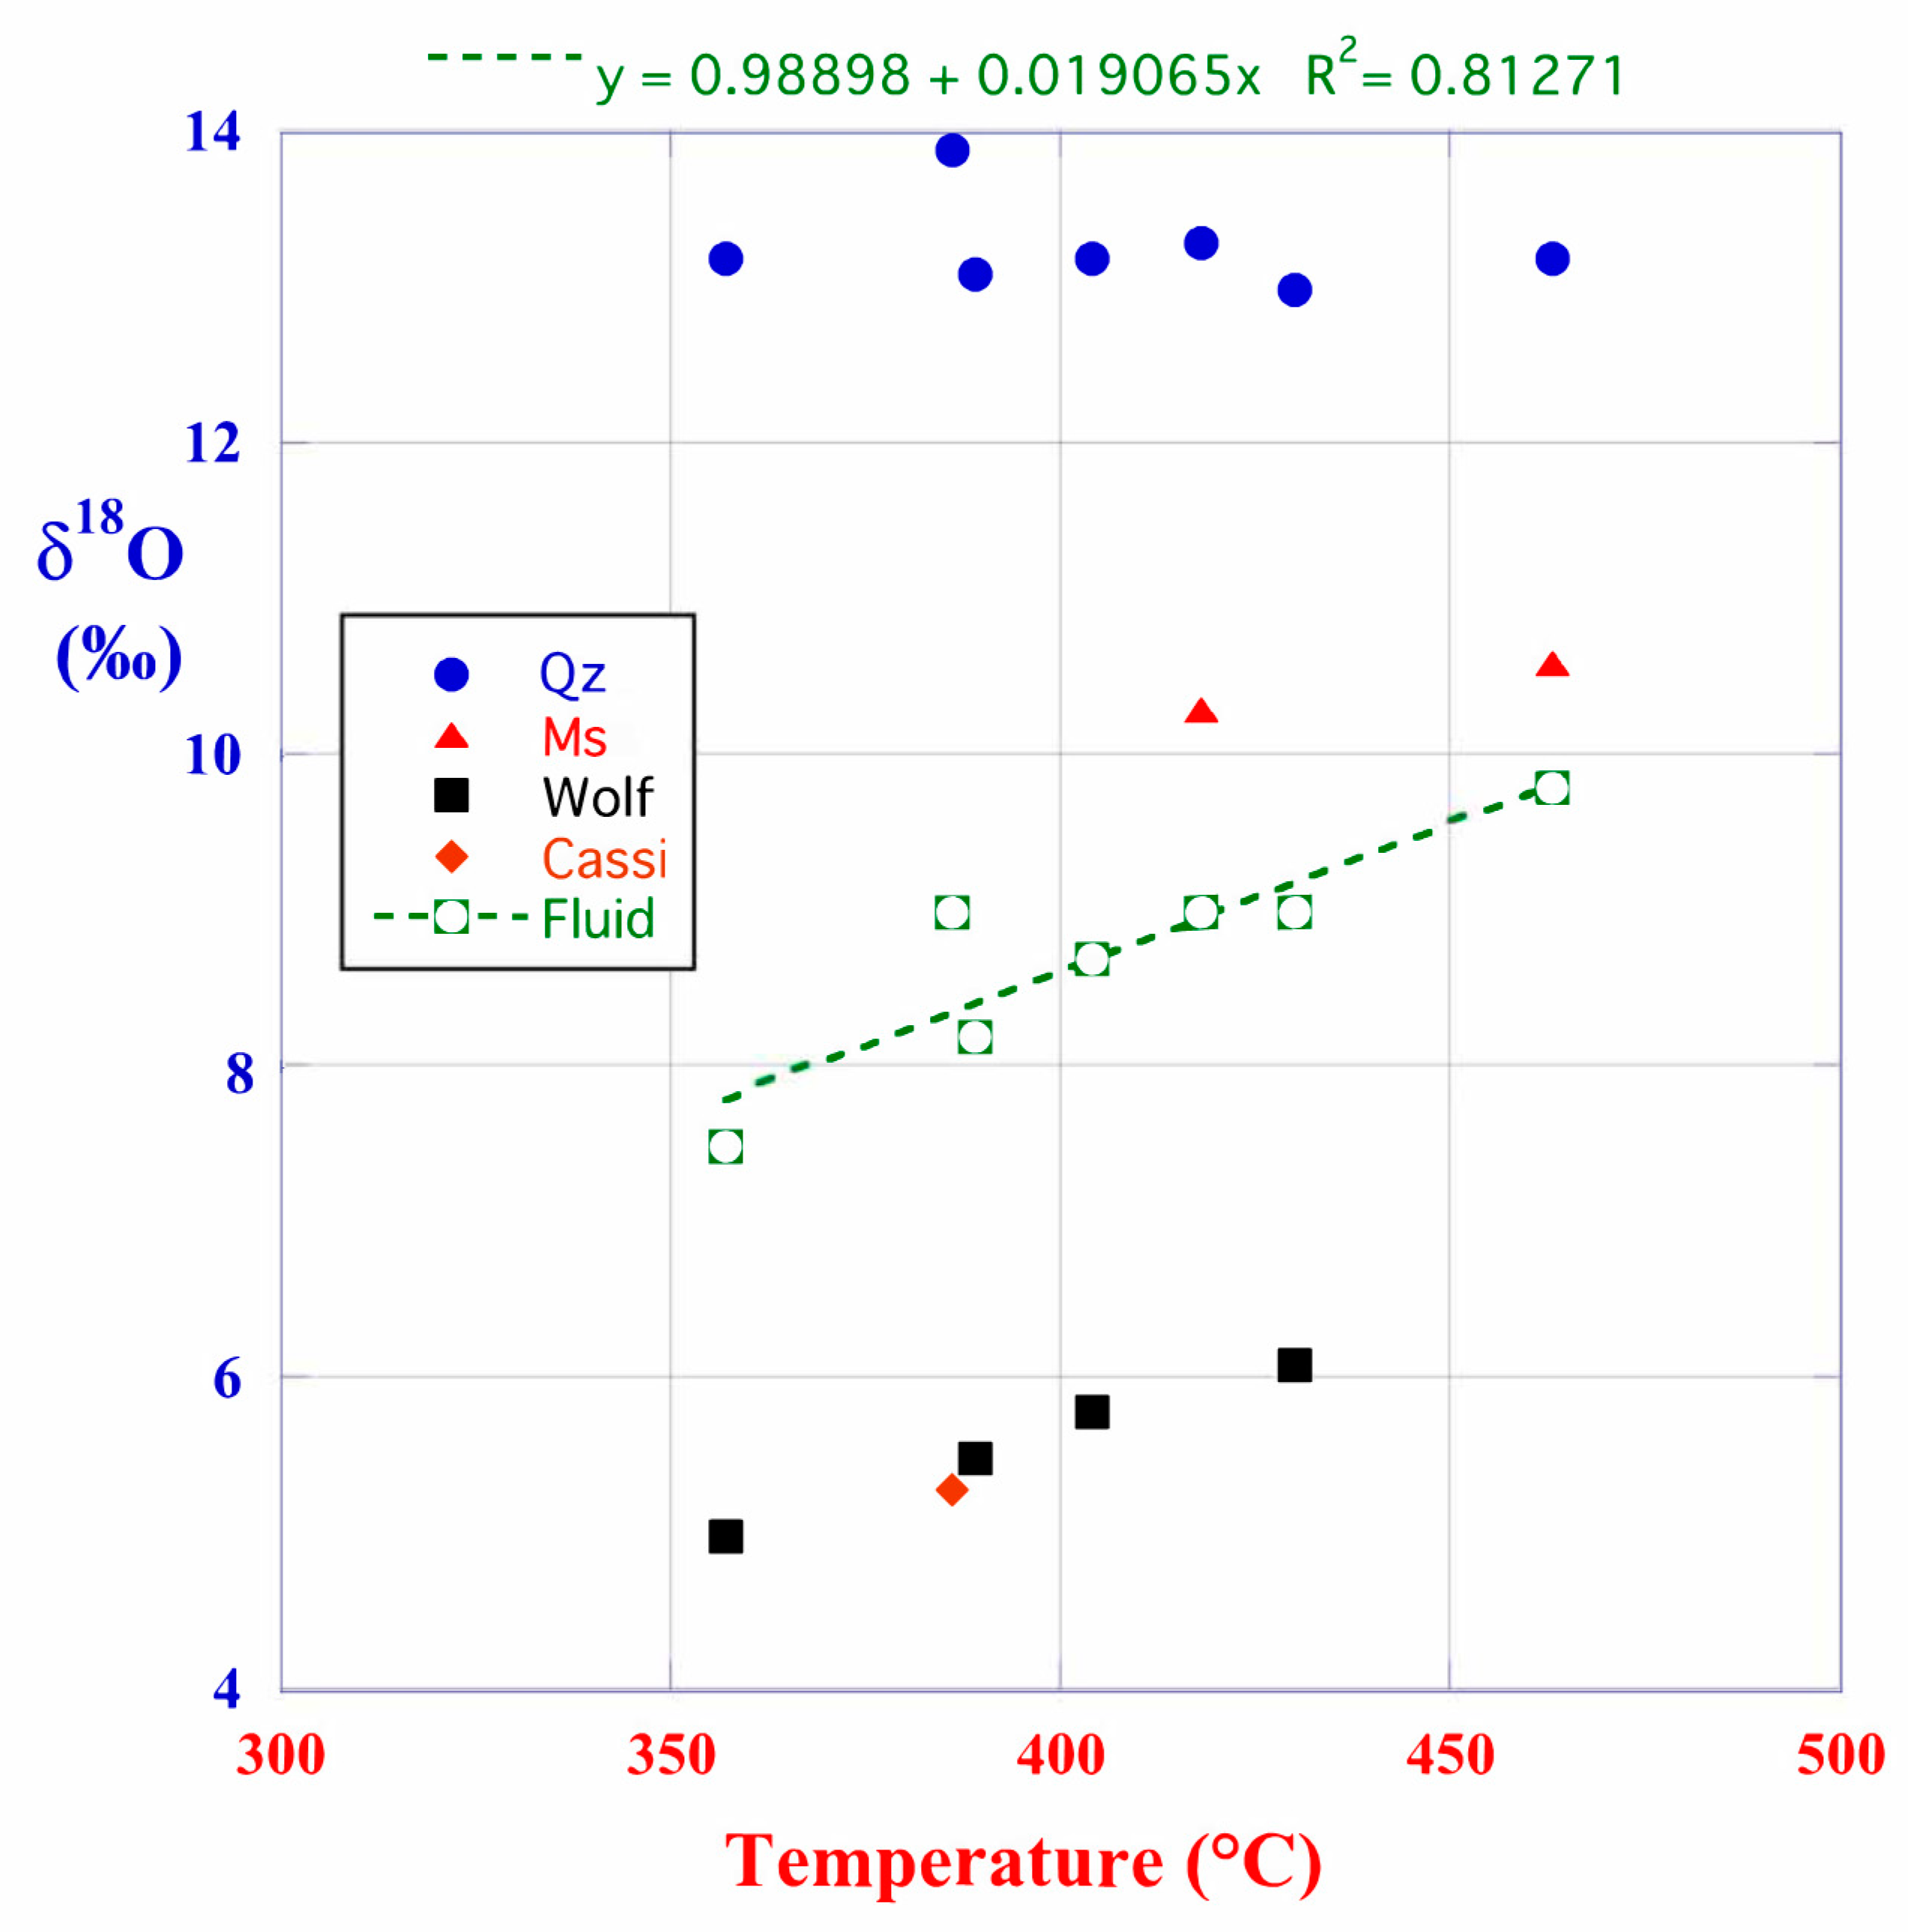
5.3. Oxygen Isotope Thermometry

Table 5 and Figure 8 show the oxygen isotope equilibrium temperature for each mineral pair using a corresponding calibration curve. Oxygen isotope equilibrium temperatures for quartz–muscovite pairs are 460 °C and 420 °C, and the temperatures for quartz–wolframite pairs range from 430 °C to 360 °C. A temperature of 390 °C was obtained for a quartz–cassiterite pair. The highest temperature of 460 °C might correspond to the earliest mineralization stage. Ore mineralization occurred below 430 °C (Figure 8). Cassiterite precipitation occurred somewhat later than the main wolframite precipitation (Figure 3), which is consistent with previous works [8,13,14].
Fortier and Giletti [27] state that micas normally become closed systems for oxygen isotope exchange by volume self-diffusion after quartz and before feldspar during the cooling of metamorphic rocks. This would result in low apparent quartz–mica temperatures. However, we do not think this has occurred in the case of the Takatori deposit, as the veins are inferred to have cooled rapidly in comparison with most metamorphic rocks. Moreover, the vein minerals quickly separated from the fluid after precipitation. The well-preserved oxygen isotope compositions of both quartz and muscovite in the Takatori veins warrant their use in isotope thermometry.
The oxygen isotope ratio of the Takatori fluid was then calculated using the isotope equilibrium temperature, the δ18O value of quartz, and the calibration curve for quartz. The δ18O values of the fluids range from +9.8‰ to +7.5‰ (Table 5, Figure 8). Table 5 shows two equilibrium temperatures and two corresponding δ18O values of the fluid for several mineral pairs. When two sets of equilibrium mineral pairs in a sample were identified, each pair was separately measured for δ18O values. Therefore, each pair presents an equilibrium temperature. Different equilibrium temperatures in a sample imply that there are different mineral stages in a single specimen.
The highest δ18O value of +9.8‰ was calculated at the highest temperature of 460 °C, and the δ18O values of the fluid decreased with decreasing temperature. Previous studies indicated that the homogenization temperatures of fluid inclusions in a quartz sample from the Takatori deposit were proportional to the NaCl eq. wt.% of the fluid inclusions [22,28]. The homogenization temperatures of fluid inclusions in cassiterite, topaz, and rhodochrosite from the Takatori deposit were also positively correlated with the NaCl eq. wt.% of the fluid inclusions [22]. Such correlations could be explained by the incorporation of meteoric water in the Takatori hydrothermal system, that is, the decreasing fluid δ18O values with decreasing temperature were probably because the fluid mixed with meteoric water. The fluid evolutions of the Ohtani and Kaneuchi tungsten–quartz vein deposits (having formed at 91 Ma within the Jurassic Tanba Group accretionary sedimentary complex), which have similar geologic characteristics to the Takatori deposit, present similar characteristics [29]. The δ18O values of the Ohtani and Kaneuchi fluids decreased with decreasing temperature, which was interpreted as a result of the incorporation of meteoric water into the hydrothermal system.
The effect of dissolved NaCl on equilibrium oxygen isotope fractionation factors between mineral and fluid phases should be determined to understand salt effects. Although Truesdell [30] suggested that fractionation constituted a large effect, Zhang et al. [20,21] reported that oxygen isotope fractionation factors between quartz, cassiterite, or wolframite and pure water or salt solutions of different types and concentrations (up to 60 wt.%) were constant to within ±0.5‰, suggesting little effect of the salts on oxygen isotope fractionation. Horita et al. [31] precisely measured the effect of dissolved NaCl on equilibrium oxygen isotope fractionation factors between liquid water and water vapor. They confirmed the findings of Zhang et al. [20,21] and contradicted those of Truesdell [30], and further concluded that the oxygen isotope effect was −0.2‰/mol at 350 °C with increasing temperature. According to Horita et al. [31], the oxygen isotope fractionation factor for 9 wt.% NaCl fluid at 460 °C might be 0.6‰ lower than that of pure water. This is the maximum effect to be expected for the Takatori fluids. It is worth noting that the oxygen isotope equilibrium temperatures are not affected by salt contents, as the paired minerals respond equally and the salt effect is canceled when the subtraction is performed to calculate equilibrium temperature.

5.4. Related Underlying Granites

It is inferred that the earliest fluid for the Takatori hydrothermal mineralization (at the fluid δ18O was +9.8‰ (Table 5)) might have been in equilibrium with ilmenite-series or S-type granitic magmas based on their oxygen isotope ratios [32,33]. Masukawa et al. [14] also concluded from 87Sr/86Sr ratios of fluid inclusions that the ore-forming fluid responsible for tungsten mineralization has a genetic relationship with S-type magma. Tungsten deposits in Japan are mostly related to ilmenite-series granitoids [34], and Robb [35] stated that tungsten deposits are associated with deep, highly differentiated and reduced, ilmenite-bearing S-type granites. Therefore, the estimated granitic stock beneath the Takatori deposit is ilmenite-series or S-type, though there are no such granitoids exposed in the mining area. MITI [6] suggested the existence of an underlying granitic body on the basis of a low Bouguer gravity anomaly southwest of the deposit.

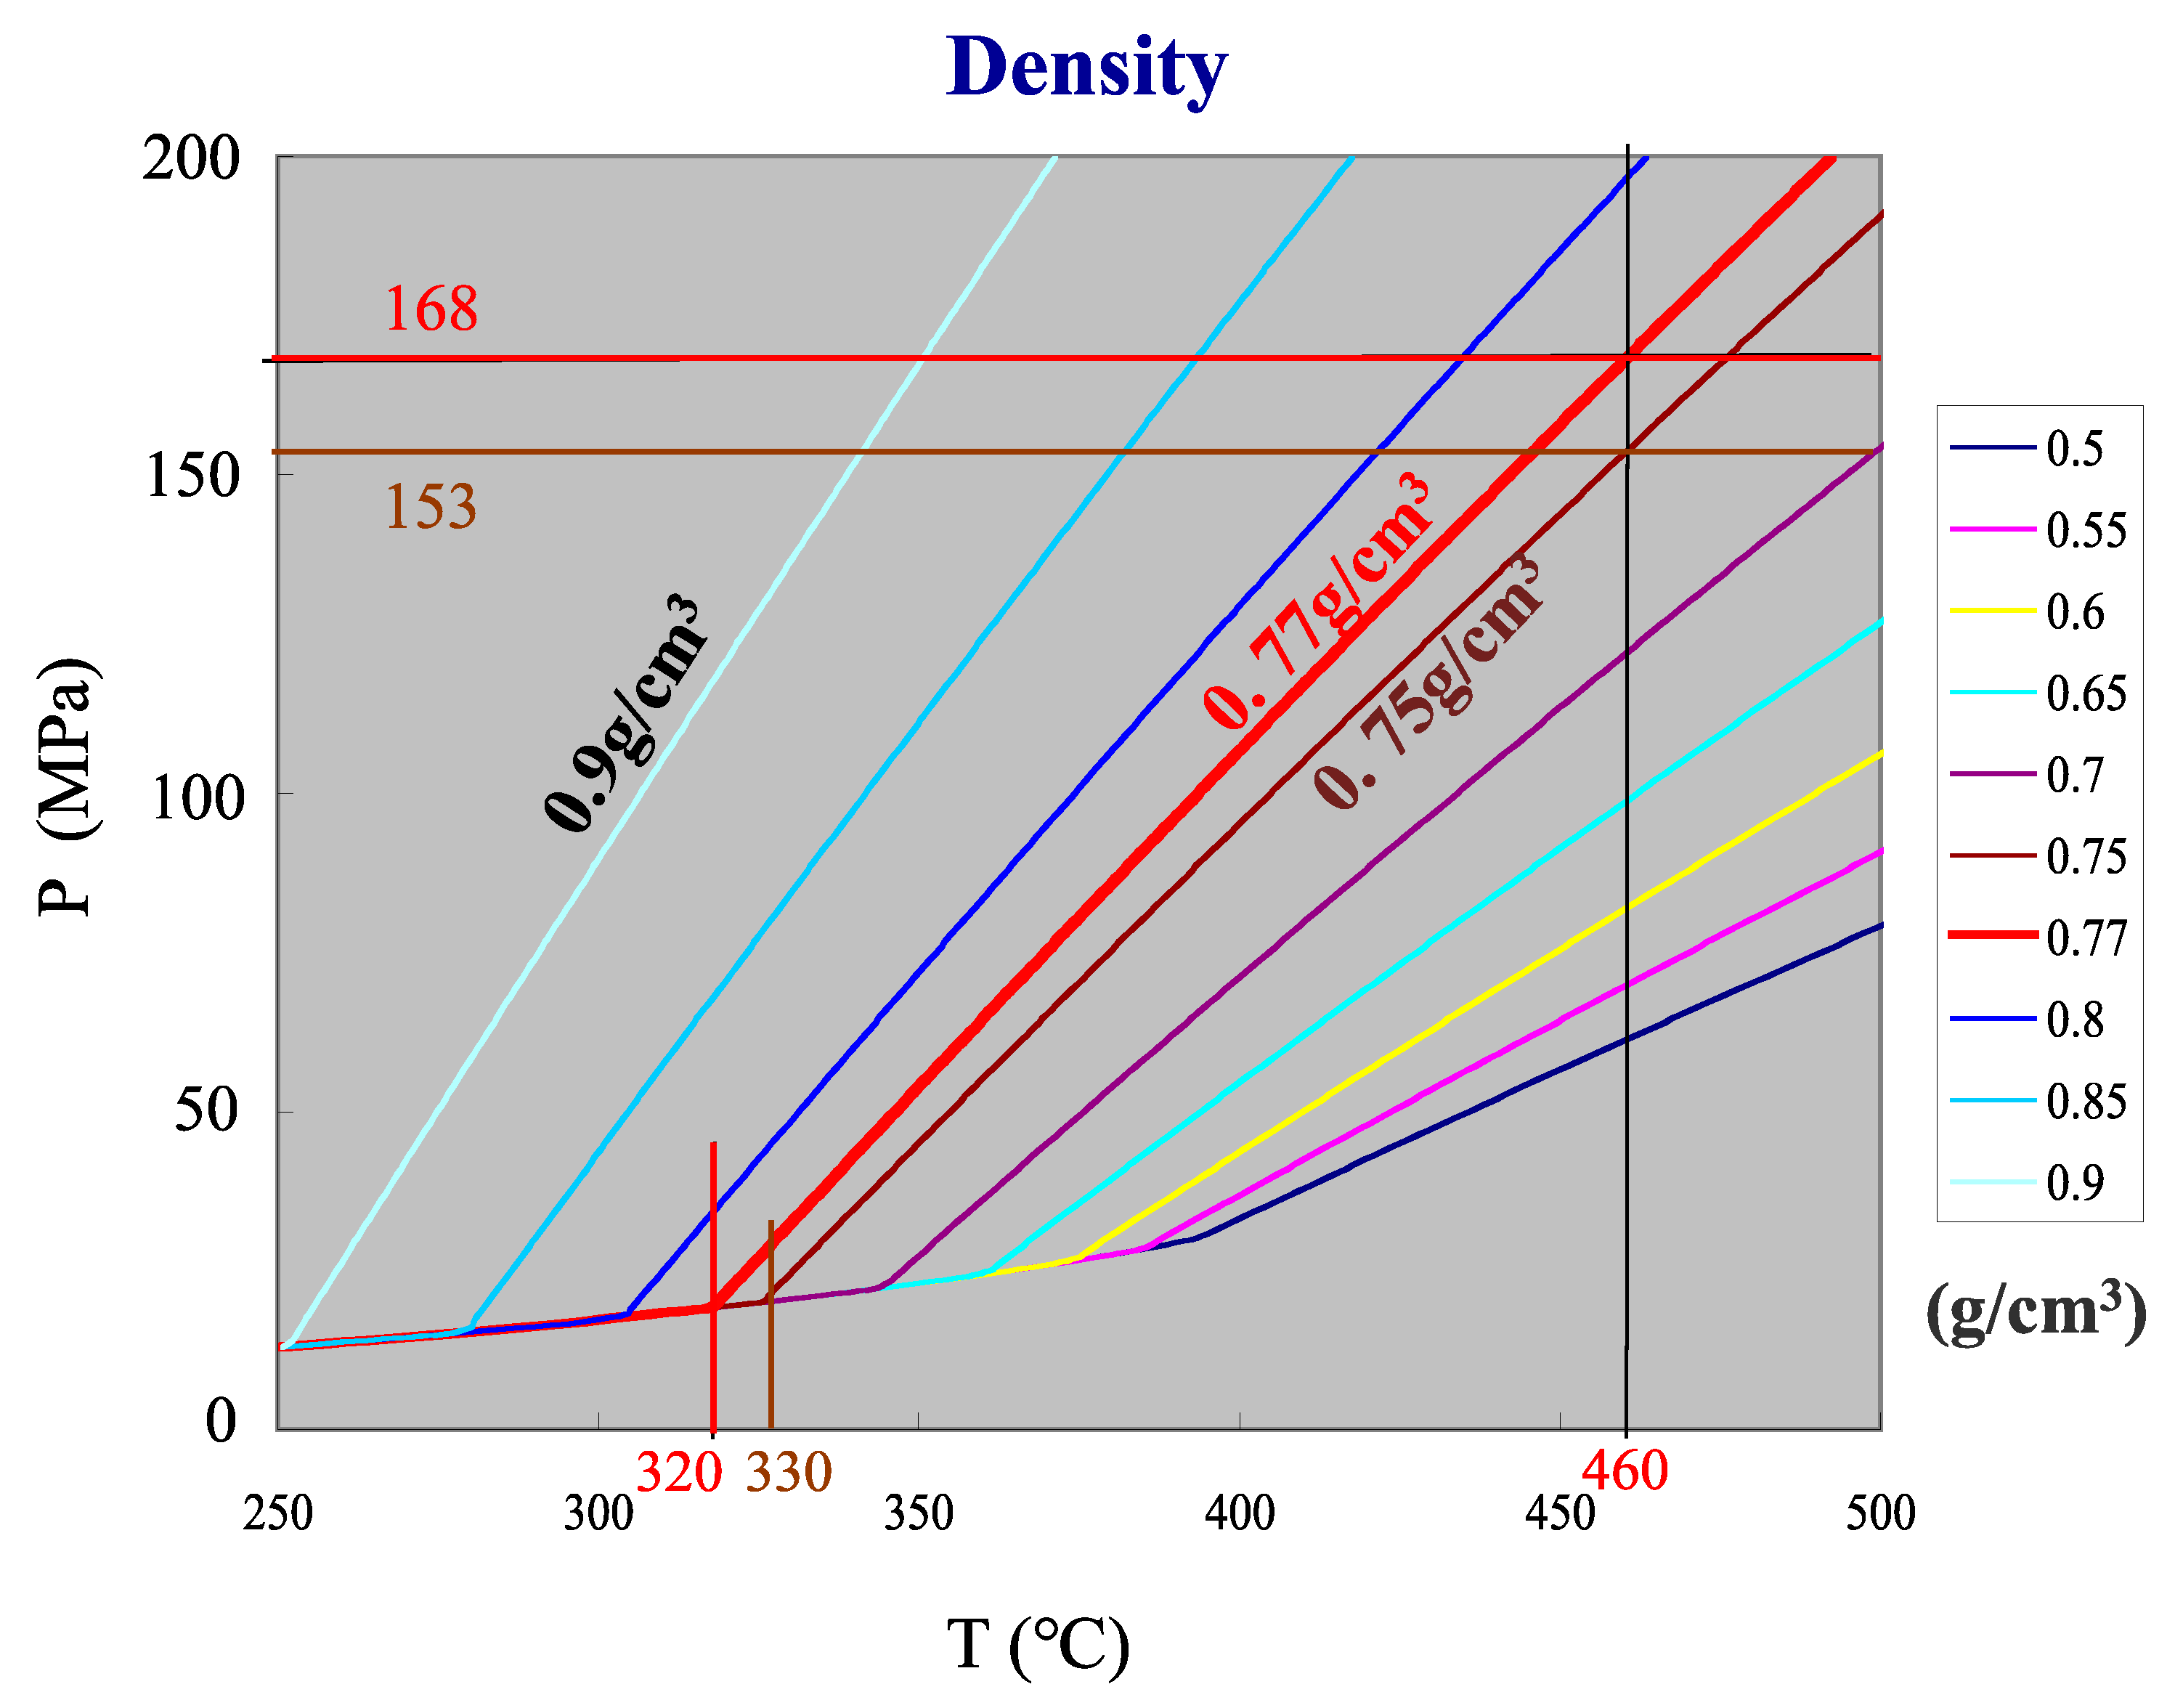
5.5. Formation Pressure of the Takatori Ore Deposit

The oxygen isotope equilibrium temperatures obtained in this study range from 460 °C to 360 °C, whereas the homogenization temperatures of fluid inclusions in vein quartz range from 320 °C to 225 °C by Takenouchi and Imai [28] or from 330 °C to 150 °C by Shibue et al. [26]. The highest temperatures may correspond to the earliest mineralization stage of the deposit, so we compared the highest values. The difference between the two temperatures is 140 °C using the highest homogenization temperature by Takenouchi and Imai [28] or 130 °C using the highest homogenization temperature by Shibue et al. [26].
The large discrepancy in temperature between the oxygen isotope equilibrium temperatures and homogenization temperatures might plausibly correspond to a pressure correction for the fluid inclusion homogenization temperatures. If that is the case, the formation pressure can be calculated from the difference between the pressure-independent isotope equilibrium temperatures and pressure-dependent homogenization temperatures of fluid inclusions, which provides a geobarometer (method described in [29]).
The volumetric properties of fluids are calculated using a modified Redlick–Kwong equation of state for the H2O–CO2–NaCl ternary system [36,37], and calculated densities of fluids are shown as isochores (method described in [29]). Previous studies revealed that the Takatori fluid inclusion with the highest homogenization temperature had a CO2 mole fraction of 0.05 [38] and NaCl equivalent concentration of 9 wt.% [28]. Assuming the earliest Takatori fluid had those concentrations, the density of the fluid could be calculated as a function of temperature and pressure, illustrated by isochores in Figure 9.
The density of the Takatori fluid inclusion having the highest homogenization temperature of 320 °C [28] is 0.77 g/cm3. Taking the highest isotope equilibrium temperature of 460 °C, a formation pressure of 168 MPa is obtained for the Takatori deposit (Figure 9) based on the pressure-independent isotope equilibrium temperature and pressure-dependent homogenization temperature of fluid inclusions. If we take the highest homogenization temperature of 330 °C [26], the density of the Takatori fluid is 0.75 g/cm3, and the formation pressure of 153 MPa is calculated taking the highest isotope equilibrium temperature of 460 °C (Figure 9). We assume that the formation pressure of the Takatori deposit was 160 MPa by averaging the two sets of data.

5.6. Genesis of the Takatori Deposit

A granitic stock is inferred to lie beneath the deposit, although it is not exposed (Section 2.1). The surrounding areas are rich in F (Figure 1) and Li (Table 2), which might originate from volatile magmatic components. As the average density of the rocks overlying the Takatori deposit is 2.65 g/cm3 [6], the ore-forming depth is calculated as 6.0 km using the ore-formation pressure of 160 MPa (Section 5.5) if we assume lithostatic conditions. The δ18O value of the earliest Takatori hydrothermal fluid was about +10‰ at 460 °C (Section 5.3), with fluid that was related to an ilmenite-series or S-type granitic magma beneath the deposit (Section 5.4). Thus, Takatori ore mineralization occurred within a magmatic hydrothermal system at the earliest stage, when the system had just started to develop. The magmatic hydrothermal fluid might have first mixed with the surrounding pore water. At the same time, the vein fractures had developed upward, resulting in decreasing pressure and incorporating meteoric water from the wider area. Thus, the δ18O value of the fluid decreased with decreasing temperature by mixing with meteoric water (Section 5.3). The estimated fluid evolution in the Takatori deposit was reinforced by the following evidence. The homogenization temperatures of fluid inclusions in quartz were proportional to the NaCl eq. wt.% of the inclusions [22,28], and Hayashi [24] showed that W, Fe, and Mn concentrations in fluid inclusions decreased with fluid evolution.

6. Conclusions

The Takatori hypothermal tin–tungsten–quartz vein deposit was formed from a magmatic hydrothermal system related to an ilmenite-series or S-type granitic magma at 71 Ma. The δ18O value of the early-stage fluid was about +10‰ at a temperature of 460 °C, and the earliest fluid might be magmatic fluid from an assumed granitic magma beneath the deposit. An ore-formation pressure of 160 MPa was calculated on the basis of the discrepancies between oxygen isotope equilibrium temperatures and homogenization temperatures. The ore-forming depth was then calculated to be 6 km under lithostatic conditions.
Several vein wolframites show replacement textures with respect to Mn and Fe, especially wolframite coexisting with pyrite. The texture was thought to form by the replacement of Fe in the wolframite with Mn in a later stage fluid. δ7Li values of Li-bearing muscovite from the Takatori veins range from −3.1‰ to −2.1‰. Fine-grained sericites that have less Li show relatively higher δ7Li values (−0.6‰ and +2.1‰), and they might have precipitated after main ore mineralization.
The early-stage magmatic fluid might have first mixed with the surrounding pore water. The δ18O values of the ore-forming fluid range from +10‰ to +8‰. The vein fractures had developed upward, resulting in decreasing pressure and incorporating meteoric water from the wider area. The δ18O values of the ore-forming fluid decreased with decreasing temperature; such a correlation could indicate the incorporation of meteoric water into the Takatori hydrothermal system. The oxygen isotope thermometry and barometry suggest that a reduced granitic magma beneath the deposit at depth played a crucial role in the formation of the Takatori hypothermal deposit.

Author Contributions

Conceptualization, Y.M.; Formal analysis, Y.M.; Investigation, Y.M. and Y.N.; Methodology, Y.M. and Y.N.; Resources, Y.M. and Y.N.; Writing—original draft, Y.M.; Writing—review and editing, Y.M. and Y.N. All authors have read and agreed to the published version of the manuscript.

Funding

This research was funded by the Japan Society for the Promotion of Science (JSPS) Kakenhi grant number 18K03758.

Institutional Review Board Statement

Not applicable.

Informed Consent Statement

Not applicable.

Data Availability Statement

No new data were created or analyzed in this study.

Acknowledgments

The first author is grateful to geologists at the Takatori mine for their courtesy during the underground survey. We would like to acknowledge Y. Shibue for valuable suggestions. J. Ikuma is thanked for the SEM and EPMA analytical operations. We thank K. Michibayashi for the use of SEM. Saulo B. de Oliveira and an anonymous reviewer are thanked for their careful and constructive comments, which improved the manuscript.

Conflicts of Interest

The authors declare no conflict of interest.

References

  1. Zhou, Y.; Xu, J.; Shan, L.; Cheng, X.; Deng, Y.; Feng, W.; Qiao, L. Ore Genesis and Tectonic Significance of the Xiaojiashan Tungsten Deposit, Eastern Tianshan, Xinjiang, China: Evidence from Geology, Fluid Inclusions, and Stable Isotope Geochemistry. Resour. Geol. 2019, 69, 43–64. [Google Scholar] [CrossRef] [Green Version]
  2. Zhang, Y.; Ma, D.; Gao, J.-F. Origin and evolution of ore-forming fluids in a tungsten mineralization system, Middle Jiangnan orogenic belt, South China: Constraints from in-situ LA-ICP-MS analyses of scheelite. Ore Geol. Rev. 2020, 127, 103806. [Google Scholar] [CrossRef]
  3. Li, J.; Huang, X.-L.; Fu, Q.; Li, W.-X. Tungsten mineralization during the evolution of a magmatic-hydrothermal system: Mineralogical evidence from the Xihuashan rare-metal granite in South China. Am. Miner. 2021, 106, 443–460. [Google Scholar] [CrossRef]
  4. Wang, G.; Li, X.; Zhang, D.; Yu, J.; Liu, Y. Genesis of the Yingzuihongshan Tungsten Deposit, Western Inner Mongolia Autonomous Region, North China: Constraints from In Situ Trace Elements Analyses of Scheelite. Minerals 2021, 11, 510. [Google Scholar] [CrossRef]
  5. Ishihara, S. The Mo-W metallogenic provinces and the related granitic provinces. Mining Geol. 1973, 23, 13–32, (In Japanese with English abstract). [Google Scholar]
  6. Ministry of International Trade and Industry (MITI). Report of Prospect for Mineral Resources of Rare Metal in the Kasama Area, Showa 61st Fiscal Year; Ministry of International Trade and Industry: Tokyo, Japan, 1987; p. 155. (In Japanese)
  7. Ogasawara, M.; Tagiri, M.; Murao, S.; Seki, Y.; Kodama, T. Graphitization of carbonaceous material in sedimentary rocks of the Yamizo group surrounding the Takatori tungsten deposit, Japan: Influence of hydrothermal activity and the application to mineral exploration. J. Mineral. Petrol. Econ. Geol. 1994, 89, 348–359, (In Japanese with English abstract). [Google Scholar] [CrossRef]
  8. Ikeda, N.; Hida, H.; Noguchi, K.; Fujiwara, M. Geology and ore deposits of the Takatori tungsten mine, Ibaraki Prefecture, Central Japan, with special reference to the fracture system. Mining Geol. 1983, 33, 97–114, (In Japanese with English abstract). [Google Scholar]
  9. Yoshioka, T.; Takizawa, F.; Takahashi, M.; Miyazaki, K.; Banno, Y.; Yanagisawa, Y.; Takahashi, Y.; Kubo, K.; Seki, Y.; Komazawa, M.; et al. Geological Map of Japan 1:200,000, Mito, 2nd ed.; Geological Survey of Japan: Tsukuba, Japan, 2001. [Google Scholar]
  10. Ministry of International Trade and Industry (MITI). Report of Prospect for Mineral Resources of Rare Metal in the Kasama Area, Heisei 1st Fiscal Year; Ministry of International Trade and Industry: Tokyo, Japan, 1990; p. 211. (In Japanese)
  11. Shibata, K.; Ishihara, S. K-Ar age of the major tungsten and molybdenum deposits in Japan. Econ. Geol. 1974, 69, 1207–1214. [Google Scholar] [CrossRef]
  12. Steiger, R.H.; Jäger, E. Subcommission on geochronology: Convention on the use of decay constant in Geo- and Cosmochronology. Earth Planet. Sci. Lett. 1977, 36, 359–362. [Google Scholar] [CrossRef]
  13. Sakamoto, M. Internal structure and compositional variation of wolframite in the Takatori mine. Mining Geol. 1985, 35, 317–329. [Google Scholar]
  14. Masukawa, K.; Nishio, Y.; Hayashi, K. Lithium-strontium isotope and heavy metal content of fluid inclusions and origin of ore-forming fluid responsible for tungsten mineralization at Takatori mine, Japan. Geochem. J. 2013, 47, 309–319. [Google Scholar] [CrossRef] [Green Version]
  15. Nishio, Y.; Okamura, K.; Tanimizu, M.; Ishikawa, T.; Sano, Y. Lithium and strontium isotopic systematics of waters around Ontake volcano, Japan: Implications for deepseated fluids and earthquake swarms. Earth Planet. Sci. Lett. 2010, 297, 565–574. [Google Scholar] [CrossRef] [Green Version]
  16. Flesch, G.D.; Anderson, A.R., Jr.; Svec, H.J. A secondary isotopic standard for 6Li/7Li determinations. Int. J. Mass Spectrom. Ion Phys. 1973, 12, 265–272. [Google Scholar] [CrossRef]
  17. Clayton, R.N.; Mayeda, T.K. The use of bromine pentafluoride in the extraction of oxygen from oxides and silicates for isotopic analysis. Geochim. Cosmochim. Acta 1963, 27, 43–52. [Google Scholar] [CrossRef]
  18. Clayton, R.N.; Goldsmith, J.R.; Mayeda, T.K. Oxygen isotope fractionation in quartz, albite anorthite and calcite. Geochim. Cosmochim. Acta 1989, 53, 725–733. [Google Scholar] [CrossRef]
  19. Chacko, T.; Hu, X.; Mayeda, T.K.; Clayton, R.N.; Goldsmith, J.R. Oxygen isotope fractionations in muscovite, phlogopite and rutile. Geochim. Cosmochim. Acta 1996, 60, 2595–2608. [Google Scholar] [CrossRef]
  20. Zhang, L.-G.; Liu, J.-X.; Zhou, H.-B.; Chen, Z.-S. Oxygen isotope fractionation in the quartz-water-salt system. Econ. Geol. 1989, 84, 1643–1650. [Google Scholar] [CrossRef]
  21. Zhang, L.-G.; Liu, J.-X.; Chen, Z.-S.; Zhou, H.-B. Experimental investigations of oxygen isotope fractionation in Cassiterite and Wolframite. Econ. Geol. 1994, 89, 150–157. [Google Scholar] [CrossRef]
  22. Enjoji, M. Studies on fluid inclusions as the media of the ore formation. Sci. Rept. Tokyo Kyoiku Daigaku 1972, 11, 79–126. [Google Scholar]
  23. Shibue, Y. Application of thermodynamic data to the stability fields of ferberite, huebnerite, and ferric tungstate. Neues Jahrb. Mineral. Mon. 1982, H.3, 125–132. [Google Scholar]
  24. Hayashi, K. Quantitative analysis of tungsten content in single fluid inclusion by SXRF. Photon Fact. Act. Rep. Part B 2012, 30, 15. [Google Scholar]
  25. Wunder, B.; Meixner, A.; Romer, R.L.; Feenstra, A.; Schettler, G.; Heinrich, W. Lithium isotope fractionation between Li-bearing staurolite, Li-mica and aqueous fluids: An experimental study. Chem. Geol. 2007, 238, 277–290. [Google Scholar] [CrossRef]
  26. Shibue, Y.; Chiba, H.; Kusakabe, M.; Morishita, Y. Temperatures and oxygen isotopic composition of hydrothermal fluids for the Takatori tungsten-copper deposit, Japan. Resour. Geol. 2005, 55, 101–110. [Google Scholar] [CrossRef]
  27. Fortier, S.M.; Giletti, B.J. Volume self-diffusion of oxygen in biotite, muscovite, and phlogopite micas. Geochim. Cosmochim. Acta 1991, 55, 1319–1330. [Google Scholar] [CrossRef]
  28. Takenouchi, S.; Imai, H. Fluid inclusion study of some tungsten-quartz veins in Japan. Mining Geol. Spec. Issue 1971, 3, 345–350. [Google Scholar]
  29. Morishita, Y. Fluid evolution and geobarometry on the Ohtani and Kaneuchi tungsten-quartz vein deposits, Japan: Oxygen and carbon isotopic evidence. Miner. Depos. 1991, 26, 40–50. [Google Scholar] [CrossRef]
  30. Truesdell, A.H. Oxygen isotope activities and concentrations in aqueous salt solutions at elevated temperatures: Consequences for isotope geochemistry. Earth Planet. Sci. Lett. 1974, 23, 387–396. [Google Scholar] [CrossRef]
  31. Horita, J.; Cole, D.R.; Wesolowski, D.J. The activity-composition relationship of oxygen and hydrogen isotopes in aqueous salt solutions: III. Vapor-liquid water equilibration of NaCl solutions to 350 °C. Geochim. Cosmochim. Acta 1995, 59, 1139–1151. [Google Scholar] [CrossRef]
  32. Takahashi, M.; Aramaki, S.; Ishihara, S. Magnetite-series/ilmenite-series vs. I-type/S-type granitoids. Mining Geol. Spec. Issue 1980, 8, 13–28. [Google Scholar]
  33. Ishihara, S.; Matsuhisa, Y. Oxygen isotopic constraints on the geneses of the cretaceous granitoids in the Kitakami and Abukuma terrains, northeast Japan. Bull. Geol. Surv. Jpn. 2004, 55, 57–66. [Google Scholar] [CrossRef] [Green Version]
  34. Ishihara, S. Granitoid series and Mo/W-Sn mineralization in East Asia. Geol. Surv. Jpn. Rep. 1984, 263, 173–208. [Google Scholar]
  35. Robb, L. Introduction to Ore-Forming Processes; Blackwell Science Ltd.: Malden, MA, USA, 2005; 373p. [Google Scholar]
  36. Bowers, T.S.; Helgeson, H.C. Calculation of the thermodynamic and geochemical consequences of nonideal mixing in the system H2O-CO2-NaC1 on phase relations in geologic systems: Equation of state for H2O-CO2-NaC1 fluids at high pressures and temperatures. Geochim. Cosmochim. Acta 1983, 47, 1247–1275. [Google Scholar] [CrossRef]
  37. Bowers, T.S.; Helgeson, H.C. FORTRAN programs for generating fluid inclusion isochores and fugacity coefficients for the system H2O-CO2-NaC1 at high pressures and temperatures. Comput. Geosci. 1985, 11, 203–213. [Google Scholar] [CrossRef]
  38. Kazahaya, K.; Matsuo, S. A new ball-milling method for extraction of fluid inclusions from minerals. Geochem. J. 1985, 19, 45–54. [Google Scholar] [CrossRef]
Figure 1. Geological map of the Takatori mining area, covered by the Jurassic Yamizo group accretionary sedimentary rocks comprising chert, sandstone, and shale (modified from [6]). The subsurface vein projection and structural attitudes (red lines) are shown. The location of drill hole 63MAKA-1 is shown. The high-fluorine area, with rocks containing more than 500 ppm of fluorine, is delineated by the dotted blue line.
Minerals 11 00765 g001
Figure 2. A typical wolframite-bearing quartz vein on the adit roof in the Takatori mine. The vein (No. 8 vein on level −4L, 57 m above sea level) is composed of quartz and wolframite with minor amounts of cassiterite, pyrite, and muscovite. Muscovite is mostly found in the vein/wall-rock boundary.
Minerals 11 00765 g002
Figure 3. Sequence of mineral paragenesis of the Takatori deposit.
Minerals 11 00765 g003
Figure 4. Schematic plan view for veins on −4L level (57 m above sea level) of the Takatori mine. Samples from −4L level are represented by black circles. Samples from other levels (red circles) are superimposed on the −4L level map. Since the veins dip south, No. 7 vein on −2L level is located in the northernmost part. The main adit (167 m above sea level) and No. 2 shaft are also shown.
Minerals 11 00765 g004
Figure 5. (a) Photomicrograph of a wolframite-bearing quartz vein with pyrite and fluorite (82032404) from No. 7 vein at W20 on level −4L (57 m above sea level, Figure 4). Elemental maps of wolframite by SEM-EDS are shown for (b) Mn and (c) Fe. The analysis area for (b,c) is designated by the rectangular frame in Figure 5a. High content (Mn or Fe) corresponds to the right end of each color bar (qualitative scale). Qz: quartz, Wolf: wolframite, Py: pyrite, Fl: fluorite.
Minerals 11 00765 g005aMinerals 11 00765 g005b
Figure 6. (a) Quantitative analyses for Mn and Fe by EPMA. The Mn/Fe ratio is expressed in mol% of MnO/(MnO + FeO). (b) The analytical traverse line A–B is shown in the photomicrograph. Wolf: wolframite, Py: pyrite.
Minerals 11 00765 g006
Figure 7. Quartz–cassiterite mineral pairs from No. 7 vein on level −4L (sample 82032406, Table 1; Figure 4) of the Takatori deposit.
Minerals 11 00765 g007
Figure 8. A set of δ18O values for mineral pairs is plotted against the calculated oxygen isotopic equilibrium temperatures for the pairs. Oxygen isotope composition of the Takatori hydrothermal fluid that was in equilibrium with the corresponding mineral pair is then calculated using the isotope equilibrium temperature, the δ18O value of quartz, and the calibration curve for quartz. The δ18O values of the fluid range from +9.8‰ to +7.5‰. The regression line shows a rough positive correlation (R2 = 0.81) between the δ18O value and fluid temperature. Qz: quartz, Ms: muscovite, Wolf: wolframite, Cassi: cassiterite, Fluid: Takatori fluid.
Minerals 11 00765 g008
Figure 9. Isochors (lines of equal density) for the Takatori fluid. The density (g/cm3) of the fluid is calculated as a function of temperature and pressure assuming a CO2 mole fraction of 0.05 [38] and NaCl-equivalent concentration of 9 wt.% [28] for the ternary system of H2O–CO2–NaCl based on [36,37]. See details in text.
Minerals 11 00765 g009
Table 1. Takatori vein samples used in this study.
Sample No.Vein No.LocalityLevelAltitude (m)Mineral Paragenesis
820324037W17−2117Qz, Ms, Wolf, Fl, Ser
TK820713055W17−387Qz, Ms, Wolf
TK820317059W22−457Qz, Ms, Wolf
820324078W21−457Qz, Ms, Wolf, Ser
820324067W23−457Qz, Cassi
820324047W20−457Qz, Wolf, Fl, Py
820324117W26−7−33Qz, Ms, Wolf, Py
Qz: quartz, Ms: muscovite, Wolf: wolframite, Fl: fluorite, Ser: sericite, Cassi: cassiterite, Py: pyrite.
Table 2. Chemical compositions of muscovite from the Takatori veins.
Minerals 11 00765 i001
Analyses were performed by atomic absorption spectrometry except for Li (flame spectrochemical analysis) and F (colorimetric analysis) at the Geological Survey of Japan (analyst: S. Terashima). *1: Contaminated quartz (1–3%) were determined by X-ray diffraction (XRD) and the SiO2 represented by quartz has been subtracted from the total SiO2. *2: FeS2 (pyrite) is subtracted from the total Fe.
Table 3. Quantitative EPMA analyses of a wolframite grain (82032404; Table 1) from No. 7 vein at −4L (57 m above sea level, Figure 4) for FeO and MnO.
Analysis No.FeOMnOMnO/(FeO + MnO)
(wt.%)(wt.%)(mol%)
18.8316.5265.46
210.3315.3260.02
39.4015.8963.11
412.4213.0351.52
512.1611.8449.67
611.8013.8354.28
714.7811.0743.13
814.8011.0443.04
914.3211.0343.81
1014.6010.9743.21
1113.119.2641.71
1214.4010.8843.35
1314.5311.0943.59
1414.7111.3143.78
1514.8911.1243.06
1614.2011.0244.02
1714.7811.1643.34
1814.5011.2043.91
1914.8610.9842.81
2014.6411.1643.56
2114.6610.6942.46
2214.8610.9942.84
2314.8210.9142.72
2414.6910.9543.02
2514.6411.1443.52
2614.9310.8742.45
2715.1910.8541.98
2814.7810.9242.80
2914.9310.9442.59
3014.6210.6142.36
3114.5911.3344.02
328.9516.3164.86
339.4115.9763.21
Table 4. Lithium isotope ratios of lithium-bearing micas.
Sample No.LocalityMineralδ7LiLi
(‰)(wt.%)
82032403No.7V, −2Lsericite−0.60.045
TK82071305No.5V, −3Lmuscovite−3.10.175
TK82031705No.9V, −4Lmuscovite−2.40.242
82032407No.8V, −4Lsericite+2.10.020
82032411No.7V, −7Lmuscovite−2.10.236
Table 5. Oxygen isotope ratios of mineral pairs from the Takatori deposit.
δ18O SMOW (‰) Equilibrium Temperatureδ18O SMOW (‰)
Sample No.VeinQuartzMuscoviteSericiteWolframiteCassiteriteFluid
82032403No.7V, −2L13.1 5.5 389 °C8.2
TK82071305No.5V, −3L13.210.6 463 °C9.8
TK82071305No.5V, −3L13.2 5.8 404 °C8.7
TK82031705No.9V, −4L13.310.3 418 °C9.0
TK82031705No.9V, −4L13.2 5.0 357 °C7.5
82032406No.7V, −4L13.9 5.3386 °C9.0
82032411No.7V, −7L13.0 6.1 430 °C9.0
Publisher’s Note: MDPI stays neutral with regard to jurisdictional claims in published maps and institutional affiliations.

