Article

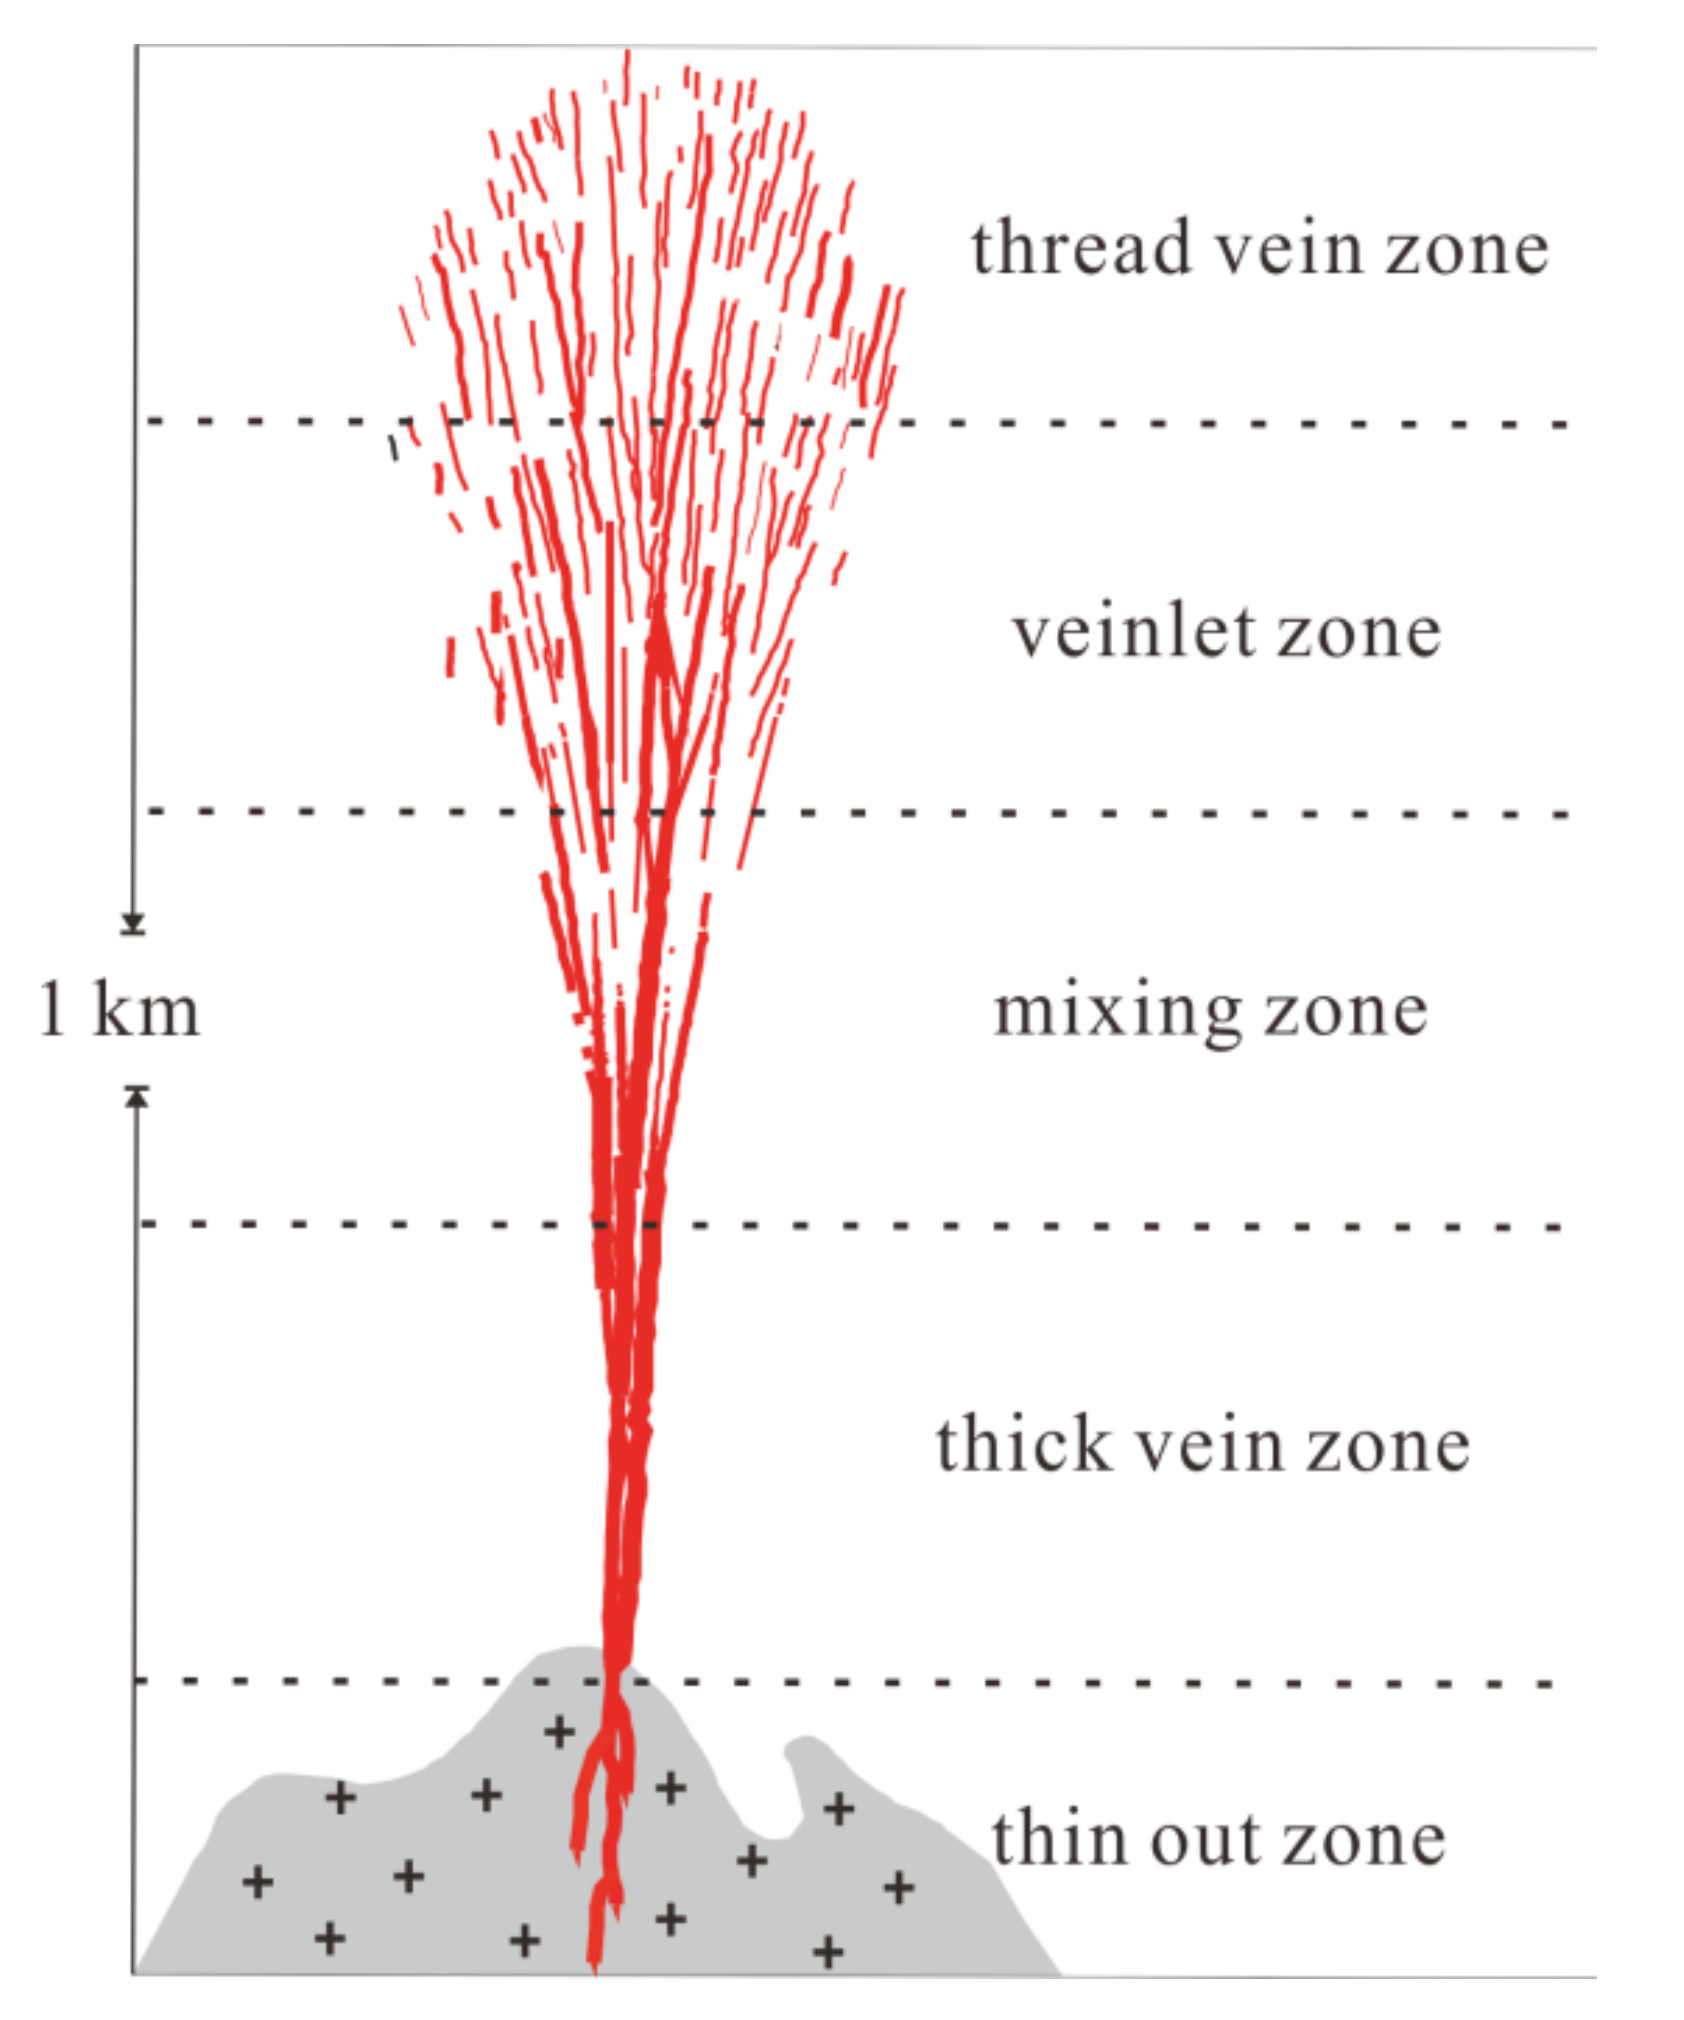
The Mechanisms Forming the Five–Floor Zonation of Quartz Veins: A Case Study in the Piaotang Tungsten–Tin Deposit, Southern China

1
Institute of Geomechanics, Chinese Academy of Geological Sciences, Beijing 100081, China
2
Key Laboratory of Paleomagnetism and Tectonic Reconstruction, Ministry of Natural Resources, Beijing 100081, China
3
School of Earth Sciences and Resources, China University of Geosciences (Beijing), Beijing 100083, China
*
Author to whom correspondence should be addressed.
Minerals 2021, 11(8), 883; https://doi.org/10.3390/min11080883
Submission received: 7 July 2021 / Revised: 12 August 2021 / Accepted: 12 August 2021 / Published: 16 August 2021

Abstract

:
It is common among many vein–type tungsten deposits in southern China that the thickness of ore veins increases from <1 cm to >1 m with increasing depth. A five–floor zonation model for the vertical trend of vein morphology was proposed in the 1960s and has been widely applied for predicting ore bodies at deeper levels, but the causative mechanisms for such a zonation remain poorly understood. The Piaotang tungsten–tin deposit, one of the birthplaces of the five–floor zonation model, is chosen as a case study for deciphering the mechanisms forming its morphological zonation of quartz veins. The vertical trend of vein morphology and its link to the W–Sn mineralization in Piaotang was quantified by statistical distributions (Weibull distribution and power law distribution) of vein thickness and ore grade data (WO3 and Sn) from the levels of 676 m to 328 m. Then, the micro–scale growth history of quartz veins was reconstructed by scanning electron microscope–cathodoluminescence (SEM–CL) imaging and in situ trace element analysis. The Weibull modulus α of vein thickness increases with increasing depth, and the fractal dimensions of both vein thickness and ore grade data (WO3 and Sn) decrease with increasing depth. Their vertical changes indicate that the fractures that bear the thick veins were well connected, facilitating fluid focusing and mineralization in mechanically stronger host rocks. Three generations (Q1–Q3) of quartz were identified from CL images, and the CL intensity of quartz is possibly controlled by the concentrations of Al and temperature. From the relative abundance of the Q1–Q3 quartz at different levels, the vertical trend of vein morphology in Piaotang was initially produced during the hydrothermal event represented by Q1 and altered by later hydrothermal events represented by Q2 and Q3. Statistical distributions of vein thickness combined with SEM–CL imaging of quartz could be combined to evaluate the mineralization potential at deeper levels.

1. Introduction

The Nanling Range is a world–class tungsten province located in southern China [1]. Most tungsten deposits in this region have a close genetic relationship to the granitic magmatism during the Late Mesozoic [2,3]. Vertical zonation in vein morphology is common among many tungsten deposits in the Nanling Range [4]. Based on the vein morphology, field geologists have identified five zones since the 1960s and proposed a five–floor zonation model for deep exploration [5,6].
The top vein zone of the five–floor zonation is referred to as the thread vein zone (Figure 1), where the veins are generally <1 cm wide [5]. The thin veins are generally barren but sometimes indicate the occurrence of a blind economic tungsten deposit at depth. Those thin veins become thicker and richer in tungsten downwards, forming the veinlet zone then the mixing zone of veinlet–thin veins. The veins in the two zones are normally 1–10 cm thick. The veins converge downwards into a few wolframite–quartz veins in the thick vein zone. The veins in this zone generally have a thickness of over 30 cm. The bottom vein zone is called the thin out zone where the veins become thinner and barren [5,7]. Such a zonation has been identified among many tungsten–tin deposits in the Nanling Range, including but not limited to the Yaogangxian deposit [8], the Meiziwo deposit [9], and the recently discovered Dongping tungsten deposit [10]. However, the reasons for such a zonation still remain enigmatic.
The vein morphology of the Dajishan tungsten deposit in China was studied by [11] using fractal techniques. One limitation of that study is that vein morphology data only cover a vertical range of 150 m, whereas the whole vein system generally has a vertical dimension of approximately 1000 m (see Figure 1). This difference on the vertical range of quartz veins is caused by at least two reasons. The first reason is that the tunnels being mined for most tungsten deposits in China cover a maximum vertical range of approximately 200–300 m. The second reason is that the shallower parts of the vein systems (e.g., the thread vein zone) are normally barren, and there is no access to those veins. An additional limitation is that the relationship between vein thickness and ore grade was not examined. The present study shows that vein thickness is linked to WO3 and Sn grades and their correlation may aid in deep exploration. The last major limitation is that the veins are probably the final product of multiple hydrothermal events because tungsten–tin deposits in southern China commonly experienced a few hydrothermal stages [12]. Hence, tracing the growth history of quartz veins at different levels is necessary to better constrain how the five–floor morphological zonation formed.
Cathodoluminescence (CL) is the emission of light caused by the interaction of an electron beam and a solid [13]. CL of minerals results from either lattice defects (e.g., vacancies and broken bonds) or the structural incorporation of certain trace elements [14]. The main advantage of CL imaging is that it can identify internal textures of minerals that are not easily distinguished by optical microscopy [15,16]. Scanning electron microscope–cathodoluminescence (SEM–CL) imaging of quartz has been widely used to reconstruct the growth histories of quartz from hydrothermal [17,18,19,20,21,22,23], sedimentary [24,25], and magmatic environments [26,27,28]. Therefore, SEM–CL imaging is a promising way to decipher the micro-scale textures and growth history of quartz veins in the five–floor zonation.
The Piaotang tungsten–tin deposit is one of the birthplaces of the five–floor zonation model. In this study, a brief introduction to the geological setting of the Piaotang deposit was first given. Then, vein thickness data in a vertical range of 348 m in Piaotang and the ore grade data were analyzed using fractal techniques and the Weibull distribution. Next, SEM–CL imaging and in situ trace element analysis of quartz were used to reveal the growth history and geochemical characteristics of quartz veins at different levels. Thus, the meso-scale vein morphology data and micro-scale quartz textures were combined to constrain how the morphological zonation in Piaotang was produced.

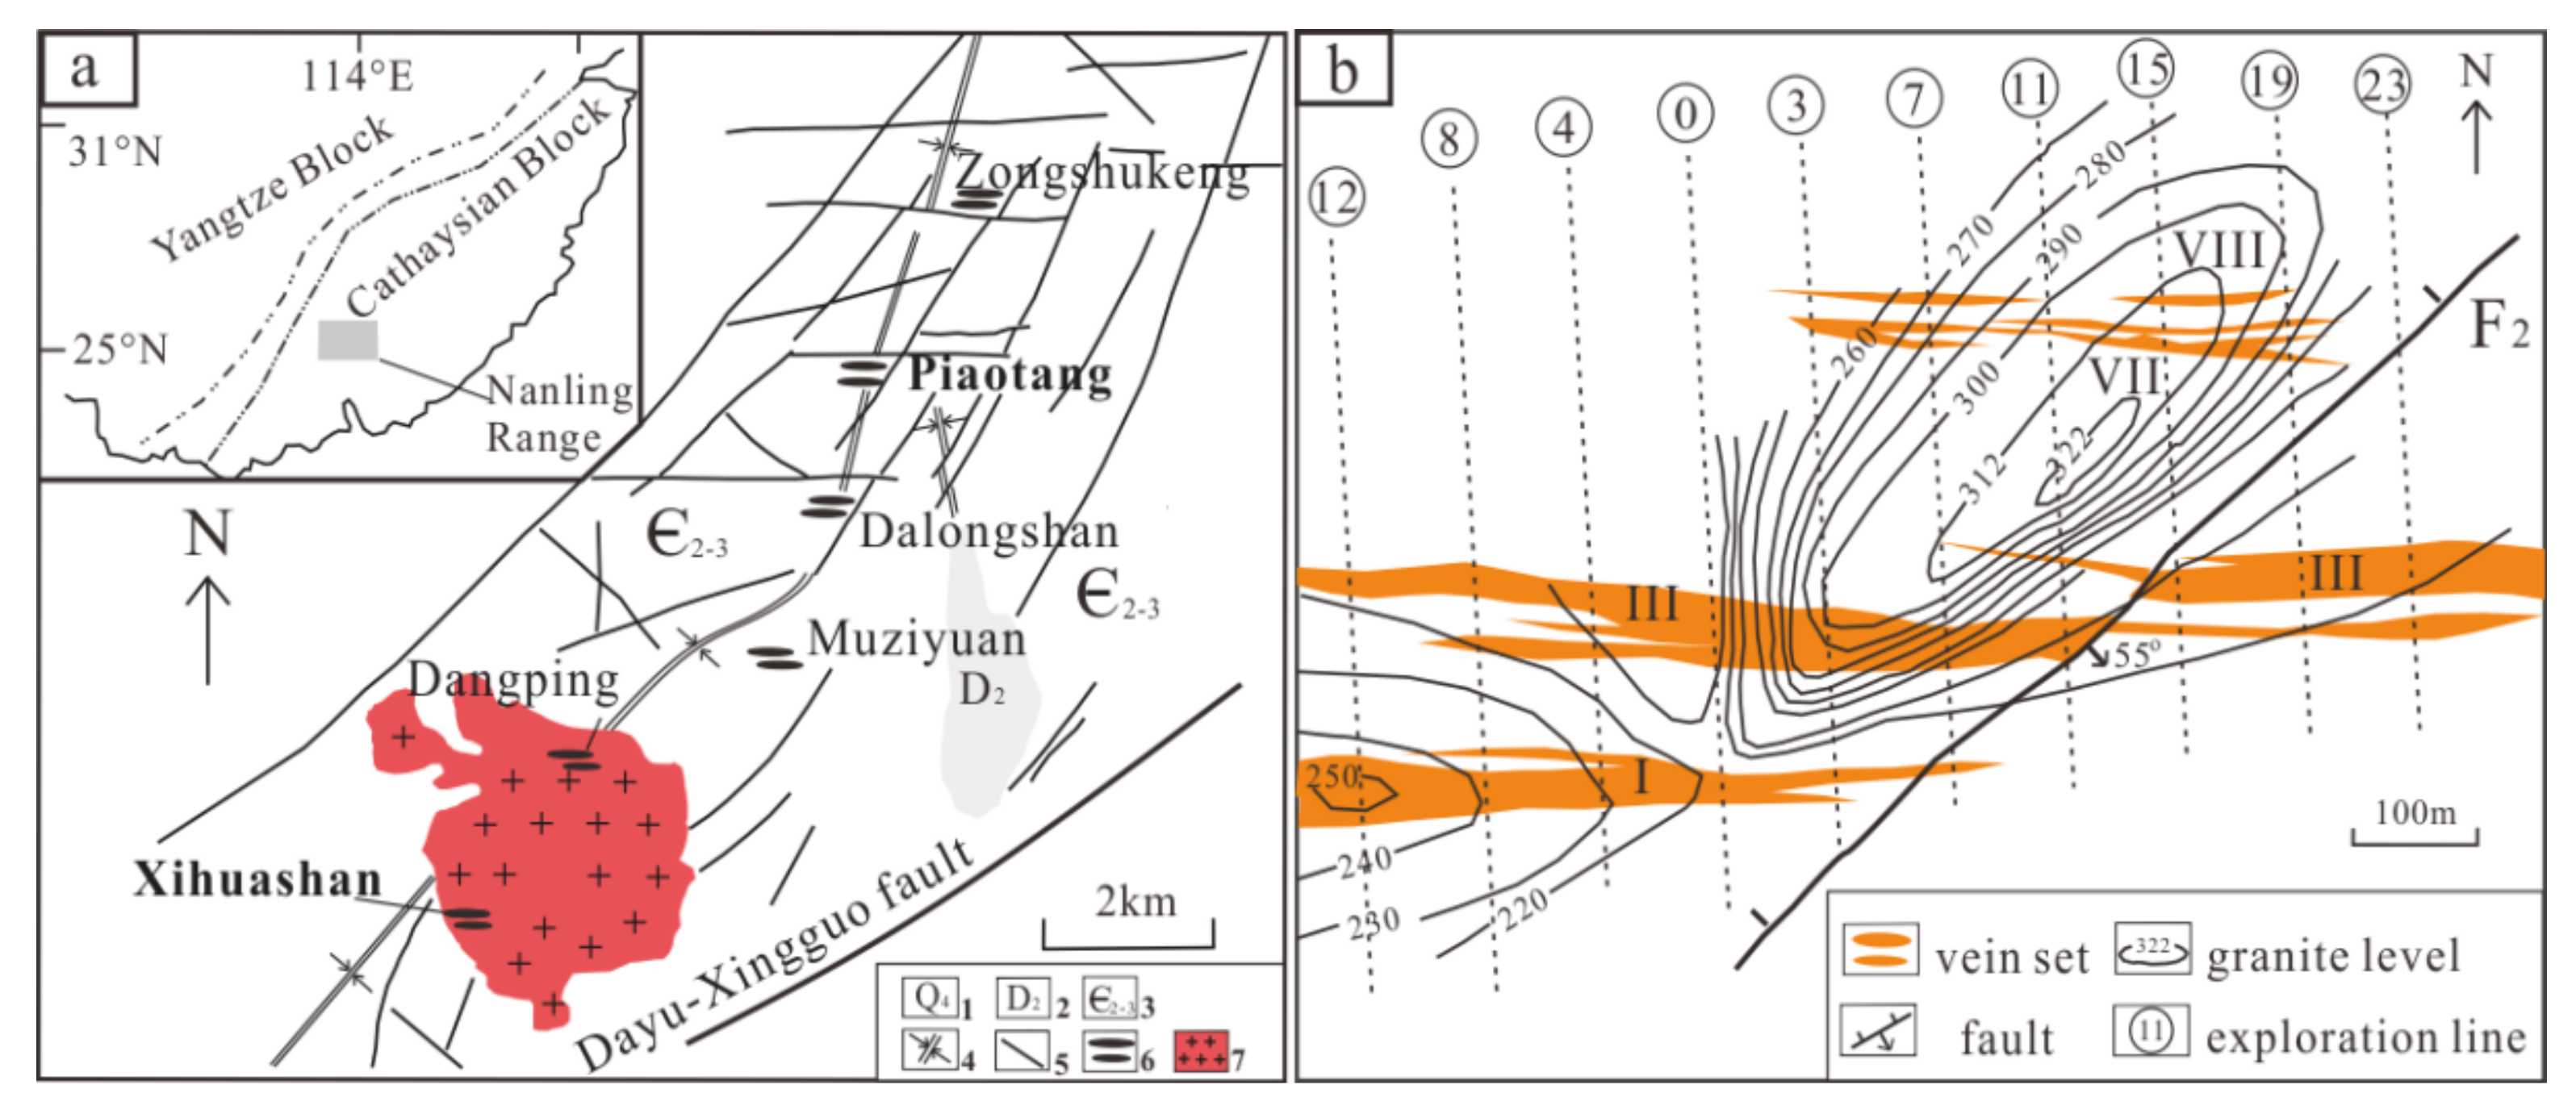
2. Geological Setting of the Piaotang Deposit

The South China tectonic block (SCB) consists of the Cathaysian Block and the southeastern margin of the Yangtze Block [3]. The SCB experienced a tectonic regime change from a Tethyan domain to a Pacific domain during the Mesozoic [2]. NE-striking extensional lithospheric belts and deep faults controlled large-scale magmatic activities and tungsten mineralization in the Nanling Range during the Late Mesozoic [3]. The Piaotang tungsten–tin deposit is a large–scale vein–type tungsten polymetallic deposit in this region and is located in the same W–Sn mineralization belt with the Xihuashan tungsten deposit (Figure 2a). The Piaotang deposit has a WO3 reserve of 69,858 tonnes with an average grade of 0.20% and a tin reserve of 45,520 tonnes with an average grade of 0.13% [29].
The Piaotang deposit is hosted by the Middle–Upper Cambrian metamorphosed sandstones, slates, and a small amount of siliceous slates (Figure 2). The magmatic rocks in Piaotang include quartz diorite and biotite granite. The quartz diorite is exposed at the northeast of the deposit and it was dated at 439 ± 2 Ma by single zircon U–Pb method [32]. Metamorphism is not developed at the contact zones between the diorite and its host rocks. The medium–fine grained biotite granite occurs below the level of 320 m (see the contour lines in Figure 2b). This granite is enriched with respect to Si, K, Al, and depleted with respect to Ti, Mg, Fe, Ca, Sr, Ba [32], and it was dated at 161.8 ± 1 Ma [29] and 158 ± 3 Ma [32] by single zircon U–Pb method. Hornfels is well developed at the contact zones between the biotite granite and its wallrock and greisenization occurs above the apex of the biotite granite.
Most veins are hosted by metamorphosed sandstones and a few thick veins (>1 m thick) and at deeper levels are hosted by the biotite granite (see the granite levels in Figure 2b). Alteration is characterized by a mineral assemblage of quartz–muscovite–biotite–tourmaline in sandstone, and quartz–muscovite±fluorite (greisens) in granite [33]. Ore minerals are wolframite, cassiterite, and some amount of molybdenite, bismuthinite, chalcocite, galena, and sphalerite, and gangue minerals include quartz, feldspar, beryl, fluorite, and muscovite [34].
The mineralization has muscovite 40Ar–39Ar ages of 152 ± 1.9 Ma [29] and 158.9 ± 1.4 Ma [35]. These two ages agree with two wolframite U–Pb ages (152.1 ± 0.9 Ma and 159.5 ± 1.3 Ma) recently reported by [36]. The latter age is also consistent with 158.6 ± 2.9 Ma and 159.5 ± 1.5 Ma dated by cassiterite 40Ar–39Ar and cassiterite U–Pb methods, respectively [34,37]. Hydrogen, oxygen, and carbon isotope data indicate that the ore fluids had a magmatic origin at the early mineralization stage, and then were mixed with meteoric water at late stages [33,38,39]. He–Ar isotopic analysis suggests that the ore fluids were mainly derived from crustal fluids [40]. The mineralizing fluids belong to H2O–NaCl systems with salinities generally less than 10 wt% NaCl equiv. The homogenization temperatures of the fluid inclusions in wolframite and cassiterite range from 300 to 400 °C, higher than those in quartz (150–300 °C) [41,42,43].
The quartz veins are divided into several vein sets by their locations (see the Roman characters in Figure 2b and Figure 3a), of which the locally called III vein set is largest in scale and holds the majority of the reserves. It can be seen from the vertical profile shown in Figure 3 that the veins are generally thin at shallower levels and converge into a few thick veins at deeper levels. The veins are east–west striking and extend approximately 2000 m along their striking. Our measurements at the levels from 328 m to 676 m suggest that the north-dipping veins are more abundant than those dipping south (Figure 4a). As the vein–bearing structures, joints are well developed in the Piaotang deposit. Similar to the quartz veins, the optimally–oriented joints from the 616 m to 268 m levels are also north-dipping (Figure 4b).

3. Data and Analytical Methods

The five–floor zonation in vein–type tungsten deposits is essentially a morphological zonation of quartz veins. A total of 1515 vein thickness data (285 data at the 676 m level, 906 data at the 448 m level, and 324 data at the 328 m level) were measured from the III vein set between the 3rd and 19th exploration lines (Figure 2). These veins approximately cover the vertical range from the veinlet zone to the thick vein zone shown in Figure 1. The vein thickness data at higher levels are absent because of unsafe access conditions. The III vein set at the 268 m level (the lowest level at present) only has a few thick veins, so the vein thickness data at the 268 m level were not considered. The true vein thickness was obtained from the value measured along the scan line multiplied by the sine of the vein’s dip angle. The minimum vein thickness recorded at each level was 1 cm. These vein thickness data, together with the corresponding WO3 and Sn content data (309 data at the 676 m level, 638 data at the 448 m level, and 177 data at the 328 m level) in [44] were fitted by power law and Weibull distributions to analyze the vertical trend of vein morphology and W–Sn mineralization. The WO3 contents were determined using the ammonium tungstate igniting gravimetric method and the thiocyanate colorimetry method (WO3 < 2%) [44]. The Sn contents were analyzed by the aluminum sheet iodometric method and aspectrophotometric method (Sn < 0.05%) [44]. Then, the micro-scale growth history of quartz veins at different levels was reconstructed by using SEM–CL imaging. Finally, in situ trace element concentrations of quartz were measured using LA–ICP–MS to find the connections between trace elements and CL intensity.

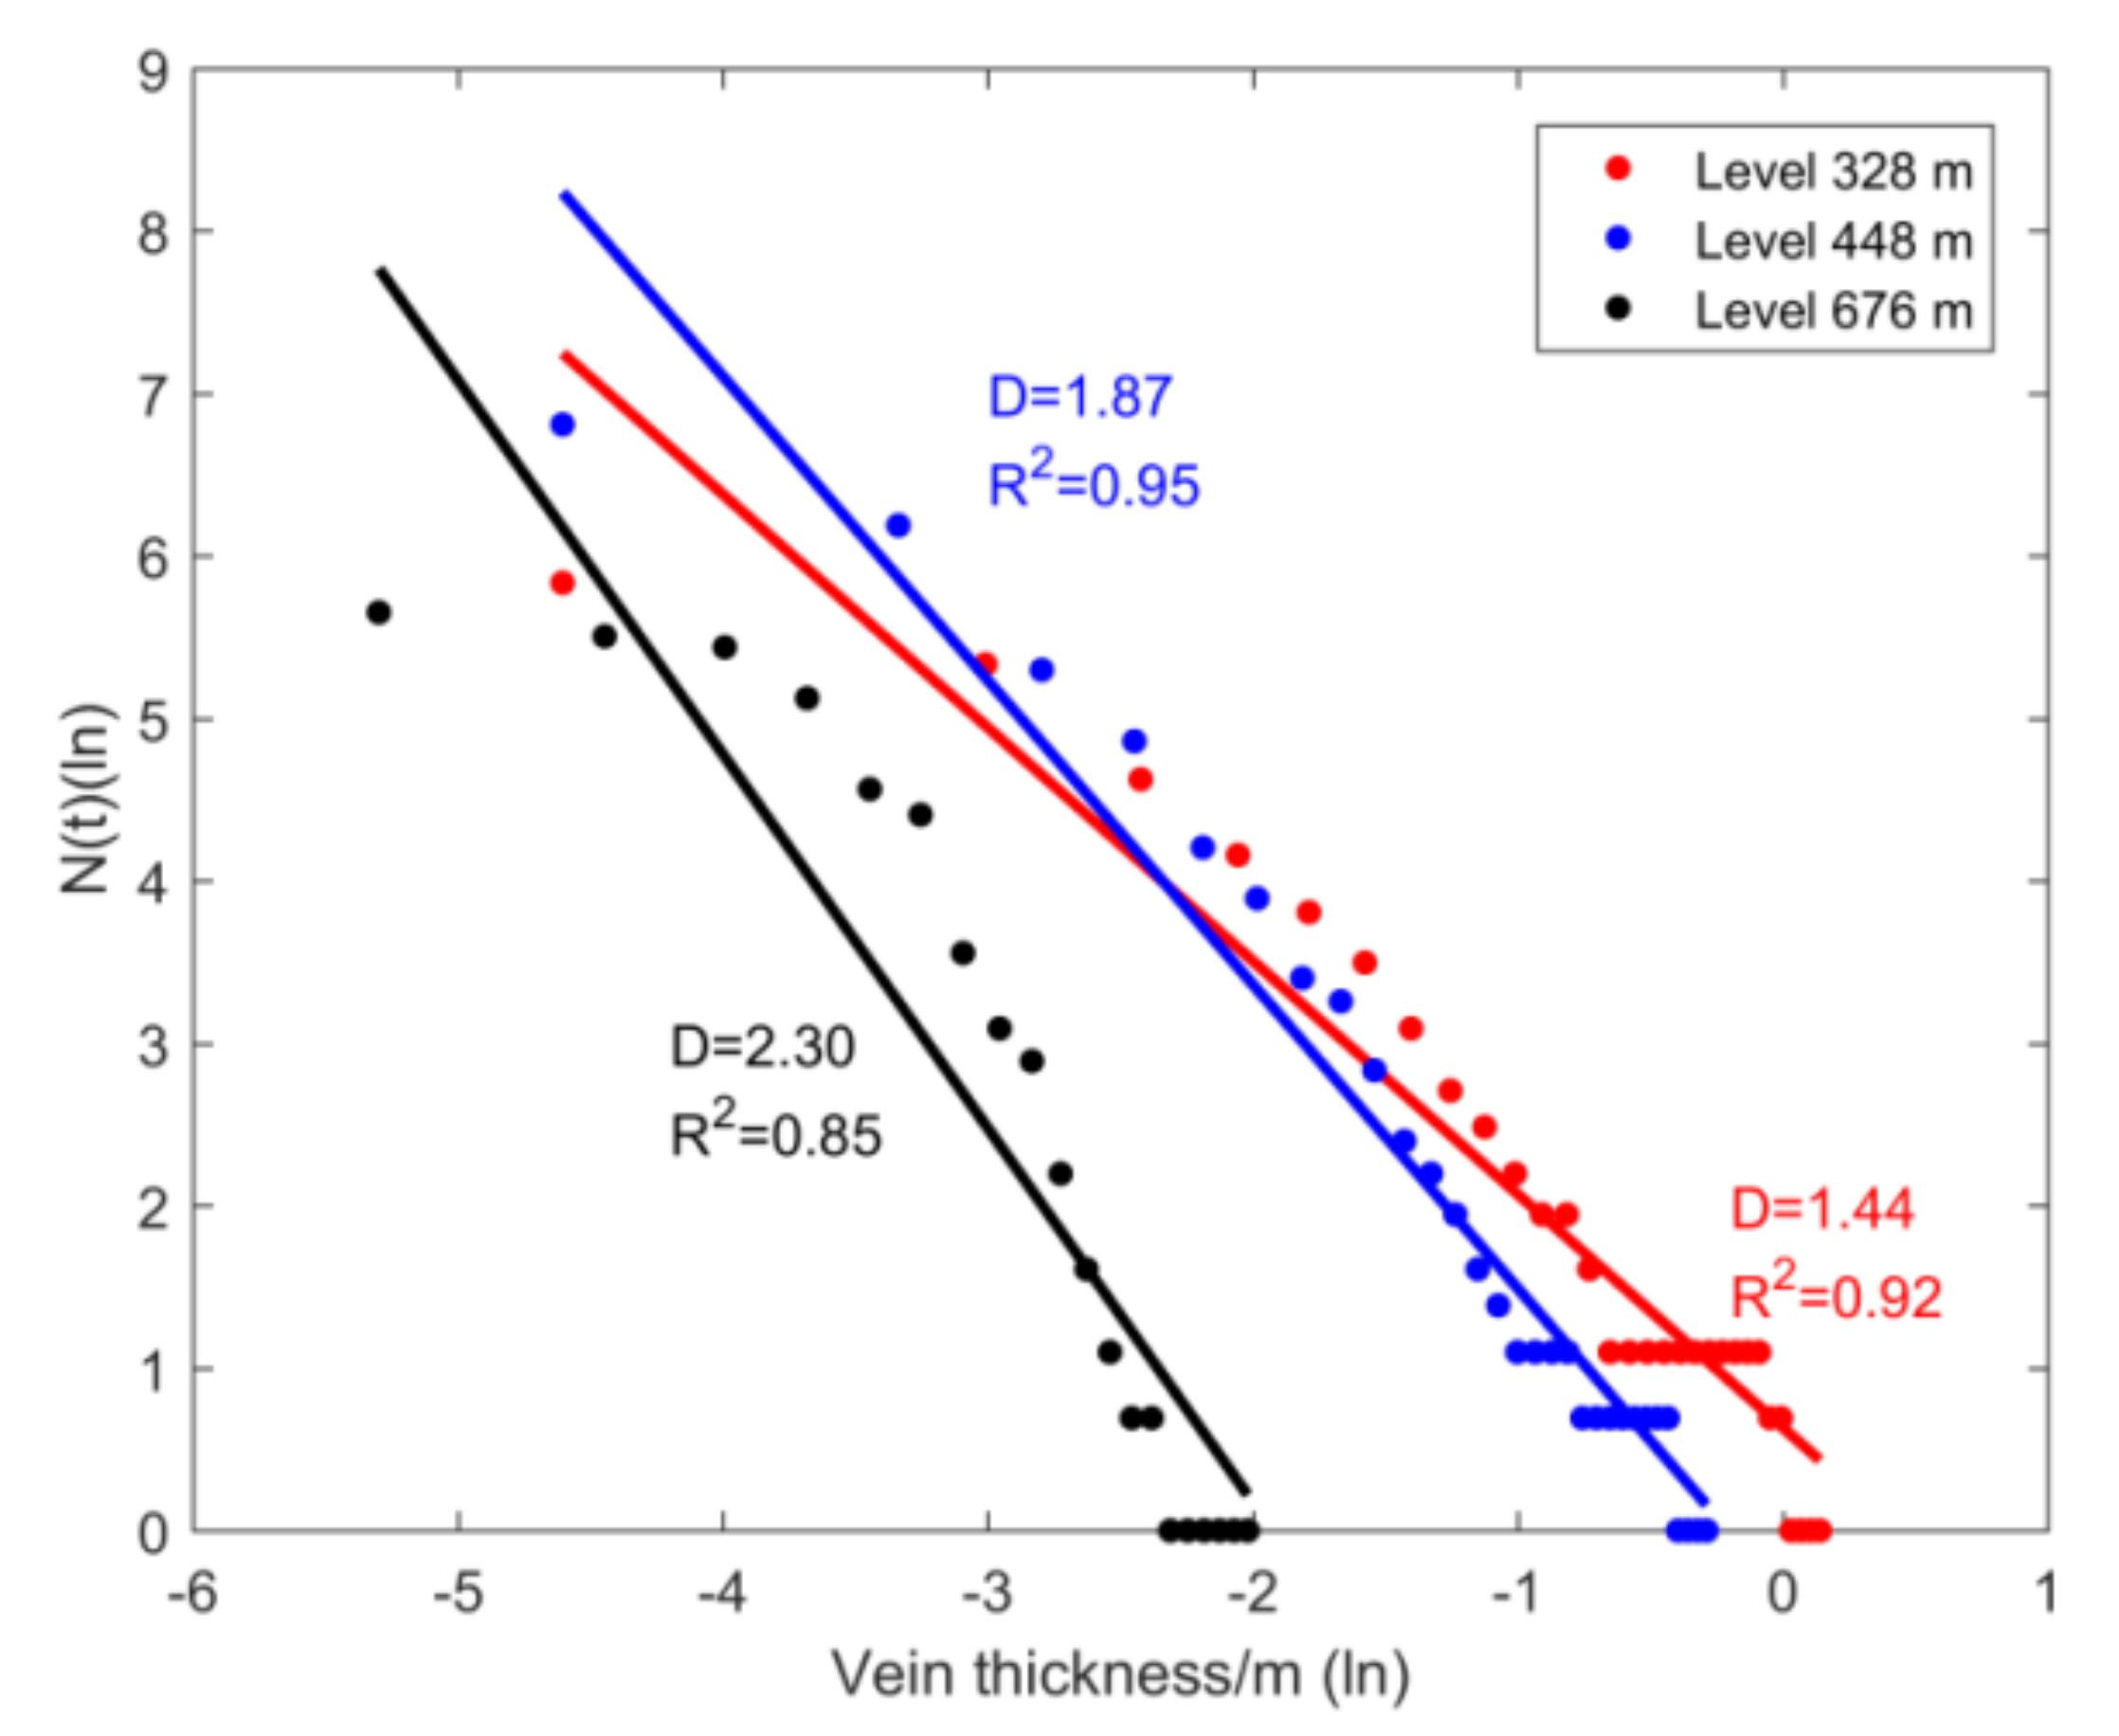
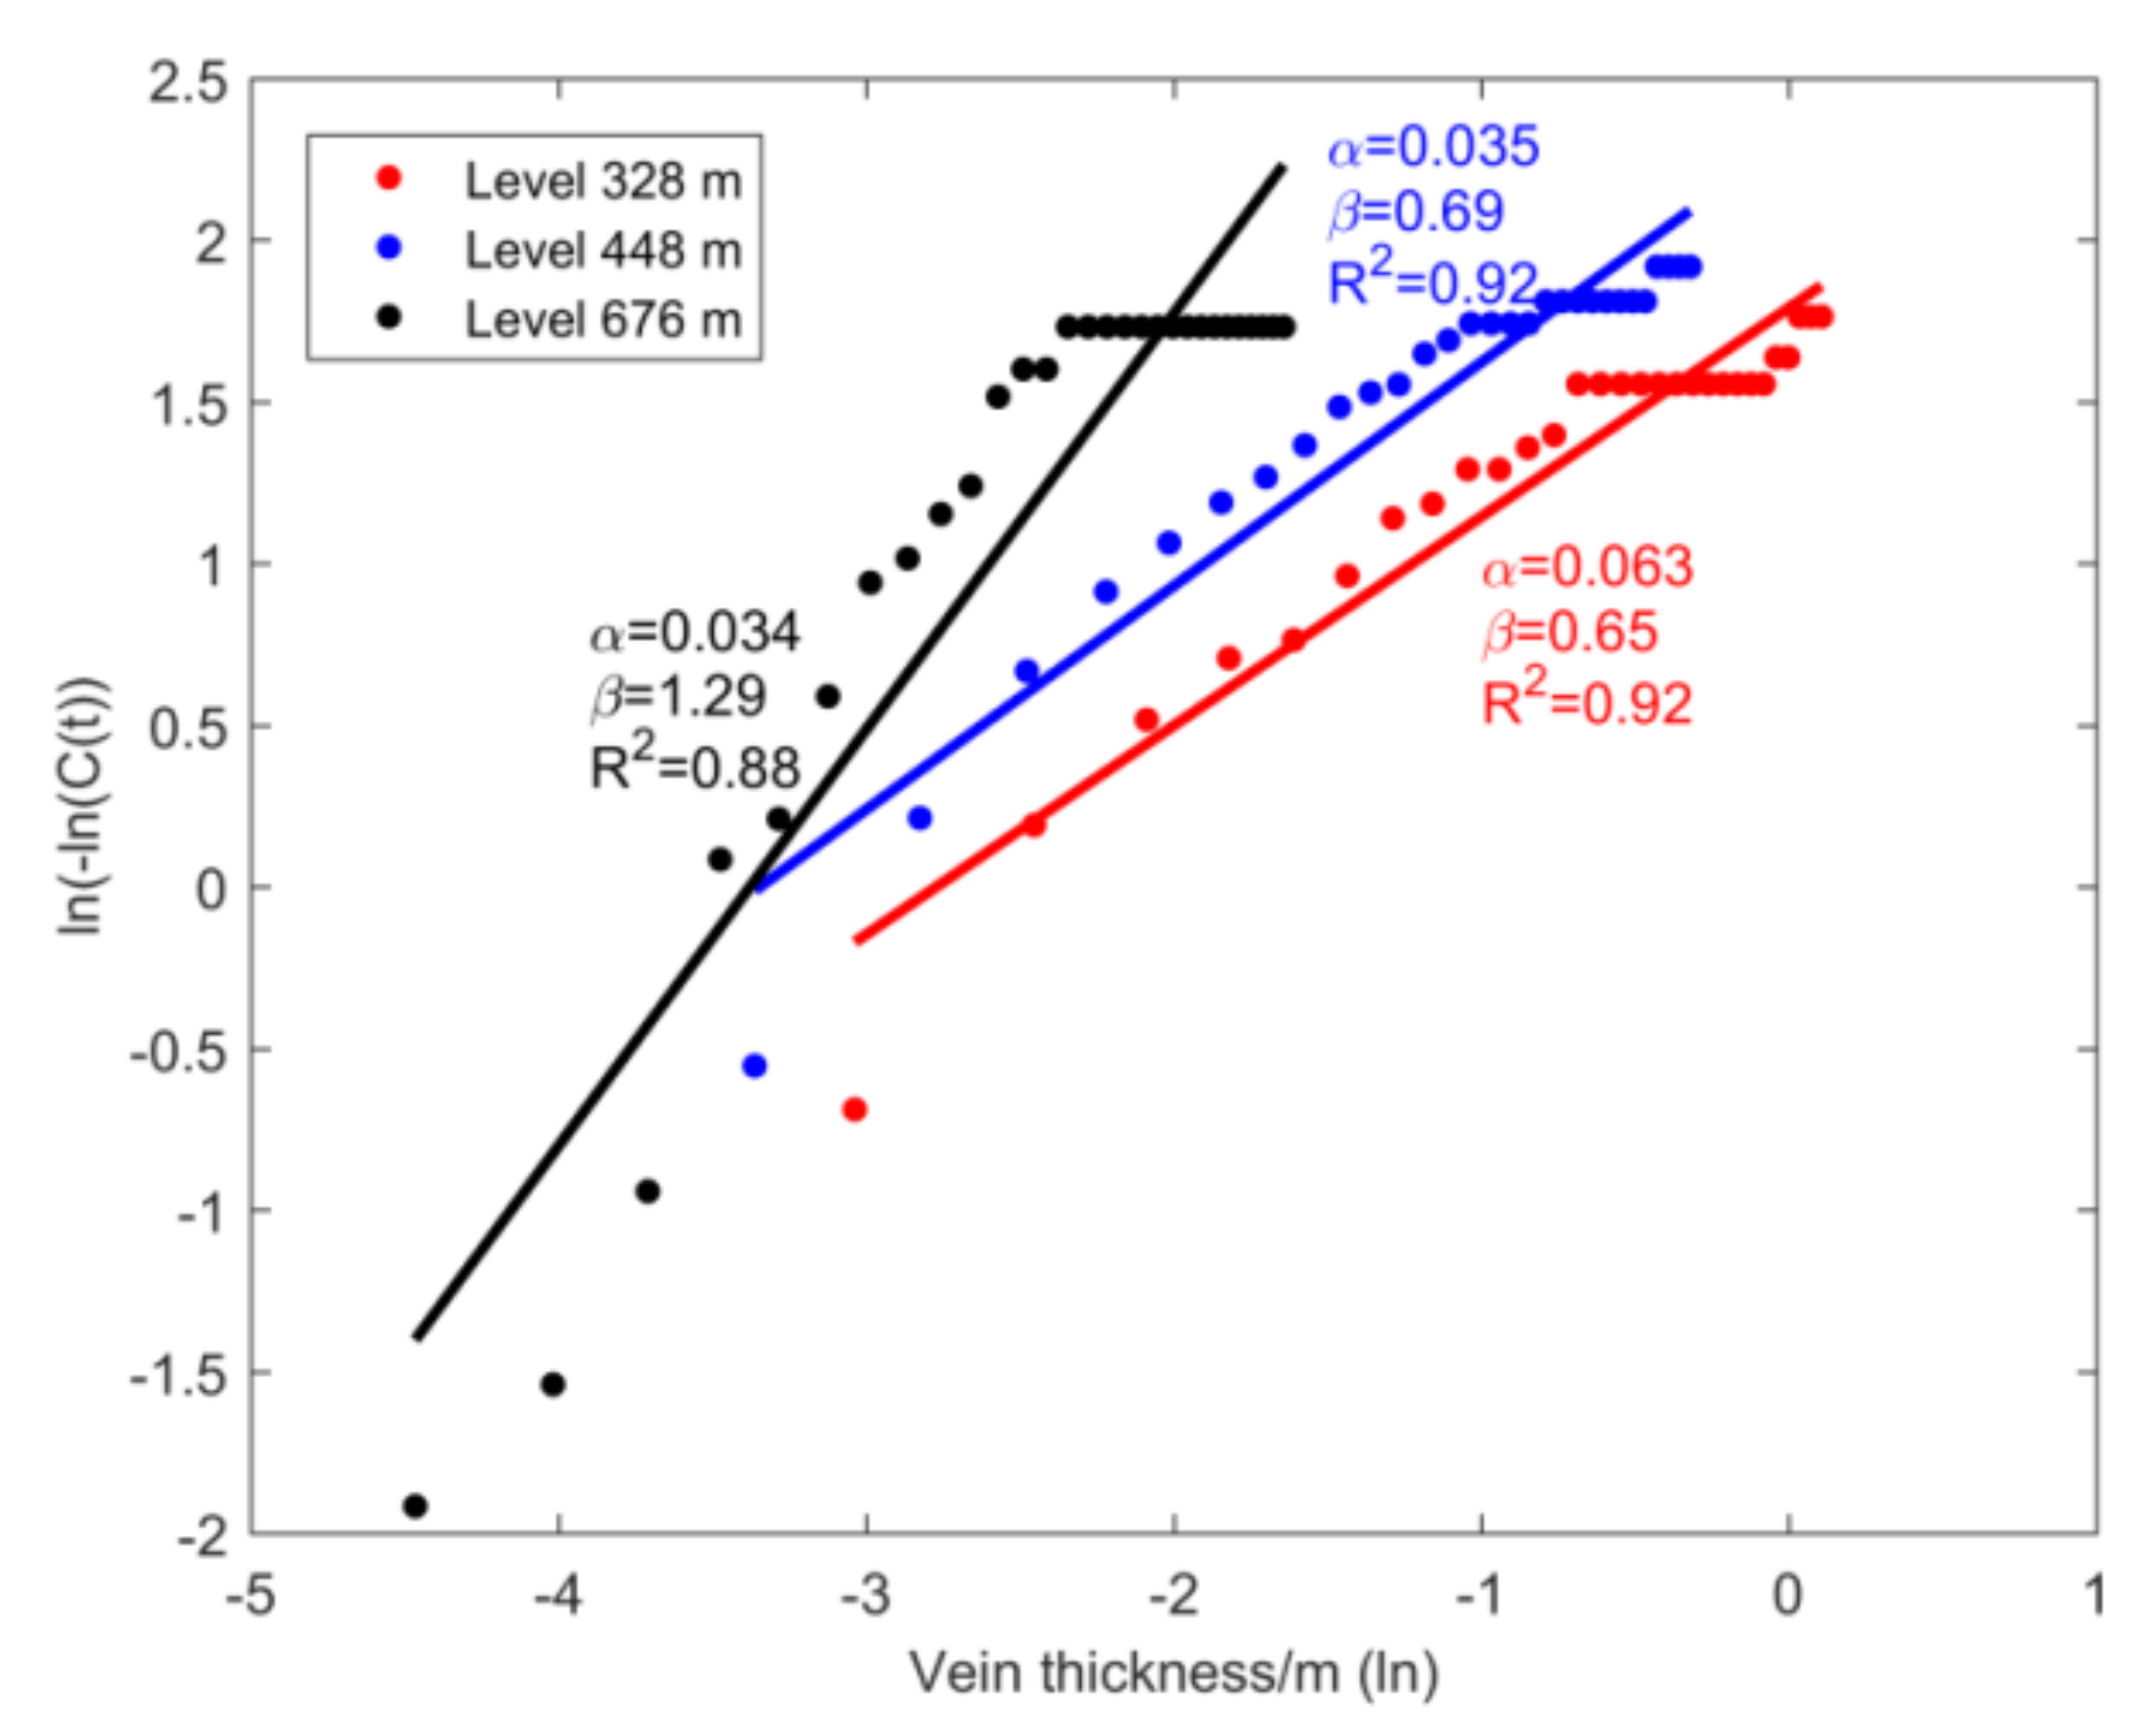
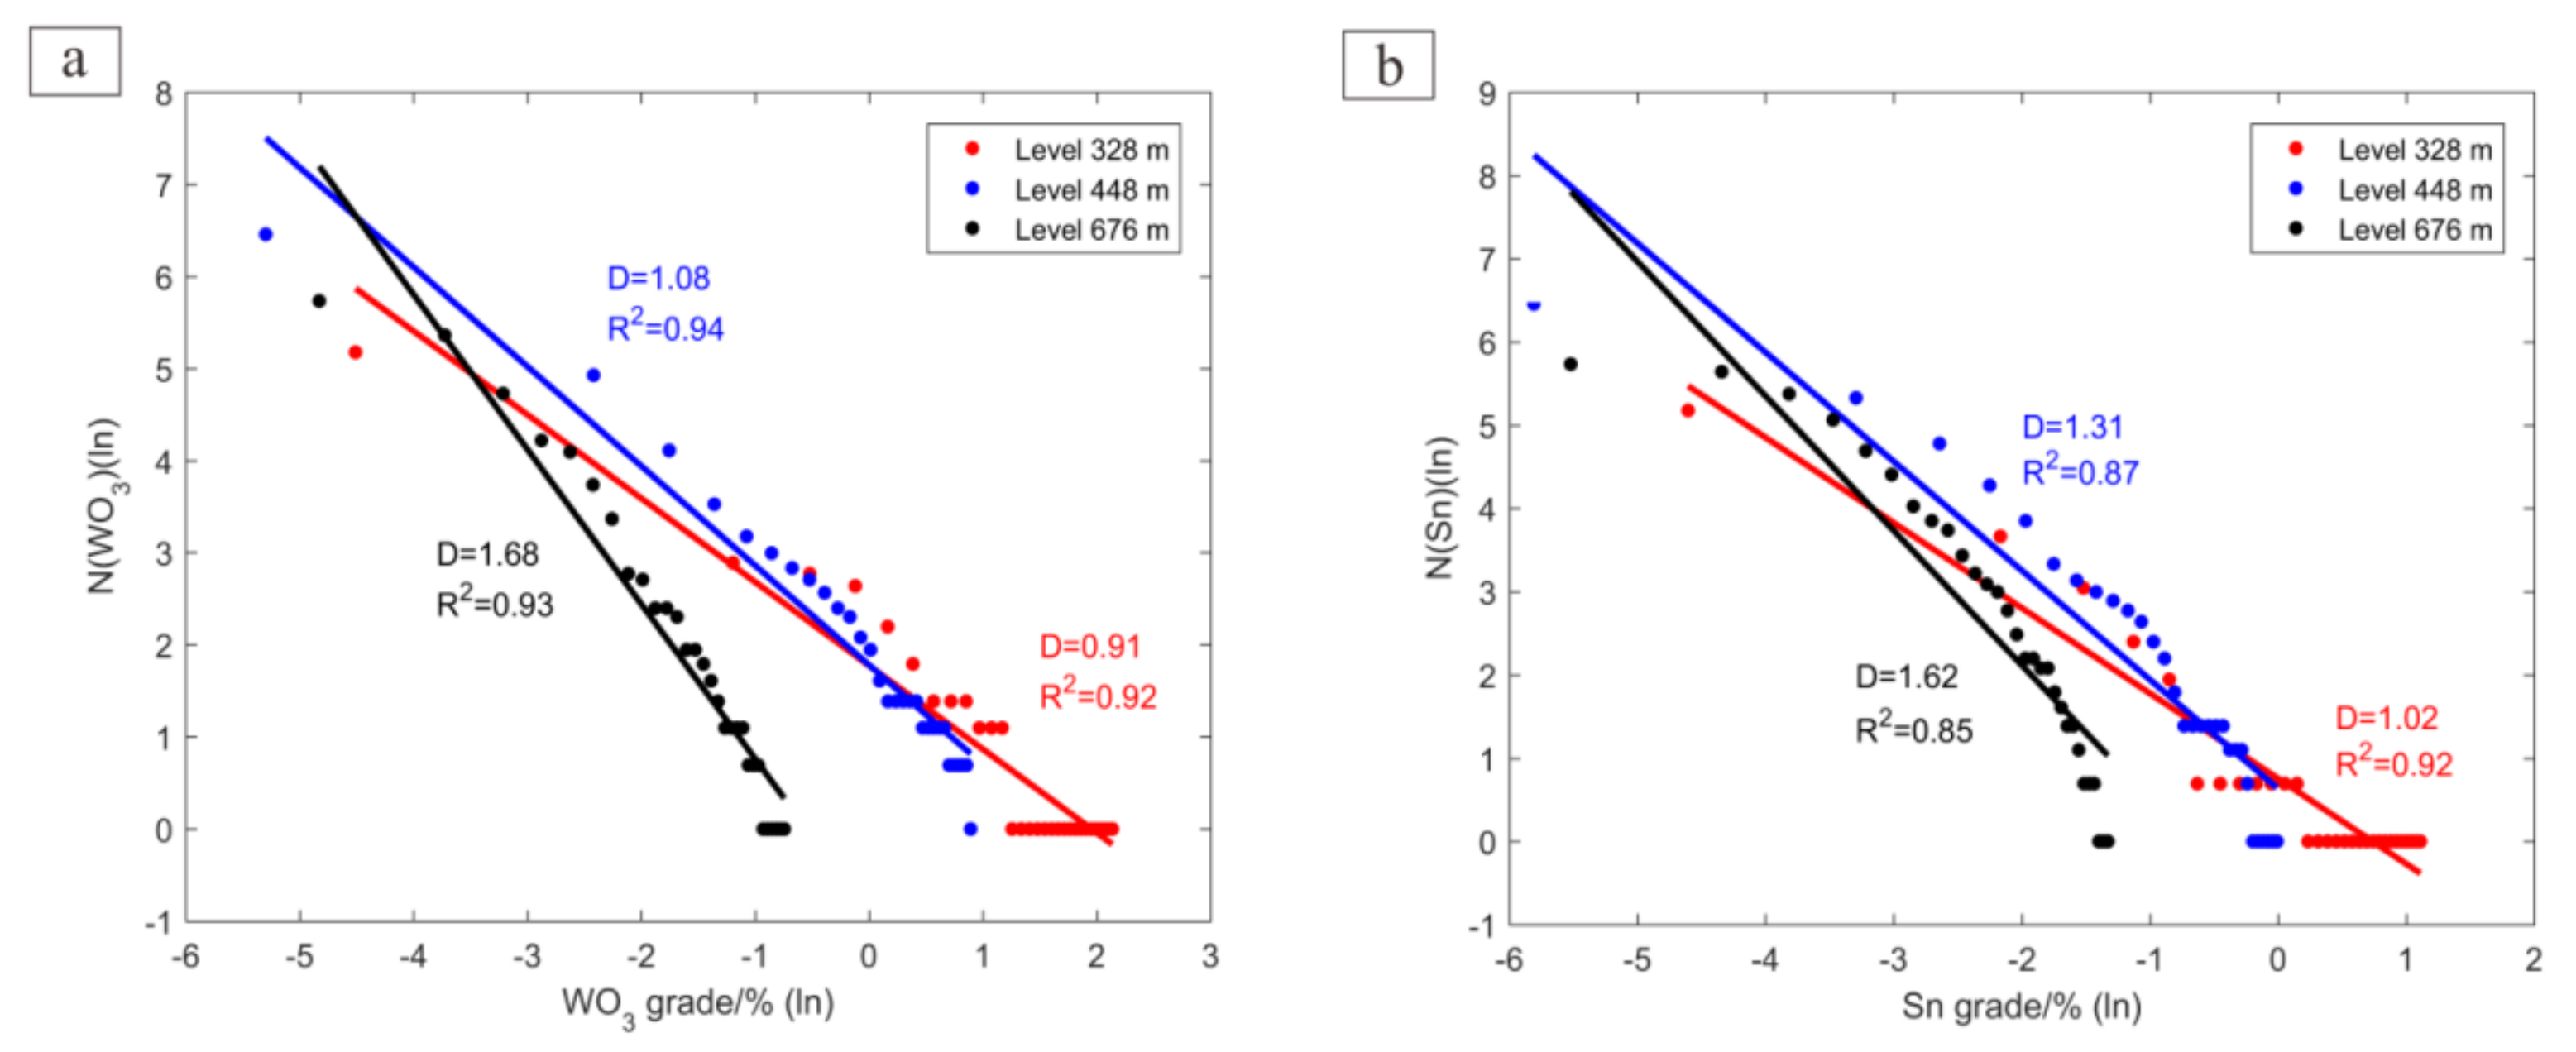
3.1. Power Law and Weibull Distributions of Vein Thickness and Ore Grade

Vein thickness distribution is a powerful tool to characterize the evolution of vein systems and aid in exploration for hydrothermal ore deposits [45,46,47,48,49,50,51] and oil reservoirs [52]. One of the most broadly discussed distributions is the power law distribution, i.e., fractals [53,54,55]. The concept of fractal was first proposed by Mandelbrot [56] who found that the coast of Britain are highly involved curves and statistically self–similar, i.e., the parts similar to the whole. Fractals were then found to be widespread in natural phenomenon [57,58,59]. For hydrothermal vein systems, [46] identified that stratabound vein systems conform to non-power law thickness distributions, whereas the vein thickness of non–stratabound vein systems follows a power law distribution. The latter is supported by later studies in hydrothermal vein systems elsewhere [48,60,61,62,63]. Therefore, the vein thickness data of the Piaotang deposit were fitted to a power law distribution as follows [64]:
N t t D t ,
where t represents the vein thickness, N t is the number of veins of size t or larger, and D t is the fractal dimension that measures the degree of irregularity based on self–similarity. The slope of the log–log plot of N t against t is the opposite number of D t . Low values of D t mean that the vein network has high connectivity [46,49].
All materials (e.g., rocks) have flaws such as pores and microcracks, and the largest flaw exerts a critical influence on fracturing [65]. The flaw size distribution of rocks often satisfies a Weibull distribution and Weibull statistics is widely used for characterizing the fracturing process of rocks [66,67,68]. The Weibull distribution is also used to relate the thickness of veins or dykes to the strength of their host rocks [60,69]. For example, [69] proposed from a large amount of dyke thickness data that dyke thickness was mainly controlled by host–rock strength. The two-parameter cumulative distribution of the Weibull distribution follows the following equation [69]:
C x = e x α β ,
where C x is the cumulative distribution of the object x (e.g., vein thickness), α is the Weibull modulus, and β is the scale parameter. For the Piaotang deposit, C t represents the cumulative distribution of vein thickness, i.e., the cumulative probability of vein thickness over or less than t. Low values of α mean that host rocks have a wide range of flaw size distribution and are weaker than those with higher values of α ; therefore, the Weibull modulus α has been used as a proxy for rock strength [69]. Moreover, the right-hand tail of flaw size can be expressed by a power law function [70]; therefore, the Weibull distribution is mechanically linked with the power law distribution. In light of the above description, the Weibull distribution parameters of the Piaotang quartz veins were also calculated in this study. The Appendix A shows the formula derivation of Equation (2) for calculating the parameters α and β .
Vein thickness is sometimes found to follow a log–normal distribution, but such a case may be caused by incomplete sampling [54]. Therefore, the log–normal distribution was not considered here.
The five–floor morphological zonation of quartz veins was proposed for deep exploration, so the links between vein thickness and ore grade should be understood. A report by [71] identified from drill data of a gold deposit in Spain that areas of higher gold grades corresponded to regions with lower fractal dimensions of vein thickness. Such a correlation between ore grade and vein thickness is also reported by later studies [48,49,60,72,73]. In [60], researchers recently found that auriferous quartz veins had lower fractal dimensions and lower Weibull modulus than barren ones. Back to the five–floor zonation, the thick vein and mixing zones are generally the most economically important zones, while other zones such as the thread vein zone are commonly barren [4]. The present research questions are whether and how vein thickness is vertically linked with ore grades in quartz veins that show a five–floor zonation. To answer these questions, the ore grade data and their corresponding vein thickness data should be analyzed together.
Metal grade distribution in ore deposits is often self–similar and also follows a power law distribution [74,75,76,77,78,79,80]. Although trace element concentrations in crustal rocks may also follow a log–normal distribution [81], the fractal dimensions of ore grade data in the Piaotang deposit were fitted to better compare the vertical trend of vein thickness and ore grade. To discriminate the fractal dimension of vein thickness D t , the fractal dimensions of WO3 and Sn contents are noted by D w o 3 and D Sn , respectively. Low values of D w o 3 and D Sn mean that vein systems are intensively mineralized [71,73].

3.2. SEM–CL Imaging and In Situ Trace Element Analysis of Quartz

Scanning electron microscope–cathodoluminescence (SEM–CL) imaging was performed in order to distinguish the growth history of quartz veins at different levels. Thin sections were cut along the direction normal to the wallrock and doubly polished to be approximately 100–200 μm thick. Thin sections were coated with a thin film of gold before imaging. SEM–CL images of quartz were acquired at Beijing SHRIMP Center on a Zeiss Merlin scanning electron microscope (SEM) equipped with a Gatan Mono CL detector under the same analytical conditions (20 kV acceleration voltage, 10–12 nA/mm beam current density and 60 s accumulation).
One CL–image captures mineral in an area of approximately 1 mm × 0.7 mm. The thin veins (1–3 cm thick) at the 448 m level were shot from one vein boundary to the other, while only a small part of thick veins (~1 m thick) at the levels of 328 m and 268 m was photographed.
After different generations of quartz were identified from their SEM–CL images, in situ trace element concentrations of each generation of quartz were analyzed at the National Research Center for Geoanalysis using a ThermoFinnigan Element II SF-ICP-MS. The positions of later generations of quartz are difficult to be located because the veins mainly consist of quartz and lack other minerals (e.g., sulfides) that can be used as markers. To avoid mixing the two generations of quartz, homogeneous CL–bright and CL–dark areas were chosen for measurements. A New Wave UP 213 Laser ablation system was used at an energy density of 12 J/cm2, a 10 Hz repetition rate, and a beam size of 40 µm. Each analysis lasted for 80 s, including a 20 s background acquisition followed by a 40 s data acquisition during ablation, and a 20s washout time. The elements measured include Li (4.0 ppm), B (4.7 ppm), Na2O (21.0 ppm), MgO (5.8 ppm), Al2O3 (24.2 ppm), SiO2 (4506.9 ppm), P2O5 (55.2 ppm), K2O (24.2 ppm), Sc (0.052 ppm), TiO2 (0.79 ppm), Cr (1.7 ppm), MnO (0.22 ppm), FeO (t) (16.75 ppm), Ni (1.0 ppm), Ge (0.55 ppm), and As (0.19 ppm), and the value in parentheses is the detection limit of the corresponding element. Every 10–sample analyses were followed by analyzing three glass reference materials NIST612, NIST610, and KL2-G. Element concentrations were calculated using matrix normalization with Si as the internal standard [82]. The precision and accuracy of the analyses are better than 10% for all elements based on the replicate analyses of the reference materials.

4. Results

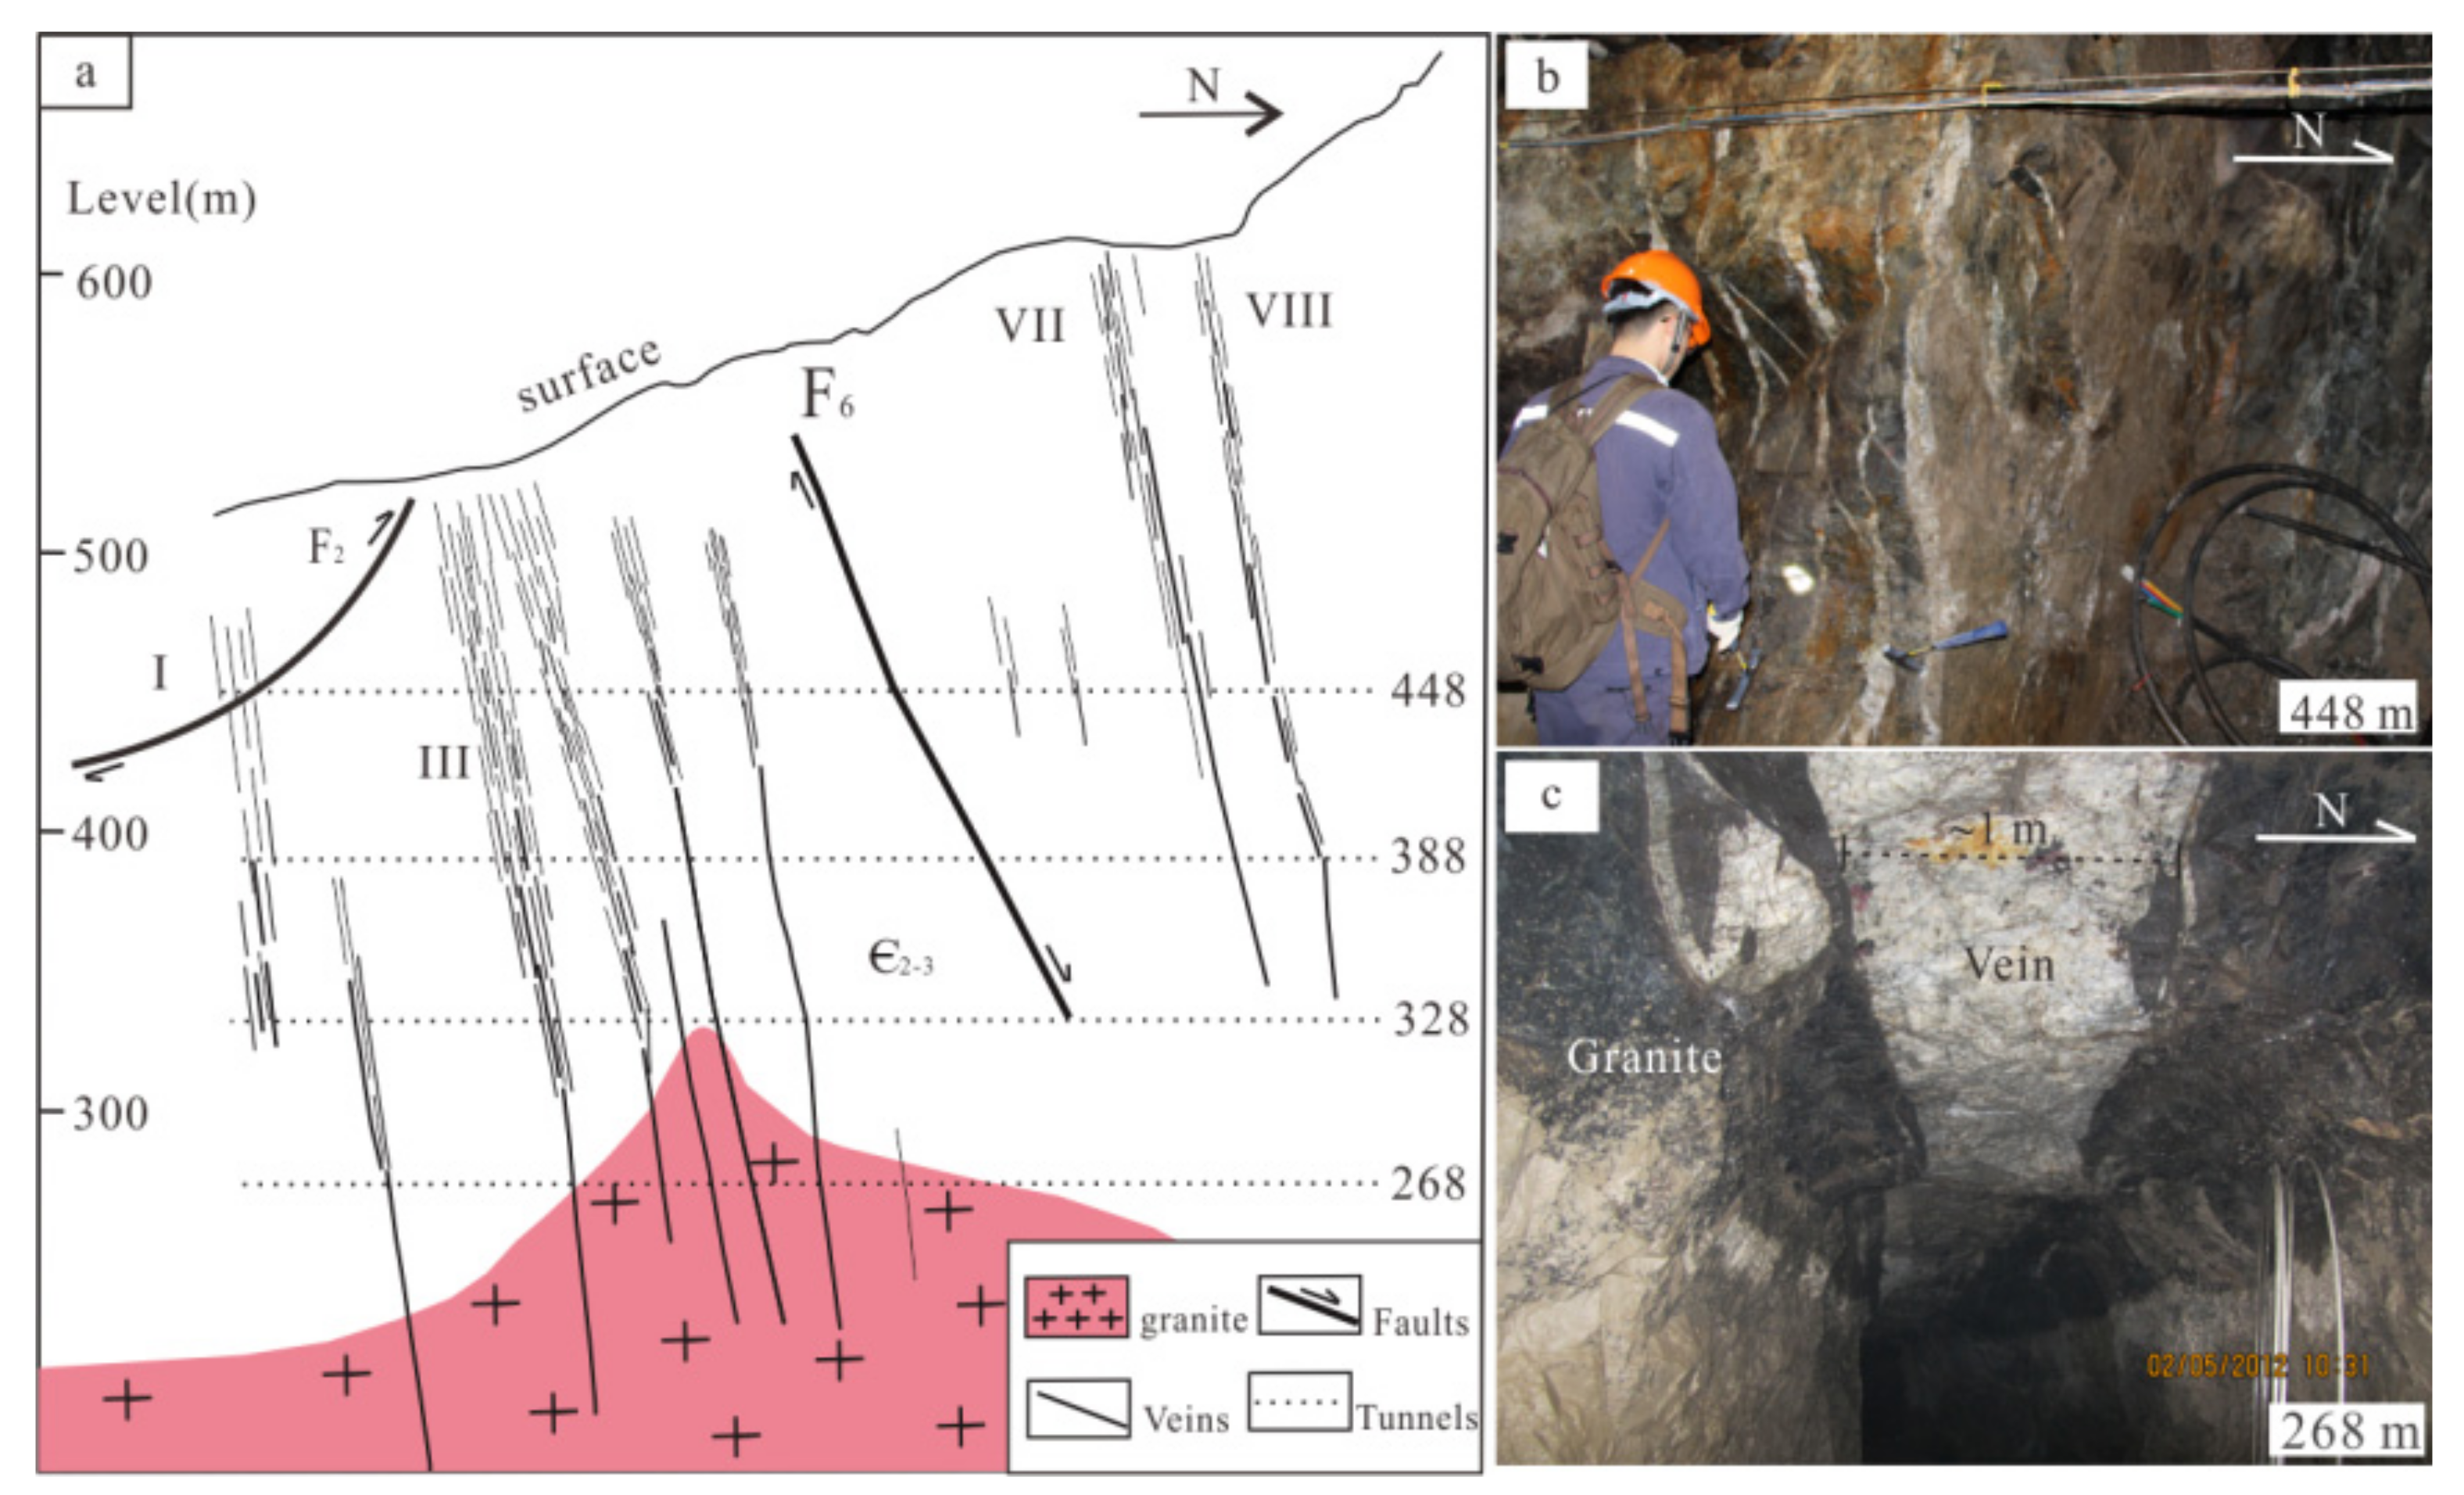
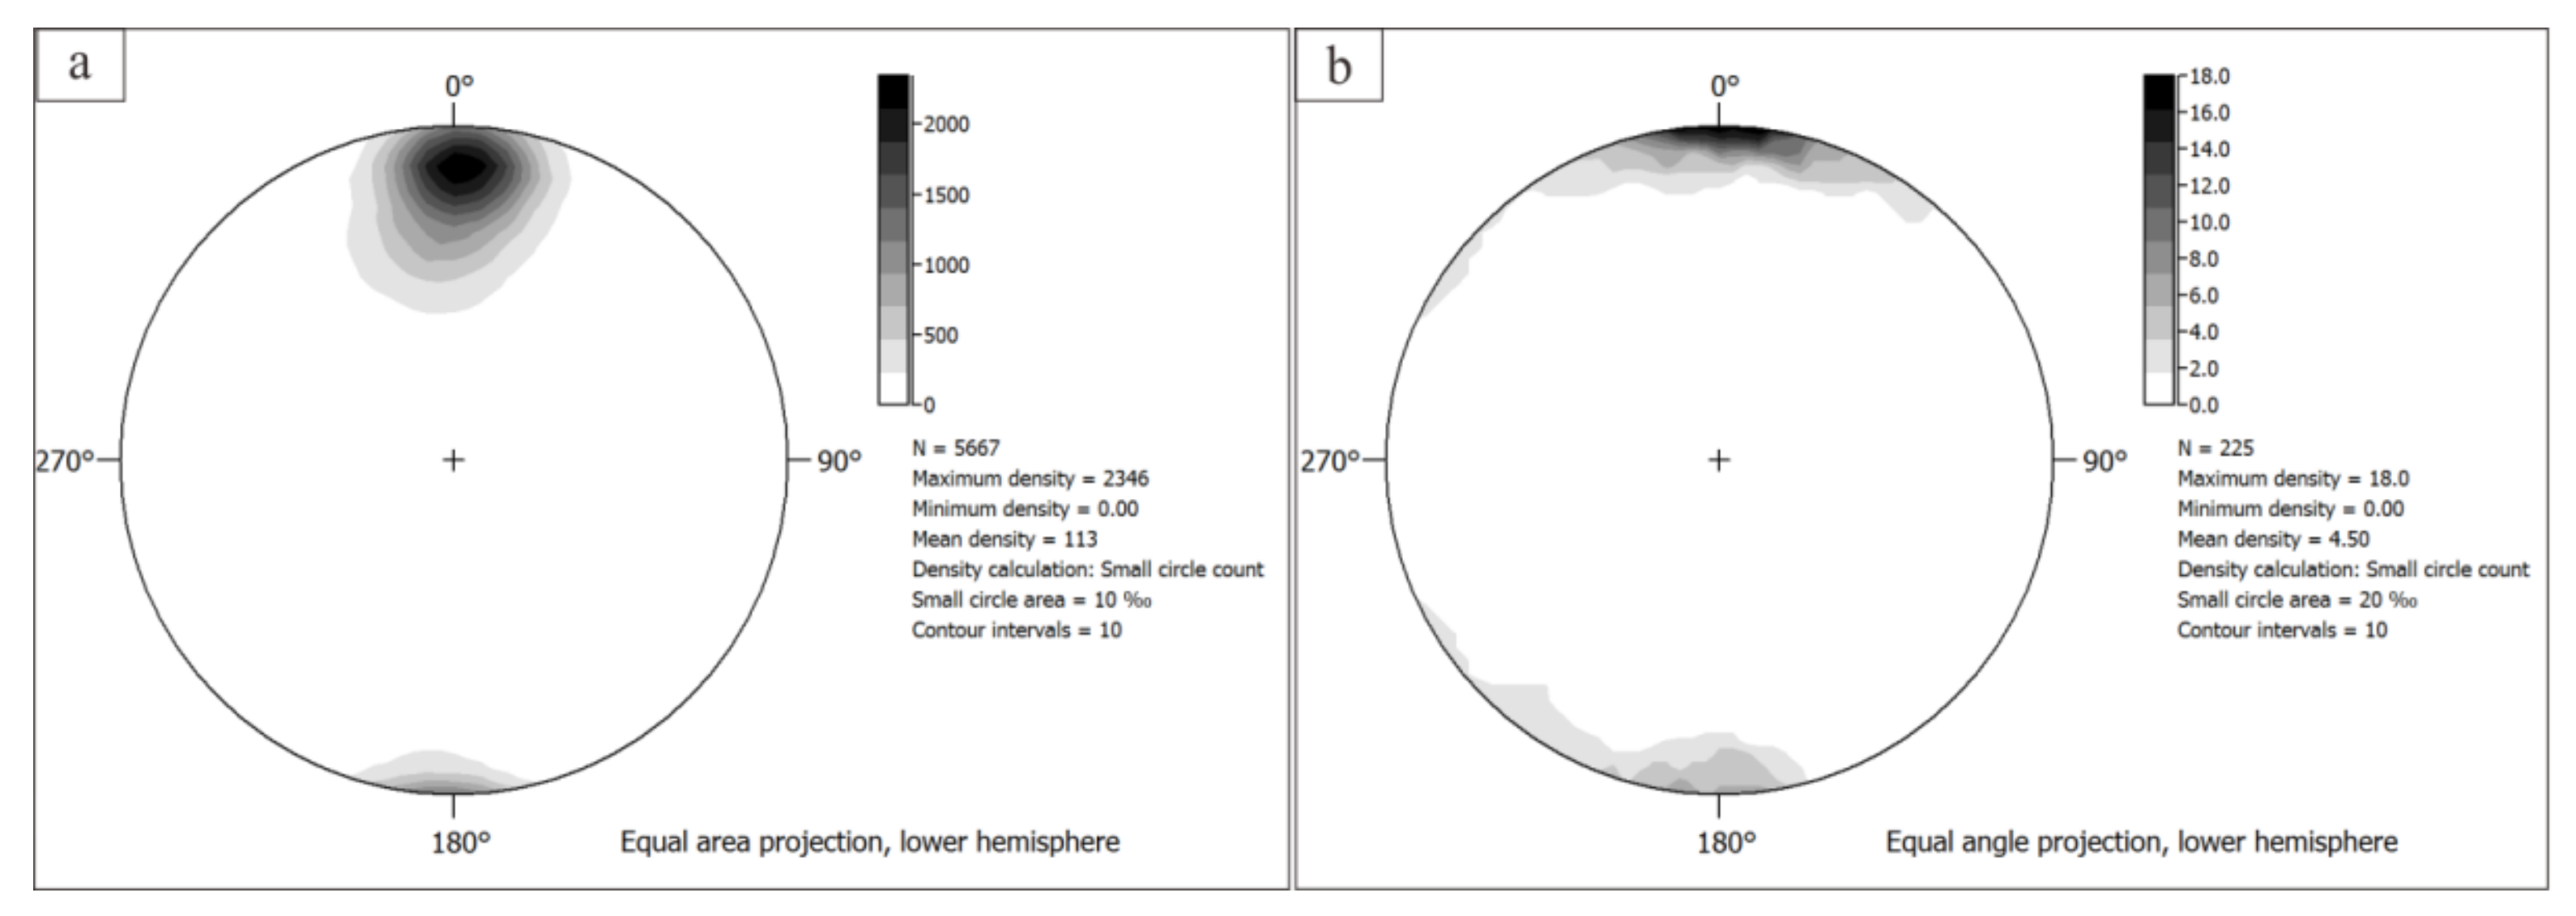
4.1. Vein Morphology in Piaotang
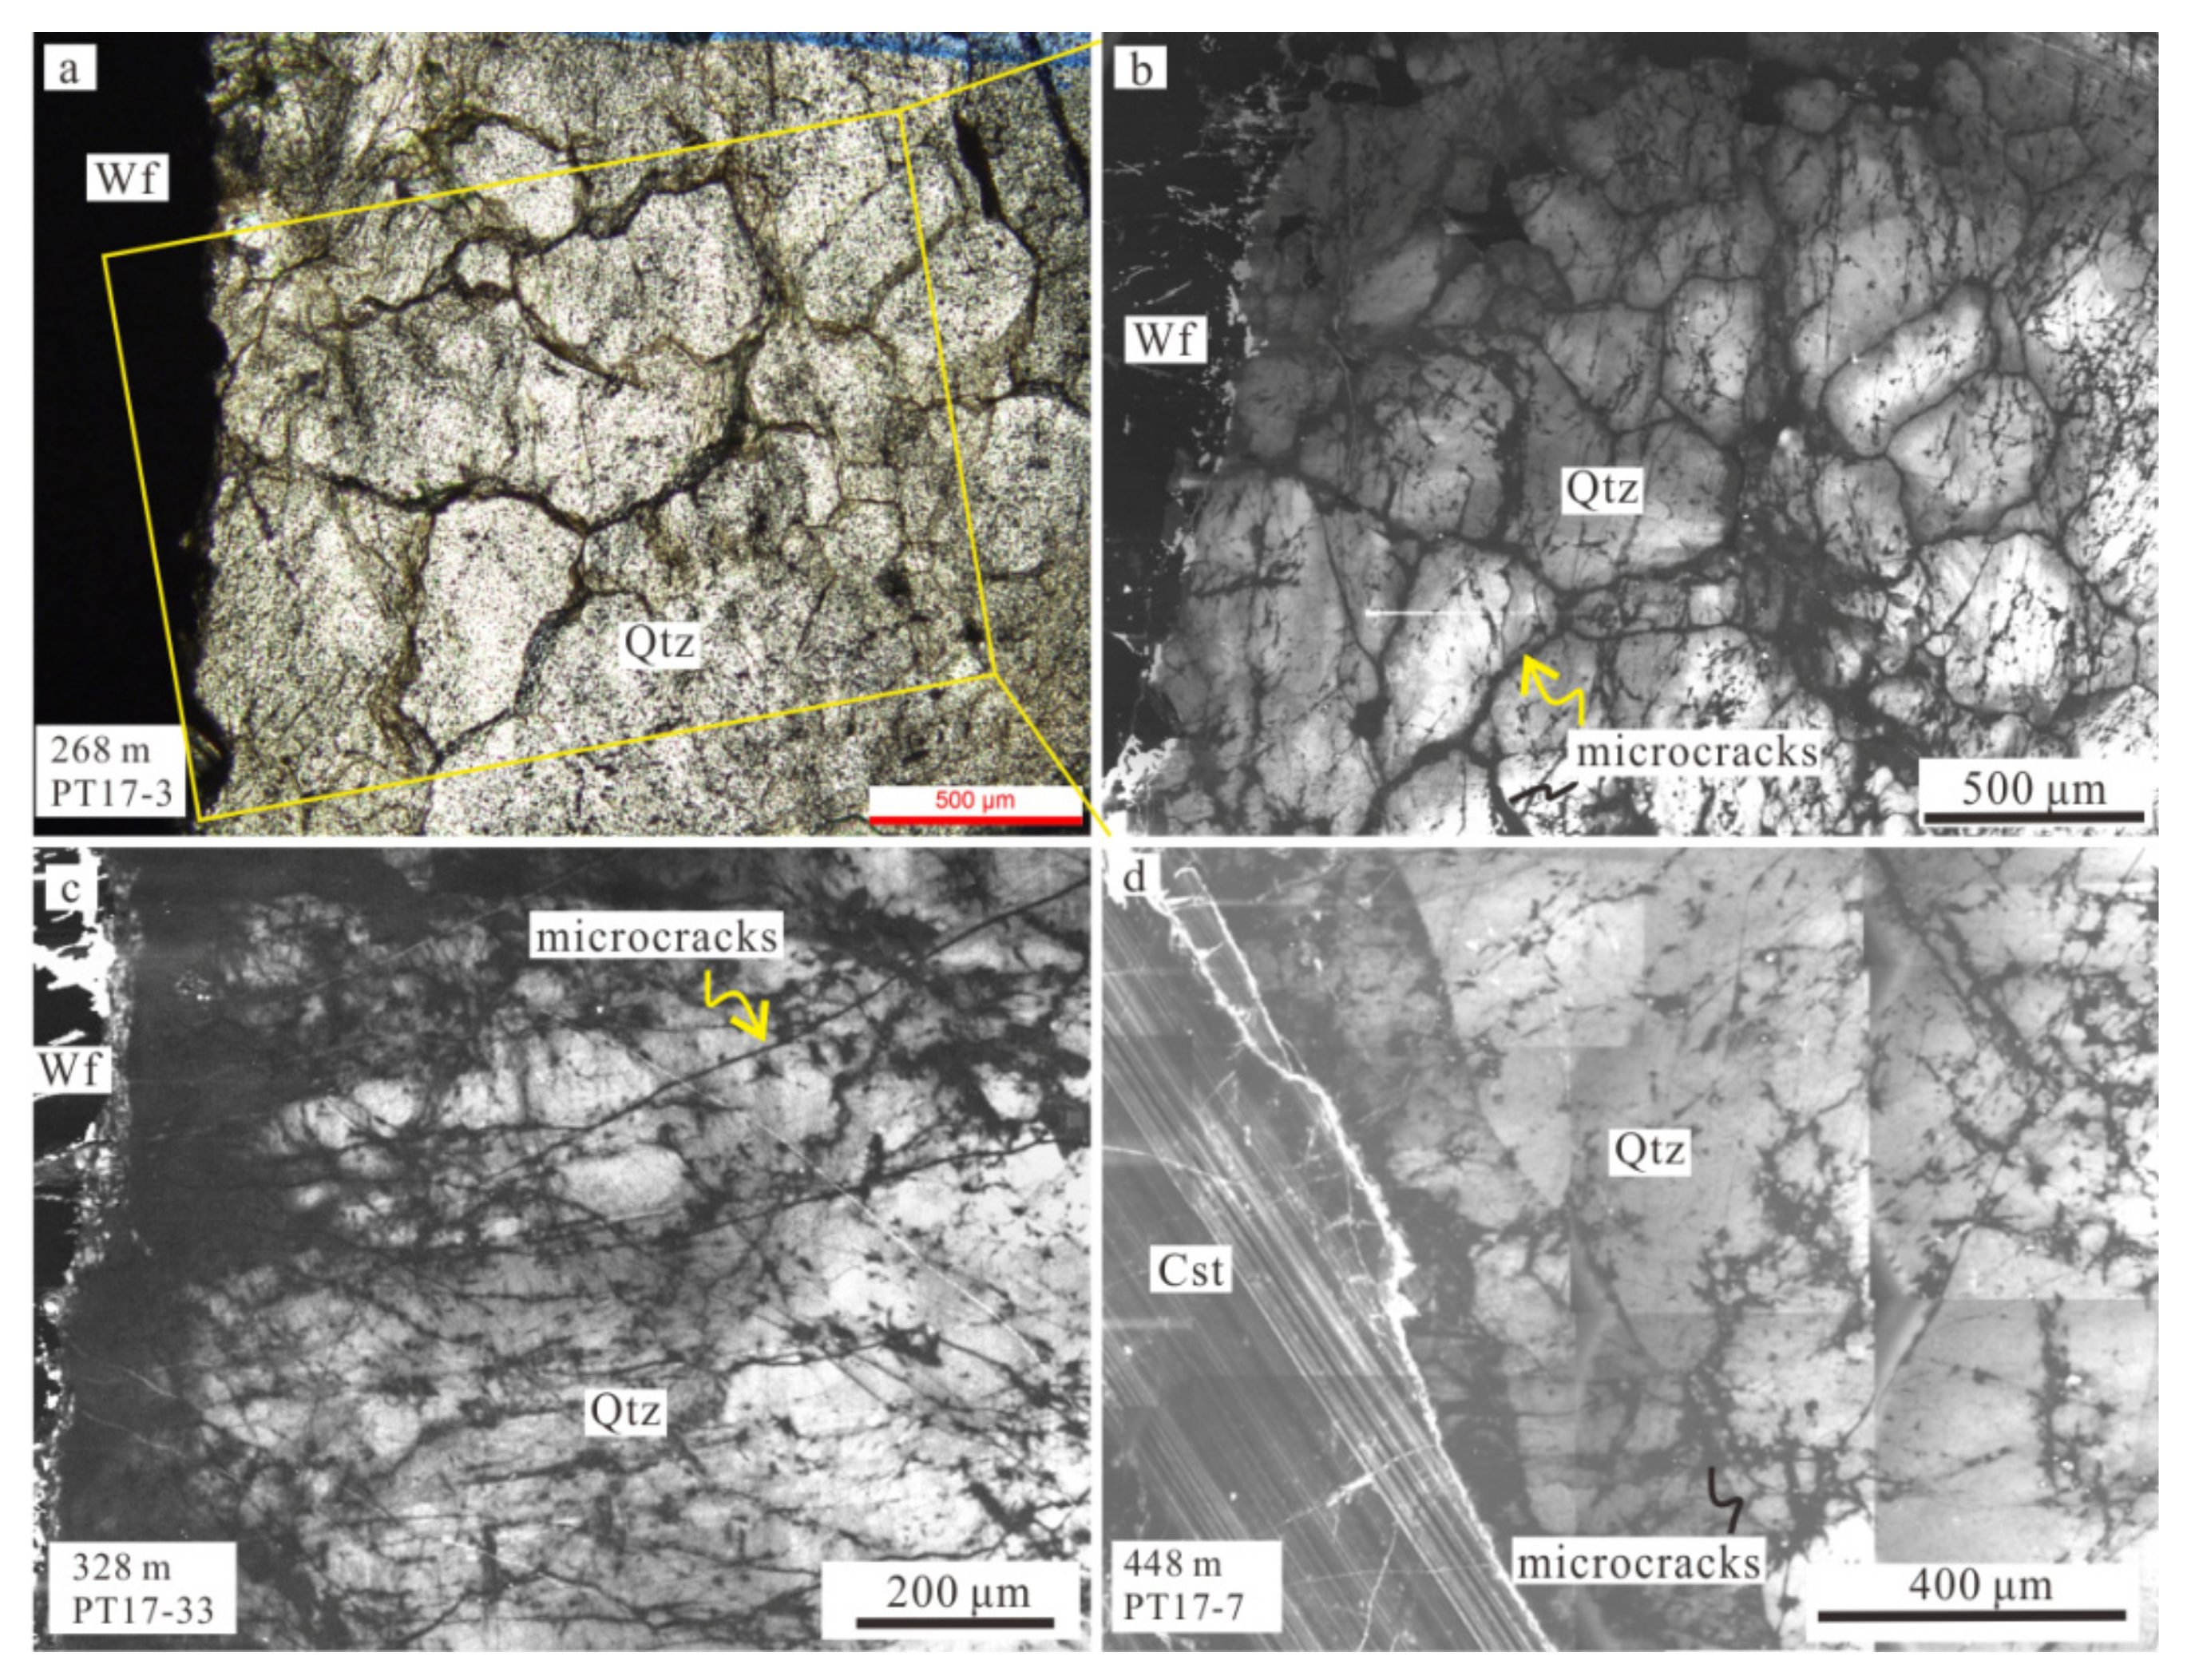
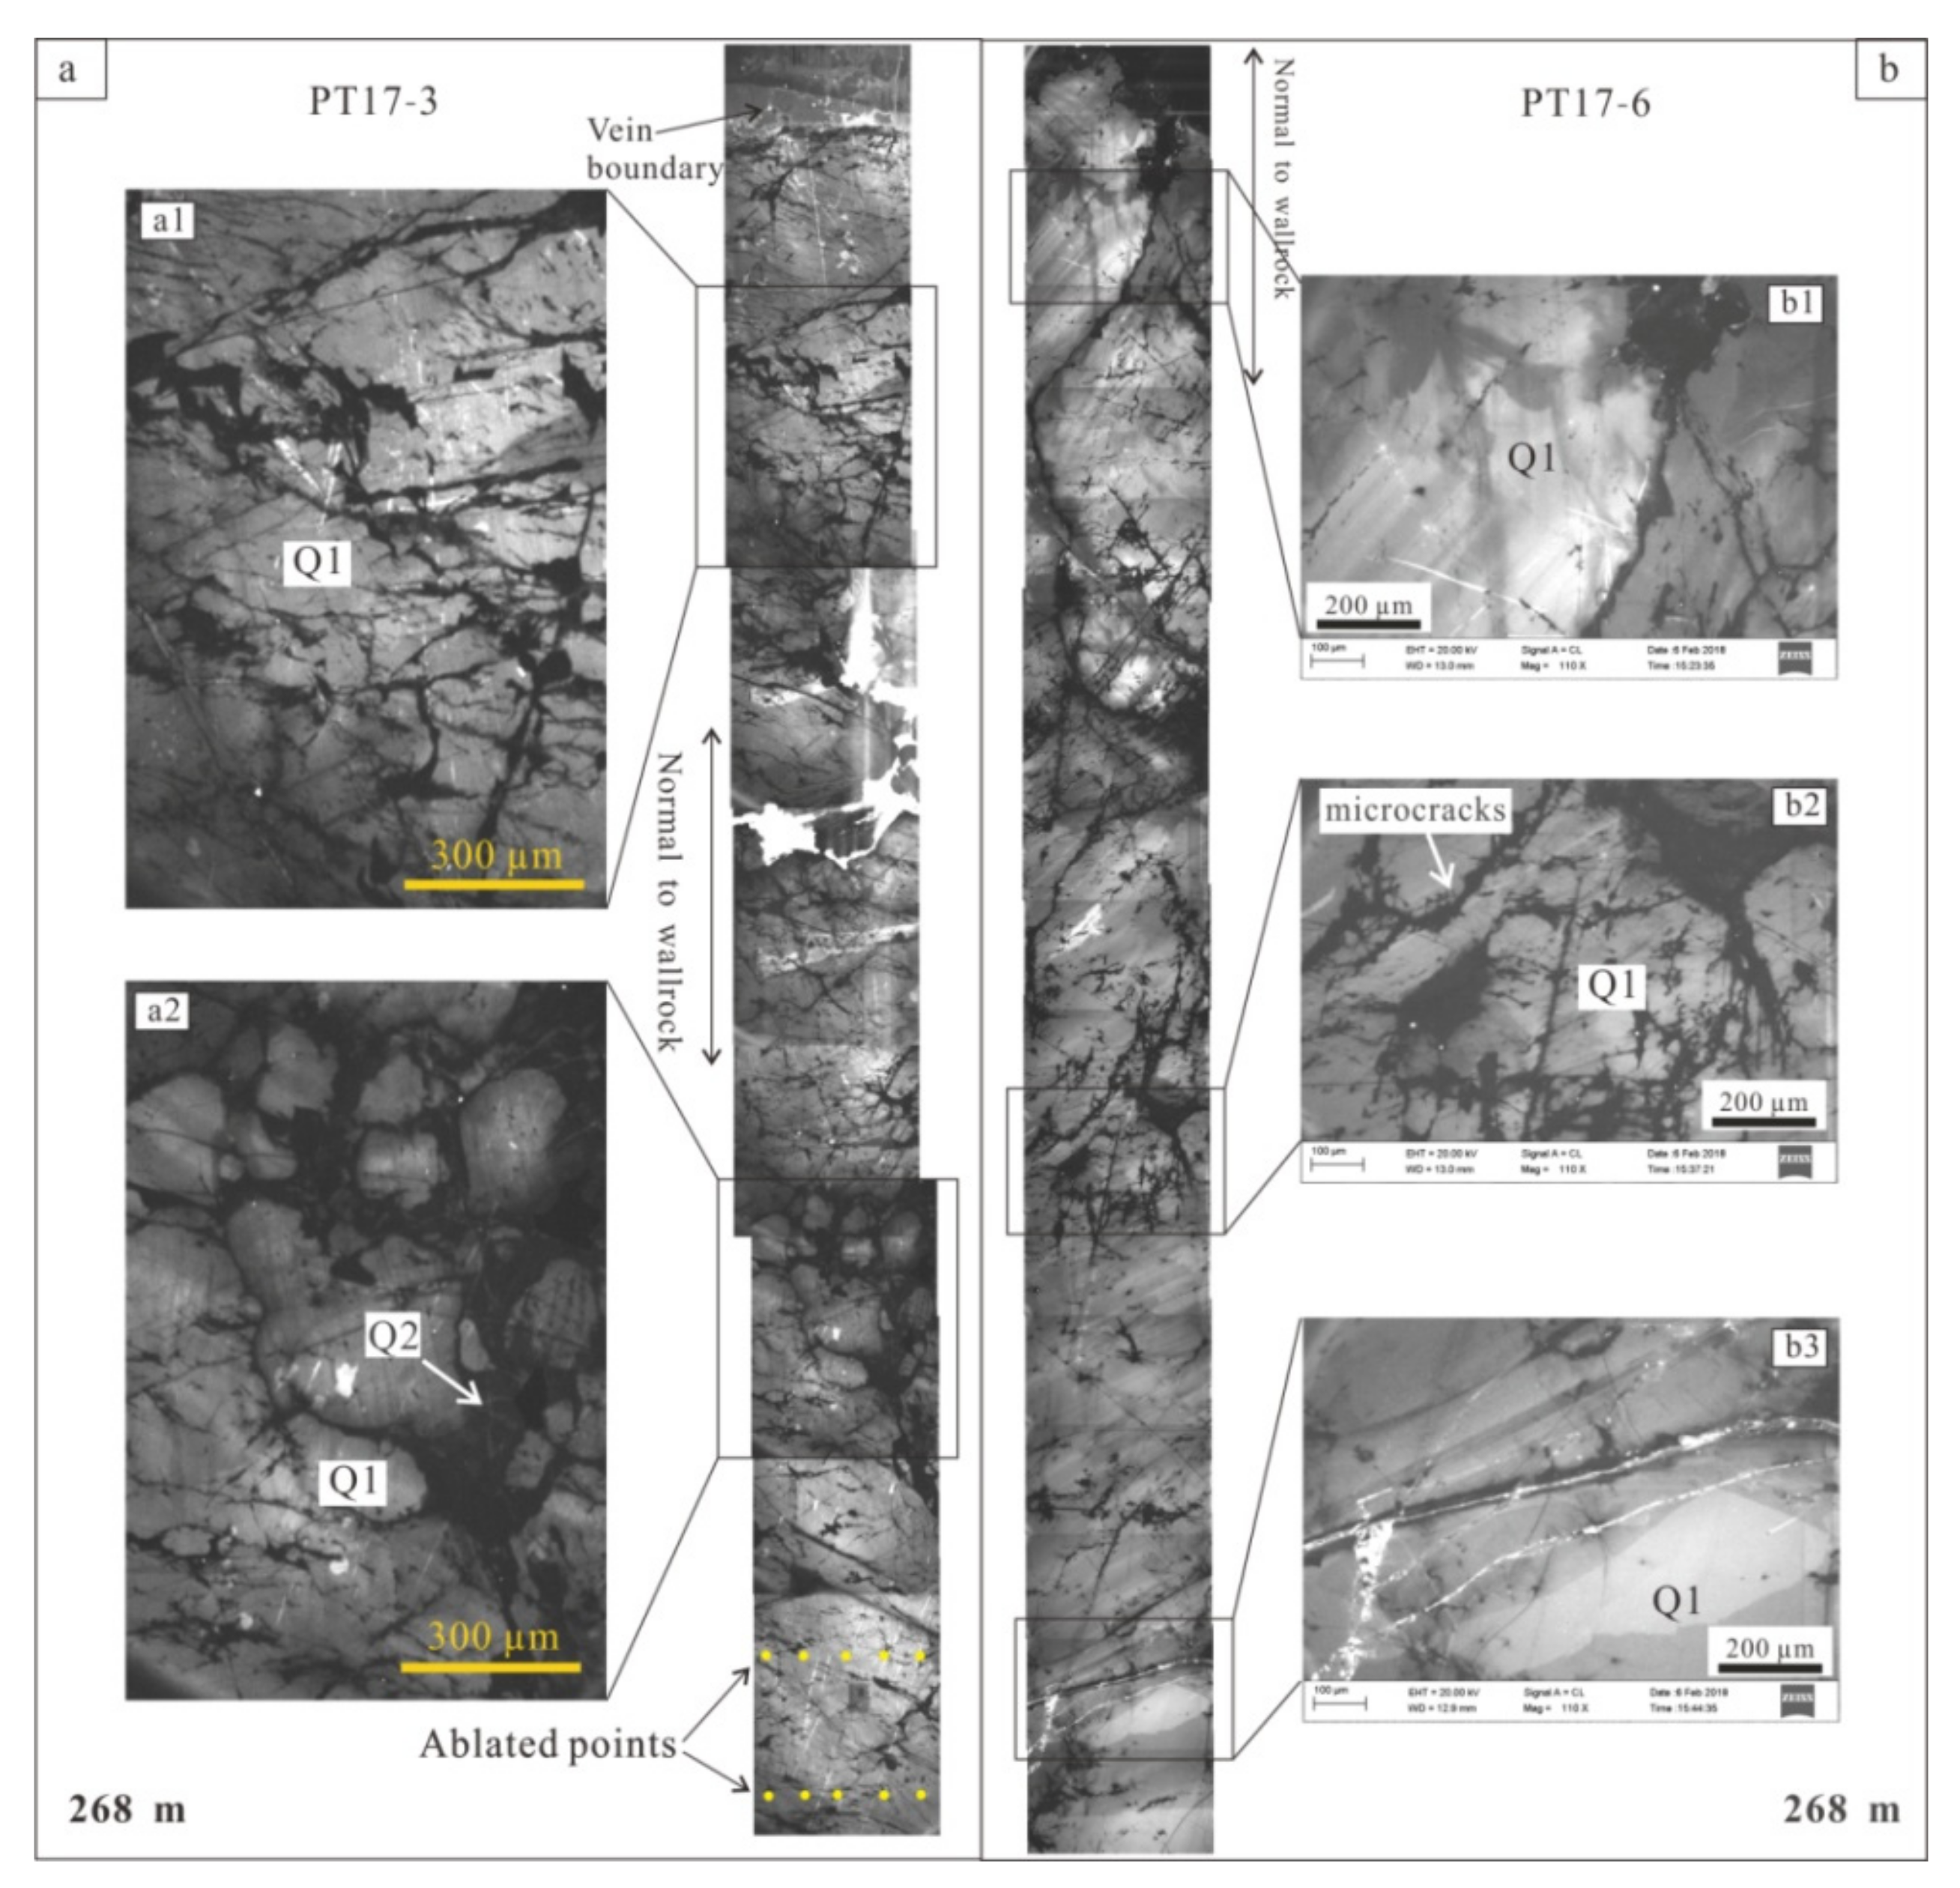
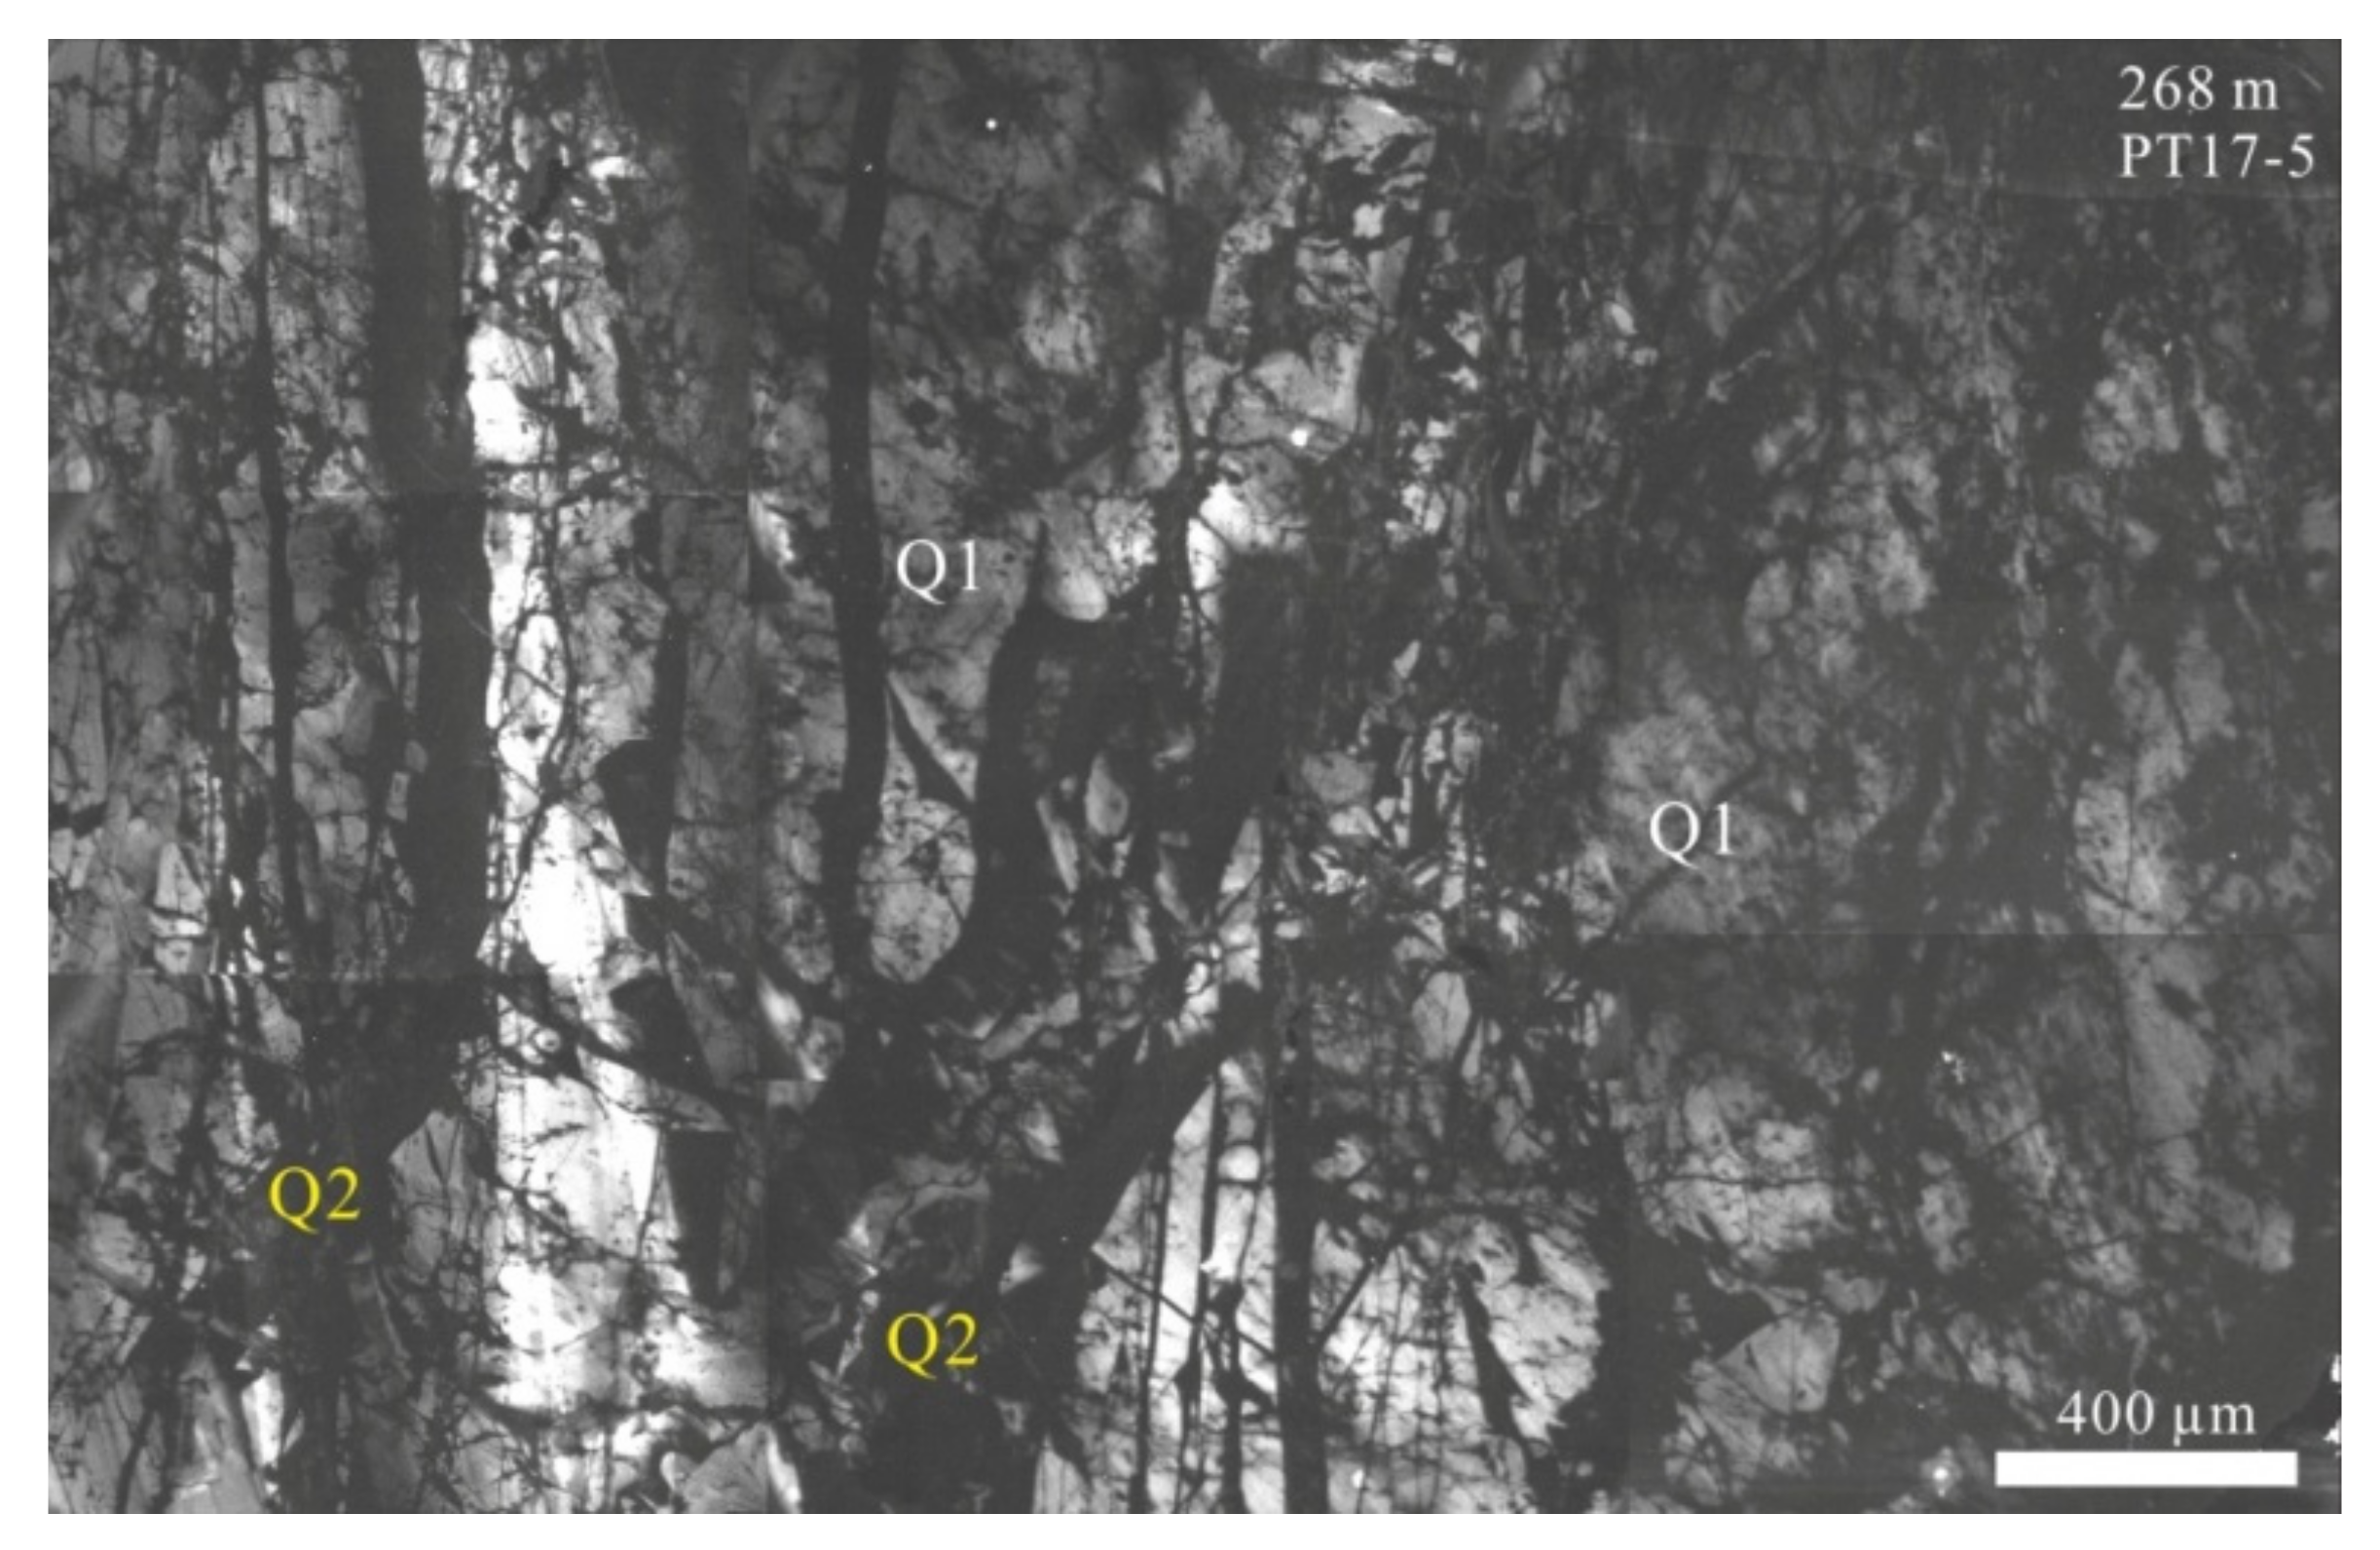
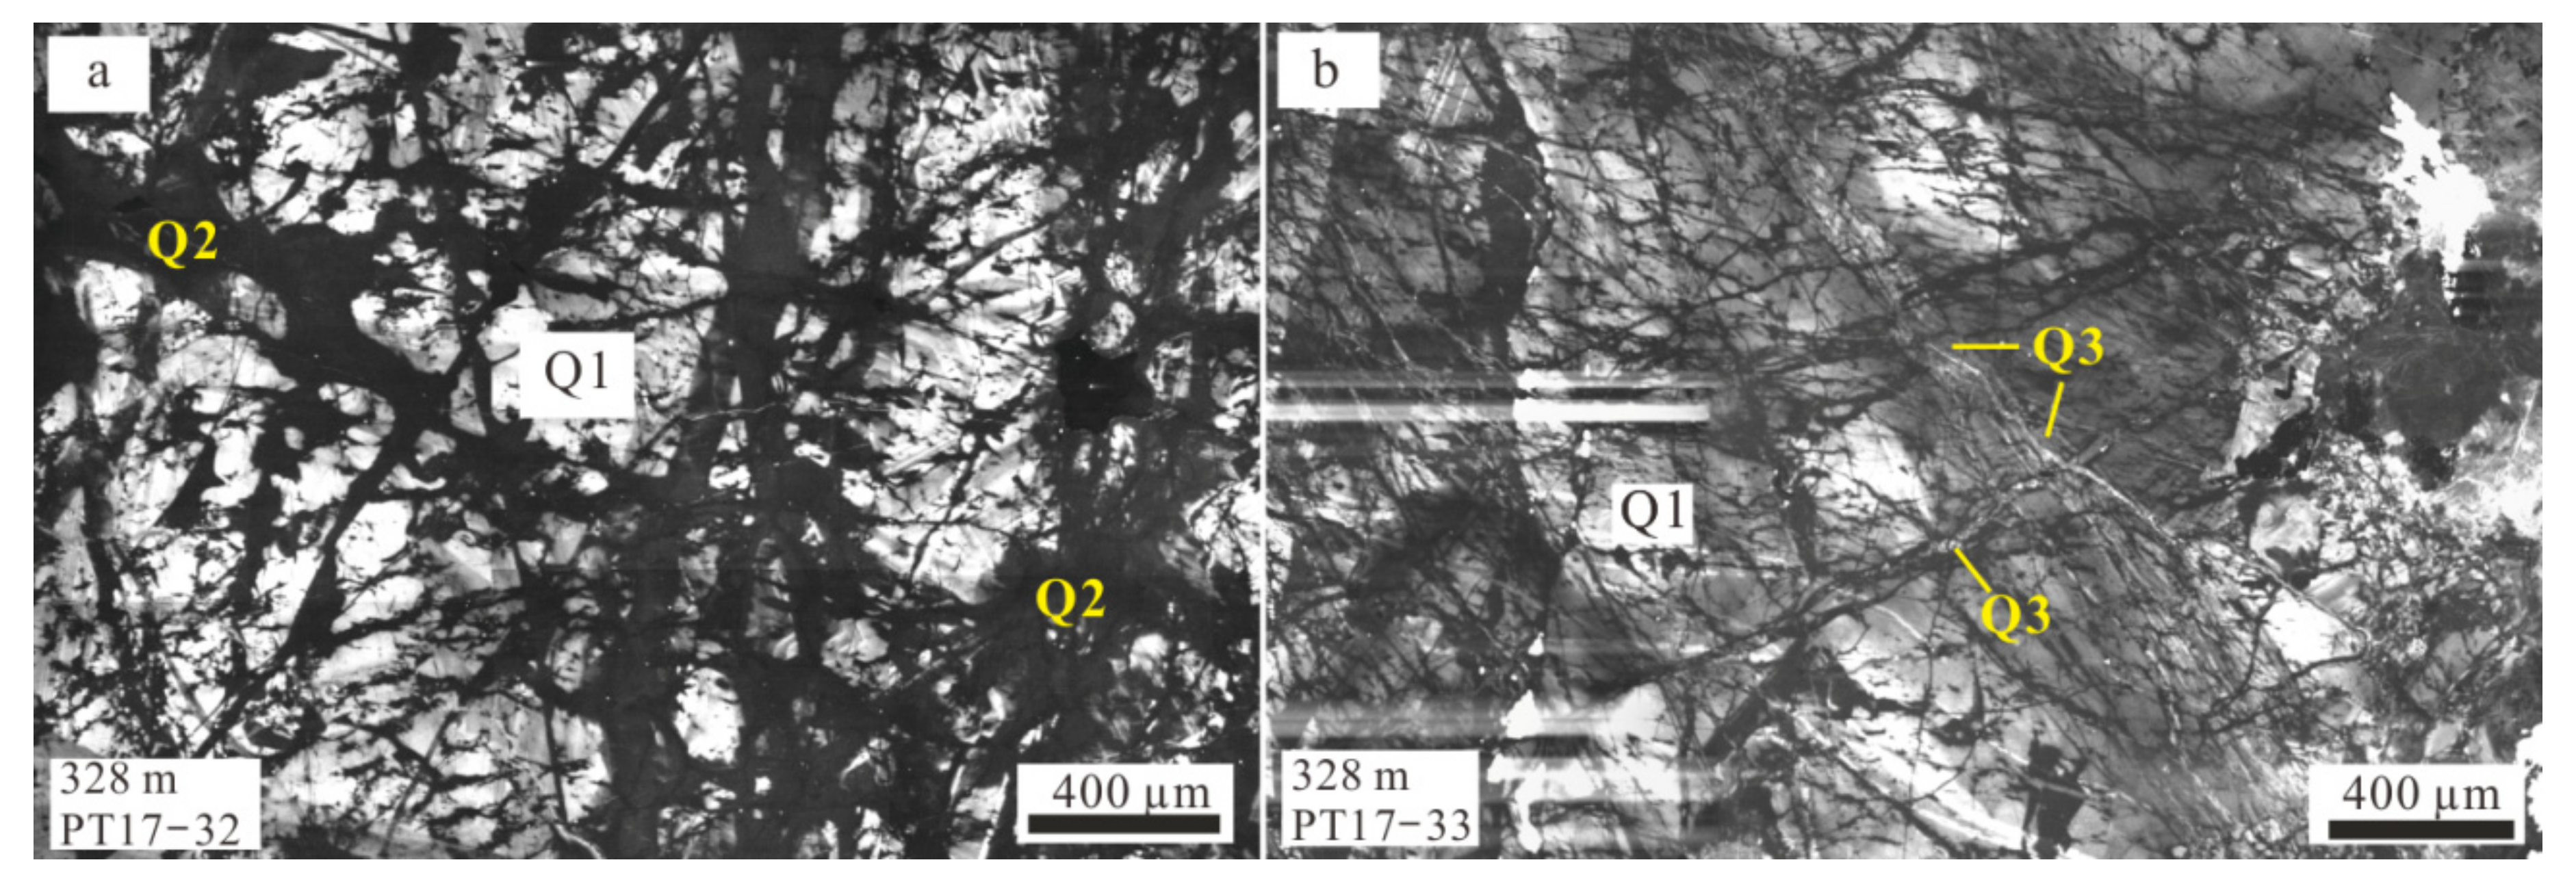
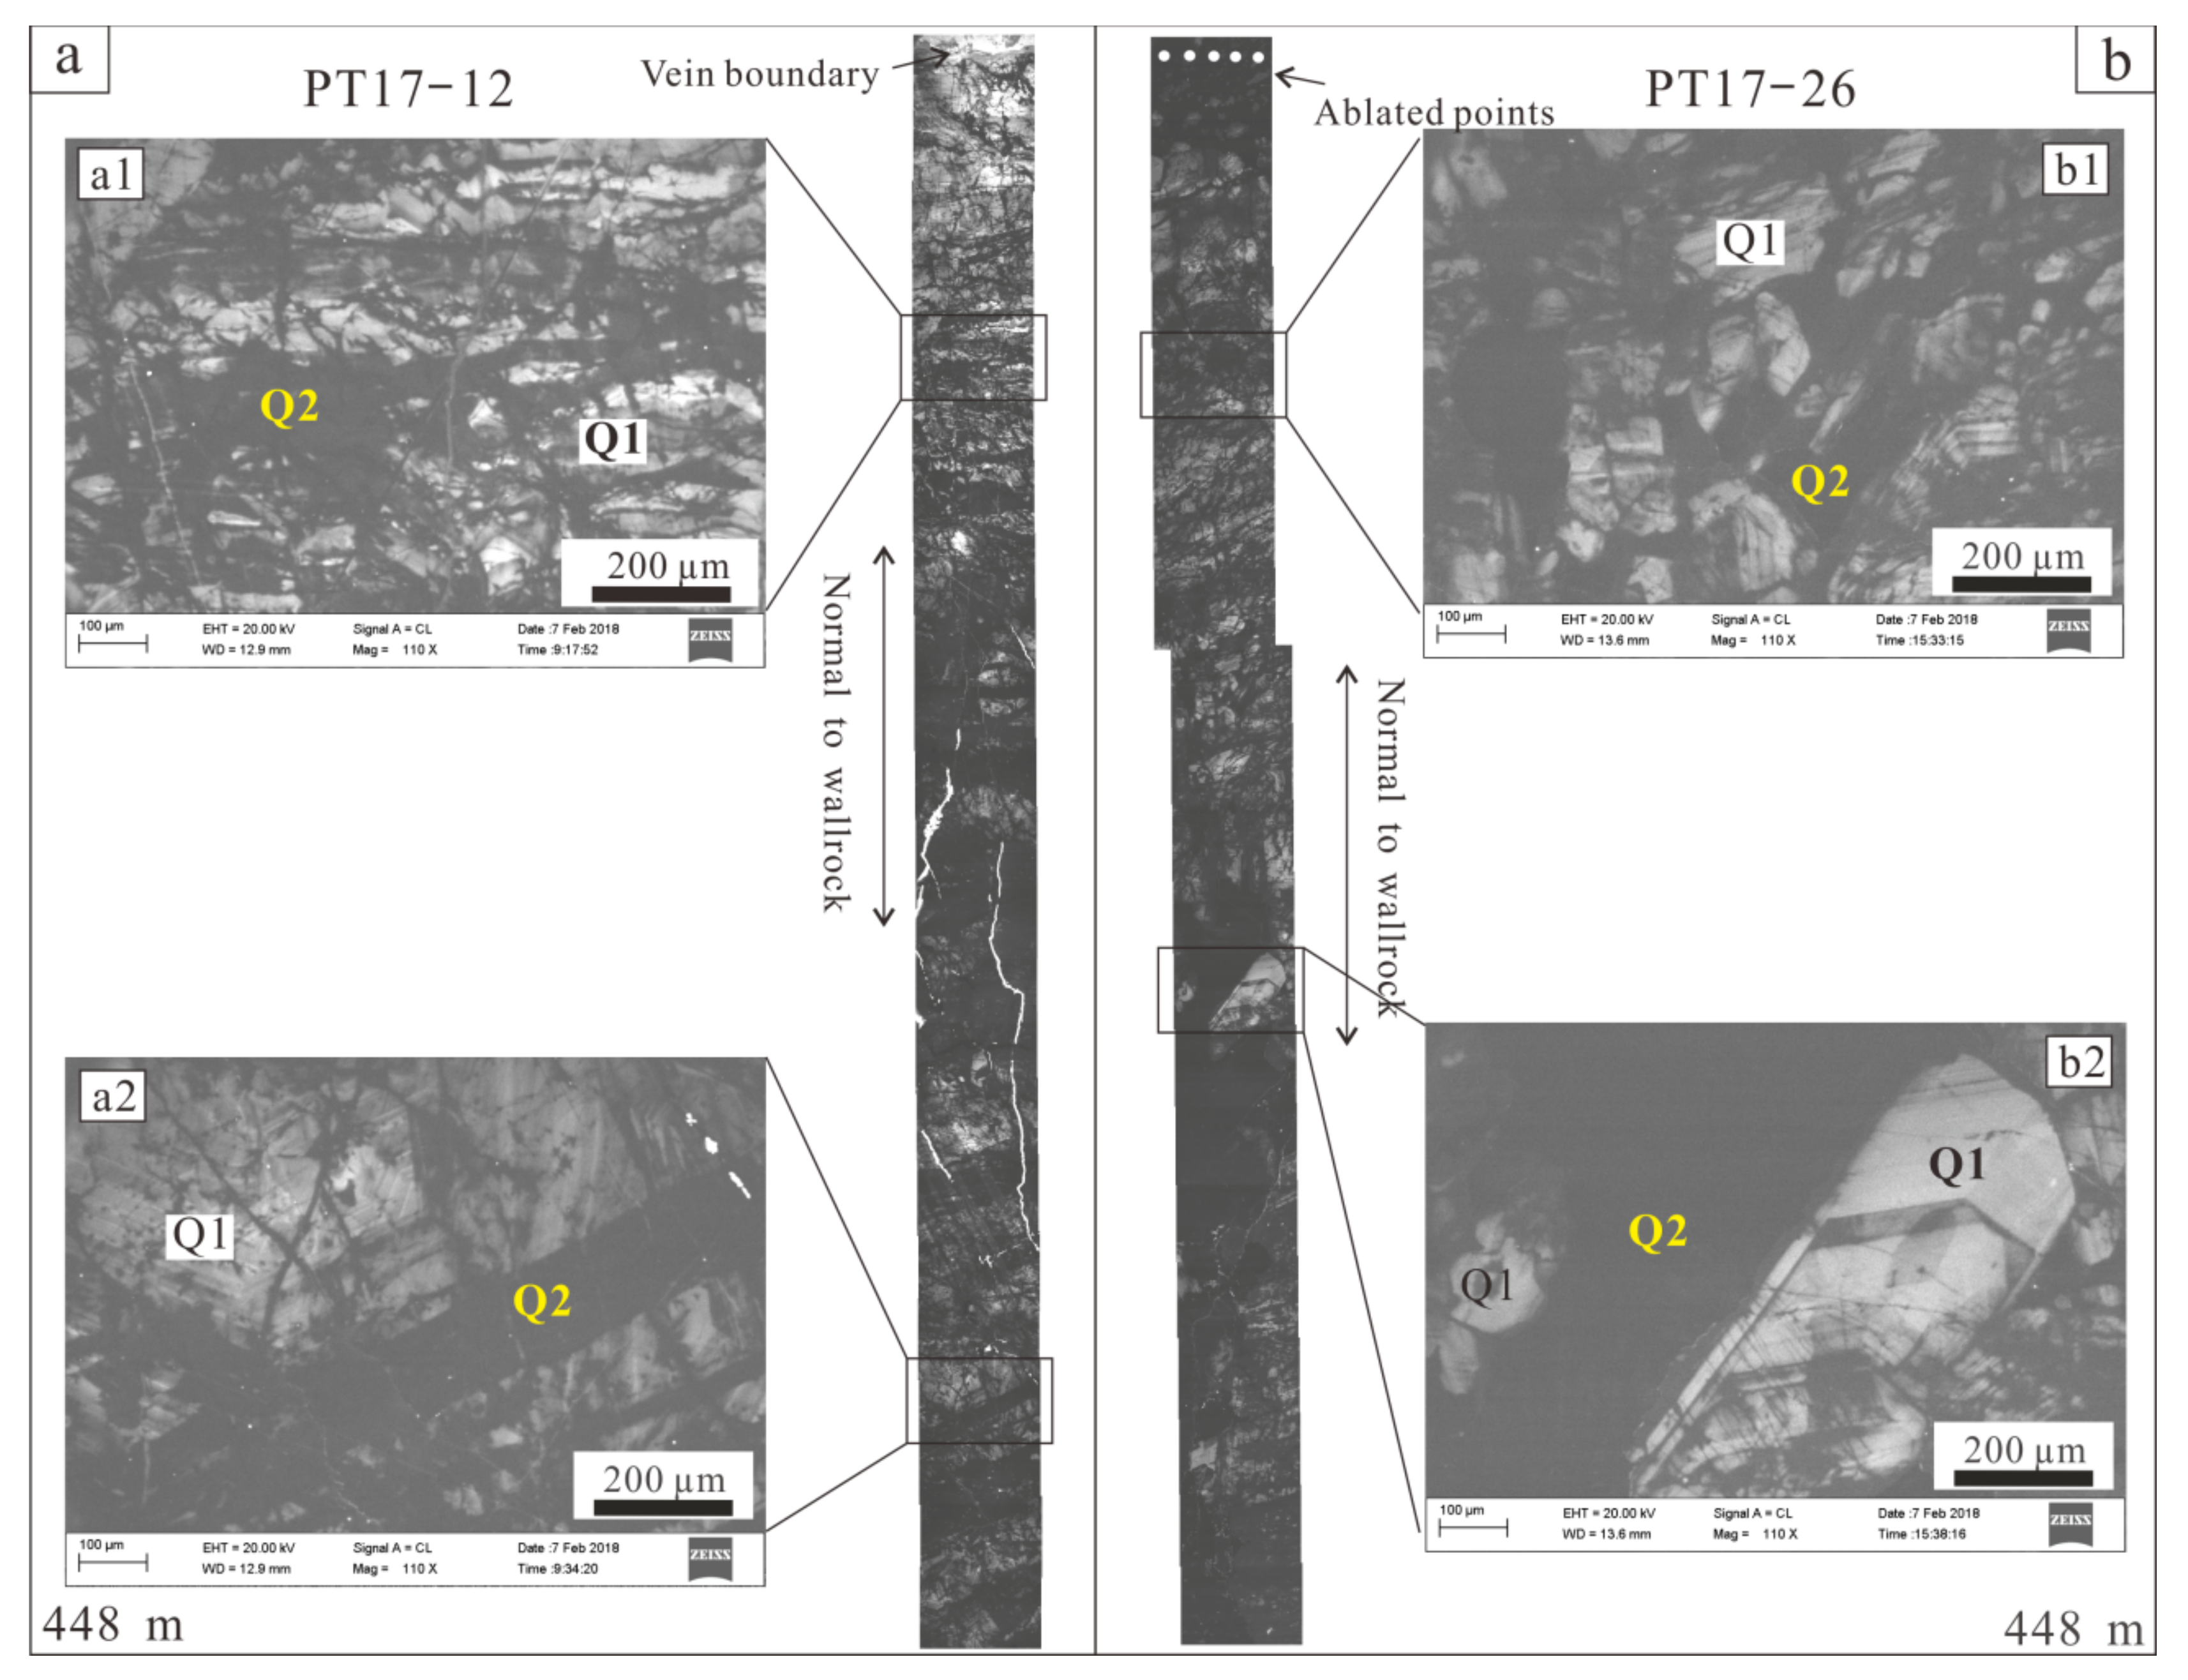
The vein thickness data at the three levels were fitted by a power law distribution. The fitting degrees at the levels of 328 m and 268 m are over 0.9, while the counterpart at the 676 m level is 0.85 (Table 1 and Figure 5). The fitted fractal dimensions decrease from the levels of 676 m to 328 m (Table 1). These vein thickness data were also fitted by a Weibull distribution. The fitting degrees are as good as those of the power law distribution (Figure 6). From Table 1, the Weibull modulus α = 0.034 at the 676 m level is slightly lower than that ( α = 0.035) at the 448 m level and much lower than that ( α = 0.063) at the 328 m level.
The fitting degrees of the WO3 grade data are higher than those of the vein thickness data (Figure 7). The veins at the 676 m level have the highest fractal dimension D w o 3 = 1.68 , followed by D w o 3 = 1.08 at the 448 m level and D w o 3 = 0.91 at the 328 m level. Compared with the WO3 grade data, the Sn grade data were fitted with slightly lower fitting degrees. The fractal dimension D S n decreases from 1.62 at the 676 m level, 1.31 at the 448 m level, to 1.02 at the 328 m level.

4.2. SEM–CL Imaging

370 SEM–CL panchromatic (i.e., over the entire visible spectral range) images of quartz were photographed from the levels of 448 m to 268 m (Table 2). The CL images of the quartz adjacent to ore minerals (e.g., wolframite and cassiterite) at different levels are homogeneous bright except many dark microcracks (Figure 8). The CL–bright quartz (Q1) composes a large part of the thick veins at the 268 m level (Figure 9) and was crosscut by a later generation of CL–dark quartz (Q2 in Figure 10). Figure 9b also shows clear growth zones in the thick veins.
Three generations of quartz were identified in the quartz veins at the 328 m level (Figure 11). The CL–bright generation of quartz (Q1) was identified to be ubiquitous in the veins at the 328 m level. This generation of quartz was crosscut by a late CL–dark generation of quartz (Q2) and another late CL–bright generation of quartz (Q3). The cross relationship between Q2 and Q3 was not found from the samples at the 328 m level. Nevertheless, some of Q3 was crystallized along microcracks (Figure 11b), so the Q3 quartz may postdate the Q2 quartz.
Two generations of quartz were also identified from the panchromatic CL images at the 448 m level (Figure 12). The CL–bright generation (Q1) of quartz shows growth zones with oscillating CL intensity and was crosscut by a late mesh-like CL–dark one (Q2). These two generations of quartz are ubiquitous in all the photographed veins.

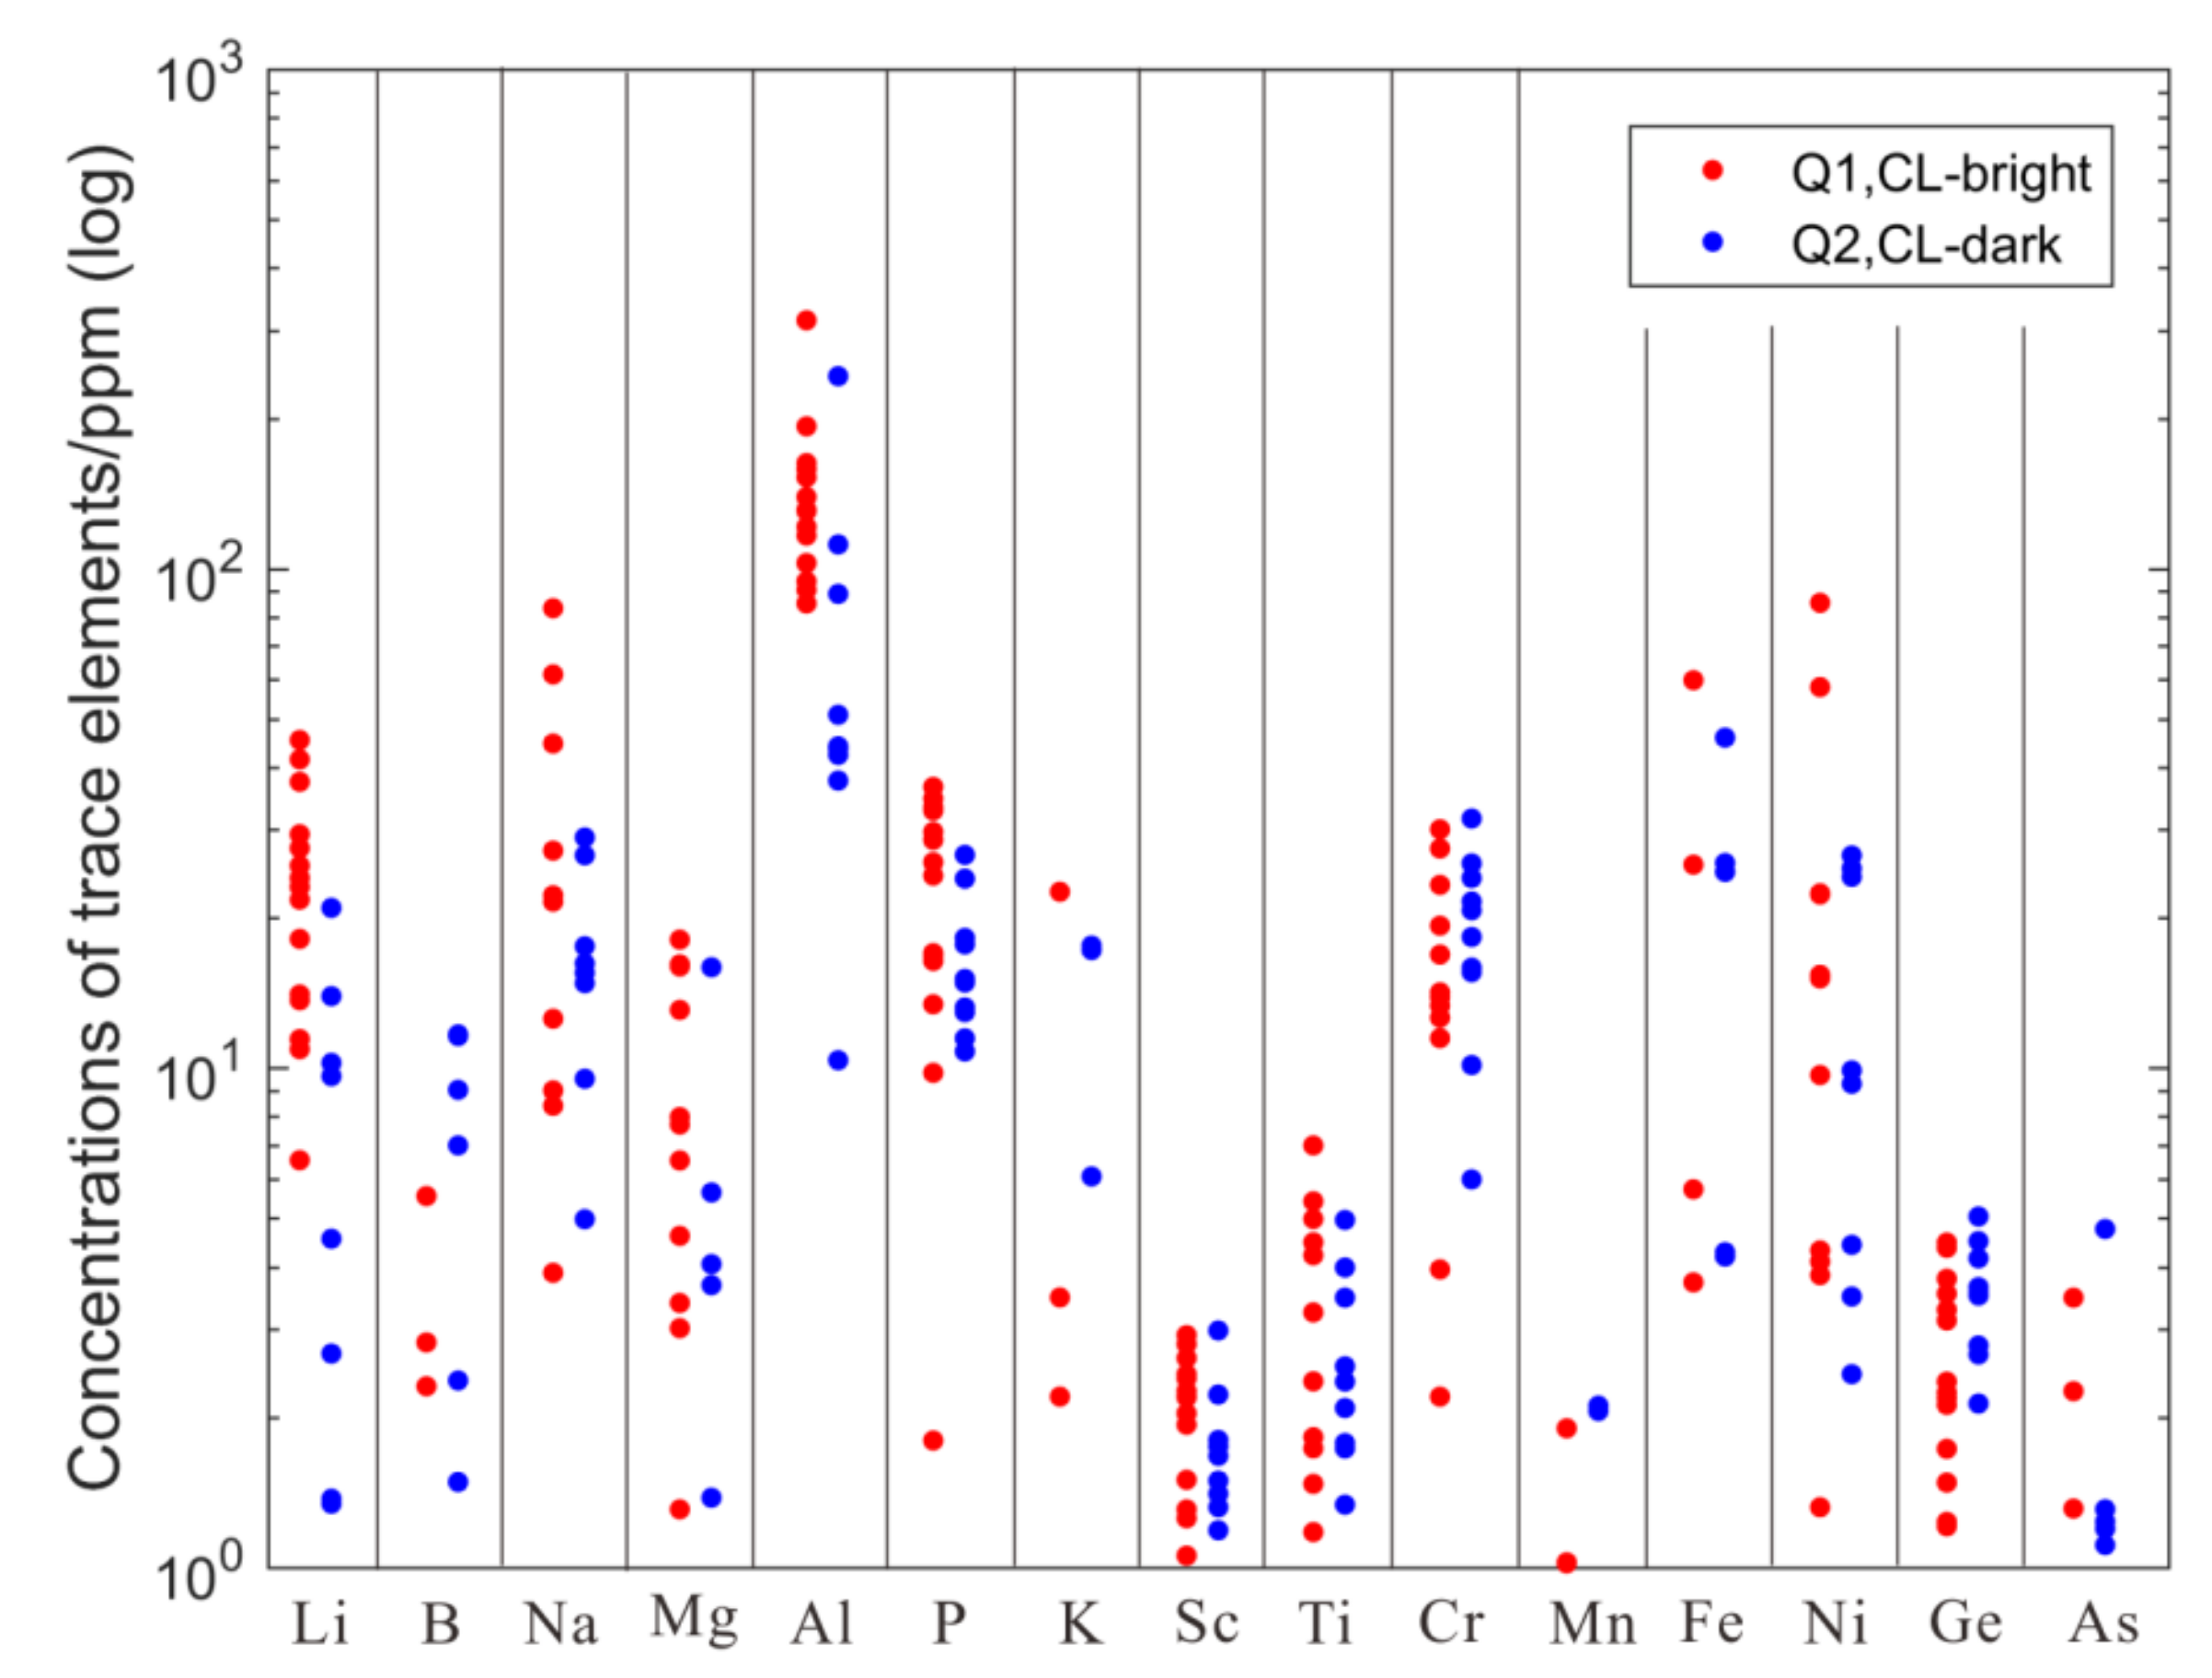
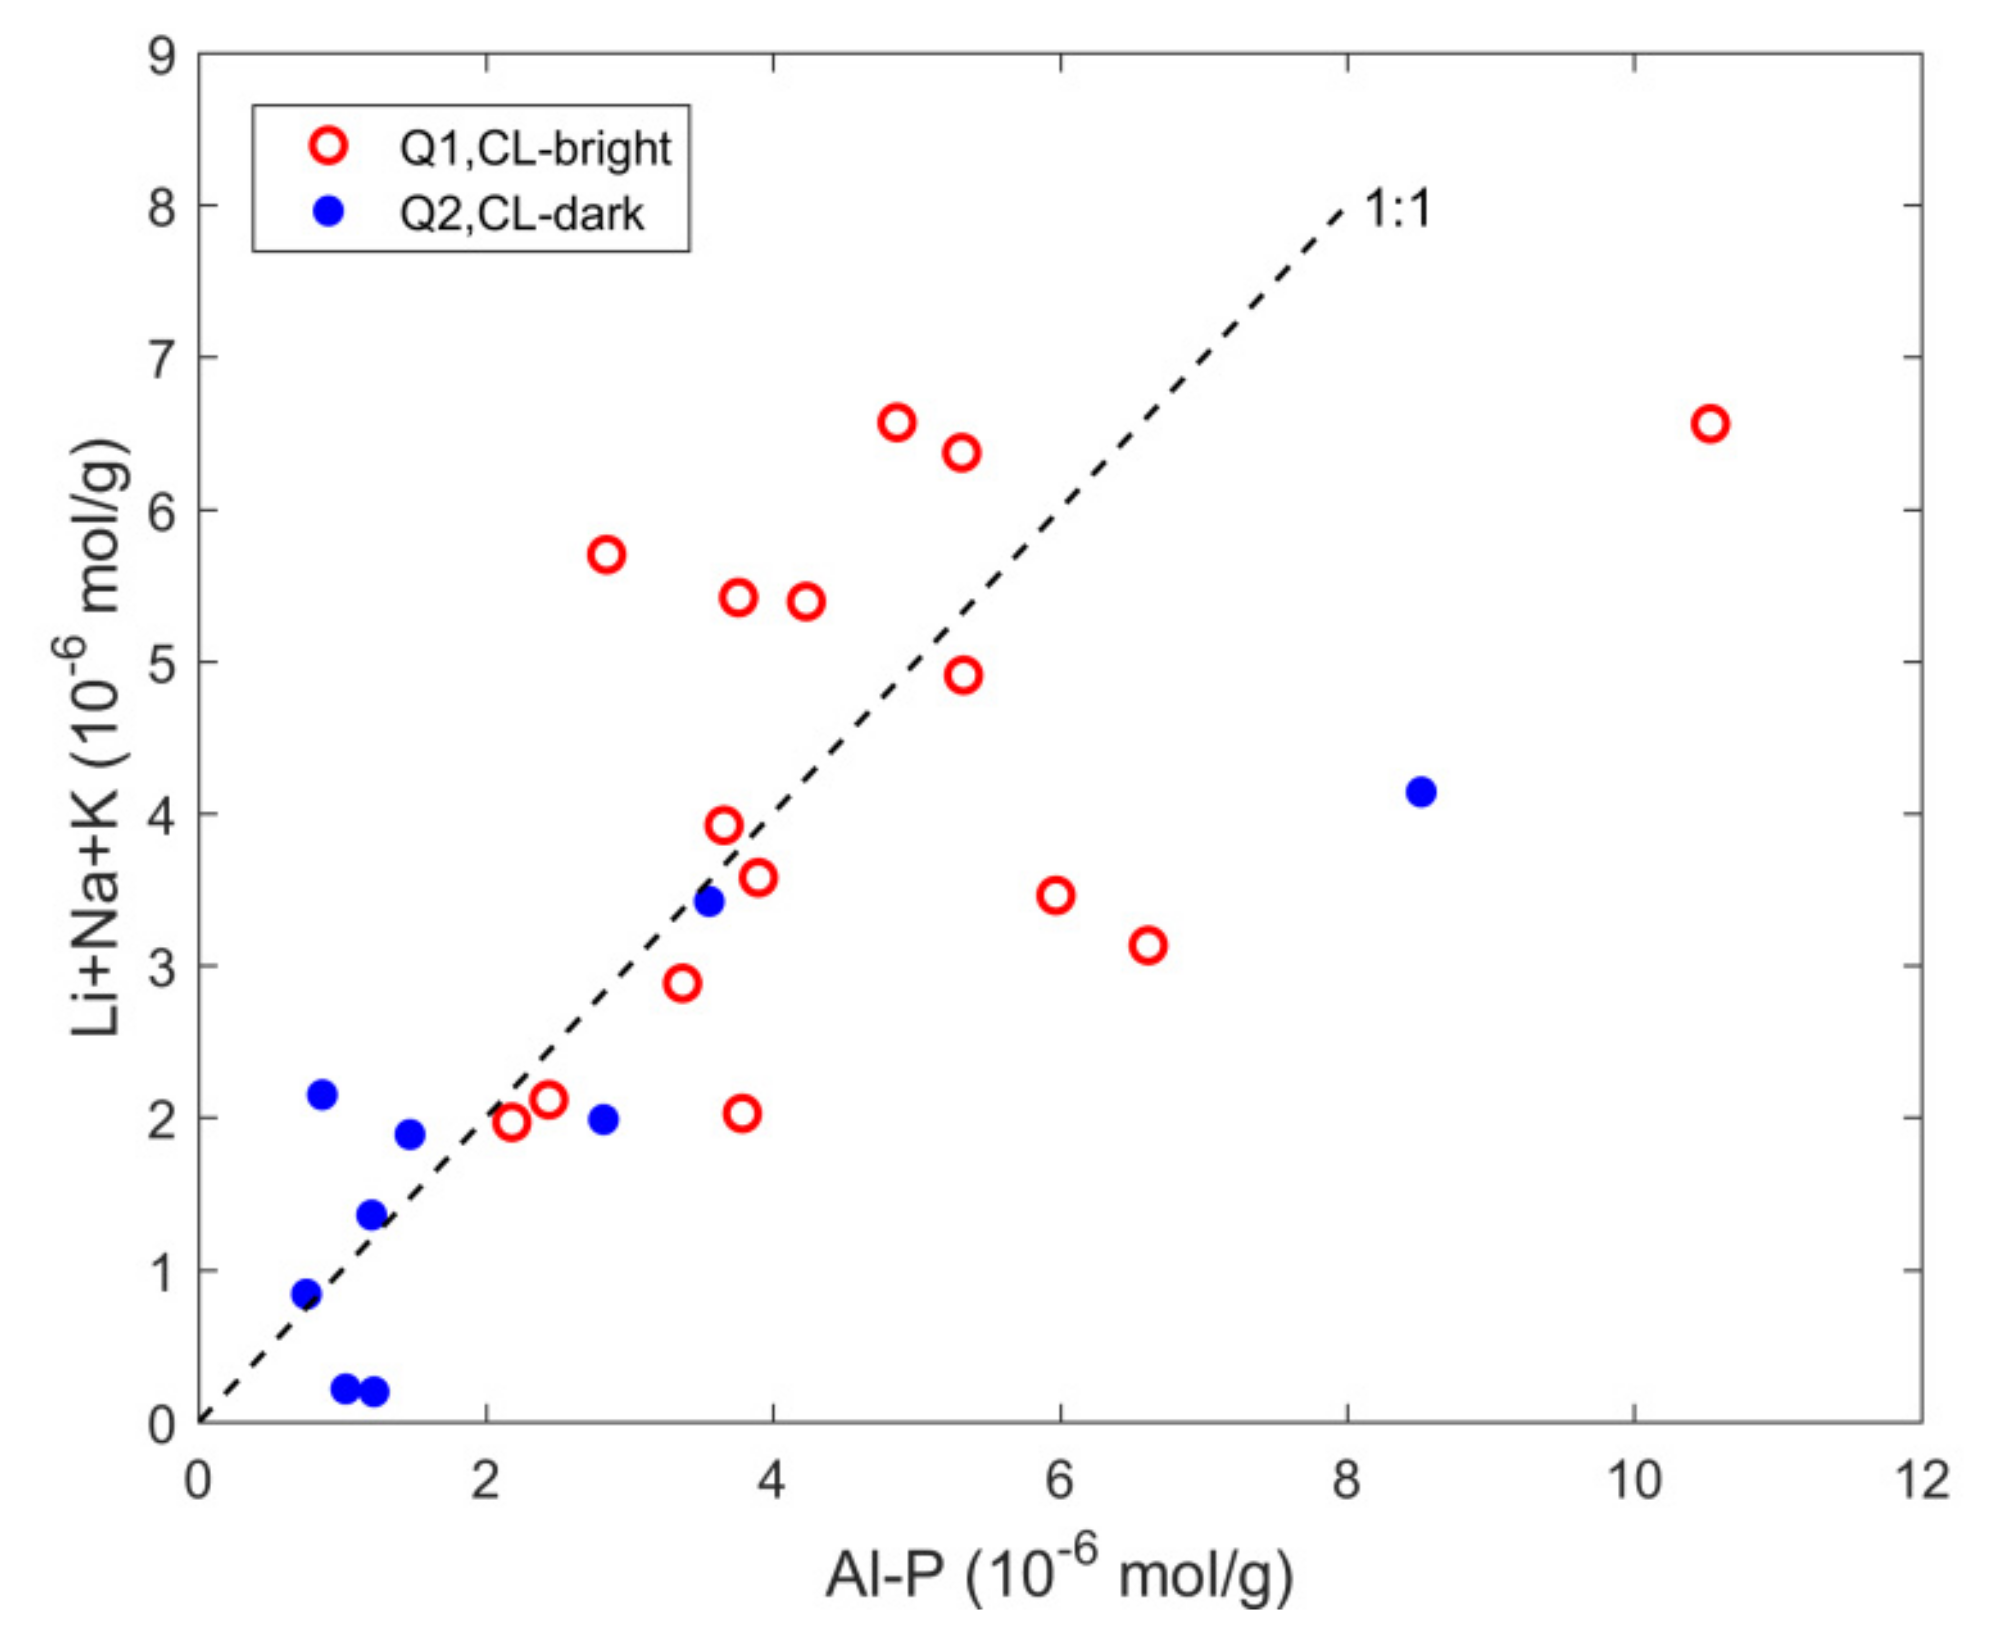
4.3. In Situ Trace Element of Quartz

Two samples PT17-3 and PT17-6 (both at the 268 m level) were selected to measure trace element concentrations of the first generation of CL–bright quartz (Q1), and another two samples, PT17-23 and PT17-26 (both at the 448 m level), were selected for the second generation of CL–dark quartz (Q2) (see Table 3).
Quartz is considered to contain only small amounts of other elements (e.g., Al3+, Ga3+, P5+, Ti4+, Li+, Na+, and K+) because of a small ion radius of Si4+ and its high valence [83]. For the Piaotang deposit, Al is the only trace element whose concentrations reach up to hundreds of ppm (See Figure 13 and Table 3). Other abundant trace elements (>1 ppm) include P, Na, Fe, Li, B, Ni, Ti, Ge, Cr, Sc, K, Mg, Ge, and As. The Q1 quartz has higher concentrations of Li, Na, Al, P, and Ni and lower B and K than the Q2 quartz. Concentrations of Ti in the two generations of quartz are within a few ppm and have insignificant difference.

5. Discussion

5.1. Meso–Scale Morphological Zonation of Quartz Veins in Piaotang

Vein thickness data of the III vein set in Piaotang follow a power law distribution. This is similar to those of tungsten-tin deposits elsewhere and other types of hydrothermal ore deposits [45,48,60,84]. The fractal dimension D t of vein thickness in Piaotang decreases with increasing depth. This vertical trend of D t is similar with the Dajishan vein-type tungsten deposit in China, whose D t in the thick vein zone decreases from 0.92 at the 467 m level to 0.85 at the 317 m level [11]. The vein thickness data also follow a Weibull distribution and the Weibull modulus α decreases with increasing depth. The WO3 and Sn content data in Piaotang conform to a power law distribution, and their fractal dimensions ( D w o 3 and D S n ) also decrease with increasing depth. It should be noted that the fitting degrees of the vein thickness and Sn content data at the 676 m level are systematically lower than those at other levels (Figure 5, Figure 6 and Figure 7b). A possible reason for their differences is that a major part of quartz veins at the 676 m level have been denudated by later geological processes (see Figure 2), leaving the remaining quartz veins deviated from their original statistical distribution.
The vertical trends of fractal dimensions D t , D w o 3 , and D S n imply that the host rocks of these quartz veins at deeper levels have higher connectivity and are more mineralized. The higher Weibull modulus α of the quartz veins at the 328 m level suggests that the host rock (i.e., the biotite granite) is mechanically stronger than that at the 448 m and 676 m levels. This is in accord with the field observation that the metamorphosed sandstones above the 328 m level are intensively fractured, while the granite exposed at the 328 m and 268 m levels is intact except the parts where a few thick veins are present. Nevertheless, the vertical trend of fractal dimensions D t and Weibull modulus α in Piaotang are in contrast with [60] who reported that the auriferous quartz veins in Gadag in southern India had lower fractal dimensions of vein thickness and lower Weibull modulus than the non-mineralized ones. This difference between this study and [60] may be caused by two reasons. Firstly, both mineralized and non-mineralized veins investigated by [60] come from outcrops and can be considered to deform at the same initial stress field, while the quartz veins of this study are at different vertical levels and the initial stress field at each level should be different. The second reason relates to the initial fracture systems at different levels. The initial fracture systems in Piaotang may have been different at different levels, and their formation may be related to magma intrusion [85] or thermal contraction [86]. The next question required to be answered is why the mechanically stronger host rock at the 328 m level has higher connectivity (low fractal dimension of vein thickness D t ) and is intensively mineralized (low fractal dimension of ore grade D w o 3 and D S n ). One possible reason is that fluid pressure is higher at deeper levels. The fluid inclusions of quartz have trapping pressures up to 150 MPa [43], and high-pressure fluids may diffuse upwards and create a few connected fracture for transporting hydrothermal fluids and precipitating quartz.

5.2. Micro–Scale Textures of Quartz Veins

Quartz CL textures reflect the environment of quartz growth [22]. CL growth zones are typical of quartz phenocrysts in volcanic and plutonic rocks, while hydrothermal quartz displays various CL textures including growth zones (see [22]). For the Piaotang deposit, the Q1 quartz shows clear growth zones with oscillating CL intensity, while the Q2 and Q3 quartz are CL–homogeneous dark or bright. Previous studies suggest that later generations of quartz in porphyry Cu or Mo deposits are generally CL–darker than earlier generations [22,87,88]. This difference in CL intensity of different generations of quartz is also applicable to the Piaotang tungsten–tin deposit.
Al is the most abundant trace element in the quartz of the Piaotang deposit. Whether the dominance of Al in quartz is representative among the tungsten deposits, southern China is unknown because no similar studies are found in the literature. From the recent studies of [89,90], Al is also the most abundant trace element in mineralized quartz veins in the Panasqueira tungsten–tin deposit, Portugal, and in the Krupka district of the Erzgebirge mountain range near the Czech–Germany border. Al concentrations in those two deposits vary from tens to hundreds of ppm, close to those in Piaotang.
Al is often found to have a positive correlation with alkali cations such as Li+, Na+, and K+ because Si4+ in quartz can be substituted by Al3+ and additional charge-compensating cations like alkali cations and P5+ [87,91]. The possible substitutions include 2Si4+ = Al3++ P5+ and Si4+ = Al3+ + M+ (M+ is Na+, Li+, and K+). The mass fractions of Al, P, Na, Li, and K were converted to be molality (mol/g). Figure 14 shows that the data fall in the two sides on the line of the molar ratio (Al−P)/(Na + Li + K) = 1, supporting the above two substitutions for the quartz in the Piaotang deposit.
The CL intensity of hydrothermal quartz generally has a positive correlation with concentrations of Ti or Al depending on the temperatures of quartz crystallization [22,92]. For the Piaotang deposit, most concentrations of Ti in the two generations of quartz Q1 and Q2 have a range of 1–6 ppm, slightly lower than those in the Panasqueira tungsten−tin deposit, Portugal [89]. Moreover, the two generations of quartz have no significant difference on Ti concentrations (Figure 13). Therefore, the difference on CL intensity between the two generations of quartz seems more likely to be controlled by the concentrations of Al. Another possible reason for the CL intensity difference between the Q1 and Q2 quartz is temperature. From [93], fluid inclusions in the Q1 quartz have homogenization temperatures of 230–380 °C, higher than those in the Q2 quartz (180–340 °C) (see Figure 6-2 in [93]). Those homogenization temperatures in [93] are slightly higher than those in [41,42,43] (see Section 2). The maximum homogenization temperatures in [93] were derived from only ten two–phase gas–rich fluid inclusions. Note that two–phase gas–rich fluid inclusions in quartz are less abundant than two–phase aqueous–rich ones. For those two–phase aqueous–rich ones, the homogenization temperatures (200–300 °C) in Q1 are also higher than those in Q1 (180–250 °C). Therefore, the CL intensity of the Q1 and Q2 quartz is possibly controlled by temperature and Al concentrations in quartz.
Six mineralization stages were identified by [94] in the Piaotang deposit according to mineral assemblages, wall rock alteration, and mineralization subsequences, whereas [95] recently proposed a four–stage paragenetic sequence from their field and petrographic observations. The former study covers all the vein sets of the Piaotang deposit and the latter also considers the flat veins that were not investigated here. The CL images of this study show that the quartz veins in the III vein set were the final product of at least three generations of quartz crystallization, fewer than the mineralization stages reported by [94,95]. This difference in the quartz generations between this study and previous studies is probably caused by the sampling locations (only in the III vein set) and sample sizes of this study. Furthermore, the Q3 quartz is identified only at the 328 m level and is volumetrically minor compared with the Q1 and Q2 quartz. From our CL images, whether the Q3 quartz represents a minor hydrothermal event still requires more CL imaging on other vein sets in Piaotang.

5.3. The Mechanisms Forming the Morphological Zonation of Quartz Veins in Piaotang

The evolution of fracture systems is essentially important for formation of hydrothermal vein–type deposits [96,97]. The mechanisms responsible for the formation of vein systems are well explained by a percolation model [71,98,99,100,101,102]. In the percolation model, as initial isolated fractures grow, the fracture system reaches a percolation threshold, above which the fractures are locally well–connected at the backbone, facilitating focused fluid flow with little fluid–rock reaction. The quartz veins of the III vein set in Piaotang were produced by at least three hydrothermal events represented by the Q1, Q2, and Q3 quartz. During the first hydrothermal event (Q1), the fracture system in the biotite granite reached the percolation threshold driven by high–pressure fluids earlier than those in sandstone, allowing more focused fluid flow in the mechanically stronger granite. This explains why the Q1 quartz in granite–hosted thick veins is volumetrically larger than that of Q1 in the sandstone–hosted thin veins at shallower levels. Then, later mineralizing fluids with lower temperatures passed along the weakness of veins and precipitated the Q2 and Q3 quartz. Determining how much these later hydrothermal events altered the initial vertical zonation of Q1 requires more SEM–CL imaging of the quartz veins at different levels.
Whether the thin veins at shallower levels indicate the occurrence of a blind tungsten deposit at depth is a challenging problem for deep exploration of tungsten deposits in southern China. Our study suggests that the growth histories of those thin veins can be traced by SEM–CL imaging of quartz, which, together with the five–floor zonation model, could be used as a guide for evaluating the mineralization potential at deeper levels.

6. Conclusions

Statistical distributions of vein thickness and ore grade and SEM–CL imaging of quartz at different levels were combined to decipher how the vertical zonation of vein morphology in the Piaotang tungsten–tin deposit was produced, and our results provide the following implications:
(1) Fractal dimensions of both vein thickness and ore metal grade (WO3 and Sn) decrease with increasing depth, while the Weibull modulus α of vein thickness increases with increasing depth.
(2) Three generations (Q1–Q3) of quartz are identified from SEM–CL images of quartz in the III vein set. The first two generations of quartz (Q1 and Q2) are common in the veins at all investigated levels, whereas the Q3 quartz is only identified in some certain veins. Al is the most abundant trace element and its concentrations, together with temperature, possibly controls the CL intensity of the first two generations of quartz.
(3) The vertical trend of vein thickness in Piaotang was initially produced by fluid focusing during the first hydrothermal event represented by the Q1 quartz and altered by later hydrothermal events represented by the Q2 and Q3 quartz.
(4) Statistical analysis of vein thickness and SEM–CL imaging could be used to evaluate the mineralization potential at deeper levels in a meso–scale and a micro–scale, respectively.

Author Contributions

Conceptualization, X.L. and D.Z.; methodology, X.L.; software, X.L. and W.W.; validation, X.L.; formal analysis, X.L.; investigation, X.L.; resources, X.L.; data curation, X.L. and W.W.; writing—original draft preparation, X.L.; writing—review andediting, W.W.; and funding acquisition, D.Z. and W.W. All authors have read and agreed to the published version of the manuscript.

Funding

This research was funded by a CGS RESEARCH FUND, grant number DZLXJK202103, National Natural Science Foundation of China, grant numbers U1939205 and 41822206, and a CHINA GEOLOGICAL SURVEY PROJECT DD20190161.

Data Availability Statement

The study did not report any publicly archived datasets.

Acknowledgments

The authors are grateful to the staff of the Piaotang Tungsten Mine for their help in field work. Zhou Liqin, Zhang Zhichao, and Zhao Linghao were appreciated for their assistance on SEM–CL imaging and LA–ICP–MS analysis, respectively. Three anonymous reviewers are thanked for their comments and advice that improved the original manuscript significantly.

Conflicts of Interest

The authors declare no conflict of interest.

Appendix A

The two–parameter cumulative Weibull distribution C t of vein thickness follows the following function:
C t = e t α β
To calculate the two parameters α and β , use natural logarithmic transformation to the above Equation (A1) twice as follows:
l n C t = t α β ,
l n C t = t α β ,
l n l n C t   =   β l n t α   =   β l n t     β l n α ,
Therefore, l n l n C t is a linear function of l n t where β is the slope and − β l n α is the constant term.

References

  1. Mao, J.W.; Ouyang, H.; Song, S.W.; Santosh, M. Geology and metallogeny of tungsten and tin deposits in China. Rev. Econ. Geol. 2019, 22, 411–482. [Google Scholar]
  2. Zhou, X.M.; Sun, T.; Shen, W.Z.; Shu, L.S.; Niu, Y.L. Petrogenesis of Mesozoic granitoids and volcanic rocks in south China: A response to tectonic evolution. Episodes 2006, 29, 26–33. [Google Scholar] [CrossRef] [PubMed] [Green Version]
  3. Mao, J.W.; Cheng, Y.B.; Chen, M.H.; Pirajno, F. Major types and time-space distribution of mesozoic ore deposits in south China and their geodynamic settings. Miner. Depos. 2013, 48, 267–294. [Google Scholar] [CrossRef]
  4. Gu, J.Y. Morphological zonation of tungsten deposits in south China. In Proceedings of Symposium on Tungsten Geology (Chinese Edition); Geological Publishing House: Nanchang, China, 1984; pp. 35–45. (In Chinese) [Google Scholar]
  5. Liu, Y.J.; Ma, D.S. Vein-type tungsten deposits of China and adjoining regions. Ore Geol. Rev. 1993, 8, 233–246. [Google Scholar]
  6. Li, Y.D. Poly-type model for tungsten deposits and vertical structural zoning model for vein-type tungsten deposits in south China. In Mineral Deposit Modeling; Kirkham, R.V., Sinclair, W.D., Thorpe, R.I., Duke, J.M., Eds.; Geological Association of Canada: St. John’s, NL, Canada, 1993; Volume 40, pp. 555–568. [Google Scholar]
  7. Clarke, M.C.G. Current Chinese thinking on the south China tungsten province. Trans. Inst. Min. Metall. Sect. B 1983, 92, 10–15. [Google Scholar]
  8. Li, W.S.; Ni, P.; Pan, J.Y.; Wang, G.G.; Chen, L.L.; Yang, Y.L.; Ding, J.Y. Fluid inclusion characteristics as an indicator for tungsten mineralization in the Mesozoic Yaogangxian tungsten deposit, central Nanling district, South China. J. Geochem. Explor. 2018, 192, 1–17. [Google Scholar] [CrossRef]
  9. Wang, J.C.; Wei, L.M.; Zhu, W.F.; Wan, F.L.; Mo, Z.M. Texture and tectonic style of five storeyed type for the tungsten deposits in the Nanling mountains, southern China. Acta Geol. Sin. 2008, 82, 894–899, (In Chinese with English Abstract). [Google Scholar]
  10. Li, J.M.; Li, Y.M.; Lou, F.S.; Hu, Z.H.; Zhong, Q.H.; Xie, M.M.; Tang, F.L.; Sha, M. A five-storey style quartz vein wolframite deposit in northern Jiangxi province: The discovery of the Dongping wolframite deposit and its geological significance. Acta Geosci. Sin. 2016, 37, 379–384, (In Chinese with English Abstract). [Google Scholar]
  11. Liu, X.C.; Xing, H.L.; Zhang, D.H. Fluid focusing and its link to vertical morphological zonation at the Dajishan vein-type tungsten deposit, South China. Ore Geol. Rev. 2014, 62, 245–258. [Google Scholar] [CrossRef] [Green Version]
  12. Chen, Y.C.; Pei, R.F.; Zhang, H.L.; Lin, X.D.; Li, C.Y.; Hu, Y.J.; Liu, H.Q.; Xian, B.Q. The Geology of Nonferrous and Rare Metal Deposits Related to Mesozoic Granitoids in Nanling Region, China; Geological Publishing Housing: Beijing, China, 1989; p. 507. [Google Scholar]
  13. Marshall, D.J. Cathodoluminescence of Geological Materials; Unwin Hyman: Boston, MA, USA, 1988; p. 146. [Google Scholar]
  14. Götze, J. Application of cathodoluminescence microscopy and spectroscopy in geosciences. Microsc. Microanal. 2012, 18, 1270–1284. [Google Scholar] [CrossRef] [Green Version]
  15. Götze, J.; Plotze, M.; Habermann, D. Origin, spectral characteristics and practical applications of the cathodoluminescence of quartz—A review. Mineral. Petrol. 2001, 71, 225–250. [Google Scholar] [CrossRef]
  16. Lehmann, K.; Berger, A.; Götte, T.; Ramseyer, K.; Wiedenbeck, M. Growth related zonations in authigenic and hydrothermal quartz characterized by SIMS-, EPMA-, SEM-CL-and SEM-CC-imaging. Mineral. Mag. 2009, 73, 633–643. [Google Scholar] [CrossRef]
  17. Mao, W.; Rusk, B.; Yang, F.; Zhang, M. Physical and chemical evolution of the Dabaoshan porphyry mo deposit, south China: Insights from fluid inclusions, cathodoluminescence, and trace elements in quartz. Econ. Geol. 2017, 112, 889–918. [Google Scholar] [CrossRef]
  18. Müller, A.; Herklotz, G.; Giegling, H. Chemistry of quartz related to the Zinnwald/Cínovec Sn-W-Li greisen-type deposit, Eastern Erzgebirge, Germany. J. Geochem. Explor. 2018, 190, 357–373. [Google Scholar] [CrossRef]
  19. Müller, A.; Seltmann, R.; Behr, H.J. Application of cathodoluminescence to magmatic quartz in a tin granite—Case study from the Schellerhau Granite Complex, Eastern Erzgebirge, Germany. Miner. Depos. 2000, 35, 169–189. [Google Scholar] [CrossRef]
  20. Monecke, T.; Kempe, U.; Götze, J. Genetic significance of the trace element content in metamorphic and hydrothermal quartz: A reconnaissance study. Earth Planet. Sci. Lett. 2002, 202, 709–724. [Google Scholar] [CrossRef]
  21. Rusk, B.; Reed, M. Scanning electron microscope–cathodoluminescence analysis of quartz reveals complex growth histories in veins from the Butte porphyry copper deposit, Montana. Geology 2002, 30, 727–730. [Google Scholar] [CrossRef]
  22. Rusk, B. Cathodoluminescent textures and trace elements in hydrothermal quartz. In Quartz: Deposits, Mineralogy and Analytics; Götze, J., Möckel, R., Eds.; Springer: Berlin/Heidelberg, Germany, 2012; pp. 307–329. [Google Scholar]
  23. Frelinger, S.N.; Ledvina, M.D.; Kyle, J.R.; Zhao, D. Scanning electron microscopy cathodoluminescence of quartz: Principles, techniques and applications in ore geology. Ore Geol. Rev. 2015, 65, 840–852. [Google Scholar] [CrossRef]
  24. Lander, R.H.; Laubach, S.E. Insights into rates of fracture growth and sealing from a model for quartz cementation in fractured sandstones. Geol. Soc. Am. Bull. 2015, 127, 516–538. [Google Scholar] [CrossRef]
  25. Becker, S.P.; Eichhubl, P.; Laubach, S.E.; Reed, R.M.; Lander, R.H.; Bodnar, R.J. A 48 m.y. history of fracture opening, temperature, and fluid pressure: Cretaceous travis peak formation, east Texas basin. Geol. Soc. Am. Bull. 2010, 122, 1081–1093. [Google Scholar] [CrossRef]
  26. Matthews, N.E.; Huber, C.; Pyle, D.M.; Smith, V.C. Timescales of magma recharge and reactivation of large silicic systems from Ti diffusion in quartz. J. Petrol. 2012, 53, 1385–1416. [Google Scholar] [CrossRef] [Green Version]
  27. Wilcock, J.; Goff, F.; Minarik, W.G.; Stix, J. Magmatic recharge during the formation and resurgence of the valles caldera, New Mexico, USA: Evidence from quartz compositional zoning and geothermometry. J. Petrol. 2013, 54, 635–664. [Google Scholar] [CrossRef] [Green Version]
  28. Audétat, A.; Miyajima, N.; Wiesner, D.; Audinot, J.-N. Confirmation of slow Ti diffusion in quartz by diffusion couple experiments and evidence from natural samples. Geology 2021, 49, 963–967. [Google Scholar] [CrossRef]
  29. Zhang, W.L.; Hua, R.M.; Wang, R.C.; Li, H.M.; Qu, W.J.; Ji, J.Q. New dating of the Piaotang granite and related tungsten mineralization in southern Jiangxi. Acta Prtrologica Sin. 2009, 83, 659–670, (In Chinese with English Abstract). [Google Scholar] [CrossRef]
  30. Yang, M.G.; Lu, D.Z. Structural characteristics and pattern in the vein-type tungsten deposits in Xihuasha-Piaotang region. In Symposium on Tungsten Geology; Geological Publishing House: Nanchang, China, 1984; pp. 293–303. [Google Scholar]
  31. Liu, X.C.; Zhang, D.H.; Zhao, B.; Liao, Z.Z.; Liu, C.P. Quantitative analysis of the five-floor vertical morphological zonation in the Piaotang tungsten deposit, South China. Geol. J. China Univ. 2017, 23, 408–416, (In Chinese with English Abstract). [Google Scholar]
  32. He, Z.; Xu, X.; Zou, H.; Wang, X.; Yu, Y. Geochronology, petrogenesis and metallogeny of Piaotang granitoids in the tungsten deposit region of south China. Geochem. J. 2010, 44, 299–313. [Google Scholar] [CrossRef] [Green Version]
  33. Mu, Z.G.; Huang, F.S.; Chen, C.Y. Oxygen, hydrogen and carbon isotope studies of Piantang and Xihuasha quartz vein-type tungsten deposits, Jiangxi province. In Proceedings of Symposium on Tungsten Geology; Geological Publishing House: Nanchang, China, 1984; pp. 153–168. [Google Scholar]
  34. Bai, X.; Wang, M.; Jiang, Y.; Qiu, H. Direct dating of tin—Tungsten mineralization of the Piaotang tungsten deposit, south China, by 40Ar/39Ar progressive crushing. Geochim. Cosmochim. Acta 2013, 114, 1–12. [Google Scholar] [CrossRef]
  35. Liu, S.B.; Wang, D.H.; Chen, Y.C.; Li, J.; Ying, L.; Xu, J.; Zeng, Z. 40Ar/39Ar ages of muscovite from different types of tungsten-bearing quartz veins in the Chong-Yu-You concentrated mineral area in south Jiangxi and its geological significance. Acta Prtrologica Sin. 2008, 82, 932–940, (In Chinese with English Abstract). [Google Scholar]
  36. Deng, X.-D.; Luo, T.; Li, J.-W.; Hu, Z.-C. Direct dating of hydrothermal tungsten mineralization using in situ wolframite U-Pb chronology by laser ablation ICP-MS. Chem. Geol. 2019, 515, 94–104. [Google Scholar] [CrossRef]
  37. Zhang, R.Q.; Lu, J.J.; Lehmann, B.; Li, C.Y.; Li, G.L.; Zhang, L.P.; Guo, J.; Sun, W.D. Combined zircon and cassiterite U-Pb dating of the Piaotang granite-related tungsten-tin deposit, southern Jiangxi tungsten district, China. Ore Geol. Rev. 2017, 82, 268–284. [Google Scholar] [CrossRef]
  38. Zhang, L.G.; Zhuang, L.C.; Qian, Y.Q. Stable isotope geochemistry of granites and tungsten-tin deposits in Xihuashan-Piaotang, Jiangxi province. In Proceedings of Symposium on Tungsten Geology; Geological Publishing House: Nanchang, China, 1984; pp. 325–338. [Google Scholar]
  39. Yang, J.-H.; Kang, L.-F.; Liu, L.; Peng, J.-T.; Qi, Y.-Q. Tracing the origin of ore-forming fluids in the Piaotang tungsten deposit, south China: Constraints from In-Situ analyses of wolframite and individual fluid inclusion. Ore Geol. Rev. 2019, 111, 102939. [Google Scholar] [CrossRef]
  40. Wang, X.; Ni, P.; Jiang, S.; Zhao, K.; Wang, T. Origin of ore-forming fluid in the Piaotang tungsten deposit in Jiangxi province: Evidence from helium and argon isotopes. Chin. Sci. Bull. 2009, 55, 628–634. [Google Scholar] [CrossRef]
  41. Wang, X.D.; Ni, P.; Yuan, S.D.; Wu, S.H. Fluid inclusion studies on coexisting cassiterite and quartz from the Piaotang tungsten deposit, Jiangxi province, China. Acta Geol. Sin. 2013, 87, 850–859, (In Chinese with English Abstract). [Google Scholar]
  42. Ni, P.; Wang, X.D.; Wang, G.G.; Huang, J.B.; Pan, J.Y.; Wang, T.G. An infrared microthermometric study of fluid inclusions in coexisting quartz and wolframite from late Mesozoic tungsten deposits in the Gannan metallogenic belt, south China. Ore Geol. Rev. 2015, 65, 1062–1077. [Google Scholar] [CrossRef]
  43. Legros, H.; Richard, A.; Tarantola, A.; Kouzmanov, K.; Mercadier, J.; Vennemann, T.; Marignac, C.; Cuney, M.; Wang, R.C.; Charles, N.; et al. Multiple fluids involved in granite-related W-Sn deposits from the world-class Jiangxi province (China). Chem. Geol. 2019, 508, 92–115. [Google Scholar] [CrossRef]
  44. Li, Y.D.; Xie, B.C.; Lu, H.L. A Geological Survey Report of the Piaotang Tungsten-Tin Deposit, Dayun County, Jiangxi Province. 909 Team of Jiangxi Geological Bureau, Unpublished report. 1965. [Google Scholar]
  45. André-Mayer, A.S.; Sausse, J. Thickness and spatial distribution of veins in a porphyry copper deposit, Rosia Poieni, Romania. J. Struct. Geol. 2007, 29, 1695–1708. [Google Scholar] [CrossRef]
  46. Gillespie, P.A.; Johnston, J.D.; Loriga, M.A.; McCaffrey, K.J.W.; Walsh, J.J.; Watterson, J. Influence of layering on vein systematics in line samples. Geol. Soc. Lond. Spec. Publ. 1999, 155, 35–56. [Google Scholar] [CrossRef]
  47. Monecke, T.; Gemmell, J.B.; Monecke, J. Fractal distributions of veins in drill core from the Hellyer VHMS deposit, Australia: Constraints on the origin and evolution of the mineralising system. Miner. Depos. 2001, 36, 406–415. [Google Scholar] [CrossRef]
  48. Sanderson, D.J.; Roberts, S.; Gumiel, P.; Greenfield, C. Quantitative analysis of tin-and tungsten-bearing sheeted vein systems. Econ. Geol. 2008, 103, 1043–1056. [Google Scholar] [CrossRef]
  49. Roberts, S.; Sanderson, D.J.; Gumiel, P. Fractal analysis and percolation properties of veins. Geol. Soc. Lond. Spec. Publ. 1999, 155, 7–16. [Google Scholar] [CrossRef]
  50. McCaffrey, K.J.W.; Johnston, J.D. Fractal analysis of a mineralised vein deposit: Curraghinalt gold deposit, county Tyrone. Miner. Depos. 1996, 31, 52–58. [Google Scholar] [CrossRef]
  51. Gumiel, P.; Sanderson, D.; Arias, M.; Roberts, S.; Martín-Izard, A. Analysis of the fractal clustering of ore deposits in the Spanish Iberian Pyrite belt. Ore Geol. Rev. 2010, 38, 307–318. [Google Scholar] [CrossRef]
  52. Deng, B.; Liu, S.; Jansa, L.; Yong, S.; Zhang, Z. Fractal analysis of veins in Permian carbonate rocks in the Lingtanchang anticline, western China. Geofluids 2014, 14, 160–173. [Google Scholar] [CrossRef]
  53. Ledésert, B.; Dubois, J.; Velde, B.; Meunier, A.; Genter, A.; Badri, A. Geometrical and fractal analysis of a three-dimensional hydrothermal vein network in a fractured granite. J. Volcanol. Geotherm. Res. 1993, 56, 267–280. [Google Scholar] [CrossRef]
  54. Bonnet, E.; Bour, O.; Odling, N.E.; Davy, P.; Main, I.; Cowie, P.; Berkowitz, B. Scaling of fracture systems in geological media. Rev. Geophys. 2001, 39, 347. [Google Scholar] [CrossRef] [Green Version]
  55. Kruhl, J.H. Fractal-geometry techniques in the quantification of complex rock structures: A special view on scaling regimes, inhomogeneity and anisotropy. J. Struct. Geol. 2013, 46, 2–21. [Google Scholar] [CrossRef]
  56. Mandelbrot, B. How long is the coast of Britain? Statistical self-similarity and fractional dimension. Science 1967, 156, 636–638. [Google Scholar] [CrossRef] [PubMed] [Green Version]
  57. Turcotte, D.L. Fractals and Chaos in Geology and Geophysics; Cambridge University Press: Cambridge/London, UK, 1997; p. 216. [Google Scholar]
  58. Kruhl, J.H.; Renftel, L.-O. Fractals and Dynamic Systems in Geoscience; Springer: Berlin/Heidelberg, Germany, 1994; p. 421. [Google Scholar]
  59. Bak, P.; Chen, K. The physics of fractals. Phys. D Nonlinear Phenom. 1989, 38, 5–12. [Google Scholar] [CrossRef]
  60. Lahiri, S.; Rana, V.; Bhatt, S.; Mamtani, M.A. Paleostress and statistical analysis using quartz veins from mineralized and non-mineralized zones: Application for exploration targeting. J. Struct. Geol. 2020, 133, 104006. [Google Scholar] [CrossRef]
  61. Mazzarini, F.; Isola, I.; Ruggieri, G.; Boschi, C. Fluid circulation in the upper brittle crust: Thickness distribution, hydraulic transmissivity fluid inclusion and isotopic data of veins hosted in the oligocene sandstones of the macigno formation in southern Tuscany, Italy. Tectonophysics 2010, 493, 118–138. [Google Scholar] [CrossRef]
  62. Fagereng, Å. Fractal vein distributions within a fault-fracture mesh in an exhumed accretionary mélange, Chrystalls beach Complex, New Zealand. J. Struct. Geol. 2011, 33, 918–927. [Google Scholar] [CrossRef]
  63. Hooker, J.N.; Laubach, S.E.; Marrett, R. A universal power-law scaling exponent for fracture apertures in sandstones. GSA Bull. 2014, 126, 1340–1362. [Google Scholar] [CrossRef]
  64. Shen, W.; Zhao, P. Theoretical study of statistical fractal model with applications to mineral resource prediction. Comput. Geosci. 2002, 28, 369–376. [Google Scholar] [CrossRef]
  65. Weibull, W. A statistical distribution function of wide applicability. J. Appl. Mech. 1951, 18, 293–297. [Google Scholar] [CrossRef]
  66. Zhang, H.; Wang, Z.Z.; Ruan, B.T.; Li, Z.; Zhao, W.; Ranjith, P.G.; Wang, T. A brittleness evaluation method of rock constitutive relationship with Weibull distribution based on double-body system theory. Energy Sci. Eng. 2020, 8, 3333–3347. [Google Scholar] [CrossRef]
  67. Tang, C.A.; Liang, Z.Z.; Zhang, Y.B.; Chang, X.; Tao, X.; Wang, D.G.; Zhang, J.X.; Liu, J.S.; Zhu, W.C.; Elsworth, D. Fracture spacing in layered materials: A new explanation based on two-dimensional failure process modeling. Am. J. Sci. 2008, 308, 49–72. [Google Scholar] [CrossRef]
  68. Wong, T.-F.; Wong, R.H.C.; Chau, K.T.; Tang, C.A. Microcrack statistics, Weibull distribution and micromechanical modeling of compressive failure in rock. Mech. Mater. 2006, 38, 664–681. [Google Scholar] [CrossRef]
  69. Krumbholz, M.; Hieronymus, C.F.; Burchardt, S.; Troll, V.R.; Tanner, D.C.; Friese, N. Weibull-distributed dyke thickness reflects probabilistic character of host-rock strength. Nat. Commun. 2014, 5, 3272. [Google Scholar] [CrossRef] [PubMed] [Green Version]
  70. Jayatilaka, A.D.S.; Trustrum, K. Statistical approach to brittle fracture. J. Mater. Sci. 1977, 12, 1426–1430. [Google Scholar] [CrossRef]
  71. Sanderson, D.J.; Roberts, S.; Gumiel, P. A fractal relationship between vein thickness and gold grade in drill core from La Codosera, Spain. Econ. Geol. 1994, 89, 168–173. [Google Scholar] [CrossRef]
  72. Brathwaite, R.L.; Cargill, H.J.; Christie, A.B.; Swain, A. Lithological and spatial controls on the distribution of quartz veins in andesite-and rhyolite-hosted epithermal Au-Ag deposits of the Hauraki Goldfield, New Zealand. Miner. Depos. 2001, 36, 1–12. [Google Scholar] [CrossRef]
  73. Deng, J.; Wang, Q.F.; Wan, L.; Yang, L.; Gong, Q.; Zhao, J.; Liu, H. Self-similar fractal analysis of gold mineralization of Dayingezhuang disseminated-veinlet deposit in Jiaodong gold province, China. J. Geochem. Explor. 2009, 102, 95–102. [Google Scholar] [CrossRef]
  74. Ford, A.; Blenkinsop, T.G. An expanded de Wijs model for multifractal analysis of mineral production data. Miner. Depos. 2009, 44, 233–240. [Google Scholar] [CrossRef]
  75. Allegre, C.J.; Lewin, E. Scaling laws and geochemical distributions. Earth Planet. Sci. Lett. 1995, 132, 1–13. [Google Scholar] [CrossRef]
  76. Monecke, T.; Monecke, J.; Herzig, P.M.; Bruce Gemmell, J.; Mönch, W. Truncated fractal frequency distribution of element abundance data: A dynamic model for the metasomatic enrichment of base and precious metals. Earth Planet. Sci. Lett. 2005, 232, 363–378. [Google Scholar] [CrossRef]
  77. Nazarpour, A.; Sadeghi, B.; Sadeghi, M. Application of fractal models to characterization and evaluation of vertical distribution of geochemical data in Zarshuran gold deposit, NW Iran. J. Geochem. Explor. 2015, 148, 60–70. [Google Scholar] [CrossRef]
  78. Zuo, R.; Cheng, Q.; Xia, Q. Application of fractal models to characterization of vertical distribution of geochemical element concentration. J. Geochem. Explor. 2009, 102, 37–43. [Google Scholar] [CrossRef]
  79. Wang, Q.F.; Deng, J.; Liu, H.; Yang, L.; Wan, L.; Zhang, R. Fractal models for ore reserve estimation. Ore Geol. Rev. 2010, 37, 2–14. [Google Scholar] [CrossRef]
  80. Zuo, R.; Wang, J. Fractal/multifractal modeling of geochemical data: A review. J. Geochem. Explor. 2016, 164, 33–41. [Google Scholar] [CrossRef]
  81. Ahrens, L.H. The lognormal distribution of the elements (a fundamental law of geochemistry and its subsidiary). Geochim. Cosmochim. Acta 1954, 5, 49–73. [Google Scholar] [CrossRef]
  82. Hu, M.Y.; He, H.L.; Zhan, X.C.; Fan, X.T.; Wang, G.; Jia, Z.R. Matrix normalization for in-situ multi-element quantitative analysis of zircon in laser-ablation-inductively coupled plasma mass spectrometry. Chin. J. Anal. Chem. 2008, 36, 947–953, (In Chinese with English Abstract). [Google Scholar]
  83. Götze, J.; Plötze, M.; Graupner, T.; Hallbauer, D.K.; Bray, C.J. Trace element incorporation into quartz: A combined study by ICP-MS, electron spin resonance, cathodoluminescence, capillary ion analysis, and gas chromatography 1. Geochim. Cosmochim. Acta 2004, 68, 3741–3759. [Google Scholar] [CrossRef]
  84. Haddad-Martim, P.M.; Carranza, E.J.M.; de Souza Filho, C.R. The fractal nature of structural controls on ore formation: The case of the iron oxide copper-gold deposits in the Carajás mineral province, Brazilian amazon. Econ. Geol. 2018, 113, 1499–1524. [Google Scholar] [CrossRef]
  85. Das, R.; Zhang, Y.; Schaubs, P.; Cleary, P.W. Modelling rock fracturing caused by magma intrusion using the smoothed particle hydrodynamics method. Comput. Geosci. 2014, 18, 927–947. [Google Scholar] [CrossRef]
  86. Bergbauer, S.; Martel, S.J. Formation of joints in cooling plutons. J. Struct. Geol. 1999, 21, 821–835. [Google Scholar] [CrossRef]
  87. Zhang, Y.; Cheng, J.M.; Tian, J.; Pan, J.; Sun, S.Q.; Zhang, L.J.; Zhang, S.; Chu, G.; Zhao, Y.; Lai, C. Texture and trace element geochemistry of quartz in skarn system: Perspective from Jiguanzui Cu-Au skarn deposit, eastern China. Ore Geol. Rev. 2019, 109, 535–544. [Google Scholar] [CrossRef]
  88. Ni, P.; Pan, J.Y.; Wang, G.G.; Chi, Z.; Qin, H.; Ding, J.-Y.; Chen, H. A CO2-rich porphyry ore-forming fluid system constrained from a combined cathodoluminescence imaging and fluid inclusion studies of quartz veins from the Tongcun Mo deposit, south China. Ore Geol. Rev. 2017, 81, 856–870. [Google Scholar] [CrossRef]
  89. Launay, G.; Sizaret, S.; Lach, P.; Melleton, J.; Gloaguen, É.; Poujol, M. Genetic relationship between greisenization and Sn-W mineralizations in vein and greisen deposits: Insights from the Panasqueira deposit (Portugal). Bull. Soc. Geol. Fr. 2021, 192. [Google Scholar] [CrossRef]
  90. Peterková, T.; Dolejš, D. Magmatic-hydrothermal transition of Mo-W-mineralized granite-pegmatite-greisen system recorded by trace elements in quartz: Krupka district, Eastern Krušné hory/Erzgebirge. Chem. Geol. 2019, 523, 179–202. [Google Scholar] [CrossRef]
  91. Götze, J. Chemistry, textures and physical properties of quartz—geological interpretation and technical application. Mineral. Mag. 2009, 73, 645–671. [Google Scholar] [CrossRef]
  92. Mercer, C.N.; Reed, M.H.; Mercer, C.M. Time scales of porphyry Cu deposit formation: Insights from titanium diffusion in quartz. Econ. Geol. 2015, 110, 587–602. [Google Scholar] [CrossRef]
  93. Ma, Y. Characteristics of Catholuminescence and Fluid Inclusions of Quartz in the Piaotang Tungsten-Tin Deposit, Jiangxi Province; China University of Geosciences: Beijing, China, 2019; p. 75. [Google Scholar]
  94. Shan, F. The geological characteristics of the Piaotang tungsten-tin deposit. Acta Geol. Sin. Chin. Ed. 1976, 50, 1–16. [Google Scholar]
  95. Legros, H.; Marignac, C.; Tabary, T.; Mercadier, J.; Richard, A.; Cuney, M.; Wang, R.C.; Charles, N.; Lespinasse, M.Y. The ore-forming magmatic-hydrothermal system of the Piaotang W-Sn deposit (Jiangxi, China) as seen from Li-mica geochemistry. Am. Miner. 2018, 103, 39–54. [Google Scholar] [CrossRef]
  96. Bons, P.D.; Elburg, M.A.; Gomez-Rivas, E. A review of the formation of tectonic veins and their microstructures. J. Struct. Geol. 2012, 43, 33–62. [Google Scholar] [CrossRef]
  97. Oliver, N.H.S.; Bons, P.D. Mechanisms of fluid flow and fluid–rock interaction in fossil metamorphic hydrothermal systems inferred from vein-wallrock patterns, geometry and microstructure. Geofluids 2001, 1, 137–162. [Google Scholar] [CrossRef]
  98. Roberts, S.; Sanderson, D.J.; Gumiel, P. Fractal analysis of Sn-W mineralization from central Iberia: Insights into the role of fracture connectivity in the formation of an ore deposit. Econ. Geol. 1998, 93, 360–365. [Google Scholar] [CrossRef]
  99. Sanderson, D.J.; Zhang, X. Critical stress localization of flow associated with deformation of well-fractured rock masses, with implications for mineral deposits. Geol. Soc. Lond. Spec. Publ. 1999, 155, 69–81. [Google Scholar] [CrossRef]
  100. Cox, S.F. Structural and isotopic constraints on fluid flow regimes and fluid pathways during upper crustal deformation: An example from the Taemas area of the Lachlan Orogen, SE Australia. J. Geophys. Res. Solid Earth 2007, 112, B08208. [Google Scholar] [CrossRef] [Green Version]
  101. Barnhoorn, A.; Cox, S.F.; Robinson, D.J.; Senden, T. Stress-and fluid-driven failure during fracture array growth: Implications for coupled deformation and fluid flow in the crust. Geology 2010, 38, 779–782. [Google Scholar] [CrossRef]
  102. Xiong, Y.; Zuo, R.; Clarke, K.C.; Miller, S.A.; Wang, J. Modeling singular mineralization processes due to fluid pressure fluctuations. Chem. Geol. 2020, 535, 119458. [Google Scholar] [CrossRef] [Green Version]
Figure 1. The vertical zoning of vein–type tungsten deposits in southern China (modified from [4]).
Minerals 11 00883 g001
Figure 2. (a) A regional geological map of the Xihuashan–Piaotang mineralization belt (revised from [30]); (b) a planar view of the Piaotang deposit (revised from [31]). 1, Quaternary; 2, Middle Devonian; 3, Middle–Upper Cambrian; 4, axes of syncline; 5, fault; 6, vein–type tungsten deposits; 7, granite.
Minerals 11 00883 g002
Figure 3. (a) A cross section of the Piaotang deposit along the 7th exploration line (revised from [31]). The dotted lines (e.g., 448 m) refer to the elevations of tunnels, and the Roman characters like III represent the vein sets. (b,c) are typical veins of the III vein set at the levels of 448 m and 268 m, respectively.
Minerals 11 00883 g003
Figure 4. An equal-area upper-hemisphere projection plots the dip direction and angle of quartz veins (a) and joints (b) in Piaotang.
Minerals 11 00883 g004
Figure 5. Log-log plots of the cumulative number N t of veins against vein thickness at different levels. N t is the number of veins whose vein thickness is larger than t, D is the fractal dimension (the slope of the fitted line multiplied by −1), and R 2 is the corresponding fitting degree. The slope of the fitted line is −D. The vein thickness and N t have been transformed by natural logarithm.
Minerals 11 00883 g005
Figure 6. The fitted Weibull distribution of vein thickness at different levels. The X-axis is the logarithmically transformed vein thickness. For Y-axis, the Appendix A shows the linear relationship between l n l n C t and l n t . β is the slope of the fitted line.
Minerals 11 00883 g006
Figure 7. Log–log plots of the cumulative number of veins against WO3 (a) and Sn (b) grade data at different levels. N W O 3 and N S n are the numbers of veins whose WO3 (a) and Sn (b) grades higher than given values. D is the fractal dimension and R 2 is the corresponding fitting degree. The slope of the fitted line is −D.
Minerals 11 00883 g007
Figure 8. Plane-polarized and SEM–CL panchromatic images of the quartz adjacent to wolframite and cassiterite at different levels. (a,b) are the same quartz under plane-polarized and SEM–CL, respectively. (c,d) show SEM–CL images of the quartz adjacent to wolframite and cassiterite, respectively. The SEM–CL images of quartz are bright except many dark microcracks. Wf, wolframite; Cst, cassiterite; and Qtz, quartz.
Minerals 11 00883 g008
Figure 9. Composite SEM–CL panchromatic images of the samples PT17-3 (a) and PT17-6 (b). The early CL–bright quartz (Q1) accounts for a much larger proportion of the images than another generation of CL–dark quartz (Q2).
Minerals 11 00883 g009
Figure 10. Composite SEM–CL panchromatic images of the sample PT17-5 at the 268 m level. The CL–bright quartz is crosscut by CL–dark quartz.
Minerals 11 00883 g010
Figure 11. Composite SEM–CL panchromatic images of the samples PT17-32 (a) and PT17-33 (b) at the 328 m level. (a) The CL–bright generation of quartz (Q1) is crosscut by a late CL–dark generation of quartz; (b) The first generation of quartz (Q1) is crosscut by another late CL–bright generation of quartz (Q3), part of which was crystallized along micro fractures.
Minerals 11 00883 g011
Figure 12. Composite SEM–CL panchromatic images of the samples PT17-12 (a) and PT17-26 (b) at the 448 m level. Two generations of quartz were identified from the SEM–CL images. The early CL–bright generation of quartz (Q1) is crosscut by the second CL–dark generation of quartz (Q2). The euhedral CL–bright quartz in Figure 12(b2) is interpreted to belong to the first generation of quartz Q1 rather than another generation of quartz for two reasons. The first reason is that the growth zones of this euhedral quartz look similar to other CL images of quartz at the same level. The second reason is that this euhedral quartz is almost covered by Q2, indicating that this euhedral quartz may precede Q2.
Minerals 11 00883 g012
Figure 13. Concentrations of trace elements in the two generations of quartz Q1 and Q2.
Minerals 11 00883 g013
Figure 14. A scatter diagram of Al−P against Li + Na + K concentrations in the two generations of quartz. The dotted line represents the molar ratio (Al−P):(Li + Na + K) = 1:1.
Minerals 11 00883 g014
Table 1. Statistical data of vein thickness and ore grade at different levels.
Level (m)Average Vein Thickness (cm) D t α β Average WO3 Grade (%) D W o 3 Average Sn Grade (%) D S n
6763.092.300.0341.290.051.680.041.62
4485.321.870.0350.690.091.080.051.31
3289.311.440.0630.650.230.910.111.02
D t is the fractal dimension of the vein thickness; α and β are the fitted Weibull distribution parameters of the vein thickness; and D W o 3 and D S n are the fractal dimensions of the WO3 and Sn grade data, respectively.
Table 2. The vein samples used for SEM–CL mapping.
Level (m)Sample IDSampling LocationsImages
448PT17-7III vein set, 15th exploration line55
PT17-12III vein set, 30 m west of 15th exploration line110
PT17-17III vein set, 19th exploration line45
PT17-23III vein set, 19th exploration line18
PT17-25III vein set, 19th exploration line16
PT17-26III vein set, 19thexploration line21
328PT17-32III vein set, 15th exploration line18
PT17-33III vein set, 13th exploration line15
268PT17-3III vein set, 7 m west of 15th exploration line33
PT17-4III vein set, 15 m west of 15th exploration line12
PT17-5III vein set, 1 m west of 15th exploration line9
PT17-6III vein set, 7 m east of 7th exploration line18
The 13th exploration line lies between the 11th and 15th exploration lines (see Figure 2b).
Table 3. In situ trace element concentrations of quartz in the Piaotang deposit.
SamplePT17-23PT17-26
ppm1234512345
Li13.93 10.24 4.55 2.68 20.93 -9.63 1.37 -1.34
B--2.37 11.68 1.48 -7.00 11.59 9.05 -
Na2O39.03 12.83 21.83 35.95 20.91 -23.64 -6.72 19.94
MgO2.29 1.47 --6.10 -6.71 -26.39 9.34
Al2O3211.30 96.34 83.19 168.20 459.00 19.59 83.31 80.06 71.12 82.26
P2O541.75 29.66 30.31 33.99 34.57 40.54 54.88 24.74 26.28 61.23
K2O7.31 --20.77 21.19 ----0.14
Sc1.41 1.67 1.49 1.32 1.75 2.22 1.32 1.19 1.80 2.98
TiO23.93 8.28 4.22 6.65 5.79 2.23 -2.96 2.89 3.48
Cr24.02 10.14 20.70 31.60 21.56 15.56 18.30 5.99 15.89 25.69
MnO1.09 0.38 0.88 0.47 2.66 -2.72 -1.15 -
FeO(t)5.40 ----5.50 31.78 -33.11 59.03
Ni3.49 2.44 9.30 4.43 9.89 24.15 -25.11 -26.65
Ge4.16 3.56 3.64 2.13 5.04 4.50 2.78 0.51 2.67 3.50
As0.67 1.11 0.07 0.70 1.24 1.20 4.76 --1.31
SamplePT17-3PT17-6
ppm1234567891012345
Li45.38 14.04 24.02 23.06 41.50 10.91 18.14 29.39 11.43 21.74 6.54 25.43 27.57 37.43 13.67
B0.98 2.31 -5.54 -0.44 0.88 0.39 -0.75 --2.82 --
Na2O-112.30 -82.77 12.16 16.92 29.89 36.73 11.33 -60.19 5.24 29.03 --
MgO12.78 26.75 7.65 -5.61 -26.48 -5.00 2.17 13.23 29.98 21.68 -10.83
Al2O3593.90 161.00 307.40 288.00 298.60 178.30 247.70 246.50 220.10 364.20 193.90 229.10 299.60 262.90 171.40
P2O579.35 22.42 4.12 55.66 38.43 75.12 68.08 76.25 37.63 37.55 30.75 59.21 38.93 65.61 83.77
K2O1.08 2.65 -27.17 ----0.72 --4.19 ---
Sc2.63 2.80 1.50 2.92 2.04 2.19 2.39 2.26 2.20 1.93 1.26 0.98 1.31 2.44 1.06
TiO27.04 -8.32 -11.68 1.96 2.89 --5.41 7.47 3.94 2.45 9.03 3.04
Cr13.86 0.58 3.95 13.34 14.18 11.48 12.62 -19.28 16.88 0.30 27.52 23.27 30.07 2.20
MnO-0.54 -1.16 1.32 1.32 --0.66 0.04 0.23 2.45 0.74 -0.51
FeO(t)-76.92 4.79 ----7.36 --32.86 ----
Ni57.92 4.31 -1.32 9.68 15.37 15.12 -22.38 4.10 3.85 -85.42 22.26 -
Ge4.47 4.37 1.23 3.28 1.73 3.79 2.36 1.48 0.86 2.12 2.24 1.21 2.18 3.12 3.53
As-0.93 -1.31 -2.25 ---0.28 -0.18 -0.92 3.47
Values below detection limits are indicated by ‘-’.
Publisher’s Note: MDPI stays neutral with regard to jurisdictional claims in published maps and institutional affiliations.

