
Stability of Atrazine–Smectite Intercalates: Density Functional Theory and Experimental Study


Abstract
:
1. Introduction
2. Materials and Methods
2.1. Experimental Details
2.2. Computational Details
2.3. Computational Models
3. Results and Discussion
3.1. Structural Relaxation
3.1.1. Montmorillonite Complex Structures
3.1.2. Beidellite Complex Structures
3.2. Hydrogen Bonding
3.3. Infrared Spectra
3.3.1. A-Mt and A-TMP-Mt Structures
3.3.2. A-Bd and A-TMP-Bd Structures
3.4. Estimation of Adsorption Amount of Atrazine through FTIR Spectra Analysis
4. Conclusions
Author Contributions
Funding
Acknowledgments
Conflicts of Interest
References
- Jablonowski, N.D.; Schaffer, A.; Burauel, P. Still present after all these years: Persistence plus potential toxicity raise questions about the use of atrazine. Environ. Sci. Pollut. Res. 2011, 18, 328–331. [Google Scholar] [CrossRef] [Green Version]
- Langlois, V.S.; Carew, A.C.; Pauli, B.D.; Wade, M.G.; Cooke, G.M.; Trudeau, V.L. Low Levels of the Herbicide Atrazine Alter Sex Ratios and Reduce Metamorphic Success in Rana pipiens Tadpoles Raised in Outdoor Mesocosms. Environ. Health Perspect. 2010, 118, 552–557. [Google Scholar] [CrossRef] [Green Version]
- Olivier, H.M.; Moon, B.R. The effects of atrazine on spotted salamander embryos and their symbiotic alga. Ecotoxicology 2010, 19, 654–661. [Google Scholar] [CrossRef]
- Rohr, J.R.; McCoy, K.A. A Qualitative Meta-Analysis Reveals Consistent Effects of Atrazine on Freshwater Fish and Amphibians. Environ. Health Perspect. 2010, 118, 20–32. [Google Scholar] [CrossRef] [Green Version]
- Enoch, R.R.; Stanko, J.P.; Greiner, S.N.; Youngblood, G.L.; Rayner, J.L.; Fenton, S.E. Mammary gland development as a sensitive end point after acute prenatal exposure to an atrazine metabolite mixture in female long-evans rats. Environ. Health Perspect. 2007, 115, 541–547. [Google Scholar] [CrossRef] [Green Version]
- Hayes, T.B.; Anderson, L.L.; Beasley, V.R.; de Solla, S.R.; Iguchi, T.; Ingraham, H.; Kestemont, P.; Kniewald, J.; Kniewald, Z.; Langlois, V.S.; et al. Demasculinization and feminization of male gonads by atrazine: Consistent effects across vertebrate classes. J. Steroid Biochem. Mol. Biol. 2011, 127, 64–73. [Google Scholar] [CrossRef] [PubMed] [Green Version]
- Munger, R.; Isacson, P.; Hu, S.; Burns, T.; Hanson, J.; Lynch, C.F.; Cherryholmes, K.; VanDorpfe, P.; Hausler, W.J. Intrauterine growth retardation in Iowa communities with herbicide-contaminated drinking water supplies. Environ. Health Perspect. 1997, 105, 308–314. [Google Scholar] [CrossRef]
- MacLennan, P.A.; Delzell, E.; Sathiakumar, N.; Myers, S.L.; Cheng, H.; Grizzle, W.; Chen, V.W.; Wu, X.C. Cancer incidence among triazine herbicide manufacturing workers. J. Occup. Environ. Med. 2002, 44, 1048–1058. [Google Scholar] [CrossRef]
- De Roos, A.J.; Zahm, S.H.; Cantor, K.P.; Weisenburger, D.D.; Holmes, F.F.; Burmeister, L.F.; Blair, A. Integrative assessment of multiple pesticides as risk factors for non-Hodgkin’s lymphoma among men. Occup. Environ. Med. 2003, 60, 11. [Google Scholar] [CrossRef] [Green Version]
- Rusiecki, J.A.; De Roos, A.; Lee, W.J.; Dosemeci, M.; Lubin, J.H.; Hoppin, J.A.; Blair, A.; Alavanja, M.C.R. Cancer incidence among pesticide applicators exposed to atrazine in the agricultural health study. J. Natl. Cancer Inst. 2004, 96, 1375–1382. [Google Scholar] [CrossRef]
- Villanueva, C.M.; Durand, G.; Coutte, M.B.; Chevrier, C.; Cordier, S. Atrazine in municipal drinking water and risk of low birth weight, preterm delivery, and small-for-gestational-age status. Occup. Environ. Med. 2005, 62, 400–405. [Google Scholar] [CrossRef] [Green Version]
- Gojmerac, T.; Kartal, B.; Ćurić, S.; Žurić, M.; Kušević, S.; Cvetnić, Ž. Serum biochemical changes associated with cystic ovarian degeneration in pigs after atrazine treatment. Toxicol. Lett. 1996, 85, 9–15. [Google Scholar] [CrossRef]
- Pruett, S.B.; Fan, R.P.; Zheng, Q.; Myers, L.P.; Hebert, P. Modeling and predicting immunological effects of chemical stressors: Characterization of a quantitative biomarker for immunological changes caused by atrazine and ethanol. Toxicol. Sci. 2003, 75, 343–354. [Google Scholar] [CrossRef] [Green Version]
- McMullin, T.S.; Andersen, M.E.; Nagahara, A.; Lund, T.D.; Pak, T.; Handa, R.J.; Hanneman, W.H. Evidence that atrazine and diaminochlorotriazine inhibit the estrogen/progesterone induced surge of luteinizing hormone in female Sprague-Dawley rats without changing estrogen receptor action. Toxicol. Sci. 2004, 79, 278–286. [Google Scholar] [CrossRef] [Green Version]
- Modic, W.M. The Role of Testicular Aromatase in the Atrazine Mediated Changes of Estrone and Estradiol in the Male Wistar Rat. Master’s Thesis, North Carolina State University, Raleigh, NC, USA, 2004. [Google Scholar]
- Giusi, G.; Facciolo, R.M.; Canonaco, M.; Alleva, E.; Belloni, V.; Dessi’-Fulgheri, F.; Santucci, D. The Endocrine Disruptor Atrazine Accounts for a Dimorphic Somatostatinergic Neuronal Expression Pattern in Mice. Toxicol. Sci. 2006, 89, 257–264. [Google Scholar] [CrossRef] [Green Version]
- Cooper, R.L.; Laws, S.C.; Das, P.C.; Narotsky, M.G.; Goldman, J.M.; Tyrey, E.L.; Stoker, T.E. Atrazine and reproductive function: Mode and mechanism of action studies. Birth Defects Res. Part B-Dev. Reprod. Toxicol. 2007, 80, 98–112. [Google Scholar] [CrossRef]
- Suzawa, M.; Ingraham, H.A. The Herbicide Atrazine Activates Endocrine Gene Networks via Non-Steroidal NR5A Nuclear Receptors in Fish and Mammalian Cells. PLoS ONE 2008, 3, e2117. [Google Scholar] [CrossRef]
- Laws, S.C.; Hotchkiss, M.; Ferrell, J.; Jayaraman, S.; Mills, L.; Modic, W.; Tinfo, N.; Fraites, M.; Stoker, T.; Cooper, R. Chlorotriazine Herbicides and Metabolites Activate an ACTH-dependent Release of Corticosterone in Male Wistar Rats. Toxicol. Sci. 2009, 112, 78–87. [Google Scholar] [CrossRef] [Green Version]
- Gore, A.C.; Chappell, V.A.; Fenton, S.E.; Flaws, J.A.; Nadal, A.; Prins, G.S.; Toppari, J.; Zoeller, R.T. EDC-2: The Endocrine Society’s Second Scientific Statement on Endocrine-Disrupting Chemicals. Endocr. Rev. 2015, 36, E1–E150. [Google Scholar] [CrossRef]
- Fan, W.Q.; Yanase, T.; Morinaga, H.; Ondo, S.; Okabe, T.; Nomura, M.; Komatsu, T.; Morohashi, K.I.; Hayes, T.B.; Takayanagi, R.; et al. Atrazine-induced aromatase expression is SF-1 dependent: Implications for endocrine disruption in wildlife and reproductive cancers in humans. Environ. Health Perspect. 2007, 115, 720–727. [Google Scholar] [CrossRef]
- E.U Commission Decision of 10 March 2004. 2004. Available online: https://eur-lex.europa.eu/eli/dec/2004/248/oj (accessed on 3 August 2018).
- USEPA Decision Documents for Atrazine. 2006. Available online: https://archive.epa.gov/region5/teach/web/pdf/atrazine_summary.pdf (accessed on 3 August 2018).
- Belzunces, B.; Hoyau, S.; Benoit, M.; Tarrat, N.; Bessac, F. Theoretical Study of the Atrazine Pesticide Interaction with Pyrophyllite and Ca2+—Montmorillonite Clay Surfaces. J. Comput. Chem. 2017, 38, 133–143. [Google Scholar] [CrossRef] [PubMed]
- Davies, J.E.D.; Jabeen, N. The Adsorption of Herbicides and Pesticides on Clay Minerals and Soils. Part 2. Atrazine. J. Incl. Phenom. 2003, 46, 57–64. [Google Scholar] [CrossRef]
- Grundgeiger, E.; Lim, Y.H.; Frost, R.L.; Ayoko, G.A.; Xi, Y. Application of organo-beidellites for the adsorption of atrazine. Appl. Clay Sci. 2015, 105–106, 252–258. [Google Scholar] [CrossRef] [Green Version]
- Zarpon, L.; Abate, G.; dos Santos, L.B.; Masini, J.C. Montmorillonite as an adsorbent for extraction and concentration of atrazine, propazine, deethylatrazine, deisopropylatrazine and hydroxyatrazine. Anal. Chim. Acta 2006, 579, 81–87. [Google Scholar] [CrossRef] [PubMed]
- Belzunces, B.; Hoyau, S.; Bessac, F. Interaction of Metamitron and Fenhexamid with Ca2+-Montmorillonite Clay Surfaces: A Density Functional Theory Molecular Dynamics Study. J. Comput. Chem. 2019, 40, 1449–1462. [Google Scholar] [CrossRef] [PubMed]
- Polati, S.; Angioi, S.; Gianotti, V.; Gosetti, F.; Gennaro, M.C. Sorption of pesticides on kaolinite and montmorillonite as a function of hydrophilicity. J. Environ. Sci. Heal. Part B Pestic. Food Contam. Agric. Wastes 2006, 41, 333–344. [Google Scholar] [CrossRef]
- Aggarwal, V.; Li, H.; Teppen, B.J. Triazine adsorption by saponite and beidellite clay minerals. Environ. Toxicol. Chem. 2006, 25, 392–399. [Google Scholar] [CrossRef]
- Manzotti, F.; dos Santos, O.A.A. Evaluation of removal and adsorption of different herbicides on commercial organophilic clay. Chem. Eng. Commun. 2019, 206, 1526–1543. [Google Scholar] [CrossRef]
- Paiva, L.B.; Morales, A.R. Organophilic bentonites based on argentinean and brazilian bentonites. Part 1: Influence of intrinsic properties of sodium bentonites on the final properties of organophilic bentonites prepared by solid-liquid and semisolid reactions. Braz. J. Chem. Eng. 2012, 29, 525–536. [Google Scholar] [CrossRef] [Green Version]
- Szczerba, M.; Kalinichev, A.G.; Kowalik, M. Intrinsic hydrophobicity of smectite basal surfaces quantitatively probed by molecular dynamics simulations. Appl. Clay Sci. 2020, 188, 105497. [Google Scholar] [CrossRef]
- Andrunik, M.; Bajda, T. Modification of bentonite with cationic and nonionic surfactants: Structural and textural features. Materials 2019, 12, 3772. [Google Scholar] [CrossRef] [PubMed] [Green Version]
- Kukkadapu, R.K.; Boyd, S.A. Tetramethylphosphonium-smectite and tetramethylammonium-smectite as adsorbents of aromatic and chlorinated hydrocarbons—Effect of water on adsorption efficiency. Clays Clay Miner. 1995, 43, 318–323. [Google Scholar] [CrossRef]
- Scholtzová, E.; Madejová, J.; Tunega, D. Structural properties of montmorillonite intercalated with tetraalkylammonium cations—Computational and experimental study. Vib. Spectrosc. 2014, 74, 120–126. [Google Scholar] [CrossRef]
- Guégan, R. Organoclay applications and limits in the environment. Comptes Rendus Chim. 2019, 22, 132–141. [Google Scholar] [CrossRef]
- de Paiva, L.B.; Morales, A.R.; Diaz, F.R. V Organoclays: Properties, preparation and applications. Appl. Clay Sci. 2008, 42, 8–24. [Google Scholar] [CrossRef]
- Chun, Y.; Sheng, G.Y.; Boyd, S.A. Sorptive characteristics of tetraalkylammonium-exchanged smectite clays. Clays Clay Miner. 2003, 51, 415–420. [Google Scholar] [CrossRef]
- Lagaly, G.; Ogawa, M.; Dékány, I. Clay Mineral-Organic interactions. In Developments in Clay Science; Bergaya, B.K.G., Theng, G., Lagaly, H., Eds.; Elsevier: Amsterdam, The Netherlands, 2013; pp. 435–506. [Google Scholar]
- Vaia, R.A.; Teukolsky, R.K.; Giannelis, E.P. Interlayer structure and molecular environment of alkylammonium layered silicates. Chem. Mater. 1994, 6, 1017–1022. [Google Scholar] [CrossRef]
- Mishra, A.K.; Allauddin, S.; Narayan, R.; Aminabhavi, T.M.; Raju, K. Characterization of surface-modified montmorillonite nanocomposites. Ceram. Int. 2012, 38, 929–934. [Google Scholar] [CrossRef]
- Mittal, V. Modification of montmorillonites with thermally stable phosphonium cations and comparison with alkylammonium montmorillonites. Appl. Clay Sci. 2012, 56, 103–109. [Google Scholar] [CrossRef]
- Carvalho, P.J.; Ventura, S.P.M.; Batista, M.L.S.; Schroder, B.; Goncalves, F.; Esperanca, J.; Mutelet, F.; Coutinho, J.A.P. Understanding the impact of the central atom on the ionic liquid behavior: Phosphonium vs ammonium cations. J. Chem. Phys. 2014, 140, 064505. [Google Scholar] [CrossRef]
- Alves, J.L.; Rosa, P.; Morales, A.R. A comparative study of different routes for the modification of montmorillonite with ammonium and phosphonium salts. Appl. Clay Sci. 2016, 132, 475–484. [Google Scholar] [CrossRef]
- Palkova, H.; Zimowska, M.; Jankovic, L.; Sulikowski, B.; Serwicka, E.M.; Madejova, J. Thermal stability of tetrabutyl-phosphonium and -ammonium exchanged montmorillonite: Influence of acid treatment. Appl. Clay Sci. 2017, 138, 63–73. [Google Scholar] [CrossRef]
- Scholtzova, E.; Jankovic, L.; Tunega, D. Stability of Tetrabutylphosphonium Beidellite Organoclay. J. Phys. Chem. C 2018, 122, 8380–8389. [Google Scholar] [CrossRef]
- Scholtzova, E.; Tunega, D. Density functional theory study of the stability of the tetrabutylphosphonium and tetrabutylammonium montmorillonites. Clay Miner. 2019, 54, 41–48. [Google Scholar] [CrossRef]
- Krajňák, A.; Viglašová, E.; Galamboš, M.; Krivosudský, L. Application of HDTMA-intercalated bentonites in water waste treatment for U(VI) removal. J. Radioanal. Nucl. Chem. 2017, 314, 2489–2499. [Google Scholar] [CrossRef]
- Mellouk, S.; Cherifi, S.; Sassi, M.; Marouf-Khelifa, K.; Bengueddach, A.; Schott, J.; Khelifa, A. Intercalation of halloysite from Djebel Debagh (Algeria) and adsorption of copper ions. Appl. Clay Sci. 2009, 44, 230–236. [Google Scholar] [CrossRef]
- Wang, P.; Tang, Y.; Liu, Y.; Wang, T.; Wu, P.; Lu, X.Y. Halloysite nanotube@carbon with rich carboxyl groups as a multifunctional adsorbent for the efficient removal of cationic Pb(ii), anionic Cr(vi) and methylene blue (MB). Environ. Sci. Nano 2018, 5, 2257–2268. [Google Scholar] [CrossRef]
- Guégan, R.; Giovanela, M.; Warmont, F.; Motelica-Heino, M. Nonionic organoclay: A “Swiss Army knife” for the adsorption of organic micro-pollutants? J. Colloid Interface Sci. 2015, 437, 71–79. [Google Scholar] [CrossRef] [PubMed] [Green Version]
- Hermosin, M.C.; Cornejo, J. Removing 2,4-D from water by organo-clays. Chemosphere 1992, 24, 1493–1503. [Google Scholar] [CrossRef]
- Carrizosa, M.J.; Koskinen, W.C.; Hermosin, M.C.; Cornejo, J. Dicamba adsorption—Desorption on organoclays. Appl. Clay Sci. 2001, 18, 223–231. [Google Scholar] [CrossRef]
- Pal, O.R.; Vanjara, A.K. Removal of malathion and butachlor from aqueous solution by clays and organoclays. Sep. Purif. Technol. 2001, 24, 167–172. [Google Scholar] [CrossRef]
- Sanchez-Martin, M.J.; Rodriguez-Cruz, M.S.; Andrades, M.S.; Sanchez-Camazano, M. Efficiency of different clay minerals modified with a cationic surfactant in the adsorption of pesticides: Influence of clay type and pesticide hydrophobicity. Appl. Clay Sci. 2006, 31, 216–228. [Google Scholar] [CrossRef]
- Kubicki, J.D. Molecular Modeling of Geochemical Reactions; John Wiley & Sons, Ltd.: Chichester, UK, 2016; ISBN 9781118845226. [Google Scholar]
- Churakov, S.V.; Liu, X.D. Quantum-chemical modelling of clay mineral surfaces and clay mineral-surface-adsorbate interactions. In Surface and Interface Chemistry of Clay Minerals 9; Schoonheydt, R., Johnston, C.T., Bergaya, F., Eds.; Elsevier: Amsterdam, The Netherlands, 2018; Volume 9, pp. 49–87. ISBN 1572-4352978-0-08-102433-1. [Google Scholar]
- Scholtzová, E. Computational Modeling of Nanoclays in: Micro & Nano Technologies Series, Clay Nanoparticles. In Properties and Applications; Cavallaro, G., Fakhrullin, R., Pasbakhsh, P., Eds.; Elsevier: Amsterdam, The Netherlands, 2020; ISBN 978-0-12-816783-0. [Google Scholar]
- Matusik, J.; Scholtzová, E.; Tunega, D. Influence of synthesis conditions on the formation of a Kaolinitemethanol complex and simulation of its vibrational spectra. Clays Clay Miner. 2012, 60, 227–239. [Google Scholar] [CrossRef]
- Scholtzová, E.; Madejová, J.; Jankovič, L.; Tunega, D. Structural and spectroscopic characterization of montmorillonite intercalated with N-butylammonium cations (N = 1–4)—Modeling and experimental study. Clays Clay Miner. 2016, 64, 401–412. [Google Scholar] [CrossRef]
- Chen, J.; Min, F.; Liu, L.; Liu, C.; Lu, F. Experimental investigation and DFT calculation of different amine/ammonium salts adsorption on kaolinite. Appl. Surf. Sci. 2017, 419, 241–251. [Google Scholar] [CrossRef]
- Madejova, J.; Andrejkovicova, S.; Bujdak, J.; Ceklovsky, A.; Hrachova, J.; Valuchova, J.; Komadel, P. Characterization of products obtained by acid leaching of Fe-bentonite. CLAY Miner. 2007, 42, 527–540. [Google Scholar] [CrossRef]
- Kresse, G.; Hafner, J. Ab-initio molecular-dynamics for open-shell transition-metals. Phys. Rev. B 1993, 48, 13115–13118. [Google Scholar] [CrossRef] [PubMed]
- Kresse, G.; Furthmuller, J. Efficiency of ab-initio total energy calculations for metals and semiconductors using a plane-wave basis set. Comput. Mater. Sci. 1996, 6, 15–50. [Google Scholar] [CrossRef]
- Blochl, P.E. Projector Augmented-wave method. Phys. Rev. B 1994, 50, 17953–17979. [Google Scholar] [CrossRef] [Green Version]
- Kresse, G.; Joubert, D. From ultrasoft pseudopotentials to the projector augmented-wave method. Phys. Rev. B 1999, 59, 1758–1775. [Google Scholar] [CrossRef]
- Perdew, J.P.; Burke, K.; Wang, Y. Generalized gradient approximation for the exchange-correlation hole of a many-electron system. Phys. Rev. B 1996, 54, 16533–16539. [Google Scholar] [CrossRef] [Green Version]
- Grimme, S.; Antony, J.; Ehrlich, S.; Krieg, H. A consistent and accurate ab initio parametrization of density functional dispersion correction (DFT-D) for the 94 elements H-Pu. J. Chem. Phys. 2010, 132. [Google Scholar] [CrossRef] [Green Version]
- Monkhorst, H.J.; Pack, J.D. Special points for Brillouin-zone integrations. Phys. Rev. B 1976, 13, 5188–5192. [Google Scholar] [CrossRef]
- Kratzer, P.; Neugebauer, J. The Basics of Electronic Structure Theory for Periodic Systems. Front. Chem. 2019, 7, 106. [Google Scholar] [CrossRef] [Green Version]
- Ferrario, M.; Ryckaert, J.P. Constant pressure-constant temperature molecular-dynamics for rigid and partially rigid molecular-systems. Mol. Phys. 1985, 54, 587–603. [Google Scholar] [CrossRef]
- Nose, S. A unified formulation of the constant temperature molecular-dynamics methods. J. Chem. Phys. 1984, 81, 511–519. [Google Scholar] [CrossRef] [Green Version]
- Tombacz, E.; Nyilas, T.; Libor, Z.; Csanaki, C. Surface charge heterogeneity and aggregation of clay lamellae in aqueous suspensions. In Proceedings of the from Colloids to Nanotechnology; Zrinyi, M., Horvolgyi, Z., Eds.; Springer: Berlin/Heidelberg, Germany, 2004; Volume 125, pp. 206–215. [Google Scholar]
- Desiraju, G.R.; Steiner, T. The Weak Hydrogen Bond in Structural Chemistry and Biology, 2nd ed.; Oxford University Press: Oxford, UK, 2006. [Google Scholar]
- Scheiner, S.; Dykstra, C.E.; Frenking, G.; Kim, K.S.; Scuseria, G.E. Theory and Applications of Computational Chemistry: The First Forty Years; Elsevier: Hoboken, NJ, USA, 2005; pp. 831–858. [Google Scholar]


| Models | d 001 calc | d 001 exp |
|---|---|---|
| Na-Mt | 12.1 | 12.4 |
| Na-Bd | 12.0 | 12.3 |
| A-Mt | 12.7 | 12.8 |
| A-Bd | 12.7 | 12.7 |
| A-TMP-Mt | 13.0 | 14.1 |
| A-TMP-Bd | 13.0 | 13.9 |
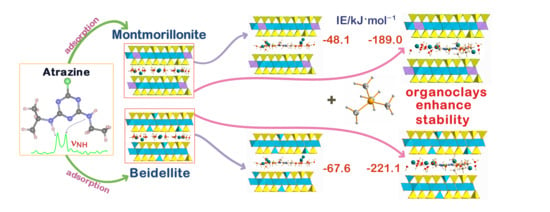
| Models/H Bonds/ | A-Mt | A-Bd | A-TMP-Mt | A-TMP-Bd |
|---|---|---|---|---|
| Catz–H···Ow | 2.46; 2.72; 2.74 | 2.48; 2.55; 2.75 | 2.56; 2.98; 2.99 | 2.62; 2.77; 2.88 |
| Catz–H···Ob | 2.38; 2.61; 3.14 | 2.42; 2.62; 3.05 | 2.43; 2.63; 2.85 | 2.39; 2.56; 2.93 |
| CTMP–H···Ob | - | - | 2.32; 2.53; 2.81 | 2.21; 2.55; 2.91 |
| N–H···Ow | 2.15 | 2.57; 2.83 | 2.30; 2.55; 2.67 | 2.31; 2.79; 2.90 |
| N–H···Ob | - | 2.98 | - | - |
| Ow–H···Ow | 1.74; 1.88; 2.75 | 1.76; 1.95; 2.95 | 1.72; 1.81; 2.97 | 1.78; 1.95; 2.94 |
| Ow–H···Ob | 1.85; 2.53; 2.98 | 1.71; 2.63; 2.99 | 1.86; 2.47; 2.99 | 1.75; 2.57; 2.95 |
| Eint | −48.1 | −67.6 | −189.0 | −221.1 |
Publisher’s Note: MDPI stays neutral with regard to jurisdictional claims in published maps and institutional affiliations. |
© 2021 by the authors. Licensee MDPI, Basel, Switzerland. This article is an open access article distributed under the terms and conditions of the Creative Commons Attribution (CC BY) license (https://creativecommons.org/licenses/by/4.0/).
Share and Cite
Moreno-Rodríguez, D.; Jankovič, Ľ.; Scholtzová, E.; Tunega, D. Stability of Atrazine–Smectite Intercalates: Density Functional Theory and Experimental Study. Minerals 2021, 11, 554. https://doi.org/10.3390/min11060554
Moreno-Rodríguez D, Jankovič Ľ, Scholtzová E, Tunega D. Stability of Atrazine–Smectite Intercalates: Density Functional Theory and Experimental Study. Minerals. 2021; 11(6):554. https://doi.org/10.3390/min11060554
Chicago/Turabian StyleMoreno-Rodríguez, Daniel, Ľuboš Jankovič, Eva Scholtzová, and Daniel Tunega. 2021. "Stability of Atrazine–Smectite Intercalates: Density Functional Theory and Experimental Study" Minerals 11, no. 6: 554. https://doi.org/10.3390/min11060554