Article

Rutile Mineral Chemistry and Zr-in-Rutile Thermometry in Provenance Study of Albian (Uppermost Lower Cretaceous) Terrigenous Quartz Sands and Sandstones in Southern Extra-Carpathian Poland

by
Jakub Kotowski
*,
Krzysztof Nejbert
and
Danuta Olszewska-Nejbert
Faculty of Geology, University of Warsaw, Żwirki i Wigury 93, 02-089 Warszawa, Poland
*
Author to whom correspondence should be addressed.
Minerals 2021, 11(6), 553; https://doi.org/10.3390/min11060553
Submission received: 30 March 2021 / Revised: 19 May 2021 / Accepted: 19 May 2021 / Published: 23 May 2021
(This article belongs to the Section Mineral Geochemistry and Geochronology)

Abstract

:
The geochemistry of detrital rutile grains, which are extremely resistant to weathering, was used in a provenance study of the transgressive Albian quartz sands in the southern part of extra-Carpathian Poland. Rutile grains were sampled from eight outcrops and four boreholes located on the Miechów, Szydłowiec, and Puławy Segments. The crystallization temperatures of the rutile grains, calculated using a Zr-in-rutile geothermometer, allowed for the division of the study area into three parts: western, central, and eastern. The western group of samples, located in the Miechów Segment, is characterized by a polymodal distribution of rutile crystallization temperatures (700–800 °C; 550–600 °C, and c. 900 °C) with a significant predominance of high-temperature forms, and with a clear prevalence of metapelitic over metamafic rutile. The eastern group of samples, corresponding to the Lublin Area, is monomodal and their crystallization temperatures peak at 550–600 °C. The contents of metapelitic to metamafic rutile in the study area are comparable. The central group of rutile samples with bimodal distribution (550–600 °C and 850–950 °C) most likely represents a mixing zone, with a visible influence from the western and, to a lesser extent, the eastern group. The most probable source area for the western and the central groups seems to be granulite and high-temperature eclogite facies rocks from the Bohemian Massif. The most probable source area for the eastern group of rutiles seems to be amphibolites and low temperature eclogite facies rocks, probably derived from the southern part of the Baltic Shield.

1. Introduction

The uppermost Early Cretaceous (Middle and Late Albian, c. 110.8–100.5 Ma) and Late Cretaceous epicontinental basin in Poland, called the Polish Basin, was part of the vast Central European Basin System (CEBS, Figure 1) [1]. The CEBS developed after the Variscan orogeny (c. 300 Ma) and extended from the North Sea to Poland [2]. The processes that took place in the CEBS from the Permian to the Palaeogene were successive marine transgressions and regressions with the dominant characteristics of shallow shelf sea sedimentation. In the late Jurassic, a significant uplift of Precambrian and Variscan structures was reported, e.g., [2,3] including SW Poland. After the Neo-Cimmerian tectonic phase, during the Earliest Cretaceous, the sea-level was low [4] and large land areas of extra-Alpine Europe had been elevated [5]. Sedimentation in the Polish Basin was restricted to the narrow Mid-Polish Trough, including terrestrial and shallow shelf facies. Additionally, the epicontinental Polish basin was isolated from the Tethys Sea during most of the Early Cretaceous [6,7,8]. In the Middle and Late Albian (latest Early Cretaceous) in the Polish Basin, as in everywhere in Europe, a significant eustatic marine transgression began [9,10,11]. The sea transgressed from the west and merged with the Russian sea in the east [9]. The detrital material came, most probably, from nearby uplifted areas. The source areas (Figure 1) could have been (i) the Bohemian Massif S and SW of the study area; (ii) the Ukrainian Shield [5,9,12]; (iii) a hypothetical Holy Cross Mountain—Dobruja Land (HCMDL) [13], also called the Krukienic Island [14]; or (iv) the crystalline basement of the southern part of the Baltic Shield. Quartz as a main component of the Albian sands has little diagnostic significance in determining its provenance. Therefore, the analysis of heavy minerals seems to be a promising approach in provenance studies of these mineralogically mature sediments [15,16,17,18,19].
Recently, the majority of provenance studies of sedimentary rocks containing clastic material have been based on the composition of heavy minerals [15,21,22]. The development of EPMA techniques has made it possible to carry out relatively inexpensive, rapid, and widely accessible analyses of trace elements in heavy minerals. This has contributed to the use of heavy minerals in provenance analyses of siliciclastic deposits and the determination of the host rocks and source areas in many places around the world [23,24,25].
Rutile, apart from zircon and tourmaline, is classified as a heavy mineral extremely resistant to weathering [24] and is very common in clastic sediments, including quartz arenite. Despite this, rutile is rarely used in provenance analyses of clastic material. It is, however, an especially useful mineral in pure quartz arenites, which are characterized by high ZTR (zircon-tourmaline-rutile) index, low quantity, and low diversity of heavy minerals [18,26,27]. However, it is interesting because rutile composition can be used as a tool in provenance studies [28,29,30]. The advancement of analytical techniques led to the recognition of a relationship between the crystallization temperature and Zr content in rutile [31,32]. This in turn allowed the calibration of the Zr-in-rutile (ZIR) geothermometer, which can also be quite widely used in determining the provenance of detrital rutile [28,29,31,33,34].
The aims of this paper are as follows: (1) to comment on the physical properties of rutile as an important factor influencing the mode of preservation of rutile in detrital settings; (2) to report on the chemical composition of rutile from twelve outcrops and/or boreholes scattered in extra-Carpathian Albian (uppermost Lower Cretaceous) sands of southern Poland; (3) to test an application of the Zr-in-rutile thermometry in provenance studies of quartz arenite; and, finally, (4) to point out some of the possible provenances of rutile in the Albian quartz arenites to determine the host rocks and location of source area(s).

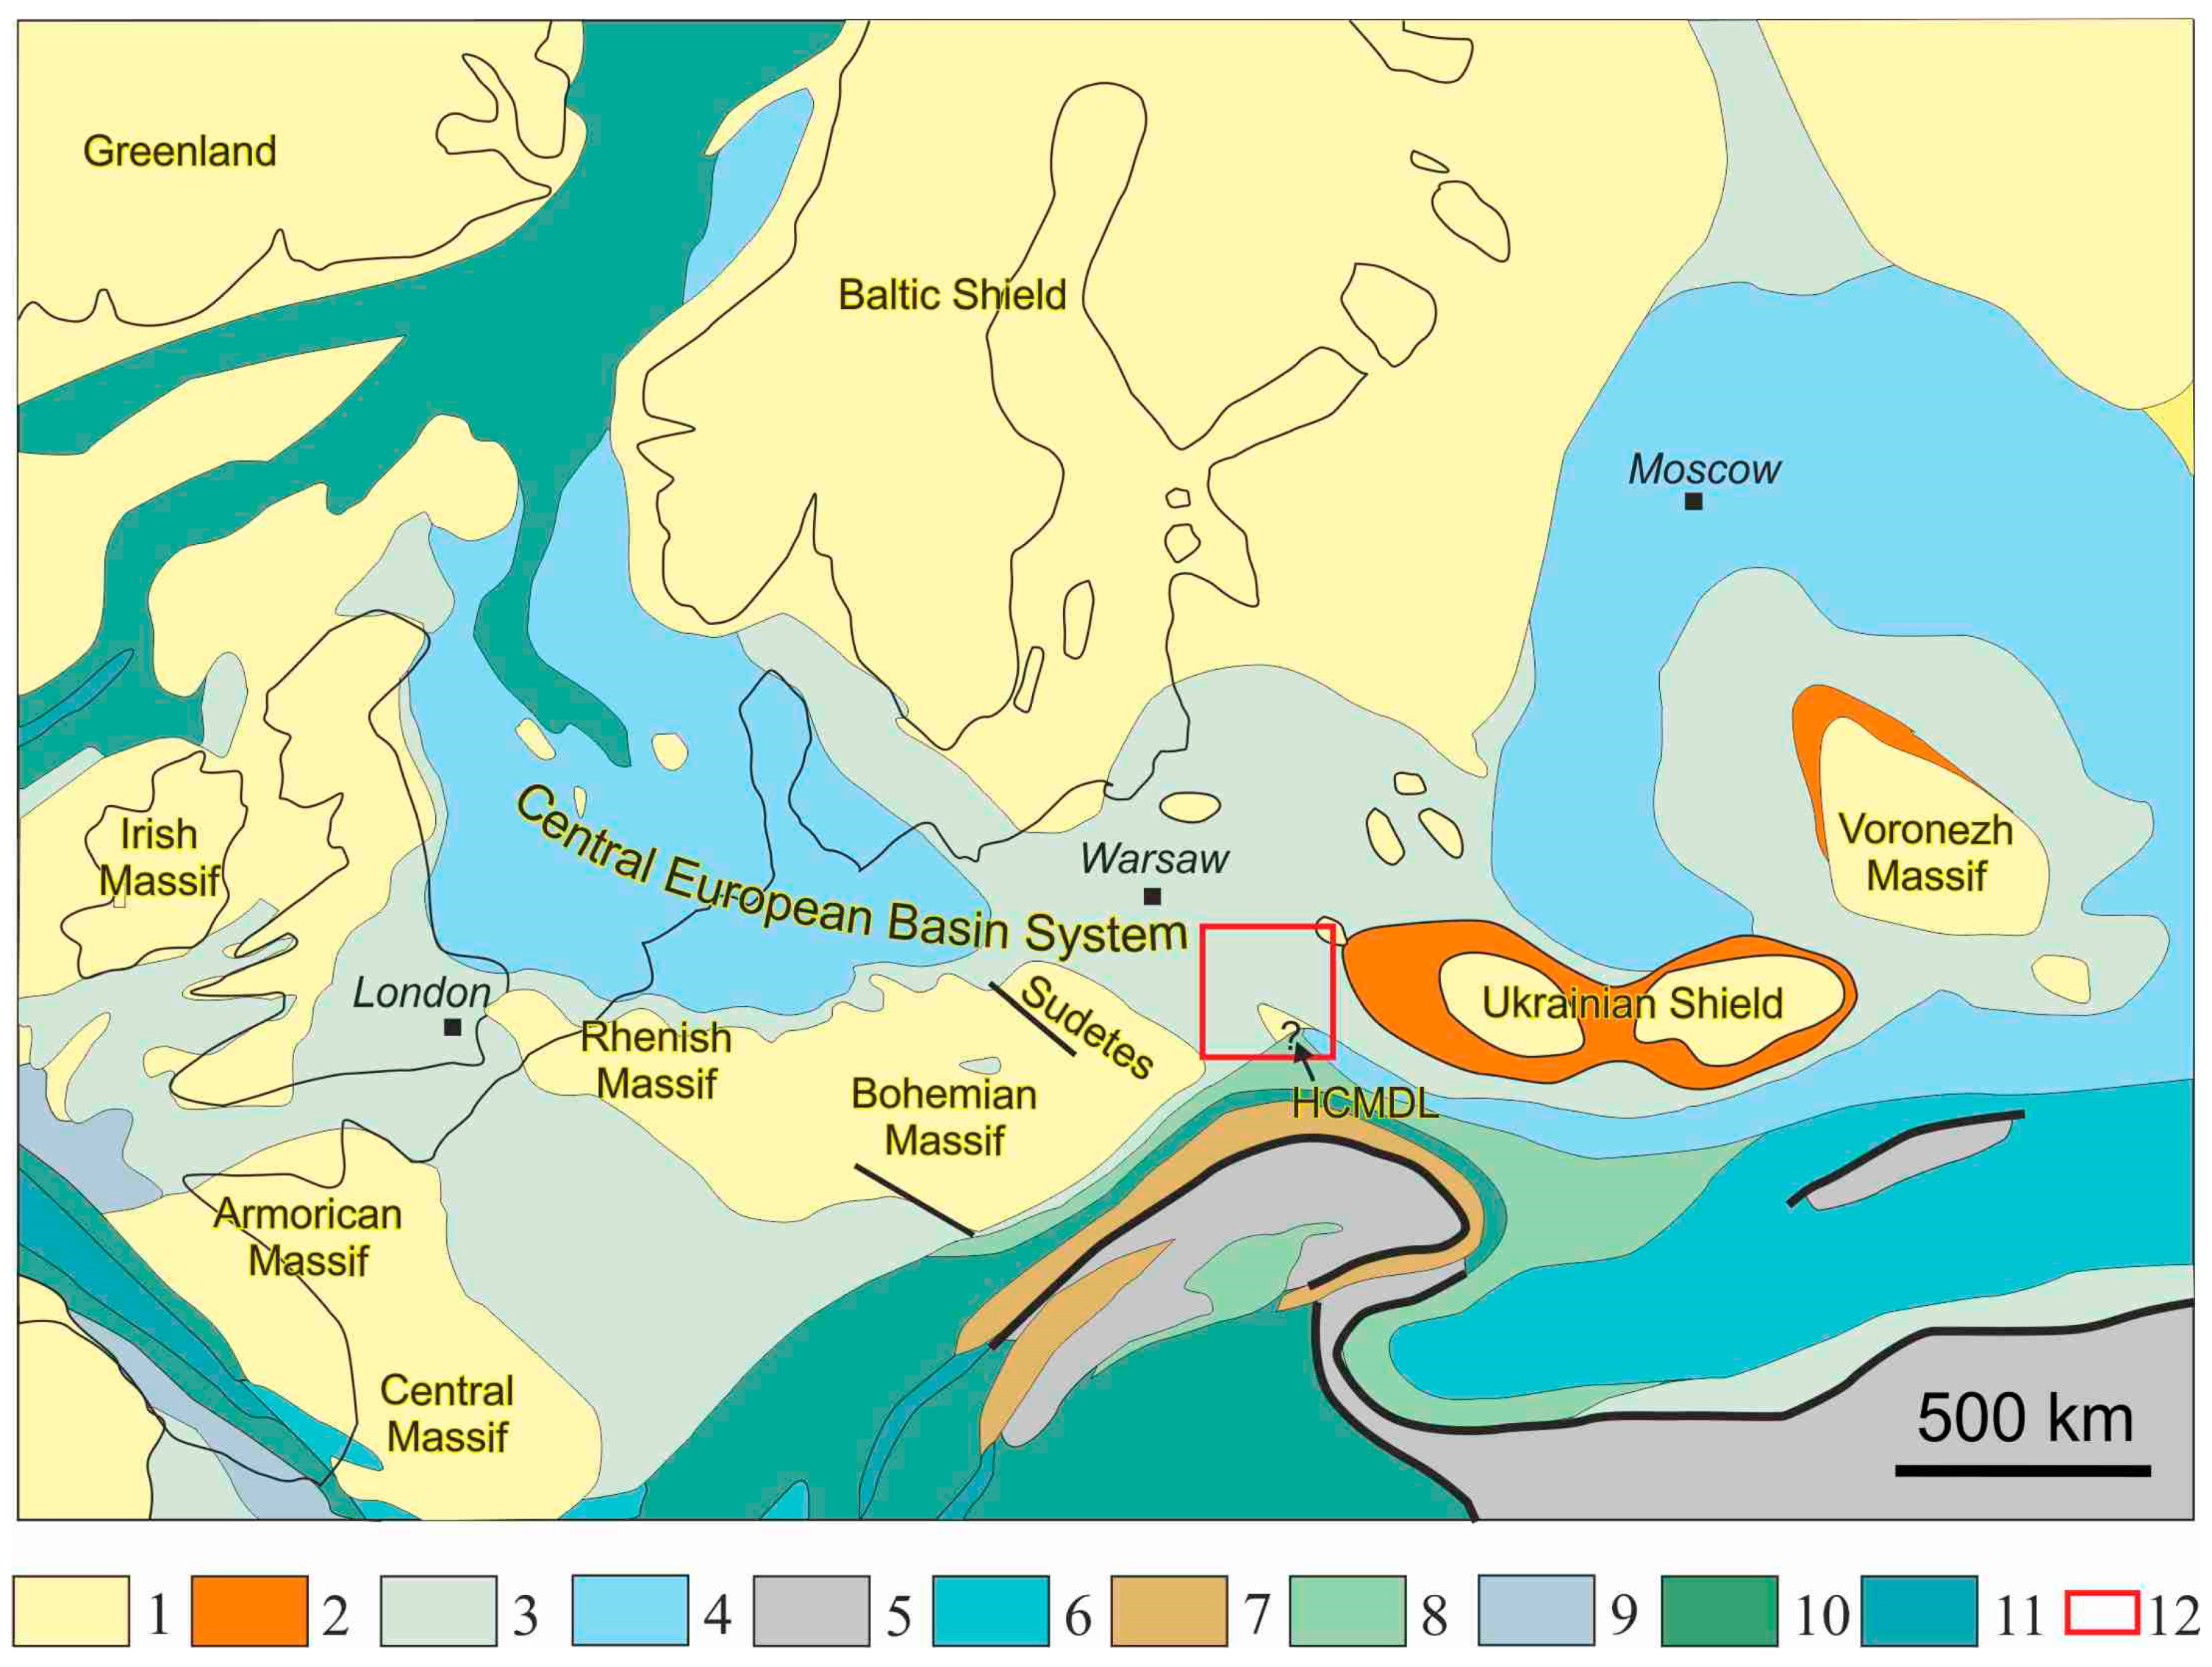
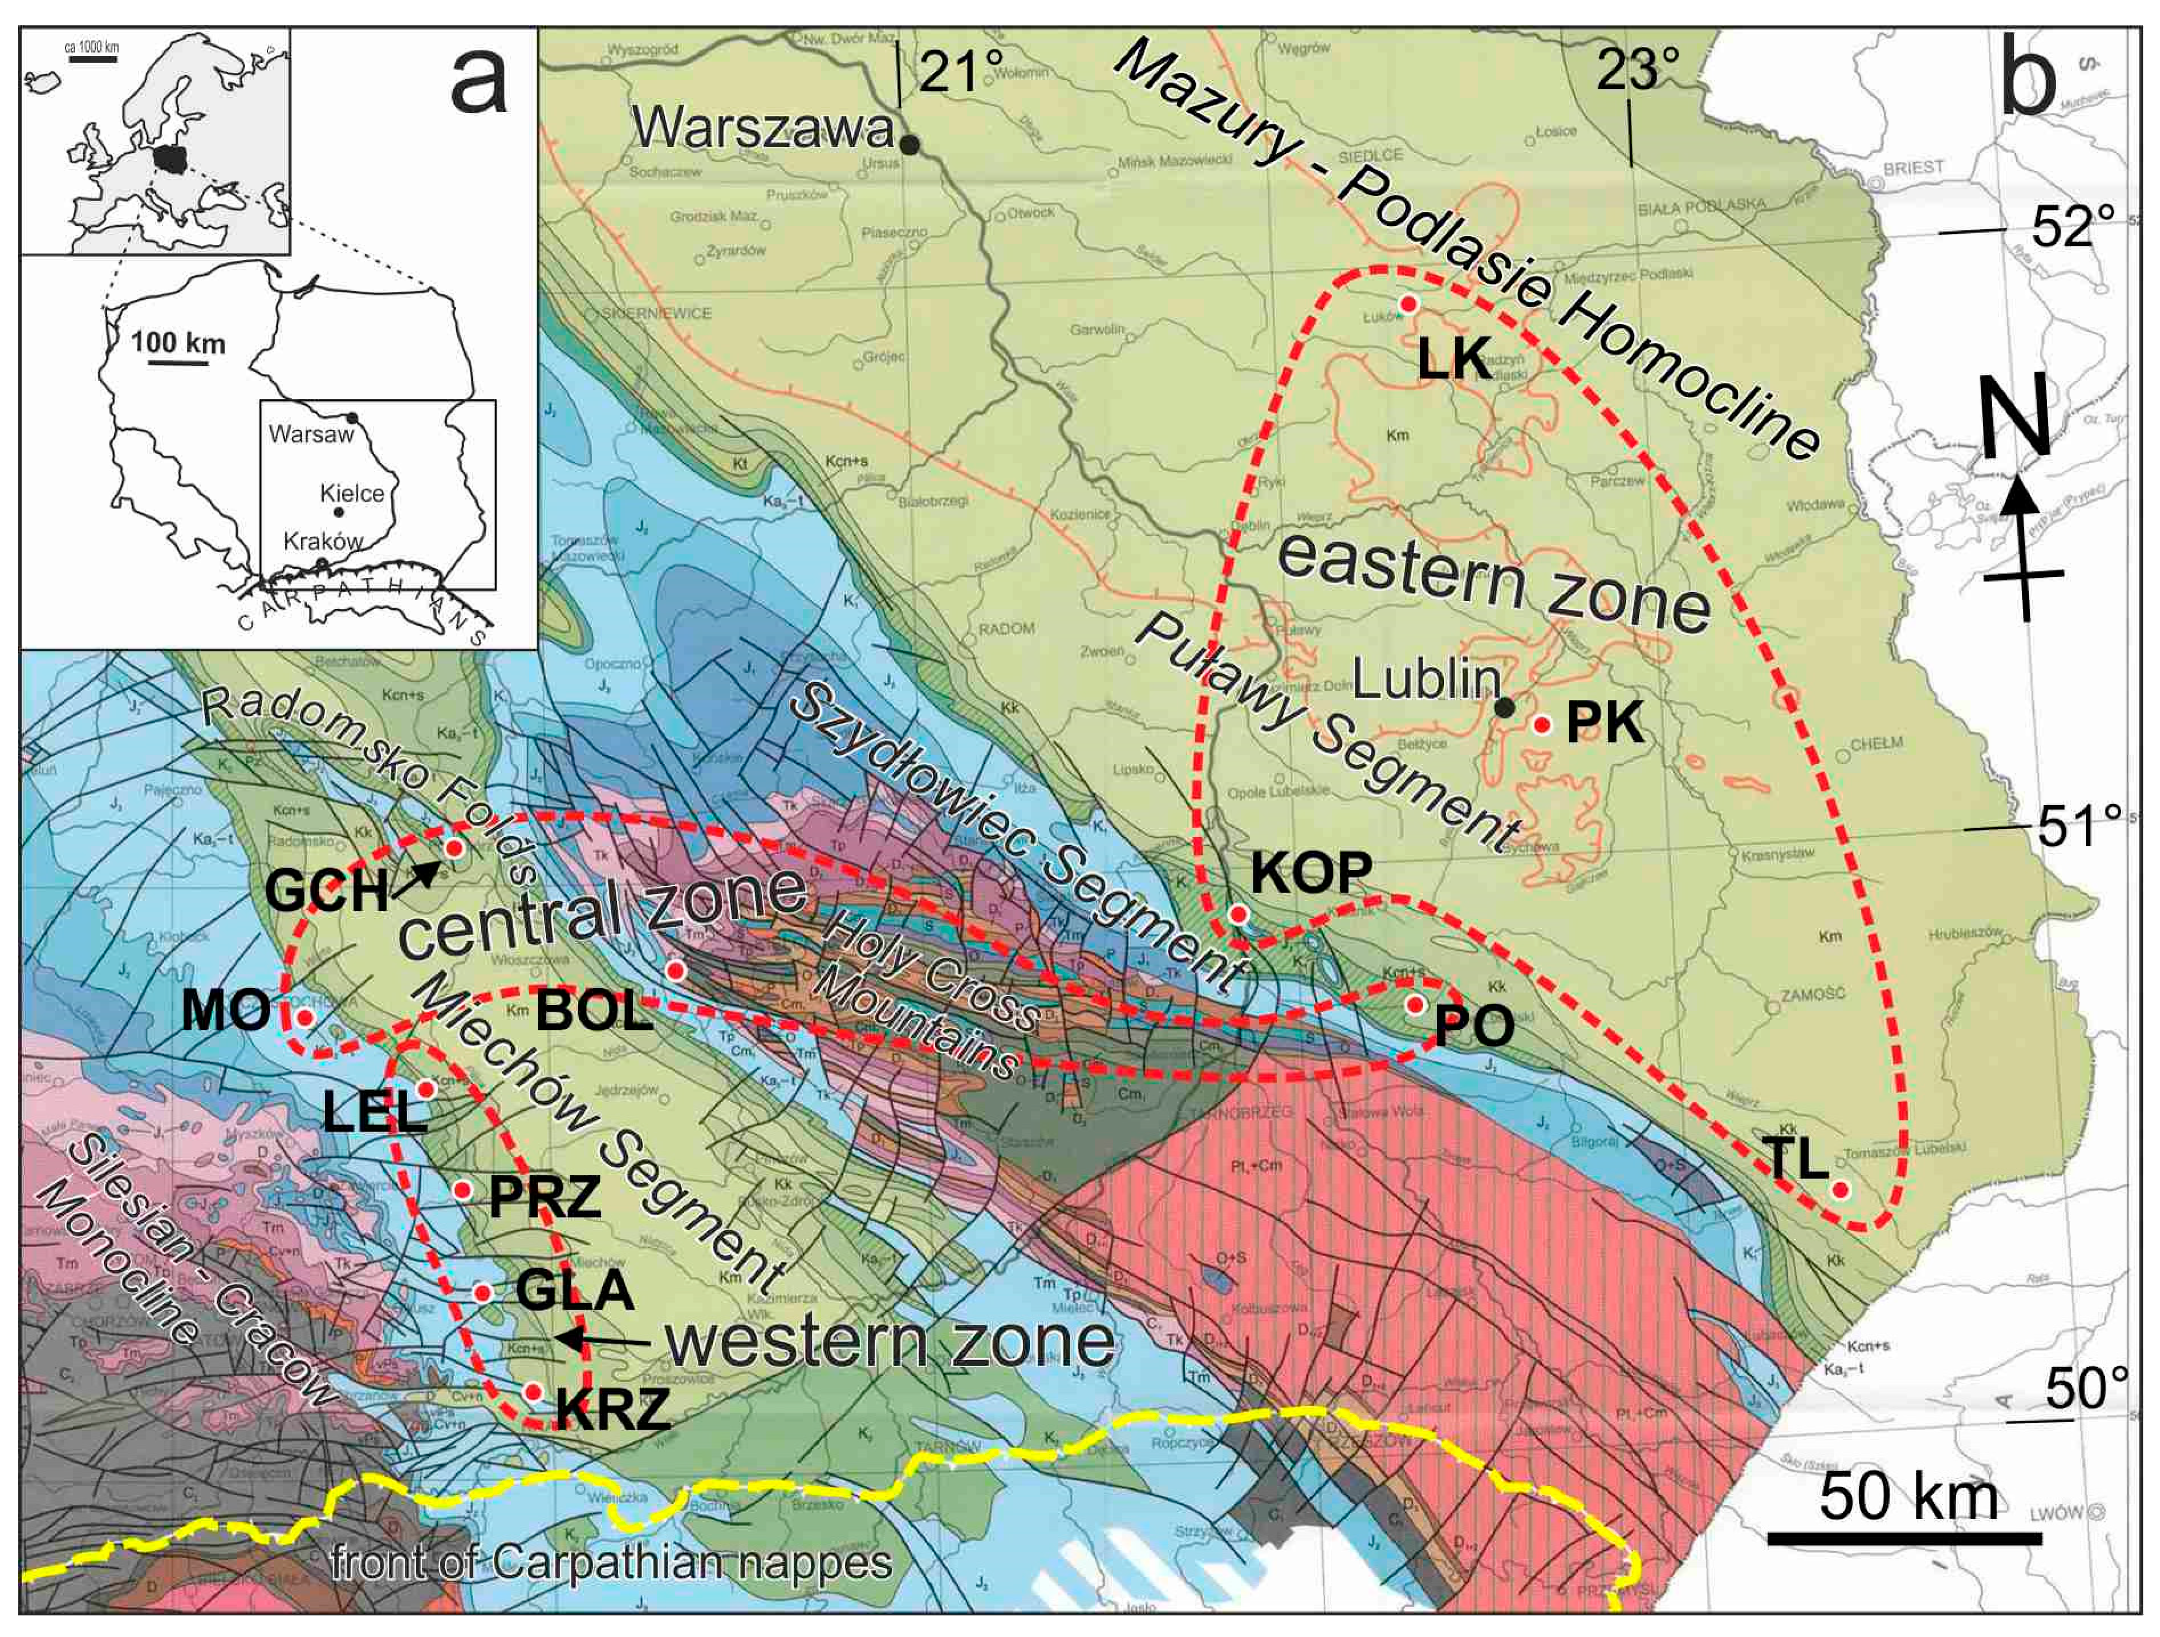
2. Regional Geological Setting

The study area covers the southern part of extra-Carpathian Poland where Albian deposits are available partly as outcrops and partly in boreholes (Figure 2). The Albian deposits crop out at the marginal parts of the Miechów Segment of the Szczecin-Łódź-Miechów Synclinorium (Figure 2, Table 1). In the south-western part of the Miechów Segment, they form a narrow, nearly 100 km long longitudinal belt of outcrops, including the Korzkiew, Glanów-Stroniczki, Przychody, Lelów, and Mokrzesz localities studied here. In the north-eastern part of the Miechów Segment, close to the Holy Cross Mountains (HCM), the Albian deposits also form a narrow, longitudinal belt, but with rather occasional outcrops [35]. The best known outcrops in this part of the Miechów Segment occur at Wrzosówka Hill (292.6 m a.s.l.) near Bolmin (studied here) and in an overburden active quarry in Małogoszcz (approx. 5 km west of Bolmin). The Radomsko Folds with the Chełmo Mount (in Polish: Góra Chełmo, 323 m a.s.l.) terminate the Miechów Segment from the north and separate it from the Mogilno-Łódź Segment (Figure 2). One more outcrop studied here, called Kopiec, is situated on the northern edge of the Annopol Anticline in the Szydłowiec Segment of the southern part of the Mid-Poland Anticlinorium (Figure 2, Table 1). The other four samples studied here come from boreholes in eastern Poland. The thickness of the Albian sands in the Potok IG-1 borehole in the Szydłowiec Segment in the southern part of the Mid-Polish Anticlinorium is approximately 20 m [36] and was sampled from a depth of 248.0–249.7 m. The other three sampled boreholes, Tomaszów Lubelski IG-1, Piaski IG-2, and Łuków IG-1, are situated in the vast tectonic unit called the Puławy Segment in the southern part of the Kościerzyna-Puławy Synclinorium (Figure 2, Table 1). The Tomaszów Lubelski IG-1 borehole is very close to the Mid-Polish Anticlinorium. The thickness of Albian sands in this borehole is c. 12 m [37] and the core material was sampled at the depth of 1006.7–1013.0 m. The thickness of Albian sands in the Piaski IG-2 borehole is only c. 2.5 m [38] and the core was sampled at the depth 725.4–727.4 m. The Łuków IG-1 borehole is located close to the Mazury-Podlasie Homocline (Figure 2, Table 1). The thickness of Albian sandstone in the northernmost borehole, Łuków IG-1, is c. 25 m [39] and was sampled at a depth of 510.1–524.6 m.
The Albian deposits directly cover Upper Jurassic limestones or calcareous clays at eleven locations [9,41]. Only in one borehole, Potok IG-1, are the calcareous sands overlying the pre-Albian Lower Cretaceous sand, sandstones, and calcareous sandstones [36]. In all cases, excluding the Chełmo Mount, the Albian sands and sandstones are covered by lithified carbonate (mainly inoceramid limestone) Cenomanian deposits [35,42]. At Chełmo Mount, the Albian sandstone is covered by Cenomanian glauconitic sands [43]. The thickness of the Albian deposits ranges from 0 to c. 50 m [42] in the south-western margin of the Miechów Segment, and approximately 26–76 m in the north-eastern margin [44]. The thickness of Albian sands and sandstones at Chełmo Mount [43], recorded as 180 m, seems to be overestimated. Previous investigations [6] show a maximum thickness of 100 m for the Albian at this locality. The thickness of Albian deposits in the Kopiec outcrop is 6.5 m and, in boreholes, as stated above, it ranges from c. 2.5 m (Piaski IG-2) to c. 25 m (Łuków IG-1). The differences in thickness of the Albian deposits were probably controlled by active synsedimentary block faulting and a diversified pre-Albian surface morphology, which played a substantial role in controlling the local deposition of clastic material [35,42].

3. Materials and Methods

Twelve localities within the Albian deposits were sampled in the extra-Carpathian area of southern Poland (Table 1, Figure 2). Sand and sandstone samples were taken from seven natural outcrops: Korzkiew (KRZ), Glanów-Stroniczki (GLA), Przychody (PRZ), Lelów (LEL), Mokrzesz (MO), Bolmin (BOL), and Chełmo Mount (GCH) of the Miechów Segment. A sand sample from Kopiec (KOP) near Annopol and one sand sample from the Potok IG-1 borehole (PO) from the Szydłowiec Segment were also taken. Two sandy samples from the Tomaszów Lubelski IG-1 (TL) and the Piaski IG-2 (PK) borehole and one quartz sandstone sample from the Łuków IG-1 (LK) borehole, all from the Puławy Segment, were also taken.
In order to separate the heavy minerals, a 1 kg sample from each outcrop (KRZ, GLA, PRZ, LEL, MO, GCH, BOL, KOP) and 0.5 kg sample from each core material (TL, PO, PK, LK—the weight of the core sample was limited owing to the limited amount of material available for sampling) were used. The sandstone samples from the Chełmo Mount were initially crushed in a Testchem LKS-60 jaw crusher. All twelve samples (loose sands and crushed material) were then rinsed with double-distilled water to dispose of the clay fractions and then sieved to obtain 63–125 μm and 125–250 μm size fractions. From these fractions, three magnetic fractions (0.3 A, 0.8 A, 1.2 A, and a diamagnetic one at 1.2 A) were obtained from a single sample after separation on the Franz LB-1 Magnetic Barrier Laboratory Separator. The Frantz isodynamic separator was set to standard operating conditions, with the side slope fixed at 15° and the chute forward slope set to 20° [45]. The most magnetic minerals, such as Fe-Ti oxides and some garnets, tend to concentrate in the 0.3 A fraction, while rutile falls into the diamagnetic fraction, and only some grains were found in the 1.2 A magnetic fraction. This procedure not only helps in gaining high quality heavy mineral concentrates, but also shortens the time of density separation using a heavy liquid. In this case, all obtained fractions were then separated using LST Fastfloat heteropolytungstate with a density of 2.9 g/cm3. After heavy liquid separation, the rutile grains were handpicked, mostly from the non-magnetic fraction and to a lesser extent from the 1.2 A fraction. Earlier investigations had shown that there is no correlation between the size of a detrital rutile grain and a magnetic fraction with its chemistry [46,47]; thus, the rutile grains were picked regardless of size or occurrence in magnetic fractions.
The grain surface morphology and initial mineral identification were performed using a ZEISS SIGMA VP electron microscope equipped with two energy-dispersive X-ray spectrometers Bruker XFlash 6|10 (SEM-EDS) in the National Multidisciplinary Laboratory of Functional Nanomaterials NanoFun, Faculty of Geology, University of Warsaw. The selection of grains for further analysis was made using a stereoscopic microscope, taking into account the optical properties of rutile [48]. Subsequently, the rutile grains were mounted in epoxy resin and polished. Rutile compositions were determined by wavelength-dispersive spectrometry (EPMA) using a CAMECA SX Five field emission electron microprobe at the Joint-Institute Analytical Complex for Minerals and Synthetic Substances, University of Warsaw. The analyses were done under a 15 kV accelerating voltage, 75 nA beam current, and 5 µm beam spot size. The counting times 20 s at peak and 10 s for background for major elements were applied, while the intensity of Cr, Zr, and Nb analytical lines selected was measured for 40 s at the peak maximum, and the background intensity was recorded during half the time of the measurement at the peak position. The ‘PAP’ Φ(ρZ) corrections after [49] were calculated. The standards supplied by Cameca and Structure Probe, Inc. were used during calibration of the microprobe. The standards, type of diffracting crystals, analytical lines used, and mean detection limits, expressed in ppm, were as follows: Mg (MgO, LTAP, Kα, 23), Al (Al2O3, TAP, Kα, 40), Si (SiO2, TAP, Kα, 12), Ti (TiO2, LLIF, Kα, 104), V (V, LLIF, Kα, 40), Cr (Cr2O3, LLIF, Kα, 37), Mn (rhodonite, LLIF, Kα, 20), Fe (hematite-SPI25, LLIF, Kα, 40), Zr (Zr, LPET, Lα, 20), and Nb (Nb, Lα, 20).
The EBSD (electron backscatter diffraction) technique [50,51] was used for identification of TiO2 polymorphs. Mounts with rutile crystals embedded in epoxy resin were polished using a 1.0 µm grain size diamond suspension and, furthermore, a 0.5 µm and 0.25 µm diamond suspension using a vibrating polisher (vibromet). Rutile grains, embedded in epoxy resin, were analyzed in Zeiss Auriga 60 FE-SEM (field emission scanning electron microscope) with a e Flash Bruker EBSD detector. The rutile grains were not covered with a conductive carbon layer; however, for more effective electron removal, a selected area of the examined mount with rutile grains was framed with a highly conductive copper tape. The analyses were done in a high vacuum using a 10 kV acceleration voltage. The sample surface was tilted 70° relative to the beam and the detector tilt angle was close to 1.6°. The distance between the detector and the examined rutile surface was 17 mm. In most cases, rectangular areas within central parts of the analyzed grains were selected for EBSD analysis. Only an identification of TiO2 polymorphs was needed, therefore, a larger step size (pixel size of approximately 1.5–3.5 µm) than in standard EBSD crystallographic orientation studies was used. A phase map mode was used to identify common TiO2 polymorphs (rutile, brookite, or anatase) using the ESPRIT ver. 2.1 software, Bruker Nano GmbH, Berlin, Germany.
For TiO2 polymorph identification, the following crystallographic parameters, including space groups and fundamental unit cell parameters, were used: anatase (I41/amd; a = 3.7845 Å, c = 9.5143 Å), brookite (Pbca; a = 5.4558 Å, b = 9.1819 Å, c = 5.1429 Å), and rutile (P42/mnm; a = 4.5937 Å, c = 2.9587 Å).

4. Rutile Mineral Chemistry, Occurrence, and Zr-in-Rutile (ZIR) Geothermometry

Rutile is the most widespread and most thermodynamically stable natural polymorph of TiO2. The other, less common, natural polymorphs of TiO2 are akaogiite, anatase, brookite, and riesite [52,53]. Rutile most often crystallizes under conditions of medium- and high-grade metamorphism, and much less frequently in low-pressure hydrothermal quartz veins and in igneous rocks (for additional references, see Meinhold et al. and references therein [54]) with crystallization temperatures ranging from approximately 430 °C to over 1100 °C [31]. In general, rutile crystallizes commonly in metamorphic rocks formed under high-pressure conditions, i.e., above 1.1 GPa [54,55]. In rocks with a low Ca content, it is also stable at pressures lower than 0.7 GPa [56]. Low-pressure rutiles are also stable in low- and medium-grade metapelites, where the concentrations of Ca and Fe are very low and, conversely, the contents of Mg and Al are very high [54,55,57,58]. Low-pressure rutile may occur as characteristic needle-like crystals in quartz veins [59,60]. Taking into account the documented stability of rutile and the potential differentiation of the chemical compositions of the protolith rocks, detrital rutile occurring in sedimentary rocks most often crystallized in the temperature and pressure range corresponding to eclogite, granulite, and blueschist metamorphism [30,31,54,55,61,62], and less frequently and/or very rarely crystallized under the conditions of epidote-amphibolite and greenschist metamorphism [54,57].
Rutile preserves information on the lithology of the source area, because of its very high resistance to weathering and diagenesis, whereas other minerals such as garnet, amphibole, and apatite may be completely dissolved occasionally. The use of rutile in provenance analysis is limited by the low concentrations of trace elements, which require the use of laser ablation inductively coupled plasma mass spectrometry (LA ICP-MS) or electron probe microanalysis (EPMA) in the trace analysis mode [31,33,47,54]. The use of EPMA in trace mode is facilitated by the high thermal stability of rutile, thanks to which it is possible to increase the detection limit of the determined trace elements by using the higher current of the electron beam and the extending count time at peak and background positions. Approximate concentrations of elements from the HFSE group (high field strength elements), represented by Nb, Ta, Zr, Hf, and W, as well as some transition metals group, such as Cr, V, and Fe, can reach concentrations up to 3000 ppm [30,33,54,63,64]. Zr concentrations in rutile from metamorphic rocks vary in the wide range from several ppm up to 11,000 ppm [29,34,65]. Anomalously high concentrations of transition metals are described only from rutile occurring in some ore deposits, e.g., [66], in which the contents of V2O3, Cr2O3, FeO, Nb2O5, and WO3 can reach 3.95 wt.%, 3.28 wt.%, 3.27 wt.%, 0.23 wt.%, and 17.73 wt.%, respectively. The common high concentrations of HFSE and other transitional elements (particularly V and Cr) in rutile allow us to estimate rutile crystallization temperatures and discriminate between different source lithologies within source areas (for review, see [54]); both of these methods are commonly used in sediment provenance studies.
Zr-in-rutile geothermometry (ZIR) is a relatively new method and is used mainly for determining crystallization temperatures of rutile in various metamorphic and igneous rocks [67]. The key requirement for using the ZIR method is the determination of the Zr concentration in the rutile structure. Improving EPMA techniques in a trace mode allows us to determine the concentration of Zr with a detection limit below 40 ppm. The ZIR method can be applied only when the SiO2–ZrO2–TiO2 system is in equilibrium with quartz, zircon, and rutile [31,32,65]. So far, in the literature, there are several calibrations of Zr in rutile geothermometers (Table 2). The first ZIR geothermometer (no 1 in Table 2) was proposed by [31] based on the Zr content of natural rutile crystals. This method assumes that, if rutile crystallizes in the presence of zircon and quartz, then Zr is buffered in the rutile structure. Rutile is able to preserve the original Zr concentration, indicating the peak of metamorphism even under retrogressive conditions [33], thus allowing for the determination of the relict temperatures of rutile formation from previous crystallization stages [68].
An alternative formula (no 2 in Table 2) was presented by [32], who calibrated their rutile geothermometer on experimental studies, supplementing it with only a few analyses of natural rutiles. The results from both geothermometers coincide only at about 540 °C. The discrepancy between the two geothermometers is clearly visible at lower and higher temperatures. This difference may come from the systematic analysis of rutiles only included inside garnets by [31], while rutiles found in the rock matrix were disregarded. The above mentioned geothermometers (no 1 and 2 in Table 2) are based only on the Zr concentration in the rutile structure. Geothermometers (no 3–7 in Table 2) presented by [65,69] additionally take into account the pressure values in the system during rutile crystallization. However, when analyzing rutile grains from sedimentary rocks, we have no certainty about pressure conditions occurring during their crystallization. In earlier studies, authors [47] suggested using a default 10 kbar and the α-quartz stability field geothermometer of [65] when information about pressure is not available. A comparison of calculated temperatures from the geothermometers of [32] (no 2 in Table 2) and [65] (no 3 in Table 2), with suggested default values, shows differences not greater than 5%. The results of both ZIR geothermometers are nearly the same; therefore, we chose not to make further assumptions regarding pressure conditions and use the geothermometer calibrated by [32] (no 2 in Table 2). In the studies of detrital rutile performed by [28,29], it is claimed that more realistic results were obtained with the use of the [32] rather than the [31] geothermometer. Therefore, in this paper, as suggested by [28,54], only the thermometer proposed by [32] (no. 2 in Table 2) will be used.
The concentrations of other trace elements in the rutile structure can also be used to discriminate the source lithology. It was previously suggested [30,70] that differences in the Cr/Nb ratio may point to the metapelitic or metamafic origin. As mentioned earlier, the presence of quartz in the system is required for the correct use of the ZIR thermometer. In the case of mafic rocks, the presence of quartz may be the result of metamorphic reactions, even in undersaturated mafic protoliths [71,72,73]. Therefore, rutile derived from different lithologies can be successfully applied for calculating crystallization temperatures using a ZIR thermometer. Equation X = 5 × (Nb[ppm] − 500) − Cr[ppm] proposed by the [47] is considered as a most accurate in discriminating source lithology using Cr/Nb ratios. However, the Nb-Cr discrimination method does not always give correct results [62,74]. The inaccuracies of the Nb-Cr discrimination may come from re-equilibration during retrograde metamorphism [74] or from usage of earlier, less reliable, and accurate discrimination equations [29,33,70]. In the case of crystalline rocks, the origin of rutile is generally known and a critical approach to Nb-Cr discrimination methods is possible. However, detrital rutile’s source rock crystallization conditions are usually unknown and, therefore, this discrimination technique must be applied with care and skepticism. Nevertheless, the Nb-Cr discrimination diagrams should be treated as an additional useful tool in studies of the origin of the clastic material [33,47,54].

5. Results

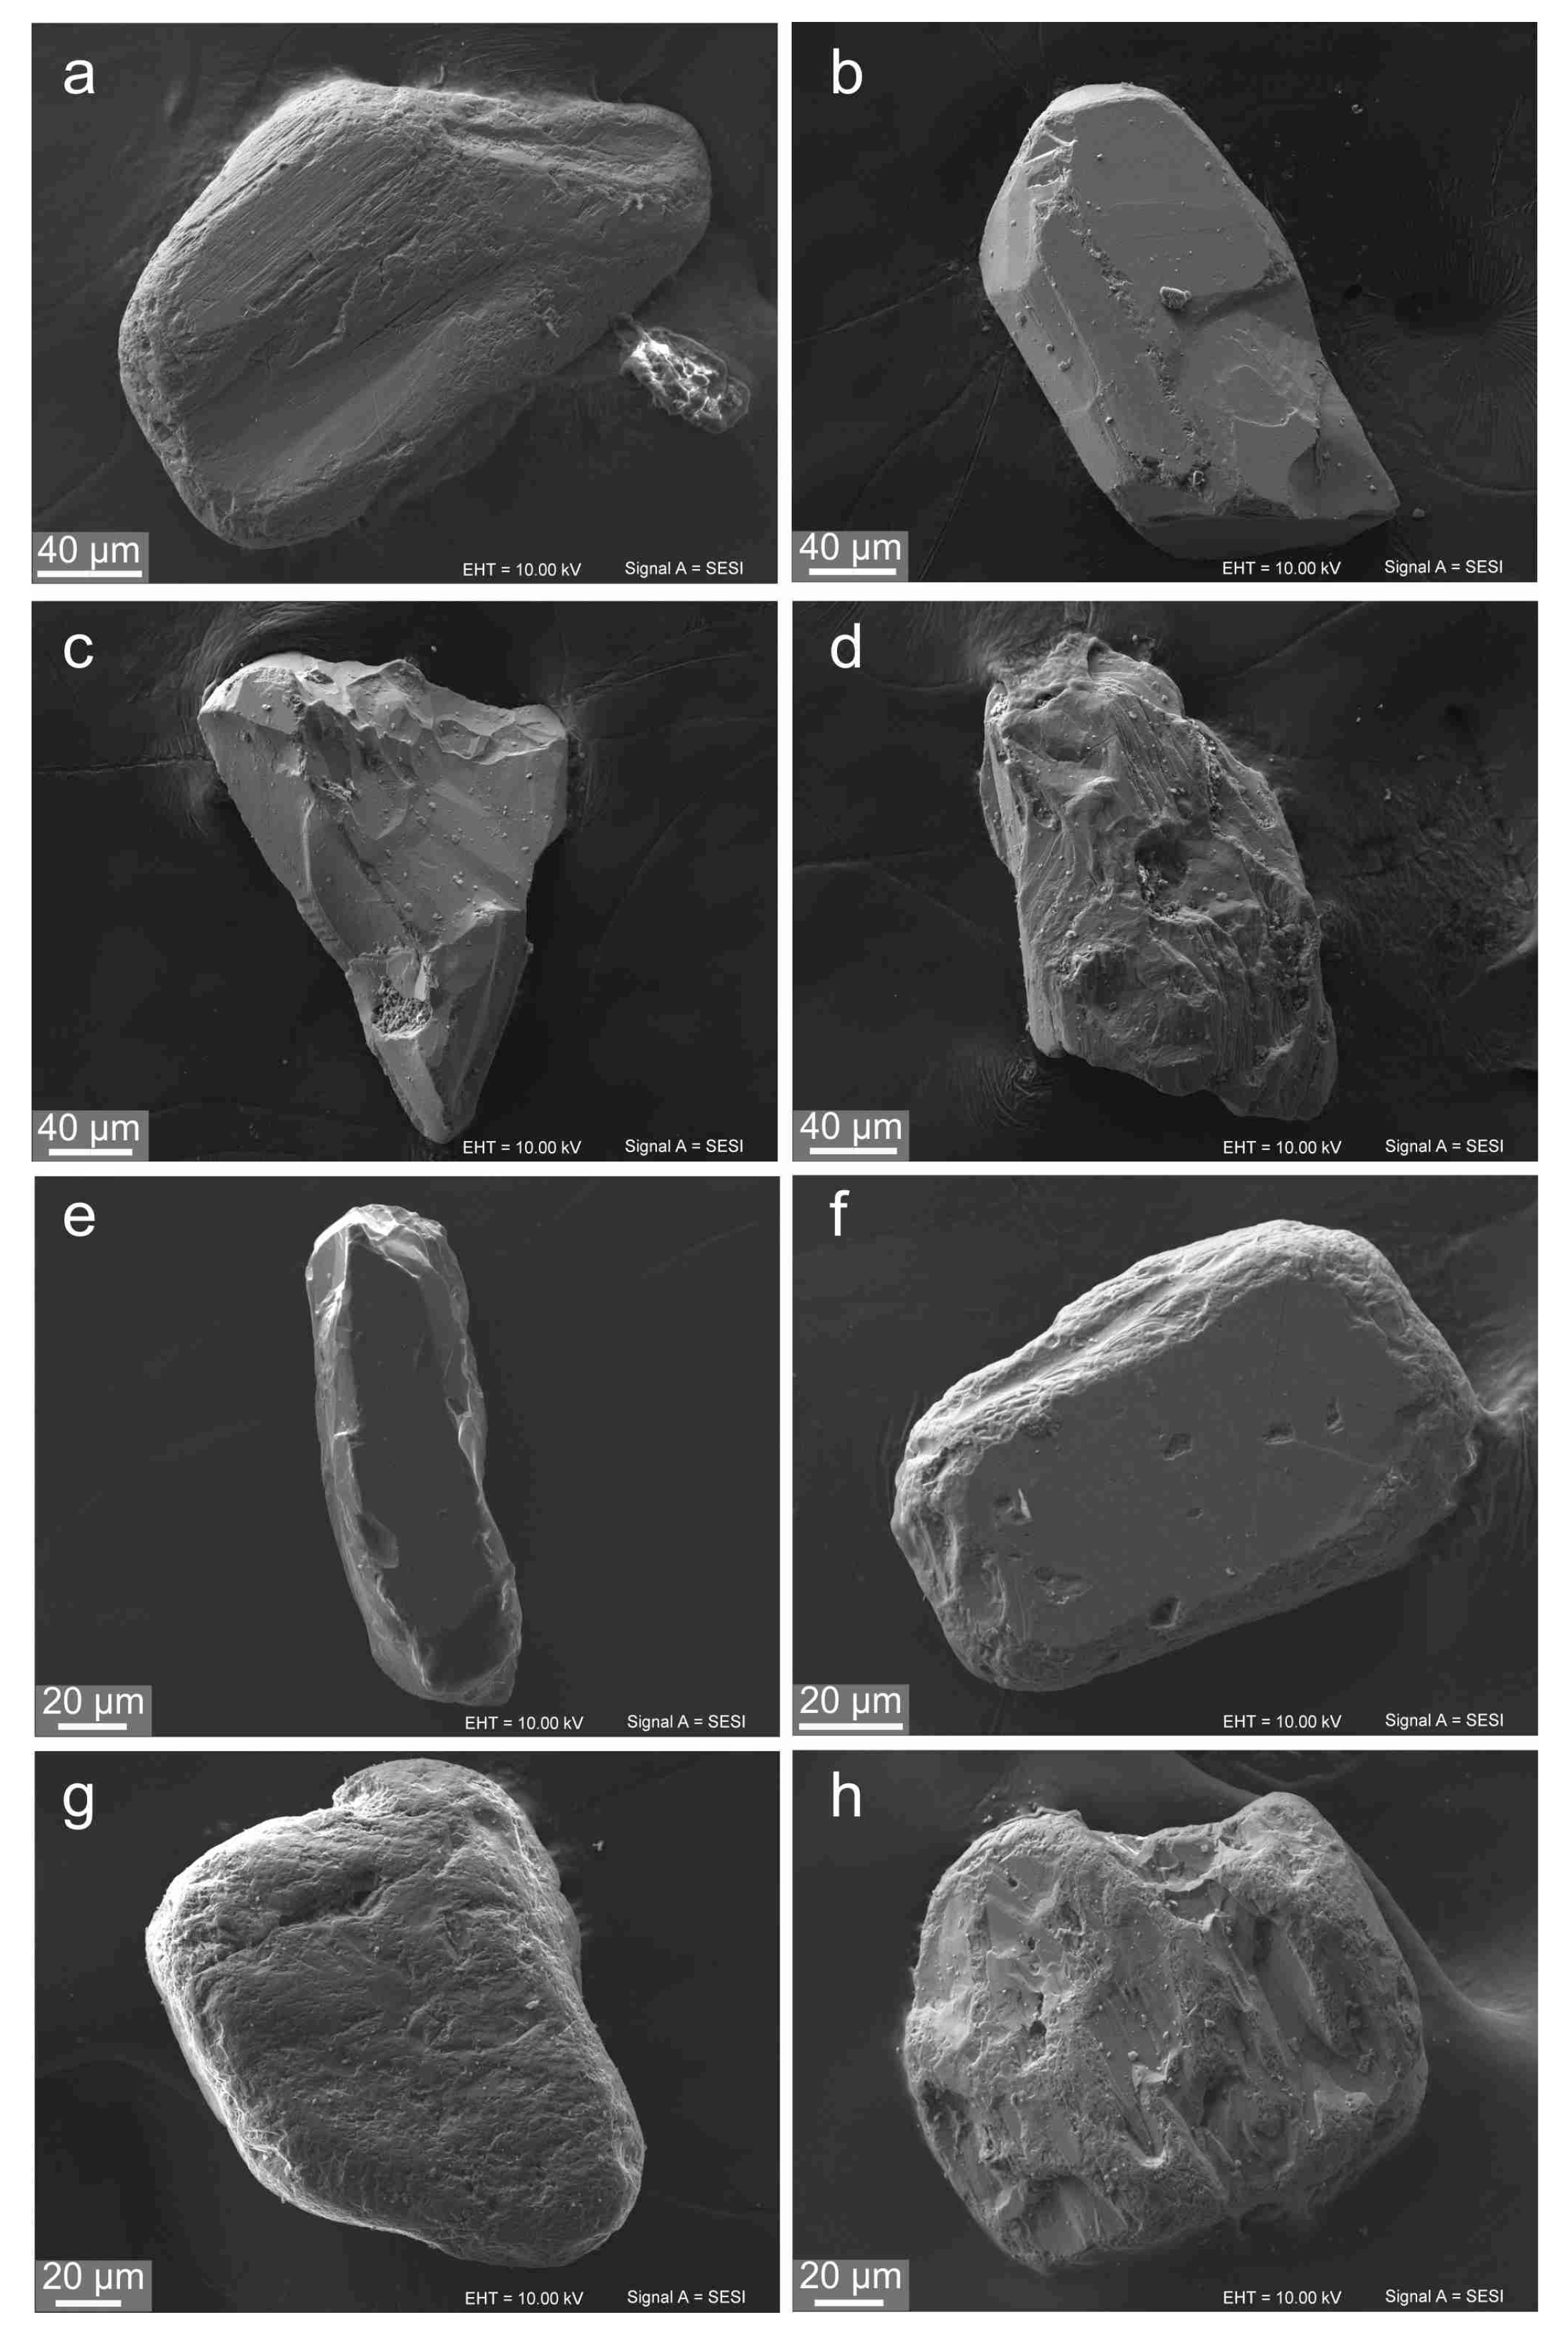
5.1. Mineralogy and Petrography of the Albian Sands

The Albian sediments are similar in all the examined sites throughout the Miechów Segment. They are composed of medium-grained quartz sands and sandstones devoid of calcium carbonates and phosphates, with variable admixtures of glauconite and muscovite. In Glanów-Stroniczki, the sample contains much higher contents of muscovite than in other outcrops; additionally, the largest crystals reach up to several mm in size. In most outcrops, apart from sands, there are also discontinuous, horizontally formed silicification beds or irregular bodies of spongiolites. In the outcrop on the Chełmo Mount, the Albian sediments are lithified, medium-grained, and/or coarse-grained ferrigenous quartz sandstones. Quartz constitutes almost 90% of all detrital grains. The dominant quartz grains are subrounded and cemented by chalcedony and kaolinite. Potassium feldspar, glauconite, and heavy minerals are relatively rare. In sandstones from the Chełmo Mount, only a few, small, muscovite flakes were identified. The Albian sands at the Kopiec outcrop are largely similar to those found on the western side of the present-day HCM. These are clastic sediments dominated by medium- and coarse-grained quartz sands. In the sands of Kopiec, however, there are significant amounts of small pieces of fine-grained phosphorite rocks and carbonate cements (mostly calcite) that are not found in the Miechów Segment. The Albian sediments from the Łuków IG-1 and Piaski IG-2 boreholes are similar to each other. They constitute poorly cemented, fine-grained sandstones or loose quartz sands with a significant amount of glauconite and fine muscovite flakes. As in the sample from Kopiec, small grains/clasts of phosphorite are also present. The Albian sandstones from the Tomaszów Lubelski IG-1 borehole are poorly lithified, composed of medium-grained quartz with macroscopically visible glauconite. However, the concentrations of muscovite are much lower than in samples from the north (Łuków IG-1 and Piaski IG-2). The sample taken from the Potok IG-1 borehole is similar to that from Tomaszów Lubelski IG-1 and Kopiec; it is characterized by a significantly higher content of calcium carbonate and only a few broken muscovite grains were identified.
Although petrographic and mineralogical descriptions of the main mineral components of the Albian sediments from southern Poland are somewhat variable, the heavy mineral assemblage is exceptionally homogeneous and does not exceed 1% of the total grains of entire samples. In all of the examined samples, there is a dominance of minerals that are highly resistant to physical and chemical weathering. Thus, tourmaline, rutile, zircon, staurolite, and to lesser extent monazite-(Ce) dominate in heavy mineral assemblages. Garnet, spinel, kyanite, and sillimanite can also be found, but in much lower amounts. Significant and variable concentrations of Fe-Ti oxides, usually very strongly affected by leucoxenization, are also present in all of the analyzed samples.
The most frequent rutile grains are dark yellowish to reddish brown. The crystal size is variable and, on average, ranges from approximately 20 µm to 250 µm (Figure 3). Grains larger than 300 μm are rare and commonly rounded. Under the SEM and optical microscope, most rutile grains are euhedral, only partially angular, subangular, and subrounded in shape (Figure 3). Various degrees of abrasion can be distinguished on the grain surfaces. The edges and joints of the walls are often abraded to a higher degree than the wall surfaces. Rounded rutiles are subordinate (Figure 3a,g) and represent up to approximately 30% of all the rutile grains. Detrital rutile from the same outcrop or borehole shows all possible stages of abrasion and weathering, e.g., rutile grains from the Bolmin at the Miechów Segment (Figure 3b–d). Numerous grains show the pristine euhedral habit (Figure 3b); moreover, numerous grains have fresh cracks without weathering (Figure 3c), although highly altered grains are also common (Figure 3d). Rutile grains from the Łuków IG-1 borehole, the Puławy Segment, are also variable (Figure 3e,f). Some needle-like rutile crystals do not show any signal of alteration apart from initial physical weathering (Figure 3e), whereas other grains (Figure 3f) are altered (most likely by chemical etching) and then subrounded during physical weathering. The highest degrees of physical and chemical weathering are visible in rutile grains from the Tomaszów Lubelski IG-1 borehole, Puławy Segment. Numerous grains from this locality are highly abraded and chemically etched (Figure 3g,h), but as in the other localities, euhedral, pristine rutile grains can also be found.

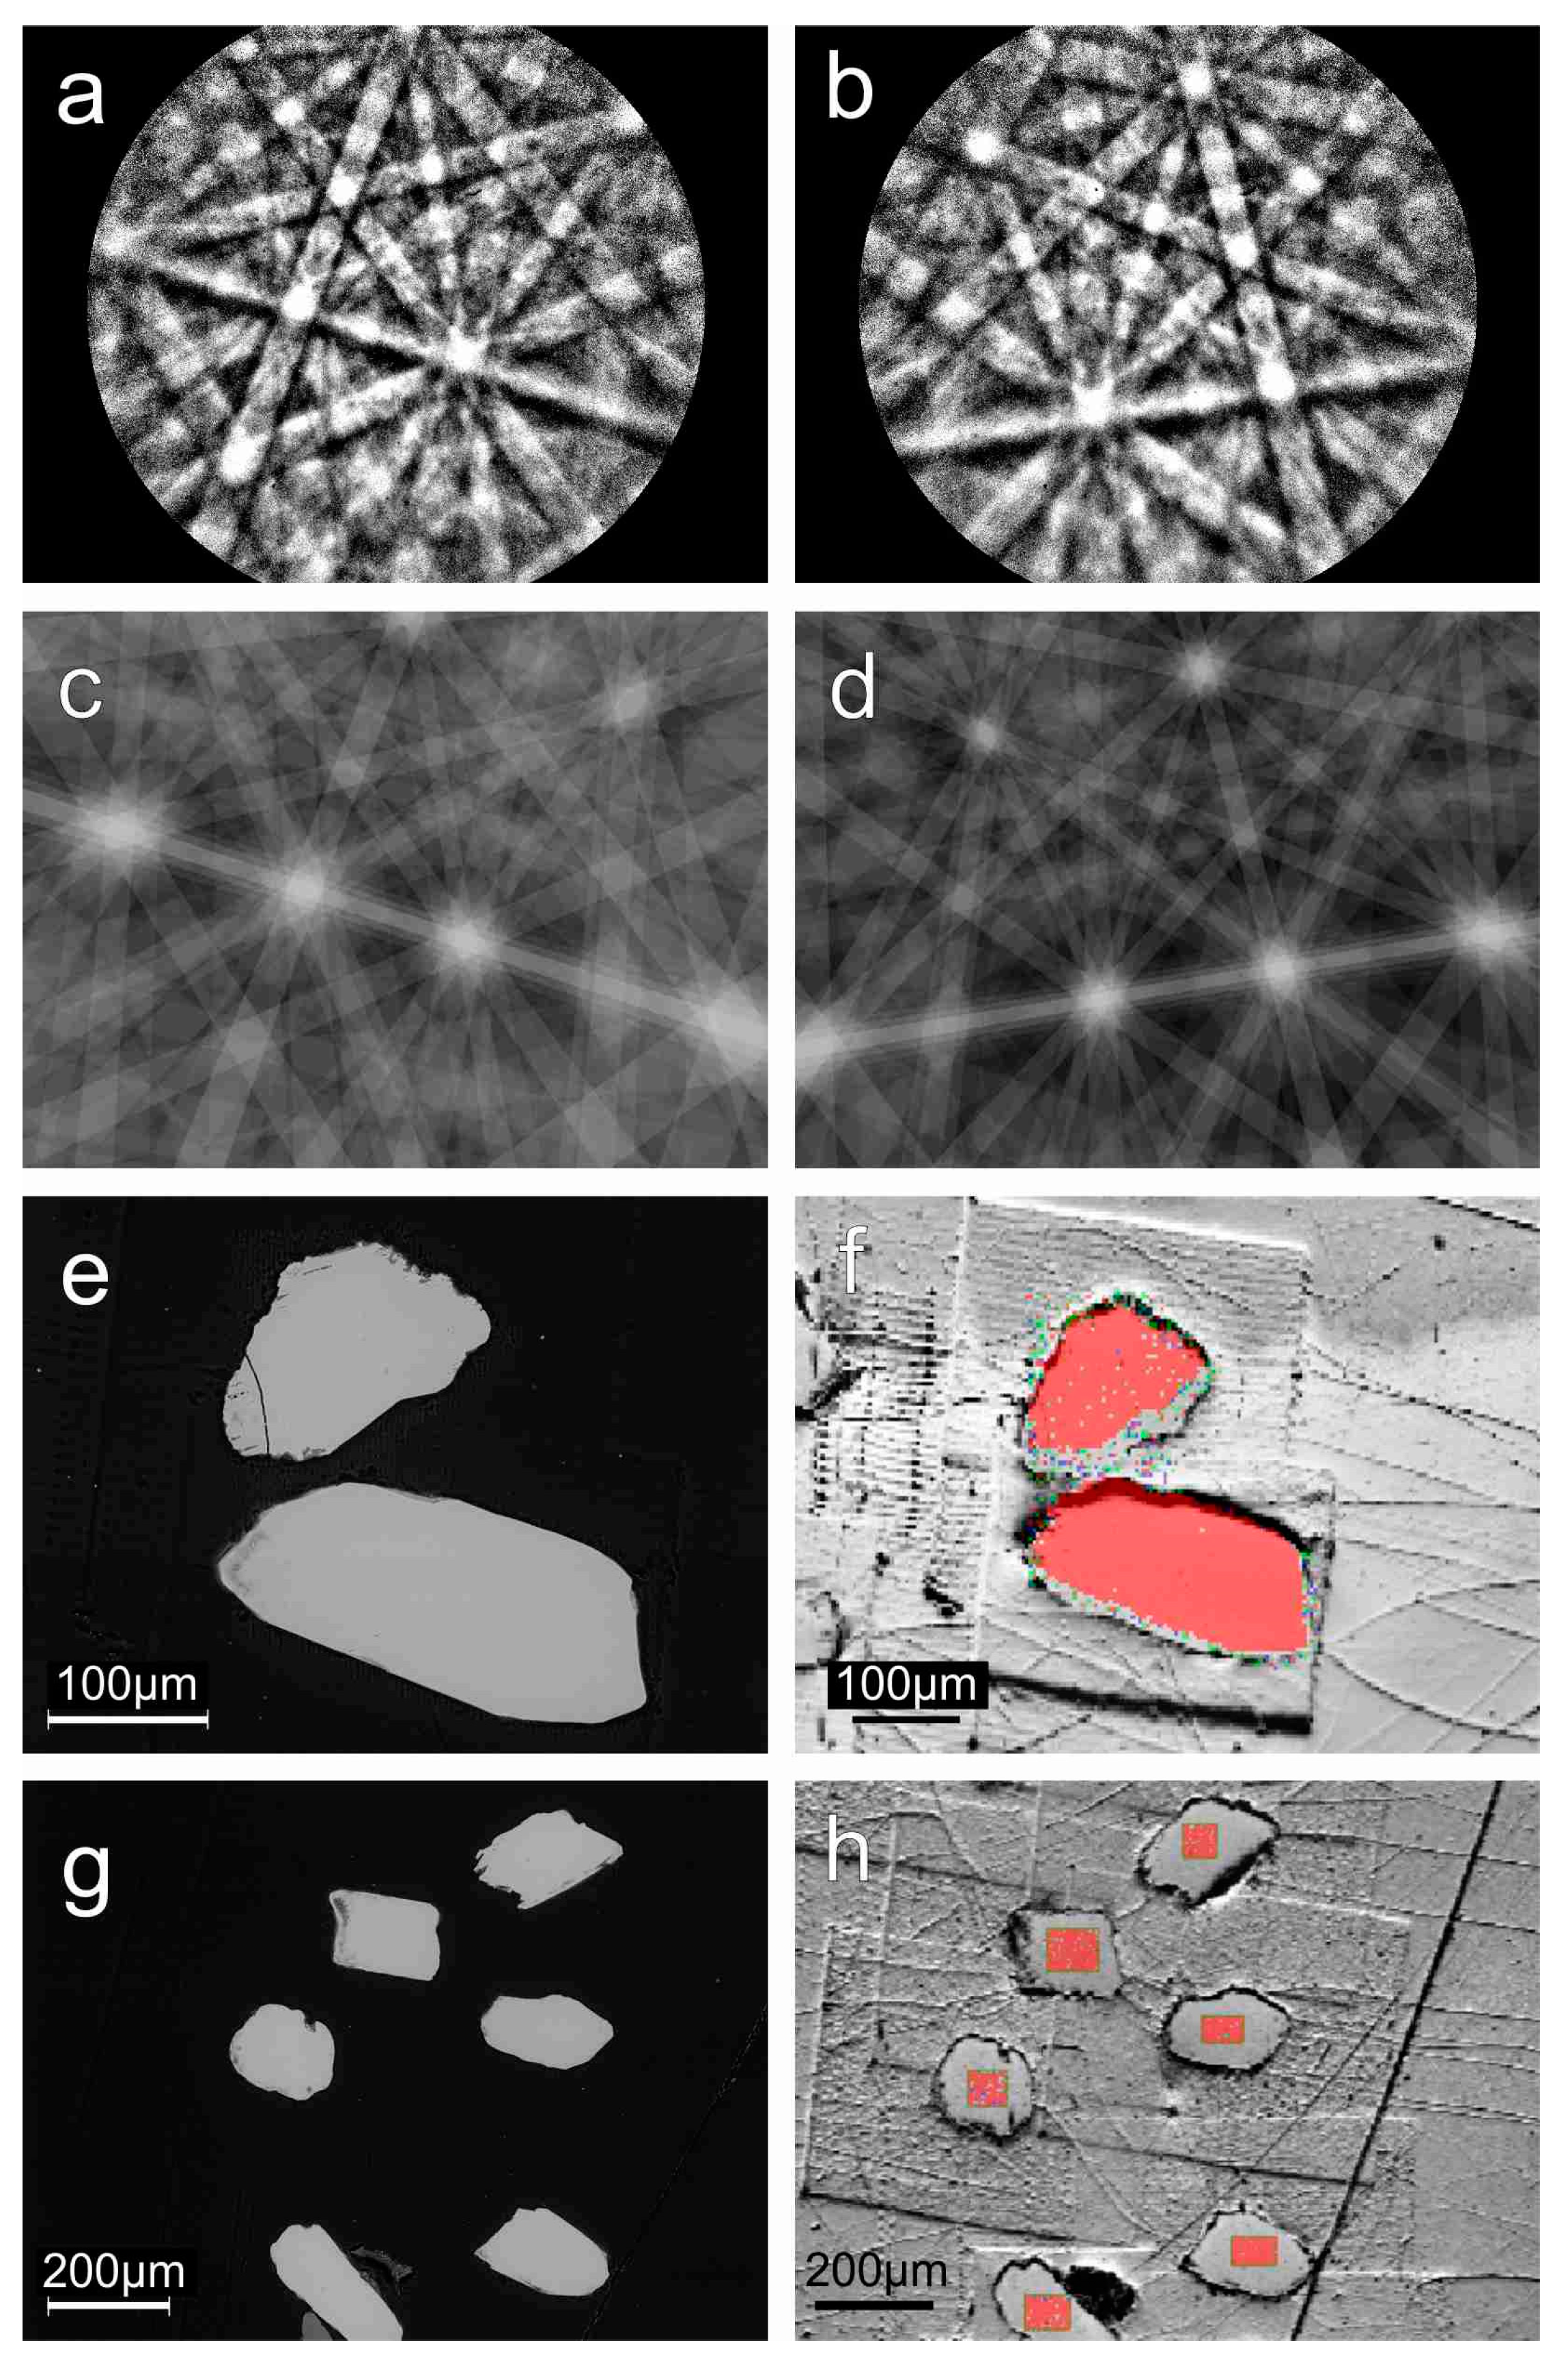
5.2. Results of Electron Backscattered Diffraction Analysis (EBSD)

To be able to correctly use the ZIR geothermometer, it is crucial to be certain that the mineral grains being analyzed are rutile and not the other common TiO2 polymorphs such as anatase or brookite. When the ZIR geothermometer is applied to a TiO2 polymorph other than rutile, the results may be highly inaccurate [47,75]. Because all the most common TiO2 polymorphs, i.e., rutile, anatase, and brookite, have similar magnetic susceptibilities [45] and densities, it is difficult to separate them using only magnetic or density separation methods. The SEM-EDS method, as well as the electron probe microanalysis, are also not sufficient for accurate polymorph identification [75]. Other polymorphs, e.g., riesite and akaogiite [52,53], representing the high pressure varieties of TiO2 polymorphs, are found in impact craters; however, they are extremely unlikely to be found in high abundances in clastic sediments. The correct polymorph identification of the rutile grains selected for chemical studies can be performed using Raman spectroscopy [76,77] or EBSD [51].
The electron backscattered diffraction analyses were done to check the precision of rutile separation from the Albian sands and to test for rutile identification on the basis of trace element concentrations as proposed by [75]. The results of EBSD phase mappings (Figure 4) do not show any polymorph other than rutile in the handpicked grain set, even in cases of uncertain grains. All analyzed TiO2 minerals are rutile, and no other TiO2 polymorphs such as anatase or brookite were recorded. The rutile grains do not contain any visible exsolution, twins, or crystallographically misoriented domains.
All TiO2 grains with a very low V content (<50 ppm), which, according to the criteria of [75], might be classified as anatase, were also tested. The results of the EBSD analysis showed that all the separated TiO2 minerals with a low V content were rutile (see Figure 4, Table 3).

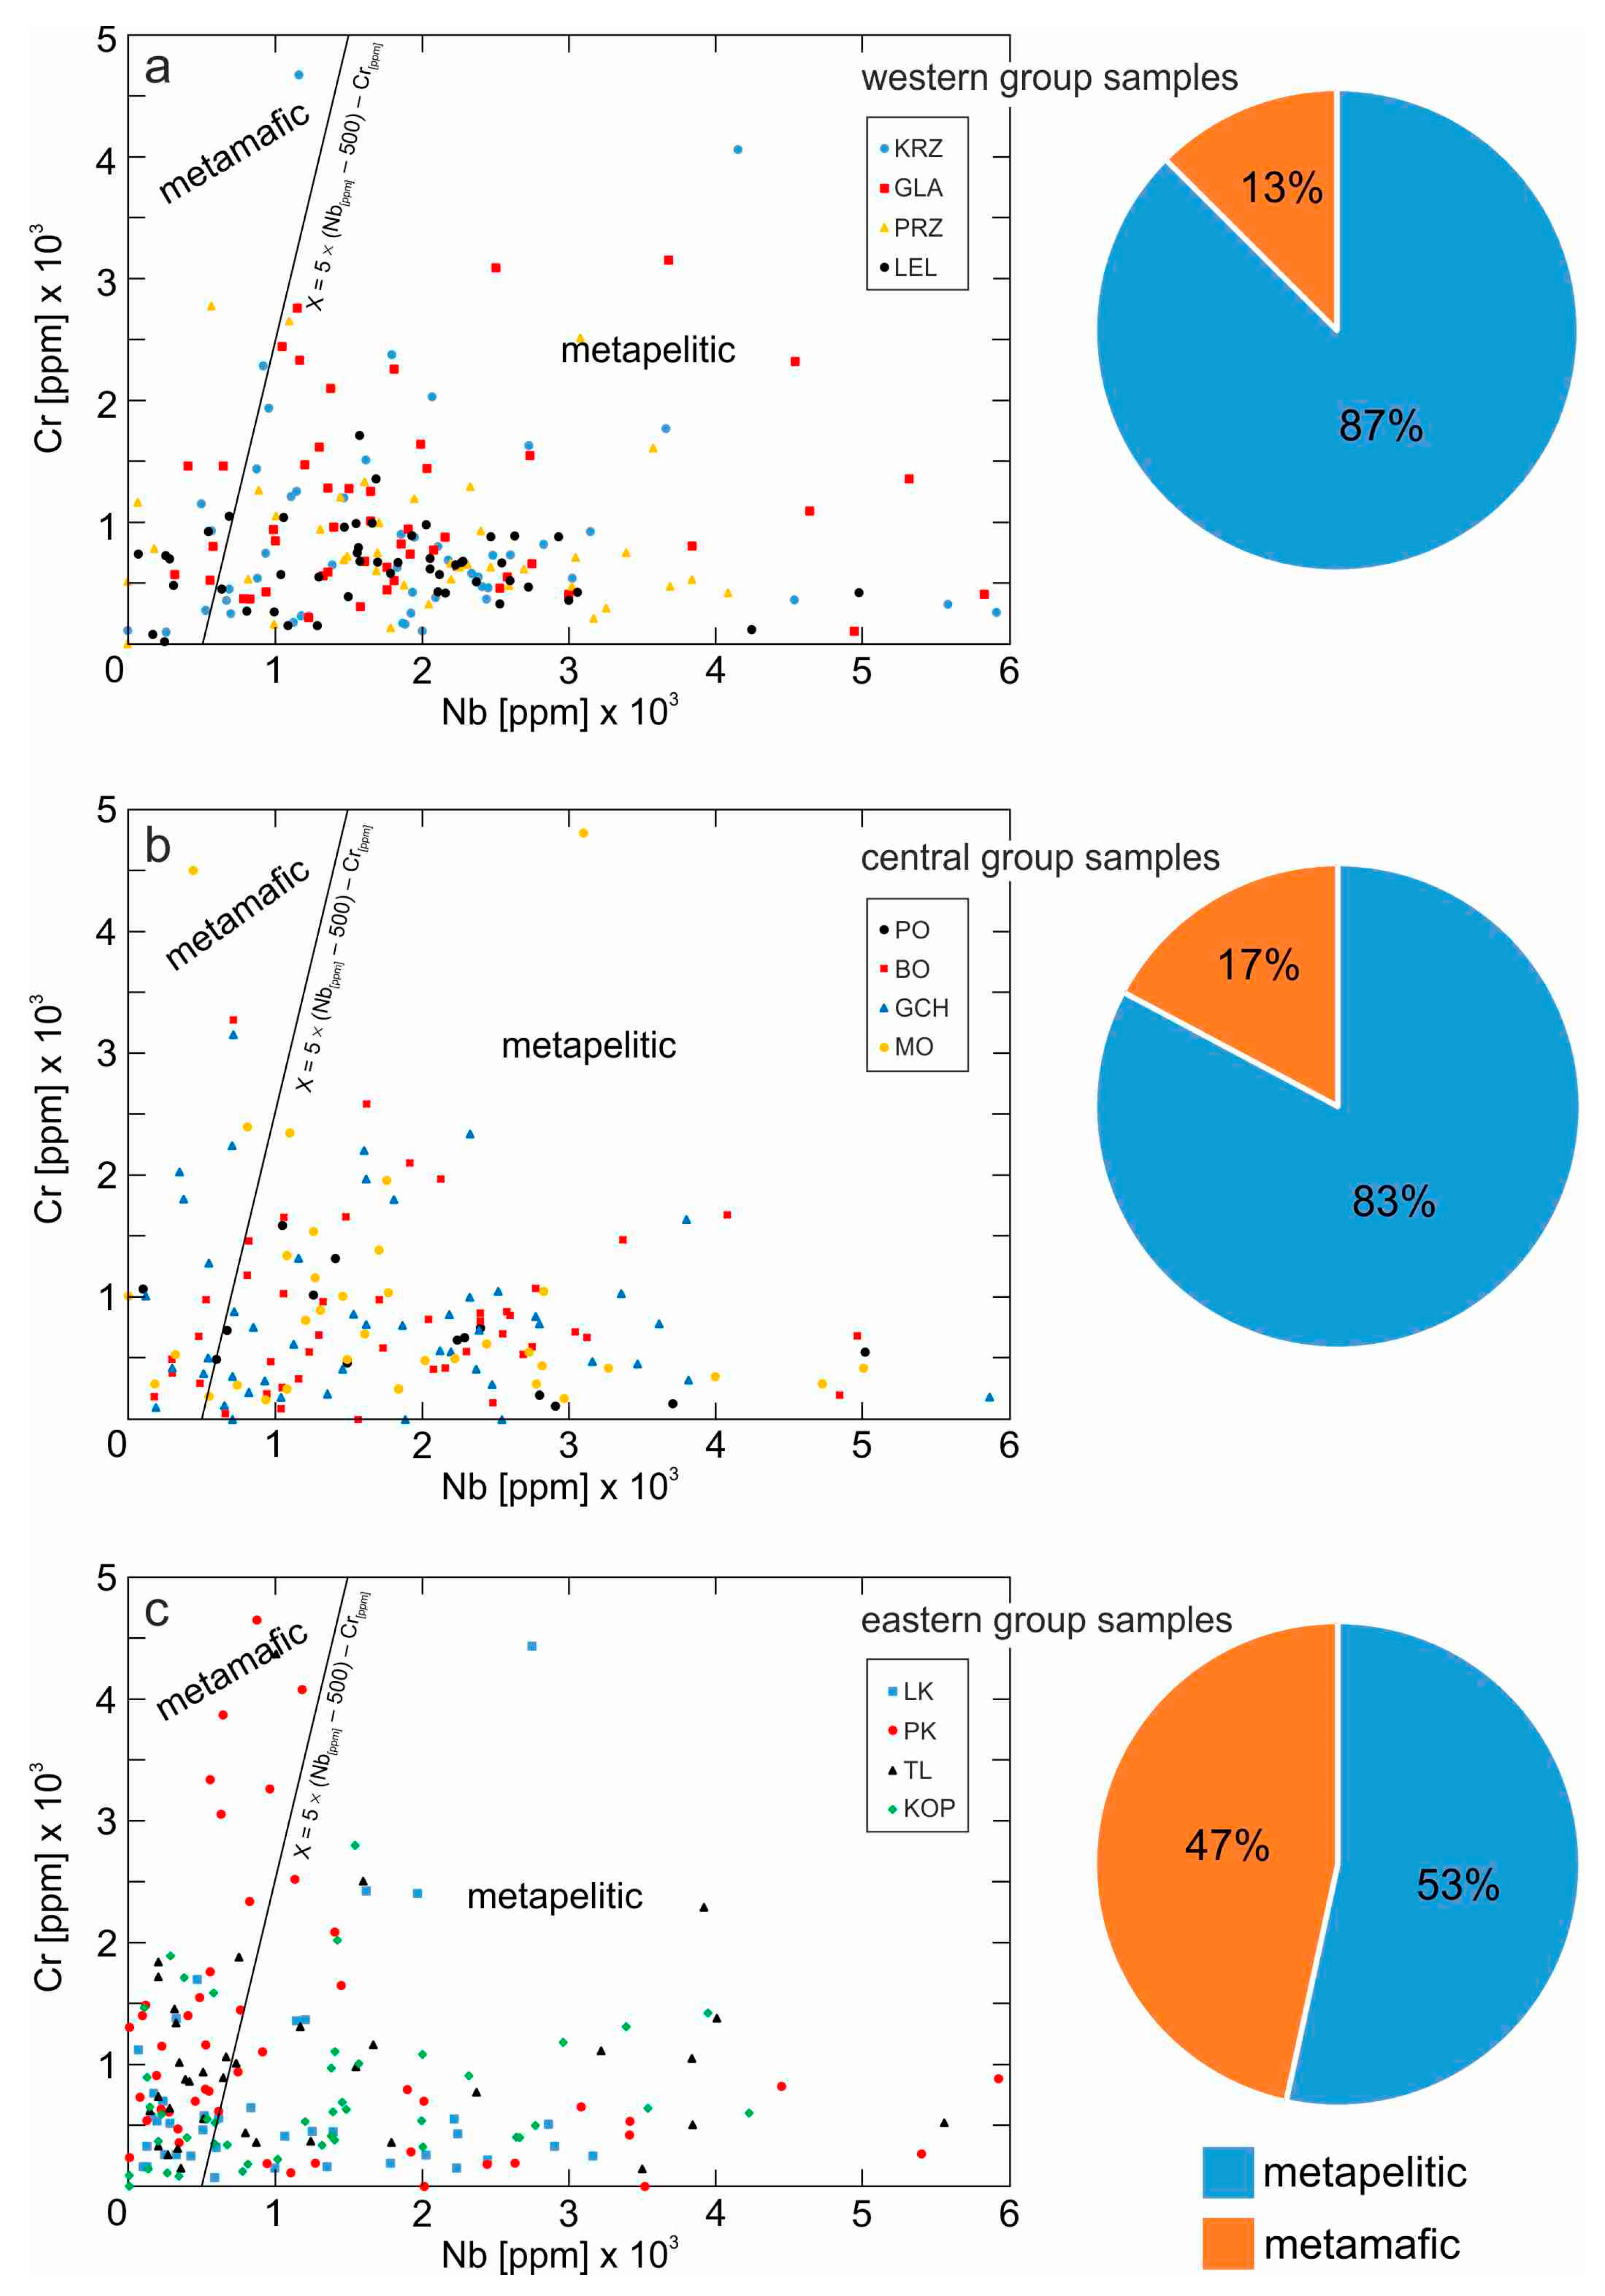
5.3. Mineral Chemistry of Examined Rutile (EPMA)

The chemical compositions of 604 rutile grains, selected from the twelve localities of the examined Albian sands of SE Poland (see Figure 2), were determined by the electron microprobe method (EPMA). A representative data set is presented in Table 3, while the full dataset is attached to the paper as Supplementary Material (see Table S1). The analyses were considered valid when the total sum deviated by no more than 1.5 wt.% from 100 wt.%. Rutile analyses with an Si content higher than 200 ppm were also excluded from further consideration, as suggested by [31,54]. This step is necessary to rule out any rutile grains with zircon (ZrSiO4) micro-inclusions, which may artificially increase the content of measured Zr, and thus inflate the calculated rutile crystallization temperature. Exsolution lamellae of baddeleyite (ZrO2) were not found in any of the analyzed rutile grains.
The average concentrations of trace elements (Nb, Si, Zr, Al, V, Cr, Mg, Mn, and Fe) in rutile were within the ranges typical of different types of metamorphic rocks [30,54,55,62]. The sum of the content of these elements determined in the rutiles from the Albian deposits of SE Poland varied from 0.16 wt.% to 9.77 wt.% (see Table S1). More than 60% of the rutile analyses show the sum of the trace element content below 1 wt.%, while only 1.5% of the analyses have a total content of trace elements exceeding 3 wt.%. The measured Zr concentrations of analyzed rutile grains extend from 0 to 7490 ppm (see Table S1) with no distinctive internal chemical zonation. The range of Zr contents in nearly all samples varies from 4000 to over 7000 ppm. Only in the sample from the Łuków IG-1 borehole, the range is limited to 1020 ppm. However, the median Zr content within an analyzed sample rarely exceeds 1000 ppm. Rutile grains with very low Zr or with Zr below detection limits were also identified in all the studied samples (Table S1).
The concentrations of Fe (on average 1500–2000 ppm) and Cr (average 620–680 ppm) in rutile are uniform and do not vary significantly, both within and between samples. The mean Nb concentrations in most samples are above 1500 ppm. Only in Tomaszów Lubelski IG-1, Piaski IG-2, and Łuków IG-1, the mean Nb concentrations range from 740 to 830 ppm. Vanadium contents in rutile grains also show visible differences with regard to sampling location (see Table S1). In localities from the Miechów Segment, i.e., the geographically western zone (Przychody, Glanów-Stroniczki, Lelów, Korzkiew, see Figure 2) and central zone (Bolmin, Mokrzesz, Chełmo Mount, see Figure 2), the mean V concentrations are mostly above 1000 ppm. The highest concentrations of V, reaching over 13,330 ppm, are reported from Przychody (on average, in this sample, 8010 ppm) and Glanów-Stroniczki (average 5105 ppm). Rutile grains east of the HCM, i.e., from the Szydłowiec and the Puławy Segments, which is the central zone (Potok IG-1) and the eastern zone (Tomaszów Lubelski IG-1, Łuków IG-1, Piaski IG-2, Kopiec, see Figure 2), contain much less V in their structure. Their mean V concentrations do not exceed 1000 ppm, e.g., in Kopiec, Tomaszów Lubelski-IG1, and Piaski IG-2, they range from 650 to 750 ppm. The lowest concentrations of V are in rutiles from Łuków IG-1, with a median value of less than 400 ppm (Table 3).

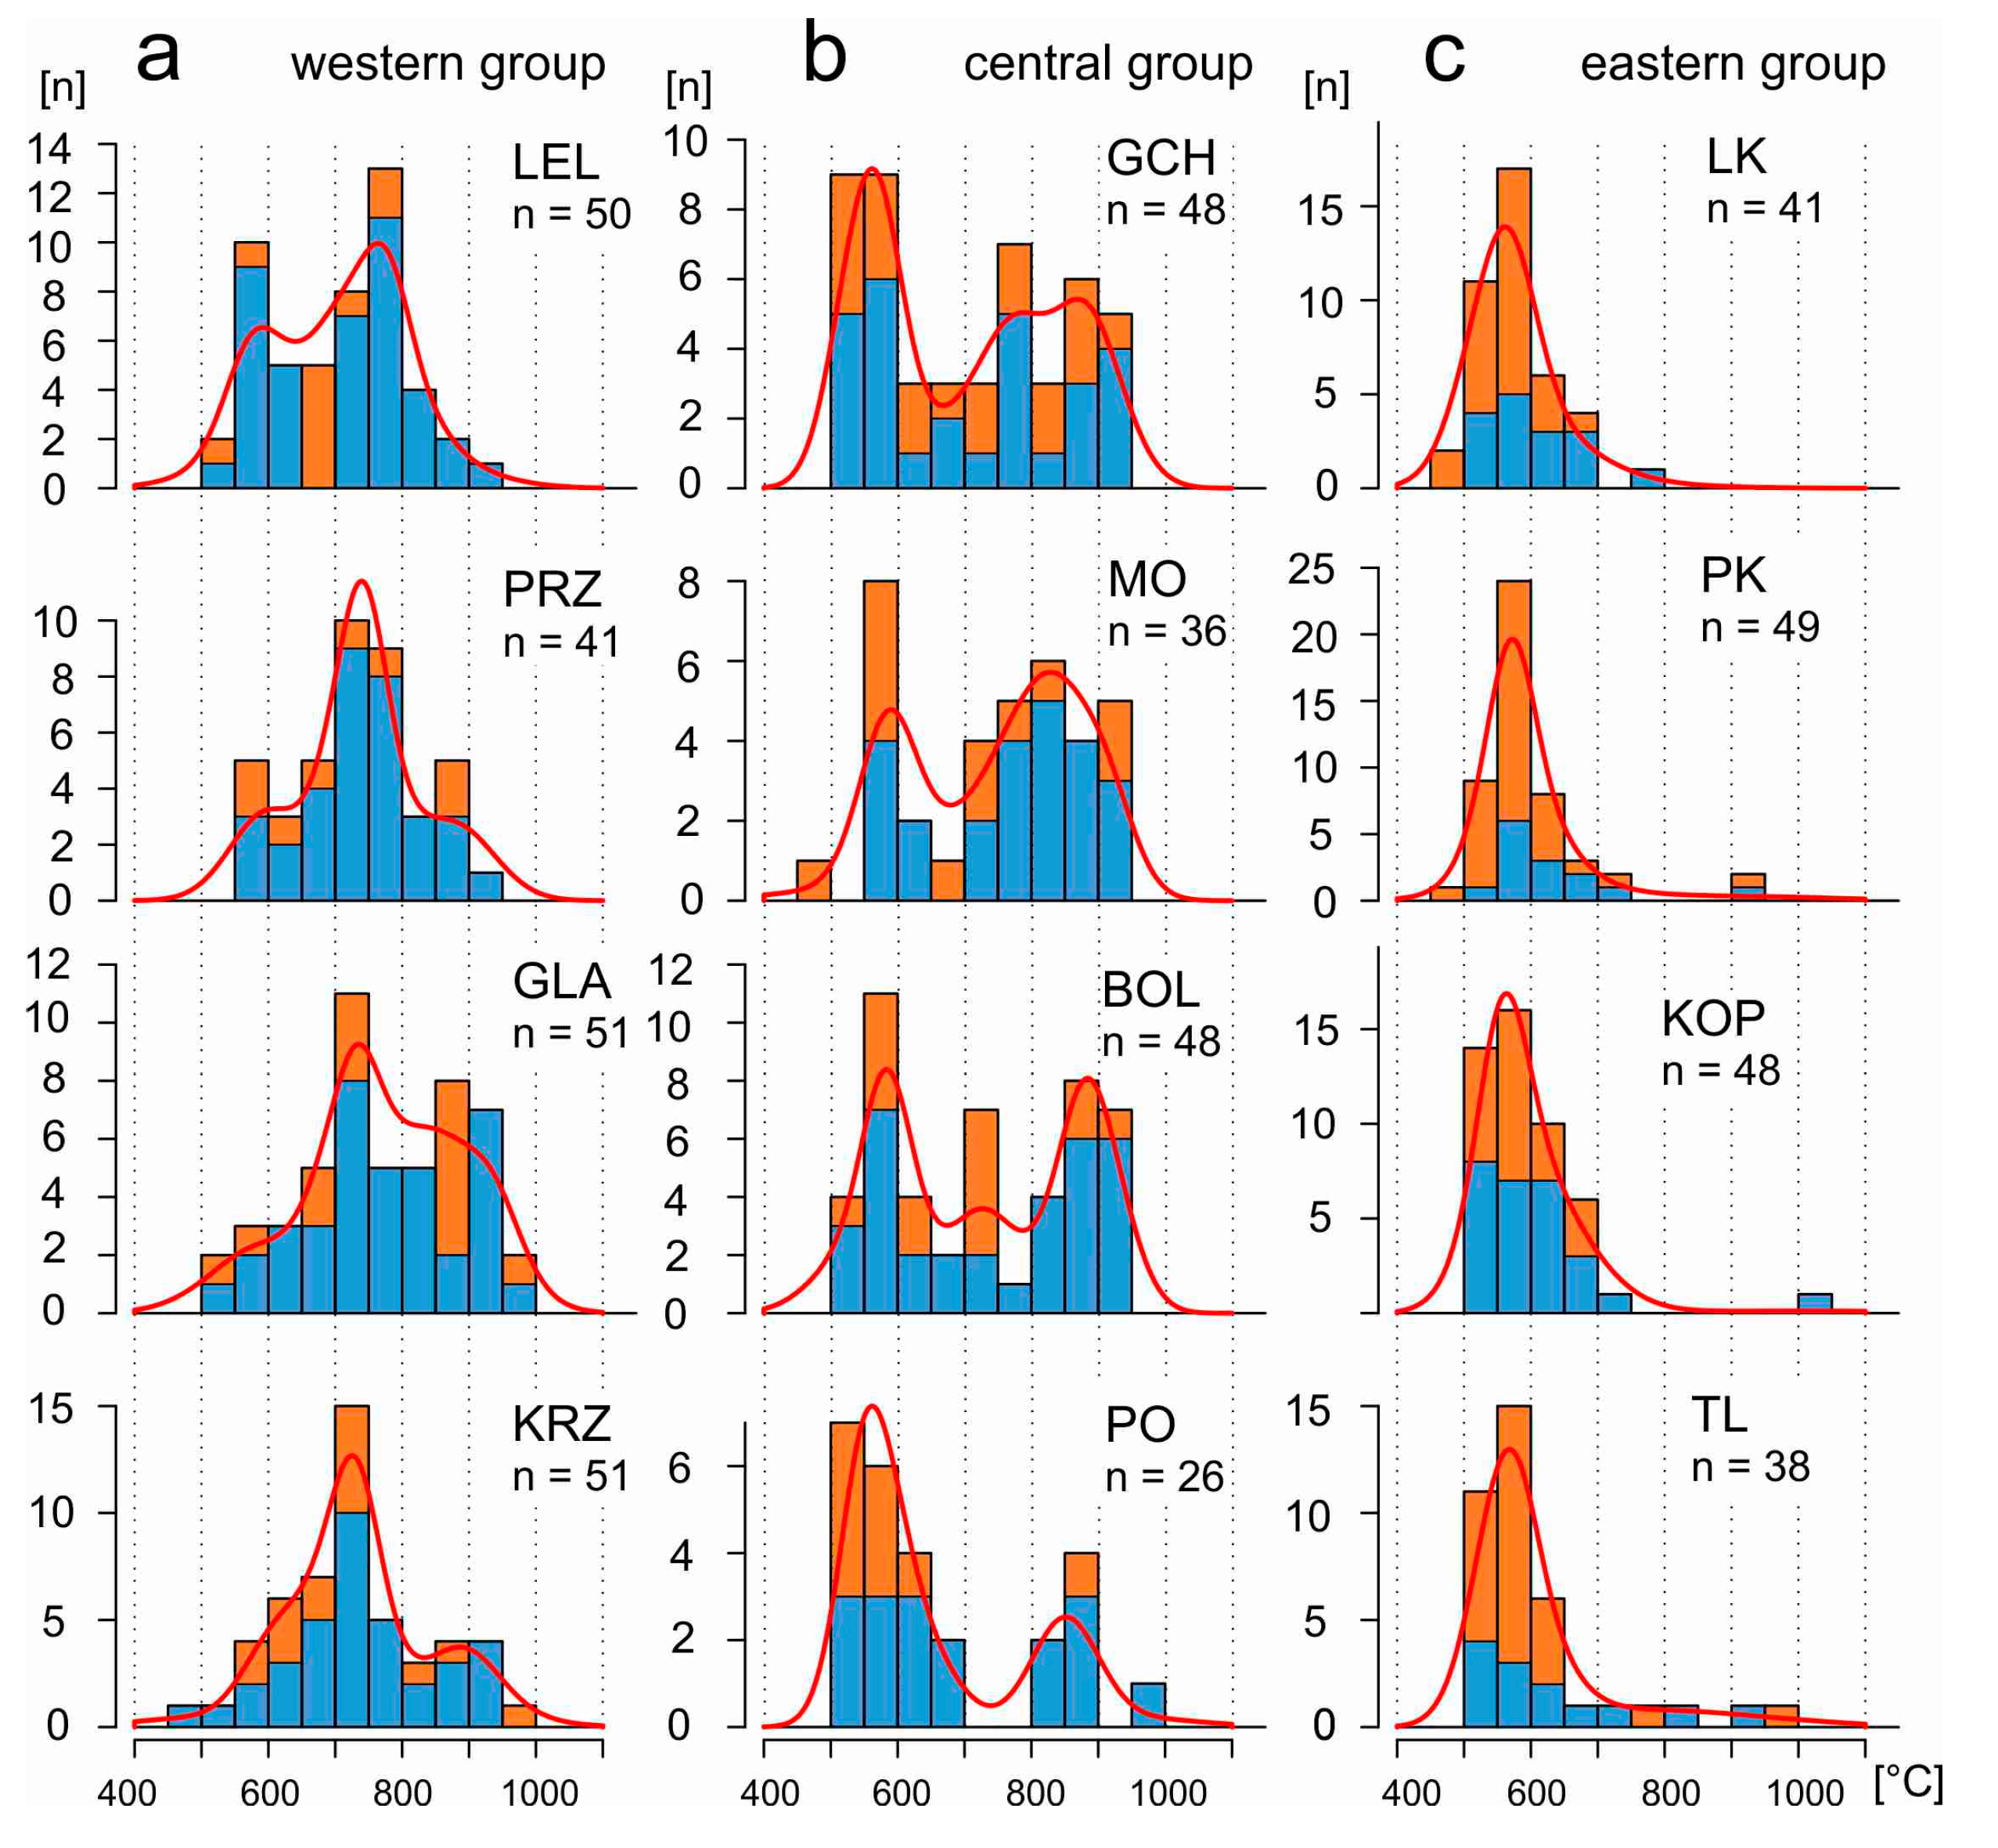
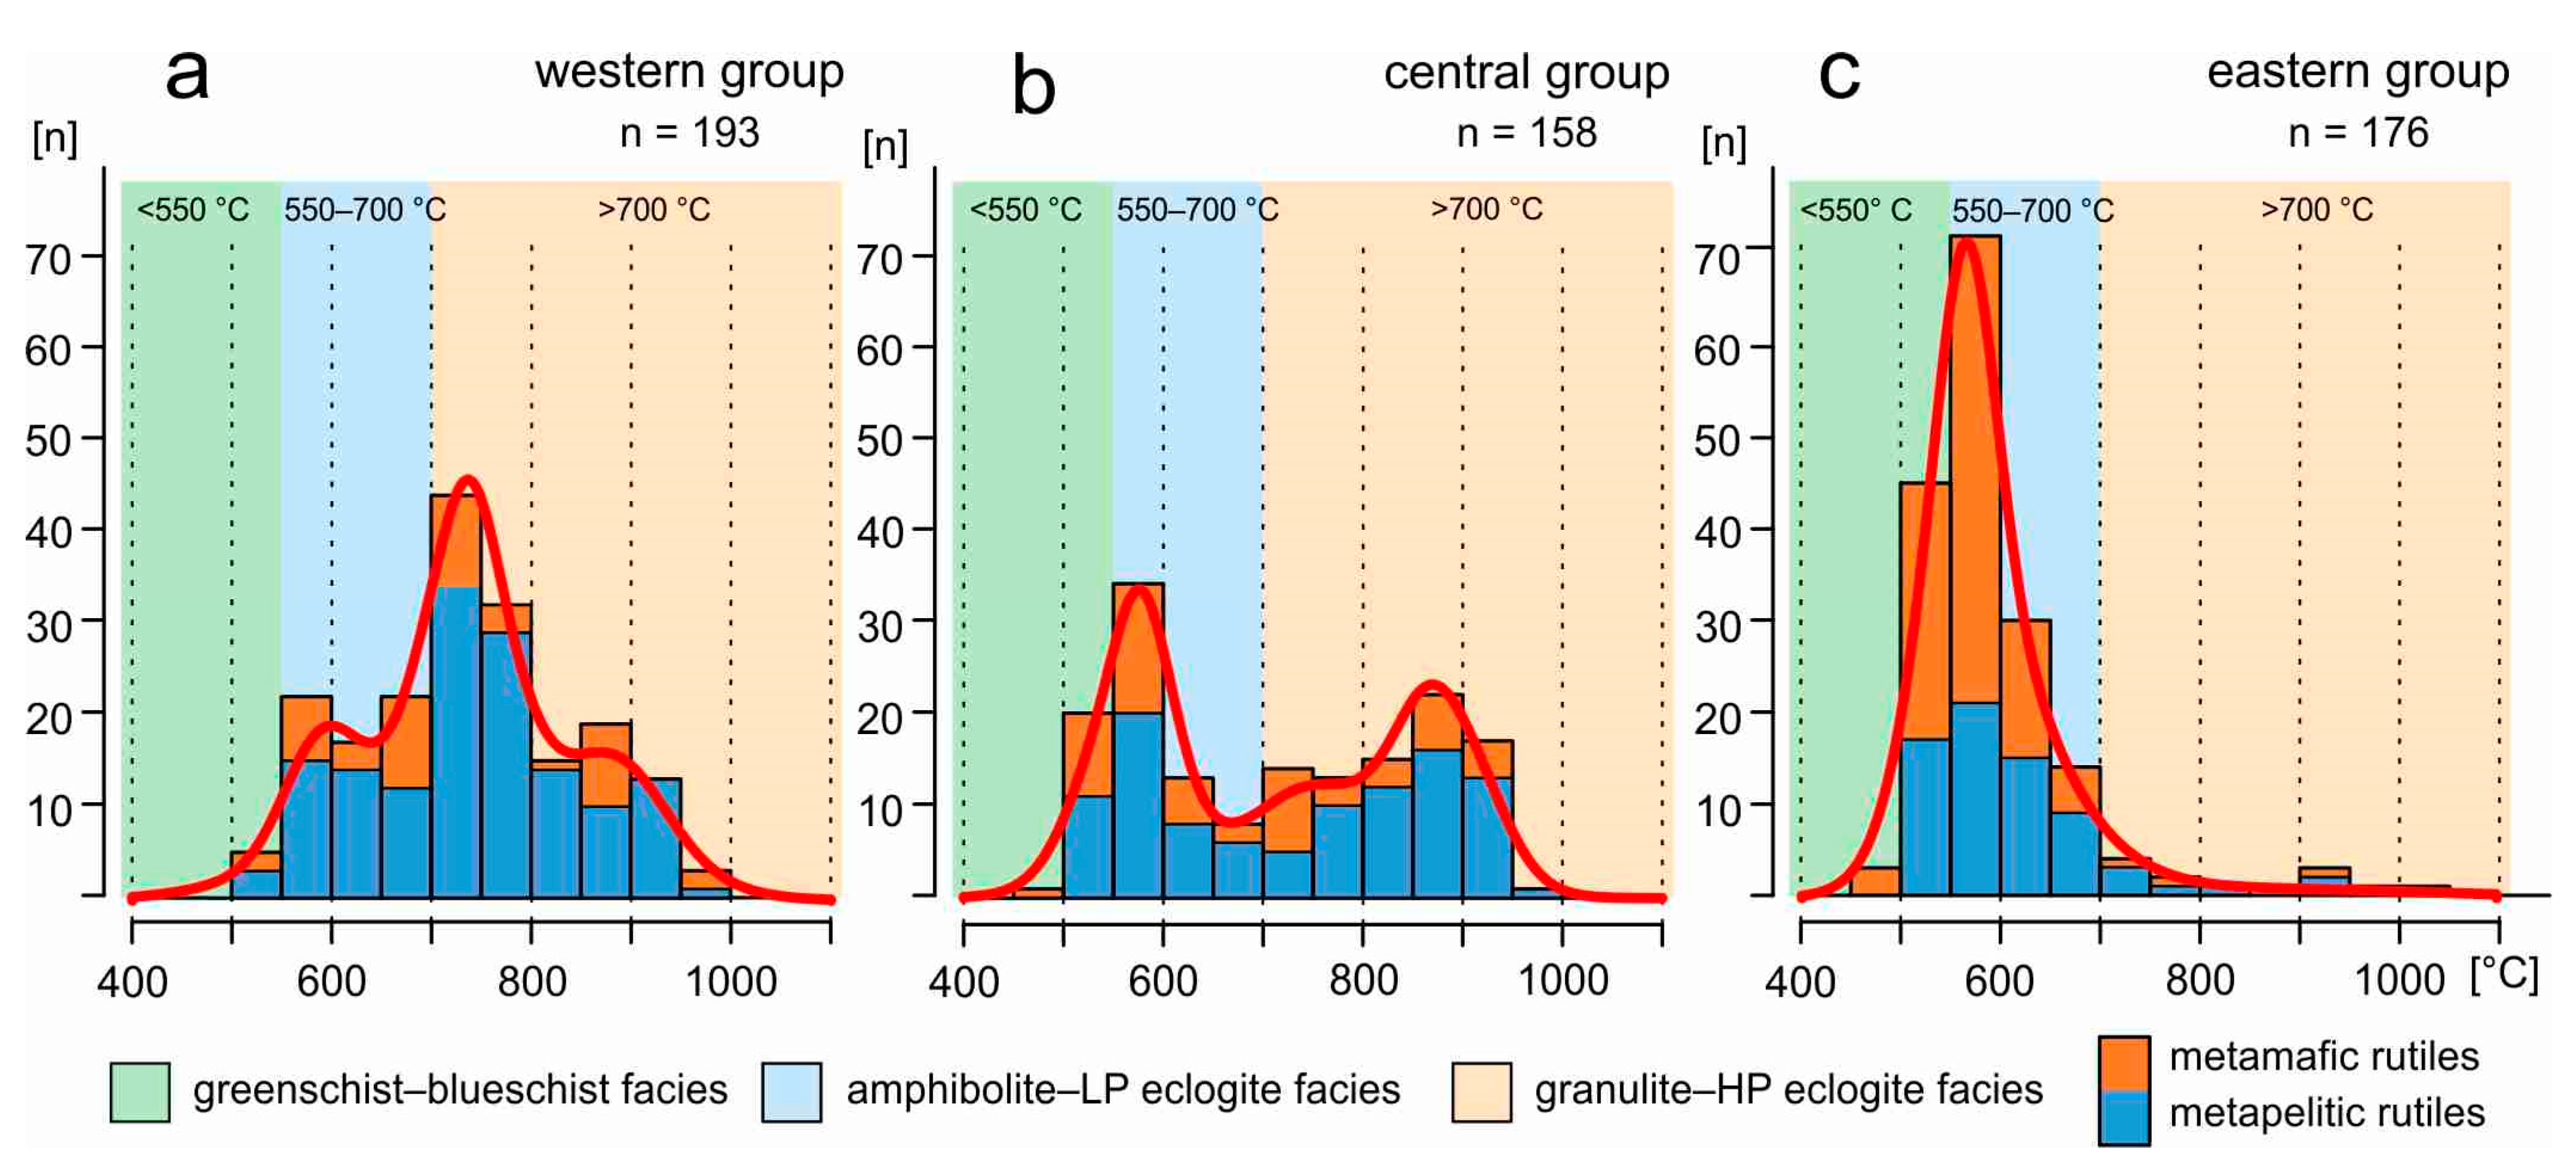
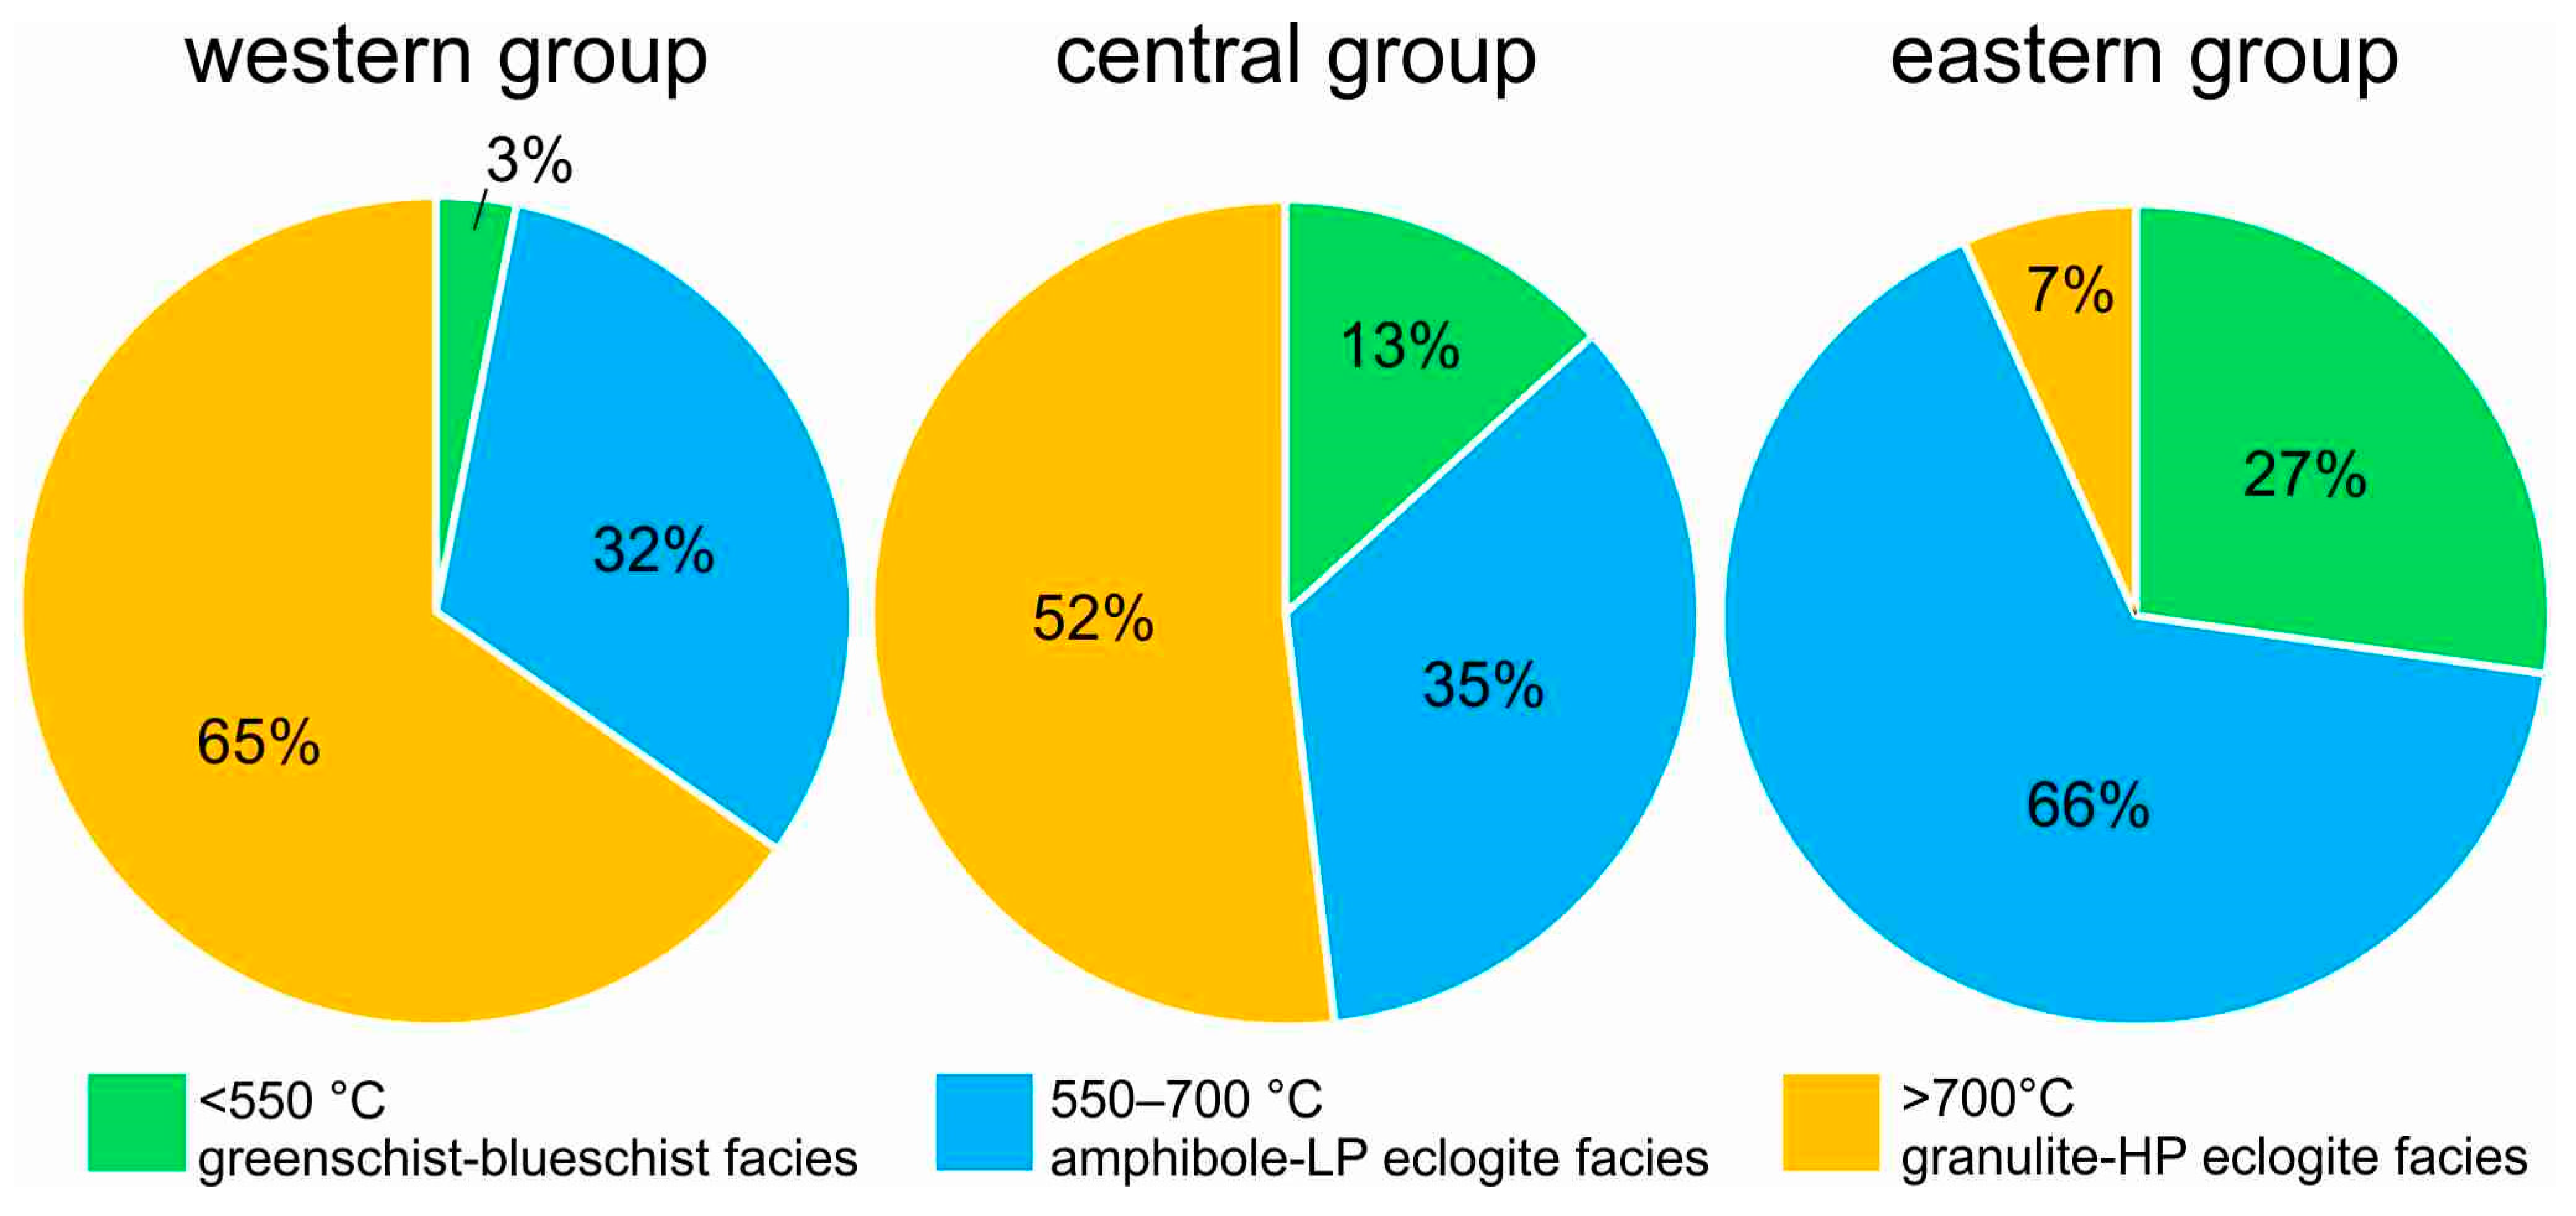
5.4. Estimation of Rutile Crystallization Temperature Using ZIR Geothermometer

Despite a significant range of zircon concentrations in each sample, distinctive peaks of estimated crystallization temperatures are indicated based on the rutile geothermometer calibrated by [32]. Estimates of the rutile grains are presented in Table 3 and Supplementary Table S1. Taking into account the temperature distributions in each of the tested samples (see Figure 5), three groups of samples (western, central, and eastern) were distinguished in Figure 6, which additionally allows us to divide the area of SE Poland into three regions (western zone, eastern zone, and central zone, see Figure 2), characterized by a similar spectrum of rutile crystallization temperatures.
The western group of samples includes four outcrops: Korzkiew, Glanów-Stroniczki, Przychody, and Lelów (Figure 2). The histograms of temperature distribution are polymodal (Figure 5a and Figure 6a). The majority of results oscillate around 700–800 °C; however, there are also visible peaks in the range of 550–600 °C as well as close to 900 °C. The distribution is platykurtic (Figure 6a) with a negative excess −0.6. Rutile compositions from the western group presented in the Nb-Cr diagram [47] show a significant dominant abundance of rutiles from matapelitic rocks over rutiles from metamafic rocks (Figure 7a). The content of metapelitic rutile grains varies between 80 and 90% of the population in each of the analyzed locations in the western zone, averaging 87% of metapelitic rutile, while the metamafic rutiles represent only 13%.
The eastern group also includes four sample localities, three boreholes: Łuków IG-1, Piaski IG-2, and Tomaszów Lubelski IG-1, as well as the Kopiec (Annopol) outcrop. All listed localities are positioned east of the Holy Cross Mountains (Figure 2). The temperature histograms are monomodal in this group of samples (Figure 5c and Figure 6c). The distribution is leptokurtic (Figure 6c), with a positive excess of 6.7. The distribution of the results is also much more concentrated than that of the normal distribution. The rutile compositional data from the eastern part of the study area presented on the Nb-Cr discrimination diagram show a nearly even distribution of rutiles from metamafic and metapelitic rocks (Figure 7c). The content of metapelitic and metamafic rutile is similar, at 53% and 47% respectively. The highest ratio of metamafic rutiles, reaching 57%, can be found only in the sample from the Piaski IG-2 borehole near Lublin.
The central group includes the following localities: Mokrzesz, Chełmo Mount, Bolmin, and borehole Potok IG-1 (Figure 2). The histograms of temperature distribution are bimodal in this group (Figure 5b and Figure 6b). The one modal value varies around 550–600 °C, while the second is around 850–950 °C. The distribution is platykurtic (Figure 6b) with a clearly negative excess of −1.5. The rutile data from the central group presented in the Nb-Cr diagram show the prevalent abundance of rutiles from metapelitic rocks over rutiles from metamafic rocks (Figure 7b). The contents of metapelitic rutile vary on average around 83% of all the rutile grains, while metamafic rutile represents only 17%. The distribution of the calculated crystallization temperatures, in both metamafic and metapelitic rutiles, does not differ significantly in all three groups (Figure 5 and Figure 6).

6. Discussion

6.1. Geochemistry and Temperatures

The simple chemical composition of rutile (TiO2) restricts the possibility of significant Ti substitution by other elements in the mineral structure [54]. This feature excludes rutile as a good tool for determining the provenance of clastic sediments solely on the basis of the variability in major element composition. It was suggested by [30] that rutile grains with more than 1000 ppm of Fe tend to be metamorphic in origin. This parameter is not as widely used as, e.g., in the Nb/Cr discrimination of lithology, but nevertheless, it can be useful in determining source rock lithology. In all the samples, the majority of rutile grains have more than 1000 ppm of Fe (Table S1, Supplementary Materials). In the western and central zones, they constitute c. 66.5%, while in the eastern zone, those metamorphic rutiles make up 80.1% of all analyzed rutile grains. Therefore, it seems that metamorphic rocks were the main sources for detrital rutile grains in Albian sands of southern Poland.
Rutile, in the petrographic study of high-grade metamorphic rocks, plays an important role as a constant component in the paragenesis of metamorphic rocks [51,54,55,57,62,78]. Petrological studies of igneous and metamorphic rocks have documented an increased concentration of trace elements such as Zr, W, Cr, V, Hf, Nb, Ta, and others [54,65,74,79]. These data are used to identify the protoliths of metamorphic rocks and in geothermometry and geobarometry [33,78,80]. The data obtained from PT studies of rutile crystallization conditions in metamorphic and igneous rocks have also been successfully applied to detrital rutile [28,29,33,34,81].
Estimation of rutile crystallization temperatures using a ZIR geothermometer [31,32] gives a wide range of results ranging from <500 °C to over 1000 °C (Figure 5 and Figure 6, and Table S1). The estimated crystallization temperatures of rutile in the Albian sand samples that were collected from outcrops (Table 1) in SE Poland point to metamorphic facies: greenschist–blueschist (<550 °C), amphibolite–lower temperature (LT) eclogite (550–700 °C), and granulite–high temperature (HT) eclogite (above 700 °C) (Figure 8).
Platykurtic distribution of calculated rutile temperatures from the western and central groups indicates rather variable sources of the detrital material. Rutile with temperatures peaking at 700–800 °C and above 900 °C was derived mainly from granulite–HT eclogite facies rocks (65% in the western group and 52% in the central group), while a much smaller amount of rutile grains with temperatures peaks at 550–600 °C were probably derived from amphibolite–eclogite facies rocks (32% in the western group and 35% in central group). Single grains (3% in the western group) and non-common grains (13% in the central group) were derived from greenschist–blueschist facies rocks (Figure 8). By contrast, monomodal distribution of temperatures in the eastern group points to one source rock and a common area of provenance of the rutile grains. Most results vary around 550–600 °C and are derived from amphibolite–LT eclogite facies rocks (66%).
Considering the distribution of rutile crystallization temperatures within the three groups, the eastern one is clearly characterized by rutile with crystallization temperatures peaking at 500–600 °C (Figure 6), while such rutile occurs in only small amounts in the western group. In turn, rutile with a crystallization temperature of 700–800 °C dominates in the western group, but appears sporadically in the eastern group. Such characteristics clearly indicate at least two different source areas providing material for the detrital rutile. This is confirmed by the proportion of rutile originating from metapelitic and metamafic rocks. In the western group, metapelitic rutile grains clearly dominate over metamafic rutile, while in the eastern group, the amounts of metapelitic and metamafic rutile are nearly equal (Figure 7). Additionally, the V contents in rutile also point to different sources for the western and eastern zones. On average, rutiles grains from the western zone contain c. 1910 ppm of V, which contrast with contents around 625 ppm in the eastern zone (Table S1). The detrital rutile of the western and eastern groups appears to come from various host rocks and probably from different source areas.
Interesting data come from the central rutile group (Figure 6). In this group, the amount of rutile with temperatures of crystallization in the range of 500–600 °C is clearly visible, which are those that dominate the eastern group and are of minor importance in the western group. So, here we have a clear influence of detrital rutile from the same source as rutile in the eastern group. On the other hand, rutile with the crystallization temperature range of 700–800 °C in the central group is present, but is not so dominant as in the western group. Moreover, in the central group, there is a distinct group of rutile grains with crystallization temperatures ranging from 800 °C to 950 °C, which are also present in smaller amounts in the western group, and very sporadically in the eastern group (only five grains). Thus, such data may indicate that part of the detrital material was supplied to the central zone from the same source as the western zone. The last interpretation is confirmed by a very similar proportion of metapelitic rutile to metamafic rutile in the central and western groups (Figure 7). It seems, therefore, that the group distinguished as central was influenced by various lithological sources and probably provenance. The detrital material deposited in the central zone was derived from the same source as in the western group, but also has some signs of the same source as that of the eastern group, i.e., the central zone constitutes a distinct mixed group. Additionally, this group has a clear large admixture from high-temperature granulite and HT eclogite facies rocks (above 850 °C) similar to the western group.
A multidimensional scaling (MDS) statistical analysis was used to compare the similarities between the samples. The MDS is a technique that compares large datasets of a variable, e.g., temperature, element concentration, detrital age, and so on [82]. The result of this method is a configuration of points in the two-dimensional Euclidean plane, creating some sort of a map in which samples with similar analyzed variable values tend to cluster close to each other, while samples with greater dissimilarities plot further apart [83,84,85,86]. It is worth noting that the MDS diagrams of calculated rutile crystallization temperatures and Nb concentrations visualizing the level of similarity between samples confirm quite well the division into three groups adopted by us based on the ZIR method (Figure 9). The four localities of the eastern zone (samples TL, PK, LK, and KOP) on the MDS diagrams are very close to each other, which indicates a high statistical similarity between those samples. The three samples from the central zone (MO, BOL, and GCH) are also located together on the temperature MDS diagram (Figure 9a), which confirms their statistical similarity. One sample, PO, is located between the TL, PK, LK, KOP and MO, BOL, GCH sample groups. Geographically, the PO sample is close to the eastern zone; however, temperature data allow us to include that sample in the central zone (Figure 5). The four samples from the western zone (GLA, PRZ, LEL, and KRZ) are close to each other on the temperature MDS diagram, reinforcing their inclusion in the same, western group. Similar conclusions can be derived from the MDS diagram of Nb concentrations (Figure 9b). As in the temperature MDS diagram, the eastern group is clearly distinct from the rest of the samples. However, the samples of the central group are not as clearly separated from the western group as shown in the temperature MDS diagram. Nonetheless, a faint division between these two groups can still be distinguished.

6.2. Source Areas and the Paleogeography

The next question is about the source area(s) for sands of the extra-Carpathian of southern Poland during the Late Albian. The answer to this question requires a combination of our results with the paleogeography studies of central Europe (Figure 1). During the Neo-Cimmerian phase, in the early Cretaceous, a significant regional uplift of some areas of southern and western Europe with numerous block tectonic movements took place [87]. In the Middle and Late Albian (110.8–100.5 Ma) during the Cretaceous eustatic transgression [87,88], the sea encroached onto a denuded area of central and southern Poland [35,41]. This part of Poland covered by the epicontinental sea (Figure 1) was the easternmost part of the Central European Basin System [87]. The transgression encroached onto the Polish Lowlands roughly from the NW direction using an earlier tectonic setting of the Polish Trough, and propagated in a south-southeasterly direction.
The area of central and southern Poland was covered with various types of Upper Jurassic carbonate deposits and siliciclastic rocks of the Lower Cretaceous [8,35,42]. The transition between the Albian and Jurassic carbonate sediments is erosional, and basal conglomerates can often be observed [35,89]. In some locations, the top of the Jurassic carbonates shows a distinct silicification and karst surfaces that point to the regional terrestrial character of the pre-Albian relief [89,90], which is supported by recognition of backshore settings during the Late Albian in the western part of the Miechów Segment [91]. Upper Jurassic dark flints found in the Albian sands in the Miechów segment additionally indicate erosion of the Jurassic carbonate sediments during the transgression [89]. During the Albian, in the area of the contemporary Miechów Segment in the western part of the study area, a large peninsula extending NW-SE was located, reaching its end near Radomsko and continuing south beyond the Carpathian thrusts [92,93]. This peninsula is devoid of Albian sediments and the Cretaceous sea transgression covered that area in the Cenomanian and/or Turonian. The Upper Jurassic limestone is covered in some places directly by Cenomanian calcareous sandstone (e.g., Zajęcza Góra near Skotniki) of the northeastern part of the Miechów Segment [94]. In the southern part of the Miechów Segment, e.g., in the Wielkanoc Quarry, the Turonian limestone directly overlies the biohermal Upper Jurassic limestone [42,95]. The area of the Sudetes was also not flooded by the sea in the Albian, but remained an elevated land area until the Cenomanian, when the transgression began to invade this area as well [94,96]. Further to the east of the present-day HCM, the Albian rocks are covered with carbonate sediments of the Upper Cretaceous [97]. The Albian deposits have been drilled in the western and northern parts of the Lublin region. Albian deposits are represented here by fine and medium-grained quartz sands and/or weakly lithified sandstone, changing up in the section into sands/sandstone with admixture of calcium carbonate and marls with numerous phosphate rocks [98]. The Albian deposits do not occur close to the eastern border of Poland and on the SW of Lublin towards Kraśnik [93,97]. Here, the Cenomanian or Turonian carbonate sediments of Upper Cretaceous directly overlie the older Pre-Cretaceous sediments [97]. The geological data mentioned above suggest the presence of a developed coastline with distinct sea bays and with the dynamic shifting the coastline during the transgression in the study area. The sea in Albian times encroached over an area covered by sedimentary rocks, mostly carbonate and to a lesser extent siliciclastic rocks. Part of the clastic material found in the Albian sediments could thus have come from the recycling of older sedimentary rocks, most likely Lower Cretaceous sediments. Those sedimentary rocks cannot have been the primary source of rutile. The sources of this mineral can be found mainly in metamorphic or igneous rocks. Land massifs of crystalline rocks did not occur in central and northern Poland in the early Cretaceous. The probable source areas of clastic material during the Albian are the closest lands of crystalline massifs such as the Bohemian Massif to the west/south-west, the Ukrainian Shield in the east, and the Baltic Shield to the north of the study area (Figure 1).
The latest geochemical studies on tourmaline and monazite from Albian sands of the Miechów Segment point to the Bohemian Massif as the most probable source area [25,99]. The Bohemian Massif comprises a large variety of igneous and metamorphic rocks [100,101]. Therefore, it is possible to indicate potential source rocks for detrital rutile crystallized under amphibolite–LT eclogite facies (e.g., mica schists, gneisses) conditions [100,102,103], as well as in high-grade granulite–HT eclogite facies rocks, namely granulites and gneisses [101,104,105]. During the Albian, the Bohemian Massif was neighboring to the western and central zones (Figure 2). Moreover, the study of heavy mineral provenance of Jurassic and Triassic sedimentary rocks in southern Poland also points to the Bohemian Massif as a main source of detrital material [106,107]. It is thus most certain that the detrital heavy minerals found in the western group and three samples from the central group (MO, GCH, and BOL) from the Miechów Segment have come from the Bohemian Massif.
The Bohemian Massif is the most probable source area for the western group of rutiles, but a more enigmatic transport direction of clastic material should not be disregarded. Southward from the study area, obscured by Neogene Carpathian thrusts, crystalline Silesian and Proto-Silesian Ridges were located. The ridges are composed mostly of granites, gneisses, schists, and quartzites [21,108]. The ridges are overlain by Carpathian thrusts, and thus information on their petrology and mineralogy comes from pebbles and exotics found in Carpathian sediments. Precise information on the P-T conditions of these rocks is not available; however, some data from garnets suggest high-grade metamorphic conditions, similar to those found in Moldanubicum and the western part of the Bohemian Massif [21,109].
As discussed earlier, the western and eastern groups had different sources of detrital rutile. The Bohemian Massif probably should not be considered as a primary and main source area for the eastern group. That group roughly corresponds to the Lublin area in eastern Poland (the eastern zone) and is situated approximately at the same distance between the Bohemian Massif and the Ukrainian Shield. The crystalline rocks in the Ukrainian Shield (which were most likely exposed during the Albian) consist mostly of Paleoproterozoic and Archean rocks such as granites, gneisses, TTG (Tonalite-Trondhjemite-Granodiorite), various mafic, and ultramafic rocks [102,110,111,112] that mostly underwent high-grade metamorphic conditions. Crystalline rocks found in the Podolia domain (southwestern part of Ukrainian Shield) are represented mostly by a high-grade granulite facies, granites, and gneisses [113]. High-grade metamorphic rocks (above 700 °C) are a highly unlikely source for the amphibolite–LT eclogite facies (550–700 °C) rutile occurring frequently in the eastern group in Albian sands. A wide range of various mafic and ultramafic rocks (such as pyroxenites, amphibolites, and anorthosites) in the Ukrainian Shield also could not have been the main source because of the scarcity (or absence) of rutile in their mineral assemblage [114]. The Neoproterozoic basalts and tuffs of the Volynian Flood Basalts province covering a vast area of eastern Poland, western Ukraine, southwestern Belarus, and northern Moldavia [115] are also an unlikely source of rutile. This is owing to a relative rarity and a small grain size (few micrometers, often less than 10 μm in diameter) of rutile found in effusive rocks [116]. The detrital rutile from the Albian sands in this work is much larger (20 µm to 250 µm, Figure 3). Thus, it is difficult to find the probable source area in an easterly direction (the Ukrainian Shield) for Albian rutile from the eastern group. It cannot be excluded that unknown source rocks have been completely eroded from the Ukrainian Shield.
The other possible source area for the detrital rutile of the eastern group may be the Baltic Shield located north of the study area. The Baltic Shield was located almost twice as far as the Ukrainian Shield and the Bohemian Massif during Albian times. The central and southern parts of the Baltic Shield are dominated by Palaeoproterozoic and Archean orogenic belts, while the Scandinavian Caledonides occur solely in the western part [110,117,118]. Calculated P-T paths for various rocks in the Scandinavian Caledonides show similar crystallization temperatures to the calculated rutile crystallization temperatures from the study area [119,120,121]. Analyses carried out on Albian detrital rutile from sandstone sediments of the Norwegian sea showed good convergence for the calculated crystallization temperatures (peaking at~550–600 °C) to our rutile from the eastern group, and in the proportion of metamafic to metapelitic rutile. This proportion in sandy sediments of the Albian MN3 sand types in the Norwegian sea is 60% to 40% [28], whereas in samples from eastern Poland studied here, it is c. fifty–fifty. It is possible that rutile has been derived from western Norway, from the Western Gneiss region and the Middle Allochton of the Caledonian Nappe Domain, where high-grade mafic gneisses, eclogites with pyroxenites, and peridotites are located [110,118,121,122,123,124] These regions sent material to the Norwegian Sea prior to the final opening of the northeast Atlantic [28,125]. It is also possible that this region, with its vast area of metamorphic rocks, was supplying detrital material to the epicontinental sea southward to the Mid-Polish Trough. The hypothetical longshore currents and grain shore drift distributed the clastic material (including rutile) from NW to SE.
Longshore currents can transport loose sediments along a coast parallel to the shoreline. The combination of longshore drift (beach drift) and longshore currents leads to longshore transport of detrital material [126]. It is possible that such transport took place along the NE shore of the elongated shallow Mid-Polish Trough. Despite quite long distances, about or greater than 1000 km, rutile is a very stable mineral in sedimentary environments and can be transported on long distances [27,127,128,129]. The transport of detrital material by longshore currents is common in recent seas where the combination of wind, wave action, morphology of the sea bottom, and sea-tidal action allows for the creation of such currents [130,131,132]. The Orange River carried diamonds from highlands around Kimberly, South Africa, westward to the beaches of the South Atlantic Ocean. As the Atlantic gradually opened, the river deposited much of its diamond-bearing sediment on the Namibian coast and longshore currents carried them northward along the 600 km coast along the Namibian shore, and that transport distance is unequivocally documented with the diamond placer deposits [133]. We have not found information in the literature as to how far single diamond grains were transported near the Namibian shore towards the north, but from the mouth of the Orange River, sand material was transported alongshore for >700 km [128]. The longshore current transported the sediment material in the Mediterranean Sea from the Nile Delta, Egypt, to Haifa, Israel, a distance of over 450 km [134]. In the Baltic sea, longshore currents are generated along the Polish sand shore [126] and can transport sandy material along the entire southern Baltic shore [135,136]. Therefore, material transport by longshore currents over a distance of 1000 km is possible and plausible.
The Nb/Cr ratios and temperatures of crystallization of rutile from the central group (samples MO, GCH, BO, and PO) show their similarity to the western group; thus, the Bohemian Massif seems to be the main source for both groups. This is confirmed by studies of tourmaline and monazite from the MO, GCH, and BO samples collected from the Miechów Synclinorium [25,99]. On the other hand, the increased amount of rutile with crystallization temperatures in the range of 500–600 °C documented in the central group (Figure 6) shows their similarity to the eastern group of rutile grains. Hence, this component documents the significant proportion of detrital material transported probably from the Baltic Shield as in the case of the eastern group. During the Albian, the central zone (see Figure 2) can be interpreted as a mixing zone to which detrital material containing rutile representing the western and eastern groups was delivered.
The absence of high-temperature rutile in the Lublin area (the eastern zone) shows that detrital material derived from the Bohemian Massif does not exceed the contemporary HCDML land area (Figure 1). The distance between the western and eastern zones is not large enough (approximately 250 km) to easily explain the lack of “Bohemian rutiles” in the eastern zone. As mentioned above, rutile can be transported over much longer distances [27,127,129]. It seems, therefore, that there must have been orographic or bathymetric barrier(s?) in the study area between the western and eastern zones; however, the distribution of a sandy Albian facies near the contemporary HCDML does not unequivocally confirm the existence of a land area there [6,9,12,41,92,93]. Thus, the large peninsula extending NW–SE in the middle part of the present-day Miechów Segment postulated by Hakenberg [35] could have played the role of such an orographic barrier controlling the transport of detrital material from the crystalline Bohemian Massif to the western and partly central zones of the study area (Figure 2). Longshore currents along the southern shore of the Albian epicontinental sea could also have played an important role in the distribution of detrital material including the heavy minerals. The detrital rutile grains were transported to the area referred to by us as the central zone from the Bohemian Massif (from the west) and possibly from the southern part of the Baltic Shield from the north. During the Albian, between the Lublin area and the Ukrainian Shield, a bathymetric barrier [137,138] could have existed; there was no possibility for any longshore action and eastward and/or westward transport of detrital material into the study area.

7. Conclusions

The amount of accessory heavy minerals is less than 1% in predominantly quartz sand samples of the Albian sediments from SE Poland. The chemically and physically resistant rutile reach up to 20% of the heavy mineral assemblage in the Albian quartz sands of southern extra-Carpathian Poland.
Rutile grains, selected for EPMA study, are represented solely by the rutile polymorph that allows the usage of the Zr-in-rutile (ZIR) method to determine the rutile crystallization temperatures. Three groups of samples with estimated crystallization temperatures were distinguished in the studied material: western, central, and eastern.
The western group, which includes outcrops situated in the southwestern part of the Miechów Segment (western zone), indicates rather variable sources of detrital material, but mainly derived from metapelitic rocks. The detrital rutile grains were mainly derived from granulite–HT eclogite facies rocks (above 700 °C) with much smaller amounts of rutile grains derived from amphibolite–LT eclogite facies rocks (550–700 °C). The most likely source area for that group of rutile seems to be the Bohemian Massif. The Bohemian Massif has a vast spectrum of metamorphic rocks with various grade of metamorphism, thus it is a good source for the diverse crystallization temperatures of the detrital rutile in the western group.
The eastern group includes sampled localities situated northeast from the Holy Cross Mountains in Lublin area (eastern zone). Detrital rutiles were mainly derived from amphibolite–LT eclogite facies of metapelitic and metamafic rocks in similar quantities. The detrital rutiles were derived from a little petrographically diversified source area. The most likely provenance for that group of rutile seems to be the southern part of the crystalline Baltic Shield, possibly from the Western Gneiss region and the Middle Allochton of the Caledonian Nappe Domain. The hypothetical longshore current was flowing in a NW to SE direction along the NE nearshore zone of the Mid-Polish Trough and transported detrital material, including rutile.
The central group includes sampled localities situated in the northern part of the Miechów Segment and one sampled place (Potok IG-1 borehole) situated northeast from the Holy Cross Mountains (central zone). Detrital rutiles from this group were mainly derived from granulite–HT eclogite facies rocks and amphibolite–LT eclogite facies rocks and chiefly from metapelitic rocks. The source of rutiles was diverse, as in the western zone. Thus, the most likely source area for that group of rutile seems also to be the Bohemian Massif and, probably, to a lesser extent, the Baltic Shield.

Supplementary Materials

The following are available online at https://www.mdpi.com/article/10.3390/min11060553/s1, Table S1: Chemical composition of rutile from the Albian sands in Southern Poland.

Author Contributions

Conceptualization, J.K.; methodology, J.K. and K.N.; software, J.K.; validation, J.K., K.N., and D.O.-N.; formal analysis, J.K. and D.O.-N.; investigation, J.K. and K.N.; resources, J.K.; data curation, J.K., K.N., and D.O.-N.; writing—original draft preparation, J.K.; writing—review and editing, J.K., D.O.-N., and K.N.; visualization, J.K. and D.O.-N.; supervision, J.K.; project administration, J.K.; funding acquisition, J.K. and D.O.-N. All authors have read and agreed to the published version of the manuscript.

Funding

This work was supported by University of Warsaw (BOB-661-300/17) and Faculty of Geology, University of Warsaw grants no: DSM 118210 and grant No. 501-D113-01-1130202).

Data Availability Statement

The data presented in this study are available in Supplementary Material Supplementary Table S1.

Acknowledgments

The authors are greatly indebted to Jan Nowak, owner of the quarry near the Chełmo Mount, for permission to conduct this scientific investigation. The warmest thanks are offered to Raymond Macdonald, for constructive remarks and linguistic correction, and to Petras Jokubauskas and Beata Marciniak-Maliszewska for help with EPMA investigations. This work was supported by University of Warsaw, Faculty of Geology (Cryo-SEM laboratory: National Multidisciplinary Laboratory of Functional Nanomaterials NanoFun project no. POIG.02.02.00-00-025/09.

Conflicts of Interest

The authors declare no conflict of interest.

References

  1. Maystrenko, Y.; Bayer, U.; Brink, H.-J.; Littke, R. The Central European Basin System—An Overview. In Dynamics of Complex Intracontinental Basins; Littke, R., Bayer, U., Gajewski, D., Nelskamp, S., Eds.; Springer: Berlin/Heidelberg, Germany, 2008; pp. 15–34. [Google Scholar]
  2. Mazur, S.; Scheck-Wenderoth, M. Constraints on the tectonic evolution of the Central European Basin System revealed by seismic reflection profiles from Northern Germany. Geol. en Mijnbouw/Netherlands J. Geosci. 2005, 84, 389–401. [Google Scholar] [CrossRef] [Green Version]
  3. Hansen, D.L.; Nielsen, S.B.; Lykke-Andersen, H. The post-Triassic evolution of the Sorgenfrei-Tornquist Zone—Results from thermo-mechanical modelling. Tectonophysics 2000, 328, 245–267. [Google Scholar] [CrossRef]
  4. Haq, B.U. Cretaceous eustasy revisited. Glob. Planet. Change 2014, 113, 44–58. [Google Scholar] [CrossRef]
  5. Ziegler, P. Geological Atlas of Western and Central Europe, 2nd ed.; Shell Internationale Petroleum Maatschappij, B.V.: Hague, The Netherlands, 1990. [Google Scholar]
  6. Jaskowiak-Schoeneichowa, M.; Krassowska, A. Paleomiąższości, litofacje i paleotektonika epikontynentalnej kredy górnej w Polsce. Geol. Q. 1988, 32, 177–198. [Google Scholar]
  7. Dadlez, R.; Marek, S. Development of the Permian and Mesozoic basins. Pract. Inst. Geol. 1997, 153, 403–409. [Google Scholar]
  8. Marek, S. Paleomiąższości, litofacje i paleotektonika epikontynentalenej kredy dolnej w Polsce. Geol. Q. 1988, 32, 157–176. [Google Scholar]
  9. Świdrowska, J.; Hakenberg, M.; Poluhtovič, B.; Seghedi, A.; Višnâkov, I. Evolution of the Mesozoic basins on the south western edge of the East European Craton (Poland, Ukraine, Moldova, Romania). Stud. Geol. Pol. 2008, 130, 3–130. [Google Scholar]
  10. Naidin, D.P.; Sasonova, I.G.; Pojarkova, Z.N.; Djalilov, M.R.; Papulov, G.N.; Senkovsky, Y.; Benjamovsky, V.N.; Kopaevich, L.F. Cretaceous transgressions and regressions on the Russian Platform, in Crimea and Central Asia. Cretac. Res. 1980, 1, 375–387. [Google Scholar] [CrossRef]
  11. Crittenden, S. The “Albian Transgression” in the Southern North Sea Basin. J. Pet. Geol. 1987, 10, 395–414. [Google Scholar] [CrossRef]
  12. Hakenberg, M.; Świdrowska, J. Cretaceous basin evolution in the Lublin area along the Teisseyre-Tornquist Zone (SE Poland). Ann. Soc. Geol. Pol. 2001, 71, 1–20. [Google Scholar]
  13. Samsonowicz, J. Szkic geologiczny okolic Rachowa nad Wisłą oraz transgresje albu i cenomanu w bróździe północno-europcjskiej. Spraw. Pol. Inst. Geol. 1925, 3, 45–118. [Google Scholar]
  14. Pasternak, S.I.; Gawrilishin, V.I.; Ginda, V.A.; Kotsyubinsky, S.P.; Senkovsky, Y. Stratigraphy and fauna of the Cretaceous deposits of the west of the Ukraine (without the Carpathians). Nauk. Dumka Kiev. 1968, 1–272. [Google Scholar]
  15. Henry, D.J.; Guidotti, C.V. Tourmaline as a petrogenetic indicator mineral - an example from the staurolite-grade metapelites of NW Maine. Am. Mineral. 1985, 70, 1–15. [Google Scholar]
  16. Fleming, E.J.; Flowerdew, M.J.; Smyth, H.R.; Scott, R.A.; Morton, A.C.; Omma, J.E.; Frei, D.; Whitehouse, M.J. Provenance of Triassic sandstones on the southwest Barents Shelf and the implication for sediment dispersal patterns in northwest Pangaea. Mar. Pet. Geol. 2016, 78, 516–535. [Google Scholar] [CrossRef]
  17. Dill, H.G.; Škoda, R. Provenance analysis of heavy minerals in beach sands (Falkland Islands/Islas Malvinas)—A view to mineral deposits and the geodynamics of the South Atlantic Ocean. J. S. Am. Earth Sci. 2017, 78, 17–37. [Google Scholar] [CrossRef]
  18. Garzanti, E.; Andò, S. Heavy minerals for junior woodchucks. Minerals 2019, 9, 148. [Google Scholar] [CrossRef] [Green Version]
  19. Mange, M.A.; Wright, D.T. Heavy Minerals in Use; Mange, M.A., Wright, D.T., Eds.; Elsevier B.V.: Amsterdam, The Netherlands, 2007; ISBN 9780444517531. [Google Scholar]
  20. Ziegler, P. Evolution of the Arctic-North Atlantic and the Western Tethys: A visual presentation of a series of Paleogeographic-Paleotectonic maps. AAPG Mem. 1988, 43, 164–196. [Google Scholar]
  21. Oszczypko, N.; Salata, D. Provenance analyses of the Late Cretaceous—Palaeocene deposits of the Magura Basin (Polish Western Carpathians)—evidence from a study of the heavy minerals. Acta Geol. Pol. 2005, 55, 237–267. [Google Scholar]
  22. van Hinsberg, V.J.; Henry, D.J.; Marschall, H.R. Tourmaline: An ideal indicator of its host environment. Can. Mineral. 2011, 49, 1–16. [Google Scholar] [CrossRef]
  23. Li, R.; Li, S.; Jin, F.; Wan, Y.; Zhang, S. Provenance of Carboniferous sedimentary rocks in the northern margin of Dabie Mountains, central China and the tectonic significance: Constraints from trace elements, mineral chemistry and SHRIMP dating of zircons. Sediment. Geol. 2004, 166, 245–264. [Google Scholar] [CrossRef]
  24. Morton, A.C.; Hallsworth, C.R. Stability of Detrital Heavy Minerals During Burial Diagenesis. In Heavy Minerals in Use, Developments in SedimentologyDevelopments in Sedimentology; Mange, M.A., Wright, D.T., Eds.; Elsevier B.V.: Amsterdam, The Netherlands, 2007; Volume 58, pp. 215–245. ISBN 9780444517531. [Google Scholar]
  25. Kotowski, J.; Nejbert, K.; Olszewska-Nejbert, D. Tourmalines as a tool in provenance studies of terrigenous material in Extra-Carpathian Albian (Uppermost Lower Cretaceous) sands of Miechów Synclinorium, Southern Poland. Minerals 2020, 10, 917. [Google Scholar] [CrossRef]
  26. Hubert, J.F. A Zircon-Tourmaline-Rutile Maturity Index and the Interdependence of the Composition of Heavy Mineral Assemblages with the Gross Composition and Texture of Sandstones. SEPM J. Sediment. Res. 1962, 32, 440–450. [Google Scholar] [CrossRef]
  27. Garzanti, E.; Vermeesch, P.; Vezzoli, G.; Andò, S.; Botti, E.; Limonta, M.; Dinis, P.A.; Hahn, A.; Baudet, D.; De Grave, J.; et al. Congo River sand and the equatorial quartz factory. Earth-Science Rev. 2019, 197, 102918. [Google Scholar] [CrossRef] [Green Version]
  28. Morton, A.C.; Chenery, S. Detrital Rutile Geochemistry and Thermometry as Guides to Provenance of Jurassic-Paleocene Sandstones of the Norwegian Sea. J. Sediment. Res. 2009, 79, 540–553. [Google Scholar] [CrossRef] [Green Version]
  29. Meinhold, G.; Anders, B.; Kostopoulos, D.; Reischmann, T. Rutile chemistry and thermometry as provenance indicator: An example from Chios Island, Greece. Sediment. Geol. 2008, 203, 98–111. [Google Scholar] [CrossRef]
  30. Zack, T.; von Eynatten, H.; Kronz, A. Rutile geochemistry and its potential use in quantitative provenance studies. Sediment. Geol. 2004, 171, 37–58. [Google Scholar] [CrossRef]
  31. Zack, T.; Moraes, R.; Kronz, A. Temperature dependence of Zr in rutile: Empirical calibration of a rutile thermometer. Contrib. to Mineral. Petrol. 2004, 148, 471–488. [Google Scholar] [CrossRef]
  32. Watson, E.B.; Wark, D.A.; Thomas, J.B. Crystallization thermometers for zircon and rutile. Contrib. Mineral. Petrol. 2006, 151, 413–433. [Google Scholar] [CrossRef]
  33. Triebold, S.; von Eynatten, H.; Luvizotto, G.L.; Zack, T. Deducing source rock lithology from detrital rutile geochemistry: An example from the Erzgebirge, Germany. Chem. Geol. 2007, 244, 421–436. [Google Scholar] [CrossRef]
  34. Liu, L.; Xiao, Y.; Wörner, G.; Kronz, A.; Simon, K.; Hou, Z. Detrital rutile geochemistry and thermometry from the Dabie orogen: Implications for source-sediment links in a UHPM terrane. J. Asian Earth Sci. 2014, 89, 123–140. [Google Scholar] [CrossRef]
  35. Hakenberg, M. Alb i cenoman w niecce miechowskiej. Stud. Geol. Pol. 1986, 86, 57–85. [Google Scholar]
  36. Niemczycka, T. Dokumentacja Wynikowa Otworu Strukturalno-Paramerytrycznego Potok-IG-1; (unpublished, PIG archive); 1973. [Google Scholar]
  37. Żelichowski, A.; Rek, E. Dokumentacja wynikowa otworu: Oporowego Tomaszów Lubelski IG-1; (unpublished, PIG archive); 1966. [Google Scholar]
  38. Gurba, L. Dokumentacja wynikowa otworu wiertniczego Piaski IG-2; (unpublished, PIG archive); 1984. [Google Scholar]
  39. Lendzion, K.; Wierzbowski, A. Dokumentacja wynikowa wiercenia Łuków IG-1; (unpublished, PIG archive); 1966. [Google Scholar]
  40. Dadlez, R.; Marek, S.; Pokorski, J. Geological Map of Poland without Cainozoic Deposits; Państwowy Instytut Geologiczny: Warszawa, Poland, 2000; ISBN 83-86986-45-x. [Google Scholar]
  41. Marcinowski, R.; Radwański, A. The Mid-Cretaceous transgression onto the Central Polish Uplands (marginal part of the Central European Basin). Zitteliana 1983, 10, 65–95. [Google Scholar]
  42. Marcinowski, R. The transgressive Cretaceous (Upper Albian through Turonian) deposits of the Polish Jura Chain. Acta Geol. Pol. 1974, 24, 117–220. [Google Scholar]
  43. Marcinowski, R.; Wiedmann, J. The Albian ammonites of Poland. Palaentologia Pol. 1990, 50, 1–94. [Google Scholar]
  44. Hakenberg, M. Alb i cenoman między Małogoszczem a Staniewicami w południowo-zachodnim obrzeżeniu Gór Świętokrzyskich. Stud. Geol. Pol. 1969, 26, 7–126. [Google Scholar]
  45. Rosenblum, S.; Brownfield, I.K. Magnetic Susceptibilities of Minerals; U.S. Department of the Interior, USGS: Reston, VA, USA, 2000. [Google Scholar]
  46. Von Eynatten, H.; Tolosana-Delgado, R.; Triebold, S.; Zack, T. Interactions between grain size and composition of sediments: Two examples. In Proceedings of the Proceed. 2nd CoDaWork, Gaborone, Botswana, 19–21 October 2005; Universitat de Girona. Departament d’Informàtica i Matemàtica Aplicada: Girona, Spain, 2005. [Google Scholar]
  47. Triebold, S.; von Eynatten, H.; Zack, T. A recipe for the use of rutile in sedimentary provenance analysis. Sediment. Geol. 2012, 282, 268–275. [Google Scholar] [CrossRef]
  48. Mange, M.A.; Maurer, H.F.W. Heavy Minerals in Colour, 1st ed.; Springer-Science+Business Media: London, UK, 1992; ISBN 9789401050197. [Google Scholar]
  49. Pouchou, L.L.; Pichoir, F. “PAP” (phi-rho-z) Procedure for Improved Quantitative Microanalysis. In Microbeam Analysis; Armstrong, J.T., Ed.; San Francisco Press: San Francisco, CA, USA, 1985; pp. 104–106. [Google Scholar]
  50. Schwartz, A.J.; Kumar, M.; Adams, B.L.; Field, D.P. Electron backscatter diffraction in materials science. Electron Backscatter Diffr. Mater. Sci. 2009, 1–403. [Google Scholar] [CrossRef]
  51. Plavsa, D.; Reddy, S.M.; Agangi, A.; Clark, C.; Kylander-Clark, A.R.C.; Tiddy, C.J. Microstructural, trace element and geochronological characterization of TiO2 polymorphs and implications for mineral exploration. Chem. Geol. 2018, 476, 130–149. [Google Scholar] [CrossRef]
  52. El Goresy, A.; Dubrovinsky, L.; Gillet, P.; Graup, G.; Chen, M. Akaogiite: An ultra-dense polymorph of TiO2 with the baddeleyite-type structure, in shocked garnet gneiss from the Ries Crater, Germany. Am. Mineral. 2010, 95, 892–895. [Google Scholar] [CrossRef]
  53. Tschauner, O.; Ma, C.; Lanzirotti, A.; Newville, M.G. Riesite, a new high pressure polymorph of TiO2 from the ries impact structure. Minerals 2020, 10, 78. [Google Scholar] [CrossRef] [Green Version]
  54. Meinhold, G. Rutile and its applications in earth sciences. Earth-Science Rev. 2010, 102, 1–28. [Google Scholar] [CrossRef]
  55. Zack, T.; Kooijman, E. Petrology and geochronology of rutile. Rev. Mineral. Geochem. 2017, 83, 443–467. [Google Scholar] [CrossRef]
  56. Angiboust, S.; Harlov, D. Ilmenite breakdown and rutile-titanite stability in metagranitoids: Natural observations and experimental results. Am. Mineral. 2017, 102, 1696–1708. [Google Scholar] [CrossRef]
  57. Luvizotto, G.L.; Zack, T.; Triebold, S.; Von Eynatten, H. Rutile occurrence and trace element behavior in medium-grade metasedimentary rocks: Example from the Erzgebirge, Germany. Mineral. Petrol. 2009, 97, 233–249. [Google Scholar] [CrossRef] [Green Version]
  58. Willner, A.P. Pressure-temperature evolution of a low-pressure amphibolite facies terrane in central Bushmanland (Namaqua Mobile Belt; South Africa). Commun. Geol. Surv. Namibia 1995, 10, 5–19. [Google Scholar]
  59. Ayers, J.C.; Watson, E.B. Rutile solubility and mobility in supercritical aqueous fluids. Contrib. Mineral. Petrol. 1993, 114, 321–330. [Google Scholar] [CrossRef]
  60. Shulaker, D.Z.; Schmitt, A.K.; Zack, T.; Bindeman, I. In-situ oxygen isotope and trace element geothermometry of rutilated quartz from Alpine fissures. Am. Mineral. 2015, 100, 915–925. [Google Scholar] [CrossRef]
  61. Zack, T.; Luvizottow, G.L. Application of rutile thermometry to eclogites. Mineral. Petrol. 2006, 88, 69–85. [Google Scholar] [CrossRef]
  62. Kooijman, E.; Smit, M.A.; Mezger, K.; Berndt, J. Trace element systematics in granulite facies rutile: Implications for Zr geothermometry and provenance studies. J. Metamorph. Geol. 2012, 30, 397–412. [Google Scholar] [CrossRef]
  63. Win, M.M.; Enami, M.; Kato, T.; Thu, Y.K. A mechanism for Nb incorporation in rutile and application of Zr-in-rutile thermometry: A case study from granulite facies paragneisses of the Mogok metamorphic belt, Myanmar. Mineral. Mag. 2017, 81, 1503–1521. [Google Scholar] [CrossRef]
  64. Graham, J.; Morris, R.C. Tungsten- and antimony-substituted rutile. Mineral. Mag. 1973, 39, 470–473. [Google Scholar] [CrossRef] [Green Version]
  65. Tomkins, H.S.; Powell, R.; Ellis, D.J. The pressure dependence of the zirconium-in-rutile thermometer. J. Metamorph. Geol. 2007, 25, 703–713. [Google Scholar] [CrossRef]
  66. Majzlan, J.; Bolanz, R.; Göttlicher, J.; Mikuš, T.; Milovská, S. Incorporation mechanism of tungsten in W-Fe-Cr-V-bearing rutile. Am. Mineral. 2021, 106, 609–619. [Google Scholar] [CrossRef]
  67. Usuki, T.; Iizuka, Y.; Hirajima, T.; Svojtka, M.; Lee, H.Y.; Jahn, B.M. Significance of Zr-in-Rutile thermometry for deducing the decompression P-T path of a garnet-clinopyroxene granulite in the moldanubian zone of the Bohemian Massif. J. Petrol. 2017, 58, 1173–1198. [Google Scholar] [CrossRef]
  68. Pape, J.; Mezger, K.; Robyr, M. A systematic evaluation of the Zr-in-rutile thermometer in ultra-high temperature (UHT) rocks. Contrib. to Mineral. Petrol. 2016, 171, 1–20. [Google Scholar] [CrossRef]
  69. Kohn, M.J. A refined zirconium-in-rutile thermometer. Am. Mineral. 2020, 105, 963–971. [Google Scholar] [CrossRef]
  70. Zack, T.; Kronz, A.; Foley, S.F.; Rivers, T. Trace element abundances in rutiles from eclogites and associated garnet mica schists. Chem. Geol. 2002, 184, 97–122. [Google Scholar] [CrossRef]
  71. Molina, J.F.; Poli, S. Carbonate stability and fluid composition in subducted oceanic crust: An experimental study on H2O-CO2-bearing basalts. Earth Planet. Sci. Lett. 2000, 176, 295–310. [Google Scholar] [CrossRef]
  72. Poli, S. The amphibolite-eclogite transformation; an experimental study on basalt. Am. J. Sci. 1993, 293, 1061–1107. [Google Scholar] [CrossRef]
  73. Molina, J.F.; Poli, S. Singular equilibria in paragonite blueschists, amphibolites and eclogites. J. Petrol. 1998, 39, 1325–1346. [Google Scholar] [CrossRef]
  74. Meyer, M.; John, T.; Brandt, S.; Klemd, R. Trace element composition of rutile and the application of Zr-in-rutile thermometry to UHT metamorphism (Epupa Complex, NW Namibia). Lithos 2011, 126, 388–401. [Google Scholar] [CrossRef]
  75. Triebold, S.; Luvizotto, G.L.; Tolosana-Delgado, R.; Zack, T.; von Eynatten, H. Discrimination of TiO2 polymorphs in sedimentary and metamorphic rocks. Contrib. to Mineral. Petrol. 2011, 161, 581–596. [Google Scholar] [CrossRef] [Green Version]
  76. Jackson, J.C.; Horton, J.W.; Chou, I.M.; Belkin, H.E. A shock-induced polymorph of anatase and rutile from the Chesapeake Bay impact structure, Virginia, U.S.A. Am. Mineral. 2006, 91, 604–608. [Google Scholar] [CrossRef]
  77. Tuschel, D. Raman Spectroscopy and Polymorphism. Spectroscopy 2019, 34, 10–21. [Google Scholar] [CrossRef]
  78. Liu, Y.C.; Deng, L.P.; Gu, X.F.; Groppo, C.; Rolfo, F. Application of Ti-in-zircon and Zr-in-rutile thermometers to constrain high-temperature metamorphism in eclogites from the Dabie orogen, central China. Gondwana Res. 2015, 27, 410–423. [Google Scholar] [CrossRef] [Green Version]
  79. Xiong, X.L.; Adam, J.; Green, T.H. Rutile stability and rutile/melt HFSE partitioning during partial melting of hydrous basalt: Implications for TTG genesis. Chem. Geol. 2005, 218, 339–359. [Google Scholar] [CrossRef]
  80. Tual, L.; Möller, C.; Whitehouse, M.J. Tracking the prograde P–T path of Precambrian eclogite using Ti-in-quartz and Zr-in-rutile geothermobarometry. Contrib. to Mineral. Petrol. 2018, 173, 1–15. [Google Scholar] [CrossRef] [Green Version]
  81. Rösel, D.; Zack, T.; Möller, A. Interpretation and significance of combined trace element and U–Pb isotopic data of detrital rutile: A case study from late Ordovician sedimentary rocks of Saxo-Thuringia, Germany. Int. J. Earth Sci. 2019, 108, 1–25. [Google Scholar] [CrossRef]
  82. Cox, T.F.; Cox, M.A.A. Multidimensional Scaling, 2nd ed.; Chapman and Hall/CRC: Boca Raton, FL, USA, 2000; ISBN 9781584880943. [Google Scholar]
  83. Hounslow, M.W.; Morton, A.C. Evaluation of sediment provenance using magnetic mineral inclusions in clastic silicates: Comparison with heavy mineral analysis. Sediment. Geol. 2004, 171, 13–36. [Google Scholar] [CrossRef]
  84. Vermeesch, P. Multi-sample comparison of detrital age distributions. Chem. Geol. 2013, 341, 140–146. [Google Scholar] [CrossRef]
  85. Vermeesch, P.; Resentini, A.; Garzanti, E. An R package for statistical provenance analysis. Sediment. Geol. 2016, 336, 14–25. [Google Scholar] [CrossRef]
  86. Lancaster, P.J.; Daly, J.S.; Storey, C.D.; Morton, A.C. Interrogating the provenance of large river systems: Multi-proxy in situ analyses in the Millstone Grit, Yorkshire. J. Geol. Soc. 2017, 174, 75–87. [Google Scholar] [CrossRef] [Green Version]
  87. Narkiewicz, M. Geologiczna historia Polski; Wydawnictwo Uniwersytetu Warszawskiego: Warszawa, Poland, 2020; ISBN 9788323542582. [Google Scholar]
  88. Hancock, J.M.; Kauffman, E.G. The great transgressions of the Late Cretaceous. J. Geol. Soc. London. 1979, 136, 175–186. [Google Scholar] [CrossRef]
  89. Hakenberg, M.; Jurkiewicz, H.; Woiński, J. Profile kredy środkowej w północnej części niecki miechowskiej. Geol. Q. 1973, 17, 763–786. [Google Scholar]
  90. Krassowska, A. Kreda między Zamościem, Tomaszowem Lubelskim a Kryłowem. Biul. Państwowego Inst. Geol. 1976, 291, 51–101. [Google Scholar]
  91. Olszewska-Nejbert, D.; Kotowski, J.; Nejbert, K. Psilonichnus upsilon Frey, Curran and Pemberton, 1984 burrows and their environmental significance in transgressive Albian (Lower Cretaceous) sands of Glanów-Stroniczki, Cracow Upland, southern Poland. Palaeogeogr. Palaeoclimatol. Palaeoecol. 2020, 538. [Google Scholar] [CrossRef]
  92. Hakenberg, M.; Świdrowska, J. Evolution of the Holy Cross Segment of the Mid-Polish Trough during the Cretaceous. Geol. Q. 1998, 42, 239–262. [Google Scholar]
  93. Jaskowiak-Schoeneichowa, M. Paläogeographie des Alb und Cenoman in Polen. In Aspekte der Kreide Europas; Wiedman, J., Ed.; E. Schweizerbart’sche Verlagsbuchhandlung: Stuttgart, Germany, 1979; pp. 463–471. [Google Scholar]
  94. Walaszczyk, I. Turonian through Santonian deposits of the Central Polish Uplands; their facies developement, inoceramid paleontology and stratigraphy. Acta Geol. Pol. 1992, 42, 1–122. [Google Scholar]
  95. Olszewska-Nejbert, D. Development of the Turonian Conulus Lagerstätte in the Wielkanoc quarry, Miechów Upland (South Poland). Ann. Soc. Geol. Pol. 2005, 75, 199–210. [Google Scholar]
  96. Biernacka, J.; Jozefiak, M.; Józefiak, M. The eastern Sudetic Island in the early-to-middle Turonian: Evidence from heavy minerals in the Jerzmanowice sandstones, SW Poland. Acta Geol. Pol. 2009, 59, 545–565. [Google Scholar]
  97. Krassowska, A. Charakterystyka osadów kredy na obszarze Lubelskiego Zagłębia Węglowego. Geol. Q. 1981, 25, 703–716. [Google Scholar]
  98. Świdrowska, J. Kreda w regionie lubelskim—Sedymentacja i jej tektoniczne uwarunkowania. Biul. Państwowego Inst. Geol. 2007, 422, 63–78. [Google Scholar]
  99. Kotowski, J.; Nejbert, K.; Olszewska-Nejbert, D. Monazite and tourmaline from the Albian (Lower Cretaceous) sands from the Miechów Synclinorium (southern Poland) as a Tool in Provenance Study. In Proceedings of the 9th European Conference on Mineralogy and Spectroscopy, Prague, Czech Republic, 11–13 September 2019. [Google Scholar]
  100. Mazur, S.; Aleksandrowski, P.; Kryza, R.; Oberc-Dziedzic, T. The Variscan Orogen in Poland. Geol. Q. 2006, 50, 89–118. [Google Scholar]
  101. Klomínský, J.; Jarchovský, T.; Rajpoot, G.S. Atlas of plutonic rocks and orthogneisses in the Bohemian Massif; Czech Geological Survey: Prague, Czech Republic, 2010; ISBN 9788070757512. [Google Scholar]
  102. Kryza, R.; Sveshnikov, K.I.; Charnley, N.; Montel, J.M. Monazite in precambrian granites of the Ukrainian Shield: Selected aspects of geochemistry and chemical age dating. Mineral. Soc. Pol. Spec. Pap. 2004, 24, 255–258. [Google Scholar]
  103. Čopjaková, R.; Buriánek, D.; Škoda, R.; Houzar, S. Tourmalinites in the metamorphic complex of the Svratka Unit (Bohemian Massif): A study of compositional growth of tourmaline and genetic relations. J. Geosci. 2009, 54, 221–243. [Google Scholar] [CrossRef] [Green Version]
  104. Buriánek, D.; Dolníček, Z.; Novák, M. Textural and compositional evidence for a polyphase saturation of tourmaline in granitic rocks from the Třebíč Pluton (Bohemian Massif). J. Geosci. 2016, 61, 309–334. [Google Scholar] [CrossRef]
  105. Jastrzębski, M.; Budzyń, B.; Stawikowski, W. Cambro-Ordovician vs Devono-Carboniferous geodynamic evolution of the Bohemian Massif: Evidence from P-T-t studies in the Orlica-Śnieżnik Dome, SW Poland. Geol. Mag. 2019, 156, 447–470. [Google Scholar] [CrossRef]
  106. Kowal-Linka, M.; Stawikowski, W. Garnet and tourmaline as provenance indicators of terrigenous material in epicontinental carbonates (Middle Triassic, S Poland). Sediment. Geol. 2013, 291, 27–47. [Google Scholar] [CrossRef]
  107. Salata, D. Heavy minerals as detritus provenance indicators for the Jurassic pre-Callovian palaeokarst infill from the Czatkowice Quarry (Kraków—Wieluń Upland, Poland). Geol. Q. 2013, 57, 537–550. [Google Scholar] [CrossRef]
  108. Nawrocki, J.; Poprawa, P. Development of Trans-European Suture Zone in Poland: From Ediacaran rifting to Early Palaeozoic accretion. Geol. Q. 2006, 50, 59–76. [Google Scholar]
  109. Otava, J.; Sulovský, P.; Krejčí, O. The results of study of the detrital garnets from the Cretaceous sediments of the Rača Unit of the Magura Group (Outher Carpathians). Geol. Výzkumy na Moravě a ve Slezsku 1998, 5, 29–31. [Google Scholar]
  110. Bogdanova, S.V.; Gorbatschev, R.; Garetsky, R.G. EUROPE|East European Craton. In Reference Module in Earth Systems and Environmental Sciences; Elsevier: Amsterdam, The Netherlands, 2016; pp. 1–18. ISBN 978-0-12-409548-9. [Google Scholar]
  111. Shumlyanskyy, L.; Ellam, R.M.; Mitrokhin, O. The origin of basic rocks of the Korosten AMCG complex, Ukrainian shield: Implication of Nd and Sr isotope data. Lithos 2006, 90, 214–222. [Google Scholar] [CrossRef]
  112. Savko, K.A.; Samsonov, A.V.; Larionov, A.N.; Korish, E.K.; Bazikov, N.S. An Archaean Tonalite–Trondhjemite–Granodiorite Association of the Kursk Block (Voronezh Massif): Composition, Age, and Correlation with the Ukrainian Shield. Dokl. Earth Sci. 2018, 478, 115–119. [Google Scholar] [CrossRef]
  113. Bibikova, E.V.; Claesson, S.; Fedotova, A.A.; Stepanyuk, L.M.; Shumlyansky, L.V.; Kirnozova, T.I.; Fugzan, M.M.; Il’insky, L.S. Isotope-geochronological (U-Th-Pb, Lu-Hf) study of the zircons from the archean magmatic and metasedimentary rocks of the Podolia domain, Ukrainian shield. Geochem. Int. 2013, 51, 87–108. [Google Scholar] [CrossRef]
  114. Force, E.R. The provenance of rutile. J. Sediment. Petrol. 1980, 50, 485–488. [Google Scholar]
  115. Białowolska, A.; Bakun-Czubarow, N.; Fedoryshyn, Y. Neoproterozoic flood basalts of the upper beds of the Volhynian Series (East European Craton). Geol. Q. 2002, 46, 37–57. [Google Scholar]
  116. Pinto, A.J.; Sanchez-Pastor, N.; Callegari, I.; Pracejus, B.; Scharf, A. Challenges to rutile-based geoscientific tools: Low-temperature polymorphic TiO2 transformations and corresponding reactive pathways. Sci. Rep. 2020, 10, 1–14. [Google Scholar] [CrossRef]
  117. Claesson, S.; Bogdanova, S.V.; Bibikova, E.V.; Gorbatschev, R. Isotopic evidence for Palaeoproterozoic accretion in the basement of the East European Craton. Tectonophysics 2001, 339, 1–18. [Google Scholar] [CrossRef]
  118. Corfu, F.; Andersen, T.B.; Gasser, D. The scandinavian caledonides: Main features, conceptual advances and critical questions. Geol. Soc. Spec. Publ. 2014, 390, 9–43. [Google Scholar] [CrossRef]
  119. Burton, K.W.; Boyle, A.P.; Kirk, W.L.; Mason, R. Pressure, temperature and structural evolution of the Sulitjelma fold-nappe, central Scandinavian Caledonides. Geol. Soc. Spec. Publ. 1989, 43, 391–411. [Google Scholar] [CrossRef]
  120. Fossen, H.; Dallmeyer, R.D. 40Ar/39Ar muscovite dates from the nappe region of southwestern Norway: Dating extensional deformation in the Scandinavian Caledonides. Tectonophysics 1998, 285, 119–133. [Google Scholar] [CrossRef]
  121. Engvik, A.K.; Grenne, T.; Lutro, O.J.; Meyer, G.B. Metamorphic constraints on the caledonian upper allochthon of Central Norway: The gula complex staurolite-garnet-kyanite mica schist. Geol. Soc. Spec. Publ. 2014, 390, 563–581. [Google Scholar] [CrossRef]
  122. Krogh, E.J. Compatible P-T conditions for eclogites and surrounding gneisses in the Kristiansund area, western Norway. Contrib. Mineral. Petrol. 1981, 75, 387–393. [Google Scholar] [CrossRef]
  123. Gee, D.G.; Sturt, B.A. The Caledonide Orogen: Scandinavia and Related Areas; Wiley: Hoboken, NJ, USA, 1985. [Google Scholar]
  124. Dobrzhinetskaya, L.F.; Eide, E.A.; Larsen, R.B.; Sturt, B.A.; Trønnes, R.G.; Smith, D.C.; Taylor, W.R.; Posukhova, T.V. Microdiamond in high-grade metamorphic rocks of the Western Gneiss region, Norway. Geology 1995, 23, 597–600. [Google Scholar] [CrossRef]
  125. Morton, A.C.; Whitham, A.G.; Fanning, C.M. Provenance of Late Cretaceous to Paleocene submarine fan sandstones in the Norwegian Sea: Integration of heavy mineral, mineral chemical and zircon age data. Sediment. Geol. 2005, 182, 3–28. [Google Scholar] [CrossRef]
  126. Rudowski, S. Mikroformy strefy brzegowej Bałtyku w Polsce. Acta Geol. Pol. 1962, 12, 541–579. [Google Scholar]
  127. Morton, A.C.; Hallsworth, C.R. Processes controlling the composition of heavy mineral assemblages in sandstones. Sediment. Geol. 1999, 124, 3–29. [Google Scholar] [CrossRef]
  128. Bluck, B.J.; Ward, J.D.; Cartwright, J.; Swart, R. The Orange River, southern Africa: An extreme example of a wave-dominated sediment dispersal system in the South Atlantic Ocean. J. Geol. Soc. 2007, 164, 341–351. [Google Scholar] [CrossRef] [Green Version]
  129. Garzanti, E.; Andò, S.; Vezzoli, G.; Lustrino, M.; Boni, M.; Vermeesch, P. Petrology of the Namib Sand Sea: Long-distance transport and compositional variability in the wind-displaced Orange Delta. Earth Sci. Rev. 2012, 112, 173–189. [Google Scholar] [CrossRef]
  130. Hori, K.; Saito, Y.; Zhao, Q.; Wang, P. Architecture and evolution of the tide-dominated Changjiang (Yangtze) River delta, China. Sediment. Geol. 2002, 146, 249–264. [Google Scholar] [CrossRef]
  131. van Rijn, L.C.; Walstra, D.-J.R.; van Ormondt, M. Unified View of Sediment Transport by Currents and Waves. IV: Application of Morphodynamic Model. J. Hydraul. Eng. 2007, 133, 776–793. [Google Scholar] [CrossRef]
  132. Bian, C.; Jiang, W.; Greatbatch, R.J. An exploratory model study of sediment transport sources and deposits in the Bohai Sea, Yellow Sea, and East China Sea. J. Geophys. Res. Ocean 2013, 118, 5908–5923. [Google Scholar] [CrossRef] [Green Version]
  133. Corbett, I.B. A review of diamondiferous marine deposits of western southern Africa. Africa Geosci. Rev. 1996, 3, 157–174. [Google Scholar]
  134. Rosen, S.D. Assessing Present and Future Mediterranean Sea Level Rise Impact on Israel’S Coast and Mitigation Ways Against Beach and Cliff Erosion. Coast. Eng. Proc. 2011, 1, 4. [Google Scholar] [CrossRef] [Green Version]
  135. Kuhrts, C.; Fennel, W.; Seifert, T. Model studies of transport of sedimentary material in the western Baltic. J. Mar. Syst. 2004, 52, 167–190. [Google Scholar] [CrossRef]
  136. Stella, M.; Ostrowski, R.; Szmytkiewicz, P.; Kapiński, J.; Marcinkowski, T. Driving forces of sandy sediment transport beyond the surf zone. Oceanologia 2019, 61, 50–59. [Google Scholar] [CrossRef]
  137. Vinogradov, A.P. Atlas of Lithological and Paleogeographic Maps of the Russian Platform and its Geosynclinal Framing. Part 2. Mesozoic and Cenozoic; Vinogradov, A.P., Ed.; Academy of Sciences of the Soviet Union: Moscow, Russia; Saint Petersburg, Russia, 1961. [Google Scholar]
  138. Baraboshkin, E.J.; Alekseev, A.S.; Kopaevich, L.F. Cretaceous palaeogeography of the North-Eastern Peri-Tethys. Palaeogeogr. Palaeoclimatol. Palaeoecol. 2003, 196, 177–208. [Google Scholar] [CrossRef]
Figure 1. Albian palaeogeography of epicontinental sea and adjacent western Tethys of Europe with simplified distribution of facies (modified from [5,20]); 1—land areas; 2—deltaic, coastal, and shallow marine clastic facies (sands and conglomerates, sands and shales); 3—shallow-marine facies (sands, marls, carbonate marls, marly carbonates, carbonates); 4—mainly shallow-carbonate marine facies (marly carbonates, carbonates, chalk, white chalk, carbonate shales); 5—active fold belts, high relief; 6—marine carbonates; 7—deeper marine clastics (sand and shales); 8—deeper marine carbonates (with sands and shales); 9—carbonates and sands; 10—deeper marine facies (sands and shales, shales); 11—deeper marine shale facies from a rift area; 12—area of the study; HCMDL—hypothetic Holy Cross Mountains—Dobruja Land; ?—no precise data for the southern edge of the HCMDL.
Minerals 11 00553 g001
Figure 2. Geological map of the south-eastern part of Poland. (a) Location of study area in Poland and Europe; (b) geological map after [40] with standard stratigraphic colours used: green—Cretaceous; blue—Jurassic; violet–pink—Triassic; other colours—pre-Mesozoic. Red dots indicate sample localities; the western zone: KRZ—Korzkiew, GLA—Glanów-Stroniczki, PRZ—Przychdy, LEL—Lelów; the central zone: MO—Mokrzesz, GCH—Chełmo Mount, BOL—Bolmin, PO—Potok IG-1; the eastern zone): TL—Tomaszów Lubeski IG-1, PK—Piaski IG-2, KOP—Kopiec, LK—Łuków IG-1. Yellow dotted line shows front of the Carpathian nappes. The division of the study area into individual zones was made on the basis of the results of rutile mineralogical studies, which allowed to distinguish three distinct groups (western, eastern, and central) of rutile grains crystallizing at different temperatures (more detailed description in the text).
Minerals 11 00553 g002
Figure 3. SEM images of detrital rutile grains showing different stages of abrasion and weathering. (a) Rutile crystals from Glanów-Stroniczki (GLA) with visible chemical weathering marks; (bd) grains from Bolmin (BOL) showing different stages of weathering from pristine crystals without traces of weathering (b); grain with fresh cracks without weathering (c); to highly altered crystal with visible etchings (d); (e,f) rutiles from borehole Łuków IG-1 (sample LK), needle-like rutile crystal (e) does not show any sign of alteration apart from physical weathering, (f) rutile is altered and rounded by weathering (chemical and physical); (g,h) altered and chemically weathered rutile from borehole Tomaszów Lubelski IG-1 (sample TL).
Minerals 11 00553 g003
Figure 4. Results of electron backscattered diffraction analysis (EBSD) study of selected rutile grains. (a,b) Experimental EBSD Kikuchi patterns of rutile grains GLA-23 (a) and GLA-24 (b); (c,d) simulated Kikuchi pattern of the same rutile grains GLA-23 (c) and GLA-24 (d); (e) BSE (backscattered electron) image of rutile grains GLA 23 (top) and GLA-24 (bottom); (f) FSE (forescattered secondary electron) image of rutile grains GLA-23 and GLA-24 superimposed on EBSD mapping: red—rutile, single blue pixels*—anatase, single green pixels*—brookite; (g) BSE image of six more rutile grains MO-9—MO-14, (h) FSE (forescattered secondary electron) image of rutile grains MO-9—MO-14 superimposed on EBSD mapping: red—rutile, single blue pixels*—anatase, single green pixels*—brookite; *—single pixels of apparent anatase and brookite phase are most likely just a misidentification of the Bruker esprit software, Bruker Nano GmbH, Berlin, Germany used in EBSD study.
Minerals 11 00553 g004
Figure 5. Histograms of rutile crystallization temperatures for all samples in the three groups: western (a), central (b), and eastern (c). Details of sample abbreviation and localization in Table 1. Temperatures were calculated using the [32] formula. Blue colour—metapelitic rutile; orange colour—metamafic rutile.
Minerals 11 00553 g005
Figure 6. Summary histograms of rutile crystallization temperatures for the western (a), central (b), and eastern (c) groups with an indication of metamorphic facies. Temperatures were calculated using the Watson et al. [32] geothermometer.
Minerals 11 00553 g006
Figure 7. Cr-Nb plots showing contrasting rutile provenance and pie charts of relative abundance of metamafic and metapelitic rutiles in the distinguished western (a), central (b), and eastern (c) groups. Discrimination of metamafic and metapelitic rutile is based on [47]. Details of sample abbreviations and localization are provided in Table 1.
Minerals 11 00553 g007
Figure 8. Pie chart of relative abundances of rutiles from different metamorphic facies in the western, central, and eastern groups.
Minerals 11 00553 g008
Figure 9. Nonmetric multidimensional scaling (MDS) maps of (a) calculated crystallization temperature of detrital rutile grains using the Watson et al. formula [32] detailed explanation in the text; (b) Nb (ppm) concentrations in rutile.
Minerals 11 00553 g009
Table 1. GPS coordinates of the examined localities.
SampleType of Locality LocalityLatitudeLongitude
KRZoutcropwestern zone/groupKorzkiew50°09′42.5″ N19°52′46.7″ E
GLAoutcropGlanów-Stroniczki50°18′59.9″ N19°47′32.7″ E
PRZoutcropPrzychody50°30′22.0″ N19°43′42.6″ E
LELoutcropLelów50°41′48.4″ N19°36′18.9″ E
MOoutcropcentral zone/groupMokrzesz50°48′09.5″ N19°23′34.4″ E
GCHoutcropChełmo Mount51°03′27.2″ N19°44′38.3″ E
BOLoutcropBolmin50°48′36.5″ N20°20′37.1″ E
POboreholePotok IG-150°45′43.17″ N22°19′13.17″ E
KOPoutcropeastern zone/groupKopiec (Annopol)50°54′27.0″ N21°50′28.1″ E
TLboreholeTomaszów Lubelski IG-150°24′59.98″ N23°34′38.64″ E
PKboreholePiaski IG-251°09′25.35″ N22°55′03.64″ E
LKboreholeŁuków IG-151°56′32.99″ N22°34′33.79″ E
Table 2. Compilation of the existing Zr-in-rutile (ZIR) geothermometers calibrated by various authors. The gas constant is R = 8.3145 J × mol−1 × K−1.
No.FormulaeError of Temperature Estimation in [°C]References for the Calibration
1 T [ ° C ] = 127.8 × ln ( Zr [ ppm ] ) 10 ±50 °C[31]
2 T [ ° C ] = 4470 7.36 log 10 ( Zr [ ppm ] ) 273 ±20 °C[32]
3 T [ ° C ] = 83.9 + 0.41 ×   P [ k b a r ] 0.1428 R × ln ( Zr [ ppm ] ) 273 ±30 °C[65] *
4 T [ ° C ] = 71360 + 0.378 ×   P [ b a r ] 0.13 × Zr [ ppm ] 130.66 R × ln ( Zr [ ppm ] ) 273.1 ±15 °C[69] *
5 T [ ° C ] = 85.7 + 0.473 ×   P [ k b a r ] 0.1453 R × ln ( Zr [ ppm ] ) 273 ±30 °C[65] *
6 T [ ° C ] = 88.1 + 0.206 ×   P [ k b a r ] 0.1412 R × ln ( Zr [ ppm ] ) 273 ±30 °C[65] *
7 T [ ° C ] = 73910 + 0.247 ×   P [ b a r ] 0.13 × Zr [ ppm ] 129.65 R × ln ( Zr [ ppm ] ) 273.15 ±15 °C[69] *
Note that the pressure units used in Formulas (4) and (7) are expressed in bars, while in Formulas (3), (5), and (6), they are in kilobars. *—equations for different quartz stability field.
Table 3. Mineral chemistry of representative rutile from the Albian deposits of the SE Poland.
SampleGLAGLAKRZPRZPRZLELLELMOMOPO
No.4421944220102/168/152/14420334/172/177/144223
CommentWGWGWGWGWGWGWGCGCGCG
in wt.%
Ti59.0059.2259.5358.4959.0559.3559.5958.7758.7159.10
Σtrace.elements1.091.170.952.071.260.400.350.781.041.04
O39.8740.0740.1239.9940.0239.8039.9439.6039.6639.88
Total99.96100.45100.61100.54100.3299.5699.8899.1499.41100.02
in ppm
Nb215813033146161030170809146012603710
Sib.d.l.32b.d.l.b.d.l.010035130120130
Zr46602508432388015040269202039102040
Al000000000320
V3104556668813,33010,640132062025203240170
Cr876161892413305108026910101540130
Mnb.d.l.b.d.l.b.d.l.0b.d.l.b.d.l.00b.d.l.40
Fe15162843495501280232015066503303860
Source lithology *PPPPMMPPPP
Temperature [°C] **938856673912589503634829913831
SampleBOLBOLGCHTLTLPKPKLKLKKOP
No.50/149/169/142/144227442054420961/148/144211
CommentCGCGCGEGEGEGEGEGEGEG
in wt.%
Ti59.1059.6559.4259.6159.0760.1059.3359.4359.3059.33
Σtrace.elements1.060.780.540.390.350.250.610.560.641.16
O39.8840.1139.8839.9939.5840.2539.8939.9139.8740.01
Total100.03100.5499.8399.9898.99100.5999.8299.9099.82100.50
in ppm
Nb496715661356505276186958202219661380
Si31b.d.l.62b.d.l.b.d.l.b.d.l.b.d.l.49b.d.l.50
Zr124178619614457821604580
Al00000000060
V35738201503432422173190280
Cr682b.d.l.20893564091032642582404410
Mn034b.d.l.00b.d.l.b.d.l.037b.d.l.
Fe442856323736821237611231551283519579360
Source lithology *PPPMMMMPPP
Temperature [°C] **576602529558586525548594510546
WG—western group rutile, CG—central group rutile, EG—eastern group rutile; * the source lithology was calculated using the equation proposed by [47]; ** crystallization temperatures were calculated after [32]; P—metapelite, M—metamafite; b.d.l.—concentration below detection limit.
Publisher’s Note: MDPI stays neutral with regard to jurisdictional claims in published maps and institutional affiliations.

