Article

Termination of Organic-Rich Accumulation of the Oceanic Anoxic Event 2 in the Deep-Water Carpathian Basins Based on Carbon Stable Isotope Data

1
Department of General Geology and Geotourism, Faculty of Geology, Geophysics and Environmental Protection, AGH University of Science and Technology, Mickiewicza 30, 30-059 Kraków, Poland
2
Department of Geology, Faculty of Exact and Natural Sciences, Pedagogical University of Krakow, Podchorążych 2, 30-084 Kraków, Poland
*
Author to whom correspondence should be addressed.
Minerals 2021, 11(4), 420; https://doi.org/10.3390/min11040420
Submission received: 2 April 2021 / Revised: 9 April 2021 / Accepted: 13 April 2021 / Published: 15 April 2021
(This article belongs to the Special Issue Geology, Palaeontology, Palaeogeography of the Western Tethys Realm)

Abstract

:
Organic-rich black shales intercalated with green radiolarian shales and bentonites, 2.2 m thick, represent an equivalent of the Bonarelli Level in the Outer Carpathian deep-water succession. Carbon stable isotope data from four sections in the Outer Carpathians show that termination of organic-rich accumulation, related to the oceanic anoxic event 2 (OAE2), occurred at the same time in this part of the Western Tethys. The excellent marker of this event is a first horizon of Fe–Mn layer (nodules), a few centimeters thick, directly covering the youngest black shale layer of the Bonarelli-equivalent Level, which is regarded as the regional chronohorizon. The youngest succession of the organic-rich shales, ca. 30 cm thick, corresponds to the latest Cenomanian interval of δ13Corg values displaying a negative trend, which represents a terminal part within the OAE2 carbon isotope excursion. A deep negative shift which ends this falling trend, close to the Cenomanian–Turonian boundary in δ13C curves from many sections around the world, is not visible in the Outer Carpathian successions. The reason for this was the long period of stratigraphic condensation, which is reflected in the ferromanganese sediments of this area.

Graphical Abstract

1. Introduction

In deep-sea sediments of the Western Tethys, thick black shale intervals of the oceanic anoxic event (OAE) 2, like Bonarelli Level in the Umbria–Marche Basin [1] or Thomel Level in Vocontian Basin [2] and its equivalent (Bonarelli-equivalent Level) in the Carpathian basins [3] are characterized by repeated occurrences of organic-rich and biogenic silica-rich shales. In the Outer Carpathians, the fine laminae in black organic-rich shale horizons containing bacteria-like remnants [4] and undigested pellets [5] indicate a lack of bottom-dwelling organisms [6], suggesting that the seafloor was covered by O2-deficient water. In turn, grey to green radiolarian-rich shales [7,8] including impoverished trace fossil assemblages represent dysoxic intervals.
The onset and termination of black shale accumulation during the Cenomanian–Turonian boundary interval (CTBI) was different in marine settings due to various environmental causes and various geodynamic evolution of particular regions (e.g., compare Tarfaya coastal basin vs. Western Interior Seaway [9,10]). It seems that the time interval for such accumulation in the Western Tethys was similar, however, the stratigraphic correlation of this phenomenon is not unequivocal and easy, especially for deep environments below CCD, due to lack of calcareous microfossils. An example of such environment were marginal basins in the Carpathian domain, where the CTBI record containing the Bonarelli-equivalent Level was studied in detail based on deep-water agglutinated foraminifers (DWAF), radiolarians [11], and using chemical indices (summary in [3,12,13]).
In this study, we interpret the termination of the organic-rich sedimentation of the CTBI in the Outer Carpathian basins (Figure 1) and correlate this with the data reported from other deep marine realms. This age is here constrained using published and new organic carbon stable isotope data [14,15,16,17], correlated by the radiolarian record [18]. Most previous stratigraphic studies in the Outer Carpathian area, partly related to the CTBI, have been based on the DWAF assemblages (e.g., [19,20,21,22] and radiolarians [7,8,23,24], suggesting a Turonian age for the base of red and green shales, the earliest oxidized sediments, which cover the black claystones and mudstones of the Bonarelli-equivalent Level.

2. Palaeoceanographic Setting

During Cretaceous–Paleogene times, the Outer Carpathian Basin consisted of several longitudinal troughs, the Silesian, Skole–Tarcău, and Magura basins, located close to the northern passive margin of the Western Tethys [25]. From the Berriasian through the Eocene, the floor of these basins was below the CCD (e.g., [26,27,28]). Turbidite sedimentation was dominant during the Early Cretaceous, with moderate accumulation rate, not exceeding 6 cm/ka [29]. Terrigenous and biogenic material supplied to the basin floor came from both the peri-Tethyan shelves and intrabasinal ridges (e.g., [30,31,32]). In the Late Cenomanian, the number and thickness of turbidites significantly decreased, and organic-rich sedimentation began to prevail, related to the OAE2 [33].
Their accumulation rate was low, 3.5–5.5 mm/ka [3]. Accumulation of oxidized (red) non-calcareous hemipelagic clays began after the termination of the OAE2 throughout the entire Carpathian Basin. Its duration varied in particular basins, depending on the influx of terrigenous turbidites (summary in [34]).

3. Anoxic and Oxic Strata in the Outer Carpathians Around the OAE2

In the Outer Carpathians, the Upper Cenomanian is represented by a dozen or so metre-thick successions of carbonate and siliciclastic turbidites with intercalations of non-calcareous green and black radiolarian shales ([33]; Barnasiówka Radiolarian Shale Formation; Figure 2). There is a gradual transition (ca. 1.0 m thick interval) from this facies to hemipelagic, non-calcareous, organic-rich sediments, whose organic matter is mainly marine in origin. This latter facies, named the Bonarelli-equivalent Level (up to 2.2 m thick; [14,15,16,17]; Figure 3) consists of argillaceous, radiolarian-rich, black shales with intercalations of green shales and bentonites in the lower part [35], and strongly siliceous parallel-laminated black claystones and mudstones alternating with green siliceous shales at the top. The total organic carbon content attains a maximum of 8% in the black shales of this succession, with mean values from 3.4% to 5.5% for individual sections [3].
In all studied sections, a few-centimeters-thick ferromanganese layer with macronodules (laid down as a Ca-rhodochrosite layer; [14,15,16,17,40]) is present at the top of the organic-rich facies, followed by oxidized sediments (Figure 3). Its origin was interpreted as recurring precipitation/redissolution of Fe-Mn oxide-hydroxides under repeated oxic/anoxic conditions (for details see [3,14]). The layer marks the onset of oxygenation of bottom water in the northern part of the Western Tethys. This Fe–Mn layer is followed by a succession (up to 1 m thick) of red and green, non-calcareous, strongly siliceous mudstones, and another Fe–Mn horizon, directly underlain by a thin layer of black shale, enriched in marine organic matter (Figure 3). The origin of the second Fe–Mn layer is the same as the initial layer discussed above [14,15,16,17]. In turn, the siliceous variegated mudstones occurring between these Fe–Mn horizons (cf. geochemical redox indices in [15,16,17]) contain DWAFs at the base, showing a return to oxic conditions at the basin floor. Higher up, green and red shales (Figure 3) are intercalated with thin-bedded silty and sandy siliciclastic (partly bioclastic) turbidites (e.g., [41]). Locally, there occur thin black-shale layers containing organic matter of mixed origin (marine and terrestrial [3]).
Among microfossils, numerous radiolarian, diatoms, and rare DWAF assemblages occur throughout the CTBI. The DWAFs disappear within the upper part of the organic-rich facies, and they are extremely rare in the lower part of the oxidized sediments [14,15,16]. Planktonic foraminifers, mainly non-keeled forms, observed in thin sections of the rocks, occur only as redeposited specimens within the turbidite layers. Radiolarians occur in discrete layers within the whole CTBI [18]. Both radiolarians and diatoms have been deposited in faecal pellets, as observed in thin sections of rocks.

4. Material and Methods

Organic carbon isotope data come from analyses of black shales of the CTBI. They were sampled in four sections (Figure 3) which represent sediments of three nappes of the Outer Carpathians in its Polish part. These sediments were accumulated in two basins (the Silesian and Skole basins) and an internal ridge (the Subsilesian ridge). The results of the δ13Corg analyses coming from the Trzemeśnia section (Silesian Nappe), Spława section (the Skole Nappe), and partly from the Barnasiówka section (Silesian Nappe) were published previously [16,17]. The new δ13Corg data (Supplementary Material, Table S1) concern the Zasań section [14] and partly the Barnasiówka section. The new field studies at Barnsasiówka and Zasań sections allowed us to find a continuous and probably complete succession of the OAE2 organic-rich sediments at these localities that was poorly exposed earlier.
The stable isotope analyses of organic carbon were performed with an elemental analyzer (Carlo-Erba1110) connected online to ThermoFinnigan Delta Plus mass spectrometer at the Stable Isotope Laboratory of the Institute of Geological Sciences, Erlangen-Nürnberg University (Germany). The results are expressed as permil values vs. V-PDB standard reference. Accuracy and reproducibility of the analyses were checked by replicate analyses of international standards (USGS 24 and USGS 40). Reproducibility was better than ± 0.11‰ (1σ). Further details of the analytical methods used are described in other publication by Bąk K. [15].
For chemostratigraphic correlation of the studied organic-rich sediments, we used selected marker points on the δ 13Corg curve (points from “A” to “E”). Their significance in correlation with reference sections from other CTB marine environments was explained in the chapter “Discussion”.

5. Results

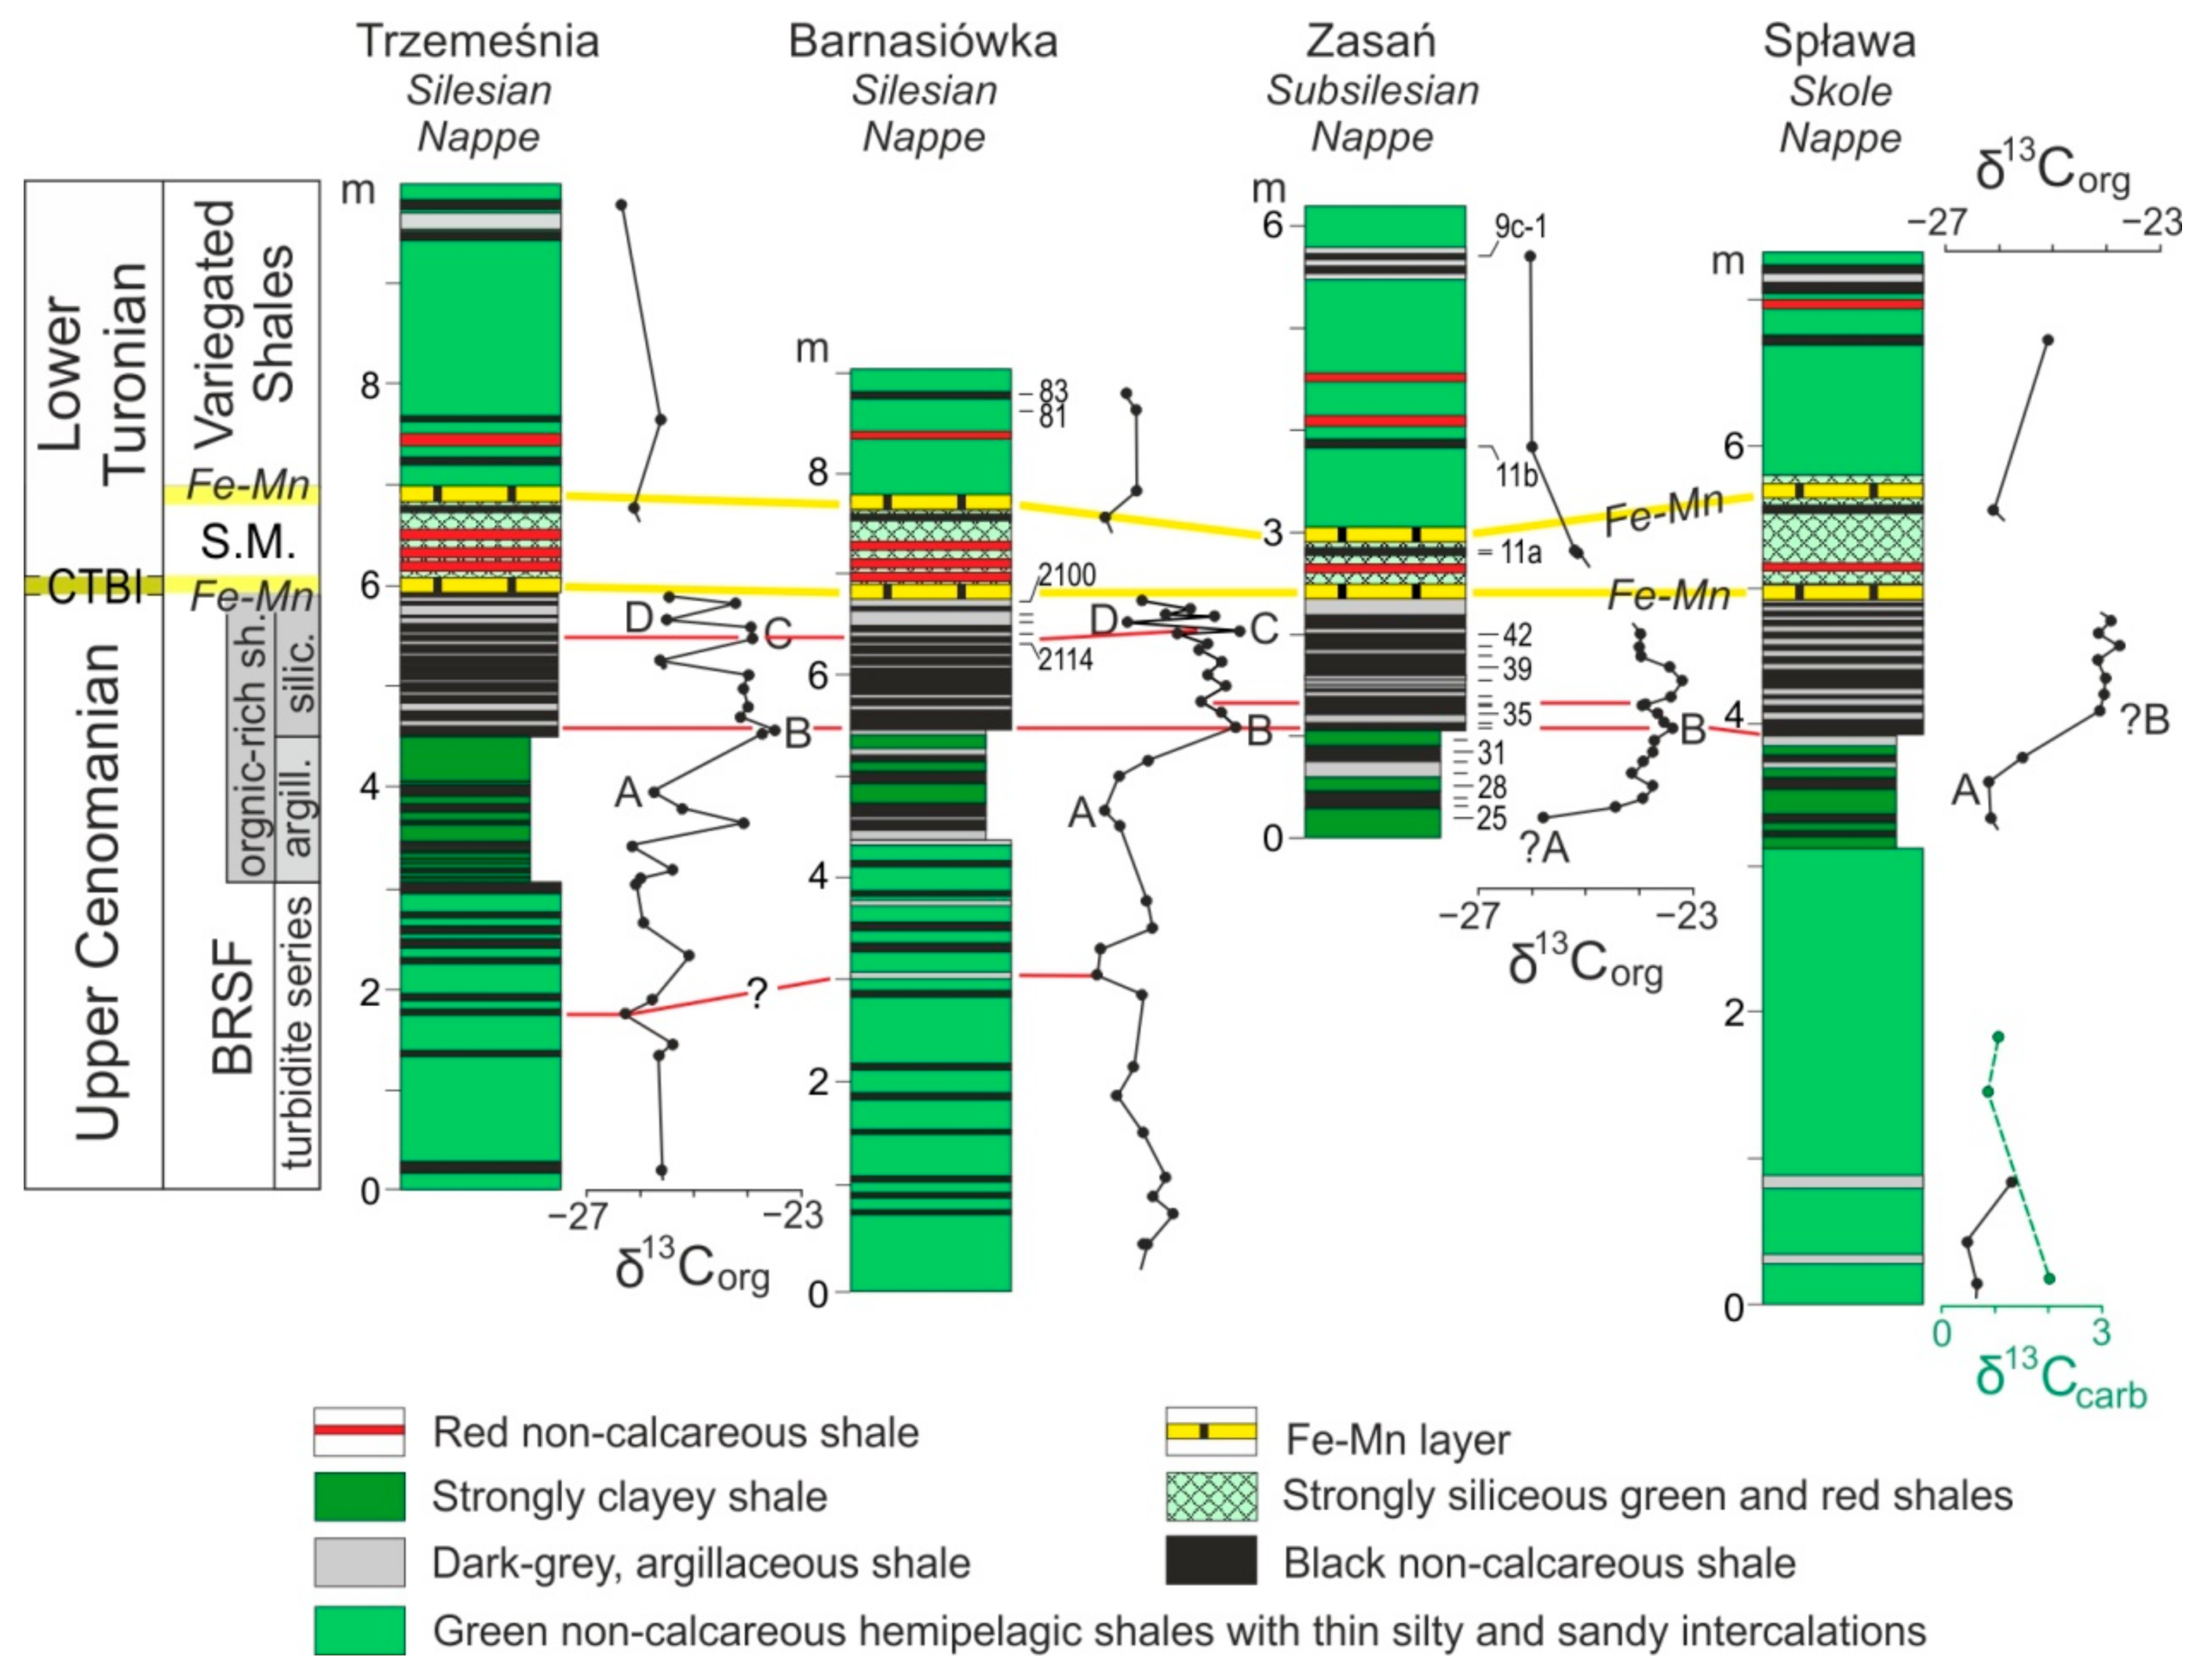
5.1. δ13C Organic Carbon Curve at Zasań Section, Subsilesian Nappe

The Cenomanian–Turonian boundary interval (CTBI), as defined by the pronounced positive carbon isotope excursion, is present in a 2.0 m thick succession of finely laminated black shales with intercalations of dark-grey shales. The δ13Corg values rise rapidly from −25.7‰ (point “A”; Figure 3) to −23.8‰ at the base of the organic-rich facies, then decrease by about 0.4‰ and rise again to −23.4‰, reaching the first maximum at the base of the siliceous part of the organic-rich facies (point “B”: Figure 3). The δ13Corg values remain high in the upper part of the section, varying from −24.0 to −23.2‰. The topmost part of the organic-rich facies are in tectonic contact with the overlying sediments in this section, hence, the subsequent interpretation of the data is not unequivocal. Nevertheless, the next organic-rich layer, ca. 0.5 m above the top of the first Fe–Mn layer, displays a low δ13Corg value (−25.2‰), corresponding to recovery interval, which continues within the overlying Variegates Shales, with values assigned to −26.0‰.

5.2. δ13C Organic Carbon Curve at Trzemeśnia and Barnasiówka Sections, Silesian Nappe

In the Late Cenomanian turbidite succession, δ13Corg values of samples are generally low, fluctuating between −26.3‰ and −24.4‰. A negative shift, ca. 1.5 m below the top of this succession (red line on Figure 3) may provide a marker point for both curves. The onset of the positive excursion related to the OAE2 lies within the argillaceous part of the organic-rich facies (point “A”; Figure 3); δ13Corg values increase rapidly by about 2–2.4‰ within a 50-centimeter-thick interval, reaching a maximum at the first black shale layer of the siliceous part of this facies (point “B”; Figure 3).
Afterwards, they decrease slightly but remain generally above −24.2‰ for the next 30 cm. The remaining part of the siliceous organic-rich facies (ca. 60 cm thick) displays differences in amplitude of fluctuating values in both sections (much higher in the Trzemeśnia section but the pattern of fluctuations is the same), with a characteristic maximum (point “C”; Figure 3), ca. 30 cm below the top of Bonarelli-equivalent Level. The next marker point is point “D” (Figure 3) representing a deep negative shift within the positive excursion, which precedes a section of the curve with the falling trend of the δ13Corg values.
The transition to the recovery interval with low δ13Corg values is not visible in both sections due to the presence of the Fe–Mn layer creating the base of oxidized sediments (ca. 1 m thick) higher in the sections. The organic-rich shale layer underlying the second Fe–Mn layer displays a low δ13Corg value (−25.9‰ and −25.7‰) in both sections, representing a recovery interval. The low δ13Corg values also characterize the remaining part of the Variegates Shales (Figure 3).

5.3. δ13C Organic Carbon Curve at Spława Section, Skole Nappe

The δ13Corg curve from the Spława section (Skole Nappe) was presented in detail by Bąk K. [16]. This curve records a positive excursion within the siliceous part of the organic-rich facies (Figure 3). However, the chemostratigraphic marker points are difficult to identify because of the low-resolution data set, excluding the base of the OAE2 excursion (point “A”; Figure 3).

6. Discussion

The chemostratigraphic correlation of organic-rich sediments representing the Bonarelli-equivalent Level is here based on selected marker points which are well-recognizable in reference sections of various marine environments. We distinguished here point “A” in the δ13Corg curve that marks a base of the OAE2 with the lowest value from which the values rise sharply to the first maximum (point “B”). This increase between the two index points reaches 2–6‰ in various marine sections around the world and depends on primary environmental factors, but also on the degree of weathering of organic matter (cf. strata of drill site in the Tarfaya Basin [42] and exposed sediments in quarry from the Bohemian Cretaceous Basin [43]). Our next marker point, ”C”, corresponds to the δ13Corg maximum on the curve near the end of the positive OAE2 excursion, followed by a marked negative shift (point "D") and a final sharp rise of δ13Corg values. In the reference section from the southern peri-Tethyan shelf (Bahlul [44]) point “B” was discriminated as point “I” (Figure 4; see also figure 11 in [44]) and correlated with the Pueblo section, a Global Stratotype Section and Point (GSSP) for the base of the Turonian Stage. In turn, our point “C” corresponds to the point “III” from the Bahlul section (Figure 4; see also figure 11 in [44]). Both marker points are also characteristic of other OAE2 sections, e.g., from the Umbria–Marche Platform [45], Vocontian Basin [46], European epicontinental sea (e.g., [47]), Demerara Rise in the Central Atlantic [48], continental margin of the South West Atlantic [49] and Western Interior Basin (e.g., [50,51]). The last marker point used in our correlation (point “E”) is important for determining the termination of black shale accumulation in relation to the C–T boundary. This point coincides with a deep negative shift in δ13Corg values occurring after the last peak of the OAE2 excursion. Its stratigraphic position was defined as very close to the first occurrence of the ammonite Watinoceras devonense and calcareous nannoplankton Quadrum gartneri, recognized in many sections where accumulation of CTBI sediments occurred above CCD (e.g., [45,51,52,53,54,55]).

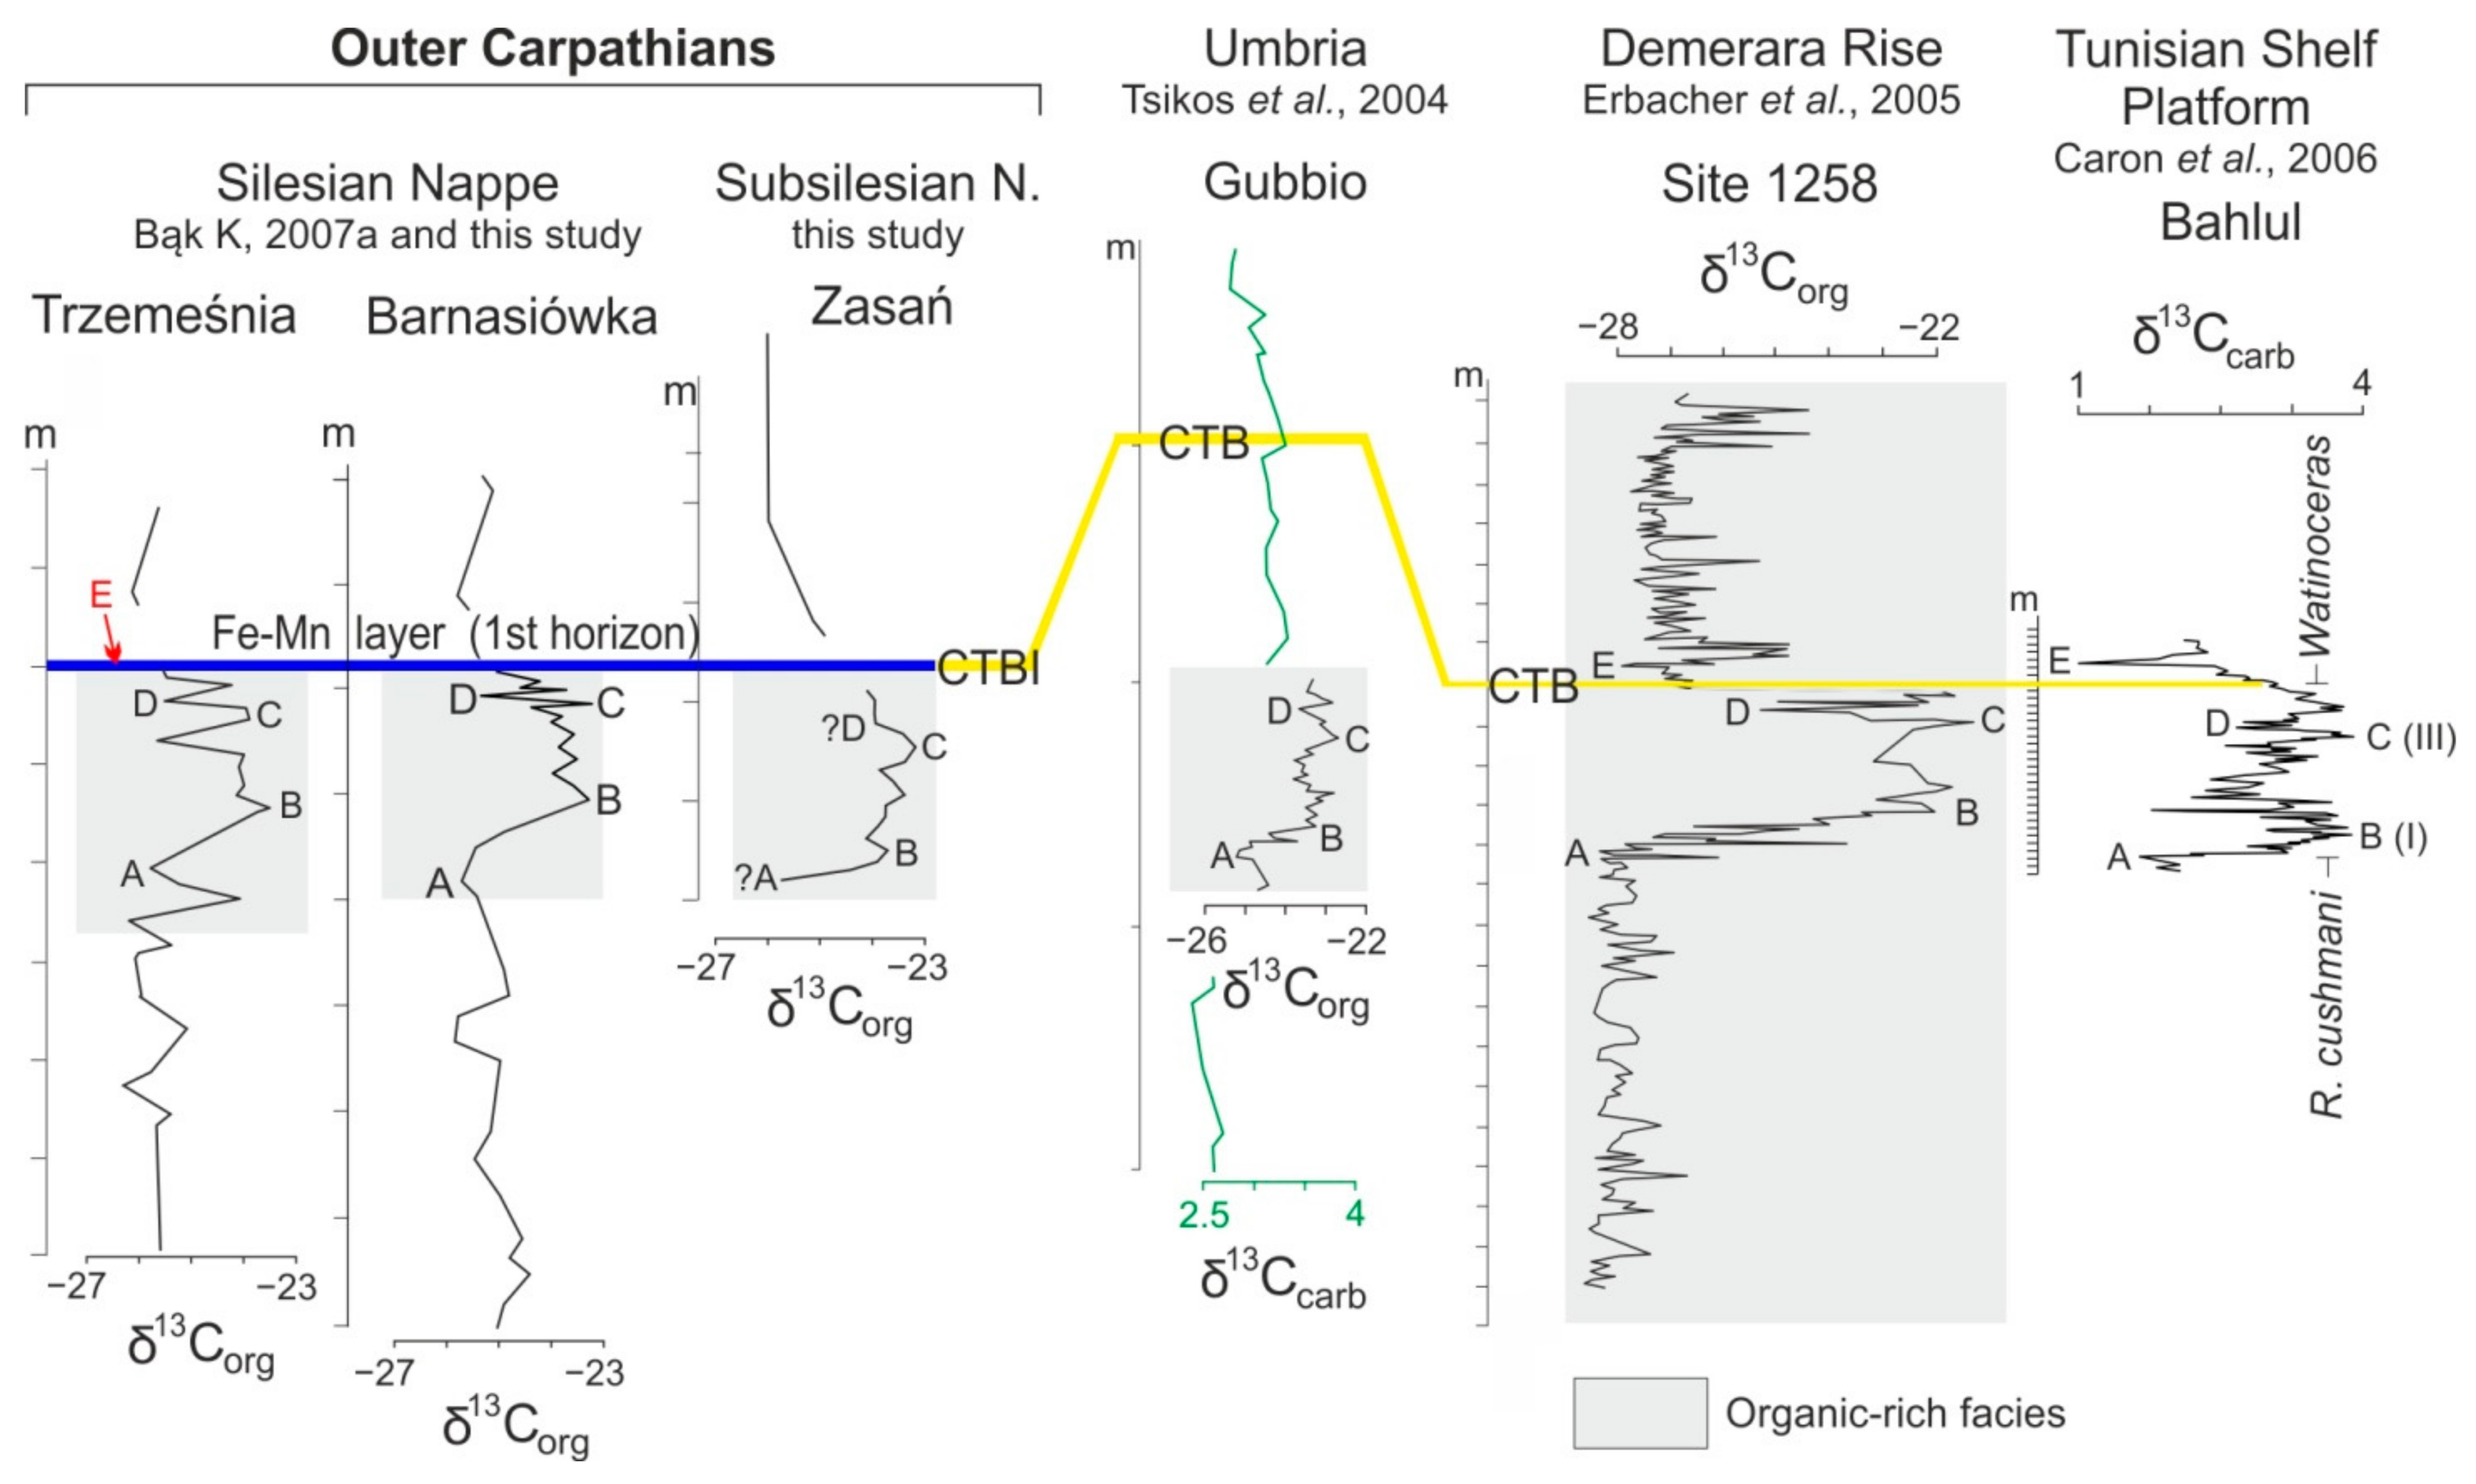
6.1. Correlation of δ13Corg Curves from the Outer Carpathians

The medium-resolution δ13Corg curves allowed for chemostratigraphic correlation among the four sections in the Outer Carpathians (Figure 3). The positive carbon excursion (approximately 3.00‰) related to the organic-rich interval is the most distinctive feature observed in these sections; this excursion clearly records the OAE2. The positive excursion begins within the argillaceous part of the organic-rich facies, near its base. The rapid increase in values (approximately 2.4‰) is characteristic of a thin (30–50 cm) interval, directly underlying the first siliceous black shale layer (between points “A” and “B”). However, a significant shift in the δ13Corg values (approximately 1.2‰) occurs also 1–1.5 m below the base of the organic-rich facies (the lowest red line; Figure 3).
Within the broad interval of the OAE2 excursion, a number of distinct peaks can be correlated between the sections (Figure 3 and Figure 4). The magnitude of these δ13Corg shifts differs between them. Such difference could be explained by a different degree of organic matter oxidation during outcrop weathering, as was suggested for other CTBI sections (e.g., [50]).
The data collected here support the conclusion that the δ13Corg values remain high over the “plateau” (−24‰ to −23‰) up to the top of the organic-rich facies in all sections studied. The next organic-rich shale layer that occurs within the oxidized facies, ~1 m above the top of a first Fe–Mn layer, corresponds to a “recovery interval”, regarded as the return to the pre-excursion δ13Corg values.

6.2. Termination of Organic-Rich Sedimentation vs. Position of C–T Boundary

The data collected here raise a question about the termination of organic-rich sedimentation in relation to the C–T boundary in the Outer Carpathian sections. Generally, this boundary is based on the first occurrence of the ammonite Watinoceras devonense [56,57,58] which in the stratotype section at Pueblo appears between the last maximum peak of δ13C that terminates the δ13C “plateau” and first deep negative shift [44,51,59,60].
A comparison of the δ13Corg curve structure from the presented Outer Carpathian sections with the structures of the high-resolution curves from the sections bearing the ammonite fauna and planktonic microfossils (Figure 4 and Figure 5) shows that the top of the Bonarelli-equivalent Level is above the end of the “plateau” interval, within the falling trend of δ13Corg values. It means that the C–T boundary can be placed at the first Fe–Mn macronodule level precipitated during stratigraphic condensation of marine transgressive record. Oxidized sediments (red and green siliceous claystones or mudstones) occur in the Carpathian sections directly above this level, displaying their unusual stratigraphic position if compared with other deep-water settings in the Mediterranean Tethys. For example, the fully oxidized strata (Scaglia Rossa) in the Umbria–Marche Apennines (Contessa Gorge near Gubbio) appear 3.4 m above the Bonarelli Level corresponding to the Early Turonian interval between the Holywell and Lulworth chemostratigraphic events [61].
In turn, the carbon isotope data from the Calabianca section [53,54] suggest that the termination of organic-rich facies of the OAE2 in the Sicily Basin was nearly coeval with a negative shift in δ13Ccarb values (point “E”; Figure 5), directly preceding the first occurrence of Quadrum gartneri.
The δ13C curves from two deep-water sections in the eastern North Atlantic, the Site 551 (Goban Spur; [62]) and the Site 641A (on the western margin of Galicia Bank, off northwestern Spain; [63]) show that the green and brown clays at the base of the Plantagenet Formation may occur within the OAE2 carbon isotope excursion. Position of this unit is probably similar at Site 398 (Vigo Seamount at the southern end of the Galicia Bank), according to the correlation presented by Thurow et al. [63] and the radiolarian assemblages determined by Thurow [64]. However, a lack of carbon isotope data from this site and low-resolution data from other North Atlantic sites does not allow the unequivocal correlation of these sediments with the C–T boundary.

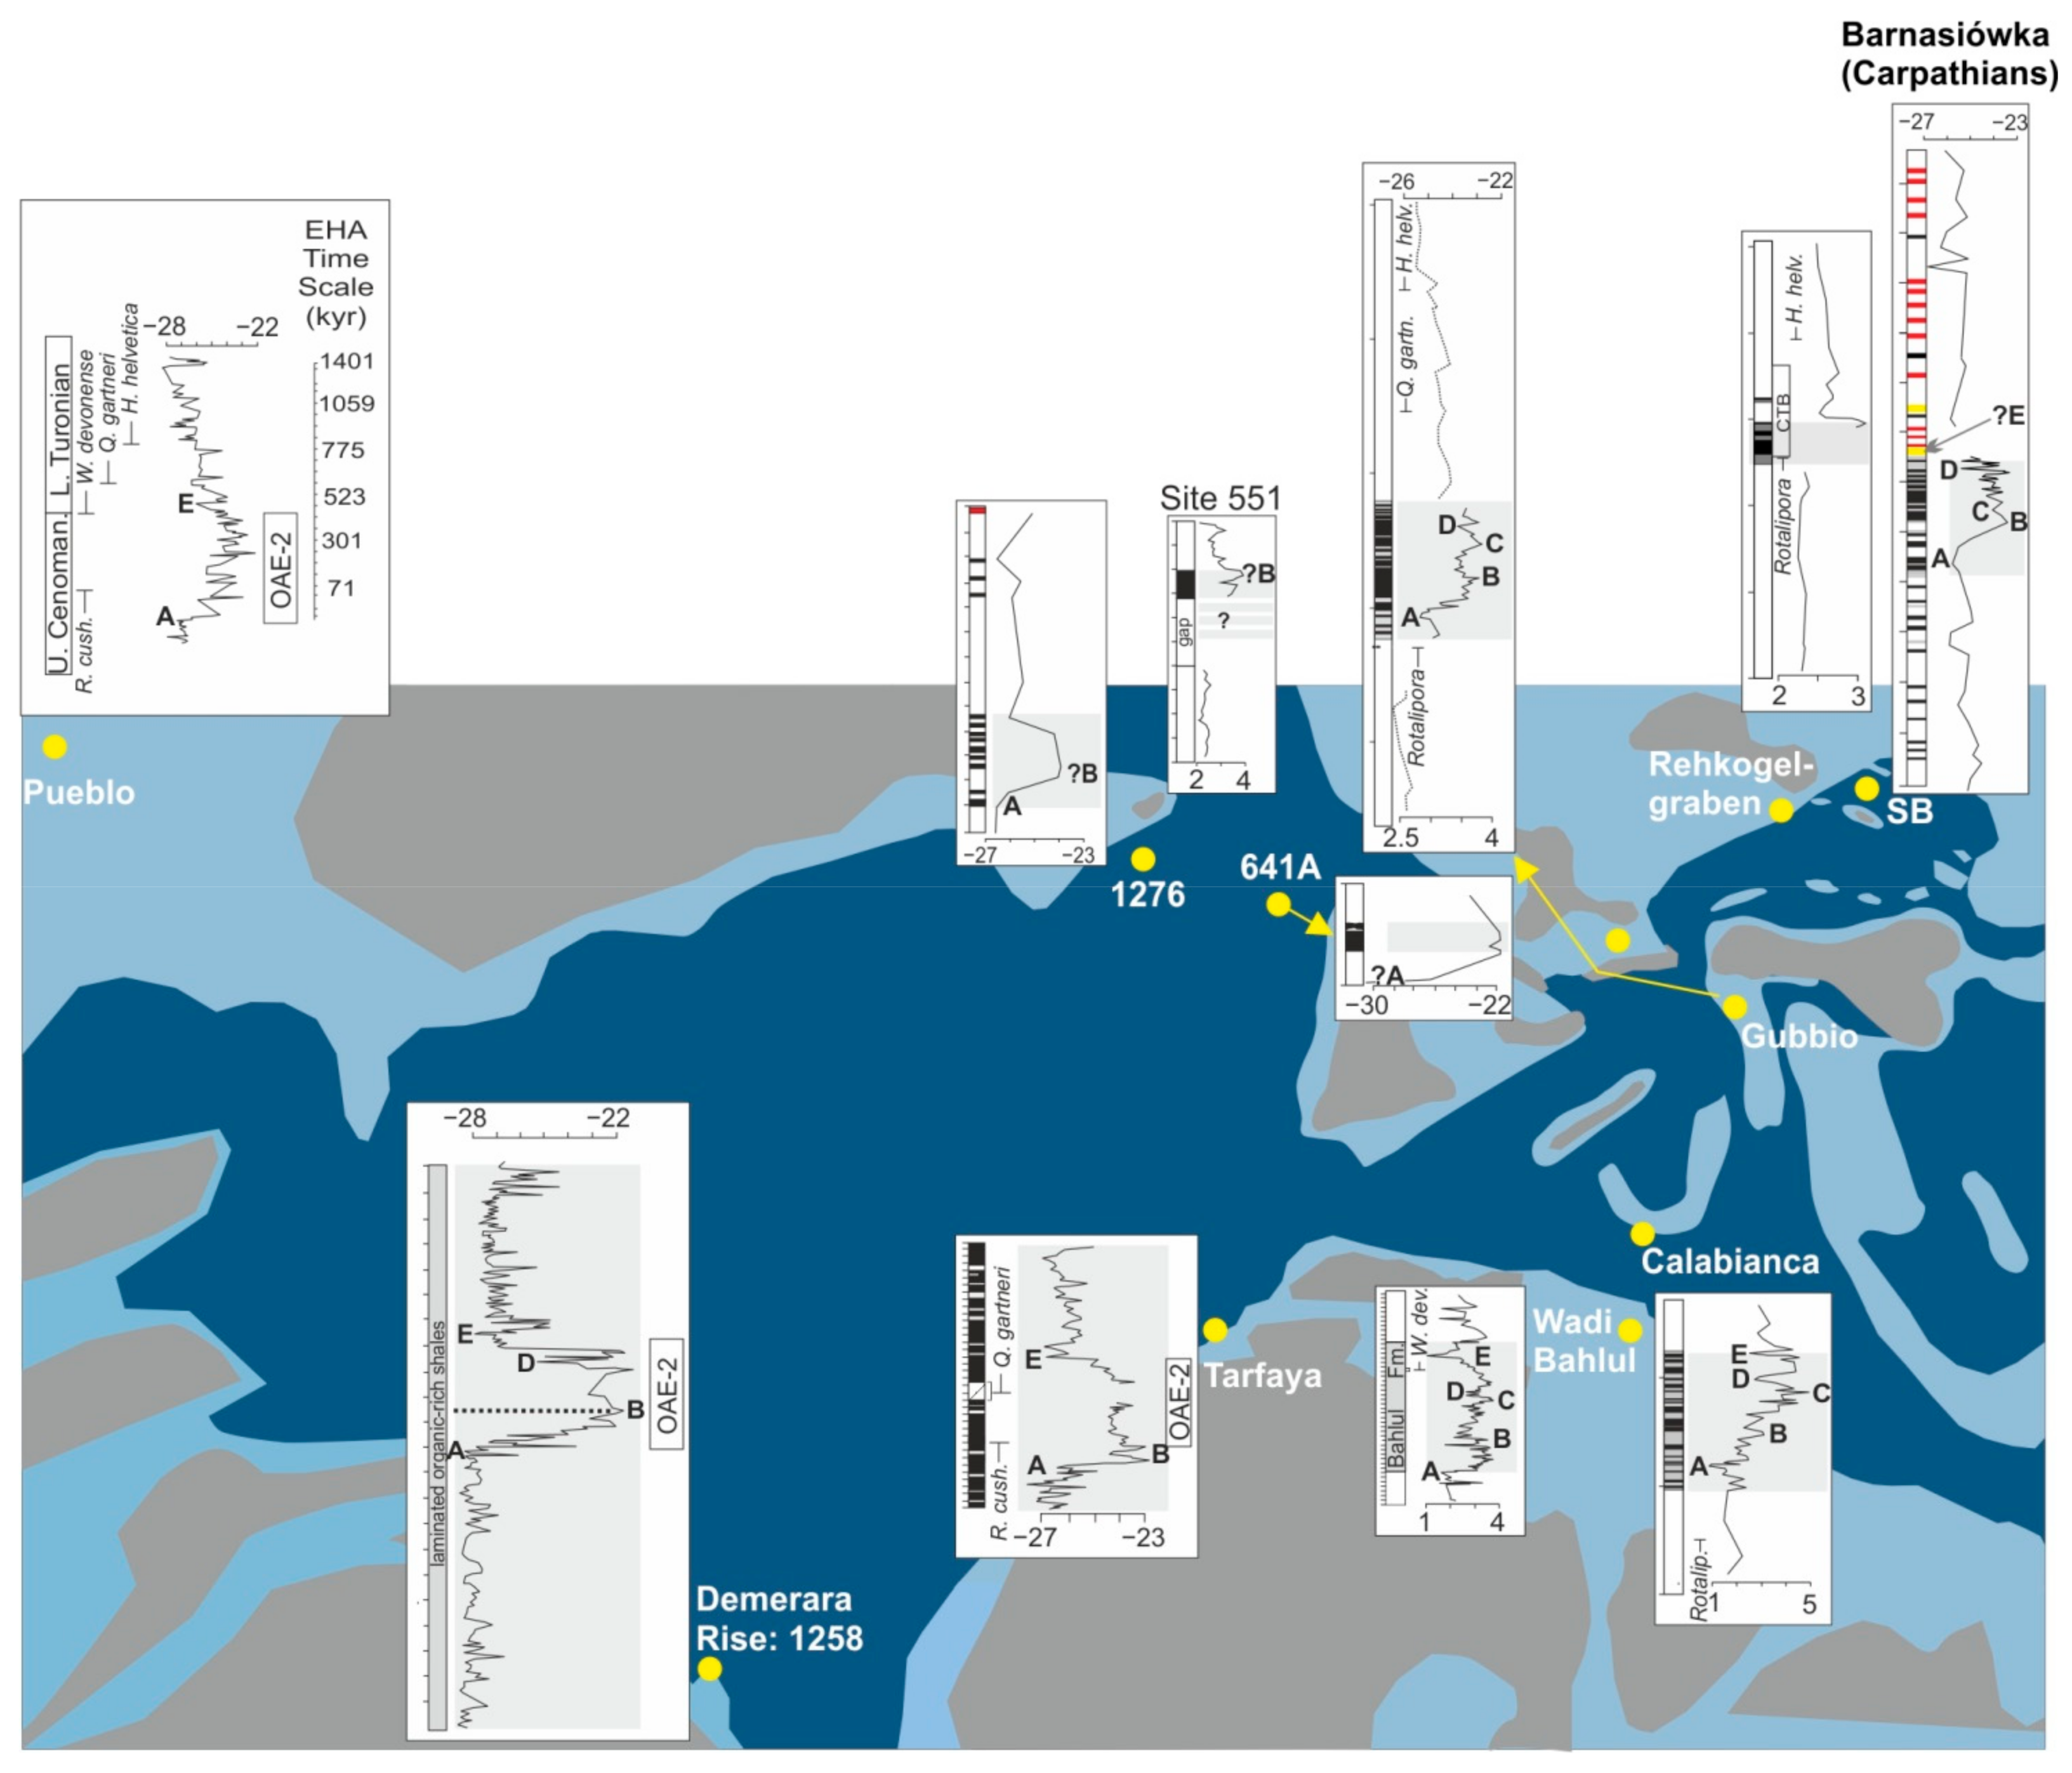
6.3. Diachronism and Synchronism of Sediments with Enhanced Content of Organic Matter in peri-Tethyan Seas

The accumulation of calcareous and siliciclastic sediments with enhanced content of organic matter in the peri-Tethyan shelves, epicontinental seas, and basins was diachronic in relation to organic-rich sedimentation in deep-water environments of the Western Tethys (cf. δ13C curves from selected sections presented in Figure 5).
In the West and East European Platforms, this accumulation terminated in the similar (but not the same) time, as in the deep marginal basins, i.e., before the C–T boundary. This was confirmed by the chemo- and biostratigraphy of the Chalk successions in England (cf. the stratigraphic position of the Plenus Marls; e.g., [61,66,67,68,69,70]); Bohemia [71], Poland [72,73], and Crimea [74]. In many sections of this area, an unconformity horizon was associated with the uppermost part of the Cenomanian–Turonian boundary interval above the organic-rich strata (cf. [75,76]). On the contrary, the OAE2 black shale deposition lasted up to various parts of the Turonian within the epicontinental seas along the northern and western African margins (e.g., [9,44,77]).
Such coincidence of the timing of bottom-water oxygenation in the deep basins and in the surrounding northern epicontinental seas, which were additionally affected by an Early Turonian erosional event in their high-latitude regions, may suggest that these ocean-margin seas might have affected the density-driven oceanic circulation, caused by the influx of warm, saline water from these areas. The interpretation of such model of deep-water circulation was earlier suggested by some authors from various regions (e.g., [78,79]), and based on the models for ocean circulation (e.g., [80]). However, the only suggested source areas for downward convection of warm, saline, dense waters were the subtropical areas of the eastern and western parts of the Tethys [80,81].

7. Conclusions

The chemostratigraphic (δ13Corg) data related to non-calcareous, hemipelagic shales enriched in marine organic matter in the CTB interval have been analyzed in the Silesian, Subsilesian, and Skole nappes of the Outer Carpathians. Several distinctive carbon isotope excursions clearly recorded the OAE2 and enabled correlation of these deposits along the Tethyan, Atlantic, and North American settings. The sedimentation of organic-rich facies terminated with a characteristic level which occurs only in the Outer Carpathians. It consists of a thin ferromanganese layer with nodules. Interpretation of this regional chronohorizon shows that in the deep Carpathian basins, the termination of the OAE2 organic-rich facies coincided with the initial stage of bottom-water oxygenation. This phenomenon began during an interval of δ13Corg values displaying a negative trend, which represent a terminal part within the OAE2 carbon isotope excursion. This “bottom oxidation event” ends episode of organic-rich deposition in regions of the Western Tethys. This event lies below the C–T boundary and is diachronic. In the southern part of the Mediterranean Tethys, the top of the organic-rich facies correlates with the beginning of the recovery interval of the δ13Ccarb values. It shows in the younger age of the first oxidized sediments in this area.

Supplementary Materials

The following are available online at https://www.mdpi.com/article/10.3390/min11040420/s1. Table S1: Carbon isotope data from sections studied. For location of samples see Figure 3.

Author Contributions

Conceptualization, M.B. and K.B.; Methodology, M.B. and K.B.; Software, M.B. and K.B.; Validation, M.B. and K.B.; Data Curation, M.B. and K.B.; Writing-Original Draft Preparation, M.B. and K.B.; Writing-Review & Editing, M.B. and K.B.; Visualization, M.B. and K.B.; Funding Acquisition, M.B. and K.B. All authors have read and agreed to the published version of the manuscript.

Funding

The study was funded by the Statutory Funds of Department of General Geology and Geotourism, the Faculty of Geology, Geophysics and Environmental Protection, AGH University of Science and Technology in Kraków, Poland to Marta Bąk (Project 16.16.140.315) and the Ministry of Science and Higher Education to Krzysztof Bąk (Project BN.610-408/PBU/2020).

Institutional Review Board Statement

Not applicable.

Informed Consent Statement

Not applicable.

Data Availability Statement

No new data were created or analyzed in this study. Data sharing is not applicable to this article.

Acknowledgments

We would like to thank two anonymous reviewers and the journal editor for constructive comments and suggestions.

Conflicts of Interest

The authors declare no conflict of interest.

References

  1. Coccioni, R.; Luciani, V. Planktonic foraminifera and environmental changes across the Bonarelli event (OAE-2, latest Cenomanian) in its type area: A high-resolution study from the Tethyan reference Bottaccione section (Gubbio, central Italy). J. Foram. Res. 2004, 34, 109–129. [Google Scholar] [CrossRef]
  2. Crumière, J.P.; Crumière-Airaud, C.; Espitalié, J.; Cotillon, P. Global and regional controls on potential source-rock deposition and preservation: The Cenomanian-Turonian oceanic anoxic event on the European Tethyan margin (SE France). In Deposition of Organic Facies; Huc, A.Y., Ed.; American Association of Petroleum Geologists, Studies in Geology: Tulsa, OK, USA, 1990; pp. 107–118. [Google Scholar]
  3. Bąk, K. Environmental changes during the Cenomanian–Turonian boundary event in the Outer Carpathian basins: A synthesis of data from various tectonic-facies units. Ann. Soc. Geol. Pol. 2007, 77, 171–191. [Google Scholar]
  4. Bąk, M.; Bąk, K.; Górny, Z.; Stożek, B. Evidence of bacteriogenic iron and manganese oxyhydroxides in Albian-Cenomanian marine sediments of the Carpathian realm (Poland). Ann. Soc. Geol. Polon. 2015, 85, 371–385. [Google Scholar] [CrossRef] [Green Version]
  5. Bąk, K.; Bąk, M.; Górny, Z.; Wolska, A. Environmental conditions in a Carpathian deep sea basin during the period preceding Oceanic Anoxic Event 2—A case study from the Skole Nappe. Geol. Carp. 2014, 65, 433–450. [Google Scholar] [CrossRef] [Green Version]
  6. Uchman, A.; Bąk, K.; Rodríguez-Tovar, F.J. Ichnological record of deep-sea palaeoenvironmental changes around the Oceanic Anoxic Event 2 (Cenomanian–Turonian boundary): An example from the Barnasiówka section, Polish Outer Carpathians. Palaeogeogr. Palaeoclimat. Palaeoecol. 2008, 262, 61–71. [Google Scholar] [CrossRef]
  7. Bąk, M. Radiolaria from the Upper Cenomanian–Lower Turonian deposits of the Silesian Unit (Polish Flysch Carpathians). Geol. Carpat. 2000, 51, 309–324. [Google Scholar]
  8. Bąk, M. Radiolarian biostratigraphy of the Upper Cenomanian–Lower Turonian deposits in the Subsilesian Nappe (Outer Western Carpathians). Geol. Carpat. 2004, 55, 239–250. [Google Scholar]
  9. Lüning, S.; Kolonic, S.; Belhadj, E.M.; Belhadj, Z.; Cota, L.; Barić, G.; Wagner, T. Integrated depositional model for the Cenomanian–Turonian organic-rich strata in North Africa. Earth Sci. Rev. 2004, 64, 51–117. [Google Scholar] [CrossRef]
  10. Elderbak, K.; Leckie, R.M.; Tibert, N.E. Paleoenvironmental and paleoceanographic changes across the CenomanianeTuronian Boundary Event (Oceanic Anoxic Event 2) as indicated by foraminiferal assemblages from the eastern margin of the Cretaceous Western Interior Sea. Palaeogeogr. Palaeoecol. Palaeoclimat. 2014, 413, 29–48. [Google Scholar] [CrossRef]
  11. Bąk, K.; Bąk, M. Foraminiferal and radiolarian biostratigraphy of the youngest (Late Albian through Late Cenomanian) sediments of the Tatra massif, Central Western Carpathians. Acta Geol. Polon. 2013, 63, 223–237. [Google Scholar] [CrossRef] [Green Version]
  12. Wójcik-Tabol, P.; Oszczypko, N. Trace element geochemistry of the Early to Late Cretaceous deposits of the Grajcarek thrust-sheets–A palaeoenvironmental approach (Małe Pieniny Mts. Pieniny Klippen Belt, Poland). Geol. Quart. 2012, 56, 169–186. [Google Scholar]
  13. Bąk, K.; Bąk, M.; Dulemba, P.; Okoński, S. Late Cenomanian environmental conditions at the submerged Tatric Ridge, Central Western Carpathians during the period preceding Oceanic Anoxic Event 2—A palaeontological and isotopic approach. Cret. Res. 2016, 63, 95–112. [Google Scholar] [CrossRef]
  14. Bąk, K. Sedimentological, geochemical and microfaunal responses to environmental changes around the Cenomanian–Turonian boundary in the Outer Carpathian Basin; a record from the Subsilesian Nappe, Poland. Palaeogeogr. Palaeoecol. Palaeoclimat. 2006, 237, 335–358. [Google Scholar] [CrossRef]
  15. Bąk, K. Deep-water facies succession around the Cenomanian–Turonian boundary in the Outer Carpathian Basin: Sedimentary, biotic and chemical records in the Silesian Nappe, Poland. Palaeogeogr. Palaeoecol. Palaeoclimat. 2007, 248, 255–290. [Google Scholar] [CrossRef]
  16. Bąk, K. Organic-rich and manganese sedimentation during the Cenomanian–Turonian boundary event in the Outer Carpathian Basin; a new record from the Skole Nappe, Poland, and a review from other tectonic-facies units. Palaeogeogr. Palaeoecol. Palaeoclimat. 2007, 256, 21–46. [Google Scholar] [CrossRef]
  17. Bąk, K. Environmental changes around the Cenomanian—Turonian boundary in a marginal part of the Outer Carpathian Basin expressed by microfacies, microfossils and chemical records in the Skole Nappe (Poland). Ann. Soc. Geol. Pol. 2007, 77, 39–67. [Google Scholar]
  18. Bąk, M. Tethyan radiolarians at the Cenomanian–Turonian anoxic event from the Apennines (Umbria-Marche) and the Outer Carpathians: Palaeoecological and palaeoenvironmental implications. Studia Geol. Polon. 2011, 134, 7–279. [Google Scholar]
  19. Geroch, S. Microfaunal assemblage from the Cretaceous and Palaeogene Silesian unit in the Beskid Śląski Mts. Western Carpathians. Inst. Geol. Biul. Warsaw 1960, 153, 1–138. [Google Scholar]
  20. Olszewska, B. Foraminiferal biostratigraphy of the Polish Outer Carpathians: A record of basin geohistory. Ann. Soc. Geol. Polon. 1997, 67, 325–337. [Google Scholar]
  21. Bąk, K. Biostratigraphy of deep-water agglutinated foraminifera in Scaglia Rossa-type deposits of the Pieniny Klippen Belt, Carpathians, Poland. In Proceedings of the Fifth International Workshop on Agglutinated Foraminifera; Grzybowski Foundation, Special Publication 7; Hart, M.B., Kaminski, M.A., Smart, C.W., Eds.; Grzybowski Foundation, Drukarnia Narodowa: Kraków, Poland, 2000; pp. 15–41. [Google Scholar]
  22. Oszczypko, N.; Malata, E.; Bąk, K.; Kędzierski, M.; Oszczypko-Clowes, M. Lithostratigraphy, biostratigraphy and palaeoenvironment of the Upper Albian–Lower/Middle Eocene flysch deposits in the Beskid Wyspowy and Gorce Ranges; Polish Outer Carpathians, Magura Nappe; Bystrica and Rača subunits. Ann. Soc. Geol. Polon. 2005, 75, 27–69. [Google Scholar]
  23. Bąk, M. Mid-Cretaceous Radiolarian zonation in the Polish part of the Pieniny Klippen Belt (Carpathians). Geol. Carpat. 1999, 50, 21–31. [Google Scholar]
  24. Górka, H. Cenomanian Radiolaria from Spława, Polish Carpathians. Geol. Quart. 1996, 40, 555–574. [Google Scholar]
  25. Książkiewicz, M. Bathymetry of the Carpathian Flysch Basin. Acta Geol. Polon. 1975, 25, 309–367. [Google Scholar]
  26. Bubik, M.; Bąk, M.; Švabenicka, L. Biostratigraphy of the Maastrichtian to Palaeocene distal flysch sediments of the Rača unit in the Užgruň section (Magura flysch, Czech Republic). Geol. Carpat. 1999, 50, 33–48. [Google Scholar]
  27. Oszczypko, N. Late Jurassic—Miocene evolution of the Outer Carpathian fold-and-thrust belt and its foredeep basin (Western Carpathians, Poland). Geol. Quart. 2006, 50, 169–194. [Google Scholar]
  28. Bąk, K.; Bąk, M.; Cieśla, M.; Paul, Z. Foraminiferal stratigraphy of Paleogene deep-water red facies in the Gorce Mountains (Magura Nappe, Polish Outer Carpathians. Ann. Soc. Geol. Polon. 2013, 83, 211–212. [Google Scholar]
  29. Słomka, T.; Malata, T.; Leśniak, T.; Oszczypko, N.; Poprawa, P. Evolution of the Silesian and Subsilesian basins. In Palaeotectonic Evolution of the Outer Carpathian and Pieniny Klippen Belt Basins; Oszczypko, N., Uchman, F., Malata, E., Eds.; Instytut Nauk Geologicznych Uniwersytetu Jagiellońskiego: Kraków, Poland, 2006; pp. 111–126. [Google Scholar]
  30. Unrug, R. The Silesian cordillera as the source of clastic material of the Flysch sandstones of the Beskid Śląski and Beskid Wysoki ranges, Polish West Carpathians. Ann. Soc. Géol. Pol. 1968, 38, 81–164. [Google Scholar]
  31. Cieszkowski, M.; Golonka, J.; Krobicki, M.; Slaczka, A.; Oszczypko, N.; Waskowska, A.; Wendorff, M. The Northern Carpathians plate tectonic evolutionary stages and origin of olistoliths and olistostromes. Geodynam. Acta 2009, 22, 101–126. [Google Scholar] [CrossRef]
  32. Bąk, M.; Górny, Z.; Bąk, K. Sponge growth on the Cenomanian carbonate shelves of the Carpathian Basin: A record from spicule-rich turbidites. Bull. Geosci. 2015, 90, 651–666. [Google Scholar] [CrossRef] [Green Version]
  33. Bąk, K.; Bąk, M.; Paul, Z. Barnasiówka Radiolarian Shale Formation—A new lithostratigraphic unit in the Upper Cenomanian–lowermost Turonian of the Polish Outer Carpathians. Ann. Soc. Geol. Polon. 2001, 71, 75–103. [Google Scholar]
  34. Hu, X.; Jansa, L.; Wang, C.; Sarti, M.; Bąk, K.; Wagreich, M.; Michalik, J.; Soták, J. Upper Cretaceous oceanic red beds (CORBs) in the Tethys: Occurrences, lithofacies, age, and environments. Cret. Res. 2005, 26, 3–20. [Google Scholar] [CrossRef]
  35. Van Couvering, J.A.; Aubry, M.-P.; Berggren, W.A.; Bujak, J.P.; Naeser, C.W.; Wieser, T. The terminal Eocene event and the Polish connection. Palaeogeogr. Palaeoclimat. Palaeoecol. 1981, 36, 321–362. [Google Scholar] [CrossRef]
  36. Koszarski, L.; Ślączka, A. Outer (flysch) Carpathians: Lower Cretaceous. In Geology of Poland; Pożaryski, W., Ed.; Wydawnictwa Geologiczne: Warsaw, Poland, 1973; pp. 492–495. [Google Scholar]
  37. Kotlarczyk, J. Stratigraphy of the Ropianka Formation or of Inoceramian Beds in the Skole Unit of the Flysch Carpathians. Prace Geol. PAN Oddział Krakowie 1978, 108, 1–82. [Google Scholar]
  38. Gucik, S. Explanations to the Detailed Geological Map of Poland, Scale 1:50,000; Krzywcza (1026) Sheet; Wydawnictwa Geologiczne: Warsaw, Poland, 1987; pp. 1–77. (In Polish) [Google Scholar]
  39. Gucik, S.; Jankowski, L.; Rączkowski, W.; Żytko, K. Explanations to the Detailed Geological Map of Poland, Scale 1:50,000; Rybotycze (1043) and Dobromil (1044) Sheets; Wydawnictwa Geologiczne: Warsaw, Poland, 1991; pp. 1–39. (In Polish) [Google Scholar]
  40. Gucwa, I.; Wieser, T. Ferromanganese nodules in the Western Carpathian flysch deposits of Poland. Ann. Soc. Geol. Polon. 1978, 48, 147–182. [Google Scholar]
  41. Okoński, S.; Górny, Z.; Bąk, M.; Bąk, K. Lithistid spicules in the sediments of the Turonian Variegated Shale in the Silesian Nappe, Polish Outer Carpathians. Geol. Geoph. Environ. 2014, 40, 33–48. [Google Scholar]
  42. Beil, S.; Kuhnt, W.; Holbourn, A.E.; Aquita, M.; Flögel, S.; Chellai, H.; Jabour, H. New insights into Cenomanian paleoceanography and climate evolution from the Tarfaya Basin, southern Morocco. Cret. Res. 2018, 84, 451–473. [Google Scholar] [CrossRef] [Green Version]
  43. Košták, M.; Čech, S.; Uličný, D.; Sklenář, J.; Ekrt, B.; Mazuch, M. Ammonites, inoceramids and stable carbon isotopes of the Cenomanian–Turonian OAE2 interval in central Europe: Pecínov quarry, Bohemian Cretaceous Basin (Czech Republic). Cret. Res. 2018, 87, 150–173. [Google Scholar] [CrossRef]
  44. Caron, M.; Dall’Agnollo, S.; Accarie, H.; Barrera, E.; Kauffman, E.G.; Amédro, F.; Robaszynski, F. High resolution stratigraphy of the Cenomanian–Turonian boundary interval at Pueblo (USA) and Wadi Bahlul (Tunisia): Stable isotope and bio-events correlation. Geobios 2006, 39, 271–300. [Google Scholar] [CrossRef]
  45. Tsikos, H.; Jenkyns, H.C.; Walsworth-Bell, B.; Petrizzo, M.R. Carbon-isotope stratigraphy recorded by the Cenomanian–Turonian Oceanic Anoxic Event: Correlation and implications based on three key localities. J. Geol. Soc. Lond. 2004, 161, 711–719. [Google Scholar] [CrossRef]
  46. Fernando, A.G.S.; Takashima, R.; Nishi, H.; Giraud, F.; Okada, H. Calcareous nannofossil biostratigraphy of the Thomel Level (OAE2) in the Lambruisse section, Vocontian Basin, southeast France. Geobios 2010, 43, 45–57. [Google Scholar] [CrossRef]
  47. Boulila, S.; Charbonnier, G.; Spangenberg, J.; Gardin, S.; Galbrun, B.; Briard, J.; Le Callonne, L. Unraveling short-and long-term carbon cycle variations during the Oceanic Anoxic Event 2 from the Paris Basin Chalk. Global Planet. Chang. 2020, 186, 103126. [Google Scholar] [CrossRef]
  48. Erbacher, J.; Friedrich, O.; Wilson, P.A.; Birch, H.; Mutterlose, J. Stable organic carbon isotope stratigraphy across Oceanic Anoxic Event 2 of Demerara Rise, western tropical Atlantic. Geochem. Geoph. Geosys. 2005, 6, Q06010. [Google Scholar] [CrossRef]
  49. Valle, B.; Führ Dal’ Bó, P.; Mendes, M.; Favoreto, J.; Luparelli Rigueti, A.; Borghi, L.; de Oliveira Mendonça, J.; Silva, R., Jr. The expression of the Oceanic Anoxic Event 2 (OAE2) in the northeast of Brazil (Sergipe-Alagoas Basin). Palaeogeogr. Palaeoclimat. Palaeoecol. 2019, 529, 12–23. [Google Scholar] [CrossRef]
  50. Bowman, A.R.; Bralower, T.J. Paleoceanographic significance of high-resolution carbon isotope records across the Cenomanian–Turonian boundary in the Western Interior and New Jersey coastal plain, USA. Mar. Geol. 2005, 217, 305–321. [Google Scholar] [CrossRef]
  51. Sageman, B.B.; Meyers, S.R.; Arthur, M.A. Orbital time scale and new C-isotope record for Cenomanian–Turonian boundary stratotype. Geology 2006, 34, 125–128. [Google Scholar] [CrossRef]
  52. Wagreich, M.; Bojar, A.-V.; Sachsenhofer, R.F.; Neuhuber, S.; Egger, H. Calcareous nannoplankton, planktonic foraminiferal, and carbonate carbon isotope stratigraphy of the Cenomanian–Turonian boundary section in the Ultrahelvetic Zone (Eastern Alps, Upper Austria). Cret. Res. 2008, 29, 965–975. [Google Scholar] [CrossRef]
  53. Scopelliti, G.; Bellanca, A.; Coccioni, R.; Luciani, V.; Neri, R.; Baudin, F.; Chiari, M.; Marcucci, M. High-resolution geochemical and biotic records of the Tethyan ‘Bonarelli Level’ (OAE2, latest Cenomanian) from the Calabianca–Guidaloca composite section, northwestern Sicily, Italy. Palaeogeogr. Palaeoclimat. Palaeoecol. 2004, 208, 293–317. [Google Scholar] [CrossRef]
  54. Scopelliti, G.; Bellanca, A.; Erba, E.; Jenkyns, H.C.; Neri, R.; Tamagnini, P.; Luciani, V.; Masetti, D. Cenomanian–Turonian carbonate and organic-carbon isotope records, biostratigraphy and provenance of a key section in NE Sicily, Italy: Palaeoceanographic and palaeogeographic implications. Palaeogeogr. Palaeoclimat. Palaeoecol. 2008, 265, 59–77. [Google Scholar] [CrossRef]
  55. Melinte-Dobrinescu, M.C.; Bojar, A.-V. Biostratigraphic and isotopic record of the Cenomanian–Turonian deposits in the Ohaba-Ponor section (SW Hatxeg, Romania). Cret. Res. 2008, 1024–1034. [Google Scholar] [CrossRef]
  56. Bengston, P. The Turonian stage and substage boundaries. Bull. Inst. Roy. Sci. Natur. Belg. 1996, 66, 69–79. [Google Scholar]
  57. Kennedy, W.J.; Walaszczyk, I.; Cobban, W.A. The Global Boundary Stratotype Section and Point for the base of the Turonian Stage of the Creataceous: Pueblo, Colorado, USA. Episodes 2005, 28, 93–104. [Google Scholar] [CrossRef] [PubMed] [Green Version]
  58. Ogg, J.G.; Hinnov, L.A. Cretaceous. In The Geological Time Scale; Gradstein, F.M., Ogg, J.G., Schmitz, M.D., Ogg, G.M., Eds.; Elsevier: Amsterdam, The Netherlands, 2012; Chapter 27; pp. 793–853. [Google Scholar]
  59. Pratt, L.M. Isotopic studies of organic matter and carbonate rocks of the Greenhorn marine cycle. In Fine-Grained Deposits and Biofacies of the Cretaceous Western Interior Seaway: Evidence of Cyclic Sedimentary Processes; Field Trip Guidebook; Pratt, L.M., Kauffman, E.G., Zelt, F.B., Eds.; Society of Economic Paleontologists and Mineralogists, Midyear Meeting: Golden, CO, USA, 1985; Volume 4, pp. 38–48. [Google Scholar]
  60. Keller, G.; Berener, Z.; Adatte, T.; Stueben, D. Cenomanian–Turonian and δ13C, and δ18O, sea level and salinity variations at Pueblo, Colorado. Palaeogeogr. Palaeoclimat. Palaeoecol. 2004, 211, 19–43. [Google Scholar] [CrossRef]
  61. Jarvis, I.; Gale, A.S.; Jenkyns, H.C.; Pearce, M.A. Secular variation in Late Cretaceous carbon isotopes: A new 13C carbonate reference curve for the Cenomanian–Campanian (99.6–70.6 Ma). Geol. Mag. 2006, 143, 561–608. [Google Scholar] [CrossRef] [Green Version]
  62. Gustafsson, M.; Holbourn, A.; Kuhnt, W. Changes in Northeast Atlantic temperature and carbon flux during the Cenomanian/Turonian paleoceanographic event: The Goban Spur stable isotope record. Palaeogeogr. Palaeoclimat. Palaeoecol. 2003, 201, 51–66. [Google Scholar] [CrossRef]
  63. Thurow, J. Cretaceous radiolarians of the North Atlantic Ocean: ODP Leg 103 (Sites 638 640 and 641) and DSDP Legs 93 (Site 603) and 47B (Site 398). In Proceedings of Ocean Drilling Project, Scientific Results; Boillot, G., Winterer, G., Meyer, A., Applegate, J., Baltuck, M., Bergen, J.A., Comas, M.C., Davies, T.A., Dunham, K., Evans, C.A., et al., Eds.; U.S. Government Printing Office: Washington DC, USA, 1988; Volume 103, pp. 379–418. [Google Scholar]
  64. Thurow, J.; Moullade, M.; Brumsack, H.-J.; Masure, E.; Taugourdeau-Lantz, J.; Dunham, K. The Cenomanian/Turonian boundary event (CTBE) at Hole 641A, ODP Leg 103 (compared with the CTBE interval at Site 398). In Proceedings of Ocean Drilling Project, Scientific Results; Boillot, G., Winterer, E.L., Meyer, A.W., Applegate, J., Baltuck, M., Bergen, J.A., Comas, M.C., Davies, T.A., Dunham, K., Evans, C.A., et al., Eds.; U.S. Government Printing Office: Washington DC, USA, 1987; Volume 103, pp. 587–634. [Google Scholar]
  65. Golonka, J.; Oszczypko, N.; Ślączka, A. Late Carboniferous–Neogene geodynamic evolution and palaeogeography of the circum-Carpathian region and adjacent areas. Ann. Soc. Geol. Polon. 2000, 70, 107–136. [Google Scholar]
  66. Gale, A.S.; Jenkyns, H.C.; Kennedy, W.J.; Corfield, R.M. Chemostratigraphy versus biostratigraphy: Data around the Cenomanian–Turonian boundary. J. Geol. Soc. Lond. 1993, 26, 29–32. [Google Scholar] [CrossRef]
  67. Gale, A.S.; Kennedy, W.J.; Voigt, S.; Walaszczyk, I. Stratigraphy of the Upper Cenomanian–Lower Turonian Chalk succession at Eastbourne, Sussex, UK: Ammonites, inoceramid bivalves and stable carbon isotopes. Cret. Res. 2005, 26, 460–487. [Google Scholar] [CrossRef]
  68. Jenkyns, H.C.; Gale, A.S.; Corfield, R.M. Carbon and oxygen isotope stratigraphy of the English Chalk and Italian Scaglia and its paleoclimatic significance. Geol. Mag. 1994, 131, 1–34. [Google Scholar] [CrossRef] [Green Version]
  69. Paul, C.R.C.; Lamolda, M.A.; Mitchel, S.F.; Vaziri, M.R.; Gorostidi, A.; Marshall, J.D. The Cenomanian–Turonian boundary at Eastbourne (Sussex, UK): A proposed European reference section. Palaeogeogr. Palaeoclimat. Palaeoecol. 1999, 150, 83–121. [Google Scholar] [CrossRef]
  70. Keller, G.; Han, Q.; Adatte, T.; Burns, S.J. Palaeoenvironment of the Cenomanian–Turonian transition at Eastbourne, UK. Cret. Res. 2001, 22, 391–422. [Google Scholar] [CrossRef] [Green Version]
  71. Uličny, D.; Hladíkova, J.; Attrep, M.J.; Čech, S.; Hradecká, L.; Svobodová, M. Sea-level changes and geochemical anomalies cross the Cenomanian–Turonian boundary: Pečinov quarry, Bohemia. Palaeogeogr. Palaeoclimat. Paleoecol. 1997, 132, 265–285. [Google Scholar] [CrossRef]
  72. Peryt, D.; Wyrwicka, K. The Cenomanian–Turonian oceanic anoxic event in SE Poland. Cret. Res. 1991, 12, 65–80. [Google Scholar] [CrossRef]
  73. Peryt, D.; Wyrwicka, K. The Cenomanian/Turonian boundary event in Central Poland. Palaeogeogr. Palaeoclimat. Palaeoecol. 1993, 104, 185–197. [Google Scholar] [CrossRef]
  74. Fischer, J.K.; Price, G.D.; Hart, M.B.; Leng, M.J. Stable isotope analysis of the Cenomanian–Turonian (Late Cretaceous) oceanic anoxic event in the Crimea. Cret. Res. 2005, 26, 853–863. [Google Scholar] [CrossRef]
  75. Marcinowski, R.; Szulczewski, M. Condensed Cretaceous sequence with stromatolites in the Polish Jura Chain. Acta Geol. Polon. 1972, 22, 515–538. [Google Scholar]
  76. Krajewski, K.; Leśniak, P.M.; Łącka, B.; Zawidzki, P. Origin of phosphatic stromatolites in the Upper Cretaceous condensed sequence of the Polish Jura Chain. Sedim. Geol. 2000, 136, 89–112. [Google Scholar] [CrossRef]
  77. Reolid, M.; Sánchez-Quiñónez, C.A.; Alegret, L.; Molina, E. Palaeoenvironmental turnover across the Cenomanian-Turonian transition in Oued Bahloul, Tunisia: Foraminifera and geochemical proxies. Palaeogeogr. Palaeoclimat. Palaeoecol. 2015, 417, 491–510. [Google Scholar] [CrossRef] [Green Version]
  78. Brass, G.W.; Southam, J.R.; Peterson, W.H. Warm saline bottom water in the ancient ocean. Nature 1982, 296, 620–623. [Google Scholar] [CrossRef]
  79. Sliter, W.V.; Brown, G.R. Shatsky Rise: Seismic stratigraphy and sedimentary record of 950 Pacific paleoceanography since the Early Cretaceous. In Proceedings of the Ocean Drilling Program; Scientific Results; Natland, J.H., Storms, M.A., Brass, G.W., Brown, G.R., Premoli Silva, I., Rack, F.R., Sliter, W.V., van Waasbergen, R.J., Eds.; Ocean Drilling Program: College Station, TX, USA; U.S. Government Printing Office: Washington, DC, USA, 1993; Volume 132, pp. 3–13. [Google Scholar]
  80. Barron, E.J.; Peterson, W.H. The Cenozoic ocean circulation based on ocean General Circulation Model results. Palaeogeogr. Palaeoecol. Palaeoclimat. 1990, 83, 1–28. [Google Scholar] [CrossRef]
  81. Woo, K.-S.; Anderson, T.F.; Railback, L.B.; Sandberg, P.A. Oxygen isotope evidence for high salinity surface seawater in the mid-Cretaceous Gulf of Mexico: Implications for warm, saline deepwater formation. Paleoceanography 1992, 7, 673–685. [Google Scholar] [CrossRef]
Figure 1. Position of the studied Cenomanian–Turonian boundary interval sections in the Outer Carpathians, Poland, in relation to the main geological units (geological units after [27]; 1—Barnasiówka, 2—Trzemeśnia, 3—Zasań, 4—Spława).
Minerals 11 00420 g001
Figure 2. Lithostratigraphy of the Cenomanian–Turonian deposits in the Polish Outer Carpathians (after [33,36,37,38,39] supplemented by the authors).
Minerals 11 00420 g002
Figure 3. Lithological logs of the Outer Carpathian sections plotted against organic carbon isotope data (partly based on Bąk K [14,15,16,17], see also Table S1); CTBI—Cenomanian–Turonian boundary interval; Fe–Mn—ferromanganese layer, S.M.—siliceous-manganiferous green and red shales. A, B, C, D—chemostratigraphic marker points used for correlation. Note that the C–T boundary was determined on the basis of organic carbon stable isotope data; this is placed within a first Fe–Mn chronohorizon that represents a stratigraphic interval coinciding with the condensation of time. The measurement points marked in green apply to δ13Ccarb data.
Minerals 11 00420 g003
Figure 4. Correlation of Late Cenomanian–Early Turonian δ13Corg events between Outer Carpathian basins, Umbria–Marche Basin, Central Atlantic, and southern peri-Tehyan shelf. The curves representing Outer Carpathian sections are compared using chemostratigraphic markers with age-calibrated sections from other regions. Note that “B” and “C” markers (positive peaks) correspond to “I” and “III” chemostratigraphic indices sensu [44]. Marker “E” (negative shift) lying close to the Cenomanian–Turonian boundary (CTB) in Tethyan, peri-Tethyan and Atlantic sections is not present in studied succession. The first horizon of the Fe–Mn layer (blue bundle) which overlies Bonarelli-equivalent Level is a regional chronostratigraphic marker displaying onset of oxic conditions in Carpathian domain of Western Tethys. This layer representing an interval of stratigraphic condensation is correlated with the CTB recognized in Gubbio, Site 1258 and Bahlul sections.
Minerals 11 00420 g004
Figure 5. The selected deep-water and neritic sections containing the organic-rich facies in the CTBI, interpreted on the basis of the carbon stable isotope data. Palaeogeographical map of the Western Tethys after [65]. Carbon isotope curves after [44,51] (Pueblo), [44] (Wadi Bahlul), [53,54] (Calabianca), [48] (Site 1285), [45] (Gubbio, Tarfaya), [62] (Site 550), [46] (Lambruisse), [52] (Rehkogel graben), this article (Barnasiówka, Outer Carpathians). SB–Silesian Basin.
Minerals 11 00420 g005
Publisher’s Note: MDPI stays neutral with regard to jurisdictional claims in published maps and institutional affiliations.

