Article

Beneficiation Studies of the Low-Grade Skarn Phosphate from Mactung Tungsten Deposit, Yukon, Canada

1
Department of Chemical and Materials Engineering, University of Alberta, Edmonton, AB T6G 1H9, Canada
2
Northwest Territories Geological Survey, Yellowknife, NT X1A 1K3, Canada
*
Author to whom correspondence should be addressed.
Minerals 2021, 11(4), 421; https://doi.org/10.3390/min11040421
Submission received: 18 February 2021 / Revised: 8 March 2021 / Accepted: 12 March 2021 / Published: 15 April 2021
(This article belongs to the Section Mineral Processing and Extractive Metallurgy)

Abstract

:
A preliminary beneficiation study of low-grade skarn phosphate rocks from Mactung tungsten deposit, along the Yukon and Northwest Territories border in Canada, was carried out through standard Bond Work Index, grinding test and laboratory batch flotation tests. The skarn phosphate sample assayed 12.65% P2O5 (about 30% apatite), 31.71% CaO and 35.46% SiO2. The main gangue minerals included calcite, quartz, calc-silicates, amphibole, feldspar, and pyrrhotite. The sample had a Bond Work Index of 19.04 kWh/t, belonging to a hard ore category. The beneficiation study of the skarn phosphate sample was carried out using “direct–reverse flotation” method. The direct flotation was carried out using sodium carbonate, sodium silicate solution (water glass) and sodium oleate. Sulfuric acid and phosphoric acid were used in the reverse flotation of the carbonate gangue. One phosphorous rougher flotation, one bulk cleaner flotation and one carbonate reverse flotation at ore grind size of 86% passing 53 µm led to a phosphate concentrate assaying 28.68% P2O5, 12.06% SiO2, 0.72% MgO and 46.98% CaO, at a P2O5 recovery of 70.9%.

1. Introduction

Phosphorous (P), located in the 15th position of the periodic table, is one of the most indispensable non-metal elements in life. Its oxidized form, phosphates (PO43−), plays essential roles in DNA, RNA and ATP structural building, which are vitally important for the growth and development of each and every organism on the planet Earth [1]. One of the principal industrial applications of phosphorous is the manufacture of fertilizer for the agricultural sector [2]. As it cannot be replaced by other nutritional elements in plant growth, phosphorous is an essential component of global food security and related world affairs [3]. As a result, phosphate minerals have been recognized as a critical and strategic natural resource by the European Union and United States [4,5].
Phosphorous occurs naturally as phosphate due to its high reactivity [6]. Its natural sources include igneous apatite, sedimentary phosphorite, biogenic, and their weathering residuum [1,7]. Sedimentary phosphorite accounts for over 80% of global production while the remainder comes from igneous rocks and other subordinate sources [8]. According to the U.S. Geological Survey, although there are no imminent shortages of phosphate rocks globally, the high-grade and easy-to-process phosphate reserves are highly segregated geographically [9]. For example, Morocco and its occupied Western Sahara alone controls about 71% share of phosphate reserves. This is followed by China, Algeria, Syria, Brazil, South Africa and Saudi Arabia, which account collectively for 17% global phosphate reserves. Such an uneven distribution of such a critical resource could pose significant risks and uncertainties to other countries. Canada has a few known phosphate deposits and occurrences, including Lac à Paul, Wapiti, Fernie, and Mactung [10]. Although recognized as one of the largest agriculture producers and a top fertilizer manufacturer, Canada has been depending solely on imports of phosphate rocks from other countries after the only operating phosphate mine in Kapuskasing was shut down in 2013 [11,12]. To secure a domestic supply chain of phosphorous for her fertilizer industry, this paper describes a study of a phosphate mineralization spatially associated with the Mactung tungsten deposit.
The Mactung tungsten deposit is geographically located at latitude 63°17′ N and longitude130°10′ W, in the Selwyn Mountain Range, along the Yukon/Northwest Territories border. It is one of the world’s largest tungsten deposits, with an estimated indicated mineral resource of 33.0 Mt grading 0.88% WO3 and 11.9 Mt grading 0.78% WO3 in the inferred category [
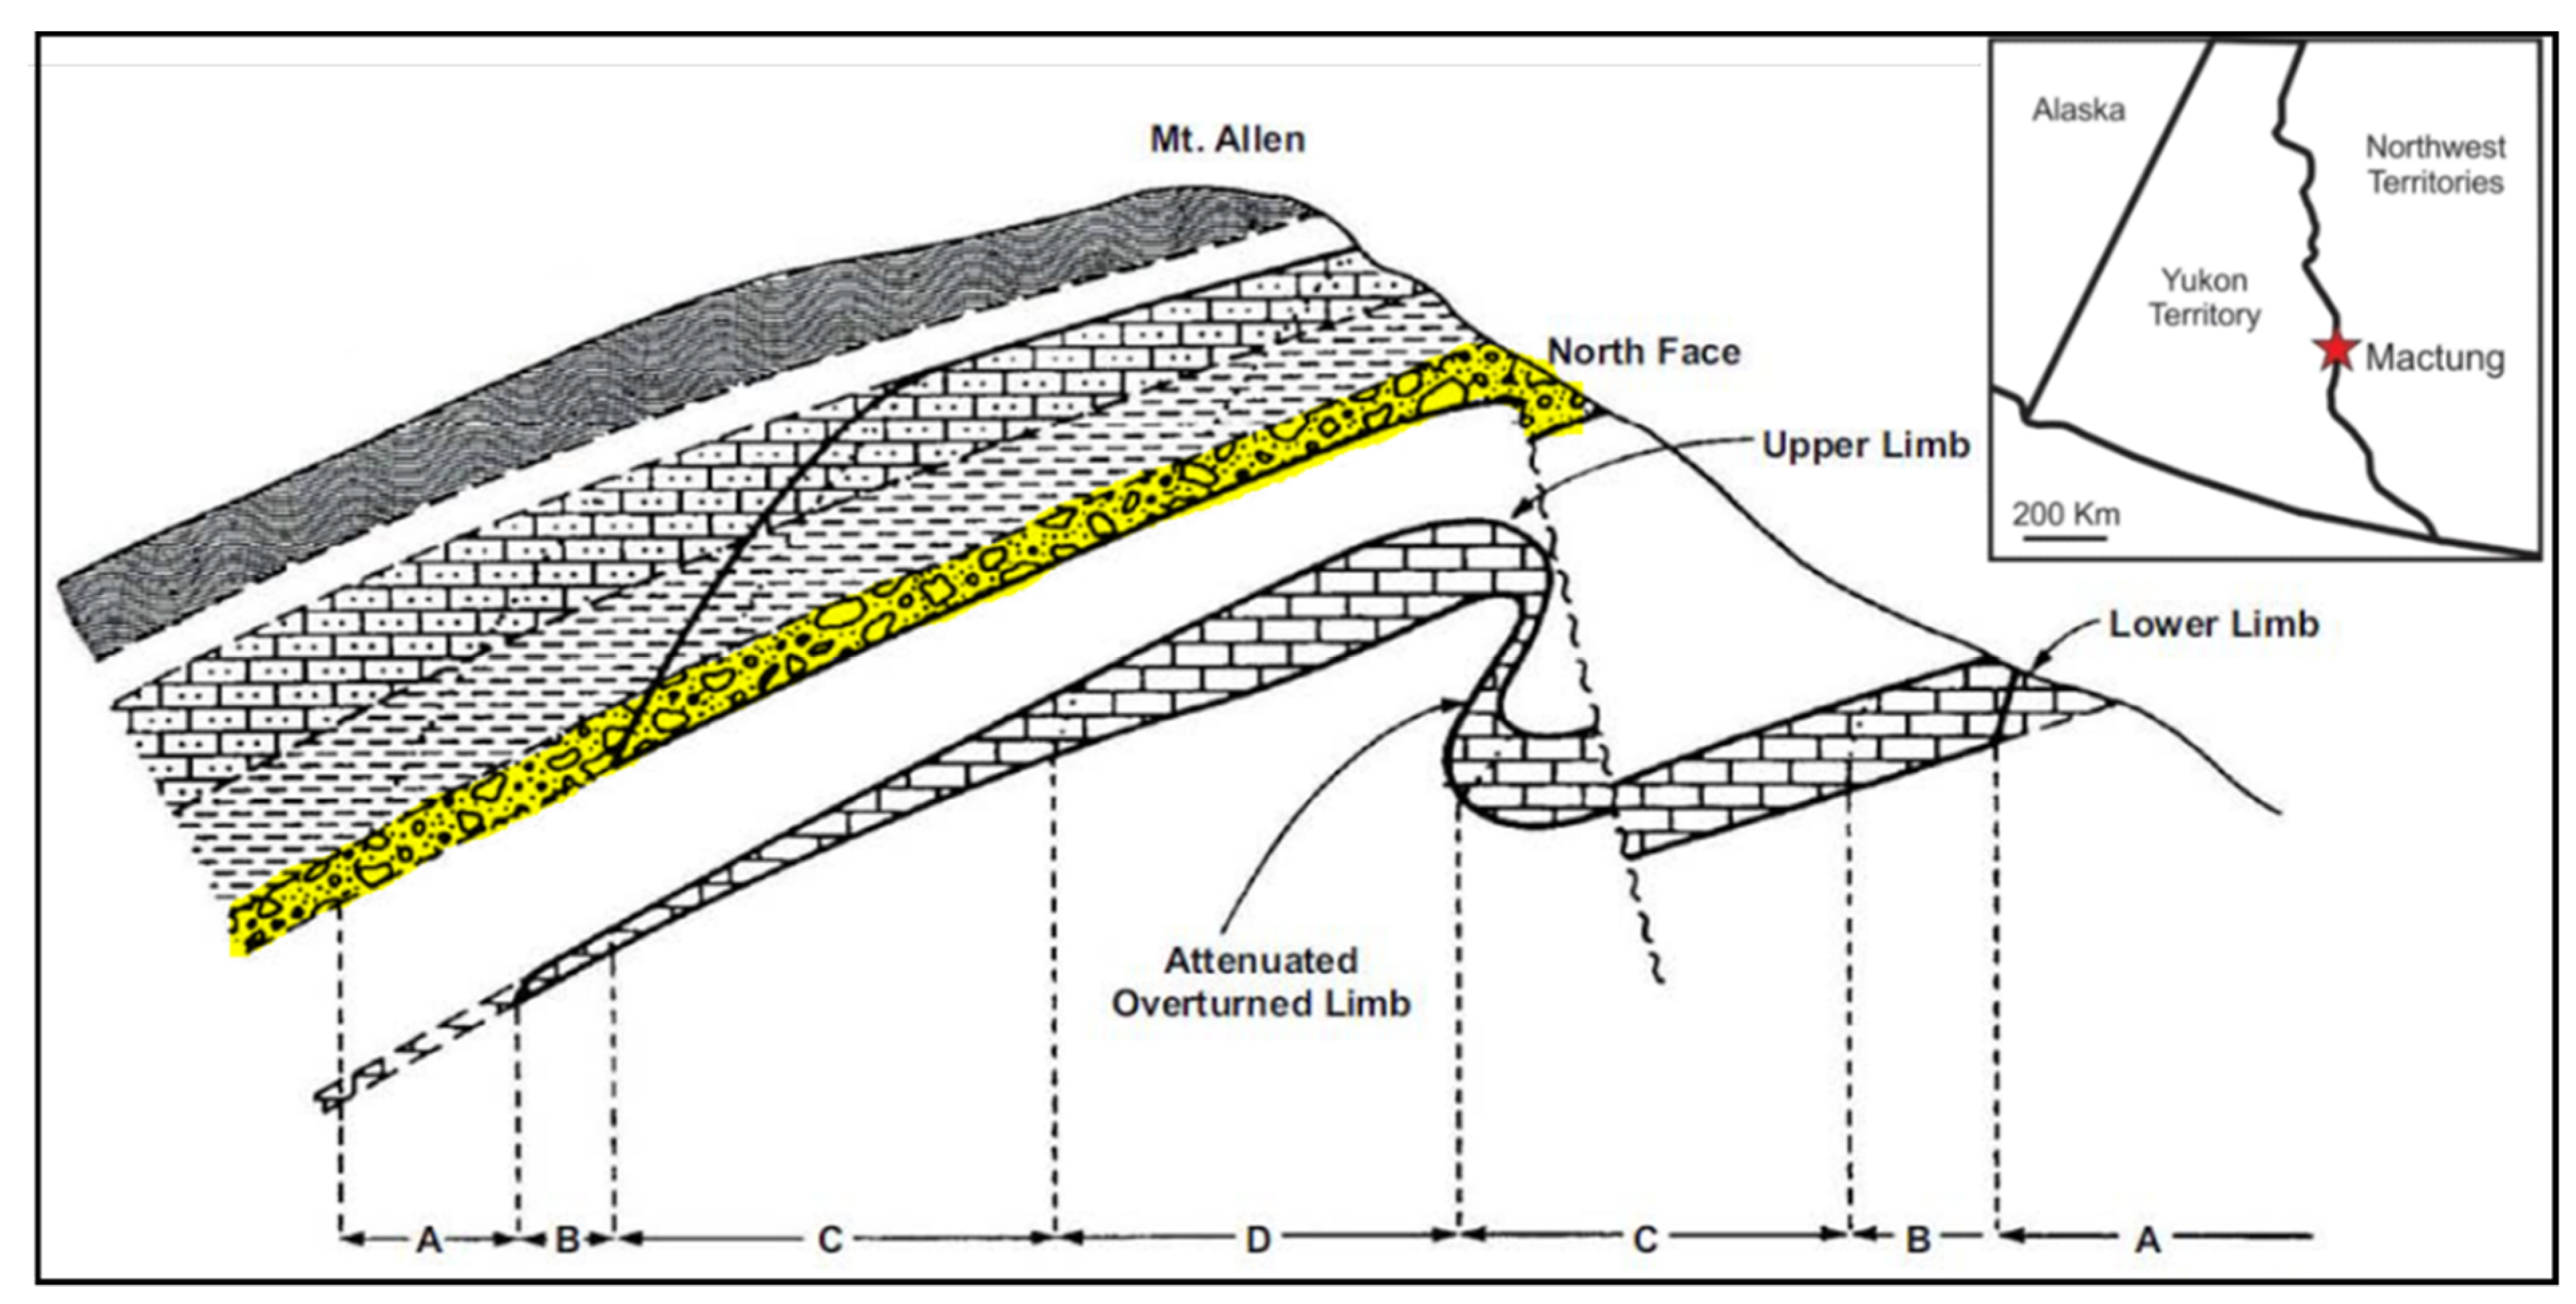
13]. The current mine plan targets the extraction of only scheelite-hosted tungsten, with no plan of processing the associated phosphate. The phosphate mineralization in Mactung is of sedimentary origin, formed by the precipitation of apatite from phosphorus rich water, mediated by microbial activity. The mineralization consists of nodular breccia clasts of cryptocrystalline apatite (“collophane”) in a limestone unit known as Unit 3D (highlighted in Figure 1). The phosphate mineralization spatially overlaps and extends beyond the skarn tungsten deposit. More than 50 million tons of phosphate resources grading at 10 wt% P2O5 on average has been estimated in Unit 3D within a 4 km2 area around the tungsten deposit.
The phosphate coinciding spatially with the skarn tungsten deposit was thermally and metasomatically altered by subjacent Cambrian to Devonian igneous intrusions that formed the tungsten deposit; and it is thus referred to as skarn phosphate and is the focus of this study. Unlike typical sedimentary phosphorite that are associated mainly with sedimentary carbonate minerals, skarn phosphate deposits contain significant non-carbonate minerals with diverse textures [14]. The alteration of the phosphorite in Mactung resulted in the recrystallization of both the phosphate and carbonate minerals as well as the introduction of new mineral phases including calc-silicates and sulfides [13]. The challenges associated with the presence of these ‘exotic’ mineral phases are probably some of the key reasons the mine is not envisaging processing the phosphorite even though it would be mined together with the tungsten ore. This makes the study interesting both scientifically and economically.
Retaining the phosphate in the mine tailings, however, could result in future environmental liabilities from any leakage into the aquatic ecosystem. Although hydroxyapatite is considered the most stable phosphate salt under most conditions in nature, its solubility can be significantly enhanced by acid mine drainage from the supergene oxidative breakdown of iron sulfides in the tailings [15]. The presence of enhanced phosphorous concentration in drainage systems has been associated with many negative environmental impacts including eutrophication of lakes and algae bloom that may cause fish die-offs, which is strictly prohibited by environmental regulations [16]. In addition, the current mineral beneficiation infrastructures setup for the tungsten concentration at Mactung could substantially reduce the financial cost for phosphate project. Flotation reagents, such as fatty acids, soda ash, sodium silicate and frother, which are used in scheelite flotation can be used in phosphate flotation as well [13,17,18]. Therefore, it is necessary to develop a management plan for phosphate at Mactung property, which could involve phosphate ore processing for downstream industrial applications.
Flotation is the common technique widely used in the industry for the beneficiation of phosphate rock [19]. Based on the types of collectors (anionic fatty acids or cationic amines) used in the process, the phosphate flotation techniques can be divided into (1) all-cationic flotation [20]; (2) all-anionic flotation [21] and (3) cationic-anionic (or anionic-cationic) flotation [22,23,24]. These flotation methods were technically known, respectively, as direct flotation, reverse flotation, direct-reverse flotation or reverse-direct flotation, depending on the types of ores and nature of gangue minerals [25]. Direct and reverse flotation processes have been successfully applied in the beneficiation of siliceous and calcareous phosphate rocks, respectively [26]. A direct-reverse flotation process has been suggested for low-grade phosphate rocks containing both silicate and carbonate gangue minerals [25]. In this process, the first step is designed to float as much phosphate as possible using anionic fatty acid salts as a collector, with the slurry pH maintained at 9–10 using soda ash, and water glass as a silicate depressant. In the second step, i.e., reverse flotation, carbonate gangues (mostly calcite and/or dolomite) is selectively floated off the phosphate concentrate from the first stage to obtain a qualified final phosphate product [27]. Although the separation efficiency has been a scientific challenge due to their similar physiochemical properties [22,28,29], research has shown that slightly acidic conditions adjusted by combined sulfuric acid and phosphoric acid could enhance the flotation efficiency [30,31,32,33].
The aim of the current study was to examine the feasibility of beneficiating the skarn phosphate mineralization associated with Mactung tungsten deposit into a concentrate that could be used to manufacture fertilizer (>30% P2O5, CaO/P2O5 < 1.6, and MgO < 1%). Given the low-grade nature of the ore and its mineralogical composition, a flowsheet comprising both direct and reverse flotation was used. Other parameters evaluated include the Bond Work Index, grinding test and mineralogical composition.

2. Materials and Methods

2.1. Ore Samples

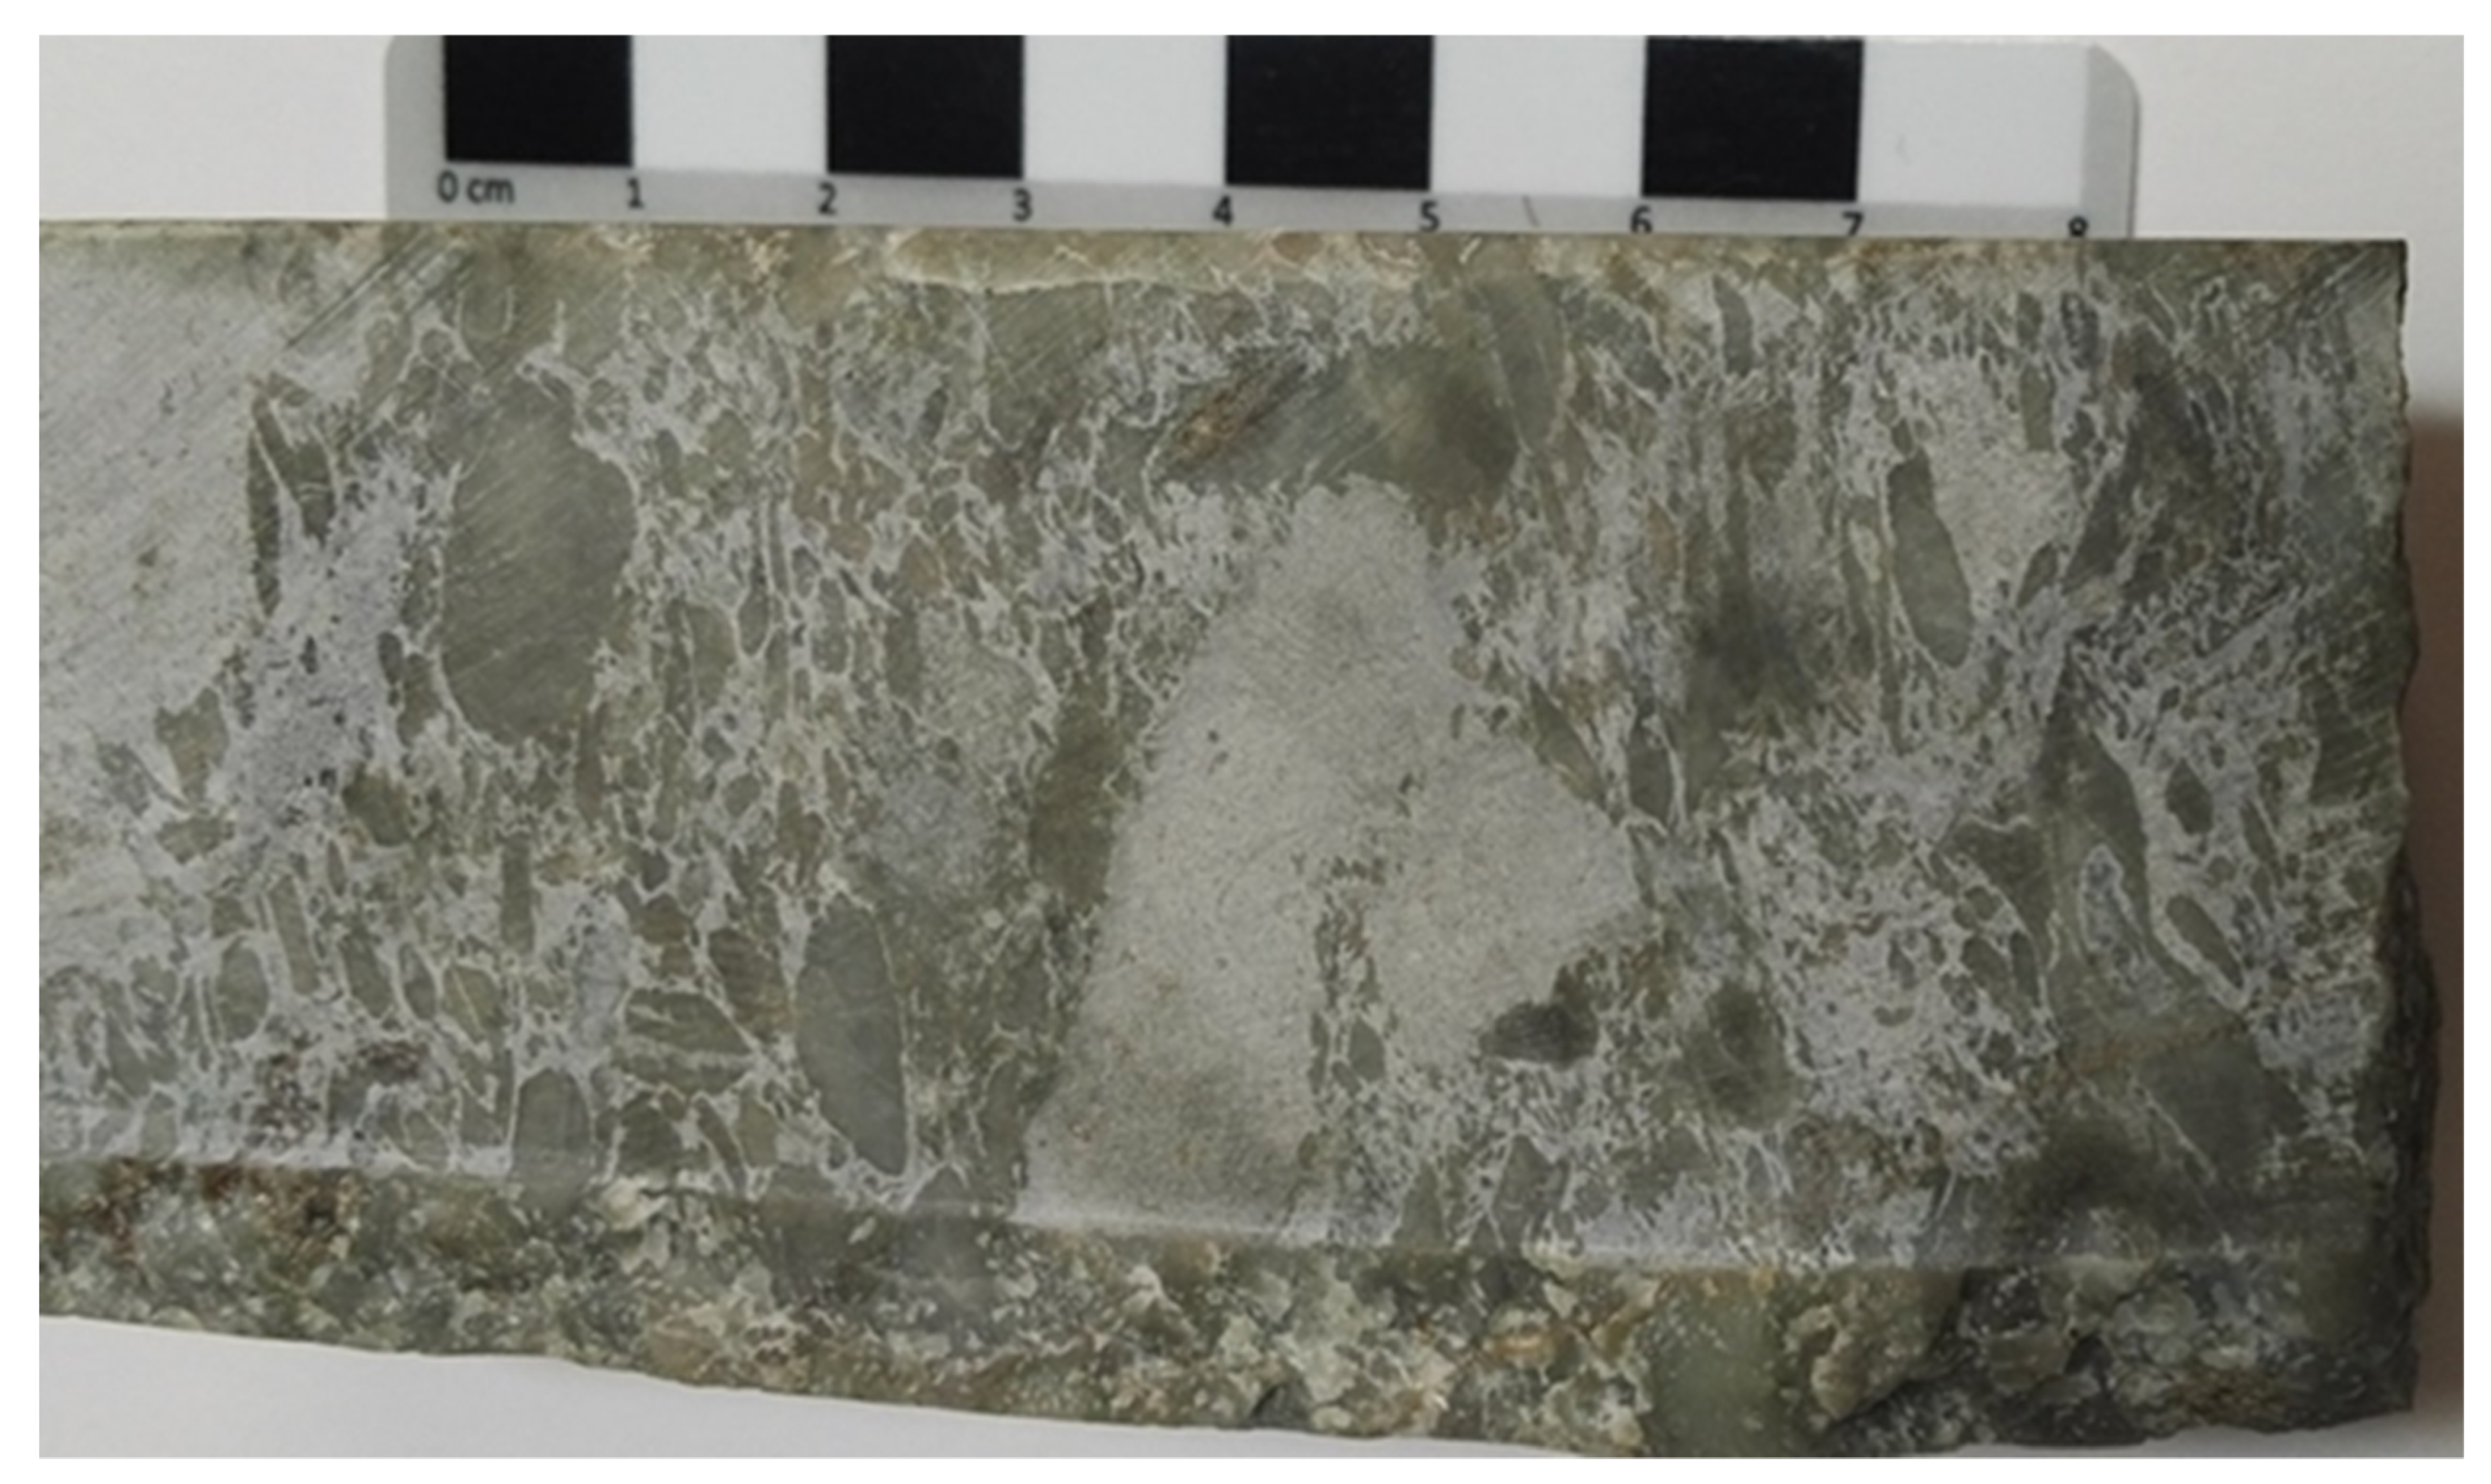
A composite skarn phosphate rock sample was collected from cores of drill holes MS164 and MS211 that intercepted mine Unit 3D containing skarn phosphate mineralization. The samples were selected based on assay results from prior exploration programs and visual observation because phosphatic clasts are visible on cores and outcrops (Figure 2). The sample was crushed in a Retsch model BB200 laboratory jaw crusher to −6 mesh (−3.35 mm), riffled into 500-g charges and stored in sealed plastic bags for beneficiation and analysis.

2.2. Reagents

Sodium oleate (NaOl; ≥82% oleic acid basis) was purchased from Sigma-Aldrich (Saint Louis, MO, USA) and was used as an anionic collector in the phosphate flotation without any further purification. Potassium amyl xanthate (PAX) at 80% purity was obtained from Prospec Chemicals (Fort Saskatchewan, AB, Canada) and was used as a sulfide mineral collector to remove sulfide minerals. Methyl isobutyl carbinol (MIBC) bought from Sigma-Aldrich was also used as a frother in sulfide flotation stage. Sodium silicate solution (water glass) with a modulus of 1.82 from Sigma-Aldrich was used to depress quartz and silicate minerals. Analytical grade sodium carbonate, sulfuric acid and phosphoric acid were purchased from Fisher Chemical (Waltham MA, USA) and used to adjust the pulp pH.

2.3. Bond Work Index

The Bond Work Index (grindability) of skarn phosphate rock sample was determined in a laboratory 8″ × 8″ ball mill using a 100 mesh (150 μm) test sieve, with proper scaling factors for the standard 12″ × 12″ ball mill.
The Bond Work Index was calculated using the following equation:
W i = 4.45 P 1 0.23 ( f · G ) 0.82 ( 1 P 1 F )
where Wi is the Bond Work Index for a given material (kWh/t); P1 is the test sieve opening size in μm; F is the size in μm at which 80% of feed passes; P is the size in μm at which 80% of the last cycle sieve undersize product passes; f is the scale up factor from 8″ × 8″ to a standard 12″ × 12″ ball mill, f = ( 12 8 ) 3 = 3.375 . G is the ball mill grindability (gram/revolution), which was averaged from the last three grinding cycles (equilibrium grinding condition) to simulate 250% circulation load, at equilibrium grinding condition. The equilibrium condition was usually achieved after 6–12 cycles until a constant grindability value was reached.
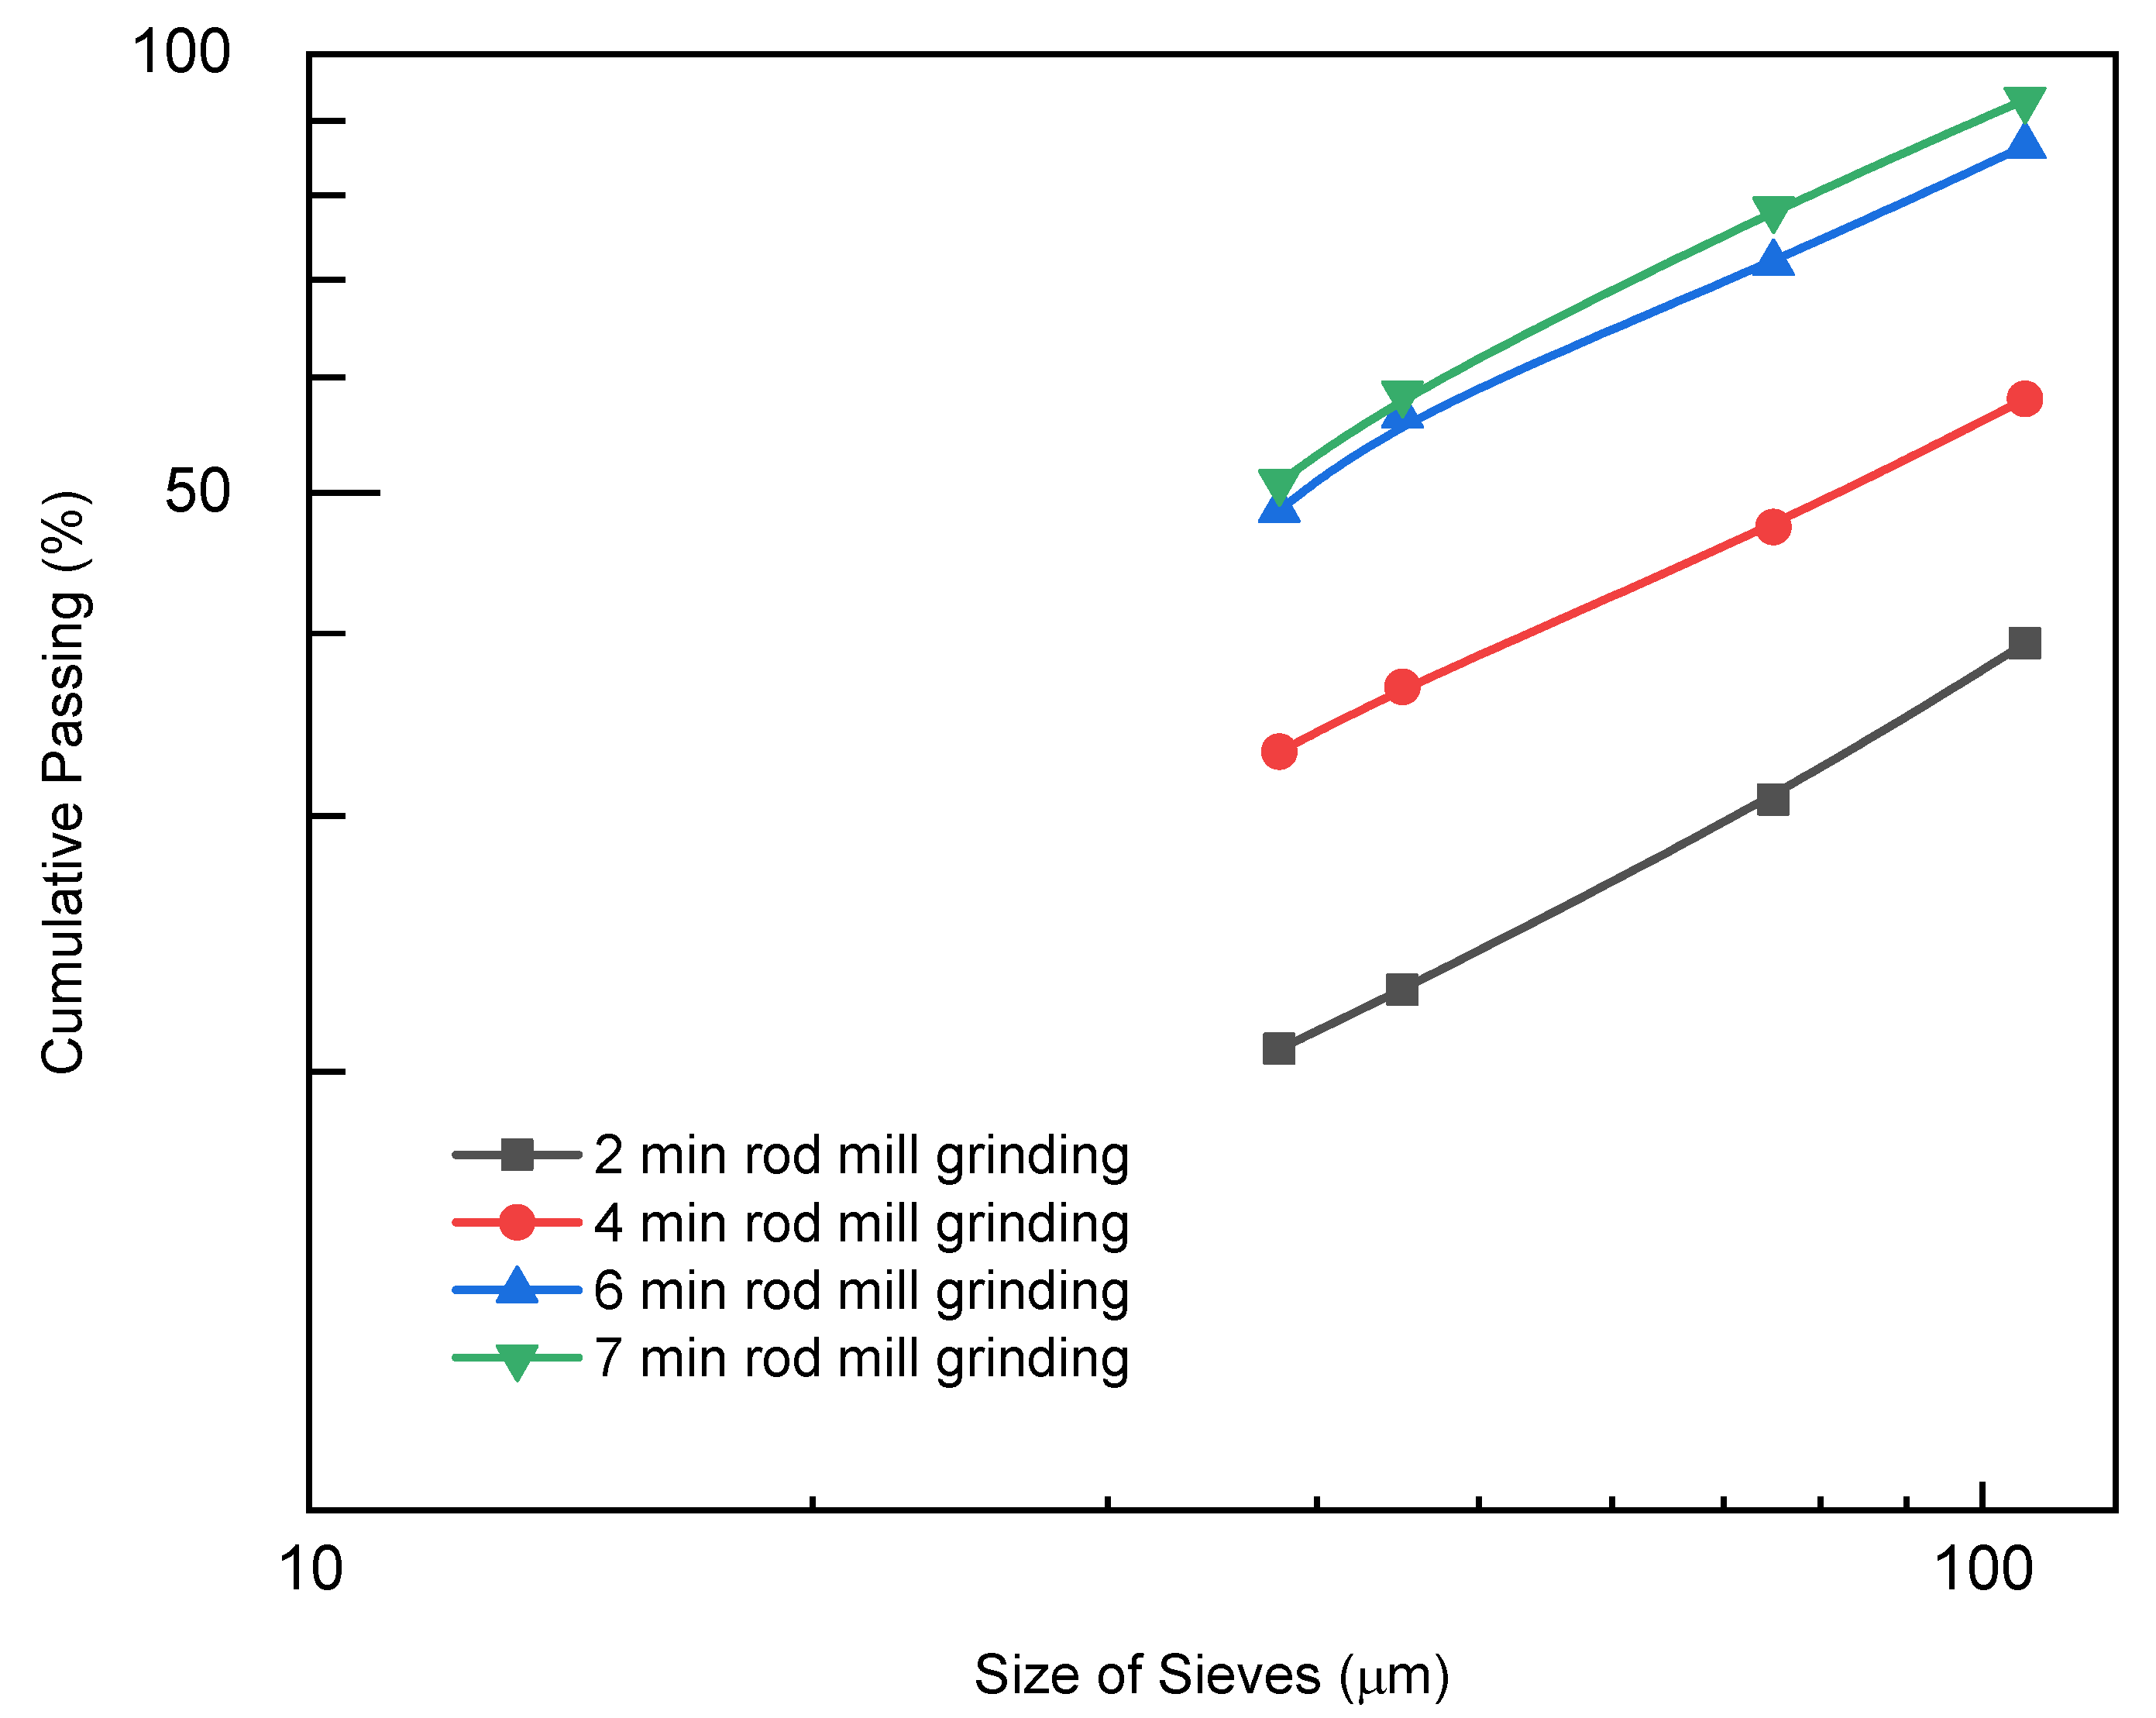
2.4. Grinding

A grinding test was carried out using a Titan 8 × 16-inch stainless steel laboratory rod mill, with 24 stainless steel rods of various diameters having a total weight of 15.8 kg. The phosphate rock sample was ground in batches of 500 g with 200 mL of tap water. A slurry was washed into a 1.5 L flotation tank with 800 mL tap water after grinding for 2, 4, 6, and 7 min, and agitated at 800 rpm. About 100 mL sample of each slurry was wet sieved using 140, 200, 325, 400 mesh sieves (105 μm, 75 μm, 45 μm and 38 μm, respectively) to obtain the grind size distribution.

2.5. Froth Flotation

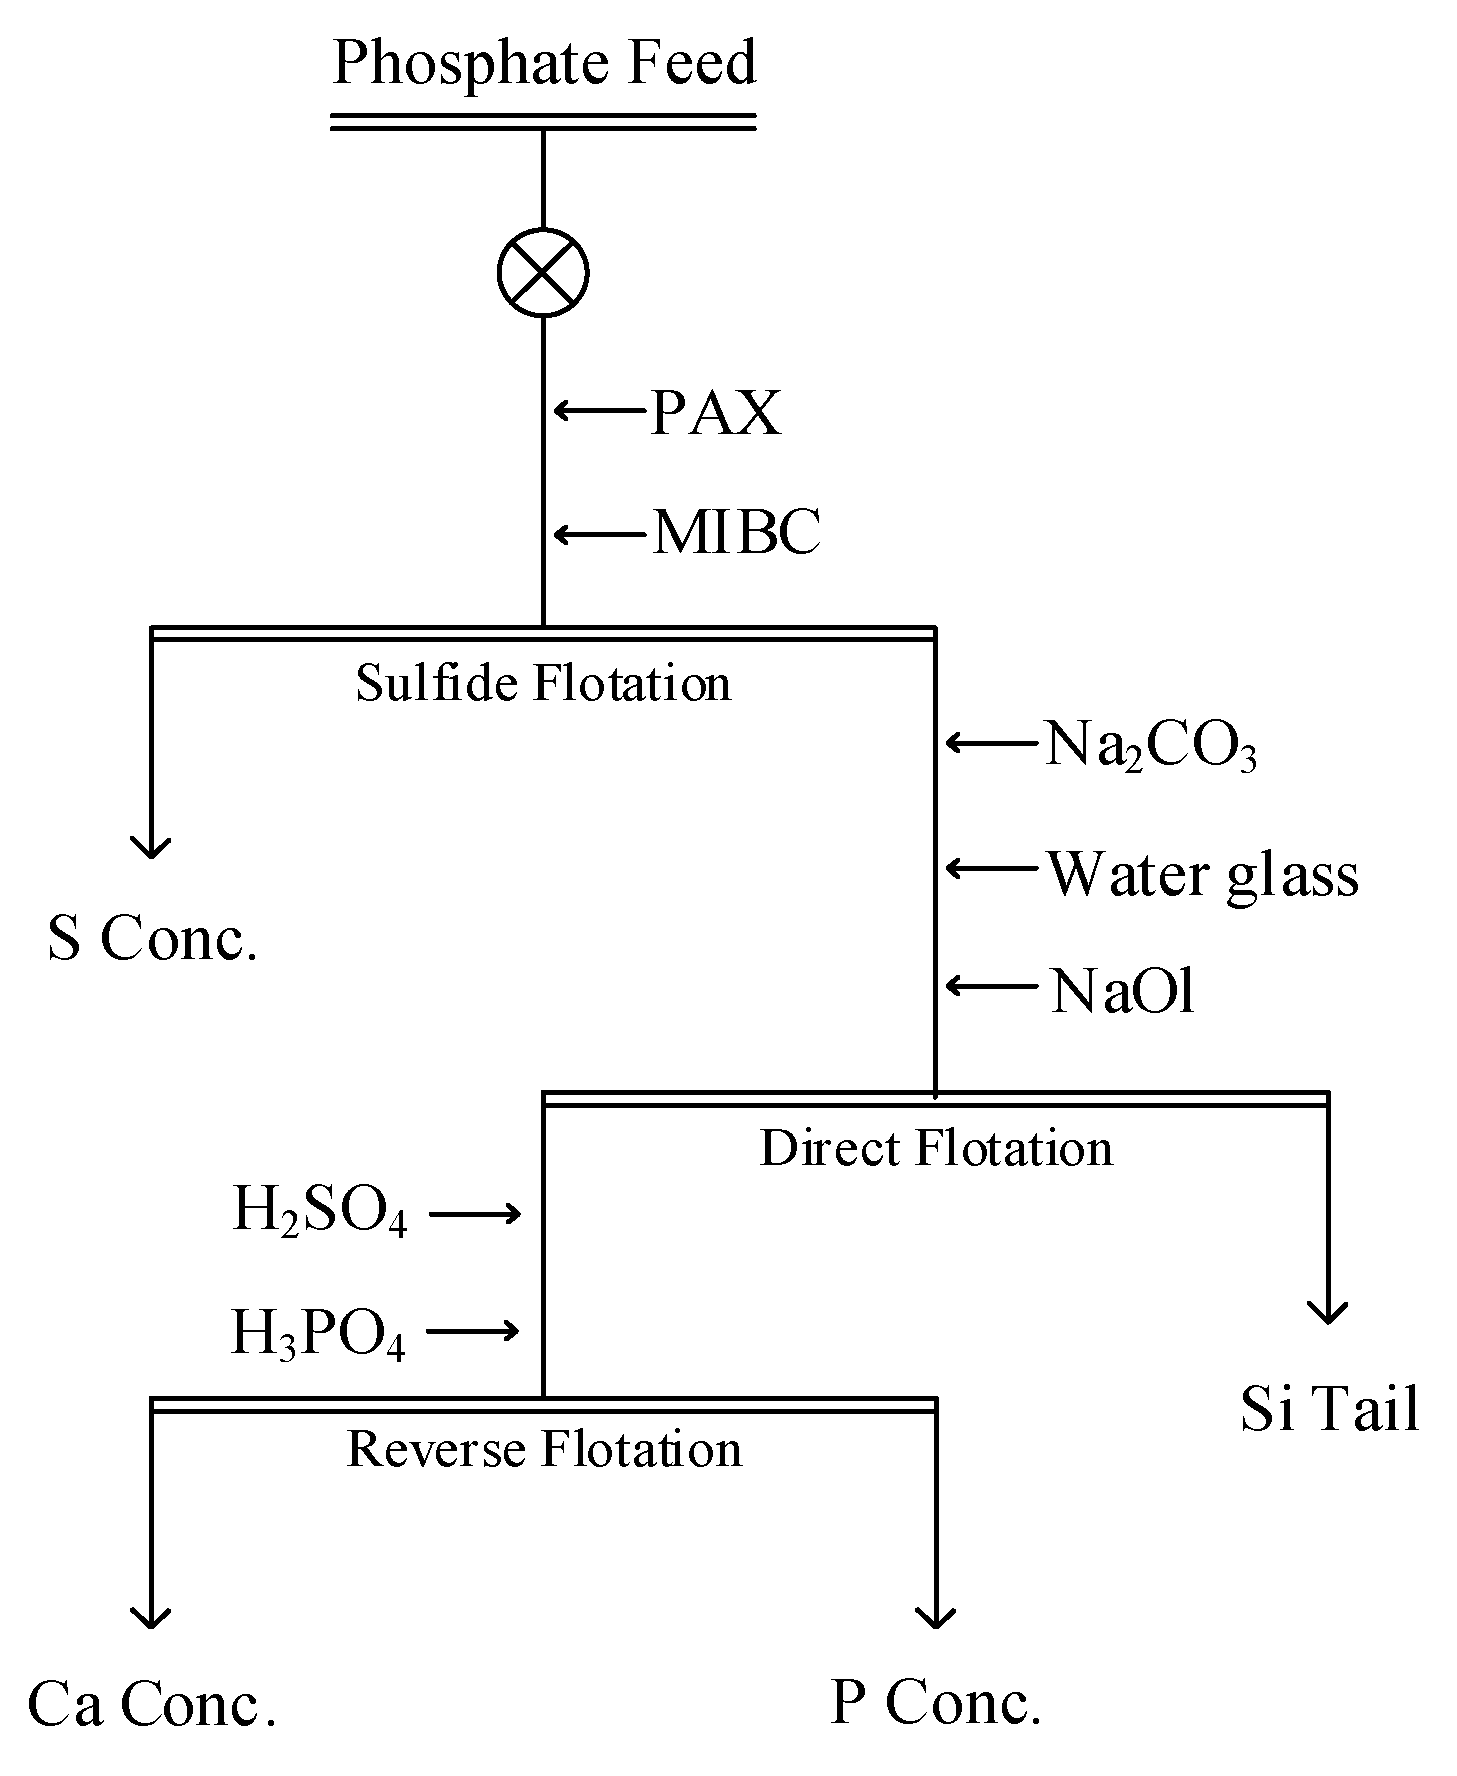
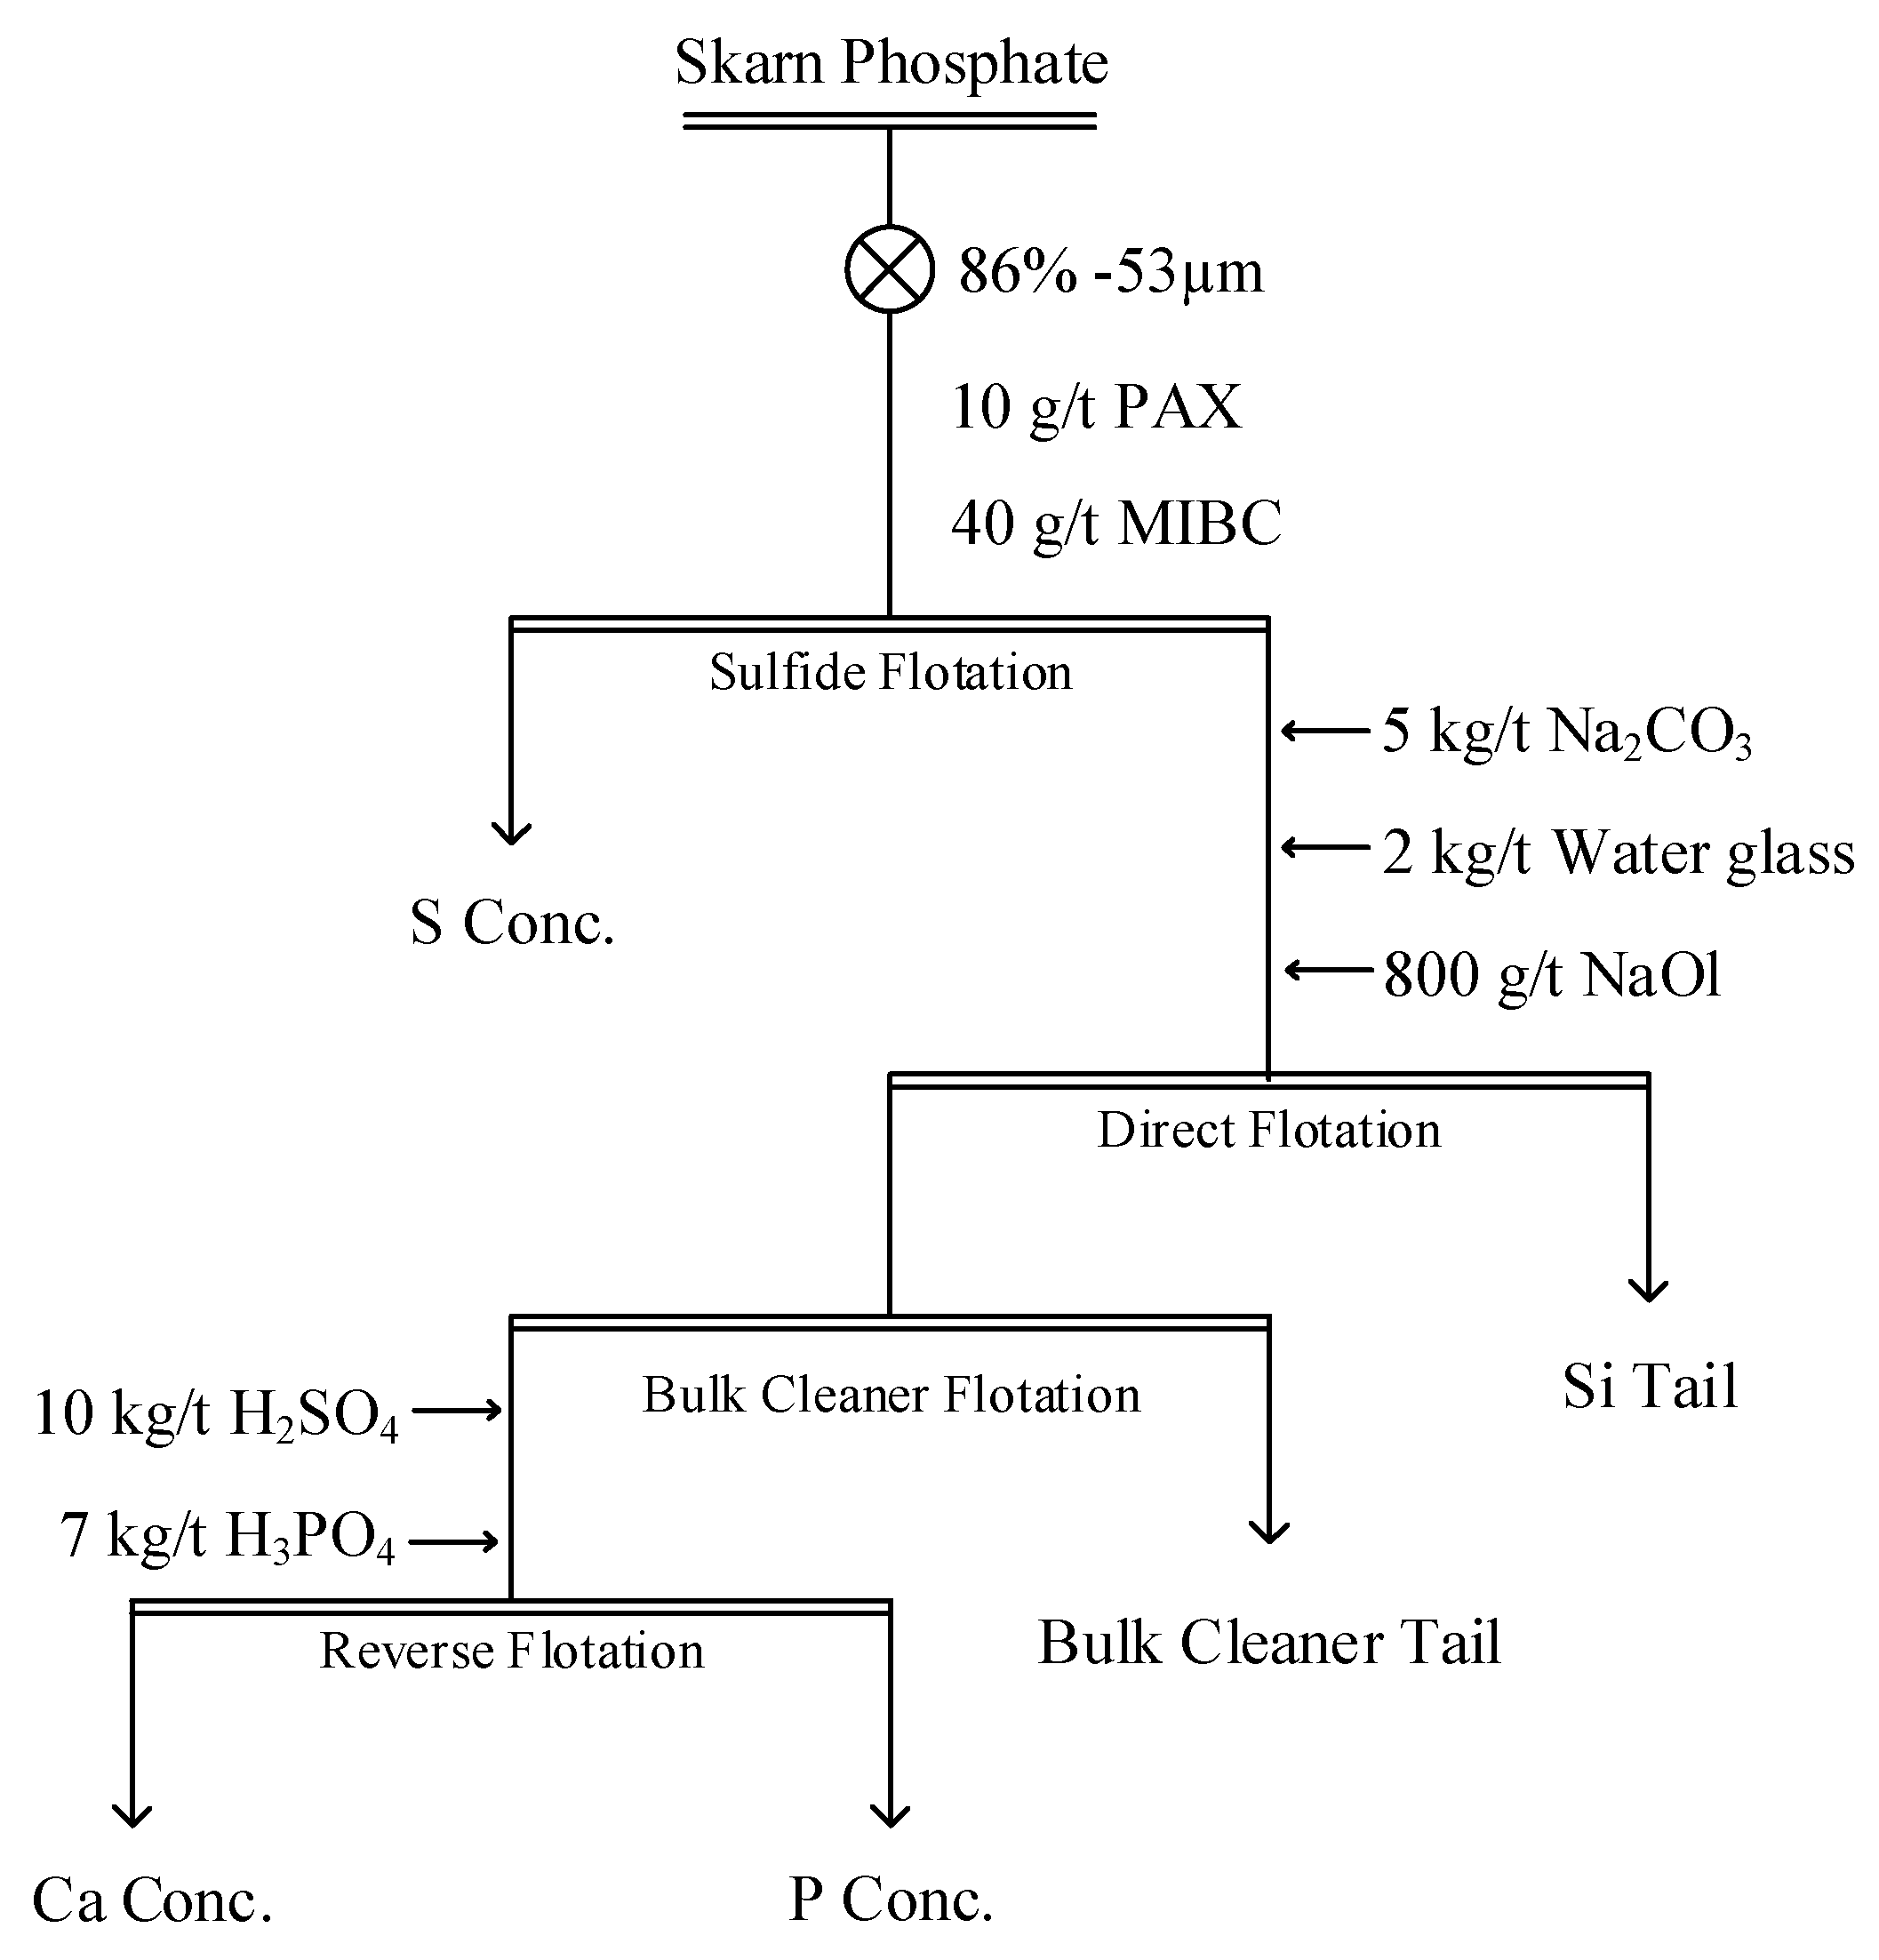
The phosphate rock sample was subjected to a direct flotation step followed by a reverse flotation step in a Denver D-12 laboratory flotation machine with a 1.5 L stainless steel flotation cell. A schematic flowsheet of the flotation process is shown in Figure 3. In each flotation test, 500 g of sample were added together with 1 L tap water, and operated at 800 rpm impeller speed and 3 L/min aeration rate during the flotation scraping. The first step in the flotation was the removal of sulfide minerals using potassium amyl xanthate (PAX) as a collector. This was followed by the direct flotation of apatite and carbonate minerals in alkaline condition using an anionic sodium oleate collector and water glass as a quartz/silicate depressant. Subsequently, a reverse flotation step was carried out on the direct flotation concentrate to float carbonate gangue minerals in acidic conditions adjusted by sulfuric and phosphoric acids. To acquire a higher P2O5 grade in the phosphate concentrate, in some tests, a bulk cleaner flotation was performed after the direct flotation.

2.6. Sample Analysis

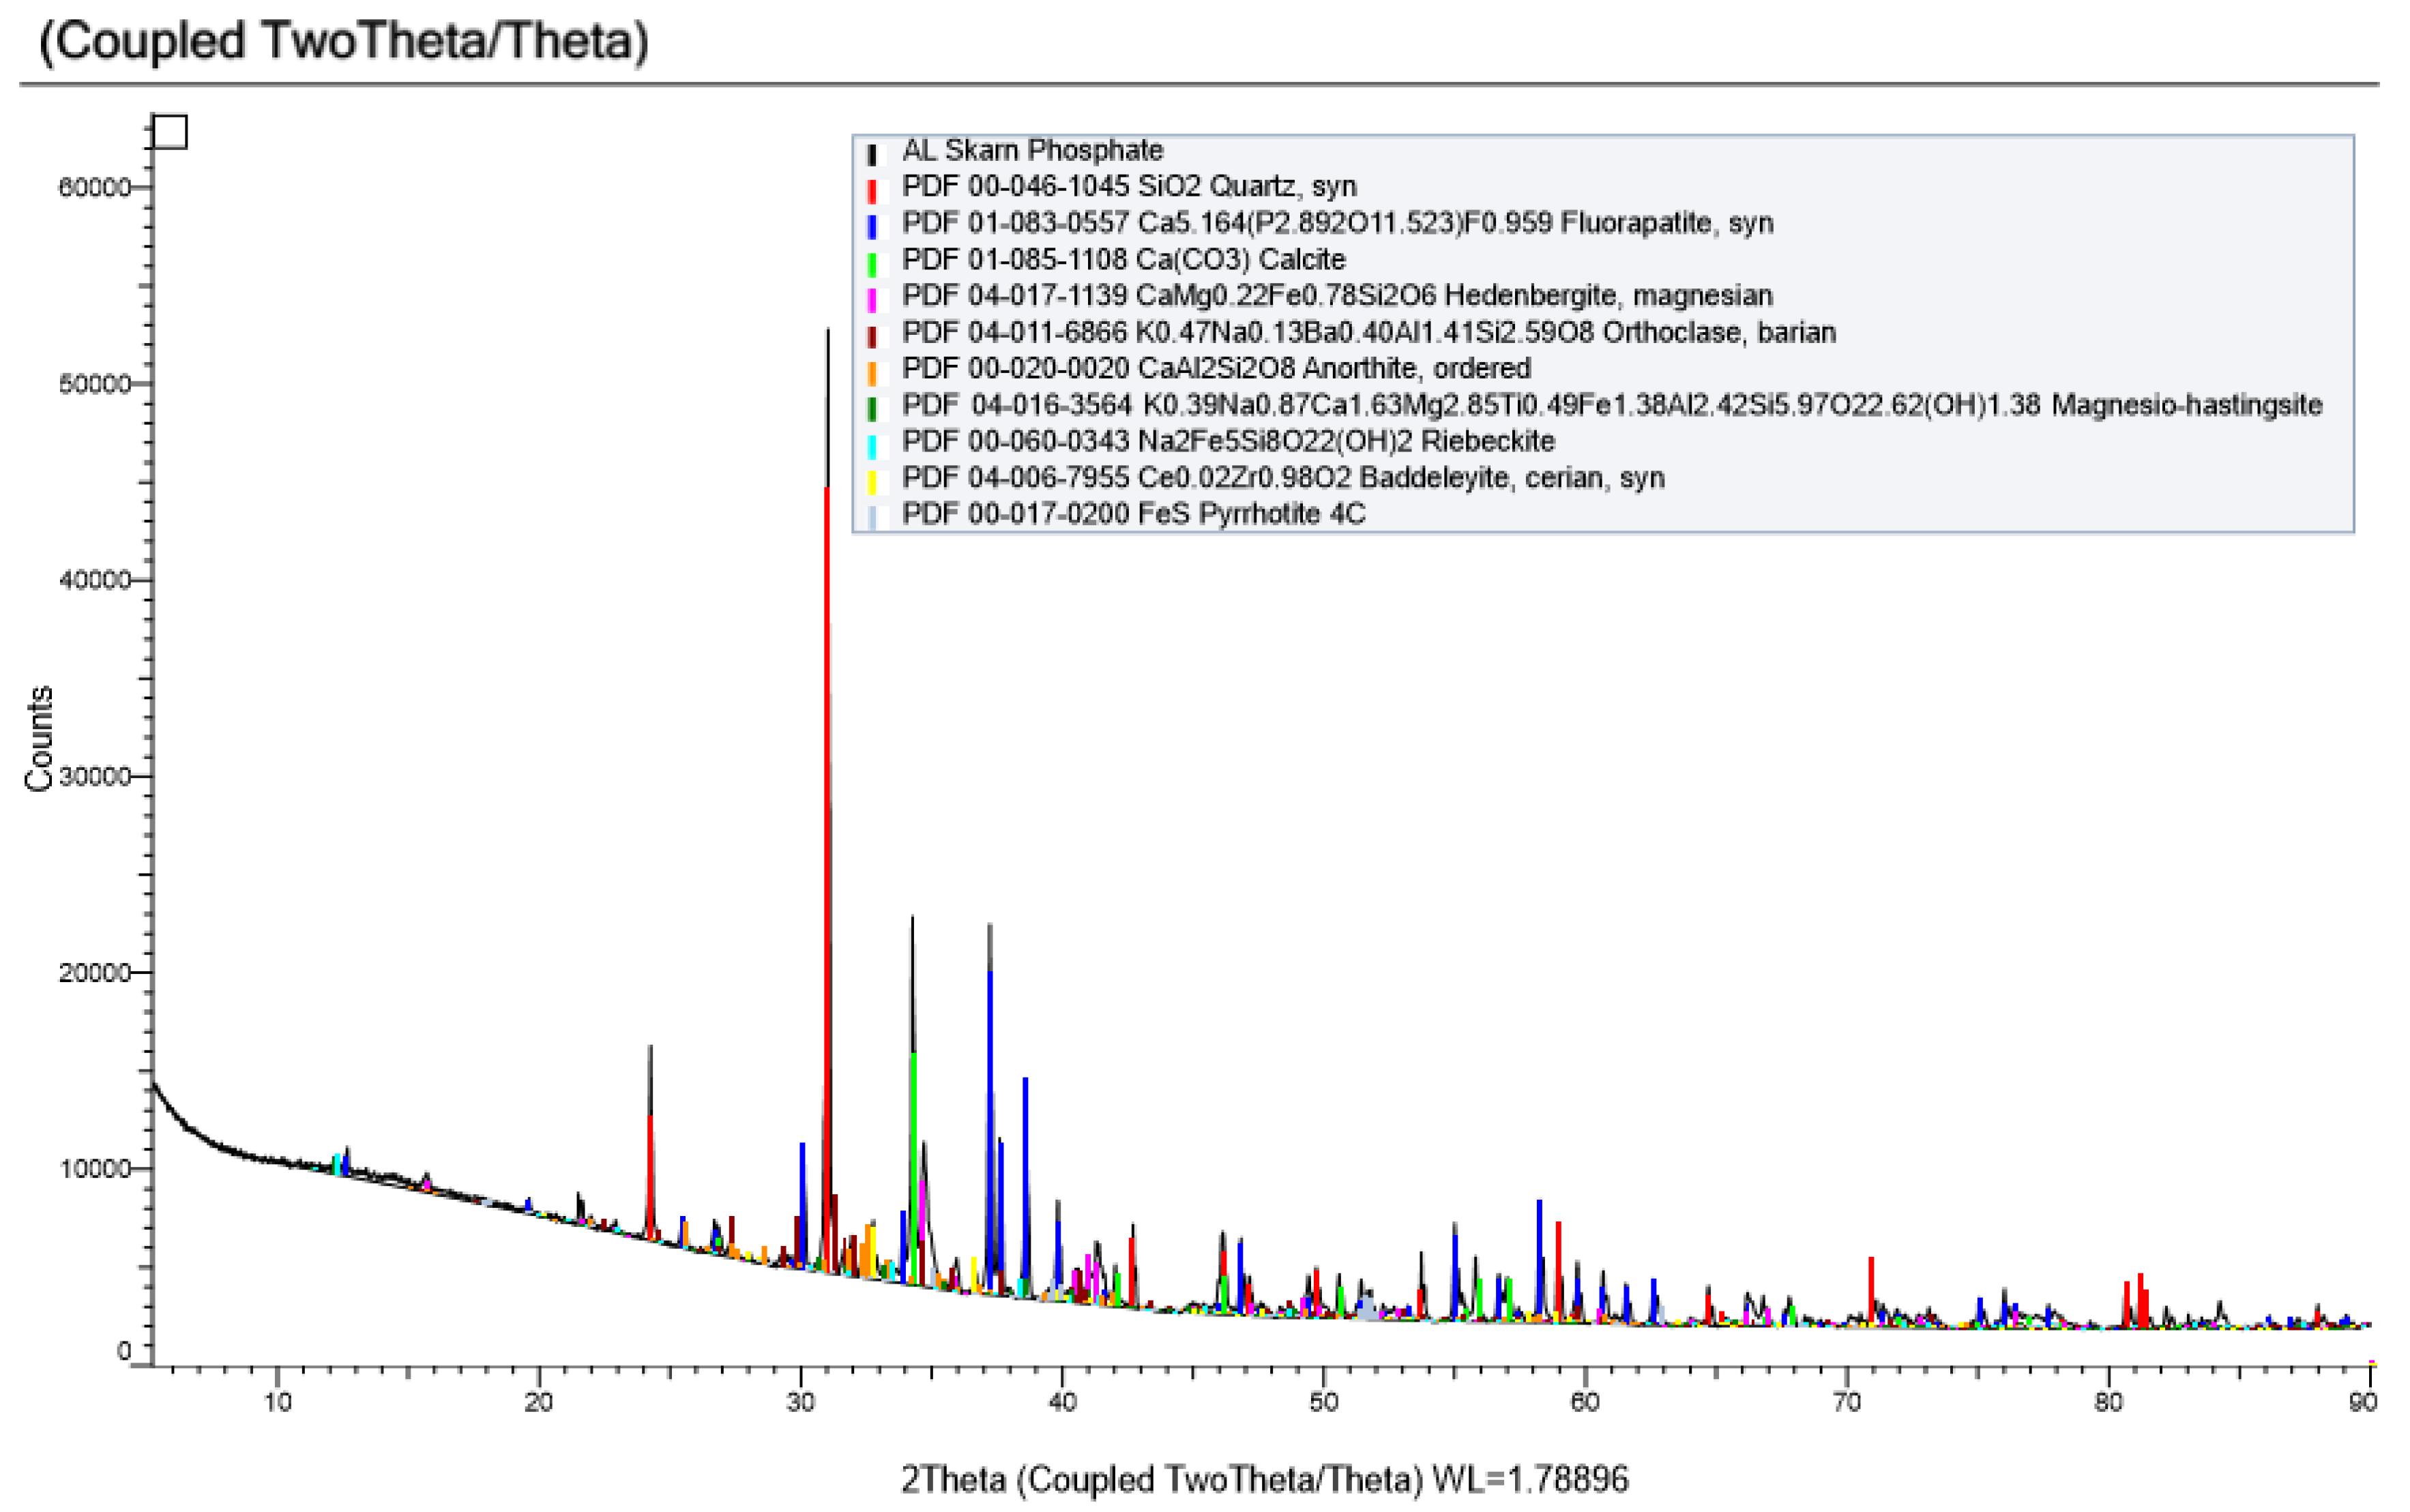
A pulverized head sample of the skarn phosphate rocks was analyzed for major elements at Bureau Veritas Commodities Canada Ltd. (Richmond, BC, Canada), a Vancouver-based commercial assay laboratory. The mineralogical composition of the sample was characterized by X-ray diffraction (XRD) using a Rigaku Ultima IV operated at 38 kV, 38 mA and 2 degree/min scan rate at the Department of Earth and Atmospheric Sciences, University of Alberta. The flotation products were analyzed in-house using a Bruker CTX800 countertop X-ray Fluorescence analyzer (Bruker, Kennewick, WA, USA), with calibration packages provided by Bruker. Samples of selected products were also analyzed at Bureau Veritas Commodities Canada Ltd. The assay results in the text are identified as “XRF” or “BV” to differentiate those analyzed in-house (XRF) from those analyzed at Bureau Veritas Commodities Canada Ltd. (BV).

3. Results

3.1. Sample Characterization

The mineralogical composition of the phosphate rock was characterized by optical microscopy and powder X-ray diffraction (XRD). Collophane, a cryptocrystalline apatite, is found to be the main phosphate mineral. The collophane occurs as poorly sorted, fine to coarse nodular slump breccia clasts with a calcitic limestone-dominated matrix (Figure 2). The collophane has a greyish to light green color, unlike in the unskarned ore where it is black to bluish-black [34]. The sample also contains trace amount of rare earth element Ce that exists in the baddeleyite mineral. Other gangue phases include quartz, pyrrhotite, anorthite, riebeckite magnesio-hastingsite, hedenbergite, and orthoclase (Figure 4).
The whole rock major and trace elements composition are shown in Table 1. The Bond Work Index of the ore is found to be 19.04 kWh/t, which falls in the hard ore category of the ore hardness index [35].

3.2. Grinding Test

The grinding tests were carried out with the 8 × 16-inch Titan laboratory rod mill described in Section 2.4. After 500 g skarn phosphate and 200 mL tap water were charged into the rod mill, the ore slurry was progressively ground in periods of 2, 4, 6, 7 min. The mill content was then removed and wet screened using 140, 200, 325, 400 mesh sieves (105 µm, 75 µm, 45 µm, and 38 µm), respectively. A relationship between grind time and product size distribution is shown in Figure 5.

3.3. Batch Flotation Tests

The batch flotation of the skarn phosphate rock sample was tested using “direct flotation–reverse flotation” method. The grinding-flotation experiment, reagent dosage optimization in the direct phosphorous flotation and reverse carbonate flotation were investigated.

3.3.1. Effect of Grind Size

The effect of sample grind size on the direct flotation of the skarn phosphate rock sample was carried out. The following reagent dosages were selected based on previous lab experience: 60 g/t potassium amyl xanthate and 40 g/t MIBC were added in sulfide flotation; 4 kg/t sodium carbonate, 3 kg/t sodium silicate solution, 400 g/t sodium oleate were added in the direct phosphate rougher flotation. The results are summarized in Table 2.
As can be seen, the decrease in grind size of skarn phosphate significantly enhanced the flotation performance at the tested reagent dosages. The best flotation result was observed in test SP-3 with a grind size of 86% passing 53 µm. Further decrease in ore grind size was not tested due to cost-effectiveness consideration. The subsequent batch flotation tests were carried out using the 86% passing 53 µm grind size.

3.3.2. Direct Phosphate Rougher Flotation

The Effect of Sodium Carbonate

The effect of sodium carbonate on the batch flotation of skarn phosphate was tested at a grind size of 86% passing 53 µm. The dosages of sodium silicate and sodium oleate were fixed at 3 kg/t and 400 g/t, respectively. The results are shown in Table 3.
The best flotation response was achieved through direct flotation of phosphate using 5 kg/t sodium carbonate. The P2O5 recovery increased by about 10 percentage points while P2O5 grade remained the same (compare SP-3 and SP-4). A further increase in sodium carbonate dosage resulted in a decrease in both P2O5 grade and recovery.

The Effect of Sodium Silicate and Sodium Oleate

The optimal dosages of sodium silicate and sodium oleate were determined in batch flotation tests SP-4, SP-6 to SP-8. The detailed flotation reagents and corresponding dosages used in the tests are listed in Table 4 and the flotation results are summarized in Table 5.
As can be seen in Table 5, 400 g/t sodium oleate was not sufficient in collecting the phosphate mineral. The P2O5 recovery was increased from 73% to 80% and the P2O5 grade from 20.16% to 21.55% when sodium oleate dosage was increased from 400 g/t to 600 g/t (compare SP-4 and SP-6). When the dosage of sodium silicate was decreased from 3 kg/t to 2 kg/t (compare SP-6 and SP-7), the P2O5 grade of froth concentrate decreased slightly by about 1 percentage point, but the P2O5 recovery increased by four percentage points. Therefore 2 kg/t sodium silicate was a suitable dosage as the silicate depressant used in the flotation. Further increase in the dosage of sodium oleate to 800 g/t led to additional increase in P2O5 recovery by three percentage points while P2O5 grade remained similar (compare SP-7 and SP-8). Therefore, 800 g/t sodium oleate was appropriate in the flotation of skarn phosphate. 800 g/t sodium oleate and 2 kg/t sodium silicate obviously resulted in a higher quartz/silicate entrainment and a poor phosphate concentrate. However, a bulk cleaner flotation following phosphate rougher flotation lowered the quartz/silicate recovery to the phosphate concentrate from about 25% to 13% while increasing the bulk phosphate concentrate grade by two percentage points and lowering the P2O5 recovery by about six percentage points. A bulk cleaner phosphate flotation was necessary, and it was therefore used in the subsequent tests.
In conclusion, 5 kg/t sodium carbonate, 2 kg/t sodium silicate, and 800 g/t sodium oleate are suitable reagent dosages for the direct rougher flotation of the Mactung skarn phosphate rock sample at a grind size of 86% passing 53 µm, and a bulk phosphate cleaner flotation is necessary to lower the quartz/silicates deportment into the phosphate concentrate.

3.3.3. Carbonate Reverse Flotation

During the reverse flotation of carbonate, combined sulfuric and phosphoric acids were used as phosphate depressants. The flotation conditions are listed in Table 6, and the results are shown in Table 7.
By maintaining a constant sulfuric acid dosage of 10 kg/t, the increased dosage of phosphoric acid from 3 kg/t to 7 kg/t led to a significant improvement in the separation efficiency of phosphate from the carbonate gangue minerals (compare SP-7 and SP-9). The P2O5 grade and recovery were increased by three and eight percentage points, respectively. However, further increase in the dosage of phosphoric acid to 9 kg/t led to a slight increase in P2O5 recovery of phosphate concentrate by about two percentage points while its grade was decreased by 1 percentage point (compare SP-9 and SP-10). Therefore, 7 kg/t was an optimum dosage of phosphoric acid.
At constant 7 kg/t phosphoric acid dosage, the decreased dosage of sulfuric acid from 12 kg/t to 10 kg/t resulted in two percentage points increase in P2O5 grade of phosphate concentrate but a slight decrease of about 0.5 percentage points in the P2O5 recovery (compare SP-8 and SP-9). Lowering the sulfuric acid dosage further to 8 kg/t slightly lowered the phosphate/carbonate separation efficiency. Therefore, 10 kg/t sulfuric acid is the optimal dosage to depress the phosphate while floating off the carbonate minerals. Due to carbonate dissolution, a relatively high consumption of both phosphoric acid and sulfuric acid were required to achieve a suitable acidic environment for an effective separation of phosphate minerals from the carbonate gangues.
Test SP-9 was carried out using optimized reagent dosages determined in the preliminary direct phosphate rougher flotation and reverse carbonate flotation stages and it produced the best flotation performance. A detailed flowsheet of the SP-9 test beneficiation is shown in Figure 6. The products of the test were further validated by Bureau Veritas Commodities Canada Ltd., and the results and metallurgical mass balances are summarized in Table 8.
Finally, a phosphate concentrate assaying 28.68 wt% P2O5, 12.06 wt% SiO2, 46.89% CaO and 0.72 wt% MgO, at a P2O5 recovery of 70.9%, was produced after one phosphate rougher flotation, one bulk cleaner flotation and one stage of carbonate reverse flotation, at a grind size of 86% passing 53 µm. The reagent scheme of the entire flotation process was: 10 g/t PAX and 40 g/t MIBC for reverse sulfide flotation from the ore feed; 5 kg/t Na2CO3, 2 kg/t water glass and 800 g/t sodium oleate for direct phosphate rougher flotation from the sulfide flotation tail; 10 kg/t H2SO4 and 7 kg/t H3PO4 for carbonate reverse flotation from the phosphate concentrate.

4. Conclusions and Recommendations

A skarn phosphate rock sample from the Mactung tungsten deposit characterized by cryptocrystalline apatite (collophane) containing carbonate, sulfides, quartz and other silicates gangue minerals and assaying 12.65% P2O5, 1.75% MgO, 31.71% CaO and 35.46% SiO2 was upgraded into a phosphate concentrate assaying 28.68% P2O5, 12.06% SiO2, 0.72% MgO and 46.98% CaO, at a P2O5 recovery of 70.9%. The ore is hard with a Bond Work Index of 19.04 kWh/t.
Instead of allowing the phosphate in the mine waste and tailings, the phosphate resources can be recovered by a flowsheet comprising both direct and reverse flotation, which is a standard industry method for processing phosphate ores with a high carbonate content. The extraction would not only promote the local economy, but also protect the aquatic ecosystem from any phosphorous leakage that may otherwise cause algae bloom and eutrophication of lakes.
Although the final concentrate does not meet the fertilizer requirement of >30% P2O5 and CaO/P2O5 < 1.6, it is possible that further optimization of reagent dosages and grind or re-grind sizes in a flowsheet involving both direct and reverse flotations could produce an acceptable concentrate.
In addition, the phosphate rock may contain recoverable trace metals including rare earth elements that could further improve the economics of processing the phosphate. However, these were not evaluated in this study and we recommend an evaluation of their content in future studies.
The current reagent dosages were very high (several kilograms per ton), which would have negative impact on the profitability of the project. It is, therefore, recommended that further research should be carried out including reagents optimization, use of non-polar oil and new collectors and/or other phosphate depressants, as well as grinding or re-grinding sizes.

Author Contributions

H.L., methodology, validation, investigation, writing-original draft. G.L.D., initiated the project, provided mineralogical information on the samples, and reviewed and edited the manuscript draft. Q.L., supervision, funding acquisition, conceptualization, draft review and editing, project management. All authors have read and agreed to the published version of the manuscript.

Funding

This research was funded by Northwest Territory Geological Survey, project number: NTGS Contribution #0139.

Acknowledgments

The authors appreciate the financial support by Northwest Territory Geological Survey. We also would like to thank Xuyang Liu and Rebecca Susan Funk for XRD analysis at Department of Earth and Atmospheric Science, University of Alberta.

Conflicts of Interest

The authors declare that they have no known competing financial interests or personal relationships that could have appeared to influence the work reported in this paper.

References

  1. McKelvey, V.E. Phosphate Deposits: U.S. Geological Survey Bulletin 1252-D, U.S.D.o.T.; BiblioGov: Washinton, DC, USA, 1967; pp. D1–D21. [Google Scholar]
  2. Daneshgar, S.; Callegari, A.; Capodaglio, A.G.; Vaccari, D. The Potential Phosphorus Crisis: Resource Conservation and Possible Escape Technologies: A Review. Resources 2018, 7, 37. [Google Scholar] [CrossRef] [Green Version]
  3. Cordell, D.; White, S. Sustainable Phosphorus Measures: Strategies and Technologies for Achieving Phosphorus Security. Agronomy 2013, 3, 86–116. [Google Scholar] [CrossRef] [Green Version]
  4. Drury, M. Global Futures and Government Towns: Phosphates and the Production of Western Sahara as a Space of Contention. Arab World Geogr. 2013, 16, 101–124. [Google Scholar]
  5. Commission European. Communication from the Commission to the European Parliment, the Council, the European Enconomic and Social Committee and the Committee of the Regions: On the Review of the List of Critical Raw Materials for the EU and the Implementation of the Raw Materials Initiative; Commission European: Brussels, Belgium, 2014.
  6. Glindemann, D.; Edwards, M.; Liu, J.-A.; Kuschk, P. Phosphine in soils, sludges, biogases and atmospheric implications—A review. Ecol. Eng. 2005, 24, 457–463. [Google Scholar] [CrossRef]
  7. Pufahl, K.; Groat, L.A. Sedimentary and Igneous Phosphate Deposits: Formation and Exploration: An Invited Paper. Econ. Geol. 2017, 112, 483–516. [Google Scholar] [CrossRef]
  8. Cisse, L.; Mrabet, T. World Phosphate Production: Overview and Prospects. Phosphorus Res. Bull. 2004, 15, 21–25. [Google Scholar] [CrossRef] [Green Version]
  9. Jasinski, S.M. Mineral Commodity Summaries: Phosphate Rock; Geological Survey: Reston, VA, USA, 2020; p. 122.
  10. Jasinski, S.M. Minerals Yearbook: Phosphate Rock 2016; U.S. Geological Survey: Reston, VA, USA, 2015; pp. 56.2–56.3.
  11. Marshall, B. Facts & Figures 2019; The Mining Association of Canada: Slater, OT, Canada, 2020. [Google Scholar]
  12. United States Securities and Exchange Commission. Agrium, Annual Information from Year Ended 31 December 2016; United States Securities and Exchange Commission: Washington, DC, USA, 2016; p. 10.
  13. Narciso, H.; Iakovlev, I.; André de Ruijter, M.; Impey, G.; Cowie, S.; Tanase, A.; Nichols, A.; Collins, J.; Goodall, N.; Lacroix, P.; et al. Amended Technical Report on the Mactung Property; Wardrop Engineering: Vancouver, BC, Canada, 2009. [Google Scholar]
  14. Einaudi, M.; Burt, D. Special Issue Devoted to Skarn Deposits: Introduction-Terminology. Classif. Compos. Skarn Depos. Econ. Geol. 1982, 77, 745–754. [Google Scholar]
  15. Brown, W.E. Progress Report on Solubilities of Phosphate and Other Sparingly Soluble Compounds; U.S. Department of Commerce: Washington, DC, USA, 1971; pp. 7–10.
  16. Gavel, M.J.; Patterson, R.T.; Nasser, N.A.; Galloway, J.M.; Hanna, B.W.; Cott, P.A.; Roe, H.M.; Falck, H. What killed Frame Lake? A precautionary tale for urban planners. Peer J. 2018, 6, e4850. [Google Scholar] [CrossRef] [Green Version]
  17. Kou, J.; Tao, D.; Xu, G. Fatty acid collectors for phosphate flotation and their adsorption behavior using QCM-D. Int. J. Miner. Process. 2010, 95, 1–9. [Google Scholar] [CrossRef]
  18. Dho, H.; Iwasaki, I. Role of sodium silicate in phosphate flotation. Min. Metall. Explor. 1990, 7, 215–221. [Google Scholar] [CrossRef]
  19. Abouzeid, A.-Z.M. Physical and thermal treatment of phosphate ores—An overview. Int. J. Miner. Process. 2008, 85, 59–84. [Google Scholar] [CrossRef]
  20. Snow, R.; Zhang, B.M. Challenging the” Crago” double float process-all cationic flotation of siliceous phosphates. Ind. Miner. 1996, 40–43. [Google Scholar]
  21. Boulos, T.R.; Yehia, A.; Ibrahim, S.S.; Yassin, K.E. A modification in the flotation process of a calcareous–siliceous phosphorite that might improve the process economics. Miner. Eng. 2014, 69, 97–101. [Google Scholar] [CrossRef]
  22. Abdel-Khalek, N. Evaluation of flotation strategies for sedimentary phosphates with siliceous and carbonates gangues. Miner. Eng. 2000, 13, 789–793. [Google Scholar] [CrossRef]
  23. Mohammadkhani, M.; Noaparast, M.; Shafaei, S.; Amini, A.; Amini, E.; Abdollahi, H. Double reverse flotation of a very low grade sedimentary phosphate rock, rich in carbonate and silicate. Int. J. Miner. Process. 2011, 100, 157–165. [Google Scholar] [CrossRef]
  24. Guan, C. Theoretical background of the Crago phosphate flotation process. Min. Metall. Explor. 2009, 26, 55–64. [Google Scholar] [CrossRef]
  25. Ruan, Y.; He, D.; Chi, R.; Ruan, H. Chi Review on Beneficiation Techniques and Reagents Used for Phosphate Ores. Minerals 2019, 9, 253. [Google Scholar] [CrossRef] [Green Version]
  26. Miller, J.D.; Wang, X.; Li, M. Selective Flotation of Phosphate Minerals with hydroxamate collectors. U.S. Patent US6341697B1, 29 January 2002. [Google Scholar]
  27. Wang, J.; Dai, H.X.; Guo, Y.H. The Processing Method and Progress of Phosphate Resources. Adv. Mater. Res. 2013, 634, 3558–3562. [Google Scholar] [CrossRef]
  28. Amankonah, J.O.; Somasundaran, P. Effects of dissolved mineral species on the electrokinetic behavior of calcite and apatite. Colloids Surf. 1985, 15, 335–353. [Google Scholar] [CrossRef]
  29. El-Shall, H.; Zhang, P.; Snow, R. Comparative analysis of dolomite/francolite flotation techniques. Min. Metall. Explor. 1996, 13, 135–140. [Google Scholar] [CrossRef]
  30. Prasad, M.; Majumder, A.; Rao, T. Reverse flotation of sedimentary calcareous/dolomitic rock phosphate ore—An overview. Min. Metall. Explor. 2000, 17, 49–55. [Google Scholar] [CrossRef]
  31. Hanna, J.; Anazia, I. Fatty acid separation of siliceous carbonate phosphates. Min. Metall. Explor. 1990, 7, 84–89. [Google Scholar] [CrossRef]
  32. Zheng, X.; Smith, R. Dolomite depressants in the flotation of apatite and collophane from dolomite. Miner. Eng. 1997, 10, 537–545. [Google Scholar] [CrossRef]
  33. Boulos, T.; Abdel Khalek, N.; Ibrahim, S. Rationalization of the flotation circuit of an Egyptian phosphorite plant. Tenside Surfactants Deterg. 2000, 37, 176–182. [Google Scholar]
  34. Gebru, A.L. Phosphate Mineralization at the Mactung Tungsten Deposit; North American Tungsten Corporation: Vancouver, BC, Canada, 2011. [Google Scholar]
  35. Tsakalakis, K.; Stamboltzis, G. Modelling the specific grinding energy and ball-mill scaleu. IFAC Proc. Vol. 2004, 37, 53–58. [Google Scholar] [CrossRef]
Figure 1. The stratigraphic sequence of phosphate (Unit 3D, highlighted) on the N-S cross section of the Mactung skarn deposit. Figure was modified from [13].
Minerals 11 00421 g001
Figure 2. Photograph of core sample of Unit 3D showing greenish grey skarn phosphate clasts in a whitish grey carbonate matrix.
Minerals 11 00421 g002
Figure 3. Schematic principle flowsheet of the beneficiation; In some tests, there was an additional cleaning flotation step of the floated phosphate minerals.
Minerals 11 00421 g003
Figure 4. XRD pattern of skarn phosphate sample.
Minerals 11 00421 g004
Figure 5. Variation of the cumulative particle size distribution of skarn phosphate sample as a function of grinding time in a Titan rod mill.
Minerals 11 00421 g005
Figure 6. A detailed flowsheet of SP-9 beneficiation test.
Minerals 11 00421 g006
Table 1. Whole rock analysis of skarn phosphate (SP) samples.
Component%
Al2O33.29
Ba0.63
CaO31.71
Cr2O30.05
Fe2O36.25
K2O0.38
MgO1.75
Mn2O0.34
Na2O0.12
P2O512.65
SO31.679
SiO235.46
Sr0.023
TiO20.29
LOI *4.8
Total C1.75
Total S0.75
* LOI: Loss on ignition.
Table 2. The results of grinding-flotation tests on skarn phosphate.
Test #Grind SizeProductsWeightAssay (XRF), (%)Distribution (%)
(g)(%)P2O5CaOMgOSiO2SO3P2O5CaOMgOSiO2SO3
SP-178% −106 µmP Conc76.917.218.8547.001.316.810.1528.125.612.13.51.3
Si Tail363.381.19.9828.541.9939.190.9170.373.586.595.835.7
S Conc440.298.311.5331.771.8733.540.7898.499.198.699.336.9
S Tail7.71.710.6417.531.5314.1476.411.61.01.40.763.1
Feed447.8100.011.5131.521.8633.212.07100.0100.0100.0100.0100.0
SP-275% −53 µmP Conc141.531.920.2348.900.898.950.0052.648.517.98.80.0
Si Tail287.864.88.3324.181.9444.661.3444.148.879.689.150.8
S Conc429.396.712.2532.331.5932.890.9096.697.397.497.850.8
S Tail14.63.312.5526.901.2221.5725.613.42.82.62.249.2
Feed443.9100.012.2632.151.5832.521.71100.0100.0100.0100.0100.0
SP-386% −53 µmP Conc166.337.320.5649.470.889.920.0062.557.122.811.20.0
Si Tail260.858.56.9121.601.7948.521.6633.039.172.985.856.7
S Conc427.195.812.2332.451.4333.491.0195.596.295.797.056.7
S Tail18.84.213.1228.791.4823.8217.544.53.84.43.043.3
Feed445.9100.012.2632.301.4333.091.71100.0100.0100.0100.0100.0
Table 3. The results of phosphate rougher flotation.
Test #Sodium Carbonate (g/t)ProductsWeightAssay (XRF), (%)Distribution (%)
(g)(%)P2O5CaOMgOSiO2SO3P2O5CaOMgOSiO2SO3
SP-34000 P Conc166.337.2920.5649.470.889.920.0062.5257.1222.7611.190.00
Si Tail260.858.496.9121.601.7948.521.6632.9739.1272.8985.7856.71
S Tail427.195.7912.2332.451.4333.491.0195.4996.2495.6596.9756.71
SP-45000P Conc221.244.3920.1646.631.4111.220.0073.0966.0536.8416.010.00
Si Tail259.852.145.4318.461.9648.462.3923.1230.7060.0681.2266.87
S Tail481.096.5212.2031.411.7131.331.2996.2196.7596.9097.2366.87
SP-56000P Conc198.139.5419.8547.091.2110.310.0066.3558.2331.1412.550.00
Si Tail288.957.646.2521.721.7748.202.5130.4639.1566.2185.5671.58
S Tail487.097.1811.7832.041.5432.781.4996.8197.3897.3598.1271.58
Table 4. The flotation conditions of phosphate rougher flotation of skarn phosphate.
Test #Sodium Carbonate, g/tSodium Silicate, g/tSodium Oleate, g/t
SP-450003000400
SP-650003000600
SP-750002000600
SP-850002000800
Table 5. The results of direct phosphate flotation.
Test #ProductsWeightAssay (XRF), (%)Distribution (%)
(g)(%)P2O5CaOMgOSiO2SO3P2O5CaOMgOSiO2SO3
SP-4P Conc221.244.3920.1646.631.4111.220.0073.0966.0536.8416.010.00
Si Tail259.852.145.4318.461.9648.462.3923.1230.7060.0681.2266.87
S Tail481.096.5212.2031.411.7131.331.2996.2196.7596.9097.2366.87
SP-6Ca+P Conc1240.248.3221.5547.670.888.940.1280.3071.3727.4514.292.83
Si Tail241.148.504.4017.082.2451.962.8916.4525.6670.0883.3769.01
S Tail481.396.8312.9632.351.5630.491.5196.7597.0397.5397.6671.84
SP-7Ca+P Conc1249.650.5220.7945.421.3711.080.1484.7273.8440.5717.653.61
Si Tail223.645.252.8814.932.1155.423.1410.5021.7456.0979.0672.19
S Tail473.295.7612.3331.011.7232.031.5695.2295.5896.6696.7175.80
SP-8Ca+P Conc2226.345.7023.0149.440.948.810.3381.5170.9427.4312.936.84
Si Tail242.58.588.3022.051.8343.261.385.525.9410.0311.915.43
Ca+P Conc1268.854.2720.6845.111.0814.250.4987.0476.8737.4624.8312.27
Si Tail1211.642.732.9315.022.2253.243.499.7020.1660.5673.0368.42
S Tail480.497.0012.8631.861.5831.431.8196.7497.0398.0297.8680.69
“S Tail” refers to the rejected sulfide concentrate in the 1st stage sulfide flotation; “P Conc” or “Ca+P Conc1” refers to the carbonate concentrate of the rougher phosphate flotation stage; “Si Tail” or “Si Tail1” refers to the tailings of the rougher phosphate flotation stage; “Ca+P Conc2” refers to the carbonate concentrate of the bulk phosphate flotation stage after rougher phosphate flotation stage; “Si Tail2” refers to the silicate tailings of the bulk phosphate flotation stage after rougher phosphate flotation stage.
Table 6. Reagent dosages used in the reverse flotation of carbonate from the bulk skarn phosphate flotation concentrate.
Test #Sulfuric Acid, kg/tPhosphoric Acid, kg/t
SP-7103
SP-8127
SP-9107
SP-10109
SP-1187
Table 7. The results of carbonate reverse flotation from bulk skarn phosphate flotation concentrate.
Test #ProductsWeightAssay (XRF), (%)Distribution (%)
(g)(%)P2O5CaOMgOSiO2SO3P2O5CaOMgOSiO2SO3
SP-7P Conc145.029.3424.3246.661.267.220.0057.5544.0621.686.680.00
Ca Conc64.513.0518.6353.501.313.160.0019.6122.4710.021.300.00
P+Ca Conc2209.442.3922.5748.771.275.970.0077.1566.5331.707.970.00
SP-8P Conc167.533.8125.3545.281.0110.800.4466.4748.0721.8311.726.84
Ca Conc58.911.8816.3261.270.743.160.0015.0422.865.591.200.00
P+Ca Conc2226.345.7023.0149.440.948.810.3381.5170.9427.4312.936.84
SP-9P Conc154.731.3027.3444.840.857.120.2765.8943.4919.927.344.53
Ca Conc65.813.3213.4763.360.643.160.0013.8226.156.421.380.00
P+Ca Conc2220.544.6123.2050.370.795.940.1979.7169.6426.358.724.53
SP-10P Conc167.834.0325.0645.591.427.240.2169.0251.0125.698.073.54
Ca Conc49.410.0211.3651.781.573.160.059.2117.078.341.040.25
P+Ca Conc2217.244.0521.9547.001.456.310.1778.2468.0834.039.113.79
SP-11P Conc159.031.9726.8545.461.709.220.0065.6345.2730.239.330.00
Ca Conc65.913.2515.9462.460.713.160.0016.1525.785.281.320.00
P+Ca Conc2225.045.2223.6550.441.417.440.0081.7871.0535.5110.650.00
“P Conc” refers to the phosphate concentrate from the sink product of the reverse carbonate flotation stage; “Ca Conc” refers to the carbonate concentrate or phosphate tailings from the floated product of the reverse carbonate flotation stage; “P+Ca Conc2” refers to the feed ore for the carbonate reverse flotation.
Table 8. Results of batch flotation test SP-9 on skarn phosphate.
ProductsWeightAssay, (BV; %)Distribution (%)
(g)(%)P2O5CaOMgOSiO2SO3P2O5CaOMgOSiO2SO3
P Conc.154.731.3028.6846.890.7212.060.6370.9045.5813.2911.24n/a
Ca Conc. 165.813.3211.0952.570.161.850.4811.6721.741.260.73n/a
Ca+P Conc. 2220.544.6123.4348.590.559.010.5982.5767.3314.5411.98n/a
Bulk Tail43.28.748.3826.162.4943.370.805.787.1012.8311.29n/a
Ca+P Conc. 1263.753.3520.9644.910.8714.640.6288.3574.4327.3723.27n/a
Si Tail1210.942.672.2716.232.7658.402.177.6521.5169.4474.24n/a
S Tail474.696.0312.6632.171.7134.091.3196.0095.9496.8197.51n/a
S Conc.19.63.9712.7332.921.3621.07>104.004.063.192.49n/a
Feed494.3100.0012.6632.201.7033.57n/a100.00100.00100.00100.00n/a
Publisher’s Note: MDPI stays neutral with regard to jurisdictional claims in published maps and institutional affiliations.

