
Chemical Mapping to Evaluate Post-Depositional Diagenesis among the Earliest Ceramics in the Teotihuacan Valley, Mexico


Abstract
:1. Introduction
2. Compositional Approaches to Ceramic Production and Exchange in Archaeology
3. Materials and Methods
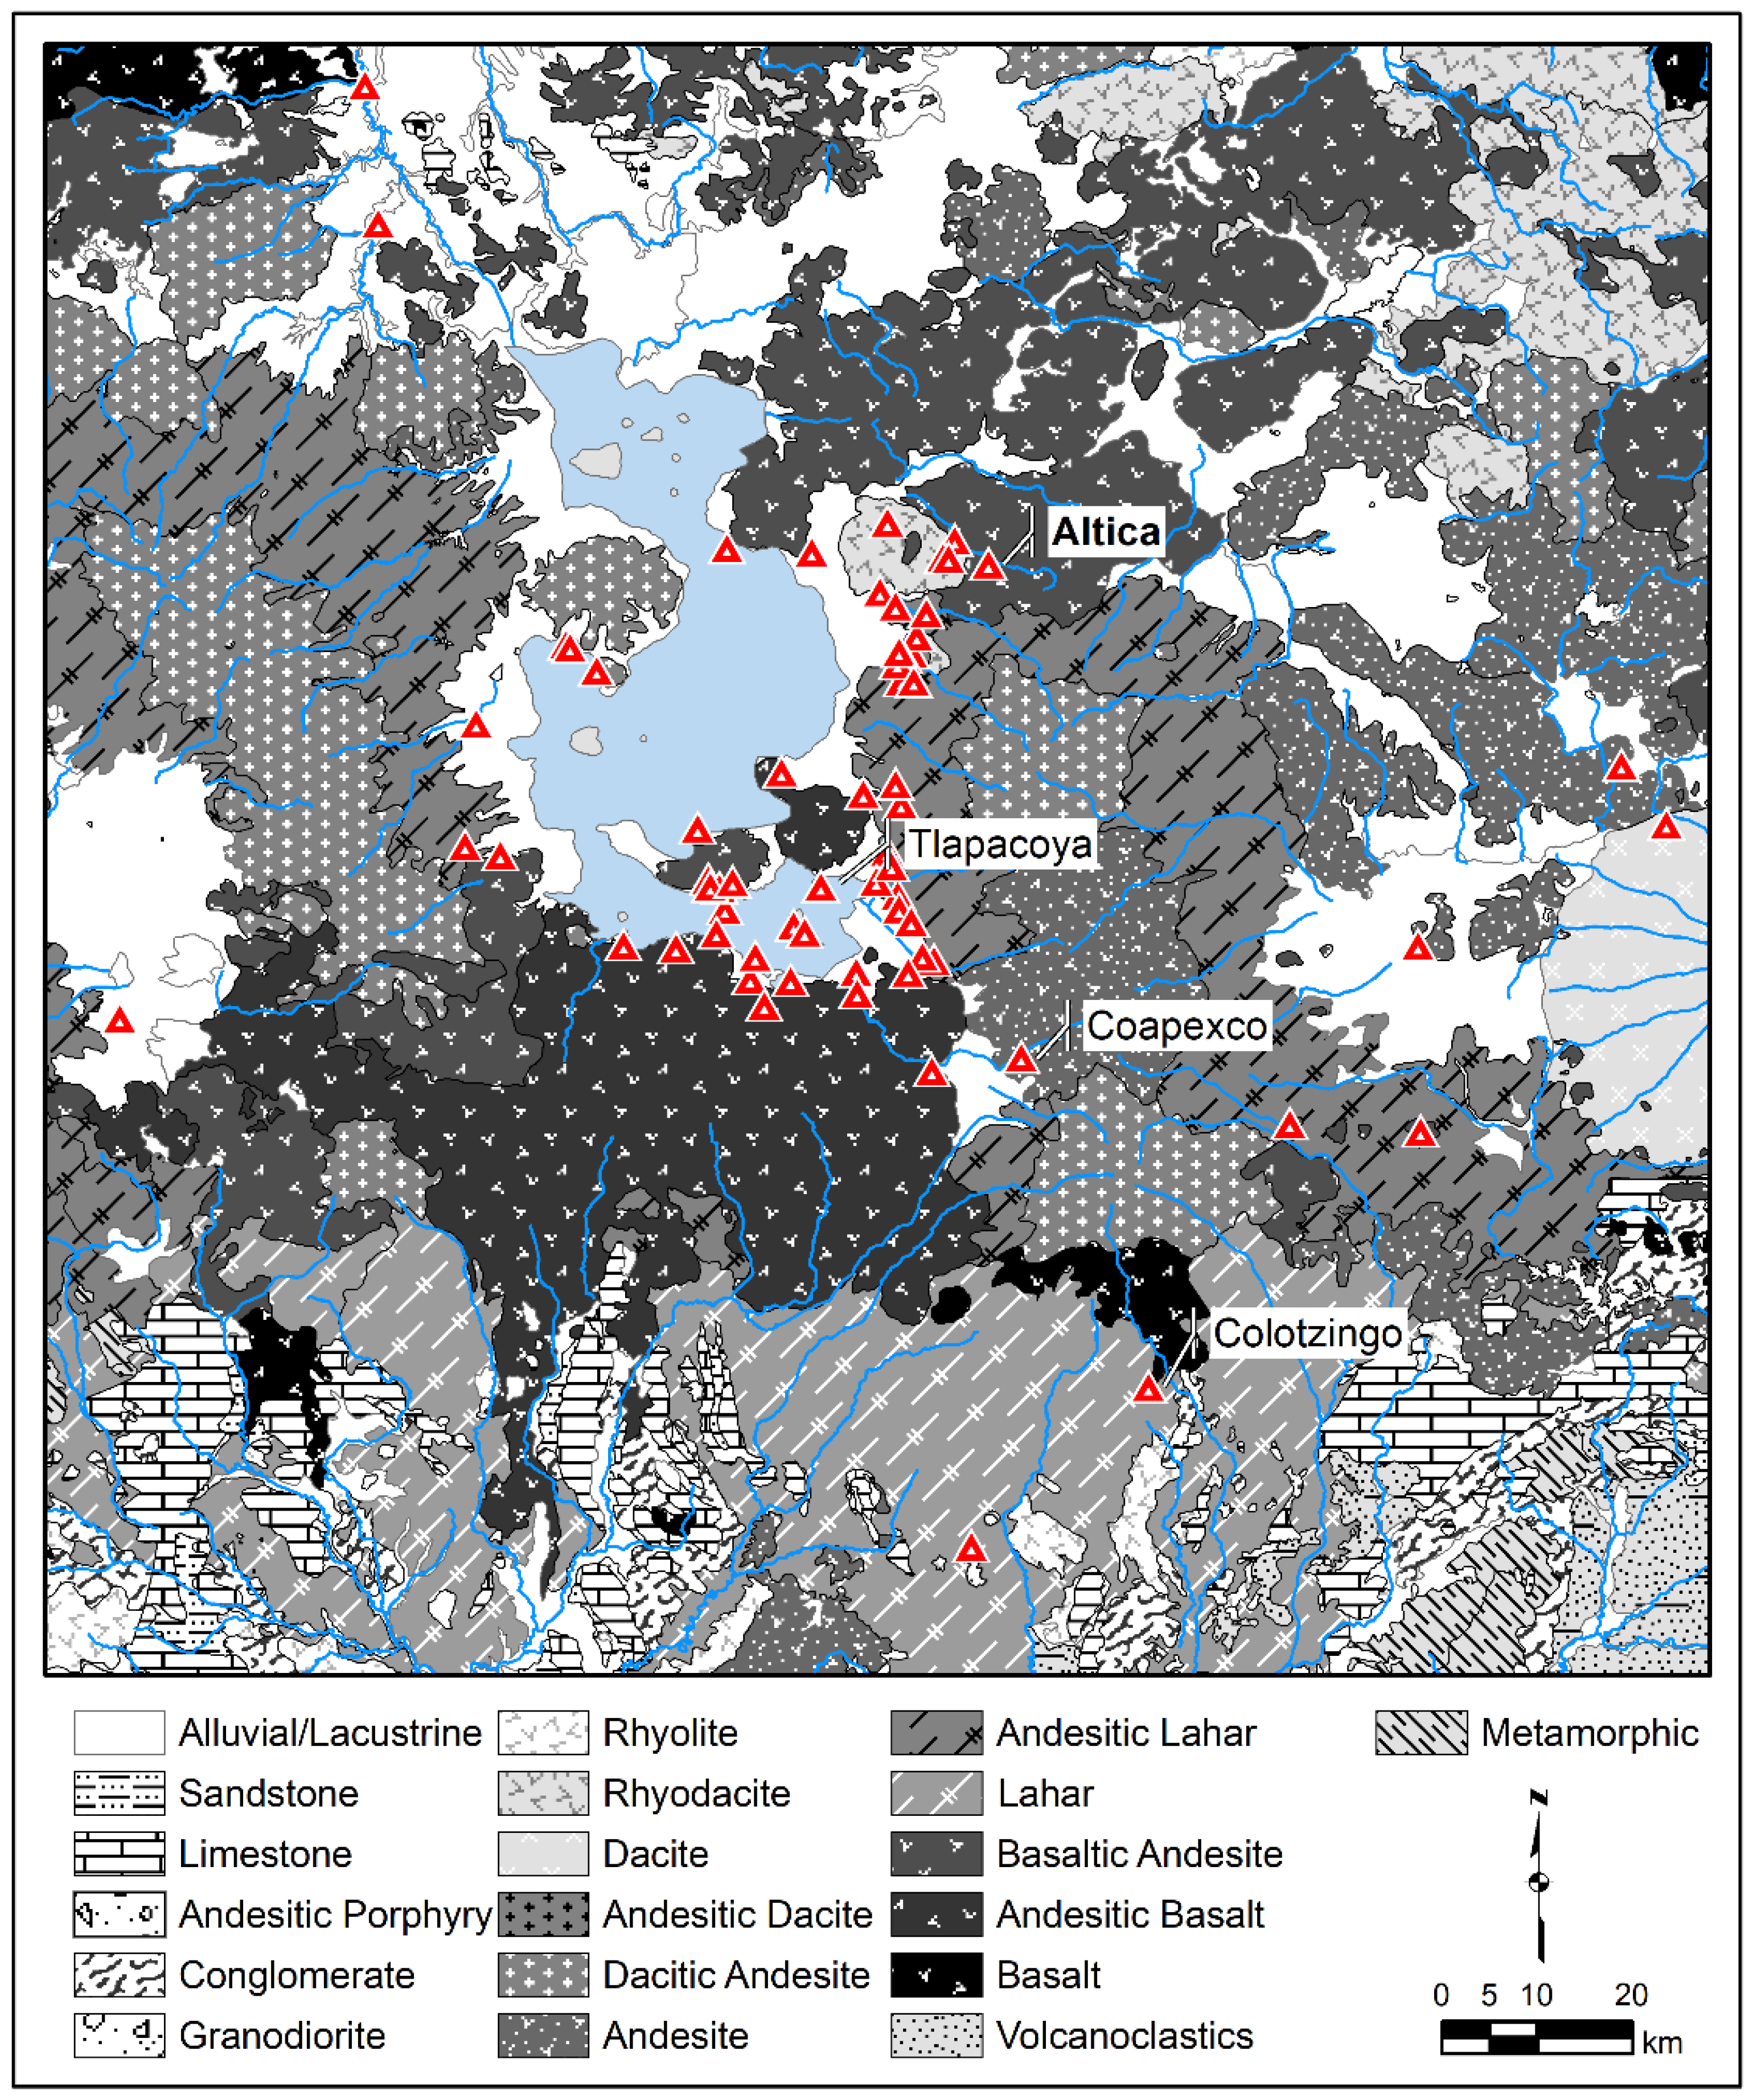
3.1. Archaeological Background
3.2. Pre-Hispanic Pottery Production in the Basin of Mexico
3.3. Previous NAA Characterization
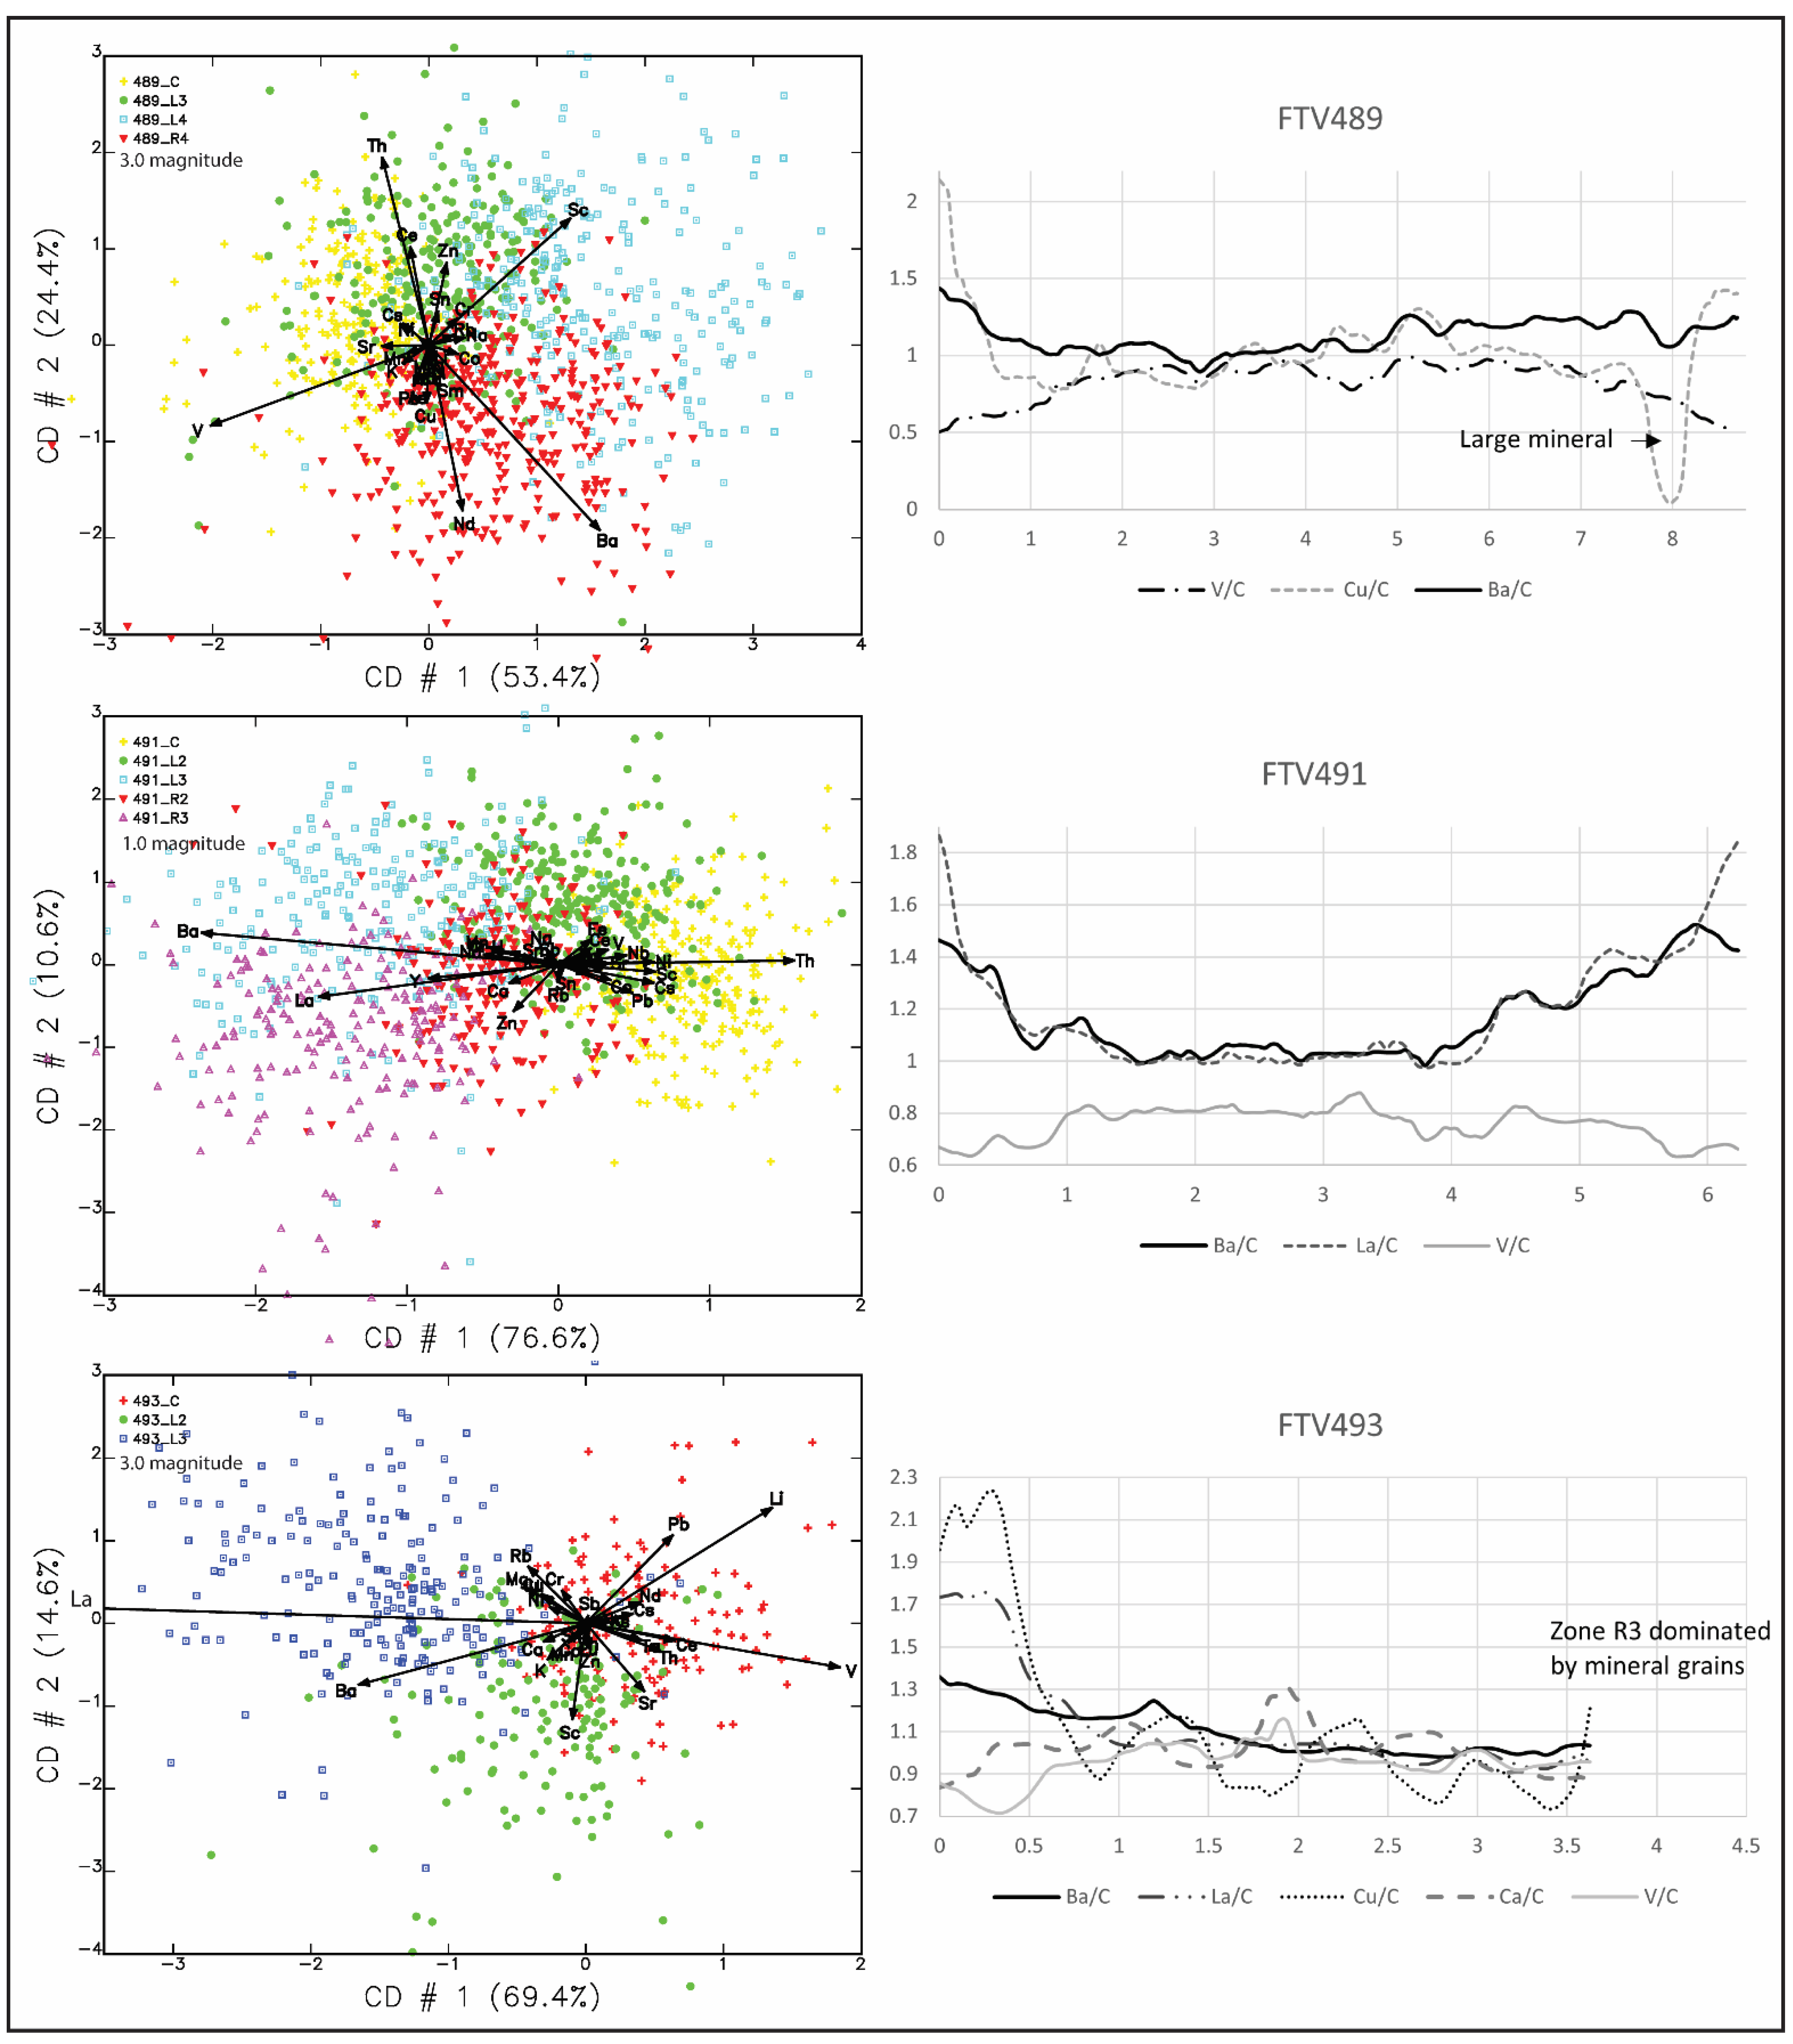
3.4. Chemical Mapping of Element Mobility in Archaeological Ceramics
3.5. Sample and Methods for Scanning LA-ICP-MS
3.6. Spatial Analysis Using GIS
4. Results
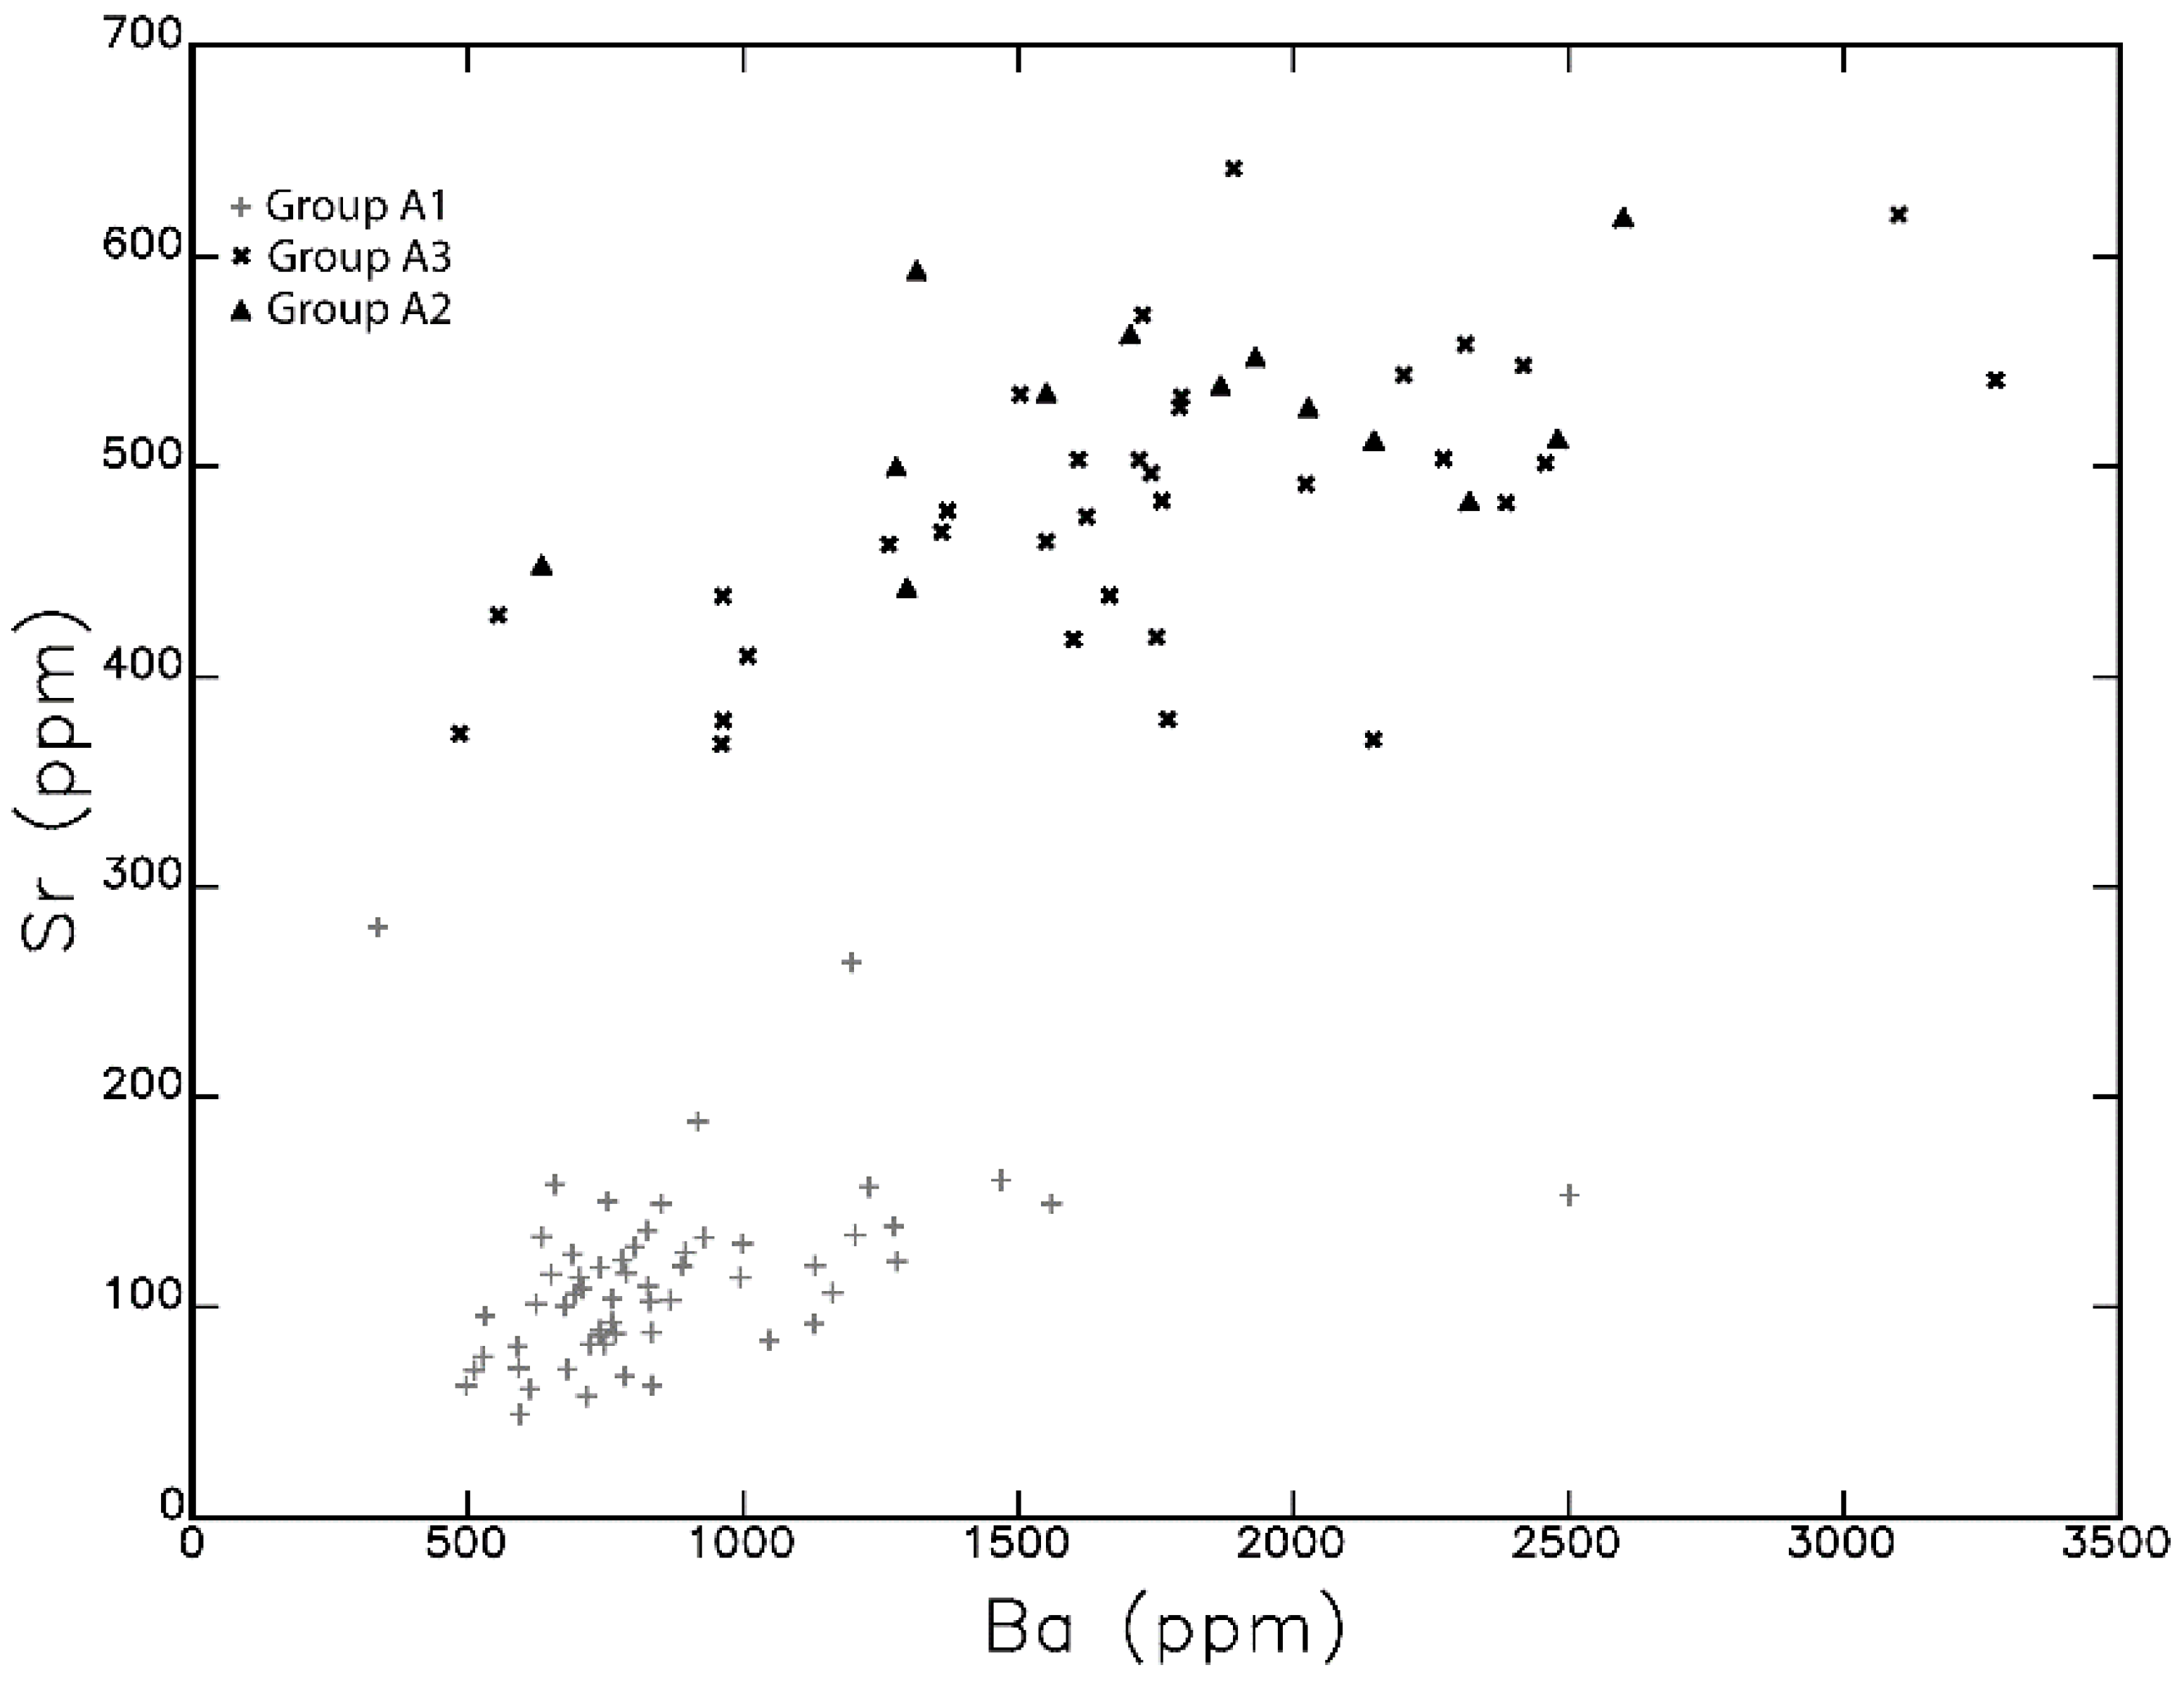
4.1. Group A1
4.2. Group A2
4.3. Group A3
4.4. Group T1
5. Discussion
6. Conclusions
Supplementary Materials
Author Contributions
Funding
Data Availability Statement
Acknowledgments
Conflicts of Interest
References
- Sayre, E.; Dodson, R.W.; Thompson, D.B. Neutron Activation Study of Mediterranean Potsherds. Am. J. Archaeol. 1957, 61, 35–41. [Google Scholar] [CrossRef]
- Stoner, W.D.; Nichols, D.L. Pottery Trade and the Formation of Early and Middle Formative Style Horizons as Seen from Central Mexico. Anc. Mesoam. 2019, 2, 311–337. [Google Scholar] [CrossRef]
- Nichols, D.L.; Stoner, W.D. Before Teotihuacan: Altica, Exchange, Interactions, and the Origins of Complex Society in the Northeast Basin of Mexico. Anc. Mesoam. 2019, 2, 369–382. [Google Scholar] [CrossRef]
- Stoner, W.D.; Nichols, D.L. The Altica Project: Reframing the Formative Basin of Mexico. Anc. Mesoam. 2019, 2, 247–265. [Google Scholar] [CrossRef]
- Golitko, M.; Dudgeon, J.V.; Neff, H.; Terrell, J.E. Identification of Post-Depositional Chemical Alteration of Ceramics from the North Coast of New Guinea (Sandaun Province) by Time of Flight-Laser Ablation-Inductively Coupled Plasma-Mass Spectrometry (TOPF-LA-ICP-MS). Archaeometry 2012, 54, 80–100. [Google Scholar] [CrossRef]
- Picon, M. La fixation du baryum et du strontium par les céramiques. Revue d’Archéométrie 1987, 11, 41–47. [Google Scholar] [CrossRef]
- Duistermaat, K. The Organization of Pottery Production: Toward a Relational Approach. In The Oxford Handbook of Archaeological Ceramic Analysis; Hunt, A., Ed.; Oxford University Press: New York, NY, USA, 2017; pp. 114–147. [Google Scholar]
- Roux, V. Ceramic Manufacture: The Chaine Operatoire Approach. In The Oxford Handbook of Archaeological Ceramic Analysis; Hunt, A., Ed.; Oxford University Press: Oxford, UK, 2017; pp. 101–113. [Google Scholar]
- Sillar, B.; Tite, M.S. The Challenge of ’Technological Choices’ for Materials Science Approaches in Archaeology. Archaeometry 2000, 42, 2–20. [Google Scholar] [CrossRef]
- Arnold, D.E. Ceramic Theory and Cultural Process; Cambridge University Press: Cambridge, UK, 1985. [Google Scholar]
- Blomster, J.P.; Neff, H.; Glascock, M.D. Olmec Pottery Production and Export in Ancient Mexico Determined through Elemental Analysis. Science 2005, 307, 1068–1072. [Google Scholar] [CrossRef] [PubMed] [Green Version]
- Neff, H. Pots as Signals: Explaining the Enigma of Long-Distance Ceramic Exchange. In Craft and Science: International Perspectives on Archaeological Ceramics; Martinón-Torres, M., Ed.; Bloomsbury Qatar Foundation: Doha, Qatar, 2014. [Google Scholar]
- Glascock, M.D. Characterization of Archaeological Ceramics at MURR by Neutron Activation Analysis and Multivariate Statistics. In Chemical Characterization of Ceramic Pastes in Archaeology; Neff, H., Ed.; Prehistory Press: Madison, WC, USA, 1992; pp. 11–26. [Google Scholar]
- Weigand, P.C.; Harbottle, G.; Sayre, E.V. Turquoise Sources and Source Analysis: Mesoamerica and the Southwestern U.S.A. In Exchange Systems in Prehistory; Earle, T.K., Ericson, J.E., Eds.; Academic Press: New York, NY, USA, 1977; pp. 15–32. [Google Scholar]
- Bishop, R.L.; Harbottle, G.; Sayre, E.V. Chemical and Mathematical Procedures Employed in the Maya Fine Paste Ceramics Project. In Excavations at Seibal: Analyses of Fine Paste Ceramics; Sabloff, J.A., Ed.; Peabody Muesum Press: Cambridge, MA, USA, 1982; pp. 272–282. [Google Scholar]
- Crider, D.L. Epiclassic and Early Postclassic Interaction in Central Mexico as Evidenced by Decorated Pottery. Ph.D. Thesis, Arizona State University, Tempe, AZ, USA, 2011. [Google Scholar]
- Garraty, C.P. The Politics of Commerce: Aztec Pottery Production and Exchange in the Basin of Mexico, A.D. 1200-1650; Arizona State University: Tempe, AZ, USA, 2006. [Google Scholar]
- Hodge, M.G.; Blackman, M.J.; Minc, L.D.; Neff, H. Compositional Perspective on Ceramic Production in the Aztec Empire. In Chemical Characterization of Ceramic Pastes in Archaeology; Neff, H., Ed.; Prehistory Press: Madison, WC, USA, 1992; pp. 203–220. [Google Scholar]
- Minc, L.D. Political Economy and Market Economy under Aztec Rule: A Regional Perspective Based on Decorated Ceramic Production and Distribution Systems in the Valley of Mexico. Ph.D. Thesis, University of Michigan, Ann Arbor, MI, USA, 1994. [Google Scholar]
- Nichols, D.L.; Brumfiel, E.M.; Neff, H.; Hodge, M.; Charlton, T.H.; Glascock, M.D. Neutrons, Markets, Cities, and Empires: A 1000-Year Perspective on Ceramic Production and Distribution in the Postclassic Basin of Mexico. J. Anthropol. Archaeol. 2002, 21, 25–82. [Google Scholar] [CrossRef]
- Stoner, W.D. The Analytical Nexus of Ceramic Paste Composition Studies: A Comparison of NAA, LA-ICP-MS, and Petrography in the Prehispanic Basin of Mexico. J. Archaeol. Sci. 2016, 76, 31–47. [Google Scholar] [CrossRef]
- Neff, H.; Cogswell, J.W.; Ross, L.M.J. Supplementing Bulk Chemistry in Archaeological Ceramic Provenance Investigations. In Patterns and Process: A Festschrift in Honor of Dr. Edward V. Sayre; van Zelst, L., Ed.; Smithsonian Center for Materials Research and Education: Washington, DC, USA, 2003; pp. 201–226. [Google Scholar]
- de la Fuente, G.A. Post-Depositional Chemical Alterations in Archaeological Ceramics: A Critical Review and Implications for their Conservation. Boletín Lab. Petrol. Consercación Ceram. 2008, 1, 21–37. [Google Scholar]
- Montana, G.; Randazzo, L.; Belfiore, C.M.; La Russa, M.F.; Ruffolo, S.A.; De Francesco, A.M.; Pezzino, A.; Punturo, R.; Di Stefano, V. An Original Experimental Approach to Study the Alteration and/or Contamination of Archaeological Ceramics Originated by Seawater Burial. Period. Mineral. 2014, 83, 89–120. [Google Scholar]
- Bearat, H.; Dufournier, D.; Nguyen, N.; Raveau, B. Influence de NaCl Sur la Couleur et la Composition Chimique des Pates Ceramiques Calcaires au Cours de Leur Cuisson. Rev. Archeom. 1989, 13, 43–53. [Google Scholar] [CrossRef]
- Buxeda i Garrigos, J. Chemical and Mineralogical Alteration of Ceramics from a Late Bronze Age kiln at Kommos, Crete: The Effect on the Formation of a Reference Group. Archaeometry 2001, 43, 349–371. [Google Scholar] [CrossRef] [Green Version]
- Buxeda i Garrigos, J.; Mommsen, H.; Tsolakidou, A. Alterations of Na, K and Rb concentrations in Mycenaean pottery and a proposed explanation using X-ray diffraction. Archaeometry 2002, 44, 187–198. [Google Scholar] [CrossRef] [Green Version]
- Franklin, U.M.; Vitali, V. The Environmental Stability of Ancient Ceramics. Archaeometry 1985, 27, 3–15. [Google Scholar] [CrossRef]
- Freestone, I.C.; Meeks, N.D.; Middleton, A.P. Retention of Phosphate in Buried Ceramics: An Electron Microbean Approach. Archaeometry 1985, 27, 161–177. [Google Scholar] [CrossRef]
- Schwedt, A.; Mommsen, H.; Zacharias, N. Post-Depositional Elemental Alterations in Pottery: Neutron Activation Analyses of Surface and Core Samples. Archaeometry 2004, 46, 85–101. [Google Scholar] [CrossRef]
- Schwedt, A.; Mommsen, H. On the Influence of Drying and Firing of Clay on the Formation of Trace Element Concentration Profiles within Pottery. Archaeometry 2007, 49, 495–509. [Google Scholar] [CrossRef]
- Schwedt, A.; Mommsen, H.; Zacharias, N.; Buxedia i Garriagos, J. Analcime Crystallization and Compositional Profiles—Comparing Approaches to Detect Post-Depositional Alterations in Archaeological Pottery. Archaeometry 2006, 48, 237–251. [Google Scholar] [CrossRef] [Green Version]
- Weiner, S.; Nagarsky, A.; Feldman, Y.; Kossoy, A. Archaeological Ceramic Diagenesis: Clay Mineral Recrystalization in Sherds from a Late Byzantine Kiln, Israel. Minerals 2020, 10, 408. [Google Scholar] [CrossRef]
- Dunnell, R.C.; Hunt, T.L. Elemental Composition and Inference of Ceramic Vessel Function. Curr. Anthropol. 1990, 31, 330–336. [Google Scholar] [CrossRef]
- Attas, M.; Fossey, J.M.; Yaffe, L. Corrections for Drill-Bit Contamination in Sampling Ancient Pottery for Neutron Activation Analysis. Archaeometry 1984, 26, 104–126. [Google Scholar] [CrossRef]
- Boulanger, M.T.; Fehrenback, S.S.; Glascock, M.D. Experimental Evaluation of Sample-Extraction Methods and the Potential for Contamination in Ceramic Specimens. Archaeometry 2013, 55, 880–892. [Google Scholar] [CrossRef]
- Stoner, W.D.; Pool, C.A.; Neff, H.; Glascock, M.D. Exchange of Coarse Orange Pottery in the Middle Classic Tuxtla Mountains, Southern Veracruz, Mexico. J. Archaeol. Sci. 2008, 35, 1412–1426. [Google Scholar] [CrossRef]
- Iñañez, J.G.; Buxeda I Garrigos, J.; Speakman, R.J.; Glascock, M.D. Archaeometric Characterization of Renaissance Tin-Lead Glazed Pottery from Talavera de la Reina, Puente del Arzobispo and Seville (Spain). In Proceedings of the Actes ISA 2006, Québec City, QC, Canada, 2–6 May 2006; Moreau, J.-F., Auger, R., Chabot, J., Herzog, A., Eds.; Cahiers d’Archeologie du CELAT, No. 25 University of Laval: Québec City, QC, Canada, 2009; pp. 279–287. [Google Scholar]
- Stoner, W.D.; Nichols, D.L.; Alex, B.A.; Crider, D.L. The Emergence of Early-Middle Formative Exchange Patterns in Mesoamerica: A View from Altica in the Teotihuacan Valley. J. Anthropol. Archaeol. 2015, 39, 19–35. [Google Scholar] [CrossRef]
- Willey, G.R. Horizonal Integration and Regional Diversity: An Alternating Process in the Rise of Civilizations. Am. Antiq. 1991, 56, 197–215. [Google Scholar] [CrossRef]
- Blomster, J.P.; Cheetham, D. (Eds.) The Early Olmec and Mesoamerica: The Material Record; Cambridge University Press: Cambridge, UK, 2017. [Google Scholar]
- Grove, D.C. Olmec Horizons in Formative Period Mesoamerica: Diffusion or Social Evolution? In Latin American Horizons; Rice, D.S., Ed.; Dumbarton Oaks Research Library and Collections: Washington, DC, USA, 1993; pp. 83–111. [Google Scholar]
- Pool, C.A. Olmec Archaeology and Early Mesoamerica; Cambridge University Press: Cambridge, UK, 2007. [Google Scholar]
- Vázquez-Sánchez, E.; Jaimes-Palomera, R. Geología de la Cuenca de México. Geofis. Int. 1989, 28, 133–190. [Google Scholar]
- Arellano, A.R.V. Estratigrafia de la Cuenca de Mexico. Mem. Congr. Cient. Mex. 1953, 3, 172–186. [Google Scholar]
- Hopkins, M.R. Teotihuacan Cooking Pots: Scale of Production and Product Variability. Ph.D. Thesis, Brandeis University, Waltham, MA, USA, 1995. [Google Scholar]
- Slayton, P. A Compositional Analysis fo Clays and Ceramics from the Basin of Mexico. Master’s Thesis, University of Colorado, Boulder, CO, USA, 1985. [Google Scholar]
- Freestone, I.C.; Middleton, A.P. Mineralogical Applications of the Analytical SEM in Archaeology. Mineral. Mag. 1987, 51, 21–31. [Google Scholar] [CrossRef]
- Maggetti, M. Phase Analysis and its Significance for Technology and Origin. In Archaeological Ceramics; Olin, J.S., Franklin, A.D., Eds.; Smithsonian Institution Press: Washington, DC, USA, 1982; pp. 121–133. [Google Scholar]
- Rice, P. Pottery Analysis: A Sourcebook; University of Chicago Press: Chicago, IL, USA, 2015. [Google Scholar]
- Rye, O.S. Pottery technology: Principles and Reconstruction; Taraxacum: Washington, DC, USA, 1981. [Google Scholar]
- Gosselain, O.P. Bonfire of the Enquiries. Pottery Firing Temperatures in Archaeology: What for? J. Archaeol. Sci. 1992, 19, 243–259. [Google Scholar] [CrossRef]
- Pool, C.A. Why a Kiln? Firing Technology in the Sierra de los Tuxtlas, Veracruz (Mexico). Archaeometry 2000, 42, 61–76. [Google Scholar] [CrossRef]
- Neff, H.; Glascock, M.D. Provenance Analysis of Aztec Period Ceramics from the Basin of Mexico: Final Technical Report; University of Missouri Research Reactor: Columbia, MO, USA, 2000. [Google Scholar]
- Murakami, T.; Boulanger, M.T.; Glascock, M.D. Petrographic and XRF Analyses of Andesitic Cut Stone Blocks at Teotihuacan, Mexico: Implications for the Organization of Urban Construction. Archaeol. Anthropol. Sci. 2018, 11, 1491–1518. [Google Scholar] [CrossRef]
- Tolstoy, P. Early Sedentary Communities of the Basin of Mexico. J. Field Archaeol. 1977, 4, 91–106. [Google Scholar]
- Alex, B.A.; Nichols, D.L.; Glascock, M.D. Compositional Analysis of Formative Period Ceramics in the Teotihuacan Valley, Mexico. Archaeometry 2012, 54, 821–834. [Google Scholar] [CrossRef]
- Buxeda i Garrigos, J. Alteration and Contamination of Archaeological Ceramics: The Pertubation Problem. J. Archaeol. Sci. 1999, 26, 295–313. [Google Scholar] [CrossRef] [Green Version]
- Johnson, C.A.; Piatak, N.M.; Miller, M.M. Barite (Barium). In Critical Mineral Resources of the United Statees—Economic and Environmental Geology and Prospects for Future Supply; Unites States Geological Survey, Department of the Interior: Reston, VA, USA, 2017. [Google Scholar]
- Cogswell, J.W.; Neff, H.; Glascock, M.D. Analysis of Shell-Tempered Pottery Replicates: Implications for Provenance Studies. Am. Antiq. 1998, 63, 63–72. [Google Scholar] [CrossRef]
- Stoner, W.D.; Millhauser, J.K.; Rodríguez-Alegría, E.; Overholtzer, L.; Glascock, M.D. Taken with a Grain of Salt: Experimentation and the Chemistry of Archaeological Ceramics from Xaltocan, Mexico. J. Archaeol. Method Theory 2014, 21, 862–898. [Google Scholar] [CrossRef]
- Jochum, K.P.; Weis, U.; Stoll, B.; Kuzmin, D.; Yang, Q.; Raczek, I.; Jacob, D.E.; Stracke, A.; Birbaum, K.; Frick, D.A. Determination of Reference Values for NIST SRM610-617 Glasses Following ISO Guidelines. Geostand. Geoanal. Res. 2011, 35, 397–429. [Google Scholar] [CrossRef]
- Paton, C.; Hellstrom, J.C.; Paul, B.; Woodhead, J.D.; Hergt, J.M. Iolite: Freeware for the Visualisation and Processing of Mass Spectrometric Data. J. Anal. At. Spectrom. 2011, 26, 2508–2518. [Google Scholar] [CrossRef]
- Woodhead, J.D.; Hellstrom, J.C.; Hergt, J.M.; Greig, A.; Maas, R. Isotopic and Elemental Imaging of Geological Materials by Laser Ablation Inductively Coupled Plasma-Mass Spectrometry. Geostand. Geoanalytical Res. 2007, 31, 331–343. [Google Scholar] [CrossRef]


| Group | Barium Mean μg/g | Barium Range | Sample | Specimen IDs in Sample | Description |
|---|---|---|---|---|---|
| A1 | 856.25 | 507–2511 | 2 | FTV039 | Ceramic imports from a metamorphic region of Mexico, likely southwestern Puebla. |
| FTV040 | |||||
| A2 | 1665.48 | 346–3275 | 6 | FTV043 | Ceramics that fit the expectations of localized production using materials found in proximity to Altica. These contain relatively low concentrations of light transition metals that are typical for volcanic materials of a felsic composition, such as rhyolite or dacite. |
| FTV056 | |||||
| FTV482 | |||||
| FTV489 | |||||
| FTV491 | |||||
| FTV493 | |||||
| A3 | 1780.5 | 633–2598 | 6 | FTV501 | Ceramics that do not conform to known materials available within proximity to Altica. These ceramics contain higher concentrations of light transition metals, which is representative of more mafic volcanic rocks, such as basalts and andesitic basalts. |
| FTV502 | |||||
| FTV504 | |||||
| FTV505 | |||||
| FTV506 | |||||
| FTV507 | |||||
| T1 (Tlapacoya Reference) | 696.15 | 380–1576 | 2 | PTO744 | Ceramics from the site of Tlapacoya in the southeastern Basin of Mexico. This is one of the hypothesized sources for imports to Altica. |
| PTO784 |
| ANID | Group | L4 | L3 | L2 | L1 | C | R1 | R2 | R3 | R4 |
|---|---|---|---|---|---|---|---|---|---|---|
| FTV039 | A1 | 854.2 | 616.5 | 610.8 | 598.1 | 591.4 | 592.4 | 654.7 | ||
| FTV040 | A1 | 806.5 | 802.9 | 897.9 | 763.8 | 756.9 | 771.8 | 689.8 | ||
| FTV043 | A2 | 5549.1 | 4799.8 | 4059.5 | 3740.8 | 4089.2 | 4717.8 | 4906.8 | ||
| FTV056 | A2 | 3168.8 | 2946.1 | 2792.3 | 2784.9 | 2571.6 | 2675.2 | 2856.1 | 2856.1 | 3545.0 |
| FTV482 | A2 | 6755.3 | 2632.4 | 2448.1 | 2422.6 | 2432.6 | 2797.6 | 2954.6 | ||
| FTV489 | A2 | 3284.7 | 2713.5 | 2698.2 | 2801.3 | 2590.3 | 2682.6 | 2993.8 | 3068.3 | 3181.0 |
| FTV491 | A2 | 4450.1 | 3684.9 | 3485.4 | 3441.0 | 3653.3 | 4337.4 | 4787.0 | ||
| FTV493 | A2 | 4208.1 | 3912.1 | 3451.8 | 3253.1 | 3322.9 | 3404.2 | |||
| FTV501 | A3 | 3512.3 | 2544.0 | 2442.3 | 2384.6 | 2144.6 | 2466.0 | 3427.7 | ||
| FTV502 | A3 | 4434.3 | 3445.6 | 3166.4 | 2908.1 | 3033.3 | 3168.6 | 4327.3 | ||
| FTV504 | A3 | 3941.6 | 2573.1 | 2695.6 | 2838.9 | 2944.3 | 2890.9 | 3245.0 | ||
| FTV505 | A3 | 3609.5 | 3269.4 | 3395.1 | 3245.0 | 3255.3 | 3648.3 | 4066.7 | ||
| FTV506 | A3 | 3755.1 | 2965.4 | 2675.9 | 2649.4 | 2316.4 | 2222.8 | 2444.7 | ||
| FTV507 | A3 | 4165.0 | 3581.9 | 3796.2 | 3557.3 | 3628.6 | 3745.2 | 3332.5 | ||
| PTO744 | T1 | 1302.0 | 420.3 | 326.6 | 313.8 | 322.1 | 350.0 | 470.8 | ||
| PTO784 | T1 | 261.2 | 297.0 | 357.3 | 288.0 | 239.7 | 215.7 | 227.4 |
Publisher’s Note: MDPI stays neutral with regard to jurisdictional claims in published maps and institutional affiliations. |
© 2021 by the authors. Licensee MDPI, Basel, Switzerland. This article is an open access article distributed under the terms and conditions of the Creative Commons Attribution (CC BY) license (https://creativecommons.org/licenses/by/4.0/).
Share and Cite
Stoner, W.D.; Shaulis, B.J. Chemical Mapping to Evaluate Post-Depositional Diagenesis among the Earliest Ceramics in the Teotihuacan Valley, Mexico. Minerals 2021, 11, 384. https://doi.org/10.3390/min11040384
Stoner WD, Shaulis BJ. Chemical Mapping to Evaluate Post-Depositional Diagenesis among the Earliest Ceramics in the Teotihuacan Valley, Mexico. Minerals. 2021; 11(4):384. https://doi.org/10.3390/min11040384
Chicago/Turabian StyleStoner, Wesley D., and Barry J. Shaulis. 2021. "Chemical Mapping to Evaluate Post-Depositional Diagenesis among the Earliest Ceramics in the Teotihuacan Valley, Mexico" Minerals 11, no. 4: 384. https://doi.org/10.3390/min11040384