Article

Complexity of Respirable Dust Found in Mining Operations as Characterized by X-ray Diffraction and FTIR Analysis

1
Pittsburgh Mining Research Division, Health Hazards Prevention Branch, National Institute for Occupational Safety and Health, Pittsburgh, PA 15236, USA
2
Institute of Analytical and Bioanalytical Chemistry, Ulm University, Albert-Einstein-Allee 11, 89081 Ulm, Germany
3
Hahn-Schickard, Sedanstraße 14, 89077 Ulm, Germany
4
Department of Earth, Atmospheric and Planetary Sciences and Agronomy, Purdue University, West Lafayette, IN 47907, USA
*
Author to whom correspondence should be addressed.
Minerals 2021, 11(4), 383; https://doi.org/10.3390/min11040383
Submission received: 2 March 2021 / Revised: 19 March 2021 / Accepted: 29 March 2021 / Published: 2 April 2021

Abstract

:
The mineralogical complexity of mine dust complicates exposure monitoring methods for occupational, respirable hazards. Improved understanding of the variability in respirable dust characteristics, e.g., mineral phase occurrence and composition, is required to advance on-site monitoring techniques that can be applied across diverse mining sectors. Principal components analysis (PCA) models were applied separately to XRD and FTIR datasets collected on 130 respirable dust samples from seven mining commodities to explore similarities and differences among the samples. Findings from both PCA models classified limestone, iron, and granite mine samples via their analytical responses. However, the results also cautioned that respirable samples from these commodities may not always fit patterns observed within the model. For example, one unique sample collected in a limestone mine contained no carbonate minerals. Future predictive quantification models should account for unique samples. Differences between gold and copper mine dust samples were difficult to observe. Further investigation suggested that the key to their differentiation by FTIR may lie in the characterization of clays. The results presented in this study provide foundational information for guiding the development of quantification models for respirable mineral hazards in the mining industry.

1. Introduction

The risk of respiratory diseases associated with the mining profession is well-documented, with a large body of knowledge on the hazardous nature of mineral dusts, the types of lung diseases they cause, and effective measures of exposure monitoring and control. Respiratory hazards encountered in mining include respirable crystalline silica (RCS), aluminosilicates including asbestiform and other elongate mineral particles, respirable coal dust, and diesel particulate matter [1,2]. Of the possible mineral hazards, exposure to RCS continues to be of significant concern and is associated with silicosis [3,4,5,6], chronic obstructive pulmonary disease (COPD) [7], lung cancer [8] and possibly kidney disease [9]. It has been estimated that 314,533 workers in the mining industry and 408,175 in the oil and gas industry in the United States have had potential RCS overexposures, and it is assumed that 100% of the workforce in those industries are potentially exposed [10]. Moreover, RCS exposure is a suspected influence in the recent resurgence of coal worker’s pneumoconiosis (CWP) in the United States [11]. Monitoring and controlling exposure are key components to addressing the risk for these health effects.
Current RCS exposure monitoring techniques used in the U.S. mining industry are X-ray diffraction (XRD) [12,13] and Fourier transform infrared (FTIR) analysis methods [14,15,16] for the quantification of RCS in respirable dust samples. These techniques require analysis at off-site laboratories slowing the time it takes to make exposure data available to mining health and safety personnel. FTIR instruments are more suitable for on-site exposure analyses as they provide rapid testing, lower cost, and greater portability than XRD-based methods. Thus, researchers at the Pittsburgh Mining Research Division of the National Institute for Occupational Safety and Health (PMRD/NIOSH) have focused on investigating methods for advancing field-based RCS exposure monitoring approaches using FTIR analysis [17,18].
Based upon on-going exposure monitoring and prior knowledge of a mine site’s geology, mining operators are aware that RCS is present in respirable dust throughout the mine site. Nevertheless, the concentrations of RCS encountered by a worker throughout their shift or in any specific location can be variable and requires accurate monitoring. Thus, improving upon the established methods requires enabling on-site analysis for RCS quantification with a level of accuracy that is comparable or better than what is provided by “off-site” analysis in analytical laboratories with expert analysts. A significant analytical challenge to the advancement of on-site RCS exposure monitoring approaches is the mineralogical complexity of the dust to which miners may be exposed. Respirable mine dust is comprised of multiple mineral phases, and the composition can be highly variable within the same commodity, across geographic regions [19], and even within the same mine site [20]. It is well known that the presence of multiple mineral phases complicates the quantification of RCS for both the XRD [13,21,22] and FTIR techniques. Furthermore, certain mineral phases (e.g., kaolinite interferes in FTIR measurements) are considered infrared, analytical interferences [23,24,25].
The complex evolution of health effects is likely influenced by the mineralogical complexity of the hazard and the nature of the exposure. In some sites, miners can be exposed to multiple respirable mineral hazards simultaneously. In addition to RCS and EMPs, there is evidence that other mineral phases are associated with adverse health effects. Respirable carbonates cause irritation and acute respiratory impairment [26,27]. Although a lower risk than RCS, there is conflicting evidence between the inhalation of iron oxide minerals and an increased risk of lung cancer [28,29,30,31,32]. A comprehensive characterization of mineral dust could provide information on the mechanisms related to health effects and commodity-specific exposure pathways.
Multivariate analysis techniques are used to explore patterns and structure in complex datasets with many variables. These techniques are particularly useful in the investigation of multi-component samples in which the analytical responses are overlapped and complicated to resolve due to the complex nature of the samples [33,34]. These techniques have been utilized for the analysis of mineral phases in shale and clay [35,36]. Predictive, multivariate models, like partial least squares (PLS) analysis, have been investigated for the quantification of RCS in respirable mine dust in coal mines [37], synthetic limestone mine samples [38], and some noncoal mines [39].
Although the mineralogical complexity of respirable mine dust is generally known, a detailed study across diverse mining commodities and locations is lacking. This study reports the investigation of respirable dust from mine bulk dust samples in terms of minerals present and their response using both XRD and FTIR analysis. While XRD methods are generally considered the “gold standard” for mineral phase quantification, these methods require significant time for analysis in off-site analytical laboratories. In recent years, it has been recognized that rapid scanning methods, such as FTIR analysis, can provide quick, on-site analysis with comparable quantification of crystalline silica phases. In this study, a total of 130 mine dusts representing seven mine types or specific mining commodities and 56 mine locations were analyzed using FTIR and XRD methods. The objectives of the study were to examine the mineralogical complexity of this diverse suite of samples. In addition, chemometric analyses of both the XRD and FTIR datasets were conducted using principal components analysis (PCA) to show patterns in complex data sets. The results of these analyses will provide knowledge and focus for the future development of quantification models for advanced, on-site RCS exposure monitoring that can be applied to any mining sector.

2. Materials and Methods

In the last seven years, researchers at PMRD/NIOSH collected 144 bulk dust samples from 56 different mining operations in the United States. The bulk dust samples were generally in the form of powdered, particulate material. The samples were collected as grab samples [40] in different parts of the mine with no specific sampling strategy. The particle size and moisture content of the bulk samples were variable depending on the type of mine and the location within the mine in which they had been collected. The samples were collected during field studies conducted by NIOSH and through the interaction with individual mines and mining companies, as well as with industry organizations at the national and state level. A small number of samples were obtained during collaborations with international mining companies in Canada, South Africa, Chile, and Australia. The samples were organized by the mining commodity from which they were collected or sampled. The commodities (gold, copper, limestone, granite, sand and gravel (S&G), industrial sand, and other metals) are used to categorize the samples. Throughout this manuscript, the language “limestone mine dust sample” or “limestone sample” will be used interchangeably to refer to a sample collected or obtained from a mining operation whose primary commodity is limestone.

2.1. Dust Sample Preparation

Each bulk mine dust was inspected at the NIOSH laboratory. Dusts with excessive moisture levels were identified qualitatively through visual inspection. The dust was dried in a muffle furnace at 80 °C overnight if the moisture content was elevated. This treatment was generally sufficient to dry the material and facilitate re-aerosolization. Dust samples with particles larger than a few millimeters were removed by sieving with dry sieves, typically 106 um mesh size. The product of these pre-treatments was a dry, fine powder.

Respirable Dust Sample Collection

A single respirable dust sample was collected from each dry bulk mine dust. The respirable dust sample (“sample” from hereafter) was collected on a pre-weighed, PVC 37-mm diameter, 5-µm pore size filter inside a 3-piece styrene cassette attached to a GK2.69 sampler (MESA laboratories, Lakewood, CO). An AirTouch pump (SKC, Covington, GA) was used to maintain the desired volumetric flowrate of 4.2 L min−1 [41]. Although particle size distribution of the samples was not rigorously measured in this study, the GK2.69 sampler is a size selective sampler designed to collect “respirable size” particles as defined by the respirable ISO/ACGIH/CEN sampling convention with a 50% cut point at 4 µm [42]. The project report by Sellaro et al. indicated the particle size of respirable dust is below 8 µm [43].
The inlet of the sampler was connected with a ¼ inch internal diameter conductive tubing with the outlet of a plastic jar in which a small quantity of bulk mine dust was inserted. The jar was continuously in movement using a bench rocker. The continuous movement of the jar induced the dust material to be aerosolized and the aerosol was sampled by the sampler. A small, disposable filter element (Parker-Balston, Lancaster, NY, USA) was connected to the inlet of the jar to provide dust-free air for sampling. The collection of the sample varied from 30 min to a few hours, depending on how easily the dust material was aerosolized. Sampling was considered complete once 1–10 mg had been collected on the filter. Of the original 144 mine dust samples, 14 of these dusts were excluded from final analysis for the following reasons: (1) They did not sufficiently aerosolize (i.e., <1 mg was collected), (2) The mass collected exceeded the maximum target of 10 mg, or (3) Subtracted FTIR data was corrupted.

2.2. Analysis of the Samples

Respirable Dust Samples Analysis

After sampling was completed, each sample went through three different analyses: gravimetric analysis for determining the mass of respirable dust collected, transmission FTIR analysis for the collection of the spectrum associated with each sample, and powder X-ray diffraction direct-on-filter for the analysis of the mineral phases contained in each sample. Details for each analysis are provided below.
The samples were equilibrated, neutralized, and post-weighed in a controlled environment where the filter media had been pre-weighed. The controlled environment, at the NIOSH Pittsburgh Mining Research Division, is kept at 22 °C and 50% relative humidity. Gravimetric analysis of the samples was conducted on a microbalance (XP6, Mettler-Toledo, Columbus, OH) with a precision better than 5 µg. The gravimetric analysis was used to identify samples with an excessive amount of dust that would negatively affect the quality of the infrared spectrum.
An infrared spectrum was collected for each sample using a portable FTIR unit (Alpha, Bruker, Billerica, MA, USA). The spectrum was collected using transmission analysis, and the sample was analyzed in the center of the filter media using a specific filter holder that assures the correct positioning of the filter. Prior to sampling, the infrared spectrum of each filter medium was collected using an ambient air background spectrum from the empty sample chamber. The filter medium spectrum was then subtracted from the spectrum of the sample to remove the contribution of each filter material. Background and sample spectra were collected at a resolution of 4 cm−1, with 16 sample scans (averaged) per spectrum. The collection of the background, spectra for the blank filter and sample, and the subtraction of the blank spectrum from the sample spectrum resulted in a total analysis time of a few minutes per sample.
The samples were then sent to an analytical laboratory (H&M analytical, Cream Ridge, NJ, USA) for full scan X-ray Diffraction (XRD) analysis. The XRD analysis identified the presence of mineral phases in each sample. The Rietveld refinement was used to provide a semi-quantitative evaluation of the mineral phases in the form of percent relative abundance. The analysis was done as direct-on-filter. Each sample was mounted onto a zero-background sample holder. The sample holder was placed into a Panalytical X’pert MPD diffractometer using Cu radiation at 45 KV/40 ma. The scan was run over the range of 5° to 80° with a step size of 0.0131° and an accumulated counting time of 500 sec/step. Using these parameters, the average total acquisition time to collect an XRD pattern of a typical sample was about 3 h and 15 min. Once the diffraction patterns were obtained, the phases were identified with the aid of the Powder Diffraction File (PDF) published by the International Centre for Diffraction Data or the Inorganic Crystal Structure Database (ICSD). The analysis yielded semi-quantitative results, and the nature of the analysis, i.e., XRD analysis direct-on-filter, led to some increased uncertainty in the measurements. In some cases, the identification of a single mineral was not possible, and it was only possible to identify a mineral series or group.

2.3. Data Processing

2.3.1. Principal Components Analysis (PCA)

Principal components analysis (PCA) is an exploratory, data analysis technique that reduces the number of variables in large datasets to a smaller number of variables, called principal components (PC) while retaining the chemically relevant variation in the dataset. This technique enables easier recognition and interpretation of patterns within the data and is accomplished by solving eigenvector/eigenvalue type problems using matrix algebra. PCA was applied to both the XRD and FTIR datasets. Each dataset was imported into MATLAB (R2020, Mathworks, Natick, MA, USA) and analyzed using the PLS_toolbox (Eingenvector Research Incorporated, Manson, WA, USA). For the XRD data, the results of the Rietveld-derived mineral phases were evaluated. The PCA XRD analysis was based on 130 observations × 29 mineral phases. Each sample was an observation and the abundance of each mineral phase a variable. For the FTIR dataset, the spectrum of each sample was imported with the absorbance at each wavenumber used as an independent variable. The PCA FTIR analysis was based on 130 observations × 1765 variables.
Mean centering was used as a preprocessing approach for both the XRD and FTIR PCA models. The FTIR spectral data were normalized based on the actual dust loading on each sample filter determined using gravimetric analysis. The wavenumber region 2200–2800 cm−1 was excluded from the calculation of PCA models. This part of the spectrum was excluded as only peaks for ambient carbon dioxide occur in this region. The type of mine operation associated with each observation/sample was used to set up classes for the PCA models. The presence of the filter in the XRD analysis caused some interference with the calcite peak used for phase identification and quantification, leading to increased uncertainty for calcite measurements. For this reason, dolomite and calcite were combined into the group carbonates for the PCA analysis of the XRD data. It is important to consider that the division of samples in classes does not have any effect on the PCA model, but it is simply an approach to review the results of the PCA analysis.

2.3.2. Predictive Modeling for the Presence of Mineral Phases Using FTIR Data

The FTIR spectra of the samples were batch processed using the Essential FTIR software package (Operant LLC, Madison, WI, USA). The first derivative of each spectrum was calculated using a light smoothing (window of 5) with a Savitzky-Golay quadratic smoothing method. The first-order derivative spectra were then transferred to a spreadsheet for analysis.
The determination of the local maxima for each spectrum was conducted in the wavenumber region from 430 cm−1 to 1300 cm−1. The local maximum was defined with a change of sign in the first derivative, from positive to negative. Samples were compared on the basis of the location of the local maxima in the spectra. A scoring method was established to compare a spectrum with a reference spectrum: each time a local maximum is present in one spectrum and not in the reference, the score increases by one unit. By evaluating the entire range of 430 cm−1–1300 cm−1, the overall score indicates how close the local maxima are in the two spectra. By comparing a single sample against the entire dataset of samples, scores can be calculated. A low score indicates spectra with local maxima at the same wavenumbers; a high score indicates spectra with local maxima at different wavenumbers. For each sample and spectrum, the information of the presence of mineral phases identified by the XRD analysis in the samples was added. The scoring method that was designed to compare the spectra based on the location of their local maxima was then used to predict the presence of mineral phases in unknown samples. The hypothesis was that spectra within the database that exhibit a low score with an unknown sample are more likely to have the same mineral phases as the unknown sample.
This hypothesis was tested using the leave-one-out approach for method cross validation. One sample at a time was removed from the database and used as a testing “unknown” sample. Scores were calculated with the method described above. The spectrum with the lowest score was selected: the mineral phases present in the testing sample compared with the minerals present in the selected spectrum from the database samples. The comparison was analyzed as a number of false negatives (absence of a mineral in the low score array but present in the testing sample), false positives (presence of a mineral in the low score array but absent in the testing sample), and matches (agreement in the low score array and testing sample).

3. Results

3.1. Mineralogy Overview

A total of 29 mineral phases were identified, with α-quartz occurring in 100% of the samples. Table 1 displays the mineral phases detected and their incidence in the 130 respirable mine dust samples in terms of % relative abundance organized by the type mining commodity in which they were sampled. A visual representation of the % relative abundance of mineral phases in the samples is provided in the Appendix A (Figure A1).
Figure 1 summarizes the distribution of the number of mineral phases over the entire dataset. Most of the samples (41%) contained 5 mineral phases, and 14% and 16% of the samples contained 4 and 6 mineral phases, respectively. The rest of the samples (29%) had either ≥7 or ≤3 mineral phases. Analysis of the distribution of the number of mineral phases within each mining commodity (not displayed in the figure) revealed that samples from each commodity had an average number of mineral phases close to 5.

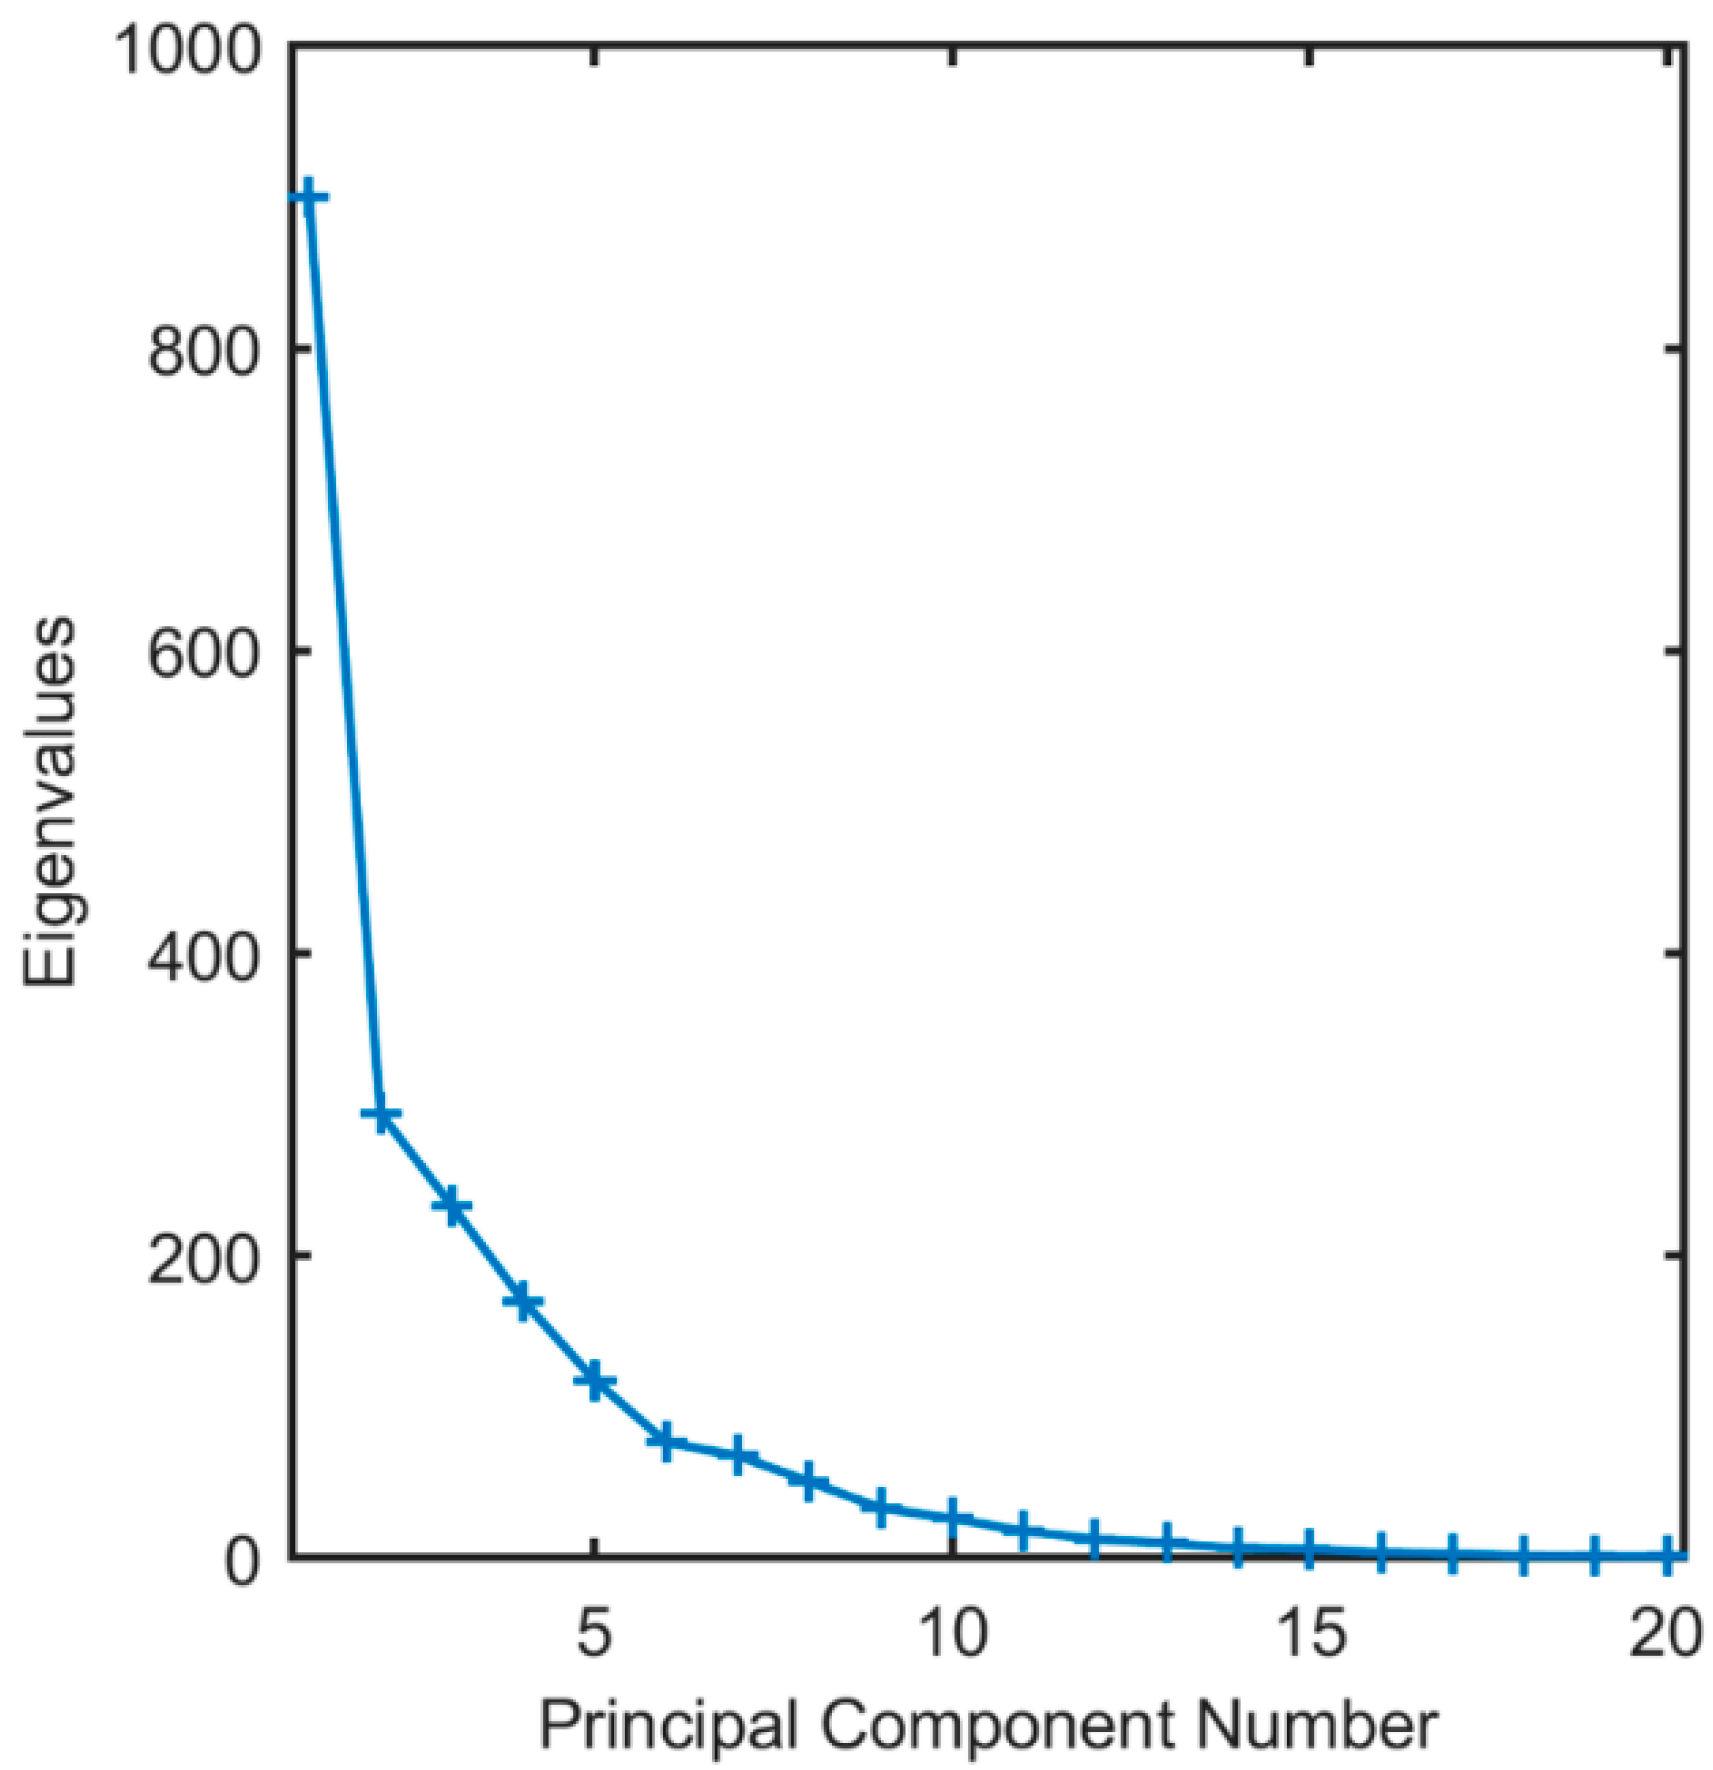
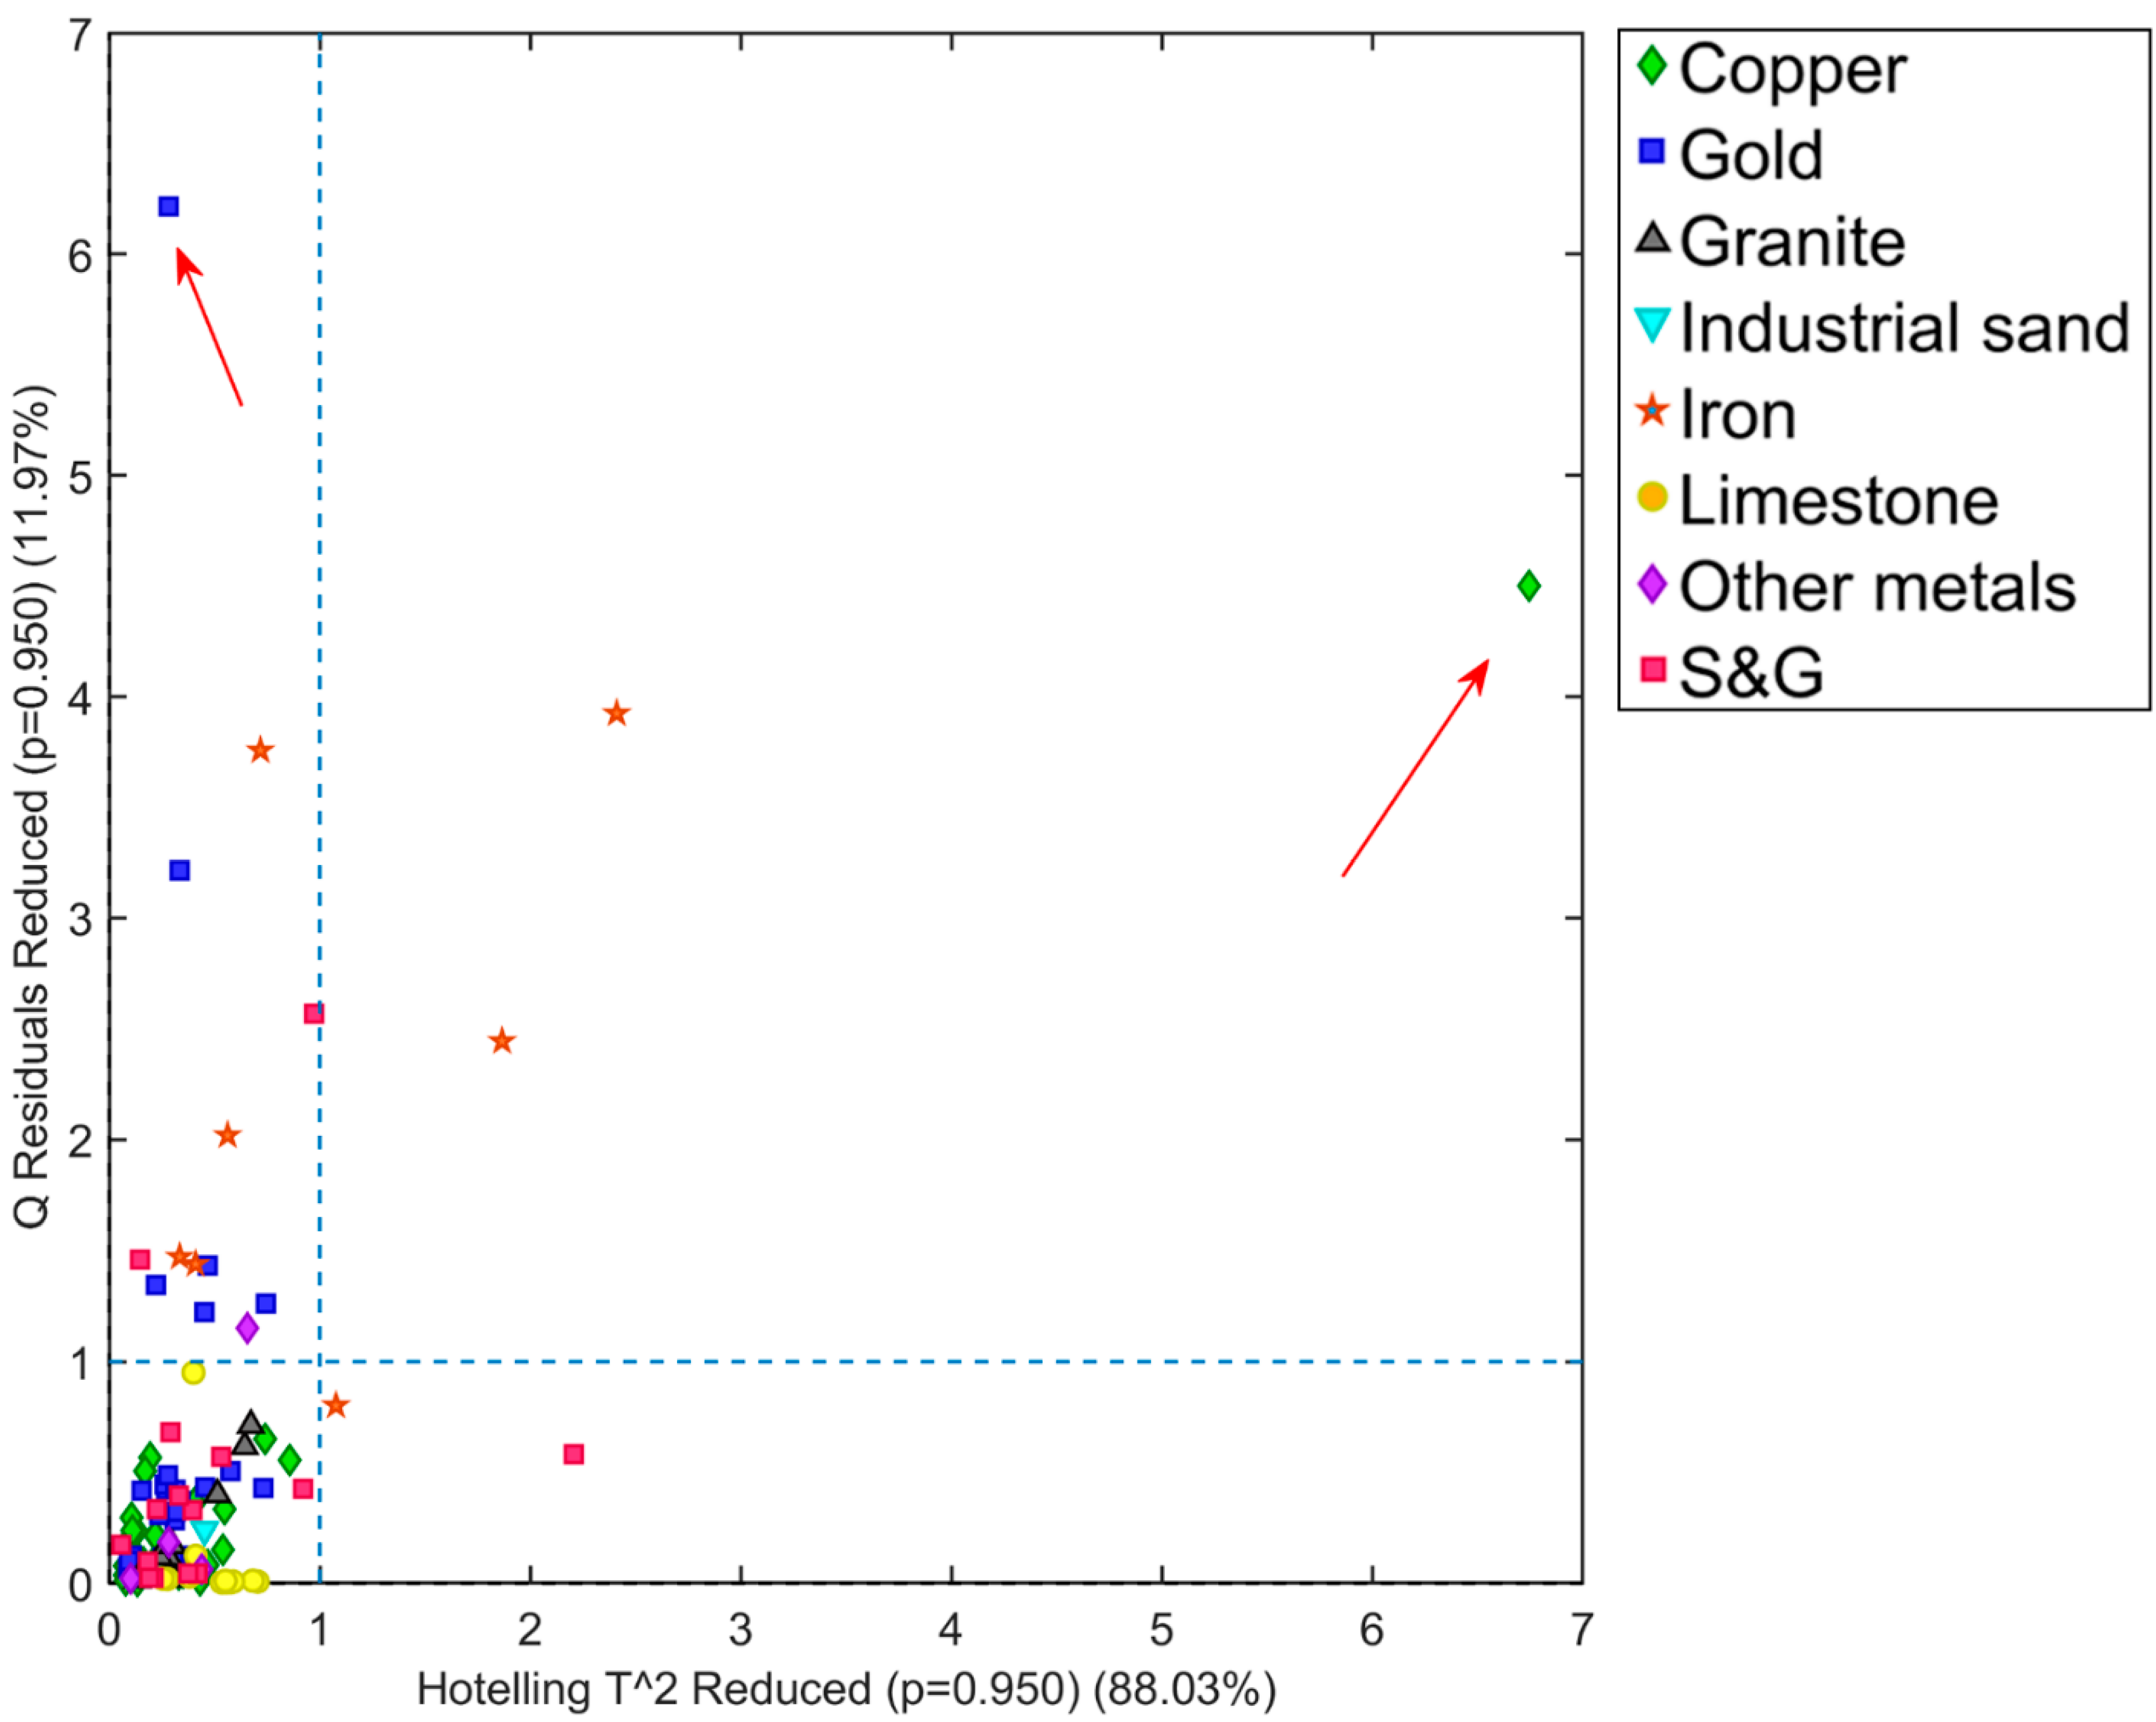
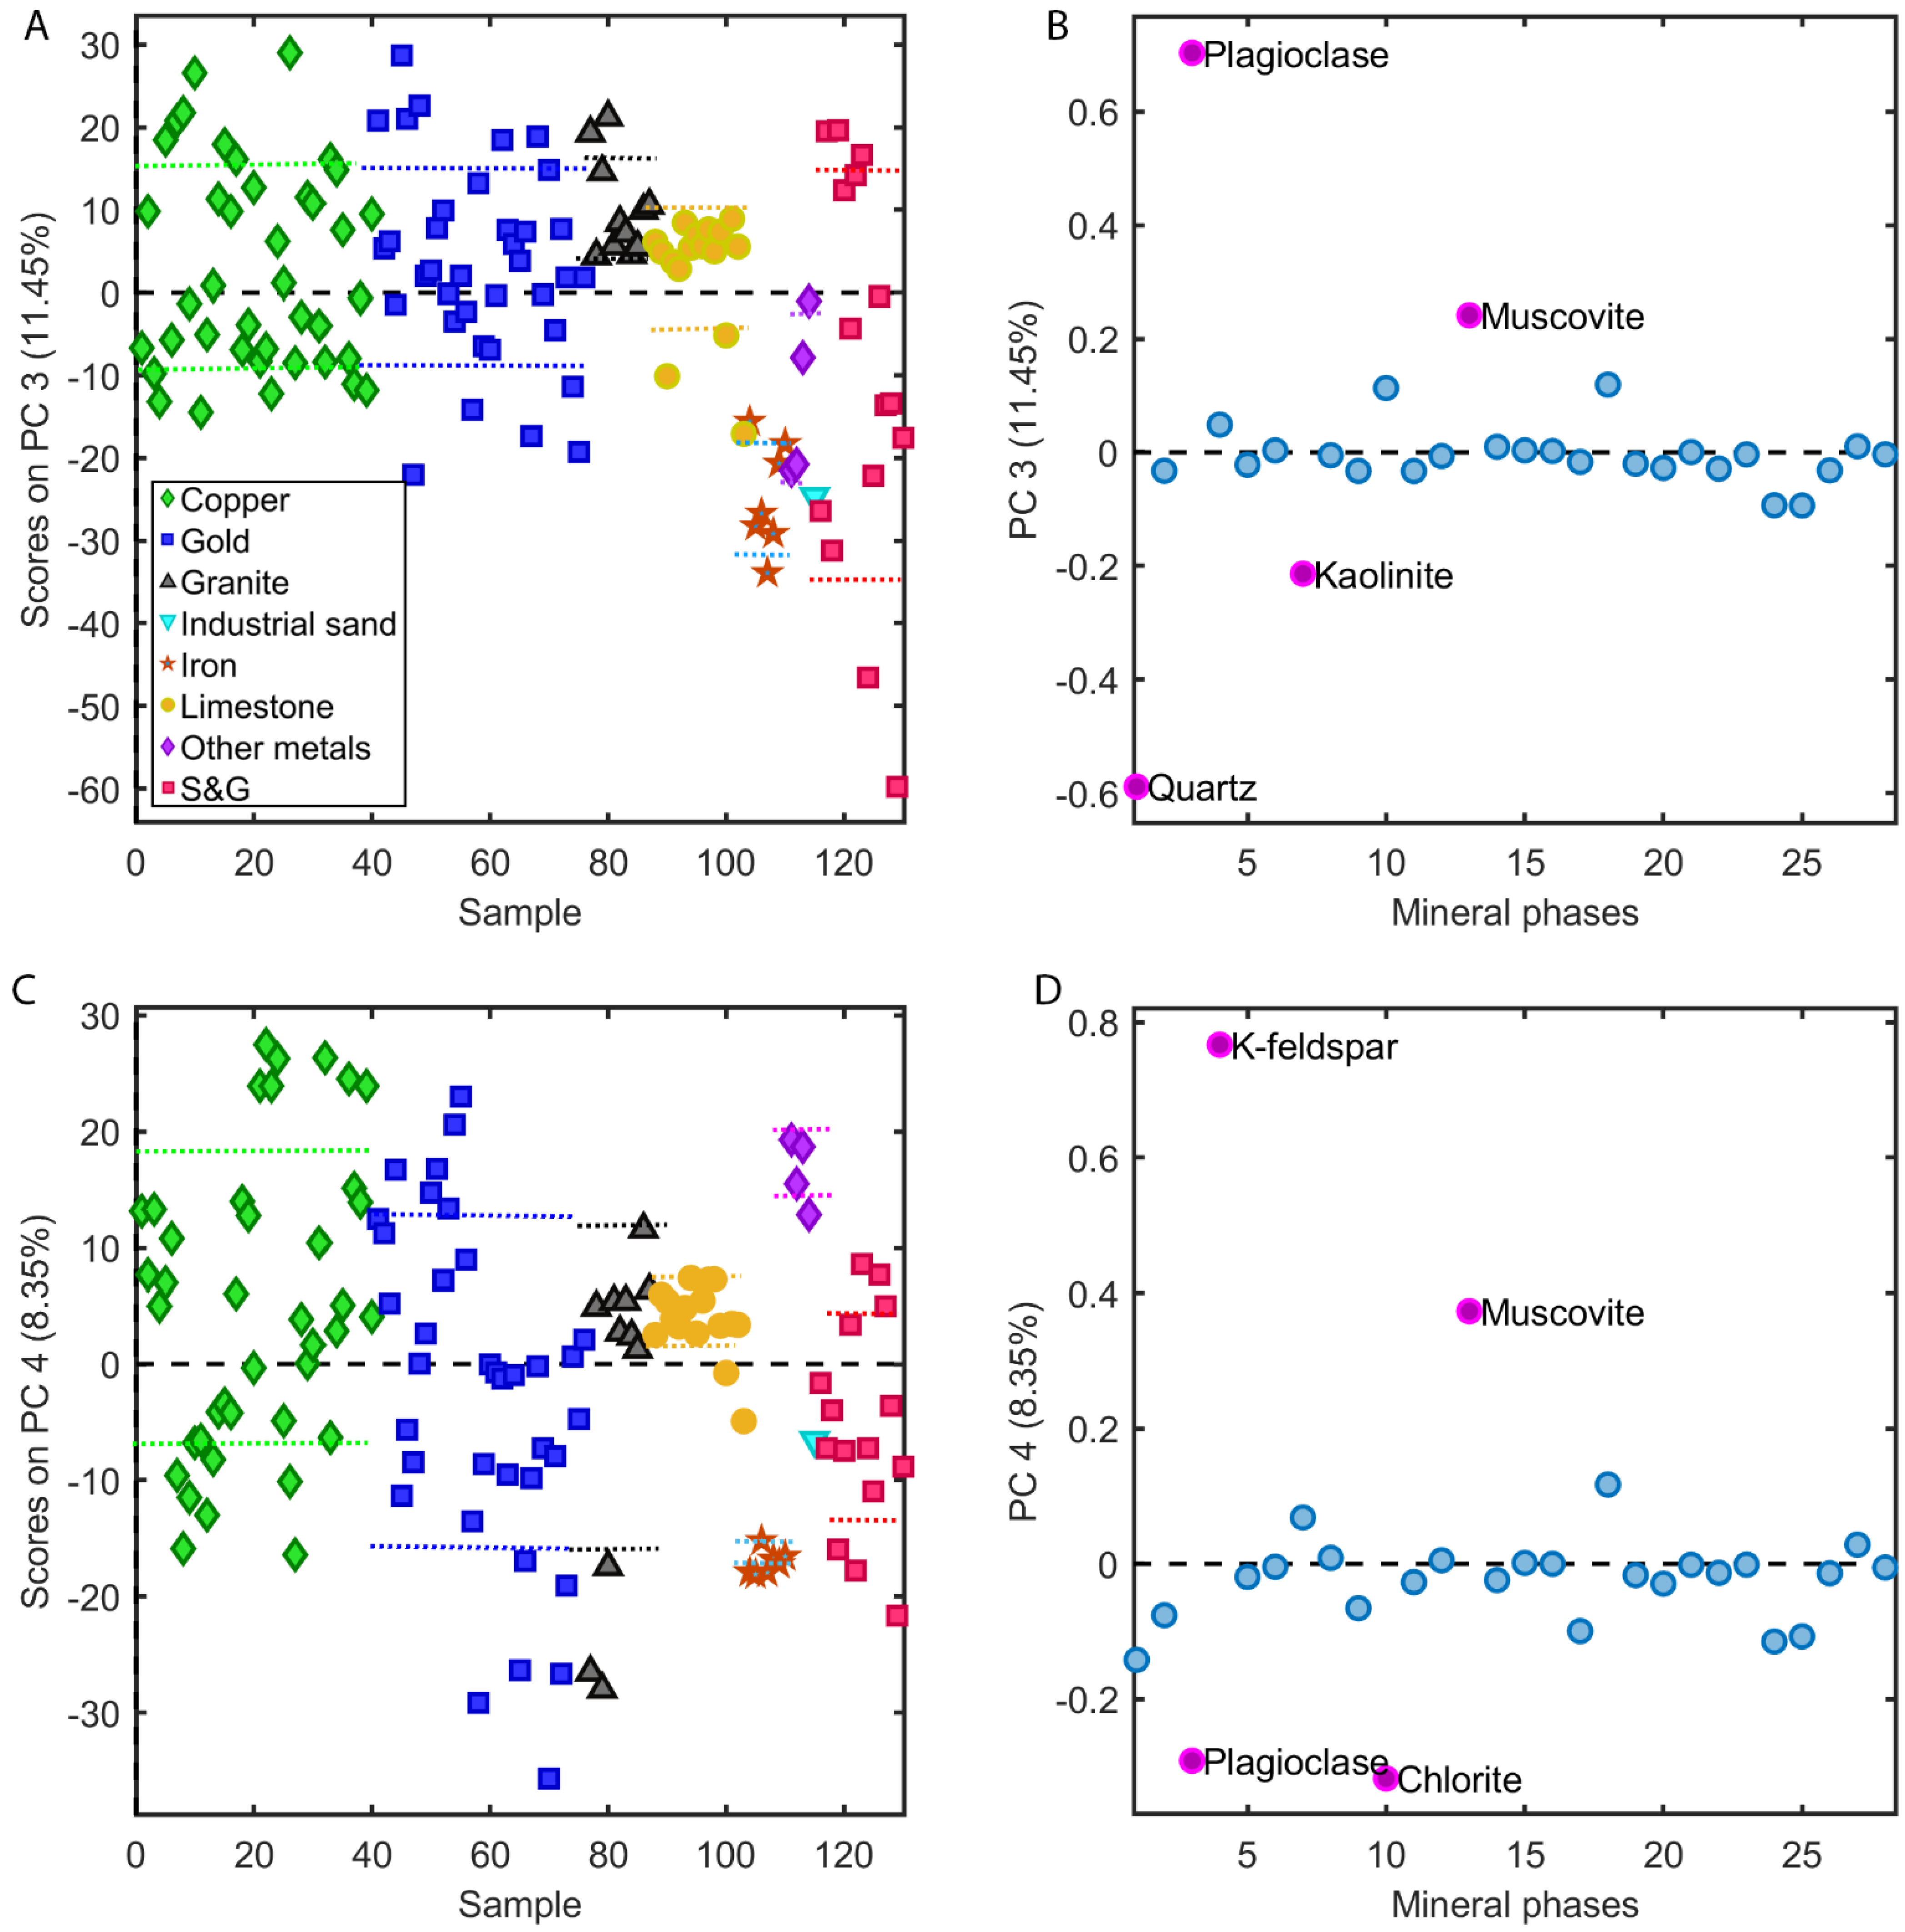
3.2. PCA of XRD Results

Principal components analysis (PCA) was applied to the XRD analysis results, where each sample was an observation and the abundance of each mineral phase a variable.
In this PCA analysis of the XRD mineralogy data, 6 principal components (PC), describing 88.03% of the variation within the data, were chosen. PC1 captures the greatest amount of variation (44.23%), and PC2 is the component describing the second greatest amount of variation (14.46%). The scree plot that was used to select the number of principal components and the variance captured by each PC are provided in the appendices (Table A1 and Figure A3). Figure 2A shows the scores on PC1 for each sample. Figure 2B displays the loadings for PC1 v. mineral phases. In the scores plot for PC1, all limestone samples have positive scores (with one exception). All granite samples have negative scores, most copper scores are negative, and the scores for iron samples show little variation along PC1. Carbonate minerals have the highest loadings along PC1 in Figure 2B.
Figure 2C displays scores on PC2 v. sample number; Figure 2D shows PC2 loadings v. mineral phases. In Figure 2C, all samples except granite samples have positive and negative scores along PC2. Iron sample scores show the least amount of variation along this component. Muscovite has the most positive loading and plagioclase and K-feldspar have the most negative loadings along PC2 (Figure 2D).
Figure 3 shows sample scores on PC1 v. sample scores on PC2. The limestone samples show some variation along PC2, and all of them, except the unique limestone sample (indicated by arrow), have positive scores on PC1. Iron samples show the least variation along PC1 and PC2, while granite samples all have negative scores on both components. Gold and copper samples are difficult to distinguish from each other. Both show variability along PC2, with scores spreading from negative to positive. Although it is very limited, more gold samples have positive scores along PC1 than copper samples.
Examination of the scores and loadings for PC3 and PC4 did not reveal any new patterns or significantly different information. Therefore, these plots are included in the Appendix A (Figure A5A–D) but are not discussed in the text in any detail. PC5 captures 5.78% of the variation in the data. Iron samples show the most variation along PC5, with the spread of their scores trending more negatively than the sample scores of other commodities in Figure 4A. The loadings of the mineral phases on PC5 are shown in Figure 4B. The mineral phases with negative loadings for PC5 are highlighted: cristobalite, kaolinite, magnetite, and hematite.

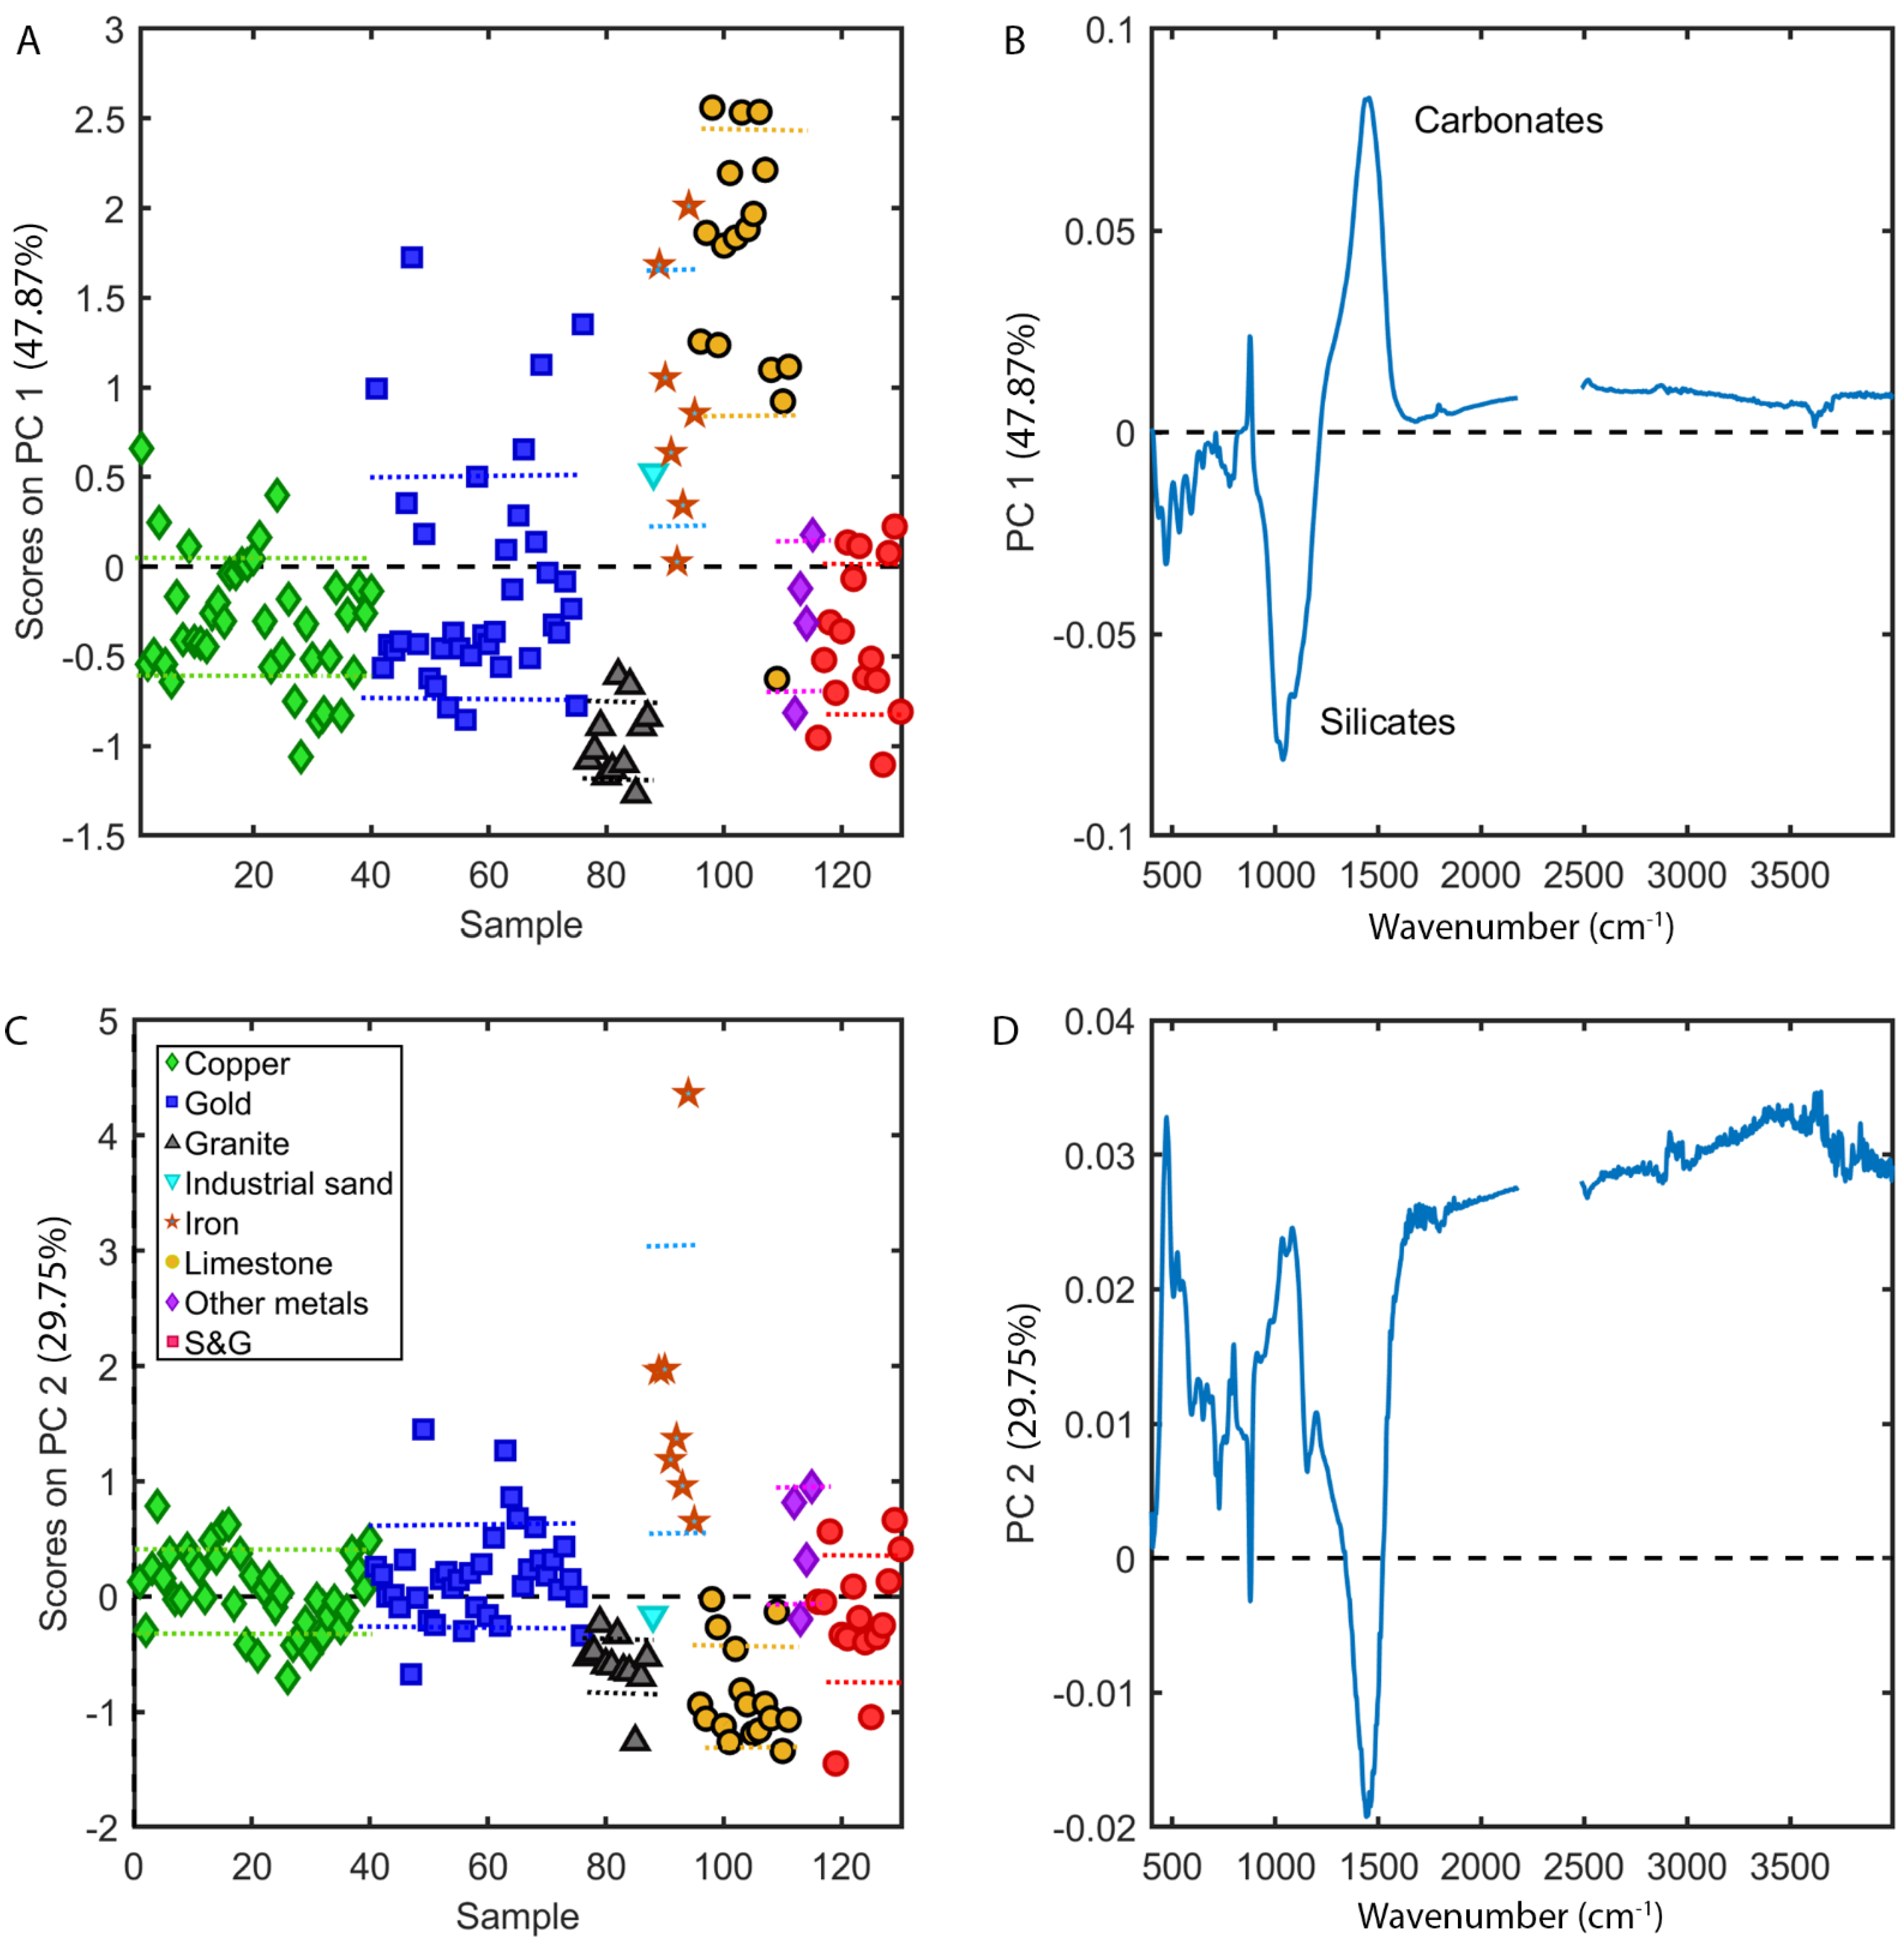
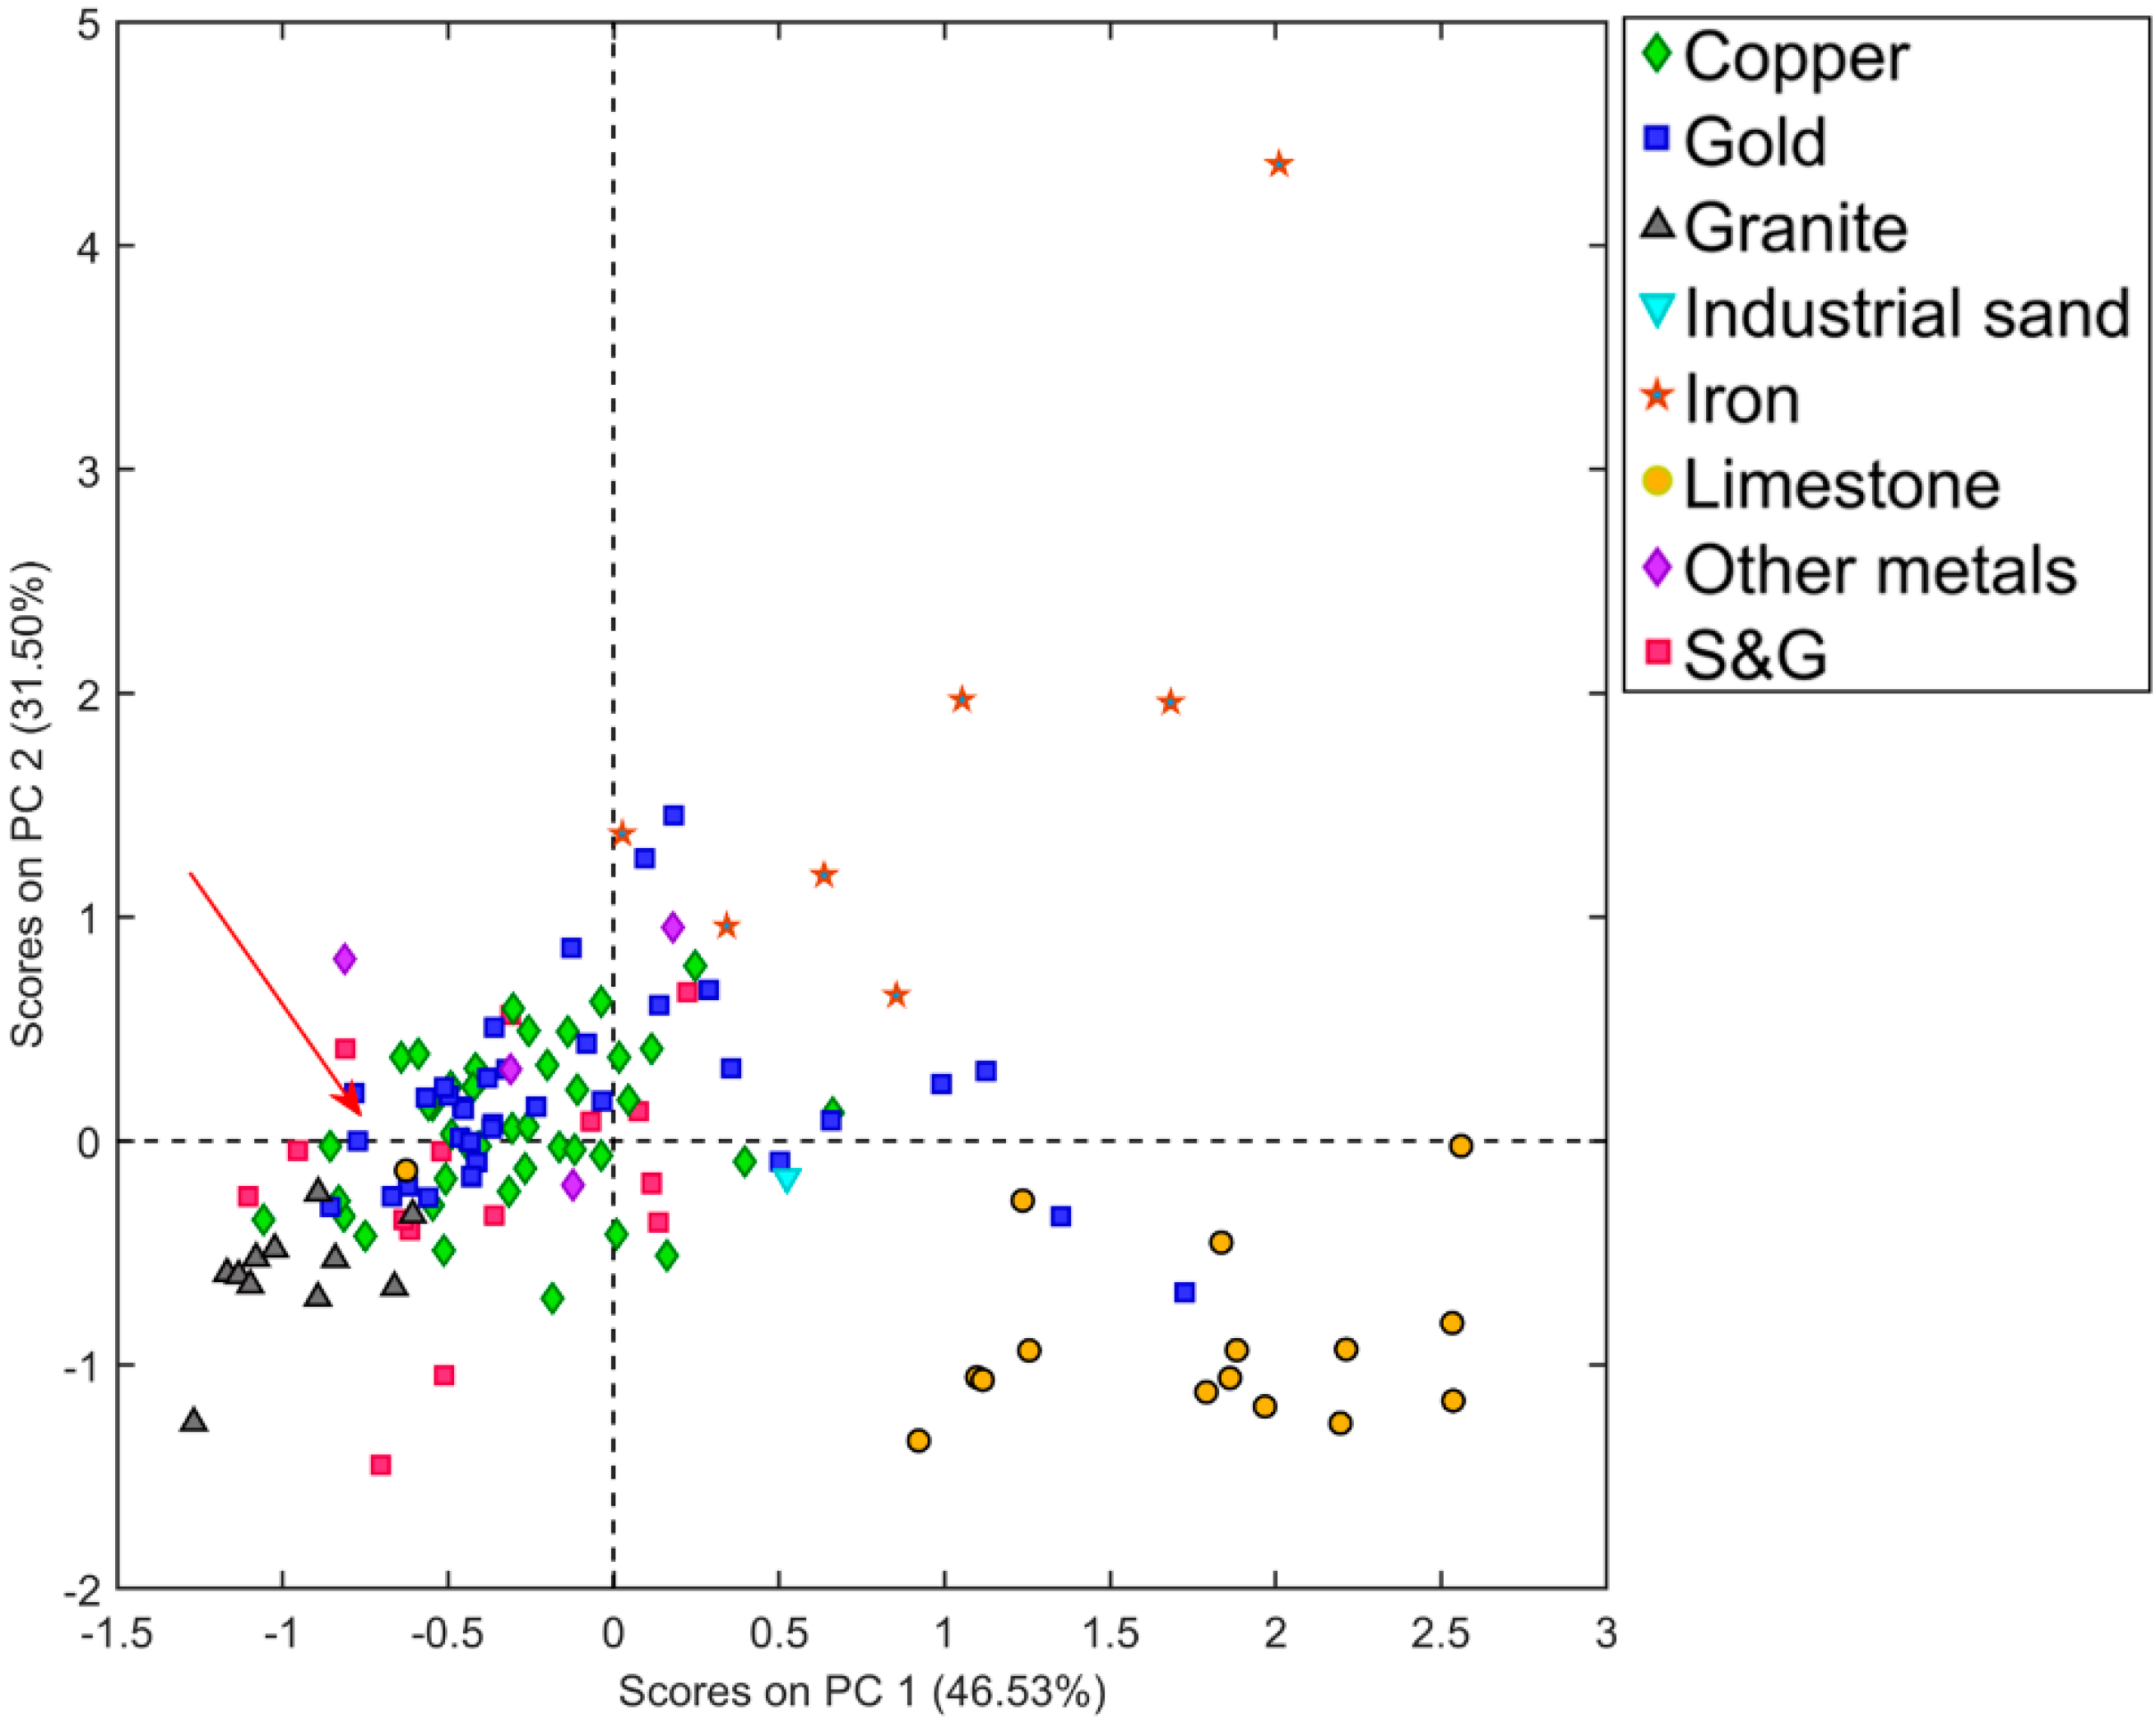
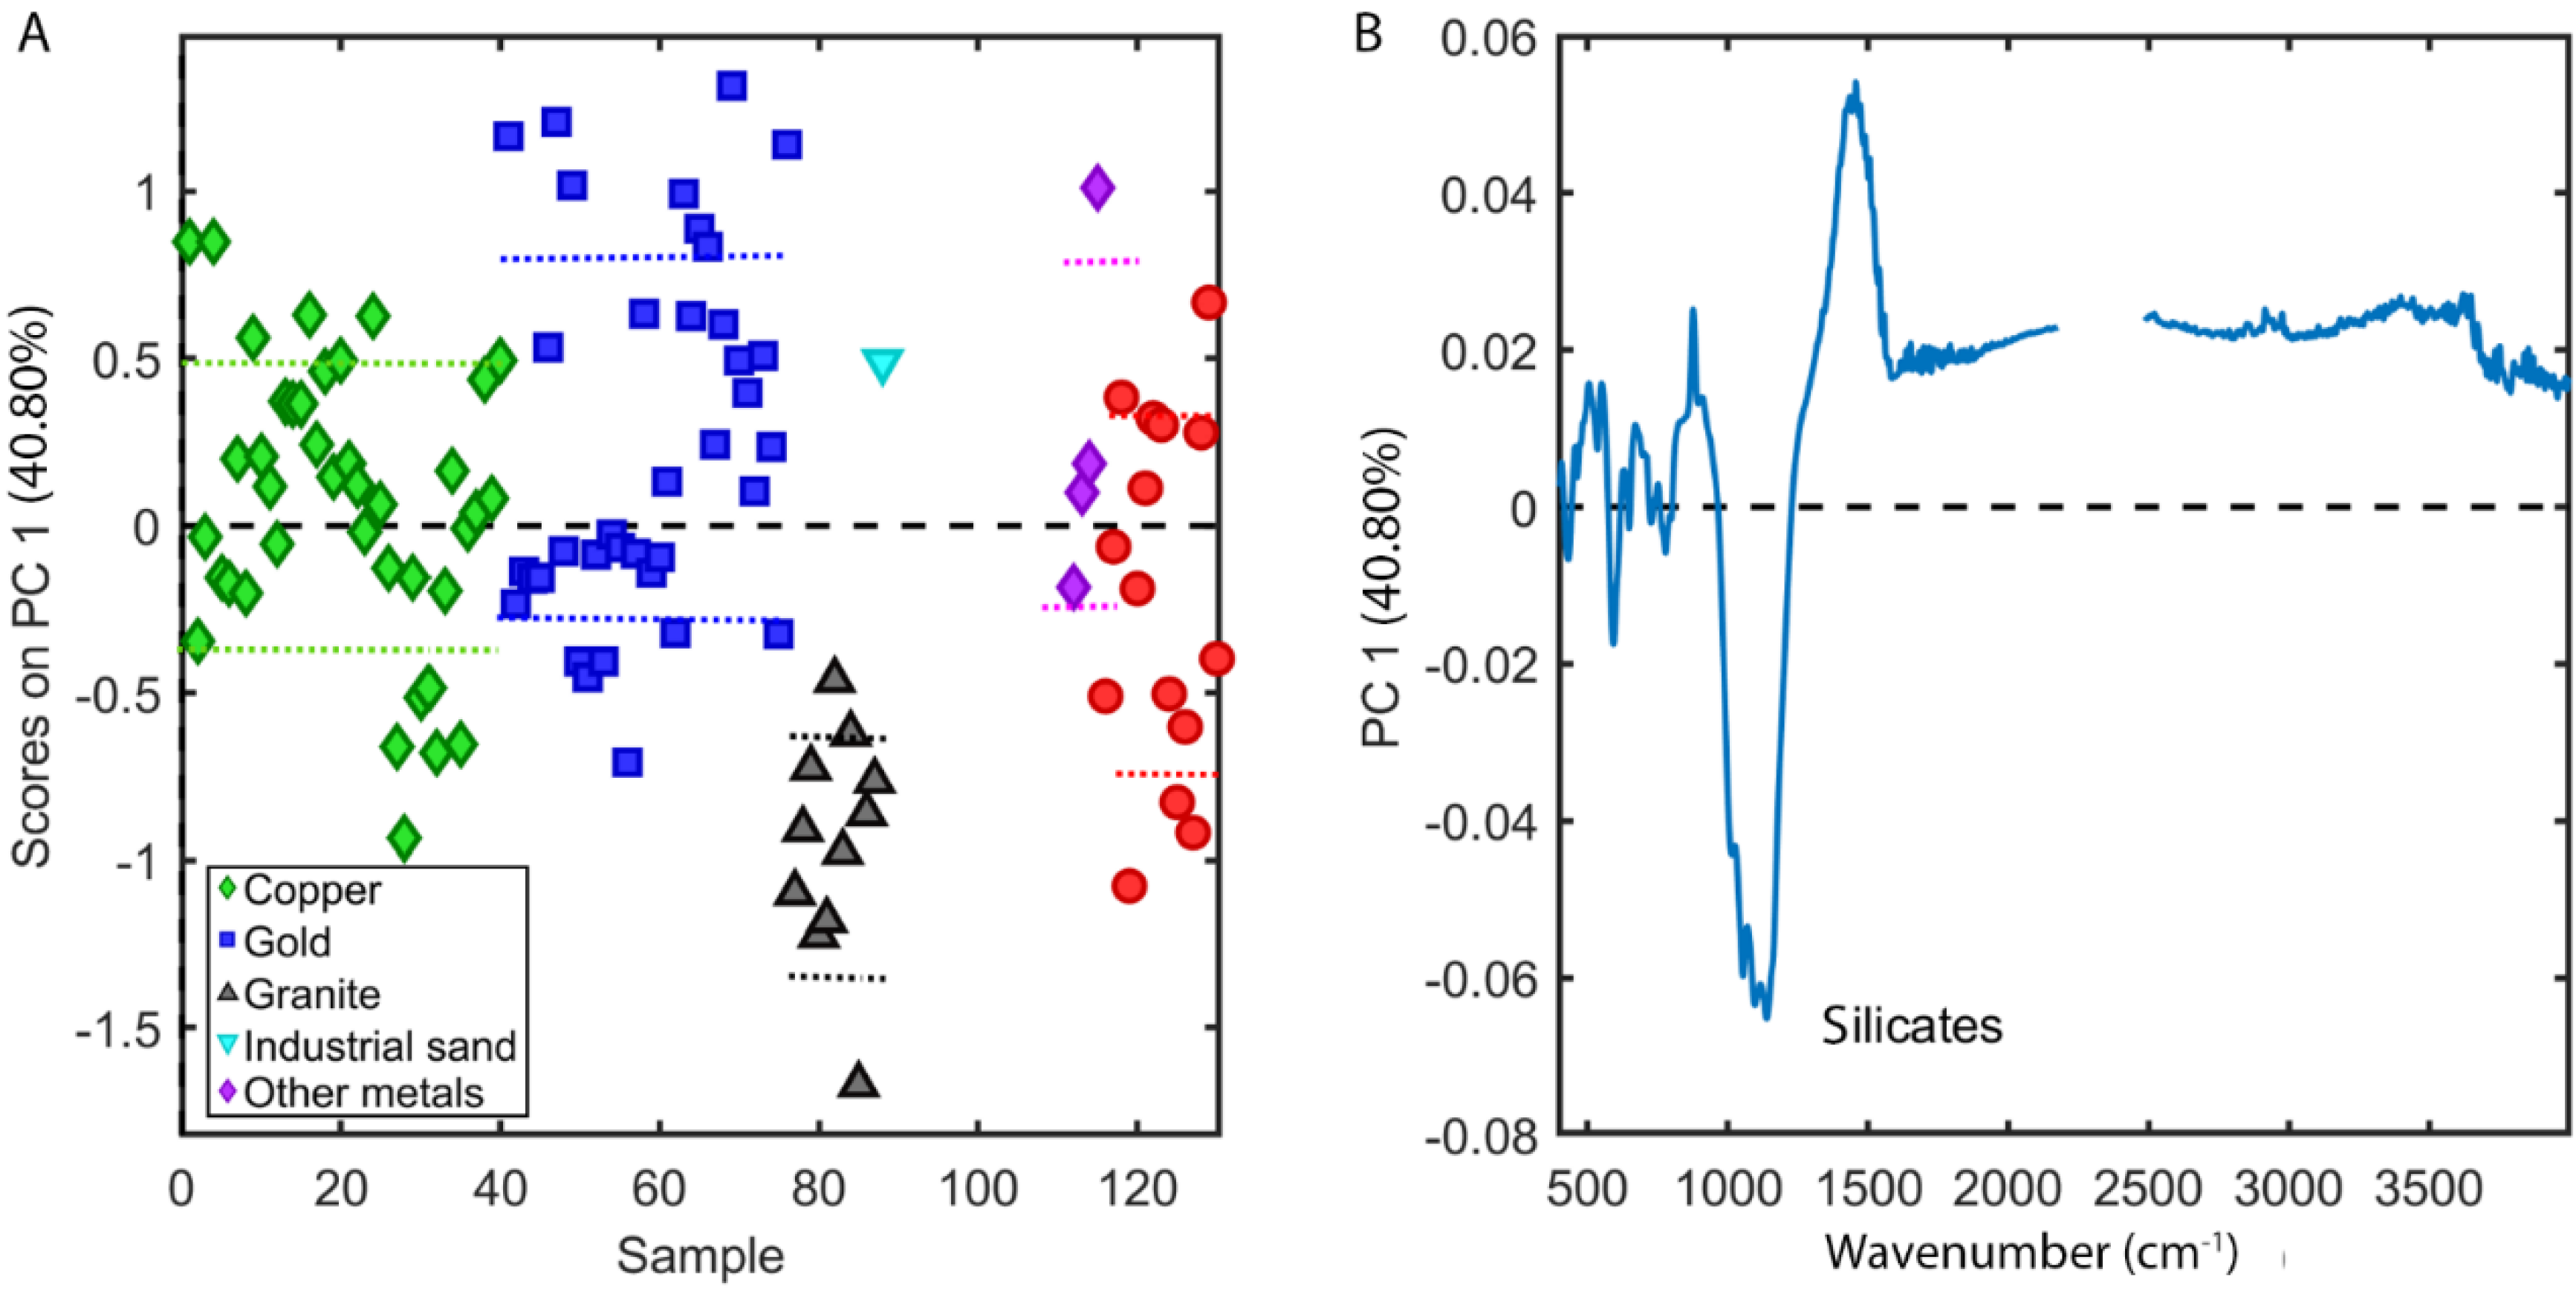
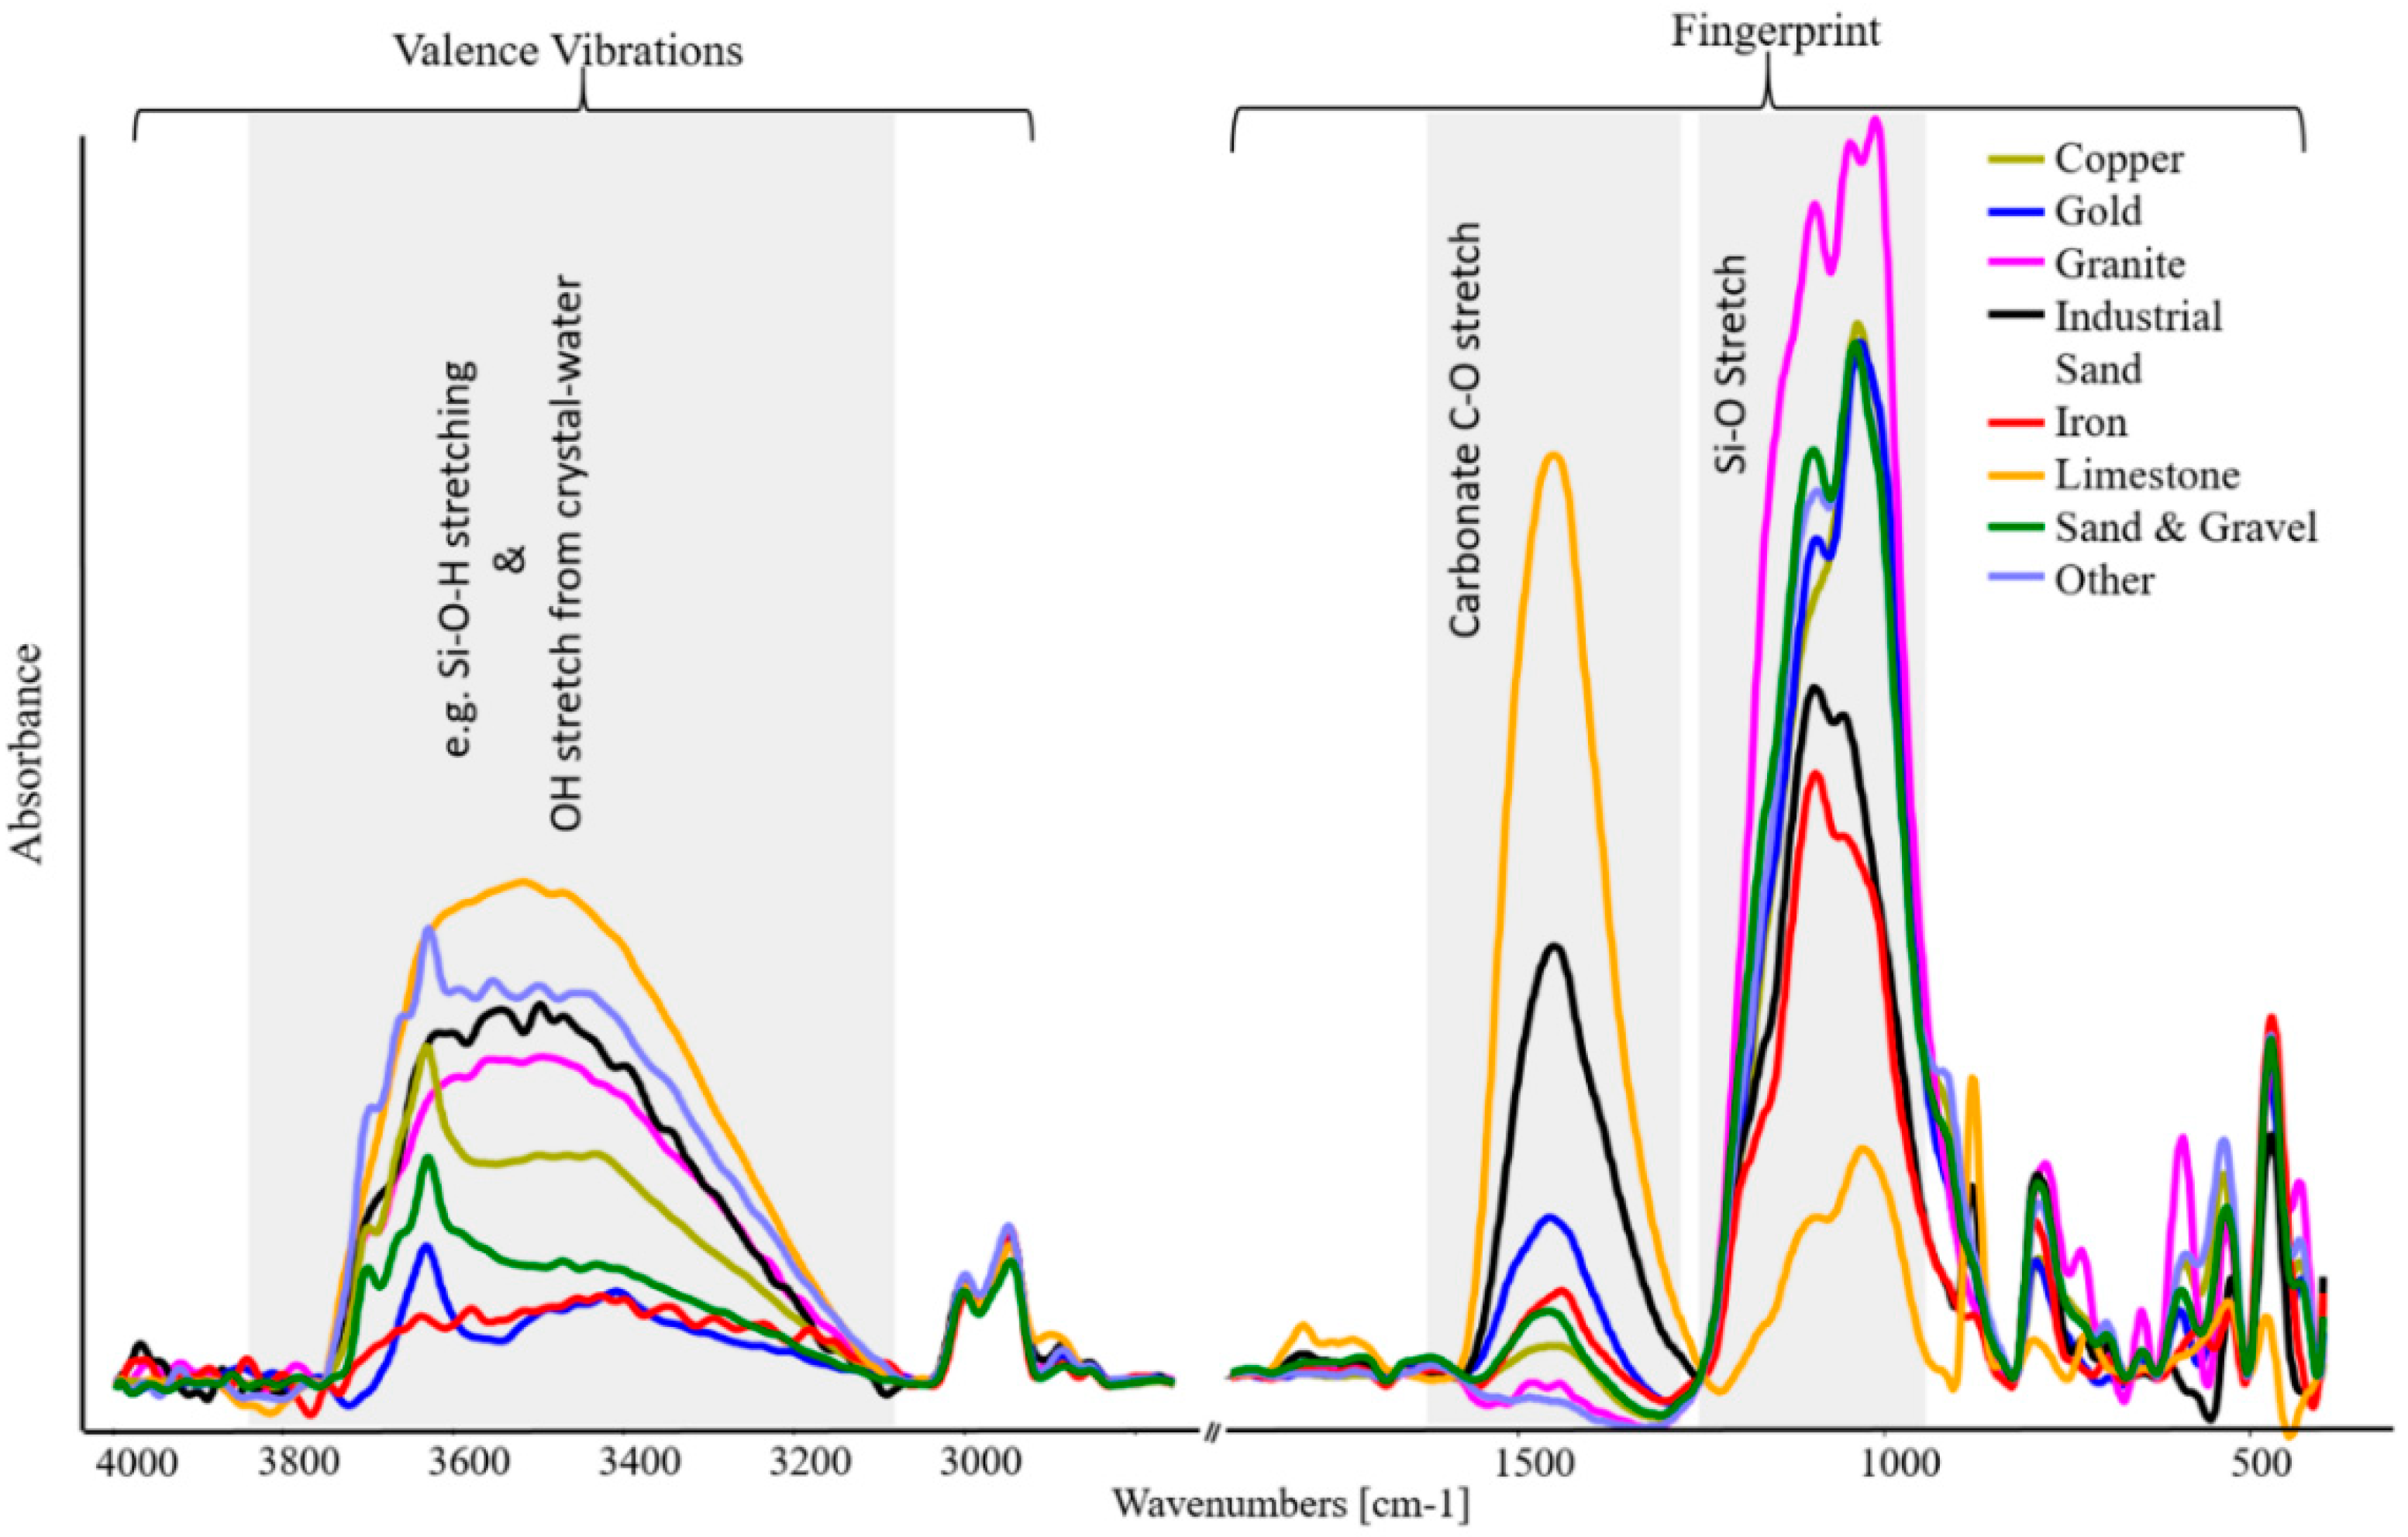
3.3. PCA of FTIR Spectra

Principal components analysis (PCA) was applied to the FTIR spectra collected on the 130 respirable dust samples. In this analysis each observation was a sample spectrum and the absorbance at each wavenumber was a variable.
Like the XRD data, the FTIR spectra were also analyzed using PCA. Percent variance captured for each principal component of the PCA FTIR model and accompanying scree plot are show in Appendix A, Table A2 and Figure A6. Six principal components, capturing 94.85% of variation, were chosen to calculate a PCA model for the 130 FTIR spectra of respirable mine dust samples. PC1 describes the largest portion of the spectra at 47.87%. The sample scores on PC1 are displayed in Figure 5A. Limestone and iron samples have mostly positive scores on PC1. There is only one limestone sample with a negative score which is indicated by an arrow. The scores for all the other samples are mostly negative. Granite sample scores are all negative. Figure 5B shows that the major spectral regions that contribute to PC1 are the silicate region (~1000 cm−1) and the carbonate region (~1400 cm−1). Part of the fingerprint region (400–800 cm−1) also negatively contributes to PC1. The scores for iron mines have the greatest variability in the positive direction along PC2 (Figure 5C). The carbonate band and a sharp peak at ~875 cm−1 are the only regions of the spectrum with negative loadings on PC2. The rest of the wavenumbers in the spectrum have positive loadings with the region 3200–3800 cm−1 having the greatest influence (Figure 5D).
Sample scores on PC1 v. sample scores on PC2 are displayed in Figure 6. The limestone samples exhibit variation along PC1, and all of them, except the unique limestone sample (indicated by arrow), have positive scores on PC1. Most of the limestone samples including the unique sample have negative scores on PC2. Iron samples vary in the positive direction along PC1 and PC2, and granite samples all have negative scores on both components. Gold, S&G, and copper samples are difficult to distinguish from each other. Each sample set shows some variability in both the positive and negative direction along both components. More gold samples have positive scores along PC1 than copper and S&G samples. S&G samples trend a bit more negatively in the PC2 direction compared with copper and gold.
Figure 7A,B display the scores and loadings plots for a PCA model of the FTIR spectra in which limestone and iron mine samples have been excluded from the dataset. The new model was calculated using 6 PCs, which captured 91.72% of the variation in the remaining samples. PC1 now describes 40.80% of the variation in the spectra. The sample scores on PC1 are displayed in Figure 7A. S&G, copper and gold mine samples have positive and negative scores along PC1, although gold samples appear to trend more positively than the others. All granite samples have negative scores on PC1. In Figure 7B, the fingerprint region of the IR spectra (400–1500 cm−1) has mostly positive loadings with the exception of 5 sharp peaks. The loadings for the silicate region are the most negative, and all other regions (>1300 cm−1) have positive loadings.
Figure 8A,B show the scores and loadings plots on PC4 for a PCA model of the FTIR spectra in which all samples except copper and gold have been excluded from the dataset. 5 PCs were used to calculate this model, which captured 88.05% of the variation in the copper and gold samples. PC4 describes 9.16% of the variation in the spectra. The sample scores on PC4 are displayed in Figure 8A. A majority of the scores for gold samples are positive, and most of the copper sample scores are negative. Figure 8C displays the average spectra with standard deviation for the samples collected in copper mines and samples collected in gold mines.

3.4. Predictive Model Based on First-Order Spectral Maxima with Mineralogy Data

A simple predictive model for identifying mineral phases in the samples was established by matching the maxima of first-order spectra of samples with their mineralogy, establishing a scoring system based on the matches, and performing a cross-validation via the leave-one-out testing method. Three parameters were used to assess model performance: (1) Calculation of the number of matches with the first-order spectrum that had the lowest score, (2) Calculation of the number of false negatives, and (3) Calculation of the number of false positives. Figure 9 displays the results of the assessment.
In the 130 samples, the XRD analysis reported overall 684 mineral phases. The predictive model identified 77% of these phases, exactly 519 phases. The incidence of the false negatives and false positives was calculated as how many times one false single false positive occurred while cross validating the model. For example, 31 times (23.9%) one false positive occurred during the 130 cross-validations. One false negative occurred 26.9% of the time. The likelihood of at least two false negatives or two false positives occurring was 23.9% and 21.5%, respectively. The likelihood of 3 or more false negatives or false positives occurring is below 10%.

4. Discussion

4.1. Mineralogy Overview

The occurrence of RCS in each of the 130 respirable dust samples is not surprising [44]. Following the feldspar mineral class, silica minerals are the second most abundant mineral family in the Earth’s crust [45]. Crystalline silica in the form of α-quartz is the most abundant silica mineral phase, and its presence is ubiquitous throughout most geologies [46]. Moreover, the underlying objective of this research is to establish foundational knowledge for the development of improved quantification models for RCS exposure monitoring, thus only samples containing quartz were of interest.
To assess the mineralogical complexity of a given respirable dust, it is helpful to determine the number of individual mineral phases present. The incidence of 5 mineral phases was reported for most of the samples (Figure 1). This information can also guide the development of quantification models for crystalline silica and other mineral phases that should account for the presence of a complex matrix. The average number of mineral phases in the matrix can affect the design and creation of the quantification models. This is the case, for example, of the need to prepare calibration samples representative of respirable mine dust using pure minerals. The calibration samples do need to account for all the possible combinations of mineral phases identified in the real samples, or at least the samples known to be interferences for a specific analytical technique. Although many standard analytical methods report mineral confounders for RCS, there are only a few limited studies that have attempted including them in the creation of quantification models [47,48], with the exception of the models for samples collected in coal mines [14].
The number of mineral phases within each commodity was consistent and in agreement with the overall distribution shown in Figure 1. For samples collected in copper, gold, granite, sand and gravel (S&G), and limestone mines, most samples contained approximately 4–6 mineral phases. It is important to note that the average number of mineral phases in the samples does not provide any information on the abundance of each mineral phase in the samples. The analysis accounts for the presence of minor mineral phases and the presence of mineral phases that are major constituents of the samples in the same way.

4.2. PCA of X-ray Diffraction Results

Examination of the XRD results shown in Figure 2A,B indicate that carbonate minerals have a substantial influence on PC1 and are responsible for much of the variation in the dataset. The simultaneous interpretation of the two plots show that there is an association between the samples collected in limestone mines and the carbonate minerals. Carbonate minerals have the major contribution in characterizing PC1 as displayed in the loading plot (Figure 2B). Additionally, the samples collected in limestone mines exhibit the highest positive scores for PC1.
The scores and loadings plots for PC2 (Figure 2C,D) indicate that samples collected in granite mines (referred to as granite samples) can be characterized almost uniquely by the variation in composition of mineral phases plagioclase and K-feldspar. This statement can be supported by evidence in both Figure 2C,D: (1) plagioclase and K-feldspar have strong negative loadings for PC2 and (2) all granite samples have negative scores on PC2. The authors note that it may not be appropriate to extrapolate this finding to respirable dust samples from any granite mine, as the granite samples in this study were collected in a single geographic region of the United States. Scores of samples from copper, gold, S&G, and other metals mines spread from negative to positive along PC2 indicating variability in the mineral phases: muscovite, plagioclase, and K-feldspar. Scores for iron mine samples show the least amount of variation along PC1 and PC2, indicating carbonates, muscovite, plagioclase, and K-feldspar may be of less importance in characterizing this sample set of iron mine dust.
The relationships between commodity groups are evident in the score plot shown in Figure 3. This figure illustrates the clustering behavior of the limestone samples indicating their similarity to each other. Inspection of the mineralogy data (Table 1) confirms the similarities amongst the limestone samples, as all these samples were collected in limestone mines and contain carbonate minerals, except one (indicated by arrows in Figure 2A and Figure 3). This sample, also collected in a limestone mine, does not follow the same trend of the samples collected in the same commodity. It can be considered unique relative to the other limestone samples. A review of the XRD analysis results for this sample confirmed the absence of carbonate minerals.
Iron and granite samples tend to form within class groups, with iron samples clustering around the zero point for both components and granite samples exhibiting negative scores for both PC1 and PC2 (Figure 3). Samples from copper, gold, and S&G mines do not form any clear groups suggesting that they are difficult to distinguish from each other. This study is not able to make statements regarding the samples collected in industrial sand and other metals mines due to the limited number of samples collected in these commodities.
The model also enables the recognition of unique samples, which is just as important as recognizing sample similarities. Unique samples can be recognized by comparing sample scores as was done to identify the unique limestone sample previously discussed. Examination of the Q residuals and Hotelling T2 values can provide indication of samples that do not fit the model from a statistical perspective. In the case of an exploratory PCA, high Q residual and Hotelling T2 values can be indicative of samples with unique characteristics. In this analysis, a unique copper sample and a unique gold sample were identified by a high Hotelling T2 and a high Q residual, respectively (see Figure A4 in Appendix A). The gold sample contained 55% alunite and the copper sample contained 97% cristobalite. The high proportion of these mineral phases in these samples was unusual compared with the percentage of these minerals in other samples within their cohort. Only two other samples in the cohort contained alunite and cristobalite as mineral phases, but at the trace level only. From a modeling perspective, these samples could be considered outliers, but since PCA is an exploratory technique, we can consider them unique samples compared to the entire dataset. With the collection of more samples and the expansion of the dataset, the unique samples can become standalone groups within or outside the commodities where they were collected.
The review of scores and loadings for PC3 and PC4 of the PCA model did not reveal substantially different information (Appendix A, Figure A5A–D). Although PC5 captures a comparatively small portion of the dataset, it is the first component that shows a clear association between the scores of the iron samples and the loadings for mineral phases that are typically found in iron dust (Figure 4A,B). The variation of the iron scores in the negative direction (Figure 4A) is likely due to the contributions of magnetite and hematite on PC5 (Figure 4B). The small variance captured by this PC can be explained by the fact that iron samples make up roughly 5% of the dataset. The distribution of variance captured by different components and the influence of different variables on each component is highly affected by the distribution of the samples in the dataset. The fact that PC1 is so strongly influenced by carbonates minerals and that samples collected in limestone mines exhibit high scores for this PC was influenced by the number of samples collected in this commodity in the entire dataset and the fact that these samples can be characterized so uniquely by carbonates.

4.3. PCA of FTIR Spectra

It is easy to see similarities and differences within the dataset and between commodity groups when reviewing a mineralogy data table, such as Table 1. However, recognizing these patterns is not as intuitive when evaluating the spectral data of the same samples. FTIR spectra of samples containing multiple mineral phases typically have characteristic bands that interfere with each other, complicating identification and quantification. The mean spectra of samples from each commodity exhibit the most variability in the region (3200–3800 cm−1), applicable to Si-OH vibrations, and the fingerprint region (400–1500 cm−1) where the quartz doublet for RCS is located (Figure A2, Appendix A). Methods like PCA are particularly useful for finding common spectral patterns in FTIR spectra in complex samples and revealing spectral regions correlated with sample variability. Moreover, PCA allows for the extraction of similar and complementary information from both XRD and FTIR datasets.
Similar to the XRD-PCA results, the presence of carbonates is the dominant spectral feature that contributes to positive PC1 scores. Thus, the limestone samples (except the unique sample), which contain the greatest proportion of carbonates, all have strongly positive PC1 scores (Figure 5A). The carbonate region of the infrared spectrum is positively correlated with PC1, indicating an association between the limestone samples and the carbonate region. The association between samples collected in limestone mines and carbonates was observed in both FTIR and XRD data analyzed by PCA. The consistent result from the separate application of PCA to both the XRD and FTIR datasets validates the FTIR-based approach of exploring mineralogical complexity of respirable mine dusts. Furthermore, the recognition of the same unique samples using both techniques cautions against the overreliance on a priori knowledge for predicting mineral composition of samples collected in the mining environment.
The results for granite samples in the PCA model of FTIR spectra also showed some agreement with the PCA model of the XRD data. Figure 5A shows that all granite sample scores are negative. While the association of negative granite scores with negative loadings from specific mineral phases was clearer by the nature of the XRD data, infrared signatures for these minerals are more complex. The broad peak at ~1000 cm−1 encompasses many vibrational peaks of several silicate mineral phases, such as the plagioclase and K-feldspar phases identified by the PCA XRD model. The bands from 400–800 cm−1 in the fingerprint region are indicative of muscovite and feldspar mineral phases. Mineralogy shows that the average feldspar content of the granite samples is 62.5%. The silicate region and the 400–800 cm−1 bands both contribute negatively to the loadings on PC1 (Figure 5B). The negative loadings of these regions suggest their importance for characterizing the granite samples.
It is also possible to make observations about the variability of the samples from other commodities. In Figure 5A, iron samples scores vary mostly in the positive direction, while gold, copper, and S&G spread in both directions along PC1. Any associations between the scores of these samples and the loadings in Figure 5B are less clear. Additionally, the limited number of samples collected in industrial sand and other metals mines prevents this study from making statements about the samples collected in these commodities.
Compared with other commodities, samples from iron mines have the greatest spread in the positive direction along PC2 (Figure 5C and Figure 6). The spectral region which contributes the most positive loadings on PC2 is the 3200–3800 cm−1 region. The loadings in this region represent the positive variation in intensity in this region of the spectrum. The iron samples scores had the most variation in the positive direction. Moreover, the three iron samples with the highest positive scores contained large amounts of magnetite, and their spectra contained high intensity, broad absorption bands in the same region. This observation suggests the higher intensity in this region may be associated with the presence of magnetite.
Grouping behavior of certain sample classes observed in the PCA model of XRD data can be recognized in the PCA model of the samples’ FTIR spectra. The plot in Figure 6 shows that the limestone samples cluster together in the lower right-hand quadrant of the plot. Iron and granite samples also form clear groups. The iron samples spread into the upper right-hand quadrant of the plot, a pattern distinct from all the other sample classes. All the granite samples have negative scores on PC1 and PC2 and form a tighter group. Samples from copper, gold, and S&G mines do not form any clear groups suggesting that they are difficult to distinguish from each other in the model and may be difficult to characterize.
The same unique limestone sample is also recognized in the PCA model of FTIR and is indicated by the arrow in Figure 6. Samples with unique characteristics were also identified by their high Q residual or Hotelling T2 values (Figure A7, Appendix A). The same unique copper and gold samples identified in the PCA model of the XRD data also identified exhibited high Q residual and Hotelling T2 values in the PCA model of the FTIR spectra, distinguishing them from the other samples within their commodities as well as the dataset as a whole. These samples are indicated with arrows in Figure A7. Additionally, the PCA models of both techniques can recognize the iron mines as unique relative to the whole sample set, as there are so few iron samples.
The removal of limestone and iron samples from the spectral dataset allows for closer investigation of further structure within the remaining samples. Copper, gold, and S&G sample scores in Figure 7A appear to trend more positively. Although limestone samples have been excluded, Figure 8B shows the carbonate peak still contributes positive loadings on PC4. Moreover, the sharp peak at 875 cm−1 can be attributed to calcite and has a positive loading on PC1. Perusal of the sample mineralogy in Table 1 shows medium to high incidence of calcite and dolomite in copper, gold, and S&G samples, suggesting their association within the model. The granite samples retain negative score positions, and the loadings of the silicate region in Figure 7B remains strongly negative. The higher incidence of carbonates in copper and gold mine samples, compared with the incidence in granite mine samples coupled with the loadings strengthens the supposition that the silicate region may be used for characterizing and distinguishing granite samples.
Throughout this study, patterns specific to copper or gold samples, which could indicate ways to characterize them, were difficult to identify. To investigate the structure of these samples further, a PCA model was calculated for copper and gold mine samples with samples from all other commodities excluded from the dataset. No clear associations between samples scores and loadings were observed until PC4 was considered. At this point, some differences in the scores of both sample classes emerge. Gold samples have more positive scores, while copper samples have more negative scores in Figure 8A. In Figure 8B, most of the features in the fingerprint region have positive loadings, as does the carbonate region. Three sharp features in the fingerprint region around 500–800 cm−1 and the Si-OH stretching region (>3200 cm−1) of the spectrum have negative loadings; however, the Si-OH stretching region contributions are the strongest.
The variability of the copper and gold spectra were studied to determine which spectral features contribute to the splitting of the gold and copper samples scores (Figure 8C). Common features in the spectra of both copper and gold samples include sharp peaks in the fingerprint region that are indicative of feldspar and muscovite mineral phases and the broad and intense silicate peak around 1000 cm−1. The notable differences between the two commodities are lower intensity peaks for carbonates (~1400 cm−1) and higher intensity, more defined peaks for kaolinite (~3600 cm−1). XRD mineralogy data confirm that copper samples on average contain lower amounts of carbonate minerals and higher amounts of kaolinite compared with gold samples. The spectral features and mineralogy suggest the hypothesis that the splitting of copper and gold scores is due to the anti-correlation between the loadings for the carbonate region and the Si-OH stretching region.
The authors note that the need to use PC4, which only describes 9.04% of the variation in the samples, underscores the complexity of the samples from an analytical standpoint. Moreover, it may not be possible to extrapolate these interpretations to samples from any gold and copper mine due to the limited number of samples in this dataset as well as the use of a principal component which describes a small percentage of the data.

4.4. Predictive Model Based on First-Order Spectral Maxima with Mineralogy Data

The model created with the dataset explores the possibility of predicting the presence of specific mineral phases using FTIR spectra of the samples and verified with XRD mineralogy data of the same samples. The model was developed for several reasons. The PCA models of the FTIR spectra and XRD mineral phases data highlighted the complexity of the composition respirable dust present in mining environments. The PCA models also enabled the possibility of investigating associations between the composition and the commodity where the samples were collected. The two PCA investigations presented similar findings for the samples but from different perspectives. The simple predictive model tested the agreement of the findings from the two analytical techniques. Moreover, the predictive model showed that the FTIR could predict the correct mineral phase 77.1% of the time, independently from the commodity where the sample was collected. The model predicted mineral phases that were not present or missed phases that were present less than 30% of the time. Thus, the model demonstrates that both techniques capture similar sample complexities most of the time. The occurrences of false positives or false negatives indicate where the two techniques differ in their description of the samples. These differences can be attributed to the differences in the physical, fundamental mechanisms of each technique as well as their specific instrumental limitations.
In addition to sample complexity, fundamental instrumental limitations are also important to consider when building quantification models. When quantification is necessary, the presence of other minerals in samples may interfere with the signal of the target mineral. In FTIR analyses, silicate minerals pose many interferences in the fingerprint region where the quartz doublet is located. XRD quantitative analysis techniques are affected by preferential orientation and have difficulty addressing amorphous phases. The predictive model can be considered a first step for the development of quantification models for RCS to be used for on-site monitoring using portable FTIR. For example, the model could predict the presence of mineral phases in each respirable dust sample analyzed in the field with a portable FTIR using a direct-on-filter technique. The identification of mineral phases using FTIR can direct the analyst to the use of an appropriate, advanced quantification model. The use of a simple predictive model for quick identification of mineral phases as a precursor to quantification may be useful especially considering the samples with unique and unexpected mineralogy that may be encountered in the mining setting.
Although this study provided valuable information on the complexity of the respirable mine dust samples in terms of mineralogical composition, the dataset cannot be used to generalize these findings as representative for any mine dust. The distribution of the samples in the dataset, in terms of samples from different commodities, was based on the success of collecting bulk dust samples from mining operators. The distribution was not designed to represent the variability of mine dust or the presence of the different commodities in the United States. In addition, although not reported, the geographical location of the mine operations where the samples were collected was not part of the study design process. Another limitation was the nature of the respirable dust samples analyzed via X-ray diffraction. With the intent of analyzing the same sample with both analytical techniques, direct-on-filter X-ray diffraction was employed on the samples. The small quantity of sample on the filter and the presence of the filter media influenced the quality of the quantification of the mineral phases in each sample. For example, the quantification of calcite was affected by the filter media and the preferred orientation of some mineral phases was enhanced by the direct-on-filter approach. Future studies should consider the idea of using powdered respirable samples for XRD analysis. Finally, particles size distribution and morphological analyses were not included in this study. These factors are important in characterizing health effects of respirable dust exposure and should also be considered in subsequent research.

5. Conclusions

This study investigated the complexity, in terms mineral phase composition, of respirable dust samples collected in 7 different mining commodities using FTIR and XRD analysis. From the results of the study, it is possible to summarize the following conclusions:
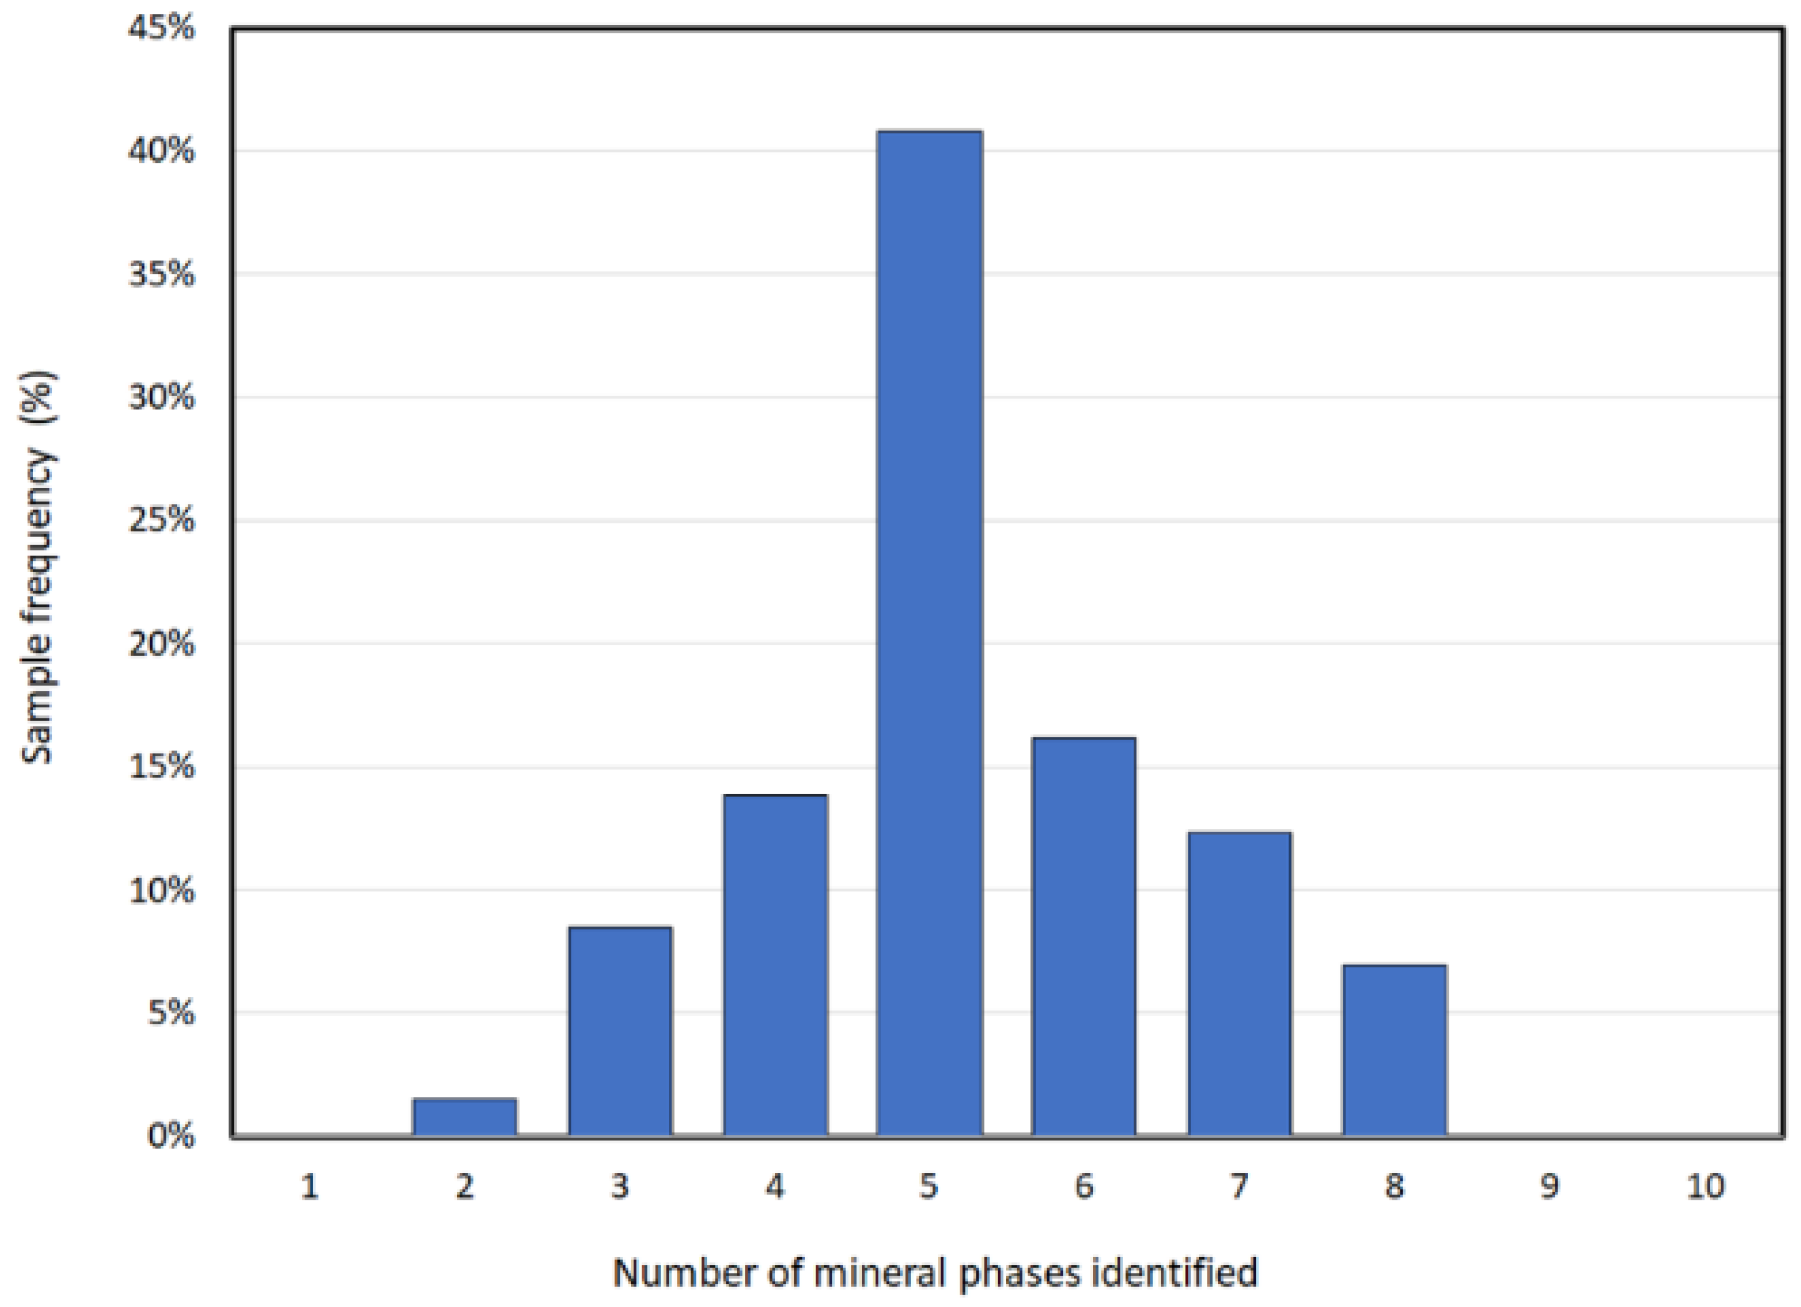
  • Mineral phases were identified by XRD analysis and Rietveld refinement. Most of the samples included in this study contained 5 mineral phases regardless of the mining commodity in which the samples were collected or obtained.
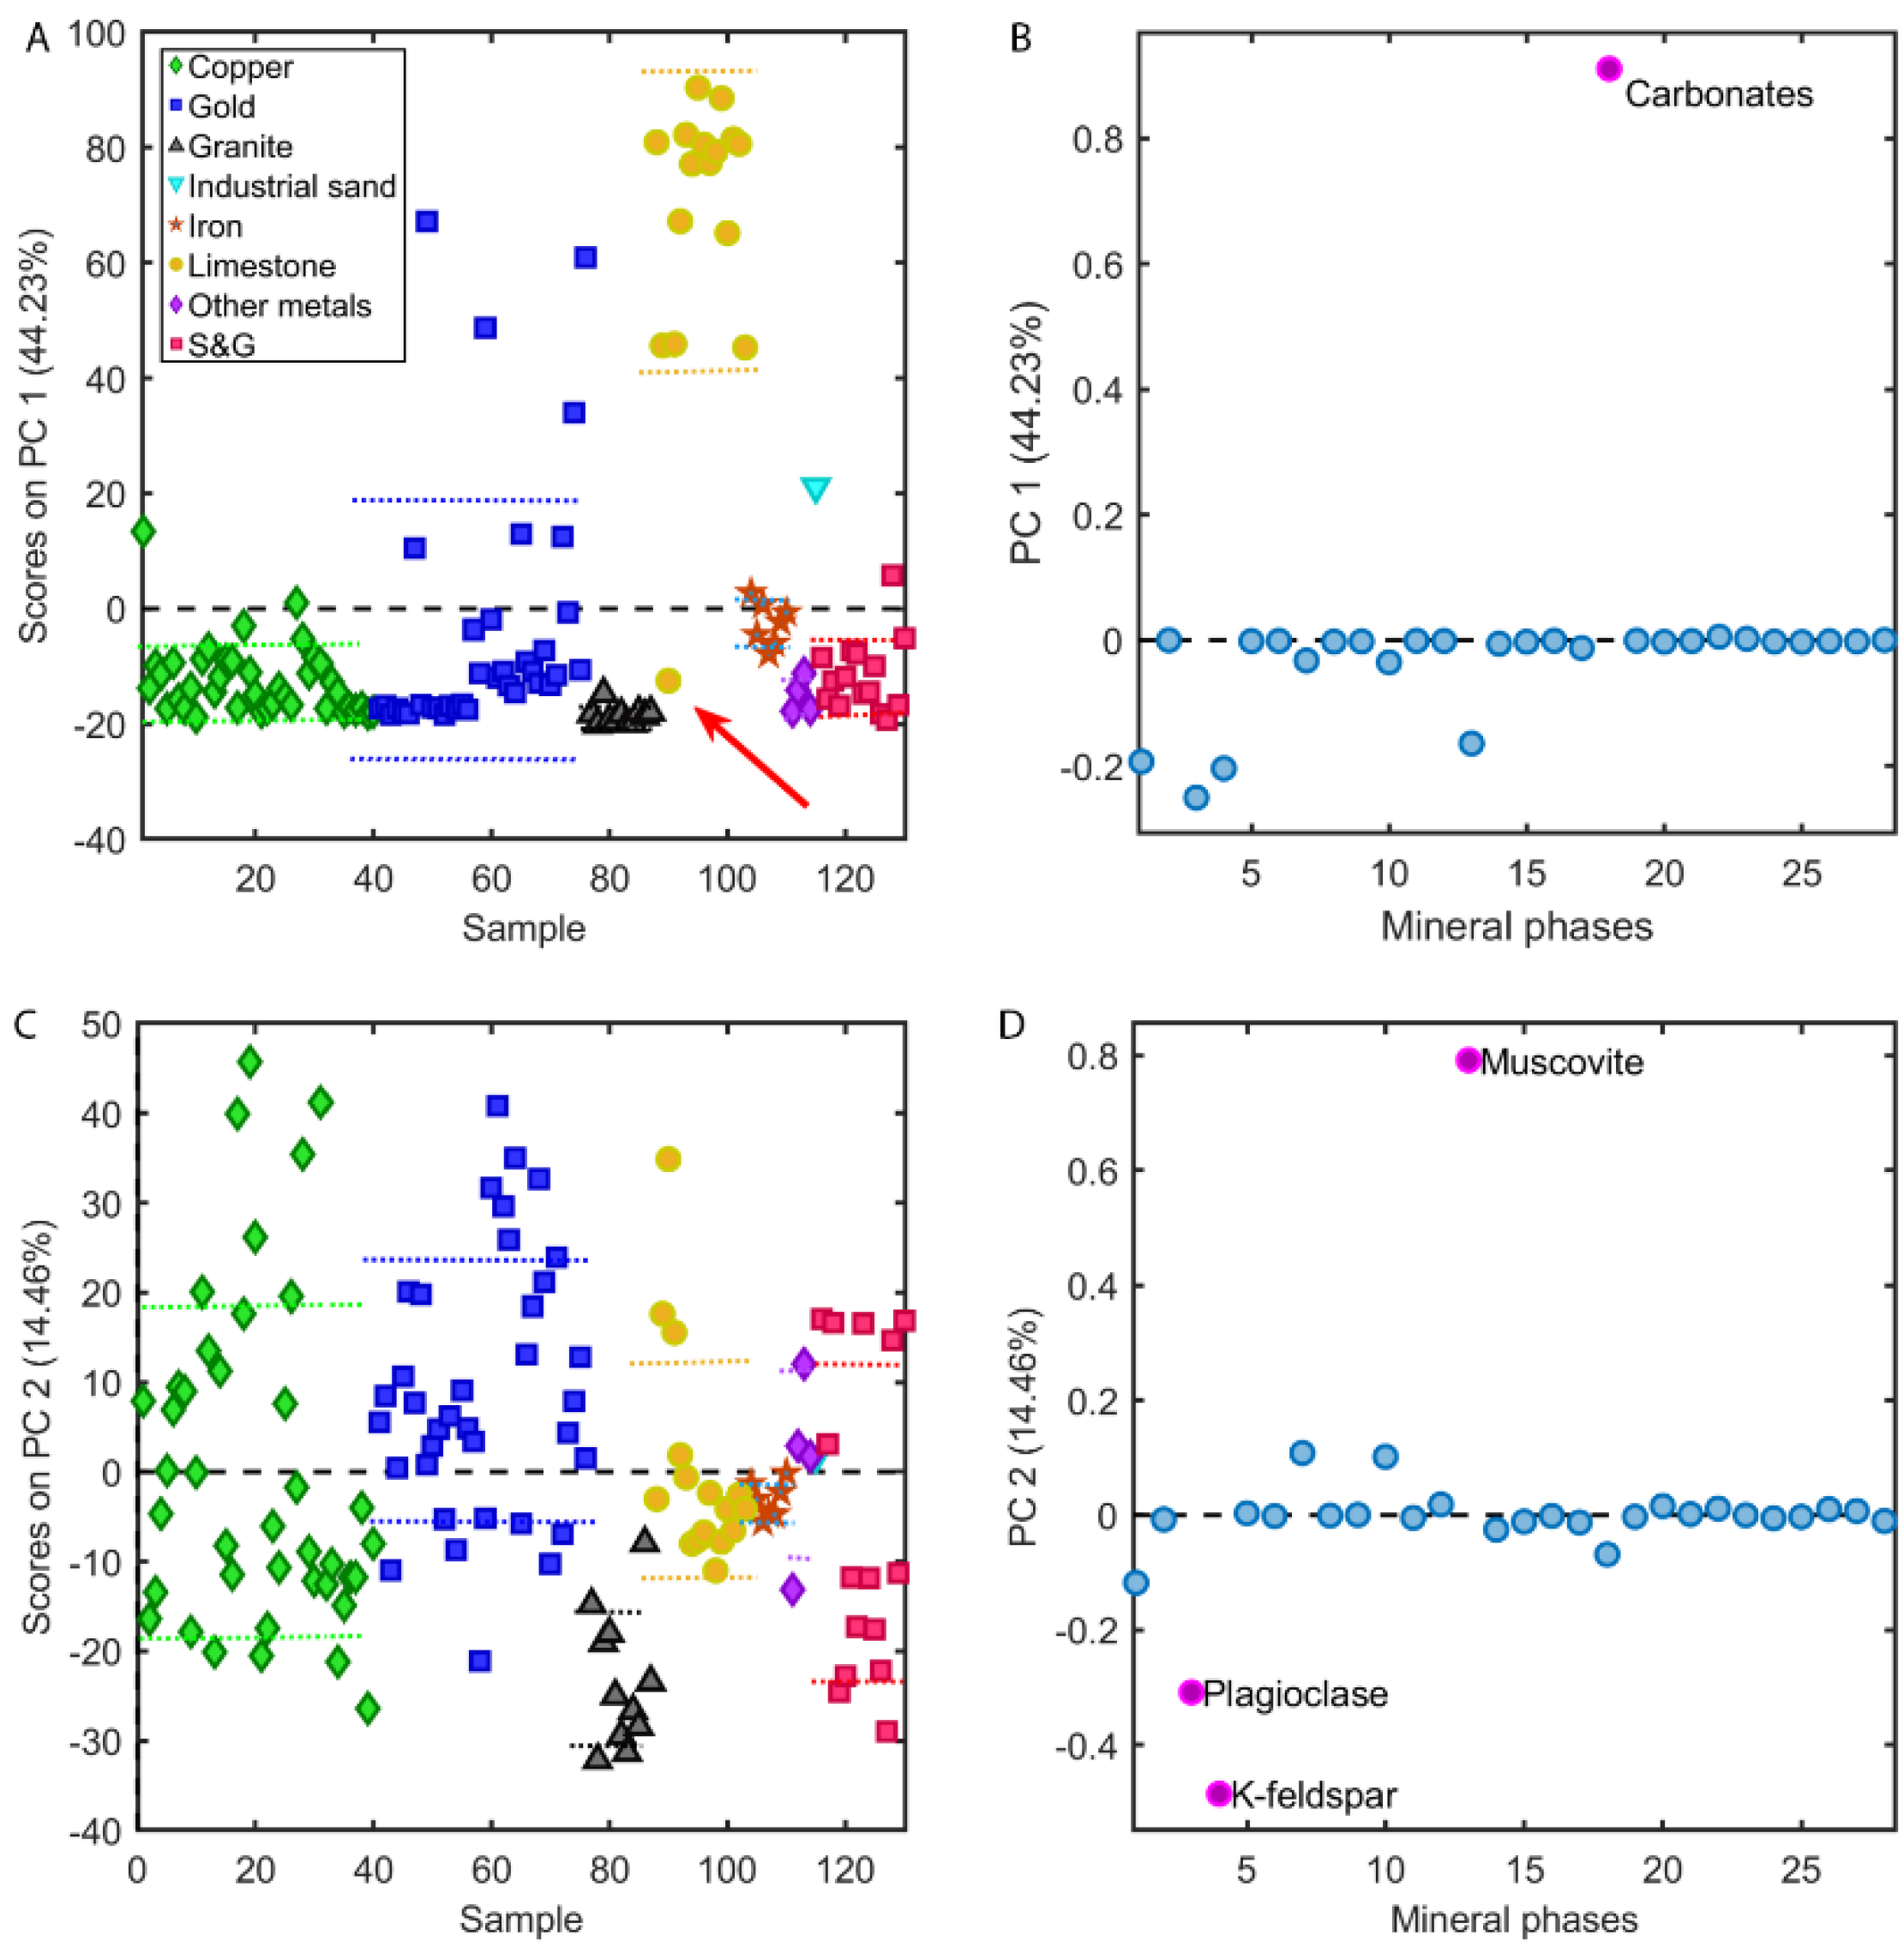
  • A total of 29 mineral phases were identified in the samples included in the dataset. An exploratory principal component analysis (PCA) investigation on the XRD results relative to the mineral phases content per each sample indicated that 6 components are sufficient to explain 88% of the compositional variability of the samples.
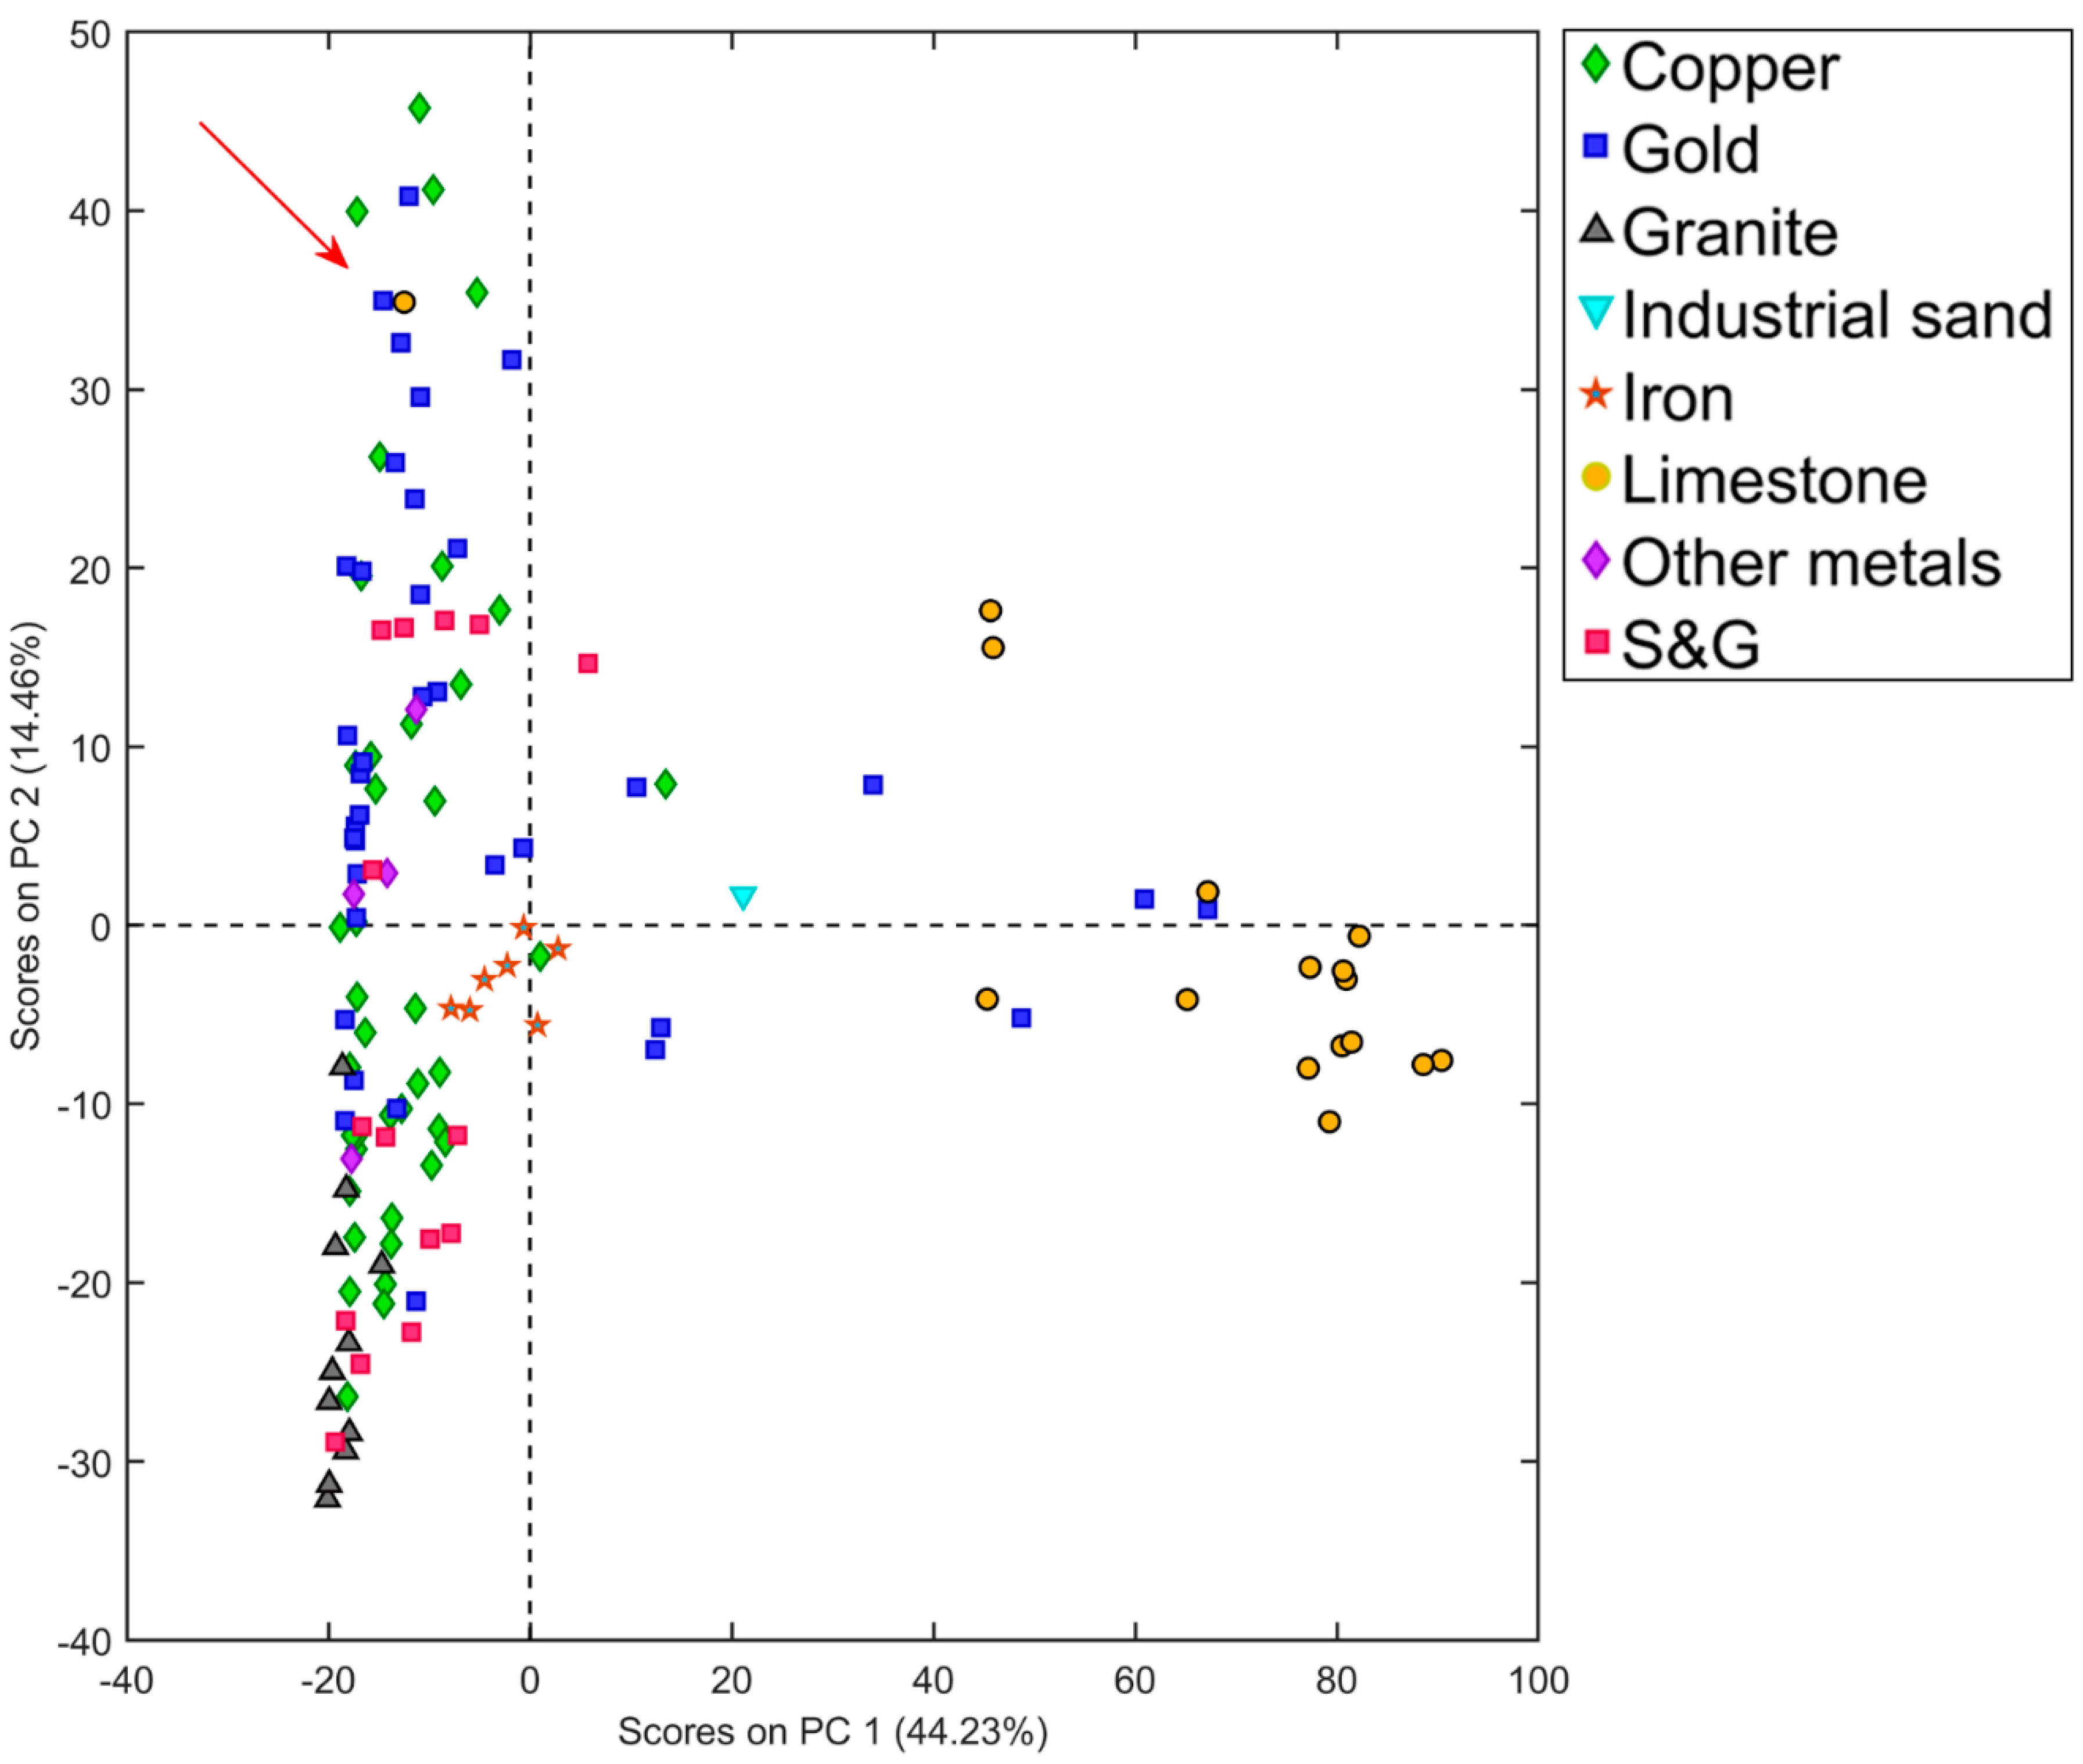
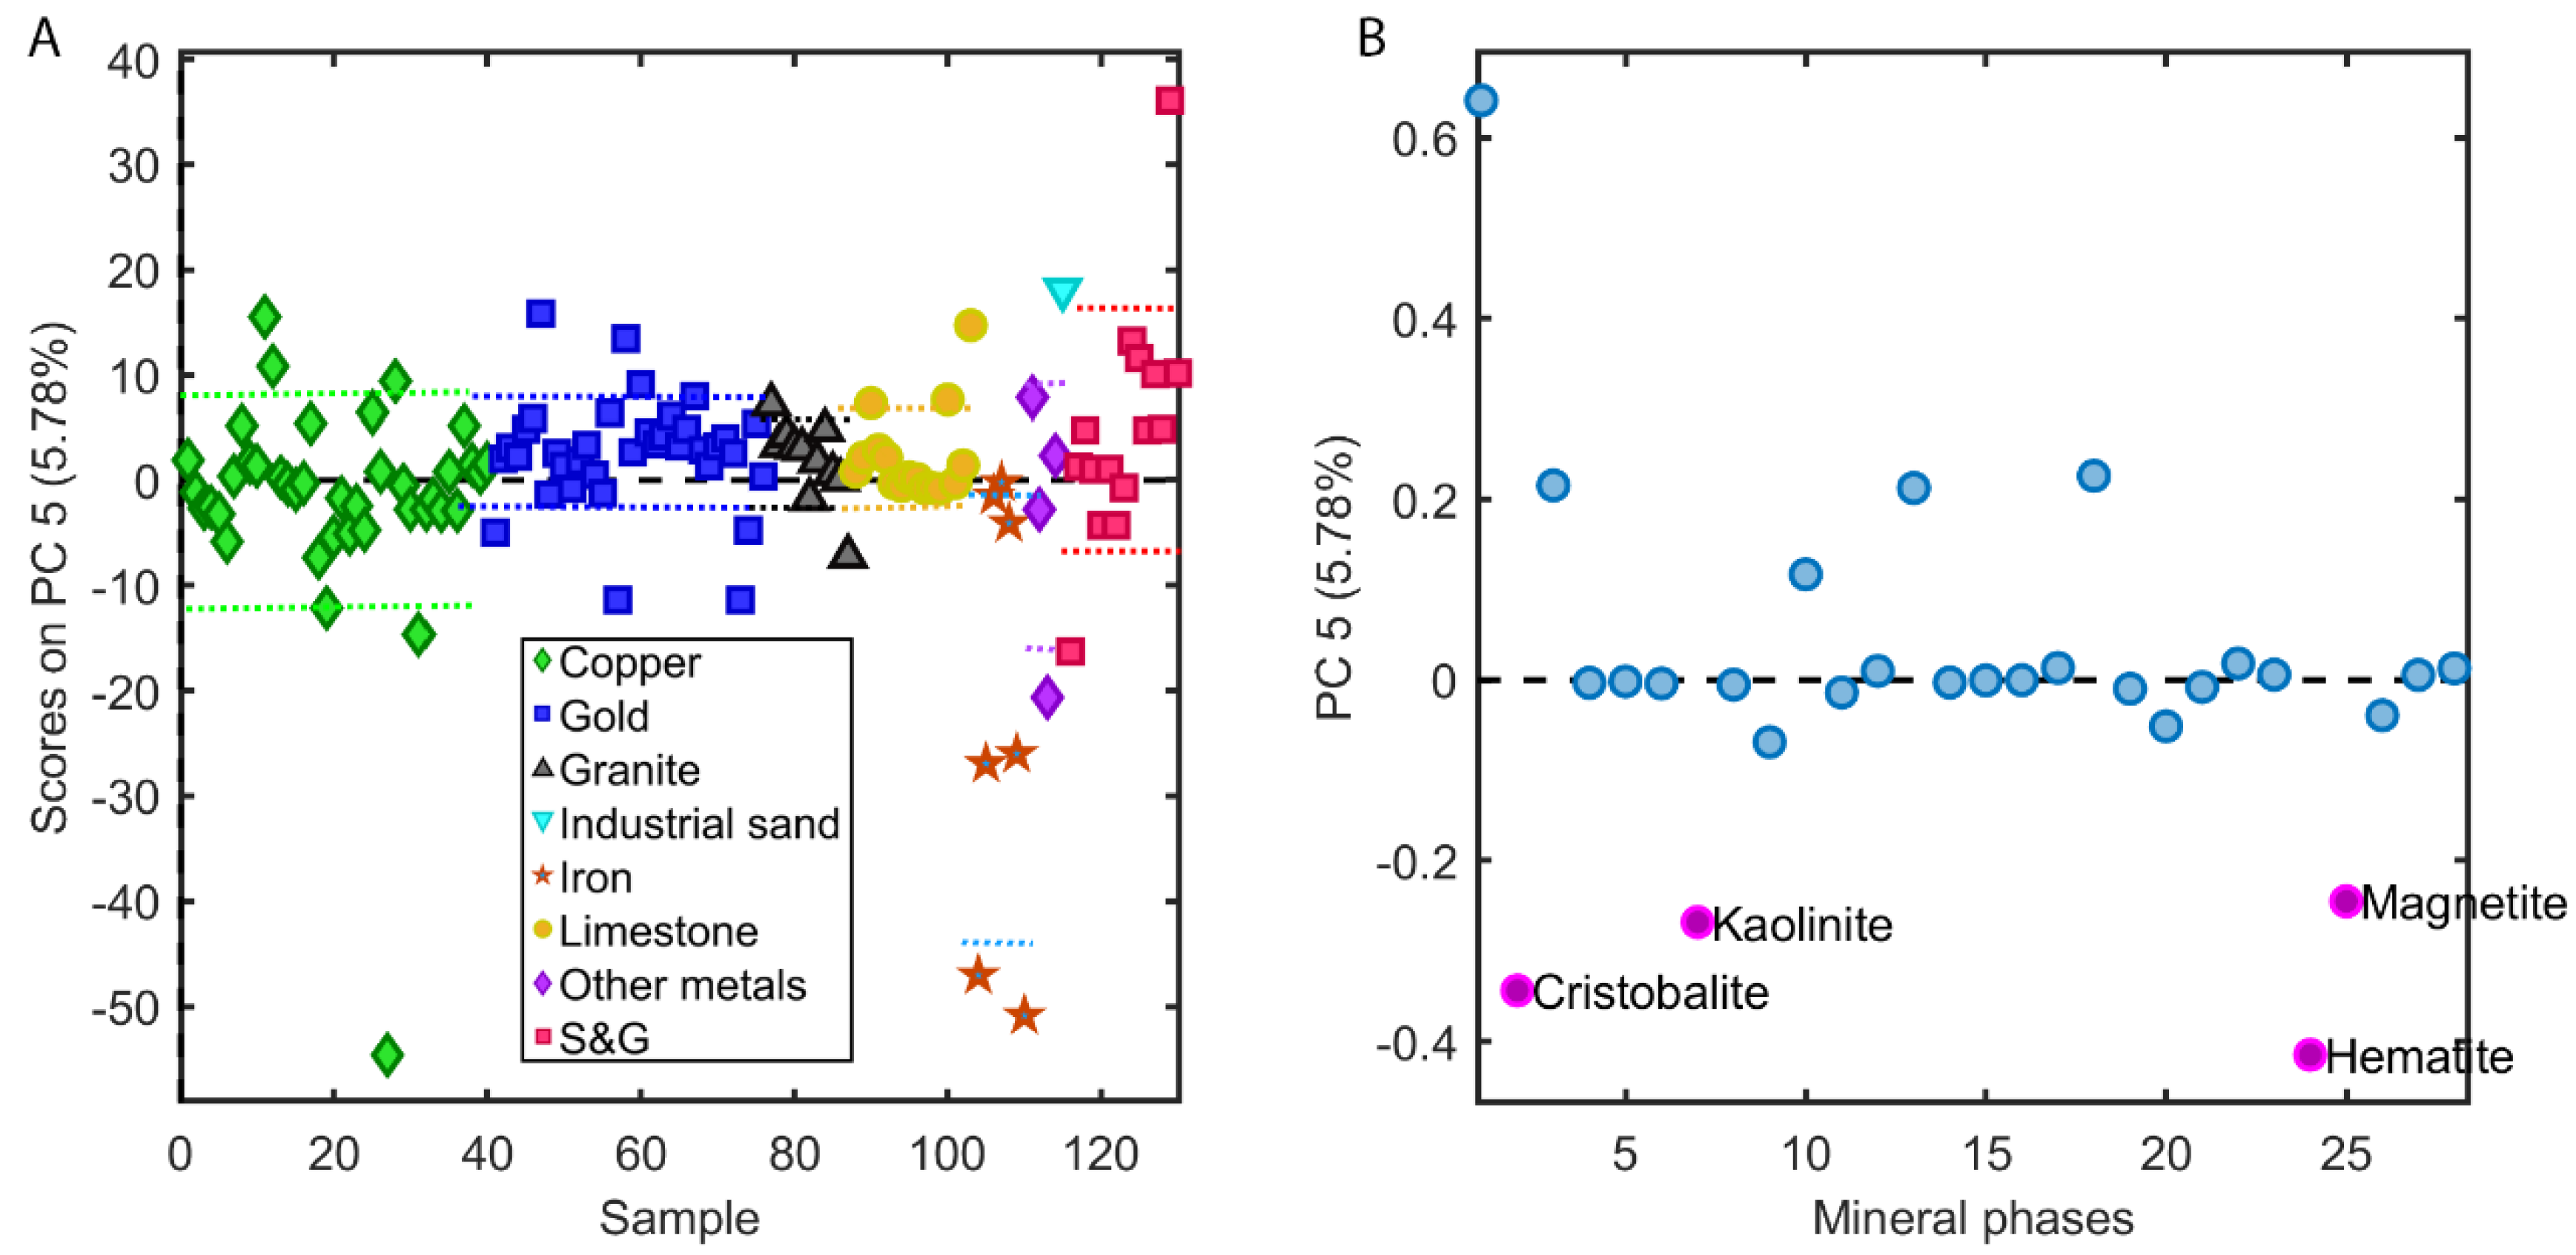
  • The PCA analysis on the XRD results provided information on the possibility of classifying samples collected in limestone mines based on the presence of carbonate mineral phases. Samples from granite and iron mines can be partially recognized based on the presence of feldspars and iron oxides, respectively.
  • The PCA analysis of the FTIR spectra of the same samples confirmed the same complexity and the possibility of using specific regions of the spectrum to classify samples from limestone, granite, and iron mines. The separation of samples from copper and gold mines was also investigated considering the high number of samples collected in these commodities.
  • Both PCA models identified unique samples characterized by mineralogy data and spectra that were significantly different compared to the average samples collected in the same commodity and to the entire dataset.
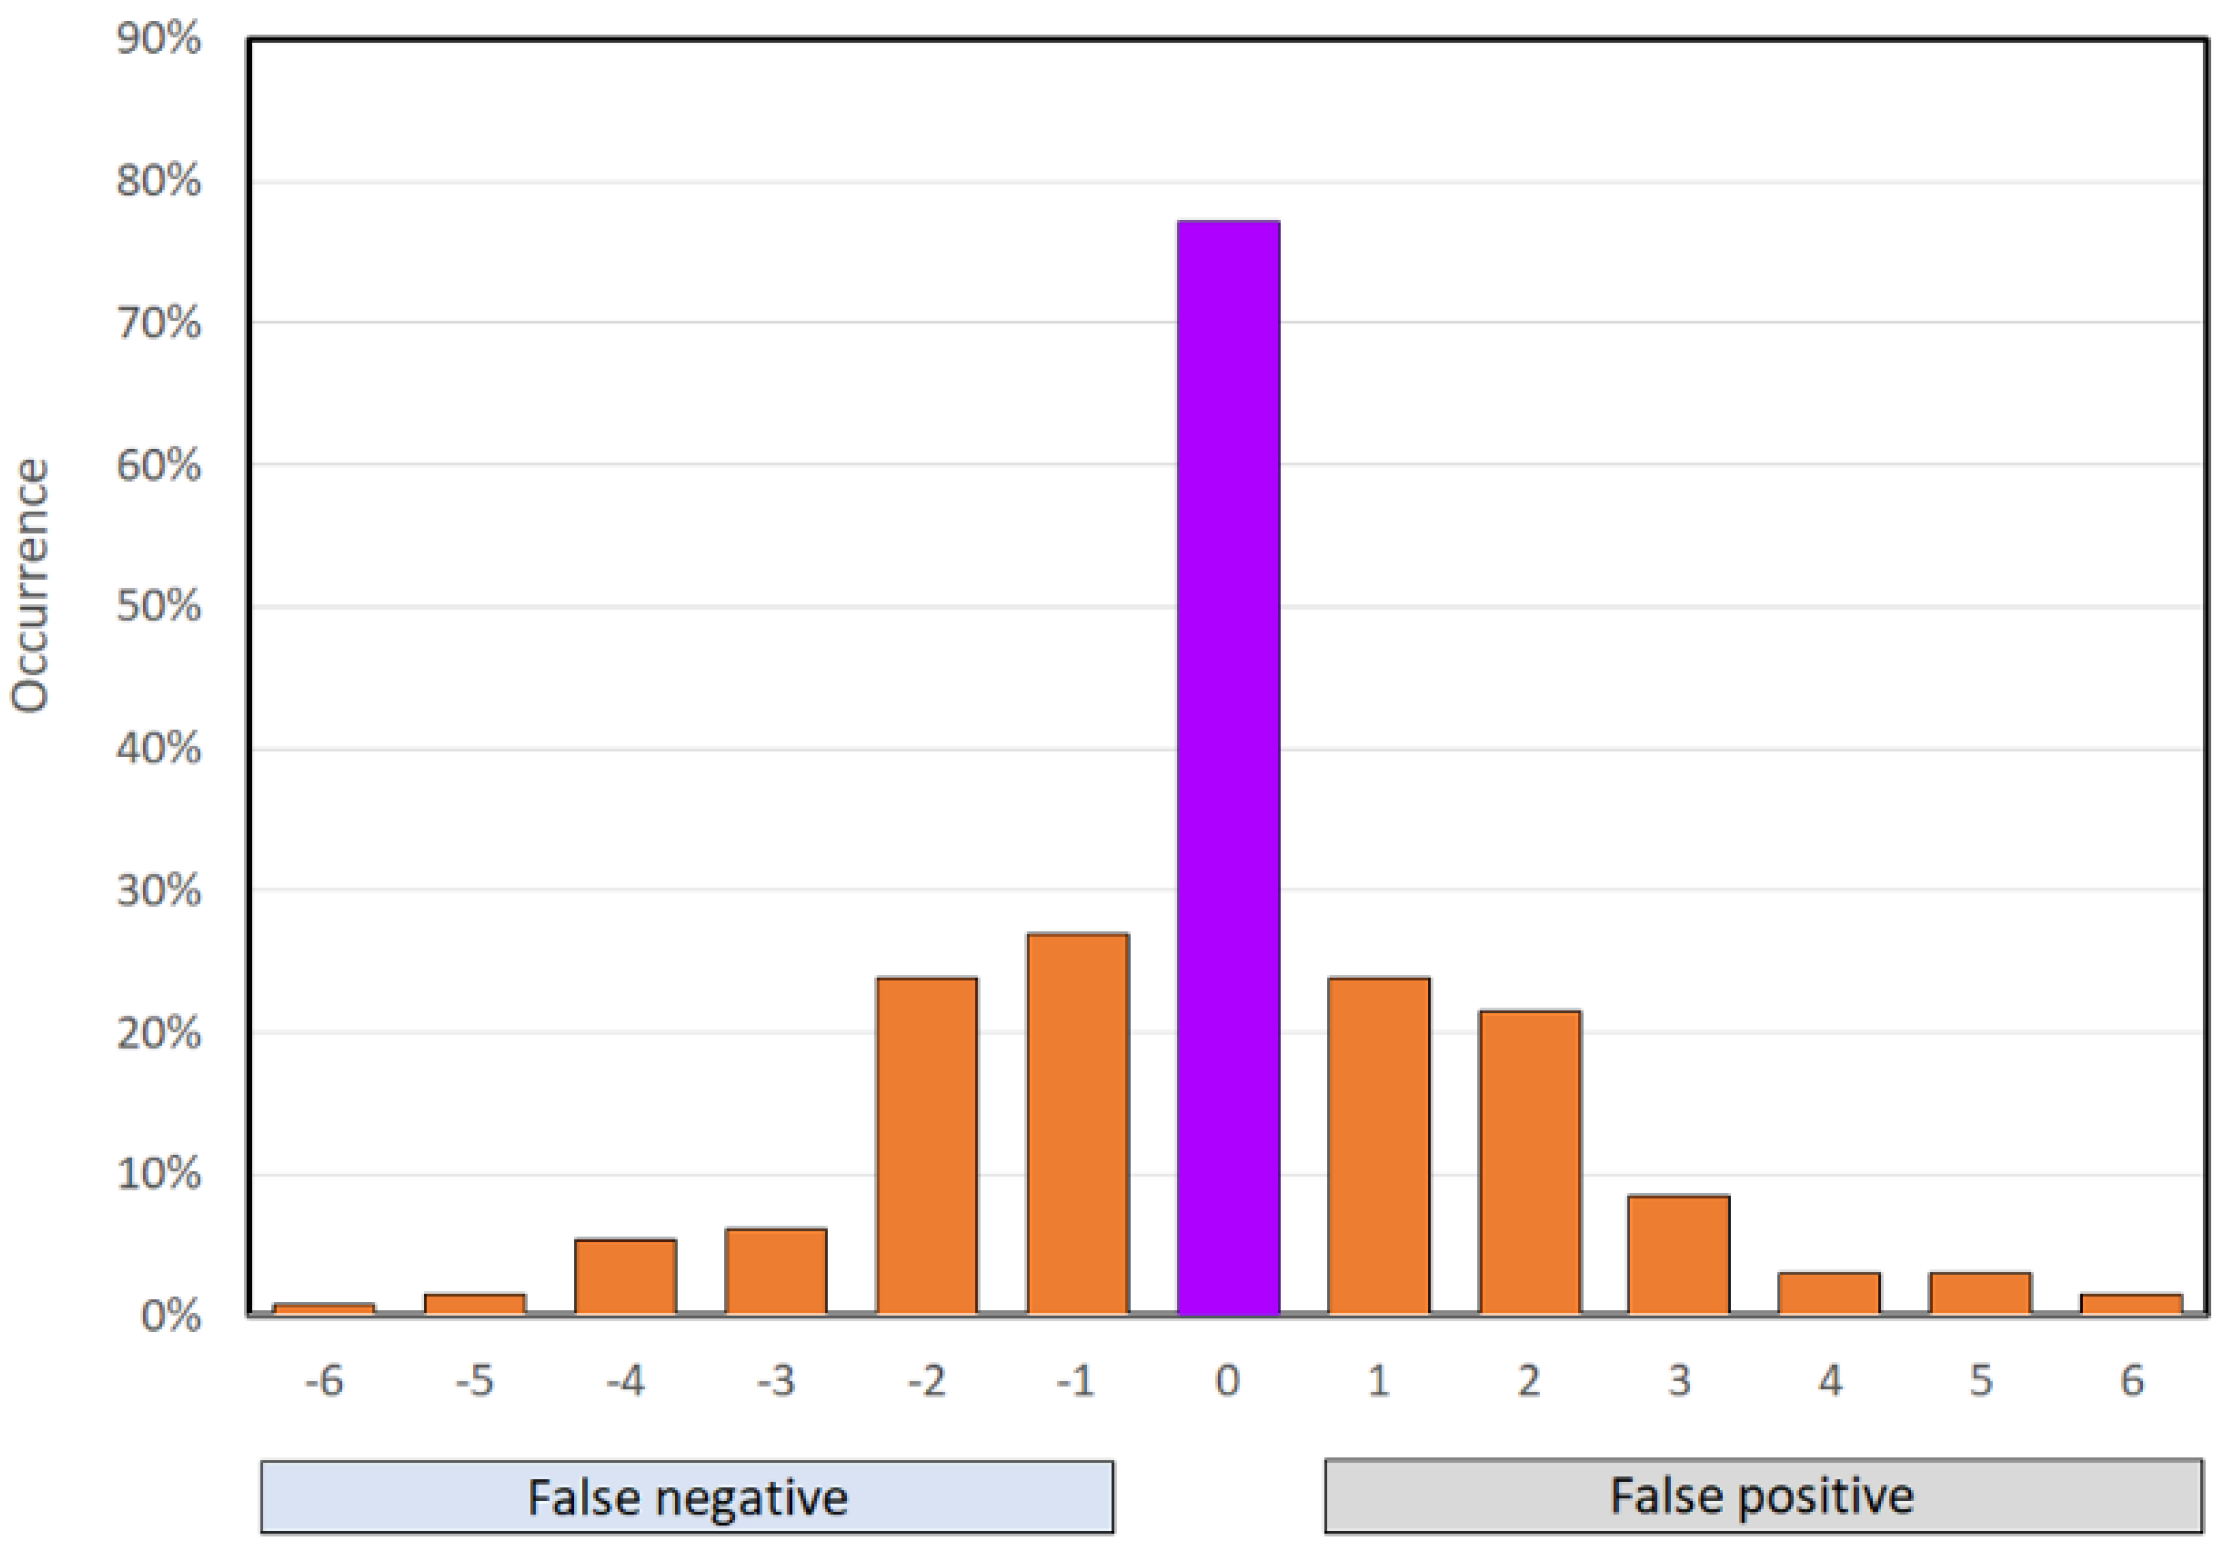
  • Despite the complexity of the mineralogy of the samples in the dataset detected by both the FTIR and XRD analyses, a predictive model using FTIR spectra was created to predict the presence of mineral phases in the samples. The model assumed that similar spectra contained similar mineral phases. The XRD data for the samples in the data were used to cross-validate the simple model.
Although the study had limitations in terms of the distribution of the samples in the dataset and the fact that XRD analysis could be improved by doing analysis of powdered samples rather than direct-on-filter samples, the findings provided important insight into the variability and complexity of respirable mine dust in terms of mineral phases. The results of this study can support the creation of quantification models for crystalline silica and other phases in complex mixtures, which will enable improved exposure monitoring approaches in the workplace. Furthermore, FTIR analysis has the potential to detect the presence of mineral phases and to assess the complexity of the mineralogy in respirable dust samples as well as XRD. The main advantages of using FTIR are the shorter analysis time of a few minutes compared to several hours and the possibility of using a portable, field instrument.

Author Contributions

Conceptualization, E.C. and R.L.T.W.; methodology, E.C. and L.C.; software, E.C., P.K. and R.S.; validation, R.S., P.K. and C.J.; formal analysis, E.C., R.S., P.K., and C.J.; investigation, R.L.T.W.; resources, L.C.; data curation, E.C. and R.L.T.W.; writing—original draft preparation, R.L.T.W.; writing—review and editing, C.J., L.C., R.S., P.K., R.L.T.W. and E.C.; visualization, E.C., R.S. and C.J.; supervision, B.M.; project administration, E.C.; funding acquisition, E.C. All authors have read and agreed to the published version of the manuscript.

Funding

This work was supported by the National Institute for Occupational Safety and Health (NIOSH).

Institutional Review Board Statement

The findings and conclusions in this paper are those of the authors and do not necessarily represent the official position of the National Institute for Occupational Safety and Health, Centers for Disease Control and Prevention. Mention of any company or product does not constitute endorsement by NIOSH.

Informed Consent Statement

Not applicable.

Data Availability Statement

The data presented in this study are available on request from the corresponding author.

Acknowledgments

The authors would like to thank Cassandra Jameyson and Jennifer Joo for their laboratory support in the collection and analysis of the samples, and Cody Wolfe for his assistance in editing and formatting of figures for final presentation. The authors would like to also thank Susan Wacaster for her invaluable support in the interpretation of the results of the mineral phases in the samples.

Conflicts of Interest

The authors declare no conflict of interest. The funding institutions had no role in the design of the study; in the collection, analyses, or interpretation of data; in the writing of the manuscript, or in the decision to publish the results.

Appendix A

Figure A1. Incidence of mineral phases distributed in the samples collected in different mining operations.
Minerals 11 00383 g0a1
Figure A2. Mean spectra from each type of mining operation displaying variability of IR bands in the Si-OH stretching region (3200–3800 cm−1) region and the fingerprint region (400–1500 cm−1).
Minerals 11 00383 g0a2
Table A1. Table displaying eigenvalue, %variance captured and % cumulative variance captured for every PC.
PCEigenvalue of Cov(X)% Variance with this PC% Variance Cumulative
19.00 × 10244.2344.23
22.94 × 10214.4658.69
32.33 × 10211.4570.14
41.70 × 1028.3578.49
51.18 × 1025.7884.27
67.66 × 103.7688.03
Figure A3. Scree plot showing decreasing eigenvalues as number of PCs increase. A “knee” occurs at PC6.
Minerals 11 00383 g0a3
Figure A4. Hotelling T2 v. Qresidual values of PCA model for XRD; arrows indicate copper and gold samples with unique characteristics as identified by the PCA XRD model.
Minerals 11 00383 g0a4
Figure A5. Scores and loadings plots for XRD PCA (A) Scores for PC3 v. samples; (B) Loadings for PC3 v. mineral phases; (C) Scores on PC4 v. samples; (D) Loadings for PC4 v. mineral phases.
Minerals 11 00383 g0a5
Table A2. Table displaying eigenvalue, %variance captured and % cumulative variance captured for every PC.
PCEigenvalue of Cov(X)% Variance with this PC% Variance Cumulative
17.82 × 10−147.8747.87
24.86 × 10−129.7577.62
31.37 × 10−18.3986.00
48.08 × 10−24.9590.95
54.00 × 10−22.4593.40
62.37 × 10−21.4594.85
Figure A6. Scree plot showing decreasing eigenvalues as number of PCs increases. A “knee” occurs at PC6.
Minerals 11 00383 g0a6
Figure A7. Hotelling T2 v. Qresidual values from PCA model for FTIR spectra.
Minerals 11 00383 g0a7

References

  1. Ribbe, P.H. (Ed.) Health Effects of Mineral. Dusts. Reviews in Mineralogy; Mineralogical Society of America: Washington, DC, USA, 1993; Volume 28. [Google Scholar]
  2. Monforton, C. Weight of the evidence or wait for the evidence? Protecting underground miners from diesel particulate matter. Am. J. Public Health 2006, 96, 271–276. [Google Scholar] [CrossRef] [PubMed]
  3. Steenland, K. One agent, many diseases: Exposure-response data and comparative risks of different outcomes following silica exposure. Am. J. Ind. Med. 2005, 48, 16–23. [Google Scholar] [CrossRef]
  4. Bang, K.M.; Mazurek, J.M.; Wood, J.M.; White, G.E.; Hendricks, S.A.; Weston, A. Silicosis mortality trends and new exposures to respirable crystalline silica—United States, 2001–2010. MMWR 2015, 64, 117. [Google Scholar] [PubMed]
  5. Center for Disease and Control (CDC). MMWR—Silicosis Screening in Surface Coal Miners—Pennsylvania, 1996–1997; Center for Disease and Control (CDC): Atlanta, GA, USA, 2000.
  6. Leung, C.C.; I.Yu, T.S.; Chen, W.H. Silicosis. Lancet 2012, 379, 2008–2018. [Google Scholar] [CrossRef]
  7. Cullinan, P.; Muñoz, X.; Suojalehto, H.; Agius, R.; Jindal, S.; Sigsgaard, T.; Blomberg, A.; Charpin, D.; Annesi-Maesano, I.; Gulati, M.; et al. Occupational lung diseases: From old and novel exposures to effective preventive strategies. Lancet Respir. Med. 2017, 5, 445–455. [Google Scholar] [CrossRef]
  8. Steenland, K.; Ward, E. Silica: A lsung carcinogen. CA Cancer J. Clin. 2014, 64, 63–69. [Google Scholar] [CrossRef] [PubMed]
  9. Vupputuri, S.; Parks, C.G.; Nylander-French, L.A.; Owen-Smith, A.; Hogan, S.L.; Sandler, D.P. Occupational silica exposure and chronic kidney disease. Ren. Fail. 2012, 34, 40–46. [Google Scholar] [CrossRef] [Green Version]
  10. NIOSH. NIOSH Hazard Review: Health Effects of Occupational Exposure to Respirable Crystalline Silica; Publication No. 2002-129; National Institute for Occupational Safety and Health: Cincinnati, OH, USA, 2002.
  11. Go, L.; Abraham, J.; Lowers, H.; Sanyal, S.; Almberg, K.; Cool, C.; Franko, A.; Green, F.; Murray, J.; Petsonk, E.; et al. Mineralogic analysis of lung tissue from US coal miners demonstrates greater silica burden in modern cases of progressive massive fibrosis. Am. J. Respir. Crit. Care Med. 2020, 201. [Google Scholar] [CrossRef]
  12. MSHA. Mine Safety and Health Administration, Xray Diffraction Determination of Quartz and Cristobalite in Respirable Mine Dust Method P2, July 2004; Department of Labor: Pittsburgh PA, USA, 2004.
  13. NIOSH. Silica, Crystalline, by XRD (Filter Redeposition)—Method No. NIOSH 7500. In NIOSH Manual of Analytical Methods, 4th ed.; Center for Disease Control (CDC): Atlanta, GA, USA, 2003. [Google Scholar]
  14. Mine Safety Health Administration (MSHA). Infrared Determination of Quartz in Respirable Coal Mine Dust—Method No. MSHA P7; US Department of Labor-MSHA-Pittsburgh Safety and Health Technology Center: Pittsburgh, PA, USA, 2008.
  15. NIOSH. Quartz in coal mine dust, by IR (redeposition)—Method No. NIOSH 7603. In NIOSH Manual of Analytical Methods, 5th ed.; Center for Disease Control (CDC): Atlanta, GA, USA, 2017. [Google Scholar]
  16. NIOSH. Silica, Crystalline by IR (KBr Pellet)—Method No. NIOSH 7602. In NIOSH Manual of Analytical Methods, 4th ed.; Center for Disease Control (CDC): Atlanta, GA, USA, 2003. [Google Scholar]
  17. Cauda, E.; Miller, A.; Drake, P. Promoting early exposure monitoring for respirable crystalline silica: Taking the laboratory to the mine site. J. Occup. Environ. Hyg. 2016, 13, D39–D45. [Google Scholar] [CrossRef] [Green Version]
  18. Chubb, L.G.; Cauda, E.G. A novel sampling cassette for field-based analysis of respirable crystalline silica. J. Occup. Environ. Hyg. 2021, 18, 103–109. [Google Scholar] [CrossRef]
  19. Sarver, E.; Keles, C.; Lowers, H.; Zulfikar, R.; Zell-Baran, L.; Vorajee, N.; Sanyal, S.; Rose, C.; Petsonk, E.; Murray, J.; et al. Mineralogic Analysis of respirable dust from 24 underground coal mines in four geographic regions of the United States. Am. J. Respir. Crit. Care Med. 2020, 201. [Google Scholar] [CrossRef]
  20. Cauda, E.; Chubb, L.; Reed, R.; Stepp, R. Evaluating the use of a field-based silica monitoring approach with dust from copper mines. J. Occup. Environ. Hyg. 2018, 15, 732–742. [Google Scholar] [CrossRef] [PubMed]
  21. International Standard ISO. Workplace Air—Guidance for the Measurement of Respirable Crystalline Silica. In A.1 Interferences in the XRD and IR Spectra of RCS; ISO: Geneva, Switzerland, 2009. [Google Scholar]
  22. Elton, N.J.; Smith, D.; Silica, K. Industrial Applications of X-Ray Diffraction; CRC Press: Boca Raton, FL, USA, 1999; pp. 450–451. [Google Scholar]
  23. Ojima, J. Determining of crystalline silica in respirable dust samples by infrared spectrophotometry in the presence of interferences. J. Occup. Health 2003, 45, 94–103. [Google Scholar] [CrossRef] [PubMed] [Green Version]
  24. Foster, R.D.; Walker, R.F. Quantitative determination of crystalline silica in respirable size dust samples by infrared spectrophotometry. Analyst 1984, 109, 1117–1127. [Google Scholar] [CrossRef]
  25. Hart, J.F.; Autenrieth, D.A.; Cauda, E.; Chubb, L.; Spear, T.M.; Wock, S.; Rosenthal, S. A comparison of respirable crystalline silica concentration measurements using a direct-on-filter Fourier transform infrared (FT-IR) transmission method vs. a traditional laboratory X-ray diffraction method. J. Occup. Environ. Hyg. 2018, 15, 743–754. [Google Scholar] [CrossRef]
  26. Li, G.; Liang, L.; Yang, J.; Zeng, L.; Xie, Z.; Zhong, Y.; Ruan, X.; Dong, M.; Yang, Z.; Lai, G.; et al. Pulmonary hypofunction due to calcium carbonate nanomaterial exposure in occupational workers: A cross-sectional study. Nanotoxicology 2018, 12, 571–585. [Google Scholar] [CrossRef]
  27. Neghab, M.; Abedini, R.; Soltanzadeh, A.; Kashkooli, A.I.; A Ghayoomi, S.M. Respiratory disorders associated with heavy inhalation exposure to dolomite dust. Iran. Red Crescent Med. J. 2012, 14, 549–557. [Google Scholar]
  28. Doll, R. Occupational Lung Cancer: A Review. Brit. J. Industr. Med. 1959, 16, 181–190. [Google Scholar] [CrossRef] [Green Version]
  29. Boyd, J.T.; Doll, R.; Faulds, J.S.; Leiper, J. Cancer of the lung in iron ore (haemetite) miners. Brit. J. Industr. Med. 1970, 27, 97–105. [Google Scholar] [PubMed] [Green Version]
  30. Pease, C.; Rucker, T.; Birk, T. Review of the Evidence from Epidemiology, Toxicology.; Lung Bioavailability on the Carcinogenicity of Inhaled Iron Oxide Particulates. Chem. Res. Toxicol. 2016, 29, 237–254. [Google Scholar] [CrossRef]
  31. Bourgkard, E.; Wild, P.; Courcot, B.; Diss, M.; Ettlinger, J.; Goutet, P.; Hemon, D.; Marquis, N.; Mur, J.-M.; Rigal, C. Lung cancer mortality and iron oxide exposure in a French steel-producing factory. Occup. Environ. Med. 2009, 66, 175–181. [Google Scholar] [CrossRef] [PubMed] [Green Version]
  32. Morgan, J.; Bell, R.; Jones, A.L. Endogenous doesn’t always mean innocuous: A scoping review of iron toxicity by inhalation. J. Toxicol. Environ. Health Part B 2020, 23, 107–136. [Google Scholar] [CrossRef] [PubMed]
  33. Beebe, K.R.; Pell, R.J.; Seasholtz, M.B. Chemometrics: A Practical Guide; John Wiley & Sons: Hoboken, NJ, USA, 1998. [Google Scholar]
  34. Esbensen, K.H.; Swarbrick, B. Multivariate Data Analysis, 6th ed.; CAMO Software AS: Oslo, Norway, 2018. [Google Scholar]
  35. Müller, C.M.; Pejcic, B.; Esteban, L.; Piane, C.D.; Raven, M.; Mizaikoff, B. Infrared attenuated total reflectance spectroscopy: An innovative strategy for analyzing mineral components in energy relevant systems. Sci. Rep. 2014, 4, 6764. [Google Scholar] [CrossRef] [Green Version]
  36. Ritz, M.; Vaculikova, L.; Plevova, E.; Matýsek, D.; Mališ, J. Determination of chlorite, muscovite, albite and quartz in claystones and clay shales by infrared spectroscopy and partial least-squares regression. Acta Geogyn. Geomater. 2012, 9, 511–520. [Google Scholar]
  37. Miller, A.L.; Weakley, A.T.; Griffiths, P.R.; Cauda, E.G.; Bayman, S. Direct-on-Filter α-Quartz Estimation in Respirable Coal Mine Dust Using Transmission Fourier Transform Infrared Spectrometry and Partial Least Squares Regression. Appl. Spectrosc. 2016, 71, 1014–1024. [Google Scholar] [CrossRef] [PubMed] [Green Version]
  38. Stach, R.; Barone, T.; Cauda, E.; Mizaikoff, B. A Novel Calibration Method for the Quantification of Respirable Particles in Mining Scenarios Using Fourier Transform Infrared Spectroscopy. Appl. Spectrosc. 2020, 75, 307–316. [Google Scholar] [CrossRef]
  39. Weakley, A.T.; Miller, A.L.; Griffiths, P.R.; Bayman, S.J. Quantifying silica in filter-deposited mine dusts using infrared spectra and partial least squares regression. Anal Bioanal Chem. 2014, 406, 4715–4724. [Google Scholar] [CrossRef]
  40. International Standard ISO. Particulate Materials—Sampling and Sample Splitting for the Determination of Particulate Properties; ISO: Geneva, Switzerland, 2007. [Google Scholar]
  41. Lee, T.; Thorpe, A.; Cauda, E.; Harper, M. Calibration of high flow rate thoracic-size selective samplers. J. Occup. Environ. Hyg. 2016, 13, D93–D98. [Google Scholar] [CrossRef] [Green Version]
  42. Baron, P.A. Factors affecting aerosol sampling. In NIOSH Manual of Analytical Methods; Department of Health and Human Services, Centers for Disease Control and Prevention, National Institute for Occupational Safety and Health: Cincinnati, OH, USA, 2016. [Google Scholar]
  43. Sellaro, R.; Sarver, E.; Baxter, D. A Standard Characterization Methodology for Respirable Coal Mine Dust Using SEM-EDX. Resources 2015, 4, 939–957. [Google Scholar] [CrossRef]
  44. Kumari, S.; Kumar, R.; Mishra, K.K.; Pandey, J.K.; Udayabhanu, G.N.; Bandopadhyay, A.K. Determination of Quartz and Its Abundance in Respirable Airborne Dust in Both Coal and Metal Mines in India. Procedia Eng. 2011, 26, 1810–1819. [Google Scholar] [CrossRef] [Green Version]
  45. Ronov, A.B.; Yaroshevsky, A.A. Chemical Composition of the Earth’s Crust, The Earth’s Crust and Upper Mantle. Am. Geophys. Union Monogr. 1969, 13, 37–57. [Google Scholar]
  46. Heaney, P.J. Structure and chemistry of the low-pressure silica polymorphs. In Silica; De Gruyter Mouton: Berlin, Germany, 1994; pp. 1–40. [Google Scholar]
  47. Salehi, M.; Zare, A.; Taheri, A. Artificial Neural Networks (ANNs) and Partial Least Squares (PLS) Regression in the Quantitative Analysis of Respirable Crystalline Silica by Fourier-Transform Infrared Spectroscopy (FTIR). Ann. Work Expo. Health 2020. [Google Scholar] [CrossRef] [PubMed]
  48. Zheng, L.; Kulkarni, P.; Dionysiou, D.D. Calibration approaches for the measurement of aerosol multielemental concentration using spark emission spectroscopy. J. Anal. At. Spectrom. 2018, 33, 404–412. [Google Scholar] [CrossRef]
Figure 1. Histogram showing the number of different mineral phases found in individual samples.
Minerals 11 00383 g001
Figure 2. PCA results of XRD mineralogy data (A) Sample scores for PC1 v. samples, arrow indicating unique limestone sample; (B) Loadings on PC1 v. mineral phases; (C) Sample scores for PC2 v. samples; (D) Loadings on PC2 v. mineral phases.
Minerals 11 00383 g002
Figure 3. Sample scores on PC1 v. sample scores on PC2 from the PCA model of the XRD dataset, unique limestone sample indicated by arrow, confidence ellipses removed for clarity.
Minerals 11 00383 g003
Figure 4. PCA results of XRD mineralogy data (A) Sample scores PC5 v. sample number; (B) Loadings v. mineral phases on PC5.
Minerals 11 00383 g004
Figure 5. PCA results of FTIR spectra (A) Sample scores for PC1 v. samples, arrow indicates unique limestone sample; (B) Loadings on PC1 v. variable; (C) Sample scores for PC2 v. samples; (D) Loadings on PC2 v. variable.
Minerals 11 00383 g005
Figure 6. Samples scores on PC1 v. samples scores on PC2 from the PCA model for FTIR spectra of respirable mine dust. Arrow indicates unique limestone sample.
Minerals 11 00383 g006
Figure 7. PCA scores and loadings for FTIR spectra with limestone and iron samples removed from the dataset (A) Sample Scheme 1. v. samples; (B) Loadings for PC1 v. variable.
Minerals 11 00383 g007
Figure 8. Scores and loadings plots of FTIR spectra of copper and gold samples (A) Sample scores for PC4 v. samples (B) Loadings for PC4 v. variable; (C) Average spectra and standard deviation of copper samples; (D) Average spectra and standard deviation of gold samples.
Minerals 11 00383 g008
Figure 9. Number of mineral phase matches (purple), false negatives and false positives using score matching of first order maxima of FTIR spectra to predict mineral phase occurrences in a test spectrum.
Minerals 11 00383 g009
Table 1. Relative incidence of mineral phases in the 130 respirable mine dust samples organized by commodity.
Mineral PhasesFull SetCopper MinesGold MinesIron MinesOther Metals MinesGranite MinesS&G MinesLimestone Mines
number of samples130403674111516
α-Quartz100.0%100.0%100.0%100.0%100.0%100.0%100.0%100.0%
Cristobalite1.5%2.5% 6.7%
Plagioclase66.9%92.5%72.2% 75.0%1.0%6.0%6.3%
K-feldspar56.2%77.5%36.1% 100.0%81.8%66.7%37.5%
Zeolites4.6% 8.3%42.9%
Cordierite2.3%5.0%2.8%
Kaolinite25.4%32.5%2.8%85.7%100.0%36.4%33.3%
Montmorillonite4.6%15.0%
Talc2.3% 2.8%28.6%
Chlorite44.6%65.0%52.8% 27.3%46.7%18.8%
Sepiolite2.3% 42.9%
Amesite1.5% 12.5%
Muscovite77.7%92.5%86.1% 100.0%63.6%53.3%81.3%
Biotite3.8%5.0% 2.0%
Phlogopite1.5% 18.2%
Natroapophylite0.8%2.5%
Amphibole6.9% 8.3%14.3% 18.2%2.0%
Calcite40.0%45.0%27.8%14.3% 10.0%53.3%81.3%
Dolomite26.9%7.5%38.9%14.3% 13.3%87.5%
Siderite2.3% 42.9%
Alunite1.5%2.5%2.8%
Jarosite1.5% 5.6%
Gypsum10.0%15.0%13.9% 13.3%
Apatite1.5% 6.3%
Hematite7.7%12.5% 57.1% 6.7%
Magnetite7.7% 11.1%85.7%
Hydroxide3.8%2.5%2.8%42.9%
Pyrite14.6%2.5%41.7% 18.8%
Unknown7.7%5.0%5.6% 18.2%26.7%
Publisher’s Note: MDPI stays neutral with regard to jurisdictional claims in published maps and institutional affiliations.

