Article

Structural Economic Assessment of Polymetallic Nodules Mining Project with Updates to Present Market Conditions

1
Faculty of Navigation, Maritime University of Szczecin, 70-500 Szczecin, Poland
2
Interoceanmetal Joint Organization IOM, 71-541 Szczecin, Poland
3
Qvistorp, 71-487 Szczecin, Poland
*
Author to whom correspondence should be addressed.
Minerals 2021, 11(3), 311; https://doi.org/10.3390/min11030311
Submission received: 1 February 2021 / Revised: 4 March 2021 / Accepted: 11 March 2021 / Published: 17 March 2021
(This article belongs to the Special Issue Exploration of Polymetallic Nodules)

Abstract

:
This paper presents the economic structure, assumptions, and relations of deep-sea mining project assessment and the results of its evaluation, based on exploration activities and research in the field of geology, mining technology, processing technology, and environmental and legislative studies. The Interoceanmetal Joint Organization (IOM) and cooperating organizations conducted a study incorporating those elements of the project that are recognized as most important for commercial viability. On the basis of formulated financial flow of operating and capital expenses of one processing technology the possible market unit price of polymetallic nodules was estimated and the result is presented in this paper. The rapidly changing economic situation, affected inter alia by the COVID-19 pandemic, is reflected in the study and updated results are based on recent changes in metal prices. Although assumptions related to mining costs need to be confirmed during pilot mining tests, promising results have been shown in the case of the use of high-pressure acid leaching processing technology (HPAL) as well as in the case of raw ore sales. A pre-feasibility study of the project will focus on the two most promising variants of the model.

1. Introduction

Before the commencement of deep-sea mining takes place, the research to investigate the feasibility of its phases for the purpose of different approaches and business model developments is carried out by the International Seabed Authority (ISA) contractors and stakeholders. The deep-sea mining value chain comprises not solely principal technical or managing activities but is also to a certain extent a kind of heuristic design incorporating geology, technology (mining, transport, and processing), economics, law, and environmental and social sciences, with the use of the increased value analysis that can be evaluated by means of economic factors, according to Abramowski [1]. In this paper the economic methodology results, along with the influence of technical assumptions that can be implemented during the feasibility evaluation in the case of the exploration area being the subject of IOM exploration activities, are presented.
Different economic approaches have been proposed at various stages of deep-sea mining development. A hypothetical polymetallic nodule price was analyzed in Hoagland [2]. The author considered long-term trends and the potential for cycles in the prices of nodule metals. The techniques for future predictions about the commercial prospects for deep seabed mining were proposed.
A spatial planning tool to assess the techno-economic requirements and implications of polymetallic nodule mining on deep-sea deposits was proposed in Volkmann et al. [3]. The authors studied the part of the German exploration area, located in the Clarion–Clipperton Zone (CCZ) in the Pacific Ocean. The approach can be used for marine mineral resource commercialization with the consideration of geological, economic, and financial as well as technical and operational aspects. The proposed approach may also be applicable for an initial evaluation of projects related to other spatially distributed mineral resources, as per Volkman et al. [3].
An integrated, stochastic techno-economic assessment from a contractor’s perspective for the commercial development of a deep-sea mining project was proposed in Van Nijen et al. [4]. The economic performance measured by the internal rate of return (IRR) was compared using deterministic and probabilistic commodity price forecasting models. The authors studied different levels of a financial payment regime comprising a royalty payment and a payment to internalize environmental costs. Following a 10-year moving average of commodity prices, including real growth, an almost 80% probability was calculated to achieve a hurdle rate of 18%, according to Van Nijen et al. [4].
An optimized scenario taking into account offshore mining, ore transfer at sea, transportation, and processing to analyze the profitability of the project was presented in Herrouin et al. [5]. The work considered an average conservative basis for metal prices and an analysis of the market, and the results are shown on the basis of economic indicators. Financial feasibility of polymetallic nodules in the Korean exploration area (Clarion–Clipperton Zone) is presented in Kwang-Hyun Nam [6]. Two production scales of polymetallic nodules were assumed (3.0 MT or 1.5 MT). The capital and operating expenses were estimated in four sectors: the exploration, mining, transportation, and metallurgical processes. The study indicated that there was economic validity of the product of polymetallic nodules at the time the study was carried out.
The International Seabed Authority has applied a cash flow approach for the sake of developing financial regulations to support the decision that is supposed to be made on the minerals payment system in the area beyond national jurisdiction, in accordance with the principle of the common heritage of mankind, according to Roth et al. [7,8]. A similar subject of research was analyzed by Cameron et al. [9]: a network-based computer model for exploring the economics of a deep-sea mining operation. A sensitivity analysis was performed for the model’s variables. The simulation led to the conclusion that the project would not give a satisfactory rate of return and that a favorable fiscal regime is desirable.
Johnson and Otto in [10] discussed the overall economics of nodule projects. The main elements of such a project were compared. The impact on the costs of processing nodules in different locations in the Pacific region was investigated.
The status and discussions of the economic, technical, technological, and environmental issues that need to be addressed for sustainable development of deep-sea minerals were given in Sharma [11]. The article showed the complexity of the entire process of technical and economic evaluation of a sea mining project. Moreover, the significant operating cost related to the metallurgical processing method adopted in the analysis was indicated as the key factor for feasibility, as well as the need to optimize in this respect. A more general perspective for deep-sea mining projects was presented in Sparenberg [12]. The work presented several political, legal, economic, and socio-cultural factors that have had an influence on such project development. Manganese nodules were used to illustrate how mineral concentrations can gain, lose, and regain their status as a resource depending on external factors. The environmental perspective of deep-sea mining was presented in Morgan et al. [13] and Wedding et al. [14]. At the present stage of development, the environmental costs are considered contributions to the environmental fund and operational expenses for monitoring and risk management.
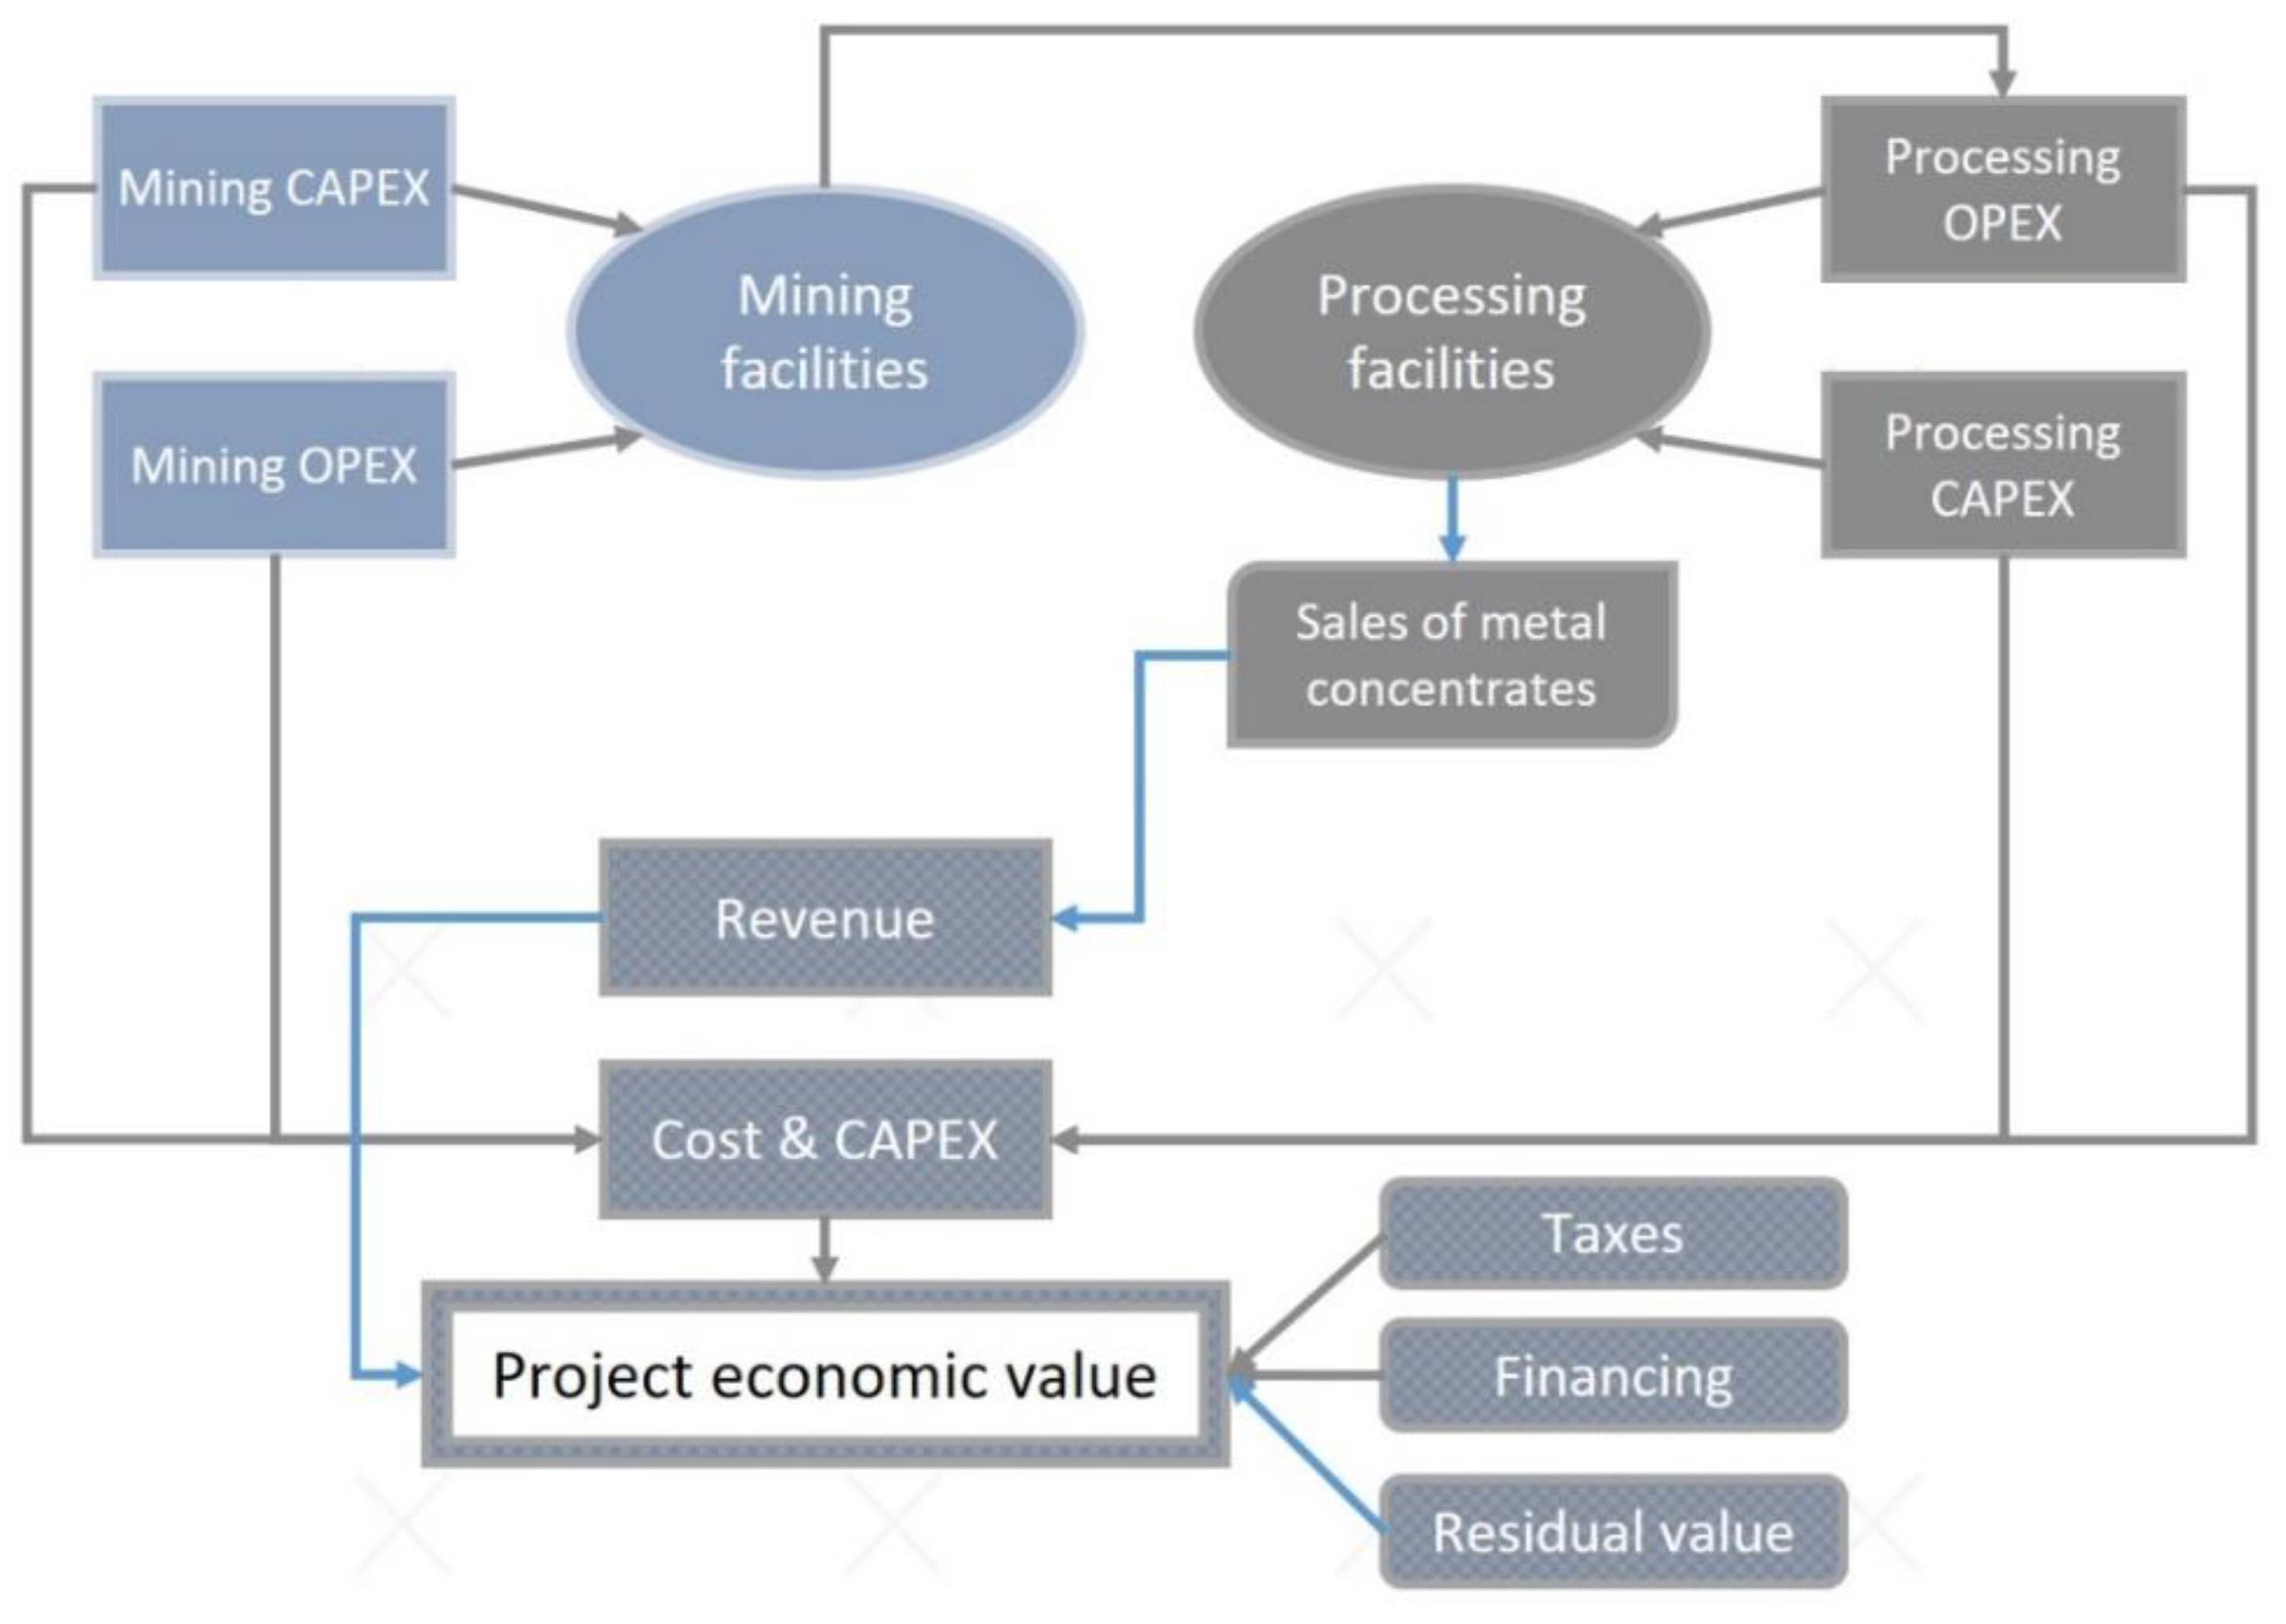
The results we present here are based on the methodology applied to the deep-sea mining project of the Interoceanmetal Joint Organization IOM. The general scheme of the IOM investment project is presented in Figure 1. The structure contains the analysis of the financial flow and technological developments of commercial phases of the project implementation, namely, deep-sea mining operations, metallurgical processing, and economic criteria investigations. The diagram shows the investor’s capital expenditure (CAPEX) that are incurred to build or purchase the tangible goods and services necessary for the project, and the operational expenses (OPEX) incurred to ensure the functioning of the project and its assets.
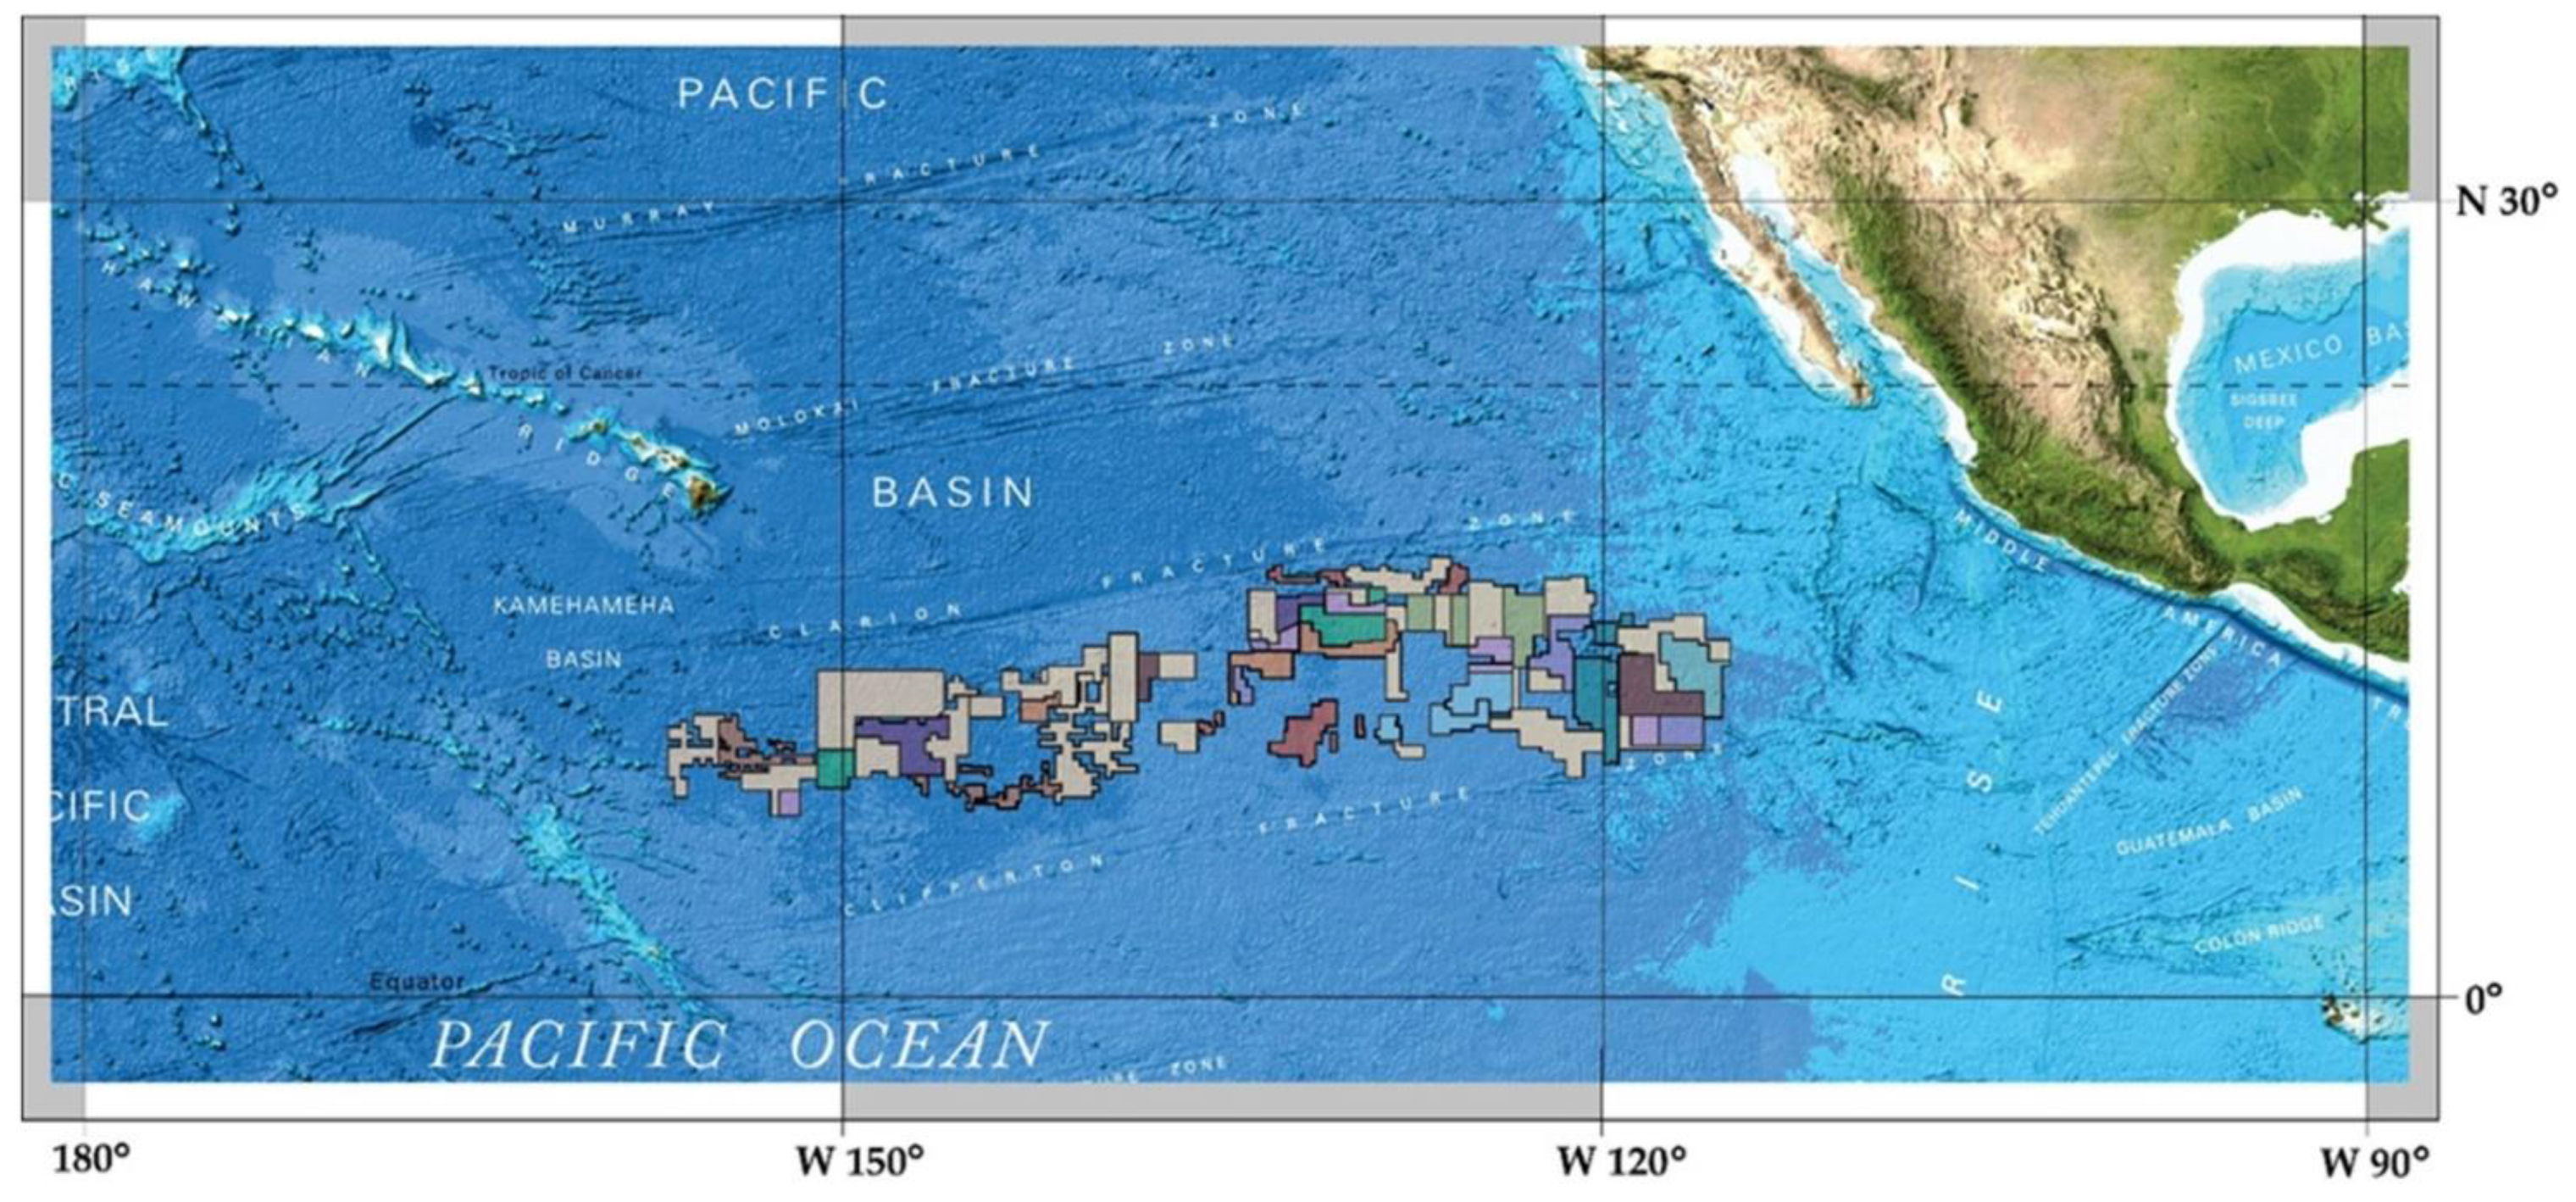
The IOM explores an area of 75,027 km2. The deposit of polymetallic nodules (PN) is located in the Clarion–Clipperton Zone (CCZ) in the eastern Pacific Ocean. It is located at depths from 4000 to 5000 m and is being explored using a variety of deep-sea technologies. The general study area location is presented in Figure 2.
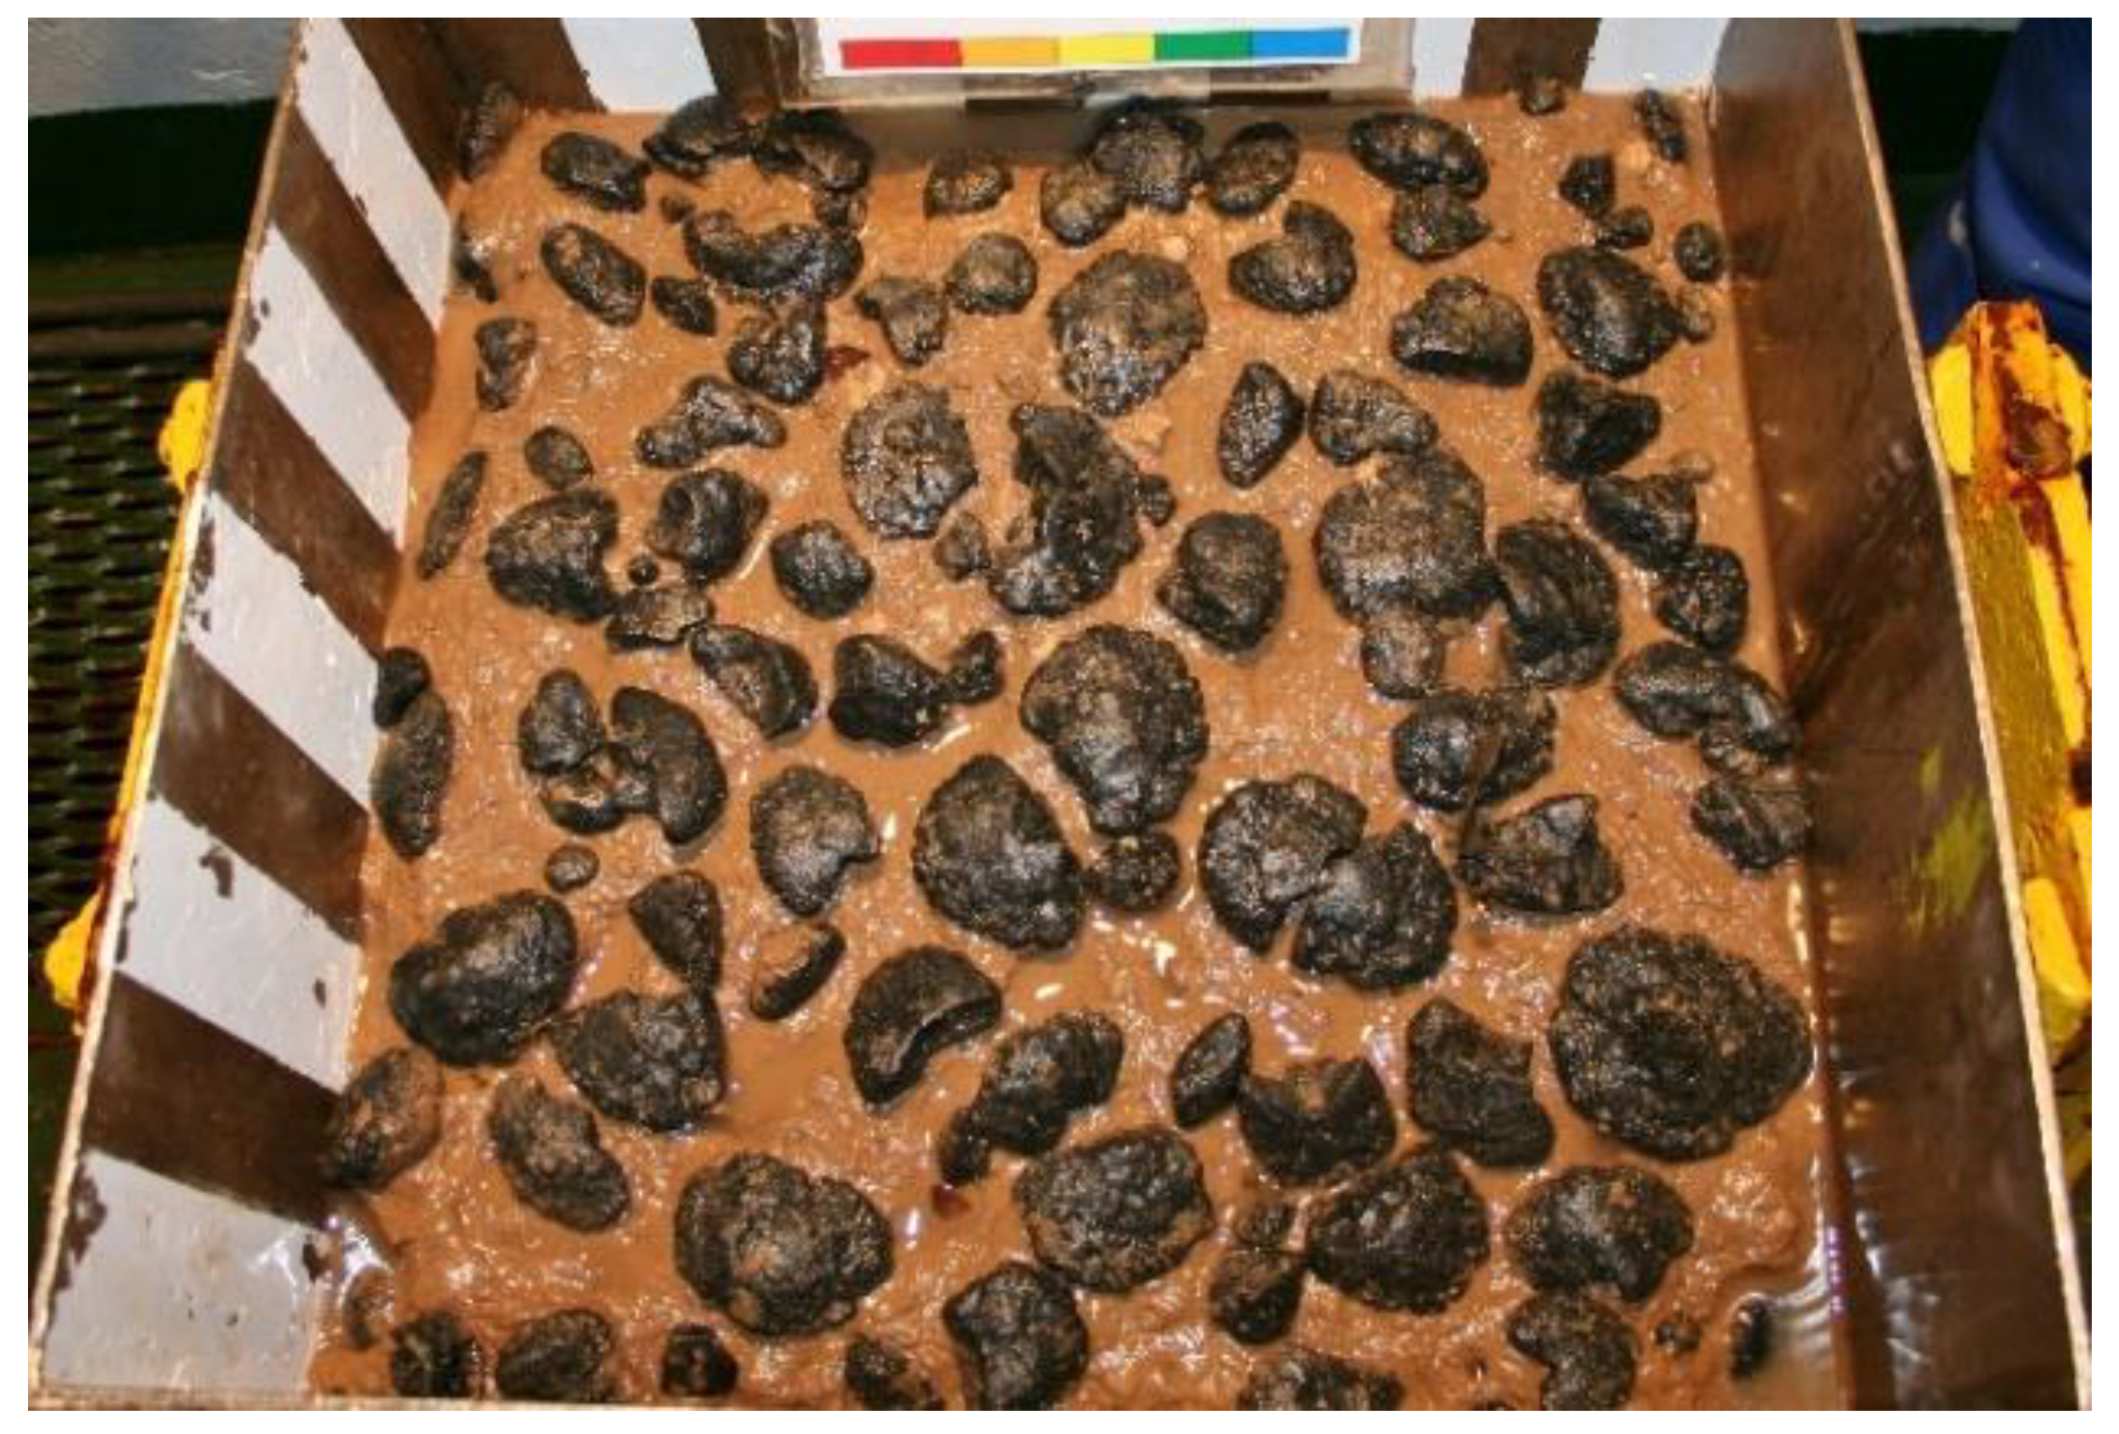
In the IOM area the sea bottom sediment profile is topped by slightly siliceous silty clay and siliceous silty clay. The top 1–15 cm layer comprises the geochemically active layer, which is the environment of nodule formation. Nodule samples collected from the seabed in the IOM area are presented in Figure 3. The seafloor polymetallic nodules mostly consist of nuclei and typically concentric layers of iron and manganese hydroxides and oxides. The nucleus can be composed of volcanoclastic debris, lithified sediment, bioclasts, or fragments of older nodules. Individual layers are characterized by different chemical and mineralogical compositions that are determined by two different growth processes: hydrogenetic and diagenetic growth. Polymetallic nodules are mainly composed of phyllomanganates such as vernadite, birnessite, buserite, and todorokite. They are enriched in Cu, Ni, Co, Zn, Mo, REEs, and other metals. The CCZ nodules vary in size from tiny particles to large nodules of more than 20 cm. More information on the geological setting can be found in e.g., Kotlinski [15].
The study is based on the currently available synthesis of knowledge on the geology of the deposit as well as on mining and processing technologies. These technical factors are constantly in the progress of development and the technical assumptions must respond to economic circumstances. Hence there is no one final set of results giving the optimal indicators. For the sake of understanding the deep-sea mining project economic structure the results can be considered lagging indicators, since they are based on market reactions (e.g., metal prices). Whereas a lagging indicator approach can explain the behavior of the project under some select market conditions and can be useful for model verification and the clarification of patterns, the decision to be made about whether to commence mining should preferably be based on leading indicators that can identify the trends. Leading indicators, however, require the existence of the market to some extent, which is presently a missing factor in the case of deep-sea mining.
The sources of information in the paper are based on extensive technical work that has been done over the last few years within the IOM and cooperating institutions. The report on the IOM polymetallic nodules project in the Pacific Ocean (CCZ) was prepared [16]. Subsequently, the preliminary economic assessment was conducted in 2019, including market study results by Lewicka et al. [17] and the evaluation of two scenarios and four variants of project implementation by Baláž et al. [18].
Resource estimation is based on data and samples collected during scientific expeditions carried out by the IOM. So far, four reports using geostatistical data analysis were prepared by Mucha et al. [19] and Shanov et al. [20] in 2007, Mucha [21] in 2011, Mucha [22] in 2015, and Mucha et al. [23] in 2020, and two validations were performed by a competent person in Szamałek [16,24] in 2016 and 2020.
This study presents an update, taking into account the most recent resource estimation based on data and samples collected by IOM during the latest sea expedition in 2019, as well as changes in metal prices and overall economic situation.

2. Materials and Methods

The financial analysis of the considered project’s scenarios was conducted using the discounted cash flow (DCF) method. DCF is a valuation method that values a business case (project) by projecting its future cash flows and then using the net present value (NPV) method to estimate those cash flows. The DCF approach in project assessment enables suitable net return indicators to be calculated (i.e., NPV, IRR—internal rate of return, PI—profitability index, dPP—discounted payback period). NPV is a mathematical technique to translate projected annual cash flow amounts into the present equivalent amounts using the discount factor (weighted average cost of capital, WACC). The discount factor determines the present value of future cash flows. The higher the WACC percentage, the higher the project risk and the lower the valuation of the project.
NPV is projected by using a series of assumptions about how the project will perform in the future, and then forecasting how this project performance translates into the cash flow generated by the project. IOM project economic analysis was carried out using constant prices (also called real prices) with costs and prices fixed at a base year. The discount rate constitutes the real discount rate (real WACC = nominal WACC deflated by the expected inflation or price increase rate using the Fisher formula that ensures that inflation or price increases will affect prices of all project inputs and outputs equally).
The DCF formula is very sensitive to the input variables. Different scenarios and analyses for a better understanding of the impact of the changes on project results were evaluated. This provided information on the performance of the project in different market scenarios and allowed for the identification of project risks and its optimization. At this stage of the project development the presented results were based on the economic model that can be considered the quantitative analytical tool supporting the investment decision-making process tailored to the particular case of the deep-sea mining project in the CCZ. The principles of the method used and more detailed information on the method used in this work can be found, for example, in Dayananda [25].

3. Assumptions

3.1. Mineral Resources

The current status of geological resources is shown in Table 1. The exploration and exploitable blocks included in the IOM resource estimation with a more general view of the International Seabed Authority (ISA) exploration areas for polymetallic nodules are presented in Figure 2 and Figure 4.
The resource validation was carried out in accordance with the ISA recommendations for the guidance of contractors on the content, format, and structure of annual reports [26]: the reporting standards of the ISA for Mineral Exploration Results Assessments, Mineral Resources, and Mineral Reserves. The classification of resources in the recommendations is based on the resource nomenclature used by CRISCO (Committee for Mineral Reserves International Reporting Standards). At the current stage of the recognition of the nodule deposit, it is possible to classify the mineral resource (inferred, indicated, measured), however, classification as a reserve requires further development of modifying factors (e.g., environmental, mining, technological, economic).
Data on the metals contained in nodules presented in Table 1 were based on the results of geological samples, the number of which was statistically important for the purpose of the resource estimation. Therefore, the subject of this economic analysis was primarily focused on the metals shown in Table 1, also for the purpose of developing metallurgical processing methods. However, polymetallic nodules or other marine minerals may show, in further research, the economic potential associated as well with other metals, such as platinum group metals or elements (PGE). Initial studies conducted by IOM did not show clearly economically significant PGE content in the nodules, although it may be a feature of nodules only for the CCZ area or the result of an incomplete research methodology. Other research, for example, Qiu et al. [27] or Koschinsky et al. [28], indicated that it is a possibility to continue the research in this direction and they suggested that a complex nature of marine minerals may reveal in the future interesting findings in this respect.

3.2. Project Infrastructure

The project included two scenarios. The first scenario represents a complete green-field project (mining–transportation–processing–sale); the second scenario represents sales of mined ore to an existing processing plant (mining–transportation–sale). Ore transportation from the mine site to the port of destination and processing plant is supposed to be chartered.
Both scenarios represent two extreme possibilities for business modeling and therefore differ significantly in terms of extraction scales. The first scenario (4.5 million tons per year) is a CAPEX-heavy scenario. In such a case, it is advisable to assume a large-scale production. The second scenario (1.5 million tons per year) is a CAPEX-light scenario, in which the minimum expenditure is sought, which can show, firstly, the feasibility of the process of extraction, and secondly, bring a measurable economic profit. Hence the differences in the scale of production of the analyzed cases.

3.2.1. Scenario 1

Mining—The mining site is located in the Clarion–Clipperton Zone, in the northeast Pacific Ocean, in the area of the IOM’s H11 and H22 exploration blocks. The H11 exploration block spreads over 5400 km2 and the area within the H11 block, which has been preliminarily classified as suitable for mining, covers 3804 km2 (nodule-free areas and areas with slope inclination over 7° are excluded). The H22 exploration block covers 4150 km2 of the ocean floor (the area preliminarily suitable for mining covers 3229 km2). Initial mining is proposed to start within the area of the H22_NE exploitable block (628 km2, 12.2 Mt) with sufficient resources to cover the first year and a half of production. Resources from the H11 + H22 exploration blocks (77 Mt) are supposed to be sufficient for at least 10 years of production. Initial mining fields of 5 km2 (dimensions 1 × 5 km) are considered. Mining field resources depend on real nodule abundance. In the case of an abundance of 10 kg/m2, 90 to 95 mining fields are required to be delineated to securing a yearly production of 4.5 Mt wet nodules. In the case of an abundance of 14 kg/m2, 65 to 70 mining fields are required. Approximate technical characteristics of one collecting module are presented in Table 2 and they have been assumed on the basis of calculations and design presented by Kostyuk [29].
The collection system consists of the following modules: carrier module (mining ship), collecting module (3 collectors), buffer storage platform (block for the preparation of PNs for lifting), lifting system, power supply system, and control unit module. Mined ore is reloaded to bulk carriers and transported to the port of destination. Basic assumptions of the mining process for scenario 1 are as follows:
-
The volume of industrial production of wet PN—4.5 million tons per year;
-
Time losses are estimated at 20% per year (it is assumed that during this period the mining complex is in storm sludge, transition or routine maintenance/repair works, or works to lower or raise underwater equipment), 290 total working operational days planned;
-
Total loss of nodules, including losses during excavation from the bottom, preparation for lifting, storing on a production vessel, and transport/transshipments, is estimated to be 35%; and
-
Maximum hourly operational production is estimated at 796.2 t, taking into account collector width (7.5 m), number of collectors (3), collector speed (1 m/s), minimal nodule abundance (10 kg/m2), and daily operational time (24 h).
Transport—Transport is supposed to be completely secured by chartering services. The initial location of the processing plant and port of unloading is assumed to be Moa (Cuba). The estimation of transport costs is based on chartering service calculations for heavy bulk cargo. The roundtrip distance from the mining site to the port of Moa is 6772 NM (33.7 days). Max vessel capacity is 30,000 tons. A total of 14 vessels are required to secure transport of 4.5 Mt of polymetallic nodules per year.
Processing—Three processing technologies are considered (Table 3): hydrometallurgy (HM), pyro-hydrometallurgy (PM), and hydrometallurgy with pressure (HPAL).
HM Technology—hydrometallurgical technology of selective leaching using sulfur dioxide, producing concentrates of Cu, Ni, Co, and MnO2.
PM Technology—pyro-hydrometallurgical technology—selective electro-reduction of nonferrous metals (ore-smelting in an electric furnace) producing SiMn and subsequent treatment of the complex Cu/Ni/Co alloy.
HPAL Technology—hydrometallurgical technology by high-pressure acid leaching using pyrite as a reducing agent and producing concentrates of Cu, Ni, Co, Zn, and MnO2.
Each of the abovementioned methods has its own advantages and disadvantages. The difficulty of processing polymetallic nodules is that they are complex ore. The metals (in the form of oxides) contained in them, which are the subject of economic interest, are not obtained simultaneously from one material anywhere in the world, hence it is difficult at the initial stages of research to conclude the usefulness of one method. The process details of the technologies developed in the IOM are summarized in Abramowski et al. [30] and their basic parameters are presented in Table 3.
Table 3. Comparison of the three processing technologies optimized by IOM [31,32].
TechnologyMaterial
Preparation
High Temp. Pre-TreatmentLeaching MethodMetal
Separation
Development
Stage
Metal Recovery (%)
CuNiCoZnMn
HMWet grindingNoneSelective leaching with SO2 under atmospheric pressureSolvent extraction, S0+SO2 precipitation Mn+SO2 precipitationBench scale development
92.196.192.598.5
PMDrying, heating, sievingElectro-smeltingTwo-stage dissolution: reductive in the presence of sulfuric acid and oxidation in the presence of air and H2OSolvent extraction, precipitationPilot scale for electro-smelting
89.983.484.272.6
HPALWet grinding, pulp preparationNoneSulfuric acid pressure leachingResin-in-pulp (ion exchange resins), solvent extraction, H2S precipitation, calcination (Mn)Bench scale development
87.193.294.193.596.6
Pyro-metallurgical (PM) methods are characterized by relatively fast process time and are considered relatively simple engineering methods. They are also not very sensitive to changes in the chemical composition of the ore. However, they mostly require significant energy inputs, especially during the reduction stage and drying, which is necessary in the case of nodules. PM methods are generally considered not very suitable for complicated ores, as they do not produce concentrates. The PM method is the most burdened one due to greenhouse gas emissions (energy consumption and emissions from processes). However, it was the PM method that was tested with PN processing on the largest scale of all the methods developed by the IOM (pilot scale, electro-smelting phase).
Typical HM methods have a number of advantages, including efficiency in relation to low-grade raw materials, elimination of gas and dust emissions, simple devices and easy process control, and small-scale suitability. The disadvantage of HM methods is the slow reaction rate (compared to PM processes), significant volumes of dilute solutions, often complex processes related to the separation of metals, and the need to control the generated wastewater and fragmented waste. HPAL technology is the development of HM methods in which the process utilizes high temperatures and elevated pressure and sulfuric acid to separate metals. It is used for laterite ores, e.g., for nickel and cobalt extraction. In comparison with typical HM, the HPAL process is characterized by faster leaching and higher rates of extraction. There are, however, some challenges related to HPAL technology, which are complicated process control and usually high investment costs.
For the purpose of this economic analysis, a technical study was carried out to evaluate the investment costs and operating costs of the three methods indicated above. In the case of the PM and HM methods, a green field investment was assumed in which a completely new metallurgical plants are being built. In the case of the HPAL technology, the costs were assessed assuming an investment to extend the existing metallurgical installations in Moa, Cuba. In this case, it was anticipated to reduce the high costs typical of HPAL technology, but it should be mentioned that they were still relatively high. Table 3 presents the features of the three analyzed technologies.

3.2.2. Scenario 2

Mining—The mining site is located in the Clarion–Clipperton Zone in the northeast Pacific Ocean, in the area of the IOM’s H22 exploration block. The H22 exploration block covers 4150 km2 of the ocean floor. Initial mining is proposed to start within the area of the H22-NE exploitation block (an area of 628 km2, 12.2 Mt) with resources sufficient to cover the first five years of production. The resources for the H11 + H22 exploration blocks (77 Mt) are supposed to be sufficient for at least 30 years of production. Initial mining fields of 5 km2 (dimensions 1 × 5 km) are considered. Mining field resources depend on real nodule abundance. In the case of an abundance of 10 kg/m2, 30 to 33 mining fields are required to be delineated to securing a yearly production of 1.5 Mt ton of wet nodules. In the case of an abundance of 14 kg/m2, 22 to 25 mining fields are required.
The collection system consists of the following modules: carrier module (mining ship), collecting module (1 collector), buffer storage platform (block for the preparation of PNs for lifting), lifting system, power supply system, and control unit module. Mined ore is loaded on bulk carriers and transported to the port of destination. Basic assumptions of the mining process for scenario 2 are as follows:
-
The volume of industrial production of wet PN—1.5 million tons per year;
-
Time losses are estimated at 20% per year (it is assumed that during this period the mining complex is in storm sludge, transition or routine maintenance/repair works, or works to lower or raise underwater equipment), 290 total working operational days planned;
-
Total loss of nodules, including losses during excavation from the bottom, preparation for lifting, storing on a production vessel, and transport/transshipments, is estimated to be 35%; and
-
Maximum hourly operational production is estimated at 265.4 t, taking into account collector width (7.5 m), number of collectors (1), collector speed (1 m/s), minimal nodule abundance (10 kg/m2), and daily operational time (24 h).
Transport—Transport is supposed to be completely secured by chartering services. The initial location of the processing plant and port of unloading is assumed to be Moa (Cuba). The estimation of transport costs is based on chartering service calculations for heavy bulk cargo. The average roundtrip distance from the mining site to the port of Moa is 6772 NM (33.7 days). The max vessel capacity is 30,000 tons; five vessels are required to secure transport of 1.5 Mt of polymetallic nodules per year.
Processing—This scenario represents the sale of polymetallic nodules to Moa Group Cubaniquel with no share by the IOM on the sale of processing products. The proposed technology is hydrometallurgy by pressure sulfuric acid leaching (HPAL) using pyrite as a reducing agent and a processing mix of laterite ores and polymetallic nodules. The operating costs of the metallurgical process are used to calculate the market price of PN, which assumes that the market price of the polymetallic nodule cannot be higher than the sum of the value of individual metals in raw polymetallic nodules minus the costs of the metallurgical process and the buyer’s margin (expected earnings from the sale of metals).

4. Model Results

4.1. Economic Evaluation Results (January 2019)

The modeling and economic assessment of the project required the adoption of various assumptions and the determination of the external conditions they were used under. Capital and operational expenses were estimated on the basis of the results of the preliminary design of systems for mining. The parametric studies were performed with scaling to get the results for different production scales. The information on the structure of the cost and particular subsystem investments was compared and adjusted with the use of some publicly available data on similar projects, e.g., the Papua New Guinea Solwara project [33] or practices applied in offshore oil and gas extraction. The summary is given (Table 4).
The calculation of the mining operating costs was carried out based on marine fuel prices, rates of compensation of floating crews, and general maintenance costs for vessels operating in ultra-deep-water conditions (Table 5).
The assessment of capital expenditures was based on the pre-feasibility study (PFS) developed in 2012 by BAT-Engineering, Bratislava [31], and its update in 2016 [32]. The evaluation of the economic efficiency of the process was based on three alternative technologies of metal processing (Table 6). HM and PM technologies were considered a new investment, whereas the use of HPAL technology was based on the technological extension of the existing facilities based in Cuba, Moa. The data on processing the variable operating costs are presented in Table 7. The expected annual production of metal in products is shown in Table 8, main economic assumptions are presented in Table 9.
The estimated PN market price (Figure 5) is a derivative of the metal prices quoted in the London Metal Exchange in November 2018 and the metallurgical process costs. The value of individual metals in raw ore takes into account the chemical composition of the ore, the metal recovery rate, and the rate of conversion of metal concentrates to their pure form. The sum of the market value of metals per metric ton of ore was reduced by the costs of the metallurgical process (HPAL) and the metal processor margin. The potential sale price of PN obtained in this way is the maximum achievable market price of the raw ore, which should cover the costs of the extraction and transport of nodules and provide a margin covering the investor’s other costs and risks as well as project financing costs.
Results of scenario 1: Scenario 1 is a variant of the project that assumes mining (4.5 million tons of wet polymetallic nodules) and processing 3.0 million tons of dry polymetallic nodules. The processing part of the business case takes into consideration three options of technologies, which could be used to process polymetallic nodules. The results of the economic analysis in terms of accumulated cash flow for different conditions and processing are presented in Figure 6, Figure 7 and Figure 8.
The results of the economic analysis of scenario 1 in terms of economic indicators and variables for different conditions and processing technologies are presented in Table 10.
Results of scenario 2: Scenario 2 is a variant of the project limited to the mining and sale of raw ore. This option does not take into account the construction costs of the processing plant and relevant operating costs. In this scenario, all the extracted PN amount would be sold on the market. The price of PN is estimated according to the results and method presented in Figure 5. In addition to capital expenditure and unit costs of PN extraction, the basic factor of the profitability of such a scenario is the price and sale amount of raw ore. The results of the economic analysis in terms of accumulated cash flow are presented in Figure 9. The results of the economic analysis of scenario 2 in terms of economic indicators and variables are presented in Table 11.

4.2. Economic Evaluation Update (November 2020)

Business assumptions for the update: To maintain the consistency of the economic model, apart from updating the prices of metals, no business assumptions of the analysis were changed in relation to the analysis carried out in January 2019. This ensured the comparability of the results and enabled the analysis of changes in the profitability of the project at different metal prices.
Regardless of the analyzed project implementation scenario, its results depend on the prices of metals. Due to the large planned volume of manganese production, its prices have the strongest impact on the rate of return on investment. In the period from the last update of the preliminary economic assessment (January 2019) to November 2020, the price of manganese decreased from USD 2750 per ton to USD 1670 per ton (down 64.7%). A similar scale of price decline was observed for cobalt, but due to the lower production of this metal, the decline in price did not significantly affect the project results (Table 12).
The aggregated sum of annual lost profits due to the decline in manganese and cobalt prices exceeded USD 0.5 billion for PM technology and USD 0.25 billion for HPAL technology (Figure 10). A similarly high decrease was recorded for the price of unprocessed ore. In this case, its estimated market price dropped from USD/t 222 to USD/t 153. This caused a decrease in annual revenues from the sale of polymetallic nodules (ore) of USD 110 million.
Assuming (for this study) that prices valid in November 2020 remain unchanged (but discounted in the project duration according to the method of project discounted cash flow measured in constant prices), the loss of revenue from the sale of metals compared to the market conditions valid in January 2019 amounted to USD 3 billion for HPAL technology (Figure 11).
The project’s total undiscounted revenue (calculated as the sum of all revenues from the sale of metals over the 20-year operating phase of the project) dropped from USD 22.9 billion to USD 20 billion between January 2019 and November 2020 (scenario 1, HPAL technology). The nickel price increase of 30%, providing a revenue gain of more than USD 1.3 billion, did not offset the loss of manganese sales revenue (down USD 4.5 billion).

Economic Evaluation

The loss of revenue from the sale of manganese and cobalt caused a significant decrease in the profitability of the project, regardless of the considered scenario and technological variant. Neither option achieved a rate of return justifying the start of the project. For both scenarios, the project did not bring an increase in value (positive NPV). In the worst-case scenario (PM technology) the decrease in discounted NPV reached USD 2 billion (Table 13, Figure 12).
In order to find realistic variables that would ensure the profitability of the project, various scenarios were tested. Achieving a positive NPV required a simultaneous reduction in project costs (both operational and capital expenditure) and an increase in metal prices (Table 14). The range of changes of +/− 20% was applied for testing. A similar sensitivity analysis was performed for scenario 2 (Table 15), however, to achieve the positive results of the project, it was enough to apply a range of changes in the range of +/− 10%.

5. Conclusions

Regular updates of the economic model data enable assessment of the quality of business assumptions and examine the impact of changes on the results of the project. Conclusions from the analysis are used to optimize the scope of the project and identify risks associated with it.
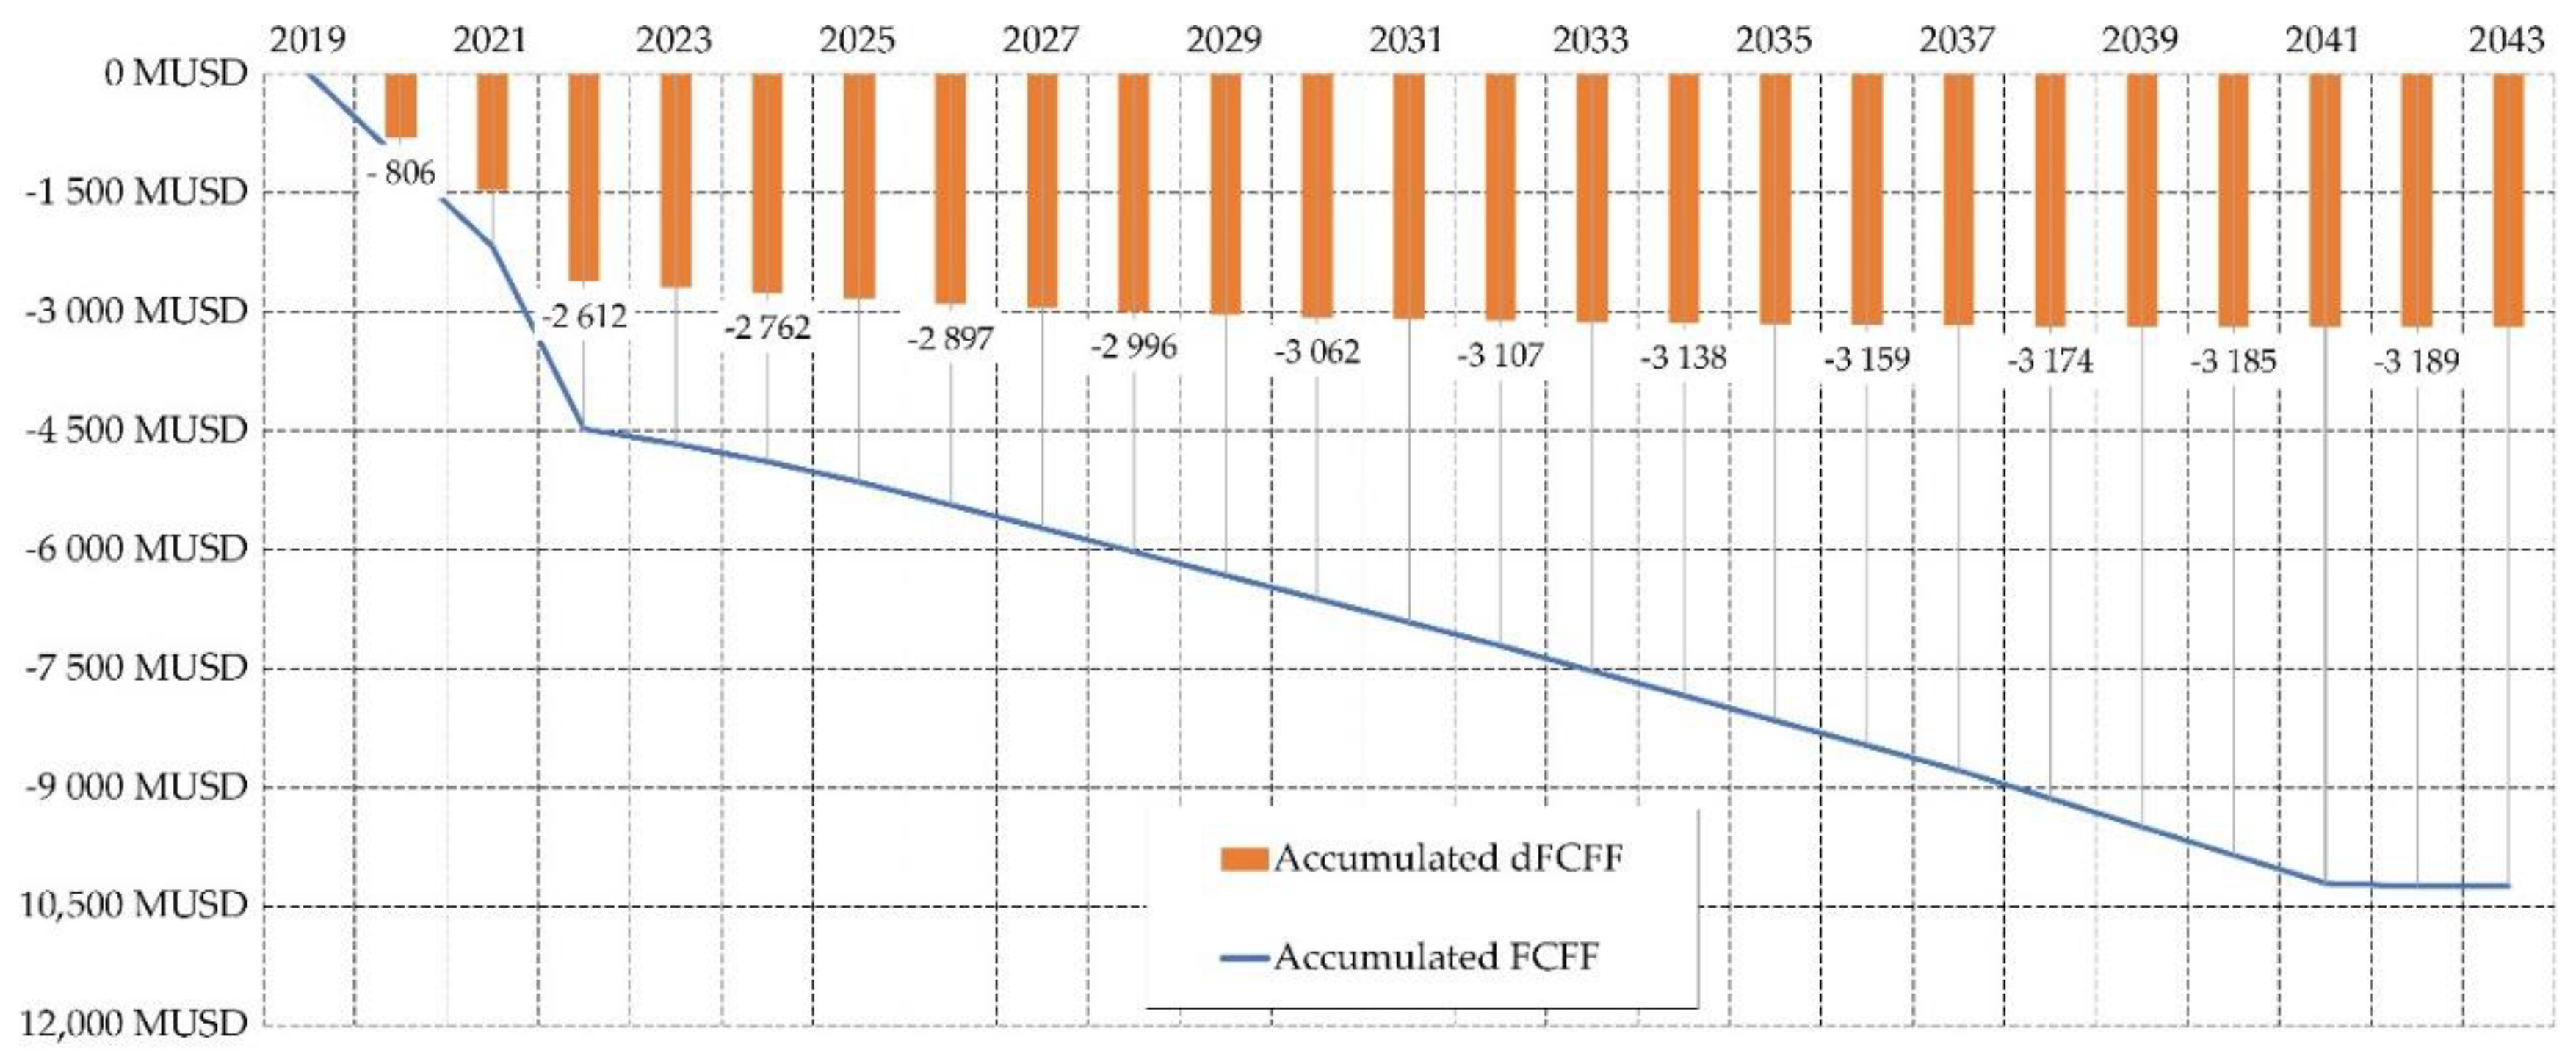
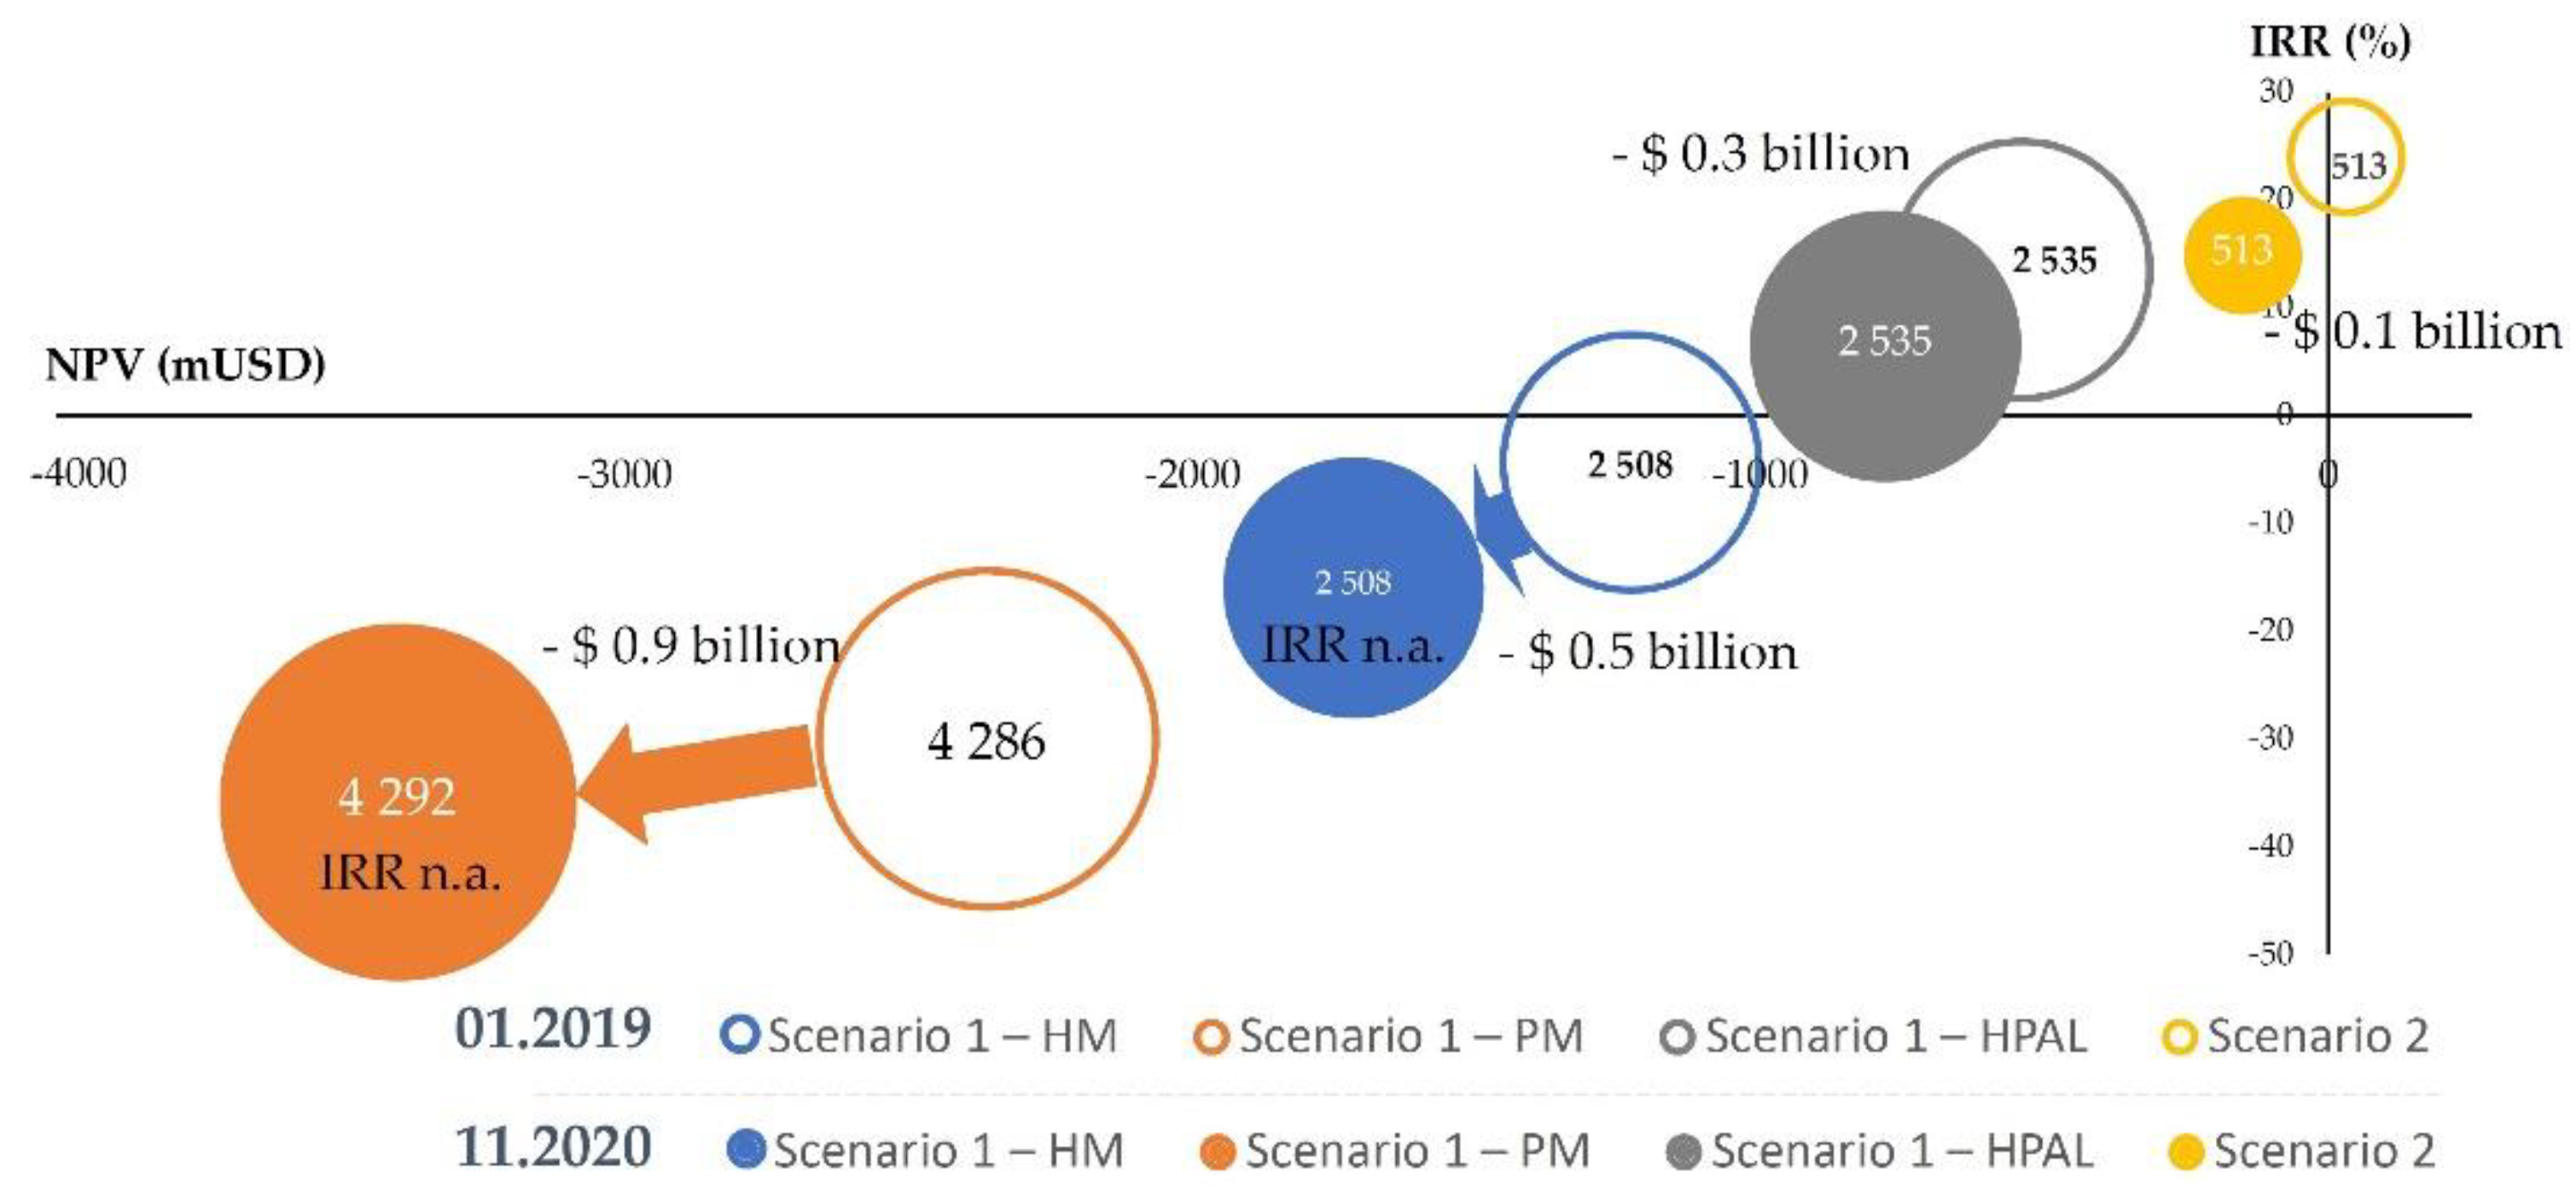
The analysis of alternative project implementation options indicated that the project requires the optimization of the business concept and favorable market conditions. For the cases in scenario 1, which includes the investment in a combination of mining and processing (Figure 6 and Figure 7), the project results were negative regardless of the technology chosen. This resulted both from high plant construction costs (CAPEX) and operating costs (OPEX). It is not expected that these costs will be reduced significantly as technology develops. The increase in material and labor costs was a constant and stable trend, as for the increase in energy costs, which for HM and PM technologies are key elements of operating costs. Therefore, profitability improvement should be found in the growth of the scale of operations. However, these are not suitable solutions for the IOM. It requires a substantial capital investment and carries a high investment and operational risk.
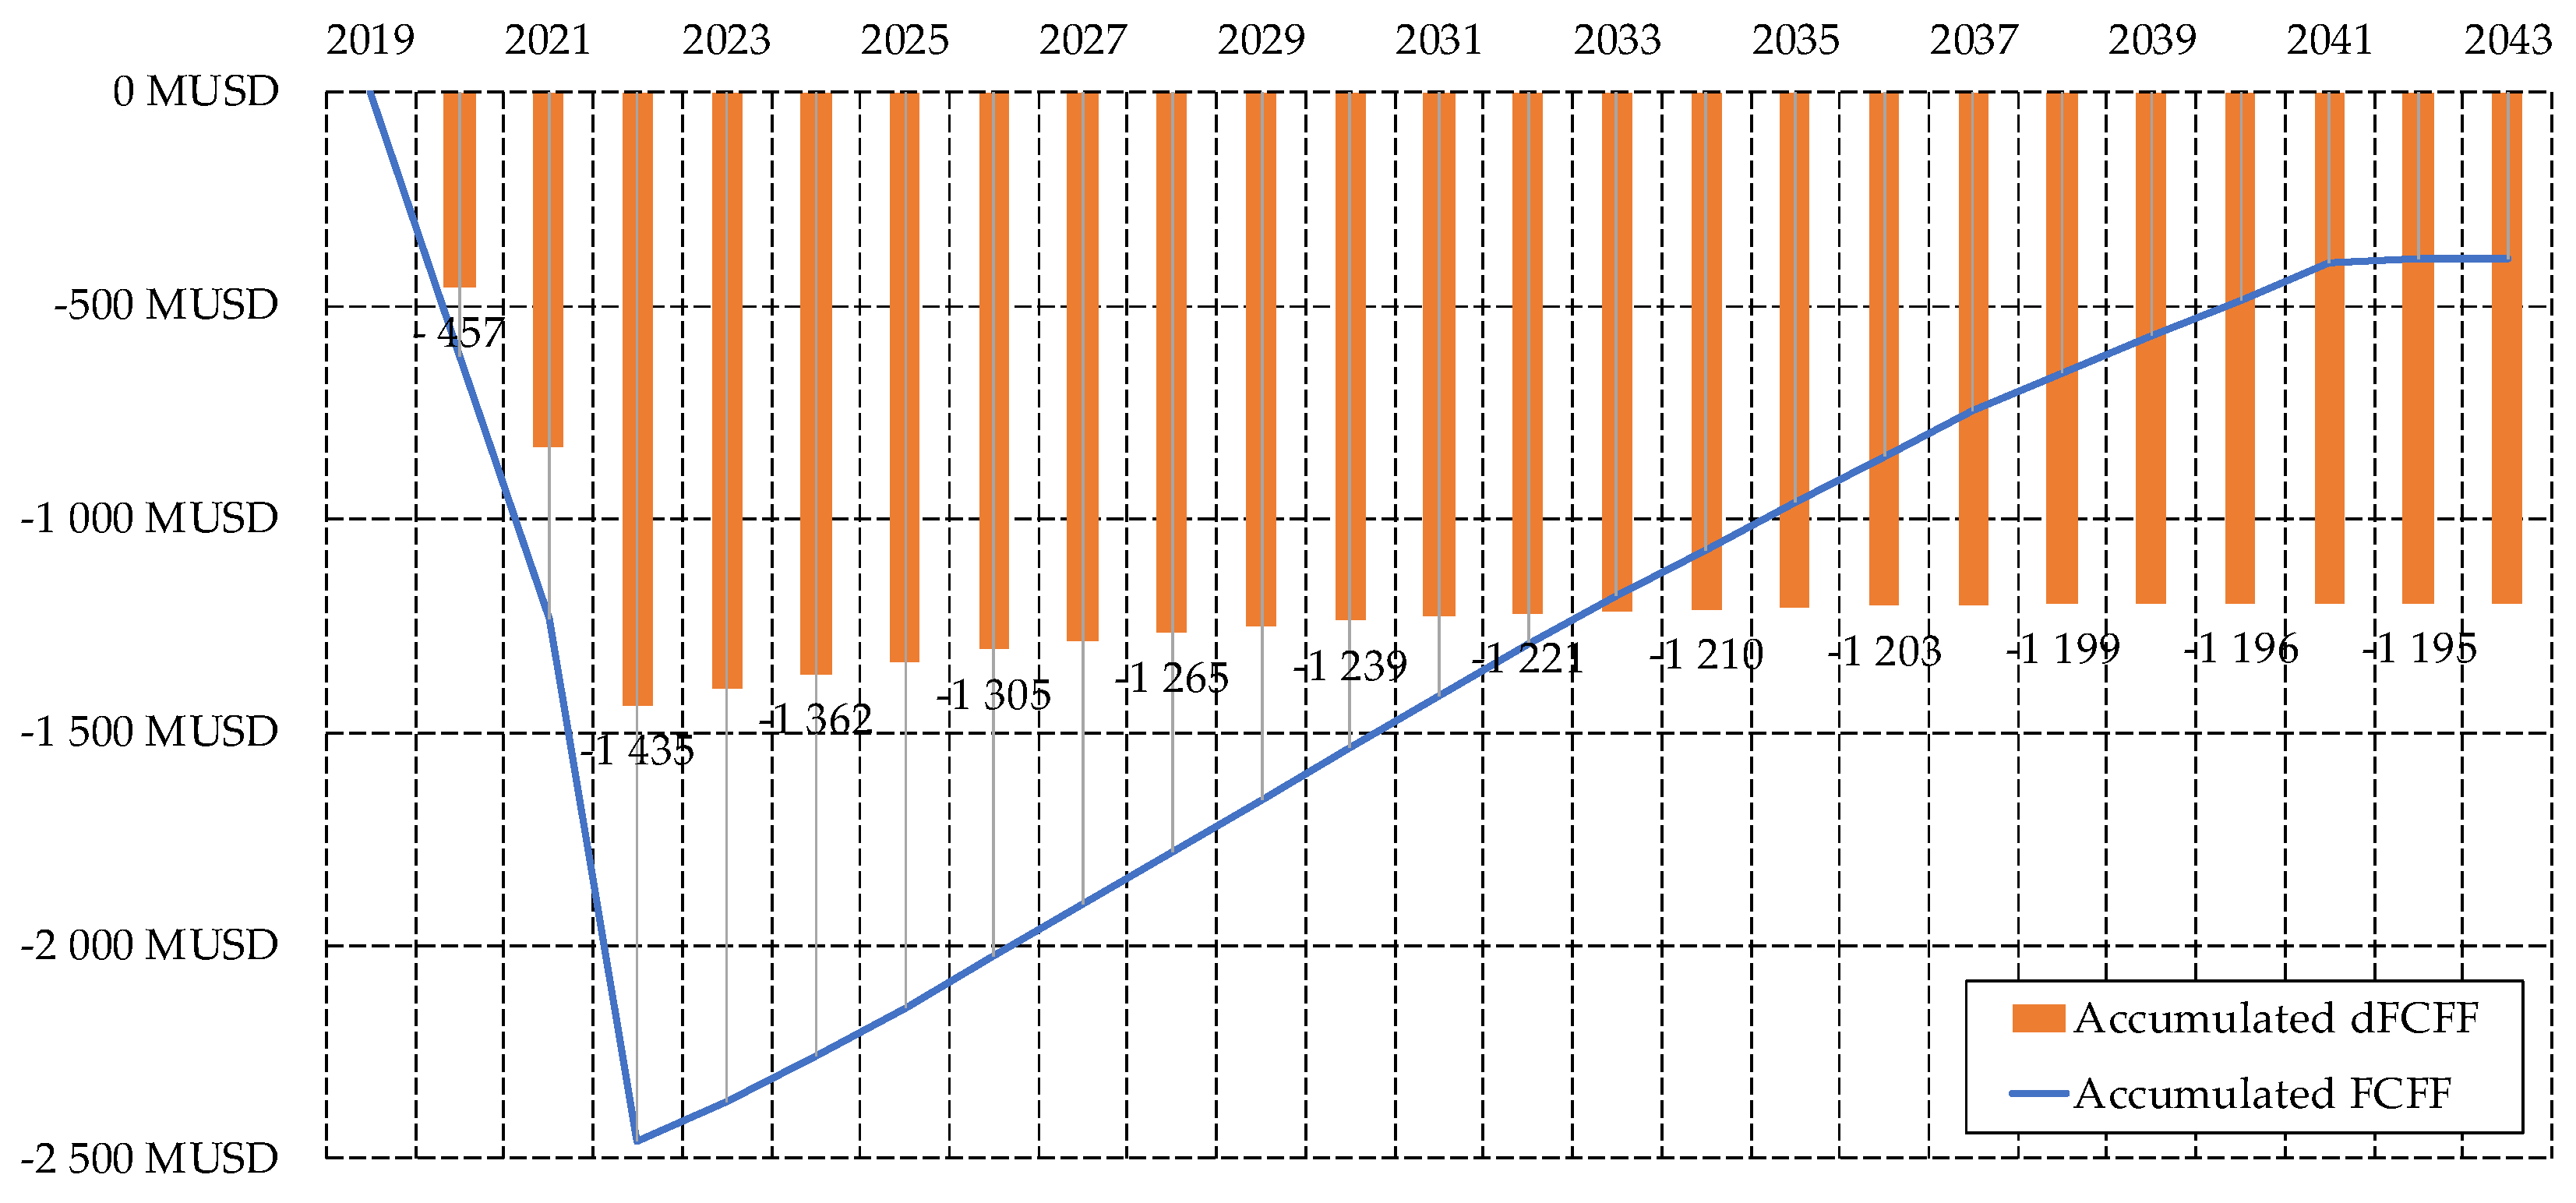
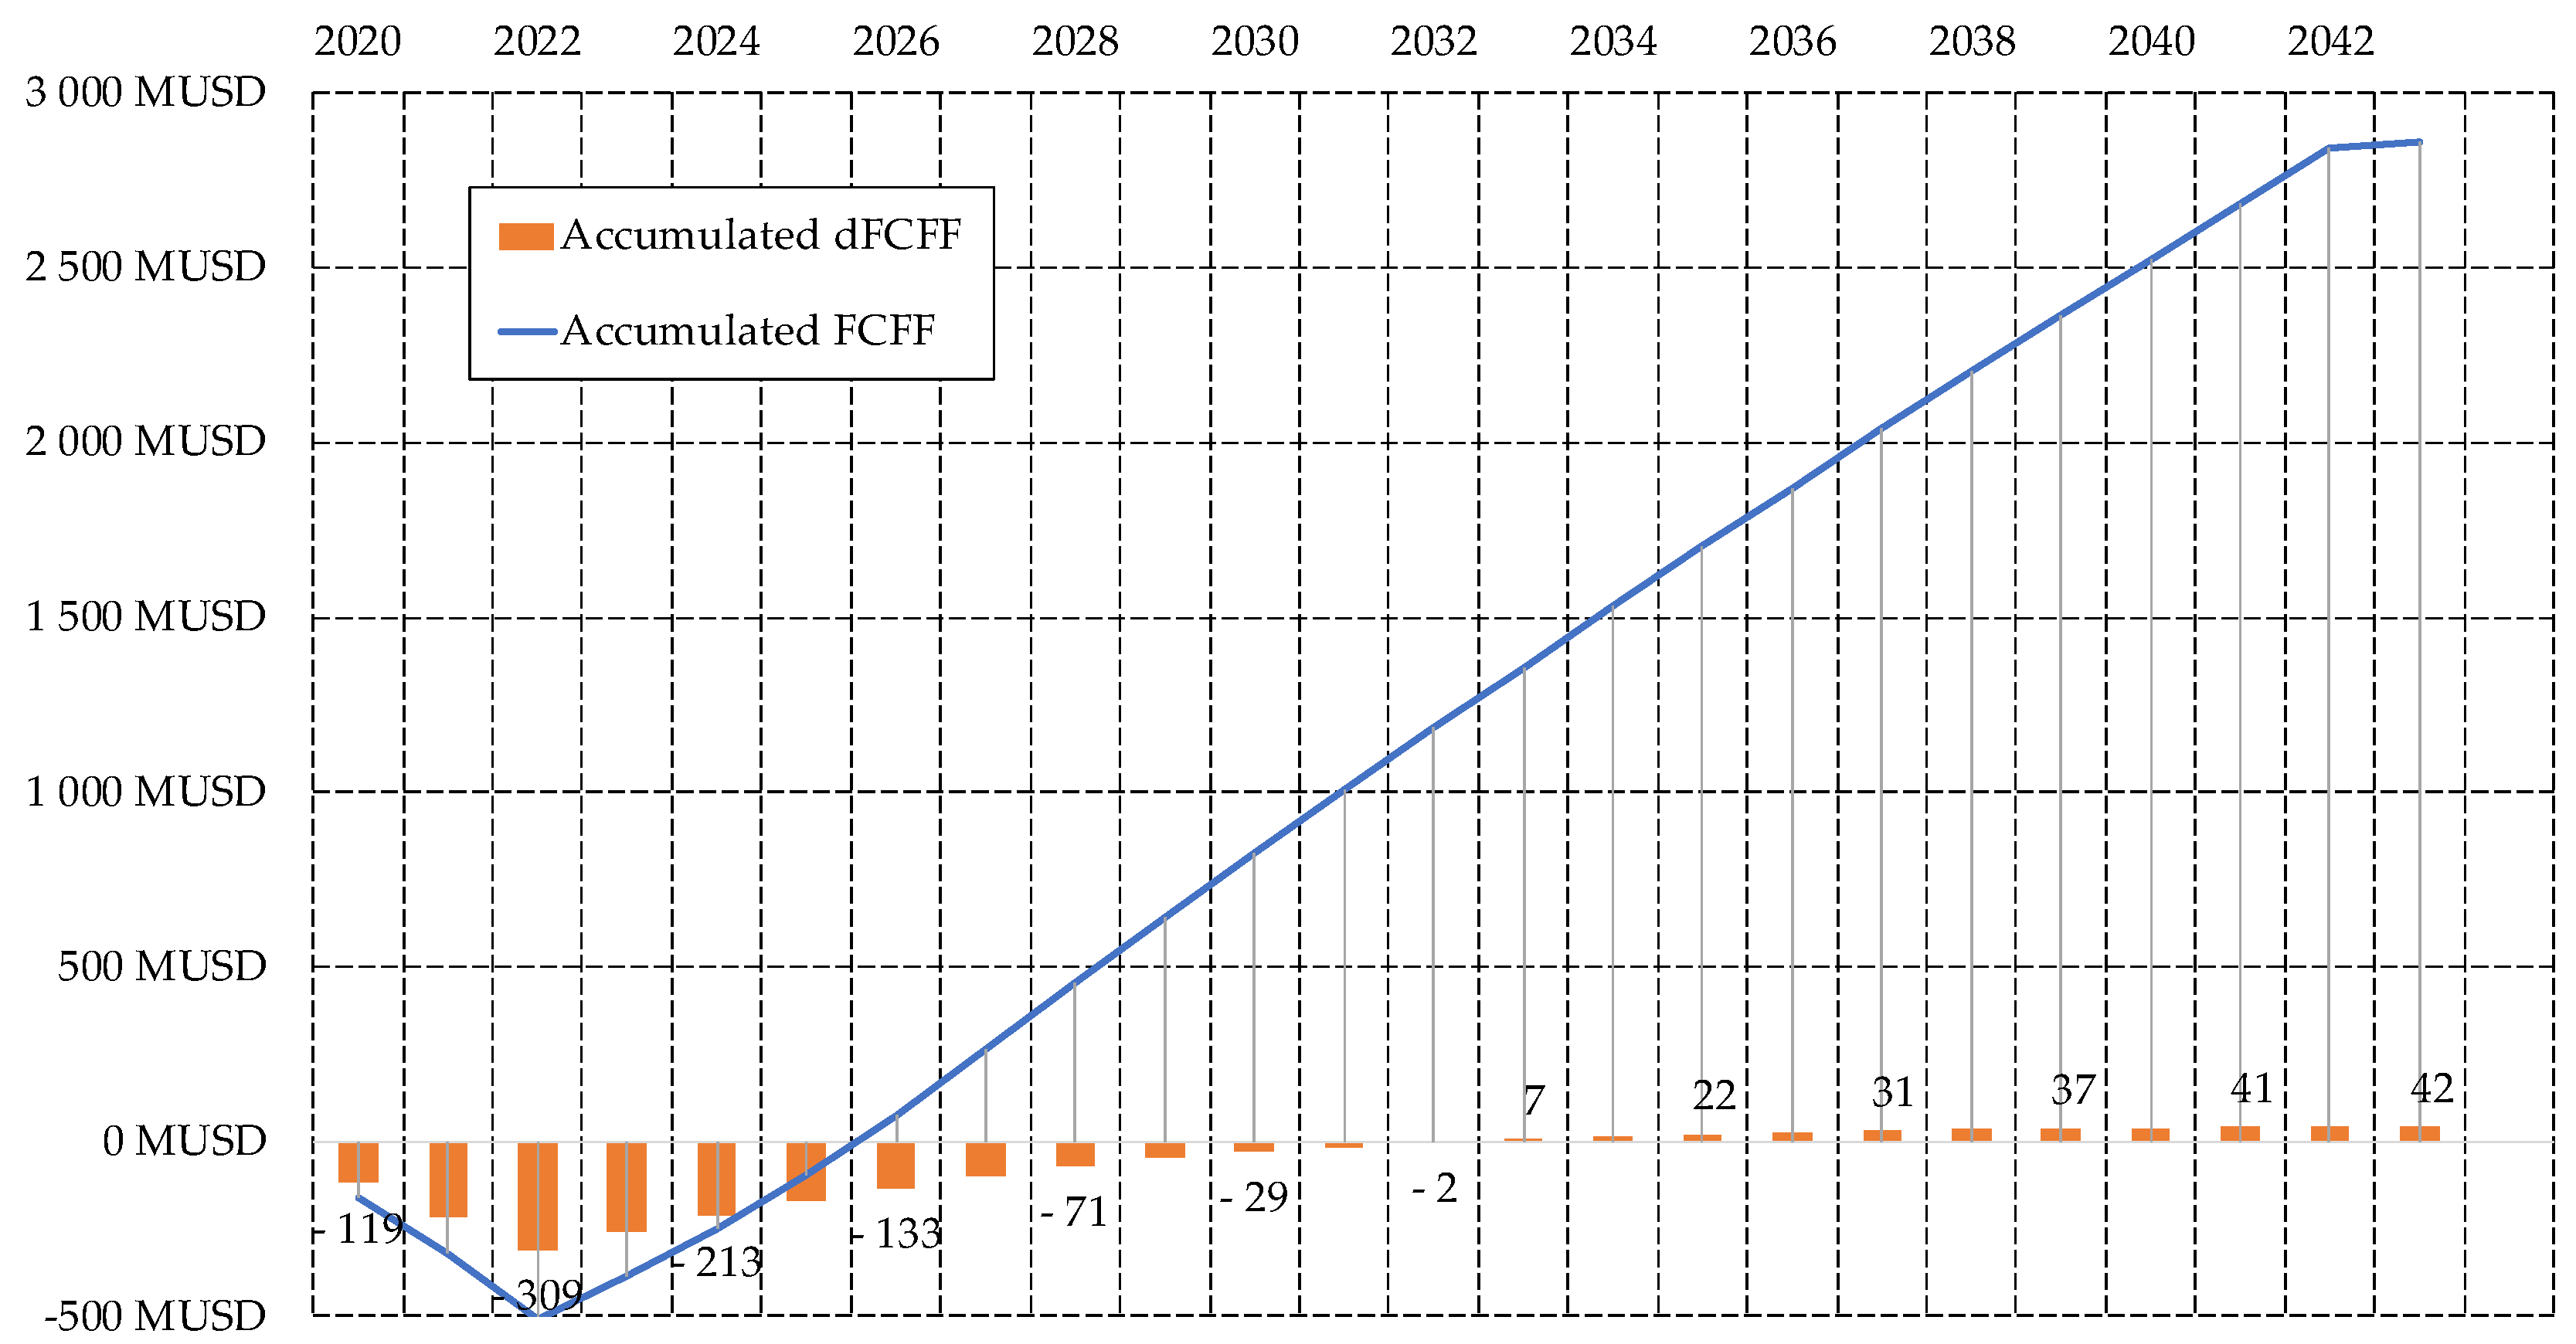
Better results were achieved for the HPAL technology (Figure 8). Even though the rate of return for the HPAL (IRR) technology was lower than WACC, the results obtained can be considered promising. Most likely the better results in this case were obtained because of the relatively lower cost of investment due to the partial inclusion of existing metallurgical facilities (an extension of the existing ones) and lower operational expenses. Moreover, there are many optimization options that can improve the efficiency of such an investment variant (among them are technology improvement, plant location, change in the scale of production, modernization of the existing plant, and mixing of the raw material charge). Improvement of the result may also be expected due to a decrease in the cost of capital (due to the increase in project maturity being a decrease in risk) and an increase in demand for metals and their prices. Other technologies (HM, PM) are too costly at present to treat them as a viable alternative to the HPAL technology, but it is not precluded that the market conditions may change in the future, especially in terms of factors that have a big influence on economic viability.
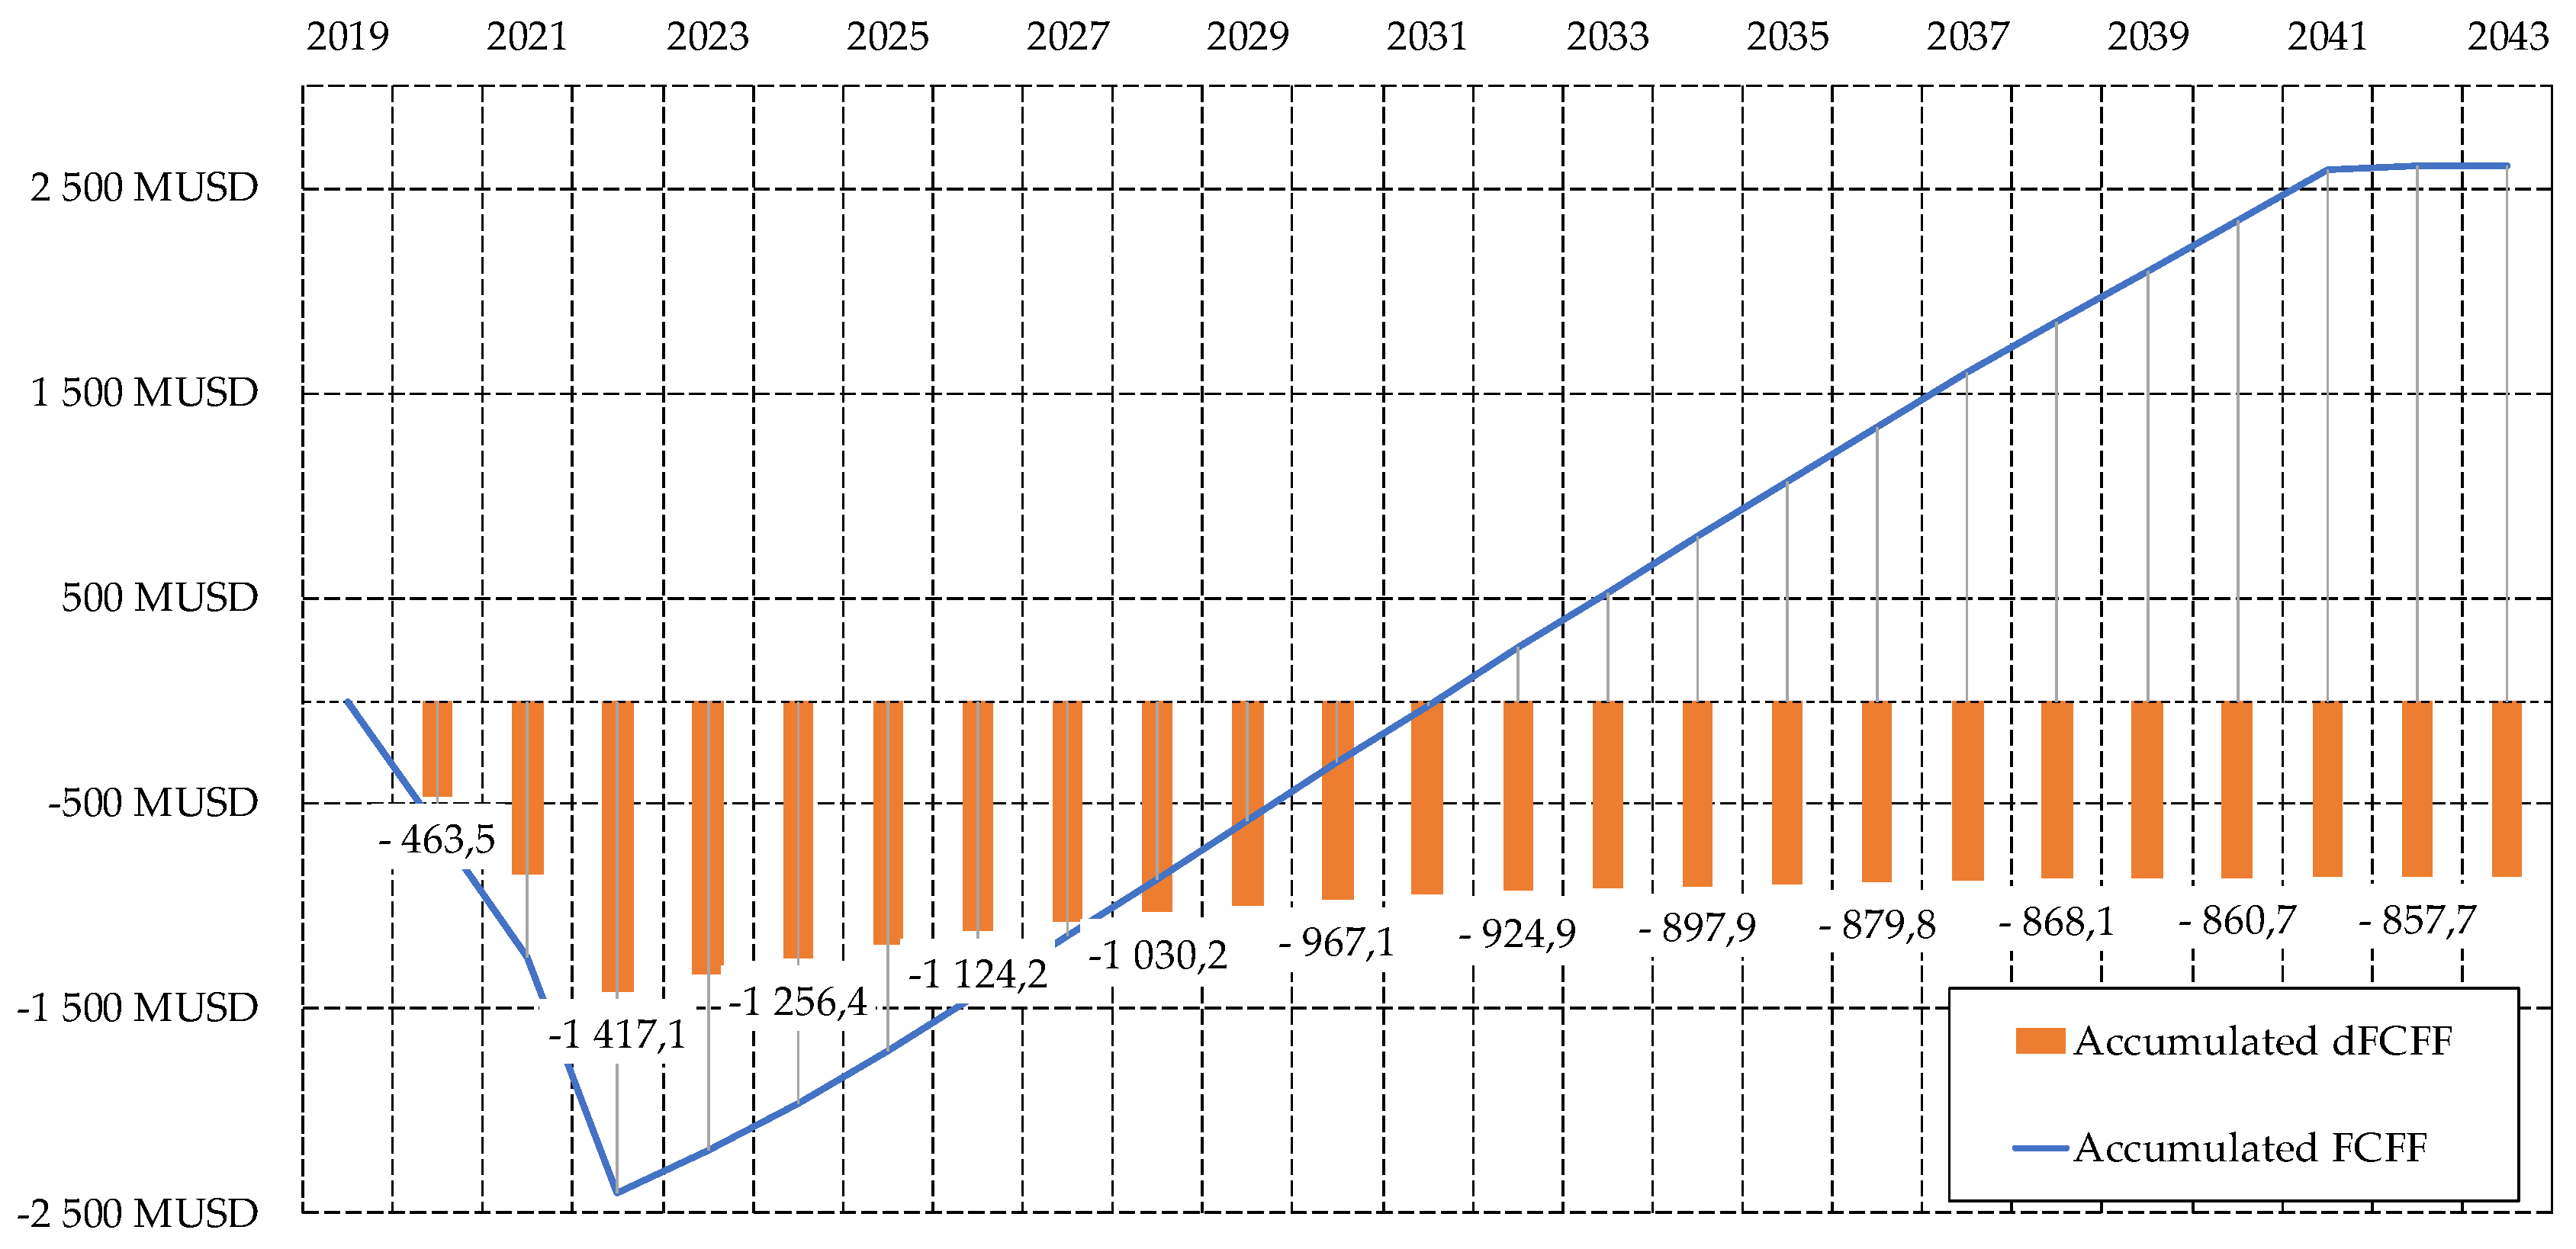
A better solution seems to be to use the existing production capacity or ordering metal processing as an external service. However, this requires reconsidering the optimal capacity of PN production and the sales structure (raw ore vs. metal extraction). This will be the subject of future analysis. A possible resignation from the construction of a new metal processing plant should not cause an interruption of work related to the evaluation of the process technology, especially since in the case of scenario 2 (Figure 9) it was shown that there was a possibility of a positive business implementation of the polymetallic nodule extraction project. Obtaining positive economic indicators was possible in this case thanks to the smaller scale of investments and the use of the existing infrastructure for the sake of sales assessment.
The effectiveness of the project strongly depends on the technological variant. Although the current level of development of the project does not allow for final investment decisions, the results of the calculations were accurate enough to indicate directions for further optimization of the works. This is extremely important because further economic analysis of all options would be extremely cost-intensive and time-consuming.
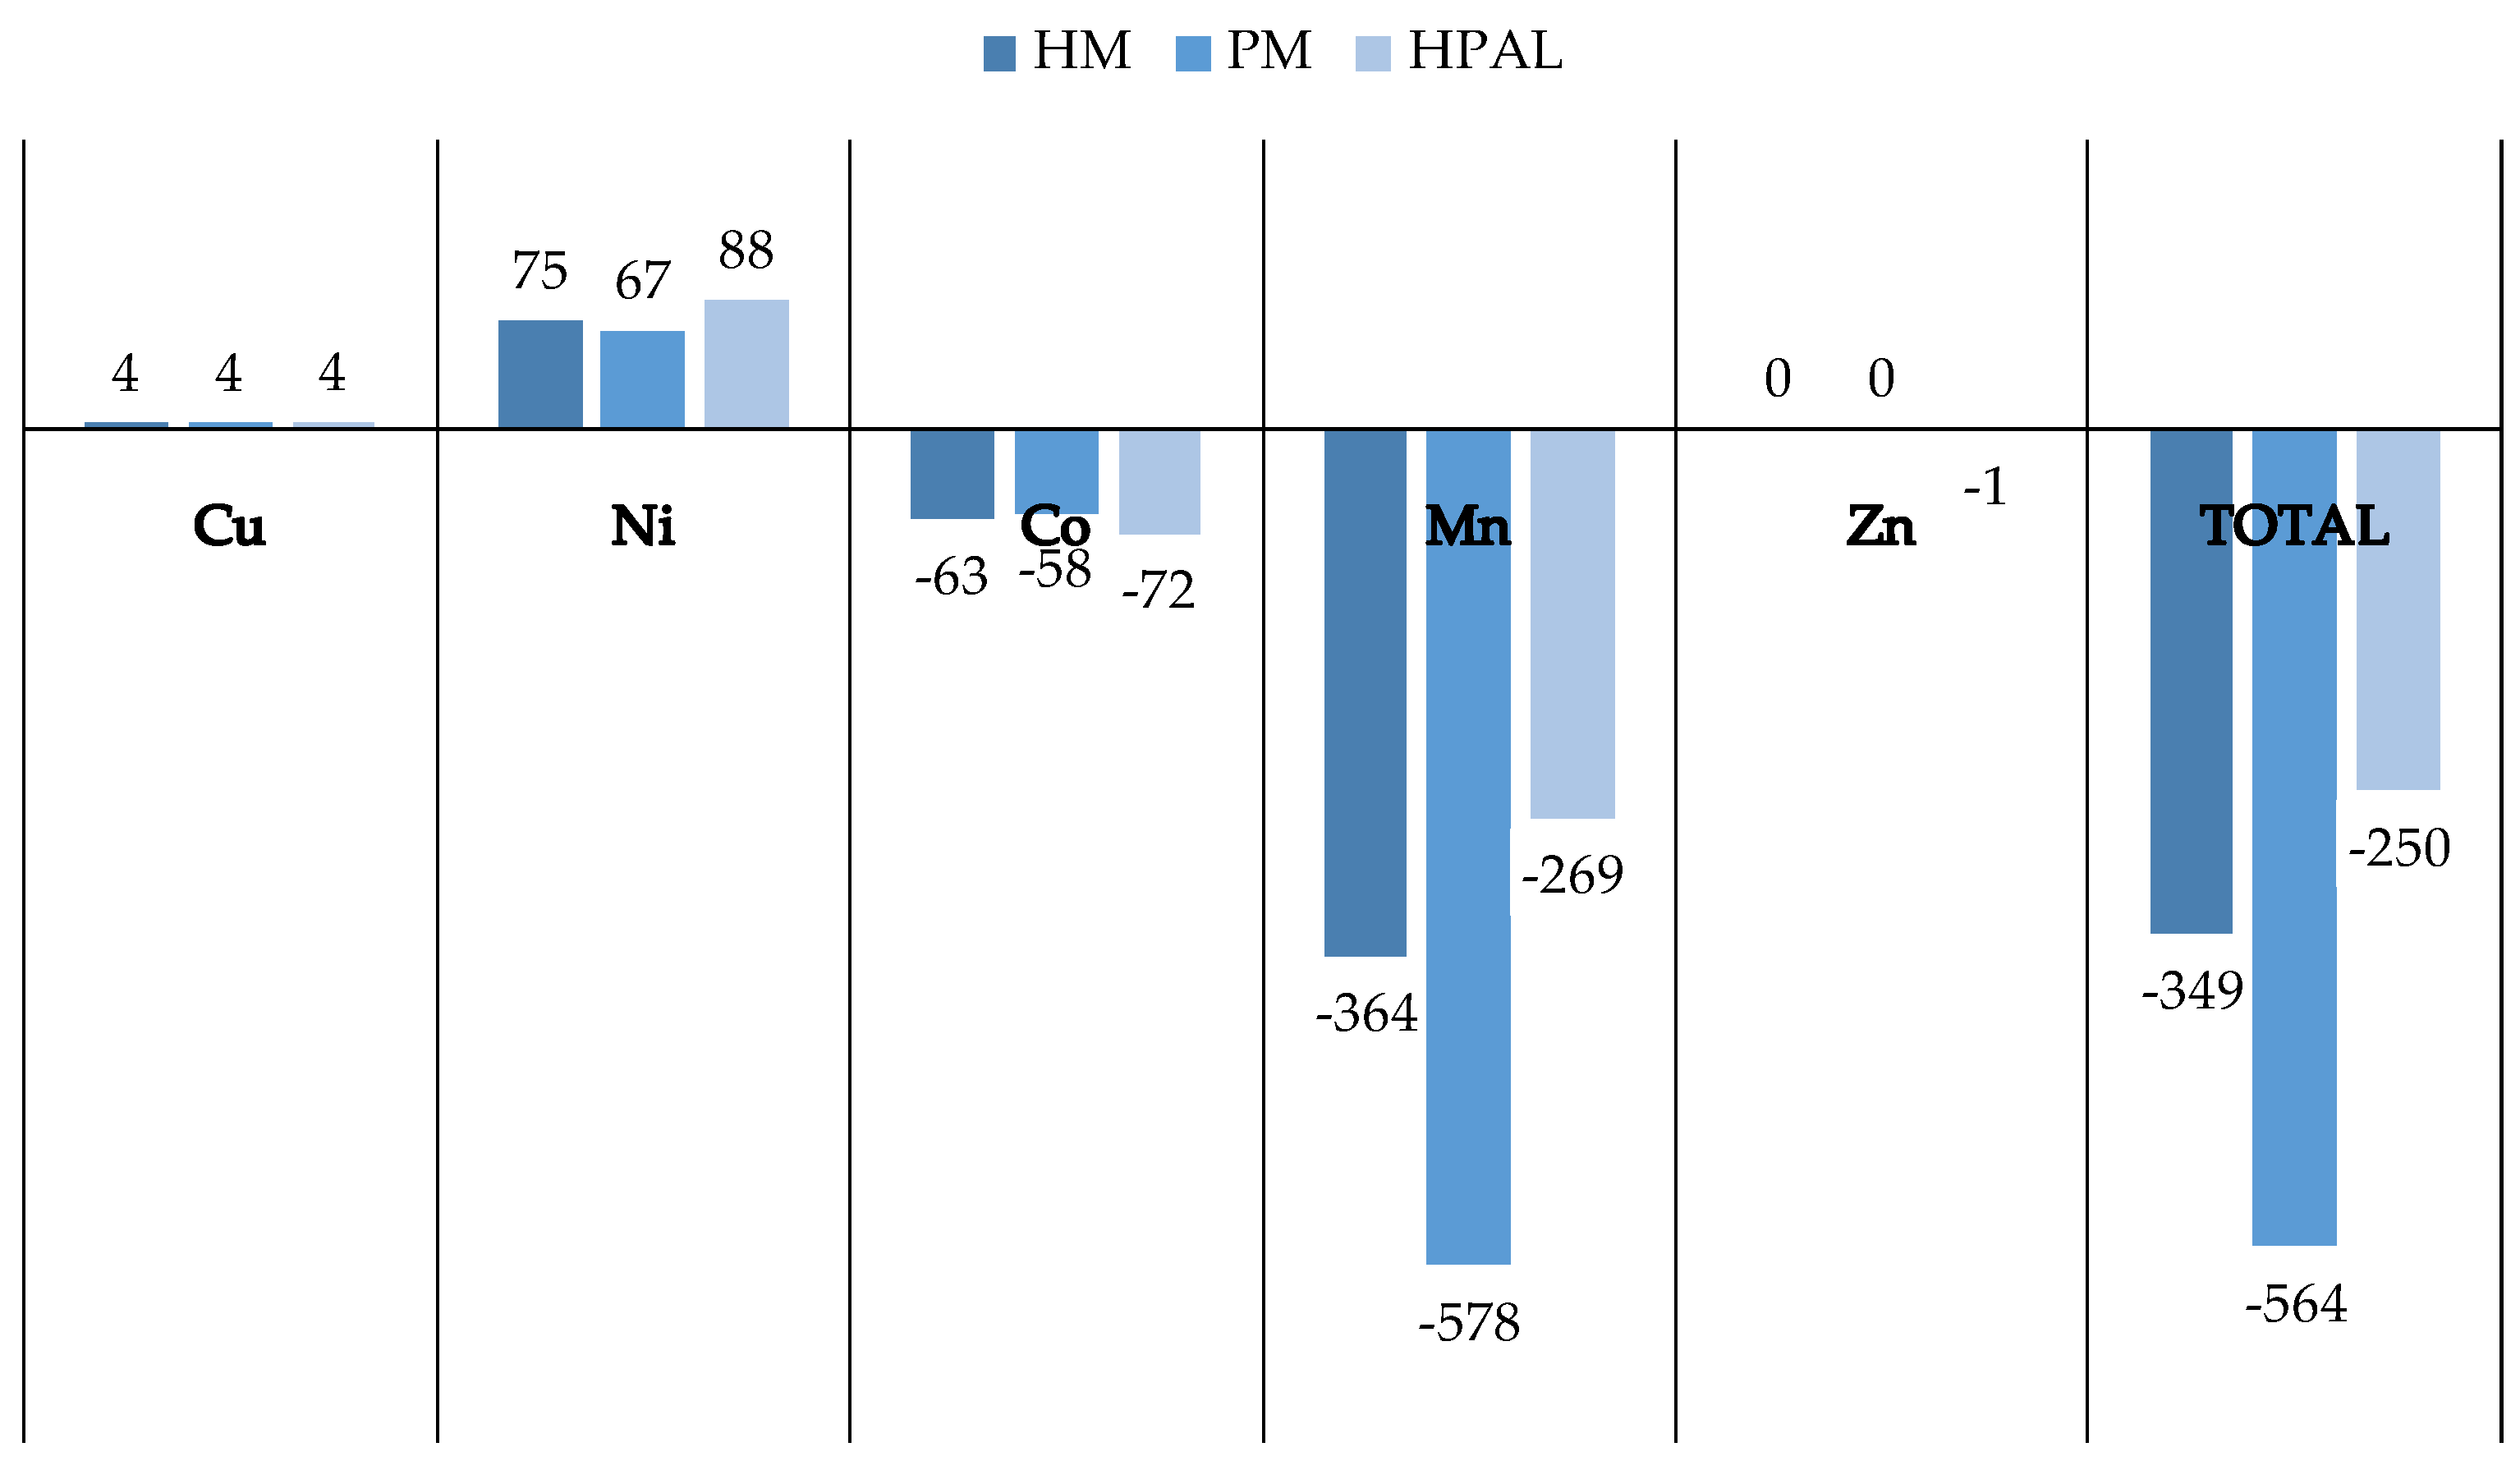
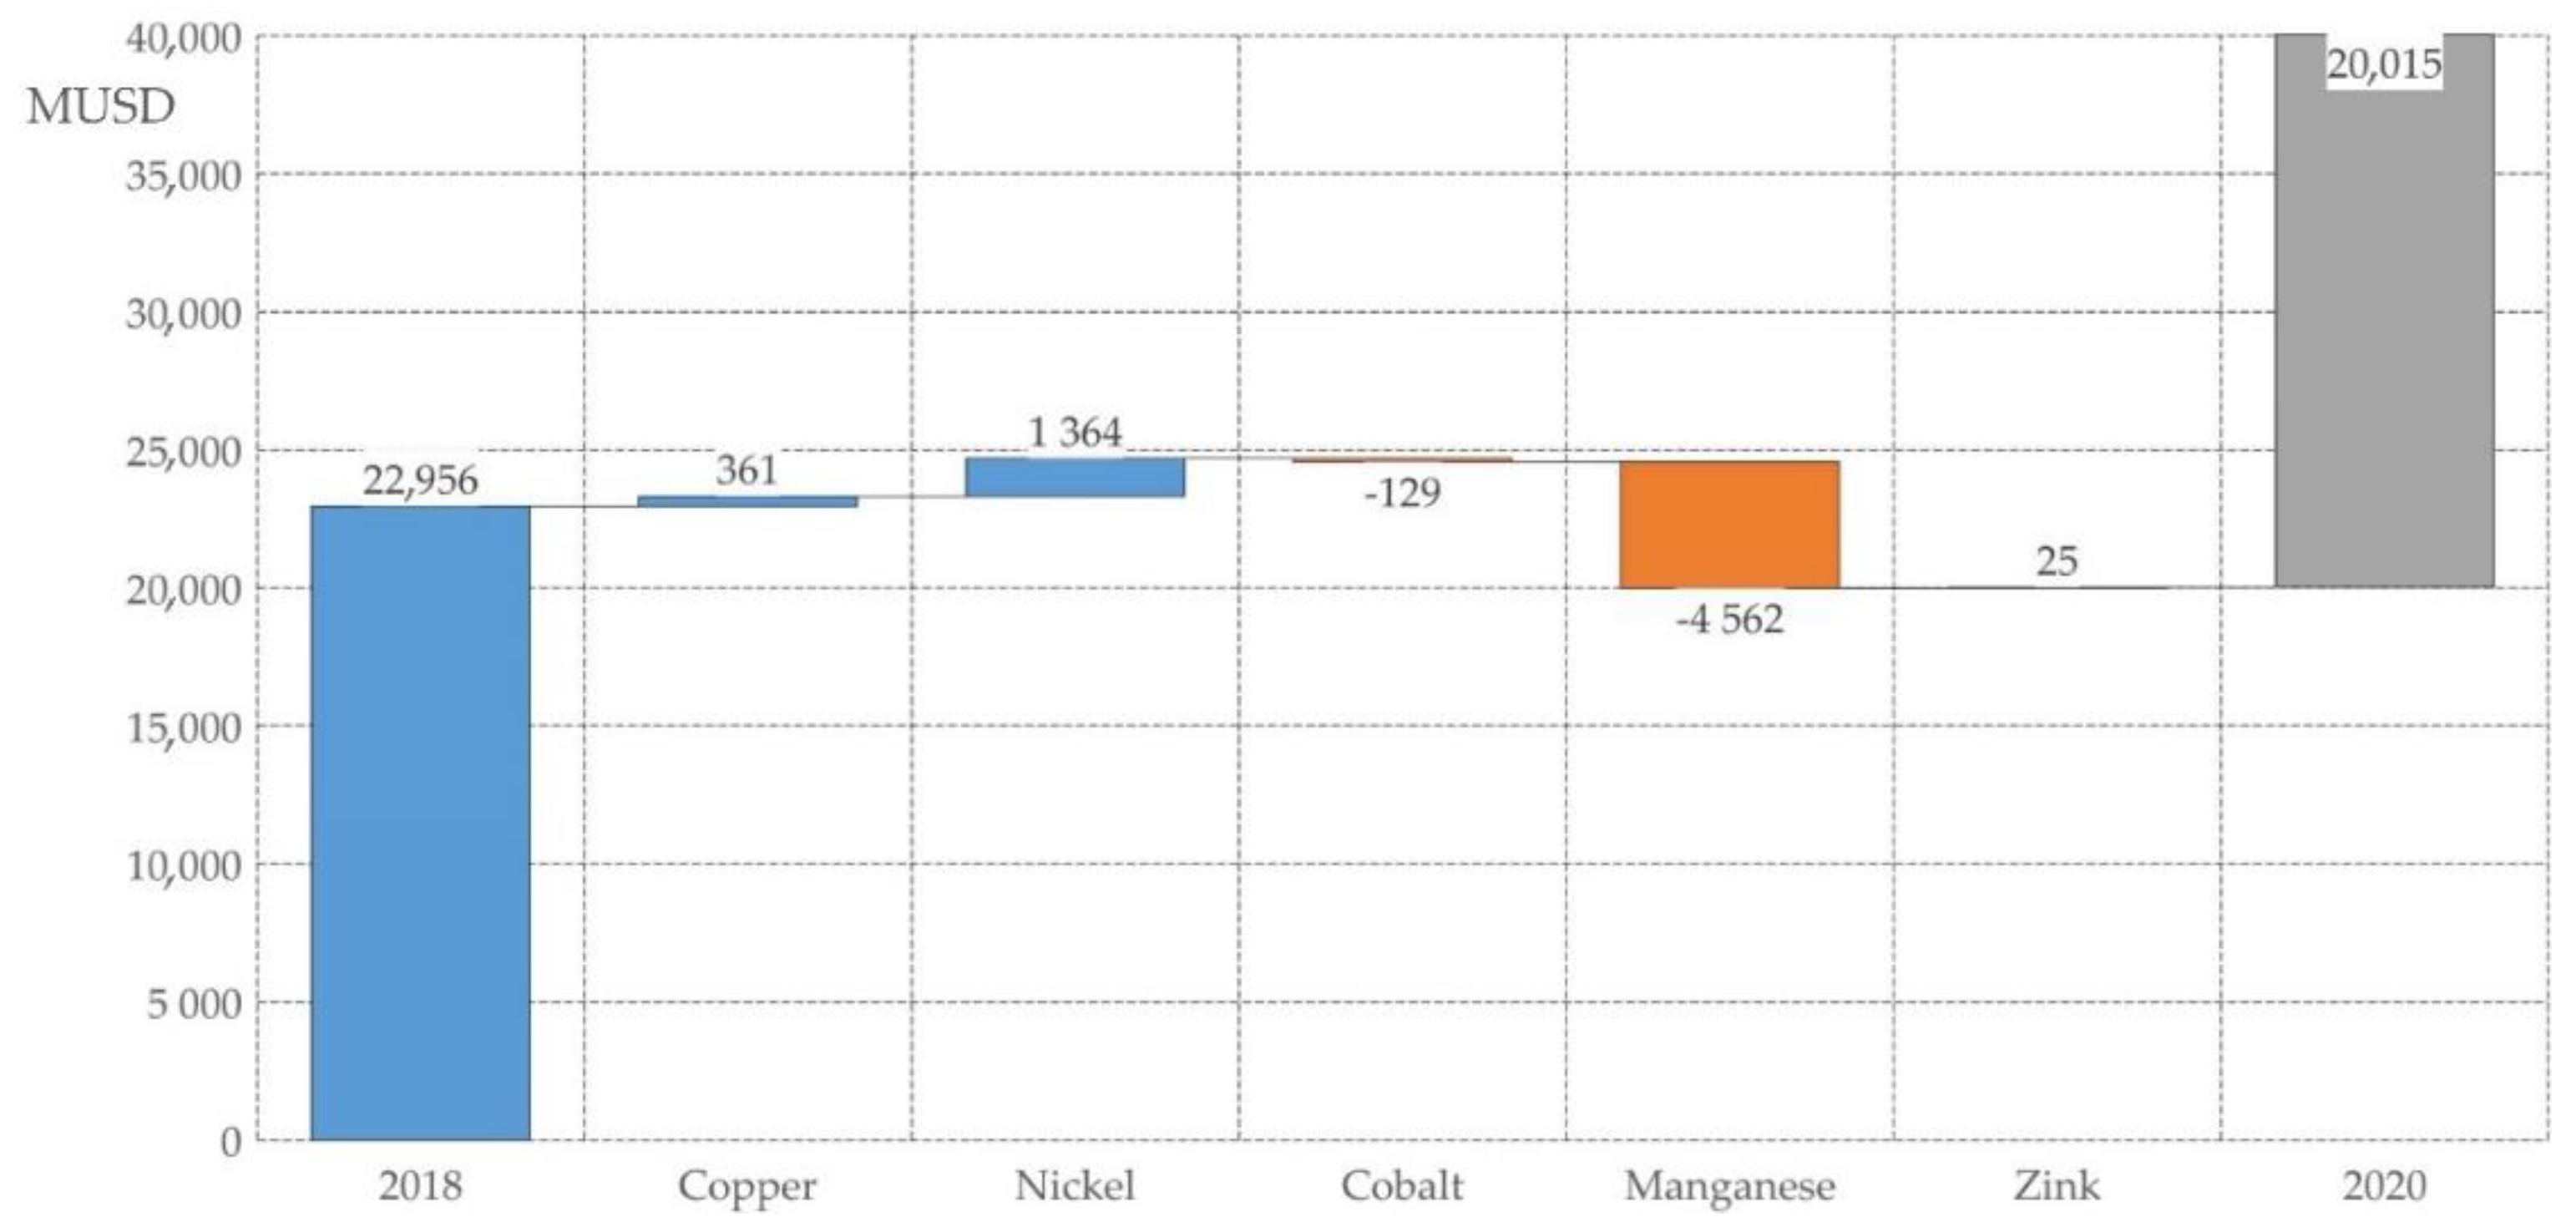
Regarding the economic updates of changes in prices (e.g., Figure 10 and Table 13), the results show that the price changes of two metals (cobalt and manganese) resulted in a decrease in the total value of the project, and the optimization directions where the profitability can be found could possibly be in parameters presented in Table 14 and Table 15. However, the most recent trends from the beginning of the year 2021 (e.g., a sharp increase in cobalt prices and the continuing growth trends of nickel and copper prices) may alter this situation soon.
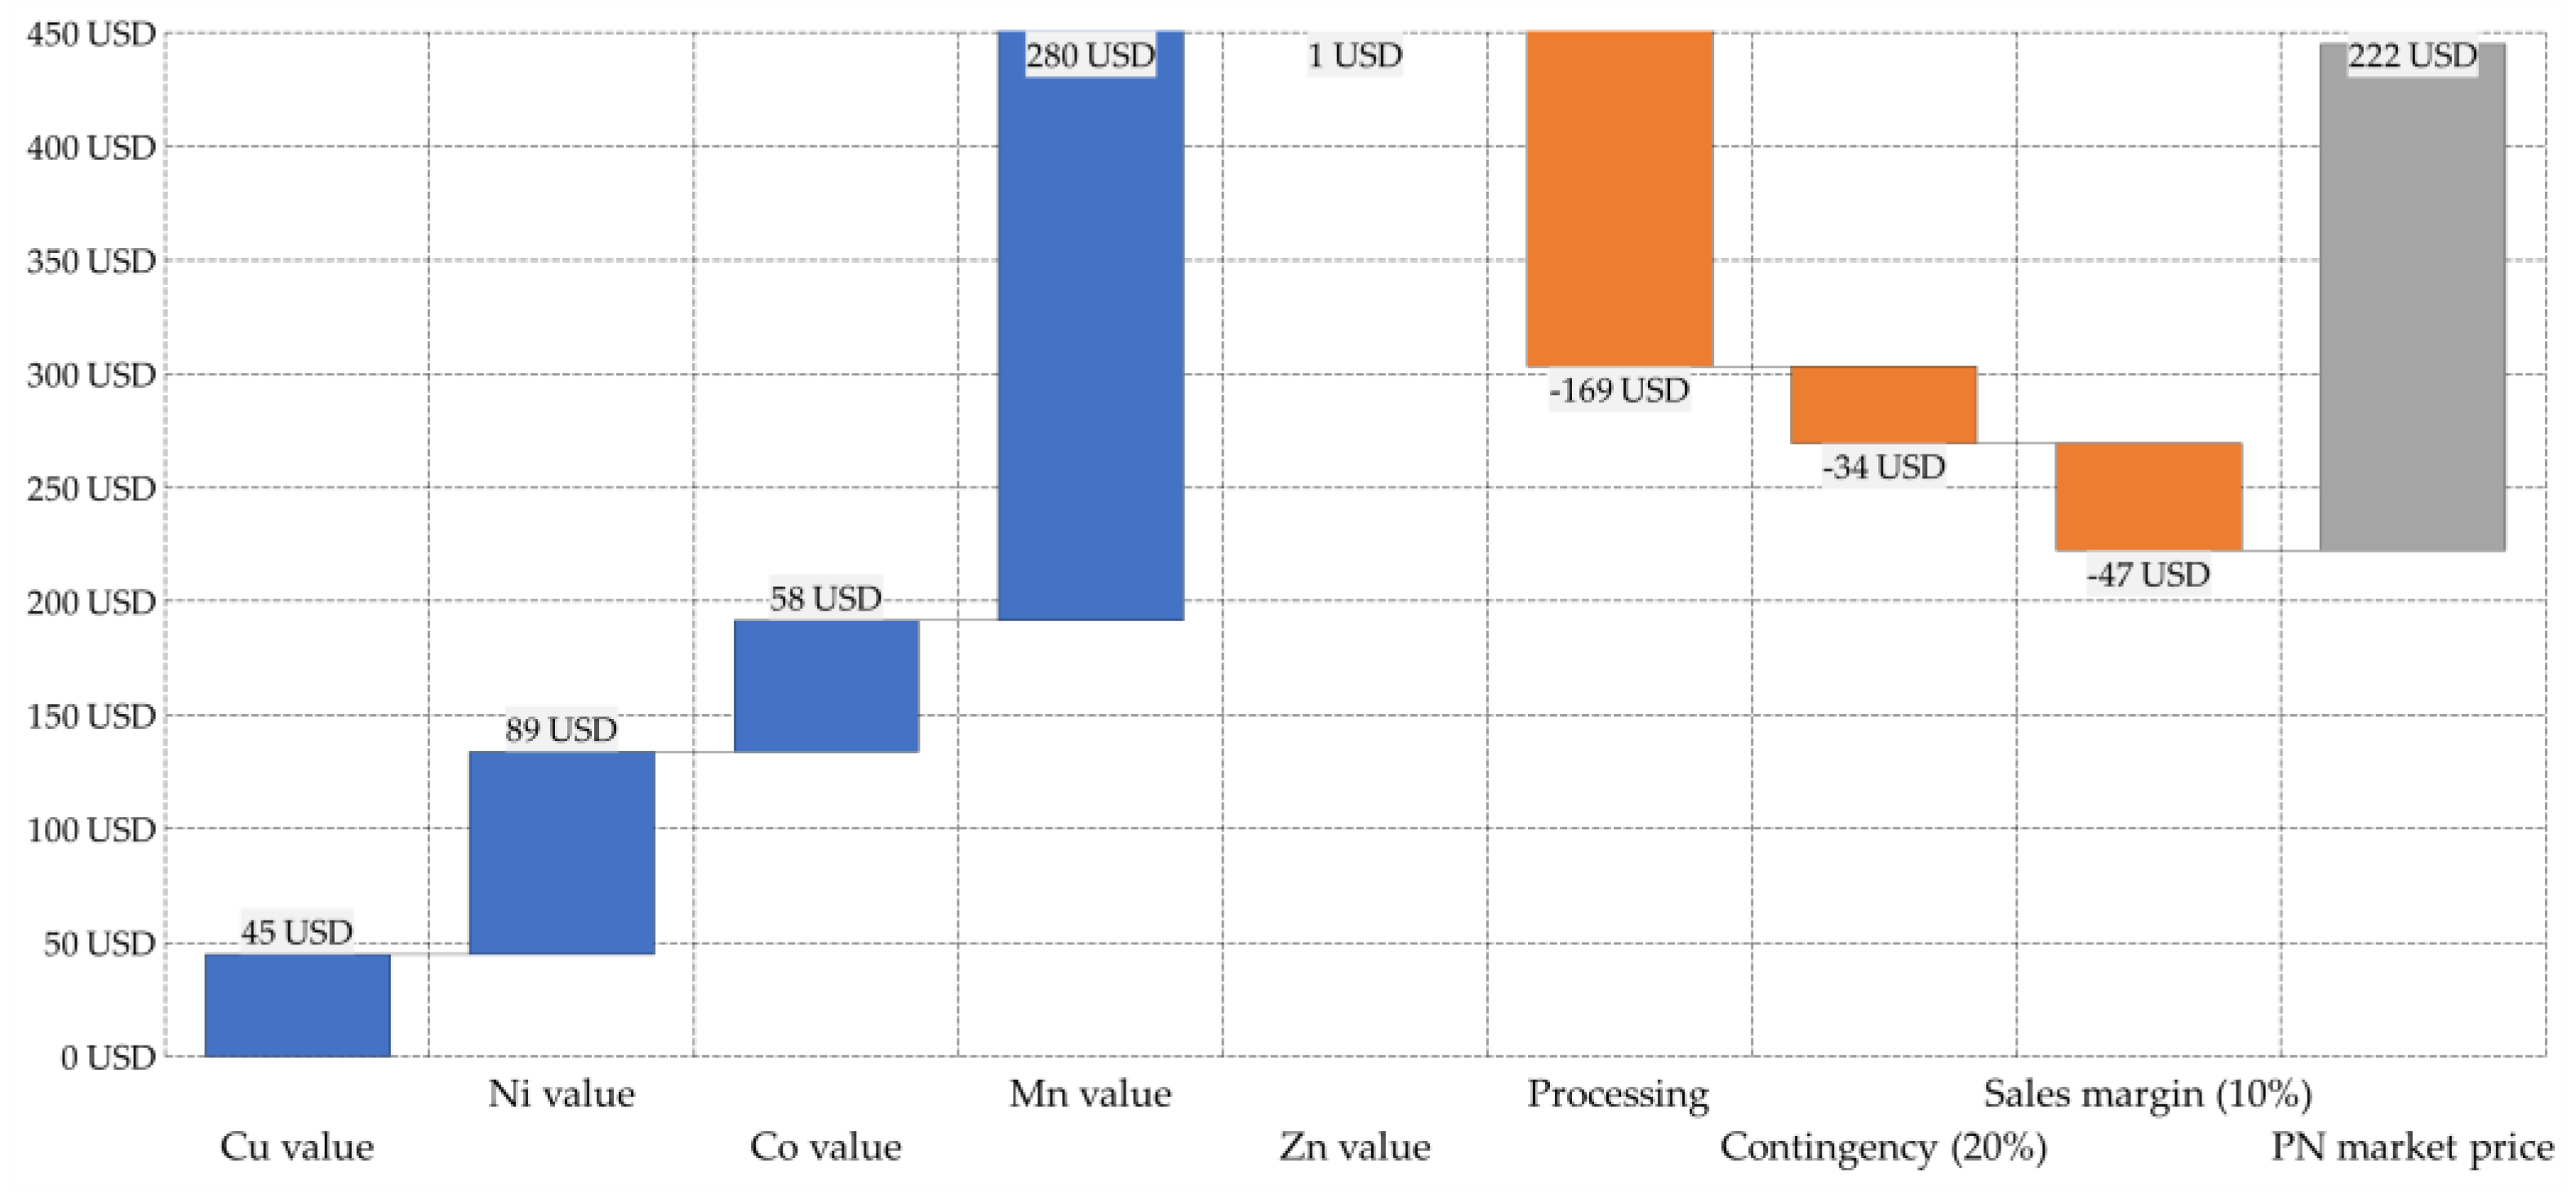
There are likely to be many different approaches in the future if marine minerals are mined, probably with a specialized market of unprocessed stock of marine minerals available for sale. This is why we considered scenario 2, in which the nodules are just sold as unprocessed ore according to the specific needs of buyers, who could take as much mineral as they need for their specific processes. The decisive element in such an approach is the estimation of income, which should be done on the basis of polymetallic nodule price estimation (method and results in Figure 5).
Further development of the economic model will include a detailed analysis and inclusion of environmental costs, with the analysis going in two directions. The first direction is related to the environmental costs associated with operating (mining) in the area under the jurisdiction of the International Seabed Organization. The second direction will comprise the cost analysis related to the waste management from selected metallurgical processes on land. To evaluate the environmental performance of the metallurgical processes, a life cycle analysis (LCA) will be performed with a focus on climate change, resource efficiency, toxicity, and overburden. The costs related to management of solid waste such as dusts, sludge, or slag, and then liquid waste such as effluents and gaseous emissions, will be estimated on the basis of preliminary designs. Moreover, the potential for waste reuse will be analyzed. Some research has already started presenting the results of the use of leach residues from processing polymetallic nodules as effective heavy metal adsorbents [36]. The environmental cost of the mitigation of harmful effects, waste management, and possible reuse of residues of metallurgical processing should be carefully studied for the sake of achieving the principles of sustainable development in the prospective use of marine minerals.

Author Contributions

Conceptualization, T.A., P.B. and M.U.; methodology, P.B. and M.U.; technical assumptions, T.A. and P.B.; software: M.U.; investigation, T.A. and P.B.; writing—original draft preparation, M.U. and P.B.; writing—review and editing, T.A. and P.B.; supervision, T.A. All authors have read and agreed to the published version of the manuscript.

Funding

This research was funded by the Interoceanmetal Joint Organization.

Conflicts of Interest

The authors declare no conflict of interest. The funders had no role in the design of the study; in the collection, analyses, or interpretation of data; in the writing of the manuscript, or in the decision to publish the results.

Abbreviations

CAPEXcapital expenditures
CCZClarion-Clipperton Zone
CRIRSCOCommittee for Mineral Reserves International Reporting Standards
DCFDiscounted Cash Flows
dPPDiscounted Payback Period
EAAEquivalent Annual Annuity
EBITearnings before deducting interest and taxes
EBITDAearnings before interest, taxes, depreciation and amortization
HMhydrometallurgy
HPALhigh pressure acid leaching
IOMInteroceanmetal Joint Organization
IRRInternal Rate of Return
ISA/ISBAInternational Seabed Authority
LTCLegal and Technical Commission (ISA)
MIRRModified Internal Rate of Return
mUSDmillion US Dollars
n.a.not available
NAICSThe North American Industry Classification System
NMnautical mile
NPVNet Present Value
OPEXoperational expenditures
PFSPre-Feasibility Study
PIProfitability Index
PMpyrometallurgy
PNpolymetallic nodule
PRZPreservation Reference Zone
ROCEReturn on Capital Employed
WACCWeighted Average Cost of Capita

References

  1. Abramowski, T. Deep Sea Mining Value Chain: Organization, Technology and Development; Interoceanmetal Joint Organization: Szczecin, Poland, 2016. [Google Scholar]
  2. Hoagland, P. Manganese nodule price trends: Dim prospects for the commercialization of deep seabed mining. Resour. Policy 1993, 19, 287–298. [Google Scholar] [CrossRef]
  3. Volkmann, S.E.; Kuhn, T.; Lehnen, F. A comprehensive approach for a techno-economic assessment of nodule mining in the deep sea. Miner. Econ. 2018, 31, 319–336. [Google Scholar] [CrossRef] [Green Version]
  4. Van Nijen, K.; Van Passel, S.; Squires, D. A stochastic techno-economic assessment of seabed mining of polymetallic nodules in the Clarion Clipperton Fracture Zone. Mar. Policy 2018, 95, 133–141. [Google Scholar] [CrossRef]
  5. Herrouin, G.; Lenoble, J.P.; Charles, C. A manganese nodule industrial venture would be profitable. Summary of a 4 year study in France. In Offshore Technology Conference; OTC 5997; OnePetro: Richardson, TX, USA, 1989; pp. 321–331. [Google Scholar]
  6. Nam, K.-H.; Oh, W.-Y.; Kwon, S.-J. An Economic Feasibility Study of Manganese Nodule in Korea Area: Clarion-Clipperton Fracture Zone. Ocean Polar Res. 2004, 26. [Google Scholar] [CrossRef] [Green Version]
  7. Roth, R.; Kirchain, R.; Peacock, T. Decision Analysis Framework & Review of Cash flow Approach. Materials System Laboratory Massachusetts Institute of Technology. In Proceedings of the International Seabed Authority, Financial Payment System Working Group Meeting 26th Session of the ISA, Kingston, Jamaica, 13–14 February 2020; Available online: https://www.isa.org.jm/sessions/26th-session-2020 (accessed on 7 January 2021).
  8. Report of the Chair on the Outcome of the 3rd Meeting of the Open-Ended Working Group of the Council in Respect of the Development and Negotiation of the Financial Terms of a Contract under Art. 13, Par.1, of Annex III to the UNCLOS, Int. Seabed Authority, ISBA/26/C/8. 2020. Available online: https://www.isa.org.jm/sessions/26th-session-2020 (accessed on 7 January 2021).
  9. Cameron, H.; Georghiou, L.; Perry, J.G.; Wiley, P. The economic feasibility of deep-sea mining. Eng. Costs Prod. Econ. 1981, 5, 279–287. [Google Scholar] [CrossRef]
  10. Johnson, C.J.; Otto, J.M. Manganese nodule project economics. Resour. Policy 1986, 12, 17–28. [Google Scholar] [CrossRef]
  11. Sharma, R. Deep-sea mining: Economic, technical, technological, and environmental considerations for sustainable development. Mar. Technol. Soc. J. 2011, 45, 28–41. [Google Scholar] [CrossRef]
  12. Sparenberg, O. A historical perspective on deep-sea mining for manganese nodules, 1965–2019. Extr. Ind. Soc. 2019, 6, 842–854. [Google Scholar] [CrossRef]
  13. Morgan, C.L.; Odunton, N.; Jones, A.T. Synthesis of environmental impacts of deep seabed mining. Mar. Georesources Geotechnol. 1999, 17, 307–356. [Google Scholar] [CrossRef]
  14. Wedding, L.M.; Reiter, S.M.; Smith, C.R.; Gjerde, K.M.; Kittinger, J.N.; Friedlander, A.M.; Gaines, S.D.; Clark, M.R.; Thurnherr, A.M.; Hardy, S.M.; et al. Managing mining of the deep seabed. Science 2015, 349, 144–145. [Google Scholar] [CrossRef] [Green Version]
  15. Kotlinski, R. Relationships between nodule genesis and topography in the eastern Area of the Clarion-Clipperton region. Establishment of a Geological Model of Polymetallic Nodule Deposits in the Clarion-Clipperton Fracture Zone of the Equatorial North Pacific Ocean. In Proceedings of the International Seabed Authority’s Workshop, Nadi, Fiji, 13–20 May 2003; pp. 203–221. [Google Scholar]
  16. Szamałek, K.; Damrat, M.; Frydel, J.; Kaulbarsz, D.; Kramarska, R.; Relisko-Rybak, J.; Mucha, J.; Wasilewska-Blaszczyk, M. Technical Report on the IOM PN Project in the Pacific Ocean CCZ; IOM Internal Report; Polish Geological Institute—National Research Institute, AGH Krakow University of Science and Technology: Szczecin, Poland, 2016. [Google Scholar]
  17. Lewicka, E.; Szlugaj, J.; Guzik, K.; Kot-Newiadomska, A.; Galos, K. Market Study on Manganese, Nickel, Cobalt, Copper and Zinc—Supply, Demand and Prices Issues; IOM Internal Report; MEERI Institute, Polish Academy of Sciences: Krakow, Poland; Szczecin, Poland, 2018. [Google Scholar]
  18. Baláž, P.; Dreiseitl, I.; Abramowski, T.; Shiryaev, B.; Cabello, M.; Mianowicz, K. Preliminary Economic Assessment Technical Report—IOM Polymetallic Nodules Project in CCZ, Pacific Ocean; IOM Internal Report; IOM: Szczecin, Poland, 2019. [Google Scholar]
  19. Mucha, J.; Wasilewska, M. Estimation of Polymetallic Nodule Resources of the IOM’s Exploration Area and Its Nickel, Manganese and Molybdenum Contents Using a Geostatistical Method for Available Geological Data Processing (in Russian); IOM Internal Report; IOM: Szczecin, Poland, 2007. [Google Scholar]
  20. Shanov, S.; Boikova, A.; Radulov, A. Estimation of the Resources of Polymetallic Nodules of the IOM Exploration Area and Their Content of Copper, Cobalt and Zinc Using a Geostatistical Method for Processing the Geological Data Available in IOM; IOM Internal Report; IOM: Szczecin, Poland, 2007. [Google Scholar]
  21. Mucha, J.; Wasilewska-Błaszczyk, M.; Yubko, V. Estimation of Polymetallic Nodule Resources of and Its Nickel, Manganese Copper and Cobalt Contents Using the Geostatistical Method of Processing Based on the IOM Geological Data; IOM Internal Report; IOM: Szczecin, Poland, 2011. [Google Scholar]
  22. Mucha, J.; Wasilewska-Błaszczyk, M.; Wójtowicz, J. Evaluation of the Resources of Polymetallic Nodules and Contained Metals in the H22 Exploration Block, and in Ore Deposits Distinguished Within the Block; IOM Internal Report; IOM: Szczecin, Poland, 2015. [Google Scholar]
  23. Mucha, J.; Wasilewska-Blaszczyk, M. Estimation of the Resources of Polymetallic Nodules and Contained Metals in Sector B2 and the Exploration Blocks H11+H22, H33 and H44; IOM Internal Report; AGH University of Science and Technology: Krakow, Poland, 2020. [Google Scholar]
  24. Szamałek, K. Validation of the Estimation of Resources of Polymetallic Nodules and Metals Contained in the Nodules in the B2 Sector and Exploration Blocks H11, H22, H33 and H44 with Resource Categorization within the Seabed Exploration Area According to Agreement between IOM and the International Seabed Authority; IOM Internal Report; IOM: Szczecin, Poland, 2020. [Google Scholar]
  25. Dayananda, D.; Irons, R.; Harrison, S.; Herbohn, J.; Rowland, P. Capital Budgeting: Financial Appraisal of Investment Projects; Cambridge University Press: Cambridge, UK, 2002. [Google Scholar]
  26. Recommendations for the Guidance of Contractors on the Content, Format and Structure of Annual Reports, Including: Reporting Standard of the International Seabed Authority for Mineral Exploration Results Assessments, Mineral Resources and Mineral Reserves Int. Seabed Authority. 2015. Available online: https://www.isa.org.jm/document/isba21ltc15 (accessed on 7 January 2021).
  27. Qiu, Z.; Dong, Y.; Ma, W.; Zhang, W.; Yang, K.; Zhao, H. Geochemical characteristics of platinum-group elements in polymetallic nodules from the Northwest Pacific Ocean. Acta Oceanol. Sin. 2020, 39, 34–42. [Google Scholar] [CrossRef]
  28. Koschinsky, A.; Hein, J.R.; Kraemer, D.; Foster, A.L.; Kuhn, T.; Halbach, P. Platinum enrichment and phase associations in marine ferromanganese crusts and nodules based on a multi-method approach. Chem. Geol. 2020, 539. [Google Scholar] [CrossRef]
  29. Kostyuk, A.N.; Elshanskyi, P.V.; Lukinova, T.G.; Lukinov, I.I. Report on Selection of the Configuration and Determination of the Parameters of the Collection unit for the Conditions of the IOM Exploration Area; IOM Internal Report; Design and Engineering Office Novorossiysk: Novorossiysk, Russia, 2013. [Google Scholar]
  30. Abramowski, T.; Stefanova, V.P.; Causse, R.; Romanchuk, A. Technologies for the Processing of Polymetallic Nodules from Clarion Clipperton Zone in the Pacific Ocean. J. Chem. Technol. Metall. 2017, 52, 258–269. [Google Scholar]
  31. Rimesova, R.; Sudolska, M.; Rimes, M.; Vranka, J.; Rimes, T. Preliminary Feasibility Study for the Processing of Polymetallic Nodules; IOM Internal Report; BAT Engineering: Bratislava, Slovakia, 2012. [Google Scholar]
  32. Miyares, R.C. Processing Technology of Polymetallic Nodules, Update of Pre-Feasibility Study; IOM Internal Report; IOM: Szczecin, Poland, 2016. [Google Scholar]
  33. Blackburn, J.; Jankowski, P.; Heymann, E.; Chwastiak, P.; See, A.; Munro, P.; Lipton, I. Offshore Production System Definition and Cost Study; SRK Consulting for Nautilus Minerals; Nautilus Minerals: Toronto, ON, Canada, 2010. [Google Scholar]
  34. The London Metal Exchange. Available online: https://www.lme.com/ (accessed on 1 December 2020).
  35. Fastmarkets, M.B. Available online: https://www.metalbulletin.com/ (accessed on 1 December 2020).
  36. Vu, N.H.; Kristianová, E.; Dvořák, P.; Abramowski, T.; Dreiseitl, I.; Adrysheva, A. Modified Leach Residues from Processing Deep-Sea Nodules as Effective Heavy Metals Adsorbents. Metals 2019, 9, 472. [Google Scholar] [CrossRef] [Green Version]
Figure 1. The structure of the deep-sea mining project economic assessment.
Minerals 11 00311 g001
Figure 2. The study area location—Clarion–Clipperton Zone (CCZ) and the contractors’ exploration areas. The IOM’s exploration area is inside the red box.
Minerals 11 00311 g002
Figure 3. Polymetallic nodule sample collected during exploration, source: IOM, photo taken by T. Abramowski.
Minerals 11 00311 g003
Figure 4. Exploration and exploitable blocks included in the IOM resource estimation (b), related to the International Seabed Authority exploration areas for polymetallic nodules (a) (source: www.isa.org.jm; accessed on 7 January 2021).
Minerals 11 00311 g004
Figure 5. Estimation of the market unit price of PN (USD/ton) based on HPAL technology (revenue and processing costs).
Minerals 11 00311 g005
Figure 6. The results of the economic analysis (accumulated cash flow) of scenario 1—HM, FCFF—free cash flow for the firm, dFCFF—discounted FCFF (QVISTORP growth, QVISTORP calculation).
Minerals 11 00311 g006
Figure 7. The results of the economic analysis (accumulated cash flow) of scenario 1—PM, FCFF—free cash flow for the firm, dFCFF—discounted FCFF (QVISTORP growth, QVISTORP calculation).
Minerals 11 00311 g007
Figure 8. The results of the economic analysis (accumulated cash flow) of scenario 1—HPAL, FCFF—free cash flow for the firm, dFCFF—discounted FCFF (QVISTORP growth, QVISTORP calculation).
Minerals 11 00311 g008
Figure 9. The results of the economic analysis of scenario 2, FCFF—free cash flow for the firm, dFCFF—discounted FCFF.
Minerals 11 00311 g009
Figure 10. Change in annual revenue from the sale of metals in 11/2020 vs. 01/2019 in MUSD.
Minerals 11 00311 g010
Figure 11. Aggregated revenue change based on HPAL technology (MUSD).
Minerals 11 00311 g011
Figure 12. Comparison of the profitability of alternative investment options in 2019 and 2020.
Minerals 11 00311 g012
Table 1. Mineral resource estimate of wet polymetallic nodules in the B1 and B2 sectors of the IOM exploration area. Cutoff 10 kg/m2 of wet nodules—without volcanoes, seabed areas free of nodules, and areas sloped over 7, as per Mucha et al. [23], Szamałek [24].
Mineral Resource ClassificationMean Abundance (kg/m2)Mn (%)Ni (%)Cu (%)Co (%)Zn (%)REE (ppm)Wet Resources (Mt)
Measured (H22_NE block)14.6029.191.311.250.180.1571312.2
Measured Total12.2
Indicated (H11 + H22 blocks)12.4031.371.301.290.160.16-77.0
Indicated Total77.0
Inferred (B1 sector)13.4027.801.200.900.20--62.6
Inferred (H33 block)12.0032.351.411.200.180.15-21.8
Inferred (H44 block)11.5030.711.321.190.190.14-13.6
Inferred (B2 sector other)11.5930.901.321.210.180.15-85.3
Inferred Total183.3
Grand Total272.5
Note: Sector B2 includes exploration blocks H11, H22, H33, and H44 and exploitable block H22_NE.
Table 2. Technical characteristics of one collecting module.
Performance, theoretical (t/h)265.4
Working depth (m)5000
Width of the harvesting strip, one collector (m)7.5
Total width of strip harvested (m)180–200
Working layer depth (m)0.1–0.15
Average collector module speed (m/s)1.0
Size of collected nodules (mm)20–150
Sediment content in extracted material (%)10
Max. steep gradient of slopes (degree)7
Table 4. Capital expenditures for the two extraction scales of raw ore.
Mining capacity (Mt)1.54.5
Mining system (MUSD)128.5248.4
Mining vessel (MUSD)269.0520.0
System commissioning (MUSD)30.030.0
Contingency (20%) (MUSD)85.5159.7
Total Capital Cost (MUSD)513.0958.2
Table 5. Annual operating expenditures for the two extraction scales of raw ore.
Mining capacity (Mt)1.54.5
Exploitation costs (MUSD)36.670.8
Transport (MUSD)38.173.7
Environment costs (MUSD)15.830.6
Other costs (MUSD)15.830.6
Total Extraction Cost (MUSD)106.4205.7
Unit cost (USD/ton)7146
Table 6. Summary of the main items of capital expenditures for three technologies (HM—hydrometallurgy, PM—pyro-hydrometallurgy, HPAL—hydrometallurgy by pressure acid leaching).
HMPMHPAL
Equipment (MUSD)425.11353.0445.1
Production flow pipeline (MUSD)94.237.098.7
Instrumentation (MUSD)36.113.537.8
Power supply (MUSD)55.221.655.6
Civil, Structure, Architecture (MUSD)174.4184.6216.9
Customs Charges and Duties (MUSD)60.6135.164.4
Expenditures Constructor (MUSD)42.387.245.9
Total Indirect Cost (MUSD)403.21020.1349.2
Contingency (20%) (MUSD)258.3475.4262.7
Total Capital Cost (MUSD)1549.43327.51576.3
Table 7. Processing variable operating costs estimate for three technologies (HM—hydrometallurgy, PM—pyro-hydrometallurgy, HPAL—hydrometallurgy by pressure acid leaching).
HMPMHPAL
Total material costs (without PN) (MUSD)747.5583.3336.4
Total Energy Cost (MUSD)123.3748.63.6
Maintenance Costs (3.5% Direct CAPEX) (MUSD)31.164.133.7
Labour (MUSD)77.177.177.1
Over Head (MUSD)24.935.716.3
Other operating expense (MUSD)45.862.140.4
Total Production Cost (MUSD)1049.71570.9507.5
Table 8. Annual production of metals in products processed (metric tons), np—not produced in the technology
HMPMHPAL
CuCu concentrate30,65628,54229,106
NiNi and Co Concentrate34,02428,51734,876
CoNi and Co Concentrate445038744770
MnHydrated manganese dioxide860,430np585,130
Silicomanganesenp561,522np
ZnZinc sulphatenpnp9667
Table 9. Main economic assumptions made for the considered scenarios.
Period of resource extraction20 years
Construction time3 years
Ramp-up5 years
Extraction cost per unitUSD 46/ton (scenario 1); USD 71/t (scenario 2)
Metal processing unit costdepends on technology
Estimated PN priceUSD 222/t (see Figure 4)
Royalty feeAd valorem system (2–4%)
Capital structure50% debt
WACC (real)20.74% (scenario 1); 20.5% (scenario 2)
Up-time (mining availability)290 days/year
Up-time (processing availability)330 days/year (scenario 1)
Port of unloadingMoa (Cuba)
Roundtrip distance6772 NM
Single roundtrip duration33.7 days
Sales volume100% of mined raw ore (scenario 2)
Expenditure contingency20%
Table 10. Economic indicators and variables for the project, scenario 1.
Economic Indicators and Variables for the HM Technology
NPV (net present value)MUSD −1227.7
ROCE (average yearly return on capital employed)−1.86%
EBITDA (average yearly EBITDA)MUSD 53.8
Total EBITDAMUSD 1344.3
EBIT (average yearly EBIT)MUSD −46.5
Total EBITMUSD −1163.6
EAA (equivalent annual annuity)MUSD −256.9
PI (profitability index)0.14
IRR (internal rate of return)−4.36%
MIRR (modified internal rate of return)2.72%
dPP (discounted payback period)not applicable
Total ExpendituresMUSD 2507.6
Variable NameUnitAverageMedian
Polymetallic nodule amount (processing)Mt2.8503.000
Polymetallic nodule amount (mining)Mt4.2754.500
Operating expenditures (processing)USD/t349.9349.9
Operating expenditures (mining)USD/t46.046.0
Manganese priceUSD/t27502750
Nickel priceUSD/t10,79510,795
Cobalt priceUSD/t54,75054,750
Copper priceUSD/t61956195
Economic Indicators and Variables for the PM Technology
NPV (net present value)MUSD −2361.5
ROCE (average yearly return on capital employed)−4.28%
EBITDA (average yearly EBITDA)MUSD −12.0
Total EBITDAMUSD −301.8
EBIT (average yearly EBIT)MUSD −183.5
Total EBITMUSD −4587.7
EAA (equivalent annual annuity)MUSD −488.7
PI (profitability index)0.04
IRR (internal rate of return)not applicable
MIRR (modified internal rate of return)not applicable
dPP (discounted payback period)not applicable
Total ExpendituresMUSD 4285.7
Variable nameUnitAverageMedian
Polymetallic nodule amount (mining)Mt2.8503.000
Polymetallic nodule amount (processing)Mt4.2754.500
Operating expenditures (processing)USD/t523.6523.6
Operating expenditures (mining)USD/t46.046.0
Manganese priceUSD/t27502750
Nickel priceUSD/t10,79510,795
Cobalt priceUSD/t54,75054,750
Copper priceUSD/t61956195
Economic Indicators and Variables for the HPAL Technology
NPV (net present value)MUSD −540.7
ROCE (average yearly return on capital employed)10.1%
EBITDA (average yearly EBITDA)MUSD 357.96
Total EBITDAMUSD 8948.92
EBIT (average yearly EBIT)MUSD 256.57
Total EBITMUSD 6414.32
EAA (equivalent annual annuity)MUSD −111.91
PI (profitability index)0.63
IRR (internal rate of return)13.49%
MIRR (modified internal rate of return)9.58%
dPP (discounted payback period)not applicable
Total ExpendituresMUSD 2534.5
Variable NameUnitAverageMedian
Polymetallic nodule amount (processing)Mt2.8503.000
Polymetallic nodule amount (mining)Mt4.2754.500
Operating expenditures (processing)USD/t169.2169.2
Operating expenditures (mining)USD/t46.046.0
Manganese priceUSD/t27502750
Nickel priceUSD/t10,79510,795
Cobalt priceUSD/t54,75054,750
Copper priceUSD/t61956195
Table 11. Economic indicators and variables, scenario 2.
NPV (net present value)MUSD17.9
ROCE (average yearly return on capital employed)15.45%
EBITDA (average yearly EBITDA)MUSD 149.4
Total EBITDAMUSD 3735.1
EBIT (average yearly EBIT)MUSD 130.1
Total EBITMUSD 3252.0
EAA (equivalent annual annuity)MUSD 3.7
PI (profitability index)1.06
IRR (internal rate of return)23.19%
MIRR (modified internal rate of return)12.26%
dPP (discounted payback period)17.26 years
Total ExpendituresMUSD 513.0
Variable NameUnitAverageMedian
PN amount (mining)Mt1.4251.500
Operating expenditures (mining)USD/t7171
Polymetallic nodule priceUSD/t222222
Table 12. Metal prices in the last two years (sources: London Metal Exchange LME [34], Metal Bulletin [35]).
01/10/201912/11/201905/05/202005/19/202008/12/202011/13/2020
CuUSD/t619560555058525063796926
NiUSD/t10,79513,07011,87511,95014,16715,815
CoUSD/t54,75034,50029,50029,50033,07032,460
MnUSD/t275027501630164015401670
ZnUSD/t2684n.a.1882199723772612
Table 13. Comparison of alternative project implementation scenarios.
Mining Output (wet PN MT)Processing Input (dry PN MT)Total CAPEX (MUSD)NPV (MUSD)
WACC 20.5%
IRR
(%)
01/201911/2020Change01/201911/2020Change
Scenario 1—HM4.53.02507.6−1227.7−1664.4−436.7−4.36n.a.n.a.
Scenario 1—PM4.53.04285.7−2361.5−3189.3−827.8n.a.n.a.n.a.
Scenario 1—HPAL4.53.02534.5−540.7−792.6−259.113.499.13−4.36
Scenario 21.5-513.017.9−126.9−109.023.9913.36−10.6
Table 14. Scenario of simultaneous change of key variables (HPAL technology).
BaseRequired Change
(NPV= MUSD 140, IRR = 24.6%)
Target Value
%Value
CAPEXMUSD 2534−20%MUSD −507MUSD 2027
OPEX MiningUSD 46.0/t−20%USD −7.05/tUSD 28.21/t
OPEX ProcessingUSD 169.0/t−20%USD −33.8/tUSD 135/t
Nickel PriceUSD 15,815/t+20%USD +3163/tUSD 18,978/t
Manganese PriceUSD 1670/t+20%USD +334/tUSD 2004/t
Cobalt PriceUSD 32,460/t+20%USD +6492/tUSD 38,952/t
Copper PriceUSD 6926/t+20%USD +1385/tUSD 8311/t
Table 15. Scenario of simultaneous change of key variables (scenario 2).
BaseRequired Change
(NPV = MUSD 90, IRR = 29.0%)
Target Value
%Value
CAPEXMUSD 513−10%MUSD −51.3MUSD 461.7
OPEX MiningUSD 71/t−10%USD −7.1/tUSD 63.9/t
PN PriceUSD 153/t+10%USD +15.3/tUSD 168.3/t
Publisher’s Note: MDPI stays neutral with regard to jurisdictional claims in published maps and institutional affiliations.

