Article

Li and Ca Enrichment in the Bristol Dry Lake Brine Compared to Brines from Cadiz and Danby Dry Lakes, Barstow-Bristol Trough, California, USA

1
U.S. Geological Survey, 2730 N. Deer Run Rd., Carson City, NV 89701, USA
2
U.S. Geological Survey, MS-176, University of Nevada-Reno, Reno, NV 89557, USA
3
U.S. Geological Survey, MS-935, Denver Federal Center, Denver, CO 80225, USA
4
Consulting Geologist, 3983 S. McCarran Blvd Suite 151, Reno, NV 89502, USA
5
Consulting Geologist, 891 Ridge Vista Road, Gerton, NC 29735, USA
*
Author to whom correspondence should be addressed.
Minerals 2020, 10(3), 284; https://doi.org/10.3390/min10030284
Submission received: 26 December 2019 / Revised: 12 March 2020 / Accepted: 18 March 2020 / Published: 21 March 2020
(This article belongs to the Special Issue Evolution of Li-rich Brines)

Abstract

:
Relatively few discharging playas in western United States extensional basins have high concentrations of lithium (Li) and calcium (Ca) in the basin-center brines. However, the source of both these ions is not well understood, and it is not clear why basins in close proximity within the same extensional trough have notably different concentrations of Li and Ca. In the Barstow-Bristol Trough, California, USA, three playas in separate topographically closed basins vary in Li and Ca concentrations from northwest to southeast: 71–110 mg/L Li and 17–65 g/L Ca at Bristol Dry Lake, 20–80 mg/L Li and 7.5–40 g/L Ca at Cadiz Dry Lake, and <5 mg/L Li and <0.5 g/L Ca at Danby Dry Lake. Using new and historic data from recently drilled wells (2017–2018), it has been determined that there is minimal variation of temperature, Li, and major ion concentrations with depth (down to 500 m), suggesting that the brines are well mixed and likely to circulate slowly due to density driven flow. Although it has been postulated that geothermal fluids supply the Li and Ca to Bristol and Cadiz closed basins, there is little to no surface evidence for geothermal fluids, except for a young (80,000-year-old) volcanic crater in Bristol Dry Lake. However, major-ion chemistry of fluid inclusions in bedded halite deposits show no change in brine chemistry over the last 3 million years in Bristol Dry Lake indicating that the source of lithium is not related to these recent basaltic eruptions. Mg–Li geothermometry of basin-center brines indicates that Bristol and Cadiz brines have possibly been heated to near 160 °C at some time and Danby brine water has been heated to less than 100 °C, although Cadiz and Danby lakes have no known surface geothermal features. The difference in Li concentrations between the different basins is likely caused by variable sources of both ions and the hydrology of the playas, including differences in how open or closed the basins are, recharge rates, evaporative concentration, permeability of basin-center sediments, and the possible amount of geothermal heating. The differences in Ca concentrations are more difficult to determine. However, historic groundwater data in the basins indicate that less saline groundwater on the north side of the basins has molar Ca:HCO3 and Ca:SO4 ratios greater than one, which indicates a non-saline groundwater source for at least some of the Ca. The similar Li and Ca concentrations in Bristol and Cadiz lakes may be because they are separated only by a low topographic divide and may have been connected at times in the past three million years. All three basins are at least Miocene in age, as all three basins have been interpreted to contain Bouse Formation sediments at various depths or in outcrop. The age of the basins indicates that there is ample time for concentration of Li and Ca in the basins even at low evaporation rates or low geothermal inputs. The source of Li for brines in Bristol and Cadiz basins is postulated to be from ancient geothermal fluids that no longer exist in the basin. The source of Li to the sediment may be either geothermal fluids or dissolution and concentration of Li from tephra layers and detrital micas or clays that are present in the sediments, or a combination of both. The source of Ca must at least partially come from groundwater in the alluvial fans, as some wells have Ca:HCO3 ratios that are greater than one. The source of Ca could be from the dissolution of Ca-bearing igneous rocks in the surrounding catchments with limited HCO3 contribution, or dilute geothermal water migrating up through faults in the basin margin. The relatively low concentration of Li and Ca in Danby playa is likely caused by a lack of sources in the basin and because the basin was (or is) partially hydrologically open to the south, reducing the effectiveness of evaporative concentration of solutes. Bristol Dry Lake is likely the only hydrologically closed basin of the three because although Cadiz has a similar brine chemistry and salinity, there is almost no halite deposition in the basin. It is only Bristol Dry Lake that contains 40% halite in its basin center.

1. Introduction

The use of brines for lithium resources has increased more than five-fold since the 1970s [1] because extracting lithium from brines is more cost effective than obtaining lithium from pegmatites and clays. The increasing use of lithium in batteries is driving brine exploration. In the United States, the search for lithium resources in western US desert basin brines began in the 1960s and culminated in the assessment of lithium in many playa brines in California and southern Nevada [2,3]. Three of the basins studied were Bristol Dry Lake (“Dry lake” is a term historically used in California for playas. See [4] for more information on playa nomenclature. The term playa will be used in this paper, except when referring to Bristol, Cadiz and Danby Dry Lakes.), Cadiz Dry Lake and Danby Dry Lake (Figure 1 and Figure 2) that are located from northwest to southeast within the Barstow-Bristol Trough; [4,5]. Previous work in these basins showed that the lithium concentration of the dry lakes ranged from 71 to 87 mg/L in Bristol Dry Lake (BDL), 20 to 80 mg/L in Cadiz Dry Lake (CDL), and <1 mg/L in Danby Dry Lake (DDL) [6,7,8]. This range in lithium concentrations indicates a different source at DDL from CDL and BDL, and a potential gradient of lithium concentrations from low at DDL, intermediate at CDL, and high at BDL. Additionally, the Na–Ca–Cl brine composition at BDL and CDL is different from the Na–Cl brine in DDL and the Na–Ca–Cl brine in BDL and CDL is somewhat unusual [9].
All three dry lakes have been mined since the early 1900s for different evaporite minerals: halite at BDL and CDL, and halite and gypsum at DDL. BDL and CDL currently have extraction operations for CaCl2, which is used as an additive to oil well completion fluids and drilling muds, highway maintenance and de-icing, as a desiccant, and for other manufacturing processes [11]. Brines from the shallow subsurface are pumped to the surface and evaporated in long ditches, where halite is precipitated to remove sodium. The subsurface brines have very little measurable carbonate alkalinity (HCO3/CO3) or sulfate (SO4) and relatively low concentrations of magnesium (Mg) and potassium (K) (data in [12,13]).
There are many different sources of Li and Ca to playa brines. For Li sources, sources of Li include dissolution of lithium-rich rocks, loess, or volcanic ash (tephra), long groundwater flow paths, recycled lithium in the playa, and geothermal fluids [1], although most highly concentrated lithium brines are thought to have originated from geothermal fluids [14,15,16,17]. Calcium is abundant in the Earth’s crust and may be sourced from many different rock types including dissolution of carbonates and feldspars in siliciclastic rocks, or dissolution of carbonate inclusions in highly metamorphosed rocks [18]. However, there are few sources of Ca-rich solutions to playas that do not also contain HCO3. Abundant HCO3 in solution would limit the amount of Ca left in solution after carbonate precipitation (HCO3 would remove Ca from solution due to calcite precipitation [9]). Hardie [19] suggested that the Ca at Bristol and Cadiz came from geothermal solutions in a process similar to the Na–Ca–Cl brines in geothermal fluids occurring at depth in the Salton Sea geothermal field. However, although Na–Ca–Cl brines are not common, they do form in relatively diverse environments, including Antarctic saline lakes [20], Canadian and Fennoscandian shield aquifers [21], and mid-ocean ridges [22]. Many of the continental-sourced brines have limited or no geothermal source for calcium and have been explained by water–rock interaction and cation exchange [20,21], or secular variation in the composition of ocean water [22]. In the Barstow-Bristol Trough, there is little evidence of long-term geothermal sources for Ca (or Li) ions, over the millions of years the basins have existed. However, two basalt extrusions, one at Lava Hills northwest of BDL and one south of Lead Mountain (Figure 1), may provide sources of heating approximately 3 million years ago. There is also a ~79,000-year-old cinder cone, Amboy Crater in the BDL basin [23]. No geothermal or relatively recent (last 1–2 million years) of basalt have been found in CDL or DDL, but tertiary volcanic rocks crop out in the northern parts of the Cadiz basin and to the east of DDL (Figure 2A).
There has been renewed interest in the lithium resources of the BDL and CDL basins and knowledge of the source and hydrologic conditions that concentrate Li is important for assessing the resource potential and for determining the sustainability of the resource. Although groundwater has been thought to contribute solutes for evaporation in the playa center [4], recent work in other basins has suggested that the basin-center brine and alluvial fan groundwater are different hydrologic systems, and do not interact on short time scales (years) [24].
The purpose of this paper is to assess the evidence of how Li is concentrated and sourced within the Bristol Trough, particularly in the BDL and CDL basins. In addition, if the source of Li is geothermal fluid, the origin of Ca in the solution would likely be the same, and therefore an evaluation of Ca and other trace elements that are associated with geothermal fluid needs to be included in this assessment. We hypothesize that Li and Ca are sourced locally within the sediments and ashes within the basins, and that if geothermal sources do exist in the basin, they likely were most active when the basin first formed. We also hypothesize that alluvial fan groundwater contributes solutes to the playa brines.

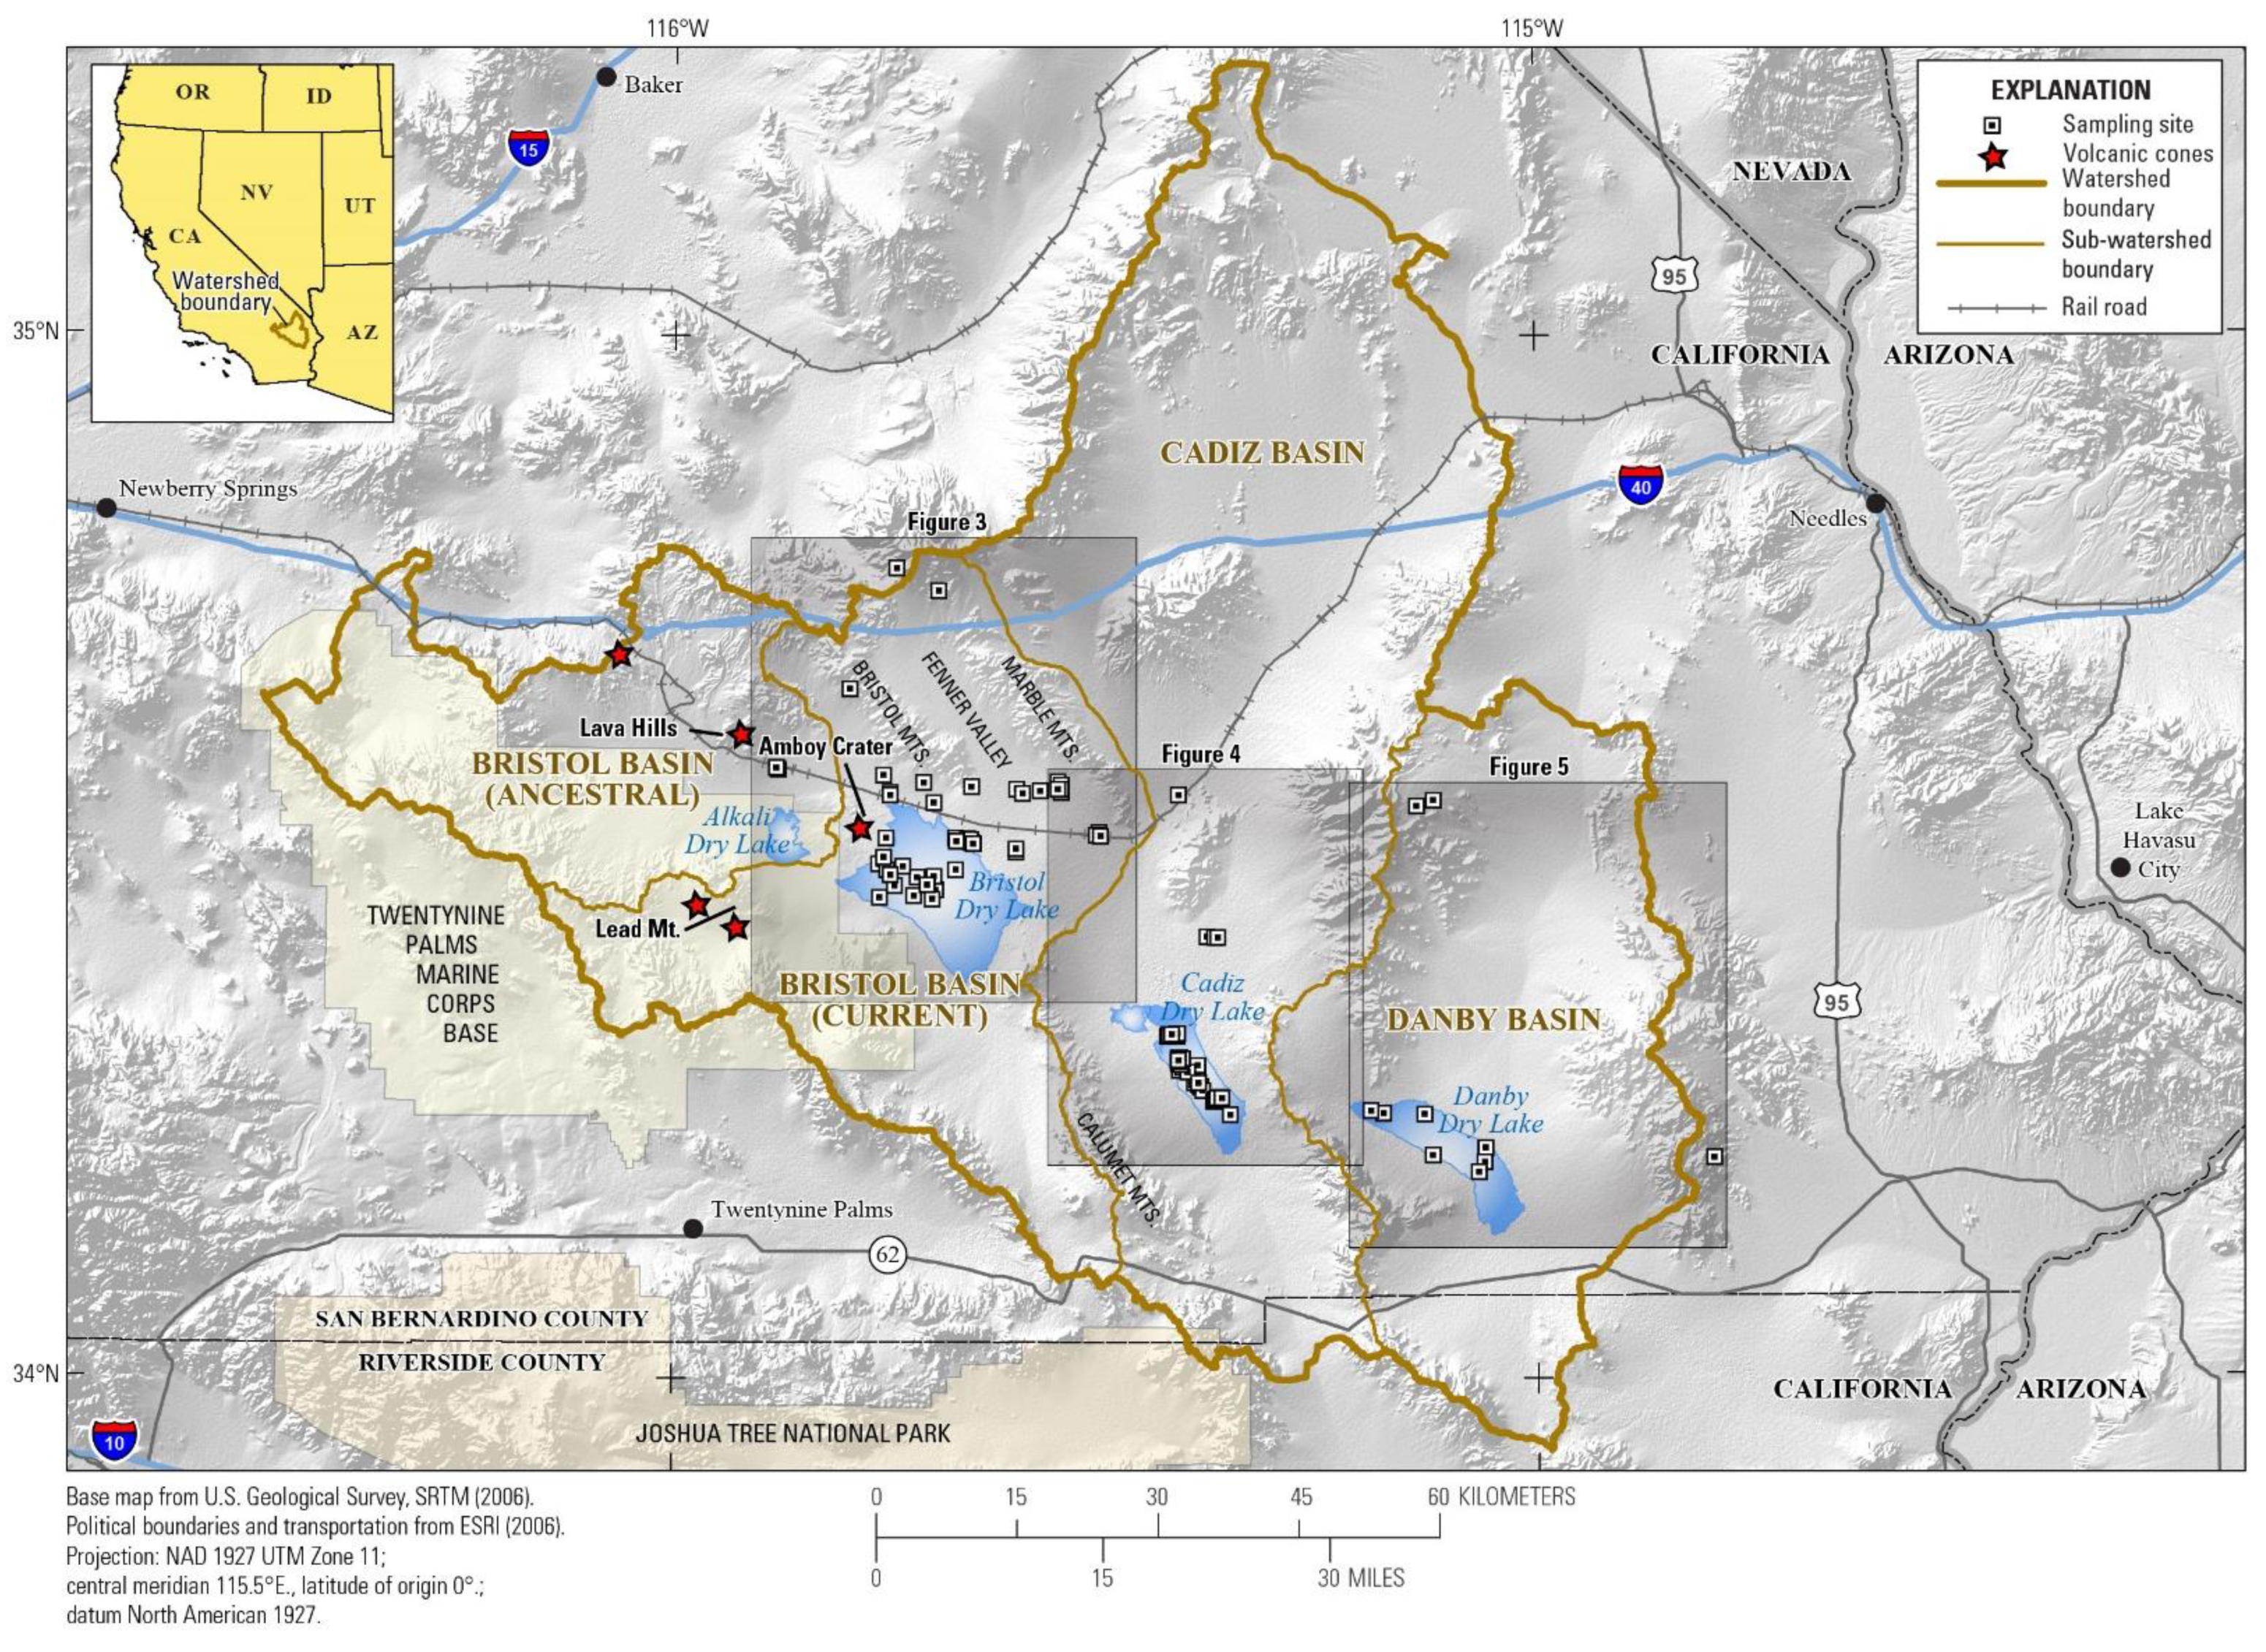
2. Geologic and Hydrologic Background of the Barstow-Bristol Trough
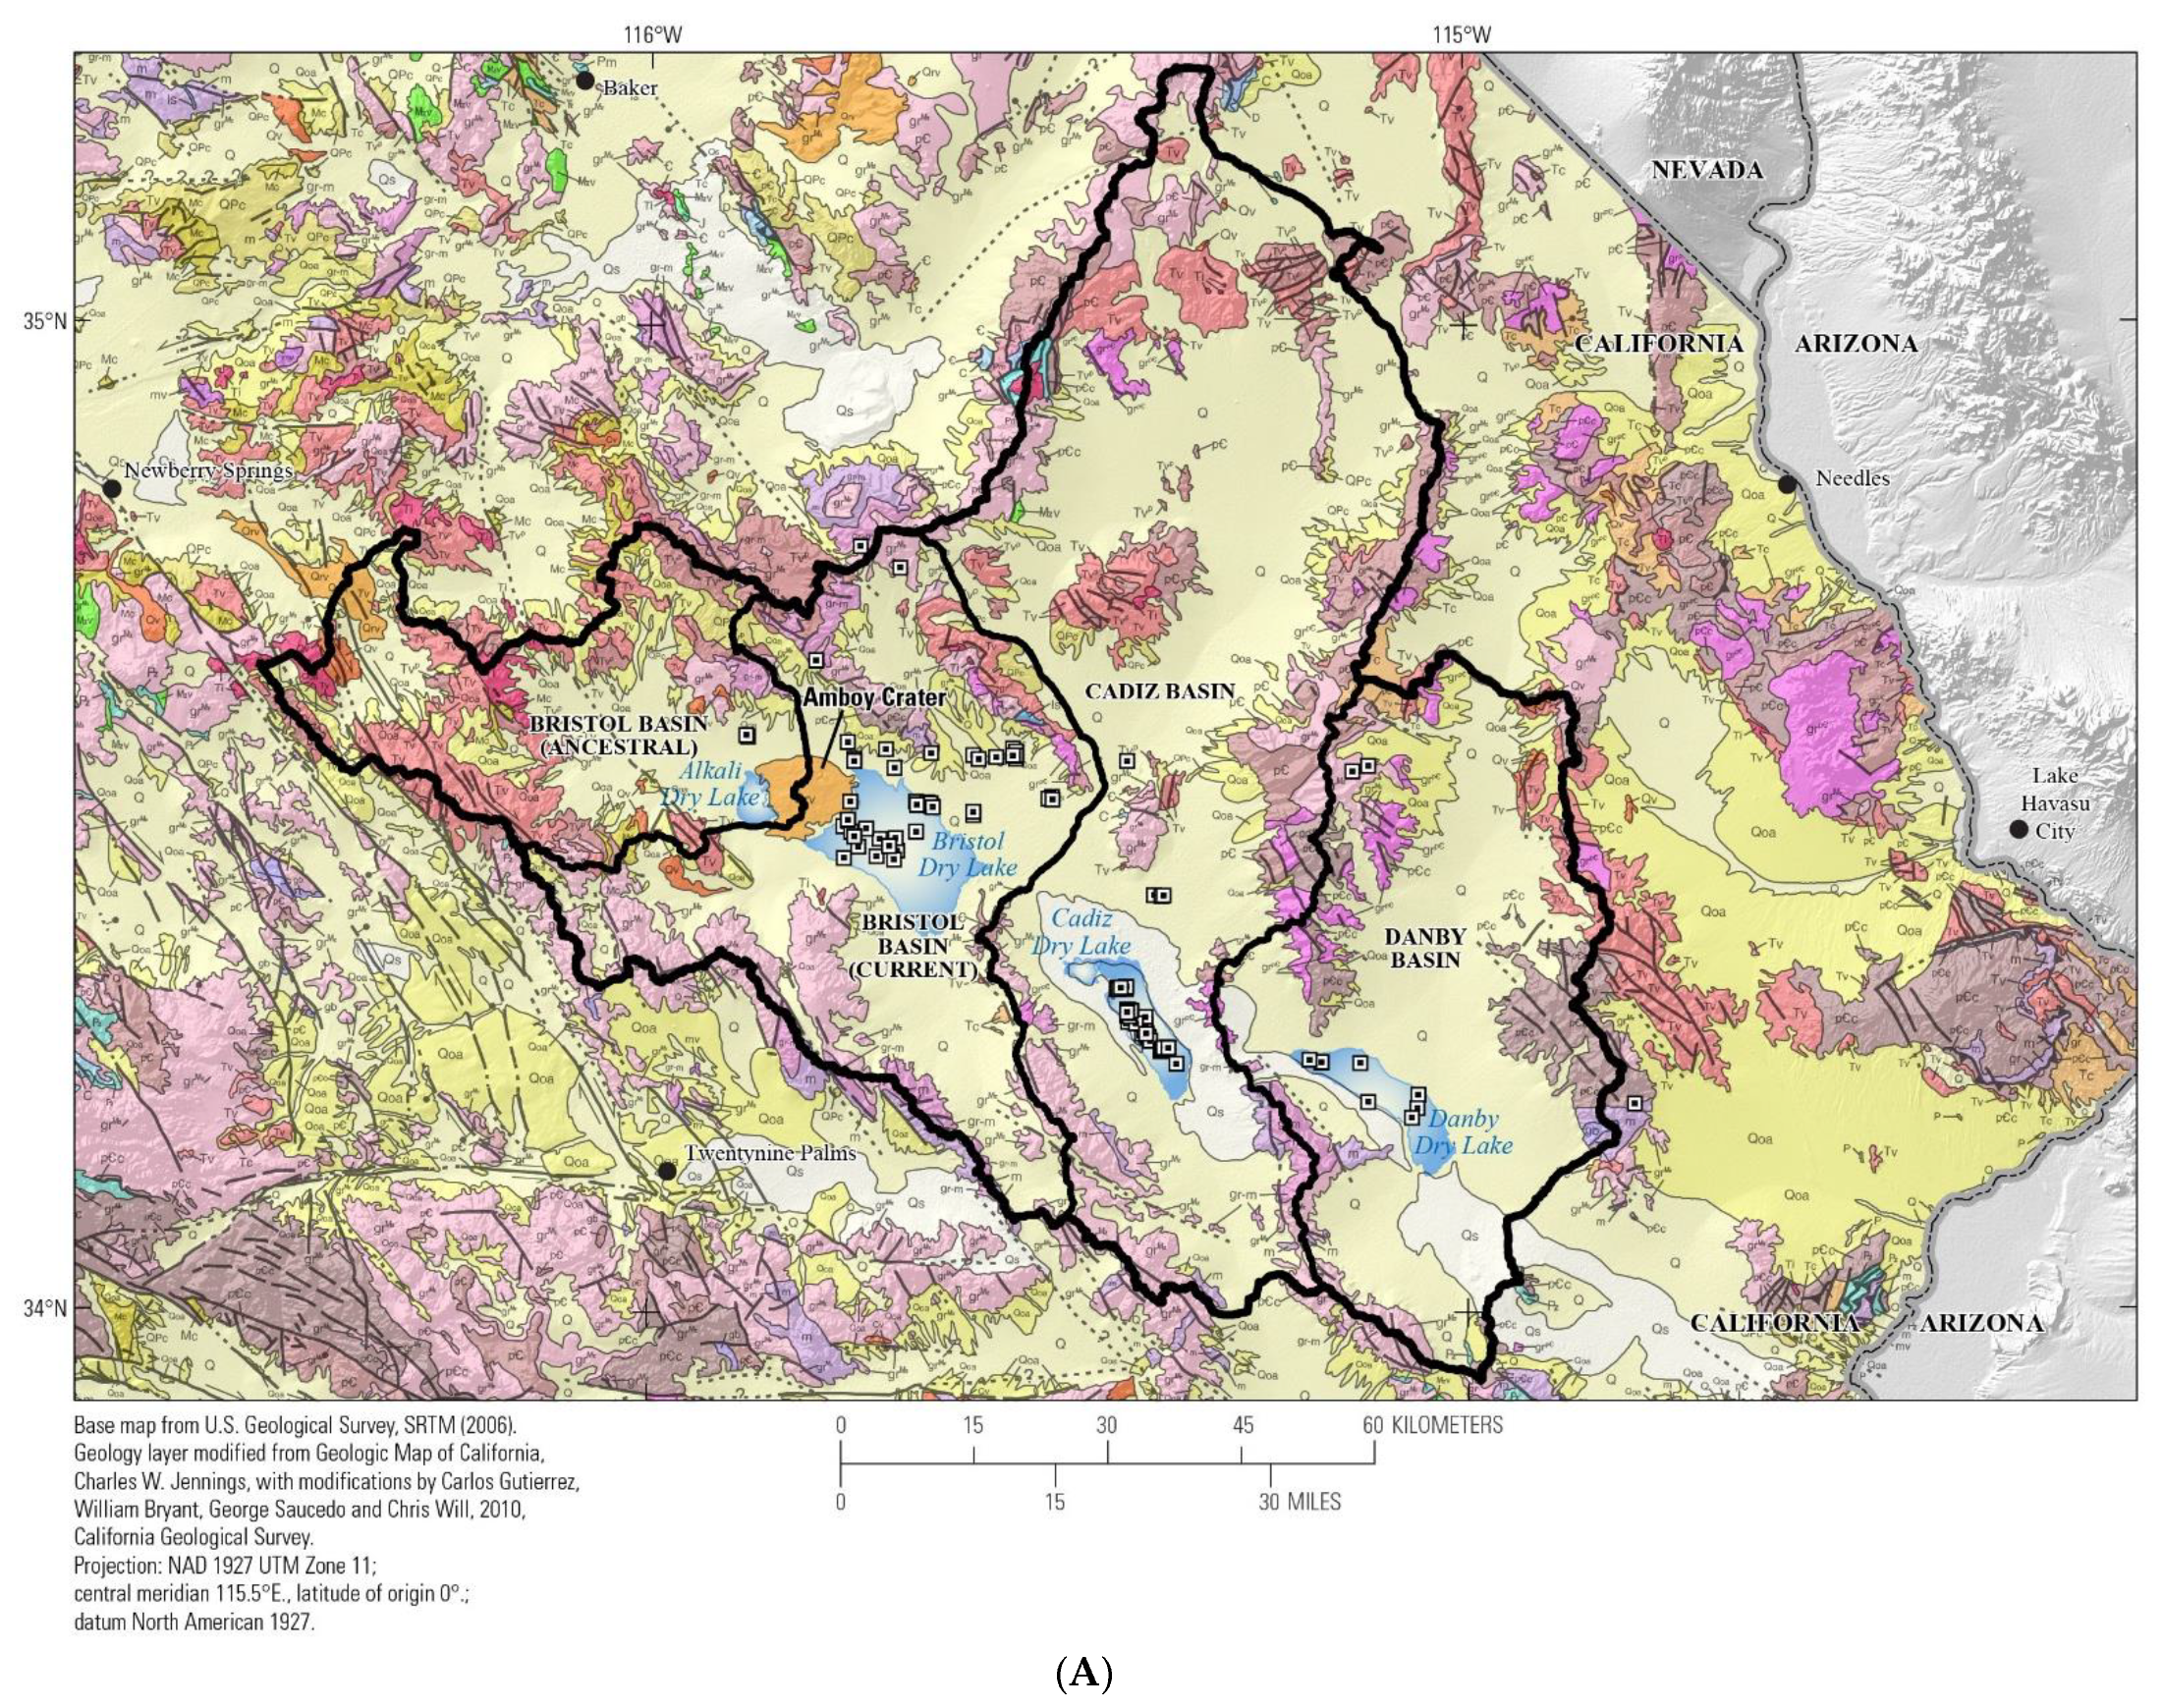
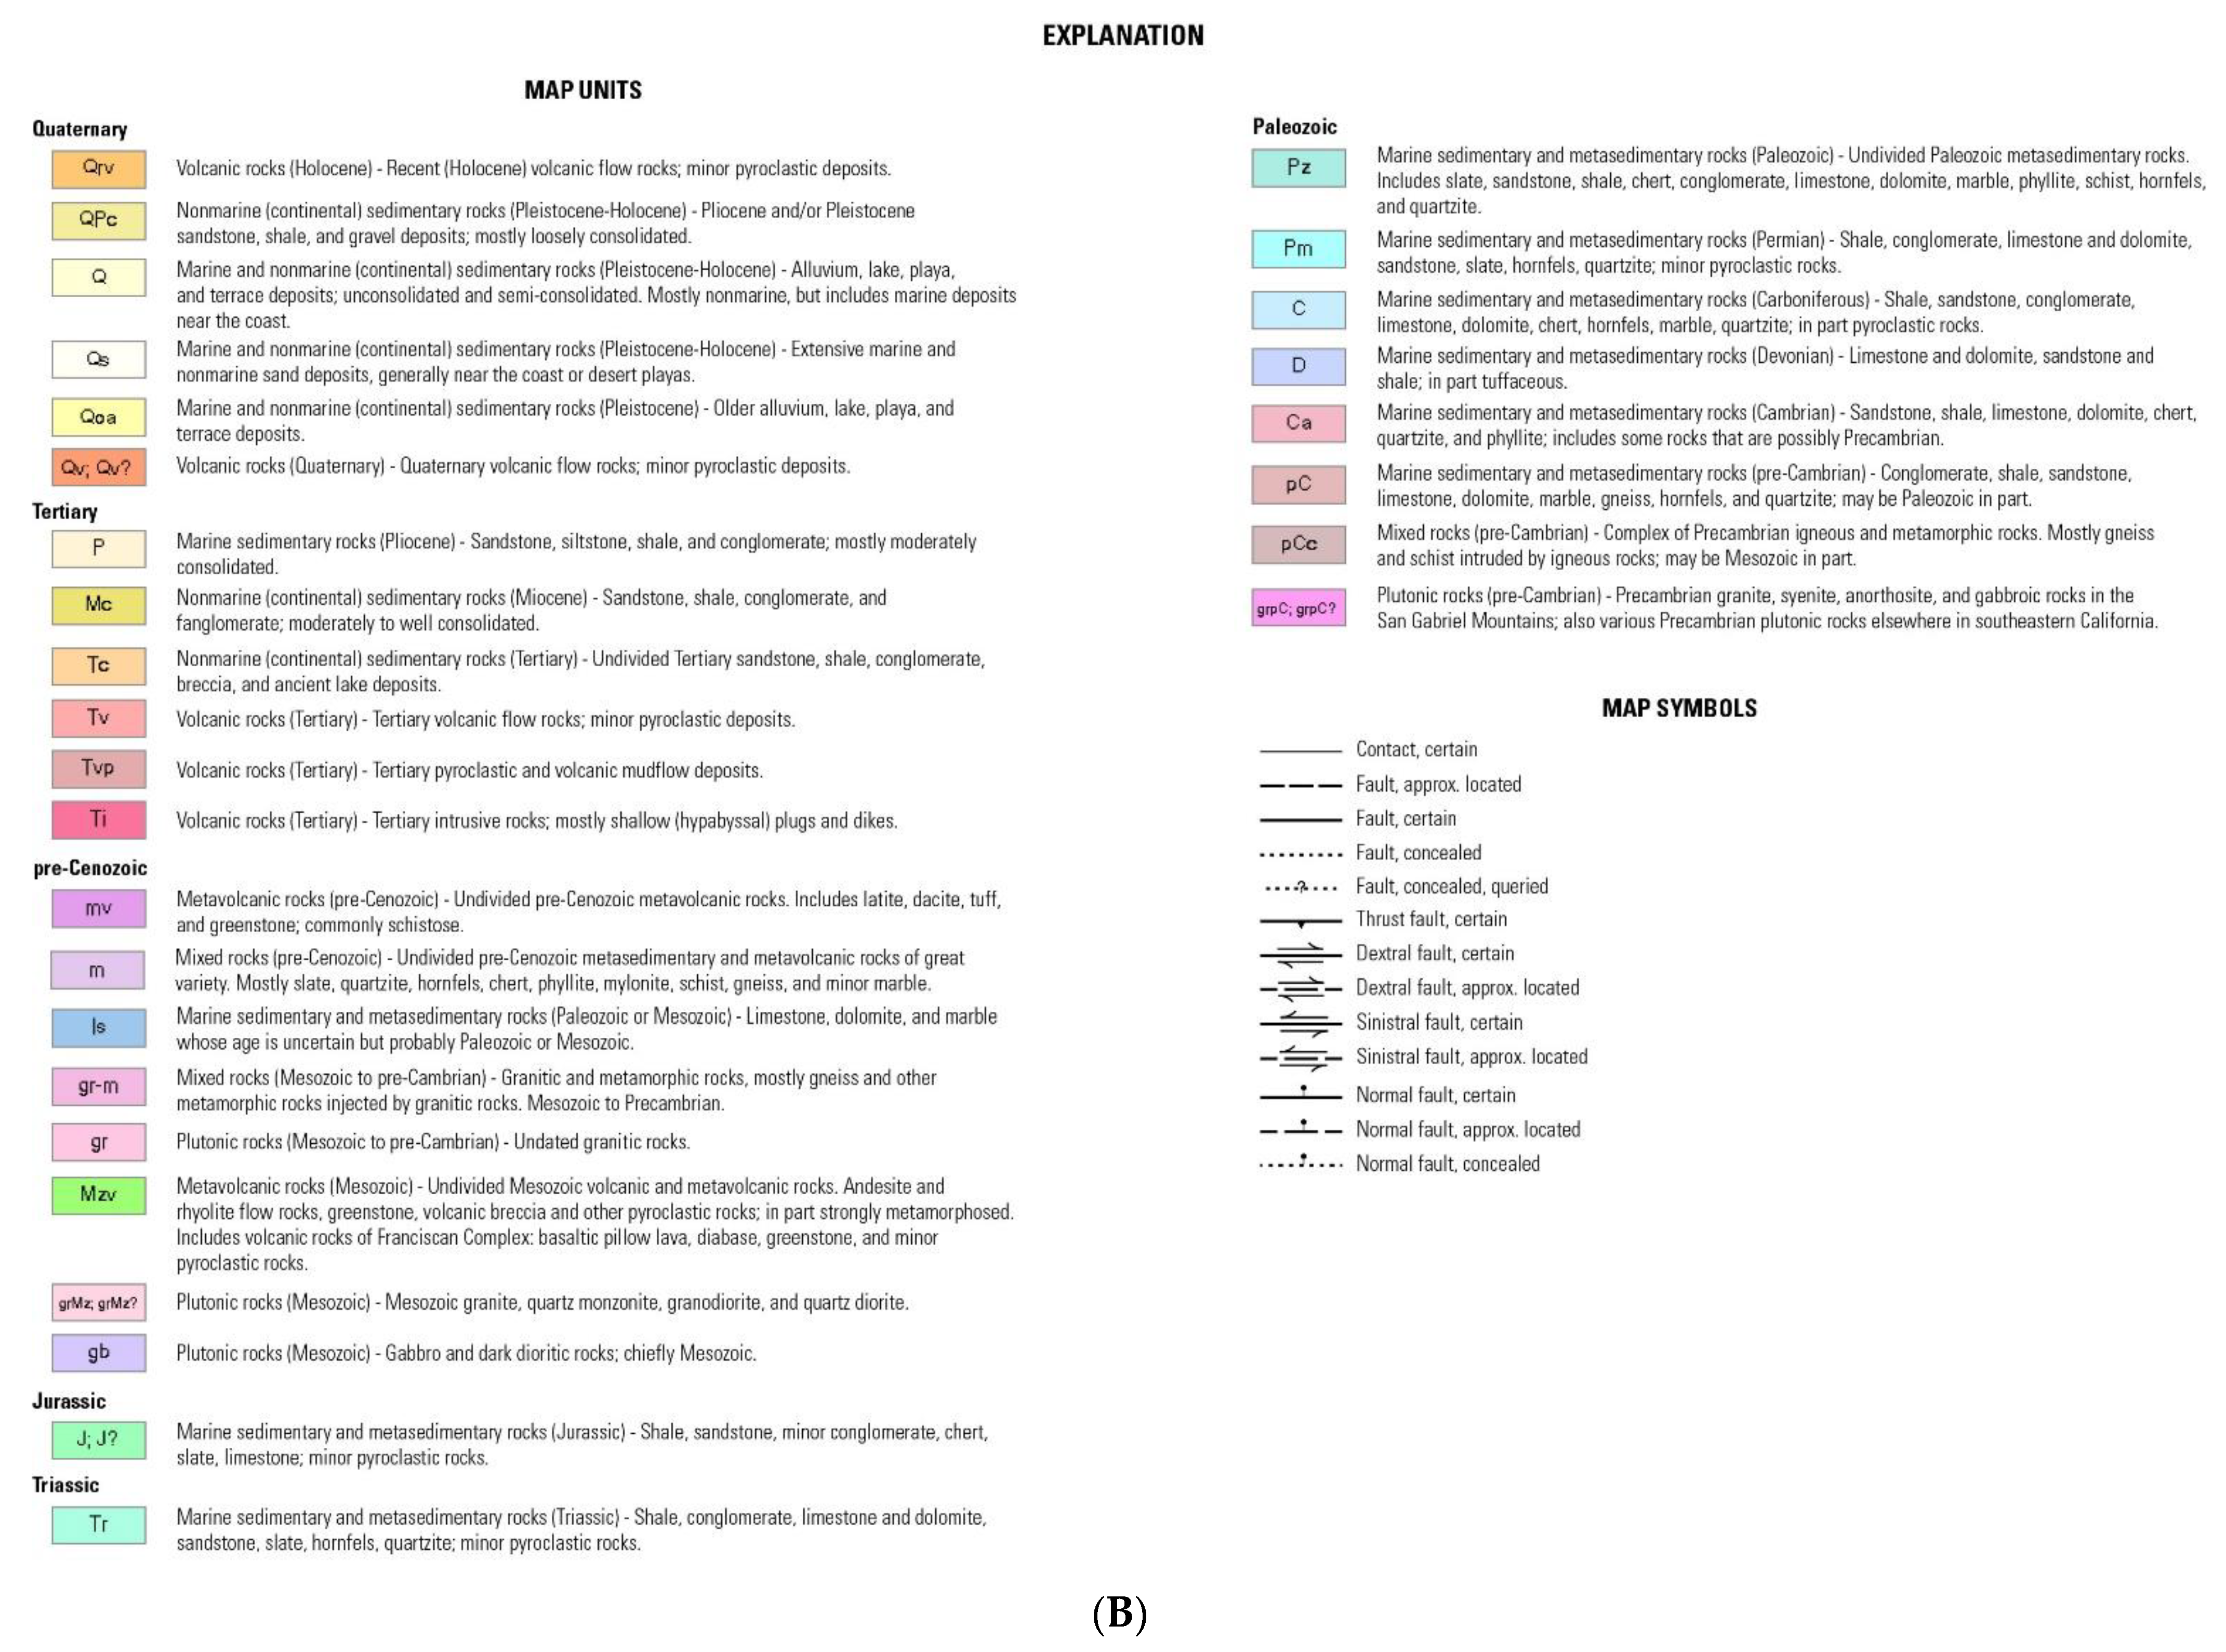
Bristol Dry Lake is situated in the Mojave Desert region of southeastern San Bernardino County, California (Figure 1). Detailed descriptions of the geologic and hydrologic framework of the Bristol Dry Lake basin can be found in [25,26,27,28], but detailed descriptions of the Cadiz and Danby basins are lacking. This section summarizes the descriptions in [26,27,28], adds some new information on the hydrology from the current study, and describes what little knowledge exists for the other two basins.

2.1. Geology

Bristol Dry Lake is the largest (155 km2) playa in a system of three northwest–southeast trending dry lakes (playas) located in a structural trough between mountain ranges in the Basin and Range physiographic province of North America. Bristol Dry Lake is situated on the eastern edge of the Mojave block [28]. The Mojave block is defined by the Garlock fault to the north, the San Andreas fault and the eastern Transverse Ranges to the west and south, and a southern projection of the Soda-Avawatz fault zone to the east [29]. The topography of the area was caused by the clockwise rotation of the Mojave block by right-shear movement along northwest trending faults during Late Cenozoic time [30]. Glazner [31] found new evidence east of Barstow for significant early Miocene (19–18 mya) extension of the Mojave block. Correlation of tephra layers from cores taken in BDL indicates that the BDL basin may have existed for 10–12 million years, since the middle Miocene [26,28]. In addition, the presence of Pliocene Bouse Formation sediments in all three playas [32,33] indicates that, at a minimum, the sediments in the playas are five million years old.
The Barstow-Bristol Trough is approximately 180 km long and extends from an unknown point north of Barstow to the southeast beyond Danby Dry Lake (Figure 2) [4]. The trough is bounded by the uplift of the Bristol and Cady Mountains to the northeast and the Newberry and Bullion Mountains to the southwest along major fault zones [4]. Gardner suggested that the Barstow-Bristol Trough represents a major break in the Earth’s crust and may extend into the upper mantle [5]. Such relationships indicate that the trough has had a relatively long history, and that tectonics may play an important role in both the short and long-term evolution of the trough. For example, [26,28] found that 200 m of sediment in a core taken from the center of BDL was repeated due to faulting and] [34] described increasingly steep dips in sediments of Cadiz basin.
Extrusive volcanics also play an important role in the evolution of the trough. A relatively young cinder cone, Amboy Crater, and its associated basalt flows is situated in the northwest portion of the Bristol Dry Lake Basin (Figure 1). The age of Amboy Crater, the only recent volcanic feature near BDL, CDL or DDL, has been constrained to approximately 79,000 ± 5000 years old based on Cosmogenic 36Cl ages of Quaternary basalt flows [23]. Amboy Crater is the southeastern-most crater of one of several similar cinder cones that line up along a northwest-southeast trend of the presumed faults within the trough (Figure 2A). These basalt flows and cinder cones and, those south of Lead Mountain, may have provided a short-lived hydrothermal heat source in the late Pleistocene in the northwestern part of the trough. Older extrusive and intrusive igneous rocks may also play a role in providing hydrothermal fluids to the basin [35]. However, at this time, there are no data on such sources which can be easily evaluated.
The drainage into BDL passes through a variety of rock types. This makes the evaluation of the ultimate source of brine components more difficult to determine. The Bristol and Marble Mountains, which bound Bristol Dry Lake to the north and east, are composed mostly of Jurassic granodiorite and quart monzonite but are associated with metamorphosed Paleozoic sedimentary rocks including some marble and dolostones [36,37], although the extent of these sedimentary rocks is minor in outcrop (Figure 2A,B). Carbonate rocks appear to be absent elsewhere in the drainage area [37], although a small outcrop of late Miocene to early Pliocene Bouse Formation shoreline carbonates (including stromatolitic mounds) has been found in the northwest fan in the Bristol Dry Lake Basin [29]. Bouse Formation outcrops have not been found in the CDL or DDL basins, but Bouse aged sediments are inferred based on rock types and fossils in basin-center cores in CDL and DDL [33]. To the south, plutonic and metamorphic rocks are most common. According to [32], no saline-bearing deposits crop out within the drainage area of the Barstow-Bristol Trough. All three basins are mostly surrounded by volcanic and plutonic igneous rocks of varying ages (Figure 2A,B).

2.2. Definitions

The hydrology of playas has been discussed by many authors in general—for example, [4] discusses three type of playas, discharge playas, where the only outlet for groundwater in the basin is through evaporation or evapotranspiration. In this case, the groundwater table is at or near the land surface at the playa. Throughflow playas are playas where some groundwater may pass out of the basin to the next basin, and the groundwater table may be at or near the land surface as well. Recharge playas are playas where surface water recharges through the playa to the groundwater that is far below the land surface. Bristol and Cadiz Dry lakes in this paper are defined as discharge playa, and DDL is likely a throughflow playa, as discussed below. Cadiz Dry Lake may have been a throughflow playa or been connected to BDL through surface flow in the past.
Geothermal water is defined as meteoric water that has traveled deeply into the earth and been heated by magmatic forces at depth and potentially returned to the surface. Geothermal water generally will have greater water–rock interaction and greater heating than thermal water. Thermal water is meteoric water that is heated by long, deep travel paths in aquifers and heated by the thermal gradient of the Earth. Thermal water is generally cooler than geothermal water but may not always be.

2.3. Hydrology of Barstow-Bristol Trough

The main hydrologic, sedimentologic, and chemical characteristics of the three playas in the Barstow-Bristol Trough are summarized in Table 1. Bristol Dry Lake is separated from CDL and DDL by projecting arms of the Marble and Calumet mountain ranges (Figure 1). At present, each of the three subbasins have completely separate surface internal drainage. Cadiz Dry Lake currently has the lowest surface elevation of the three playas (165 m above sea level), with BDL approximately 15 m and DDL approximately 22 m higher than CDL, respectively. However, the projecting arms of the mountains separating BDL and CDL are at present only approximately 15 m higher than the lowest point in BDL. It has been suggested that surface and groundwater has flowed between BDL and CDL during pre-Holocene time [38] and the similarity of the brine chemistries supports this suggestion. Unfortunately, at the present time, there are not enough data to fully assess the flow between the basins. A fourth basin, Alkali Dry Lake, is separated in terms of surface flow from BDL by Amboy Crater and its associated basalt flows Alkali Dry Lake and BDL are functionally a single groundwater basin with different surface drainages since Amboy Crater erupted. No chemistry data are available for Alkali Dry Lake because it is located on the twenty-nine Palms Air Force Base but given that the basin has for most of its history has been undivided, one can postulate that the brine is likely to also be a Na–Ca–Cl brine. Given that Alkali Dry Lake formed relatively recently, for most of the history of the BDL basin, the total drainage area into BDL (approximately 3500 km2) was significantly greater than it is today (Figure 1). Even with this reduced current drainage area, the present total drainage area into BDL, excluding drainage from CDL and Alkali Dry Lake, is approximately 2200 km2.
Thompson [39] indicated that the groundwater table at both BDL and CDL were close to, or at the surface, whereas [40] indicated that in 2010 that the water table was many meters below the land surface near the playa edge. This likely indicates that decades of pumping have changed the natural conditions in both basins. Shafer [38], and [41], using essentially the same data as [38], analyzed chemical groundwater data and water table information mostly from wells drilled in the alluvial fans in the Bristol and Cadiz Basins (Figure 3 and Figure 4). Although these data are sparse in crucial places, the general surface of the water table was defined by [38], with modifications by [26]. Shafer [38] did not state whether the groundwater system is confined or unconfined but based on the drillers logs of the lithologies of the test wells and the shallow depth to static water, it is likely an unconfined system. Unconfined groundwater systems are common in arid, porous alluvial fan systems. The mountains around all three basins are relatively low and all have extensive alluvial fans, so that the slope of the groundwater table is relatively low near the playas. This is different to some playas like Death Valley, California and Dixie Valley, Nevada, where fault-bounded mountain ranges are relatively steep and close to the edges of the playas [24].
The location of the saline–freshwater interface has important implications for modeling brine compositions and flow directions in BDL. According to [38], the wide and complex variations in groundwater surface elevations, which do not show a constant groundwater head direction, and the variations in groundwater salinity, and hence density of the water, of the Bristol Dry Lake side of the interface have not been sufficiently consistent to allow the saline groundwater to mix, either by diffusion or advection across the interface and significantly degrade the freshwater zone. Furthermore, Shafer [38] stated that the shape and relatively less permeable lake and brine pan (halite) deposits are the probable means of confining the saline water to the playa area and preventing the mixing of the playa groundwaters to form a more homogeneous body around the margins of the playa. The implication of these statements is that the solutes in saline–freshwater zones are essentially stationary. One recent study of the Death Valley, CA, USA, groundwater system also suggested that the alluvial fan groundwater system is disconnected from the playa center because of the permeability contrasts between the permeable alluvial fan sediments and the less permeable clays in the basin center [24]. This study was mostly concerned with short-term flow, on the order of 1–5 years, and did not consider longer term and slower diffusion or advective flow (thousands of years) that would allow movement within the low permeability sediments. In addition, the Death Valley alluvial system has a much narrower and steeper alluvial fan gradient than the Barstow-Bristol Trough system. Other modeling studies on wet playas have shown that this is not the case, and that wet playa basins are exceptionally dynamic across the saline–freshwater interface and that over long periods of time water moves across the saline–freshwater interface and within the brine itself [45,46]. Pumping of groundwater for brine generation and salt production in BDL has occurred since at least the beginning of the 20th century and estimates of groundwater withdrawal are approximately 100,000 m3/year [38,40].
Little is known about the hydrology of CDL playa area. Although much more is known about the hydrology of Fenner Valley alluvial fan (Figure 3), the complexity of the water use in this area is beyond the scope of this paper [40]. Wells for brine generation exist in several places (Figure 3), but due to continued pumping and private ownership of the wells, water levels are proprietary. Pumping from the wells located on the playa may roughly total approximately 925,000 m3/year, but the source of these data for this value is not given [40]. A great deal of new water quality data are available from wells located in the playa center, and these data are the basis of updated interpretations presented here.
Danby Dry Lake has the least amount of historic chemical and hydrological data, and no recent data have been collected. However, boreholes drilled by the U.S. Geological Survey in the 1980s and reported in Calzia [8] show a Na–Cl brine that contains almost no Ca or Li (Table 1). The two boreholes, one drilled in the northern part of the playa and one in the south (Figure 5), were each sampled at two intervals, between 22 and 40 m below land surface (bls), and near the base (153 m bls). Three of the four samples contain brines with a TDS between 151 and 181 g/L, but the sample from the base of the borehole at the southern end of the basin (core DAN-2-2) has a TDS of only 1.89 g/L [8]. The sediments at the base of this borehole are silty gravels and sands, indicating that there is a relatively fresh aquifer below at least part of the Danby playa. This may indicate that the basin is at least partially hydrologically open, and the reason DDL brine does not reach halite saturation until the very top of the sediment column may be due to outflux of ions from the basin as suggested by [47] in the playas in the Southern High Plains of Texas and New Mexico.
From computer simulations, Duffy and Al-Hassan [45 concluded that the relief of the surrounding mountains and the Rayleigh number of the groundwater flow (the ratio of buoyancy forces tending to cause flow to other forces tending to resist flow, i.e., free convection) can determine the hydrochemical cycling in undrained-closed basins. A basin, such as those in the Barstow-Bristol Trough, with low relief and low precipitation rates will have a high Rayleigh number and so promote free convection. The relief on the mountains surrounding the trough is only approximately 1000 m, the average alluvial fan gradients are low (1.8 m/km), and annual precipitation is extremely low at 0–100 mm per year [28]. Thus, Bristol Dry Lake is a prime candidate for free convection. Historic and recent temperature measurements of brine at BDL show that the water has a relatively consistent temperature (20–25 °C; (data in [12,13]) as deep as 350 m bls, indicating that free convection is likely. The model predicts that this free convection would promote degradation of the freshwater-saline water contact and eventually make the entire basin saline. This has happened at BDL, but not at CDL or DDL because the alluvial fan water in these basins is still relatively fresh.
No geothermal, thermal or cold springs have been found which would direct groundwater flow into one specific area of the Bristol Trough at low elevations. In fact, diffuse groundwater flow into the basin appears to be taking place. Although [5] reported “seeps” of calcium chloride confined to the north and west portions of the playa, locations for these seeps were not reported and they have not been found subsequently [25,26,27,28]. However, one of the salt companies on BDL uses groundwater from the east portion of the playa for evaporation to calcium chloride brines, suggesting that brine concentrations are higher to the east, not the west. Late Pleistocene/Early to mid-Holocene diffuse discharge groundwater marsh/spring deposits composed of calcium carbonate have been found on the northeastern margin of BDL near Fenner Valley (Figure 1) slightly above the present playa surface [48]. These thin deposits were formed when more fresh water was entering the basin during wetter periods in the Younger Dryas and early to mid-Holocene wet periods [48]. Data from the geothermal resources map of California and the United States [49] indicate that there are no geothermal wells or springs in the Bristol Trough to indicate warm geothermal fluids, and this particular area of the Mojave has a medium geothermal exploration potential for deep geothermal sources [50].

2.4. Climate

Overall, the 20th-century climate of the Mojave Desert has been discussed in [51]. Even during periods of regional high rainfall or high humidity, evaporitic conditions are dominant in the Barstow-Bristol Trough [51], although Mojave wide droughts and increased rainfall cycles are present due to the El Niño-Southern Oscillation that affects interannual climate and the Pacific Decadal Oscillation that causes decadal-scale variability that result in prolonged dry and wet episodes [51]. Calendar-year precipitation in the Mojave Desert region calculated from 52 stations averages 137 mm/yr and ranges from 34 to 310 mm/yr [51]. Modern meteorological conditions for the central Mojave Desert where the Bristol Trough is located indicate a mean annual rainfall of less than 100 mm/yr [28]. Thompson [39] noted that there are periods of 2–3 years with no precipitation recorded. However, there is variability in local weather patterns. Cloud bursts are generally intense but may only cover a small area. Many times, it will rain on one side of the playa and not on the other. The presence of extensive and thick (>3 m) halite beds with primary fabrics (chevron halite with upward growth directions [28]) indicates that the halite formed in a lake setting. In order to evaporate sufficient water to maintain thick halite deposits, a relatively permanent supply of water would be needed. This indicates that the basin was likely wetter at various times in the past [4].

3. Methods

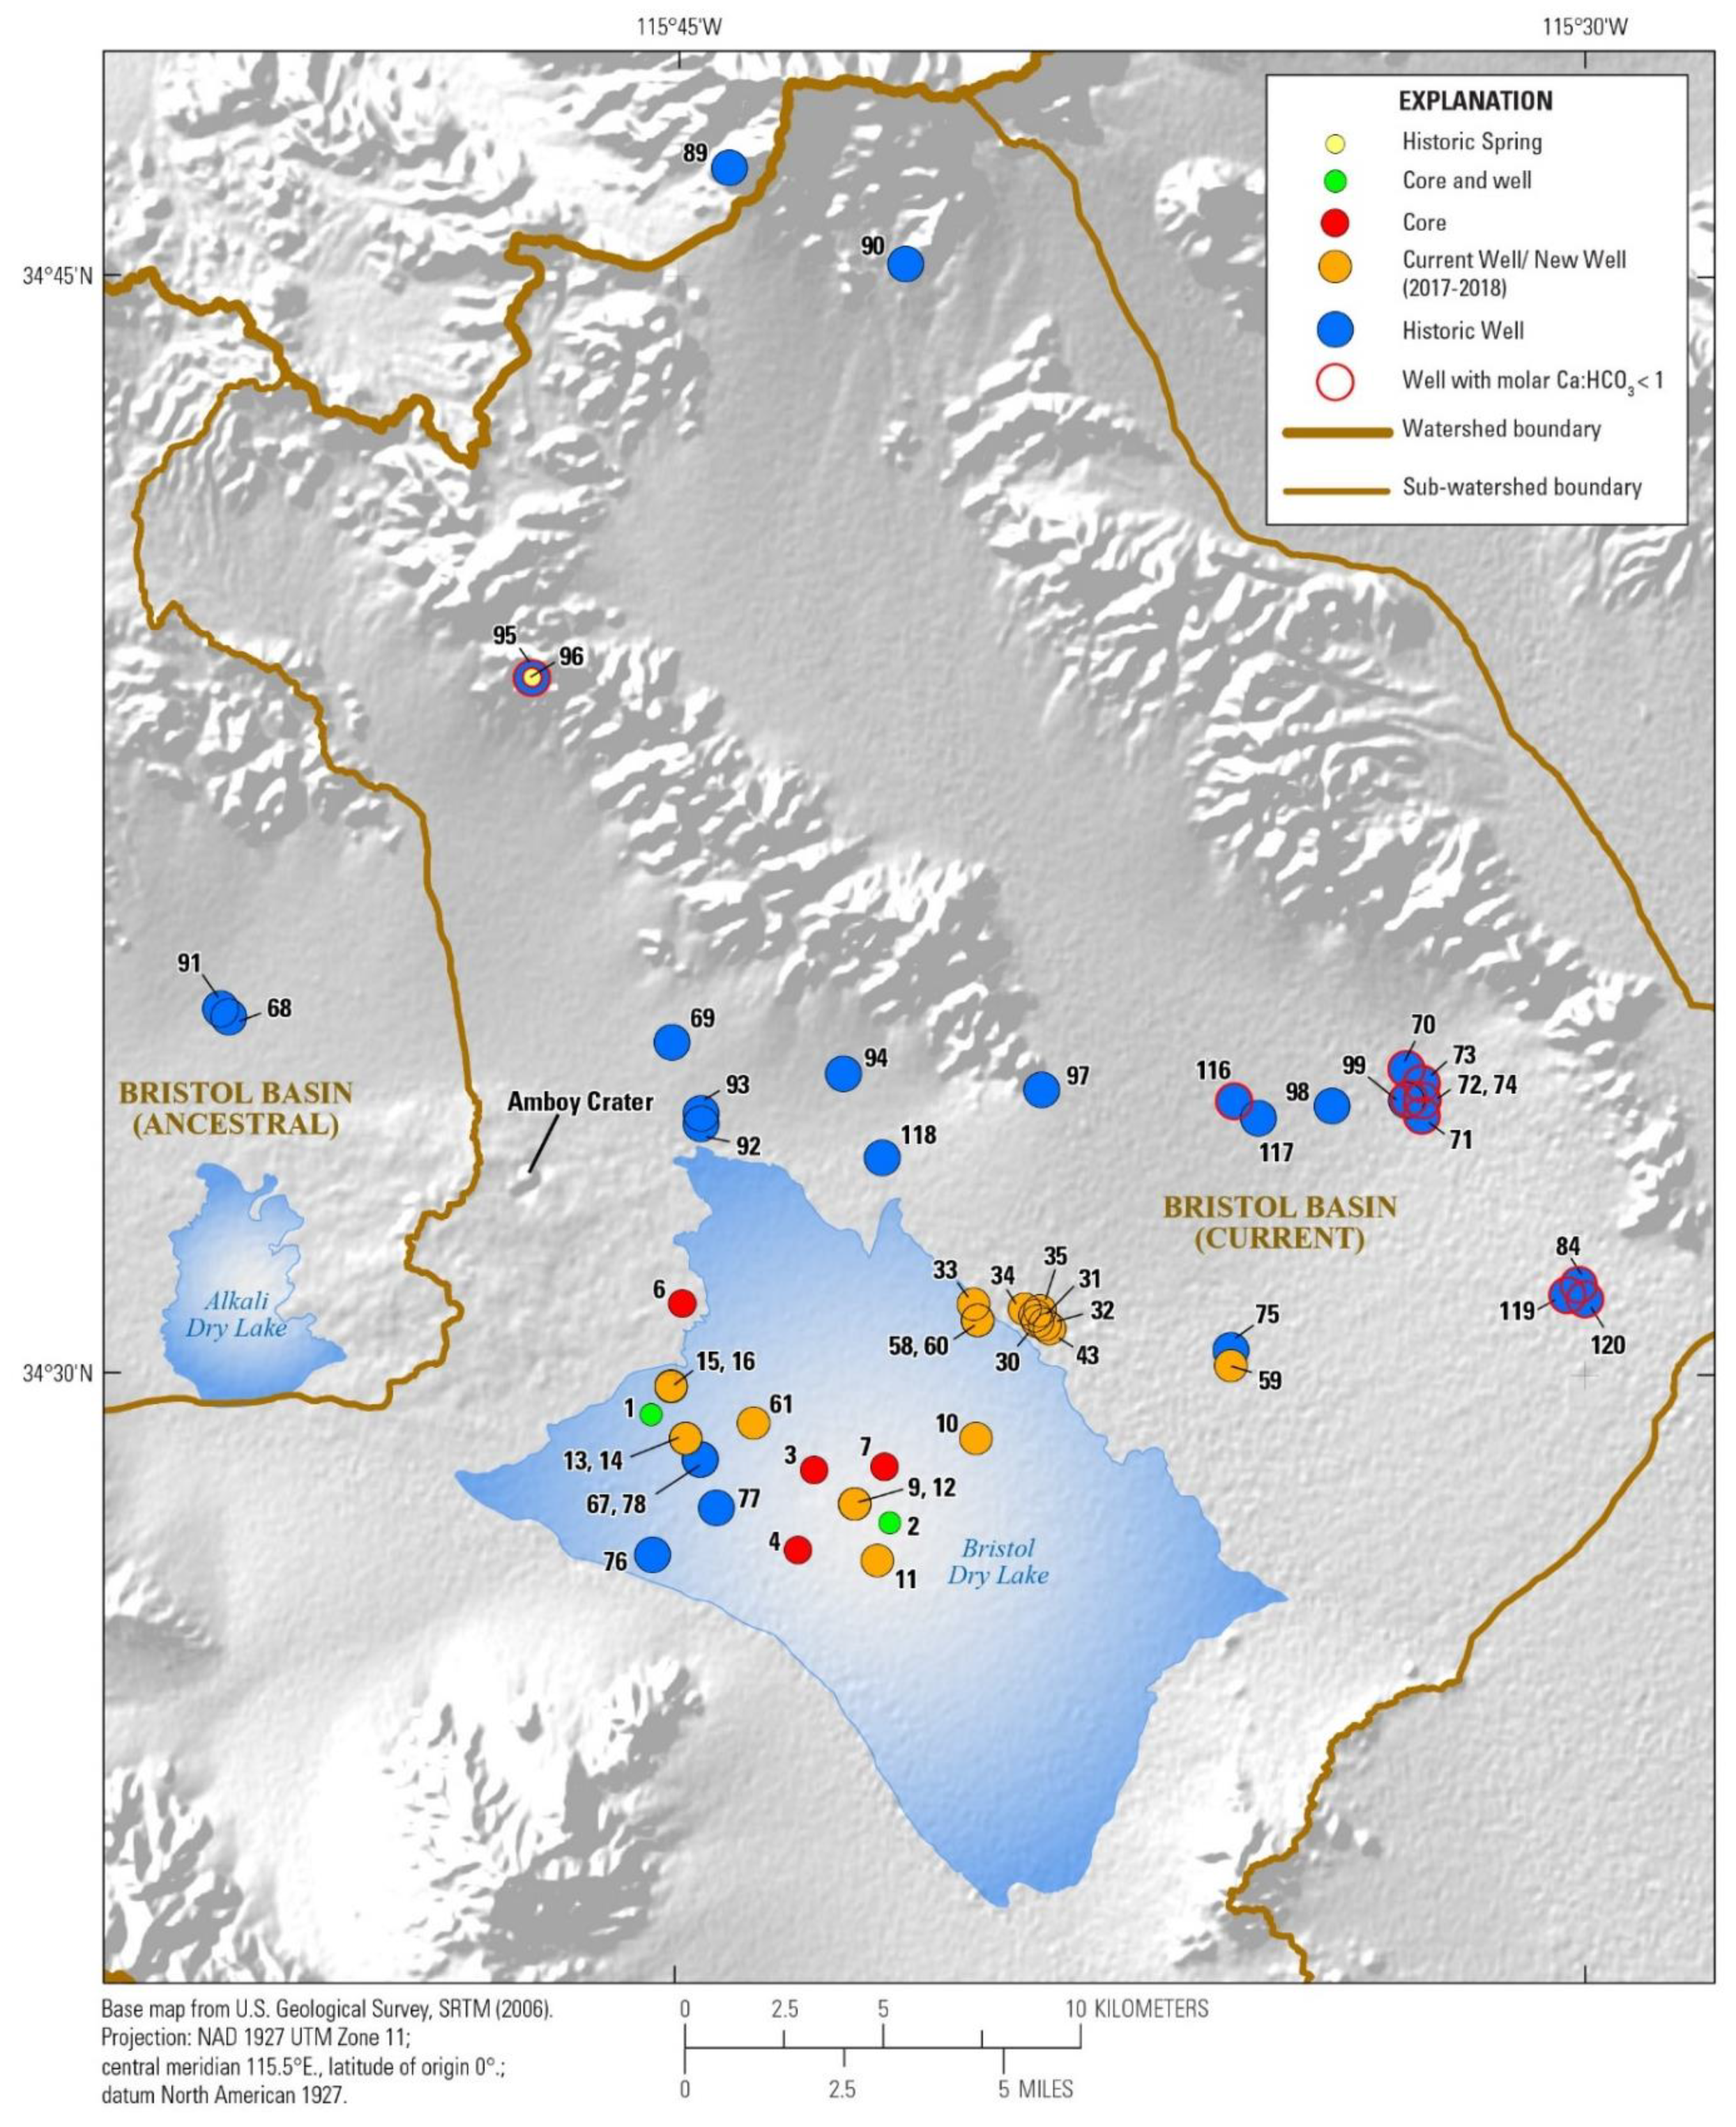
3.1. Watershed and Groundwater Delineation

Watershed boundaries were determined by combining hydrologic unit code (HUC) boundaries at the watershed (HUC-10) level, as larger units crossed closed-basin boundaries. Boundaries were not extended past HUC-4 boundaries to ensure that water outside of the combined basins was not included. The boundary between Bristol and Cadiz watersheds is somewhat difficult to determine because surface water flowing from Fenner Valley (San Bernardino, CA, USA) (Figure 1) flows to a large alluvial fan leading to both the Cadiz and Bristol basins. As a result, groundwater might also flow to both basins, but there is no documentation of this flow and pumping of water in both basins may have changed the natural groundwater flow in the basins. Therefore, although many of the alluvial fan wells appear to be in the BDL groundwater basin, they could also be in CDL. However, for this study, because the water chemistry of BDL and CDL is similar, distinguishing which groundwater basin a particular well is located within is not that important. If a flow model or water budget were to be constructed, this distinction would be far more important.

3.2. Well Construction and Sample Collection

Six new wells were drilled by Standard Lithium Ltd. (Vancouver, BC, Canada) from 2017 to 2019 in various locations on the playa at Bristol Dry Lake to approximately 450 m in depth. No new wells have been drilled at CDL or DDL, but groundwater chemical data for all three playas have been retrieved from historical well information maintained by the California Department of Water Resources database (available online at http://wdl.water.ca.gov/waterdatalibrary/index.cfm). New samples from existing brine operation well fields on the Bristol and Cadiz playas (Figure 1, Figure 2, Figure 3, Figure 4 and Figure 5) were analyzed for major ion concentration and trace element data [12,13], but Li concentration data are withheld as proprietary company information. In addition, new information on clay mineralogy, adsorbed chemicals, and mineral habit have been obtained from BDL clays at various depths in 3 of the new wells that have been drilled.
New wells were drilled by Standard Lithium Ltd. to identify the areal and vertical distribution of brine chemistry, as well as to confirm data from historical drilling and exploration [7]. From September 2017 to March 2018, seven rotary boreholes (two at the same location) were drilled using reverse circulation (RC) with air, mud rotary (MR), and flooded reverse (FR) drilling techniques. Drilling locations and targets were based on available land permissions and accessibility, surface geophysical surveys, historical drilling, and past hydrological studies. The most effective drill tooling used large diameter tricone and drag bits. Various downhole geophysical logs were run in both open hole and cased wells to obtain information on the lithology, geological properties, and the presence of brine. Samples of drill cuttings from RC drilling are loosely representative of the actual drilling depth and were washed using a 20-mesh strainer. The samples were mostly comprised of saturated cohesive clays and were placed into plastic chip trays, and then into 3.78 L plastic sample bags and were logged at the drill rig. Sometimes MR drilling was used to advance the borehole quickly and maintain borehole integrity so that a well could be completed. With this technique, drill cutting samples are not necessarily representative of the actual bit depth. The same is true for FR drilling, which was used to replace MR drilling in wells DH-5, 5A, and 6A. In MR and FR drilling, mud return was discharged through a sand separator and onto a shaker screen. Samples were collected at the end of the shaker screen and were treated the same as with RC drilling. The MR and FR drilling mud was comprised primarily of a slightly oversaturated sodium chloride salt solution (density ~1.7) using local packaged feed salt containing no gypsum. Very low quantities of various polymers and viscosifiers were used as a suspension agent to help rheology.

3.3. Hydrochemical Analyses

Well chemistry data from the California Department of Water Resources (CADWR, Sacramento, CA, USA) database provide relatively complete analyses of wells that were sampled mostly between 1955 and 1968, with some wells sampled earlier or later (data in [12]). Most wells have major ion chemistry with some trace elements such as boron (B), fluoride (F) and some lithium (Li) analyses. Ion charge balances are all within 5%, indicating that the analyses are of good quality. Some wells were sampled multiple times and so provide some degree of confidence in the reproducibility of the analyses. The methods used for each analysis are available in the online database [12,13].
For samples collected from existing wells in BDL and CDL, two laboratories were used: (1) Western Environmental Testing (WETLAB, Sparks, NV, USA) as the prime laboratory and (2) ALS Environmental (ALS Canada, Burnaby, BC, Canada) as the check laboratory. The laboratories used their own certified internal QA/QC procedures. Major anions were analyzed by ion chromatography (IC) at both laboratories. Metals were analyzed by inductively coupled plasma optical emission spectrometry (ICP-OES) at WETLAB and inductively coupled plasma mass spectrometry (ICP-MS) at ALS. Major and trace elements were analyzed using EPA method 300.0 for major anions (Cl, SO4, and F), EPA method 200.7 for major cations (Na, Ca, Mg. K) and trace elements (Sr, Si, B, Fe, and Mn) and an autotitrator for alkalinity analyses.
Quality assurance and quality control (QA/QC) field samples were collected at 10% frequency. Each QA/QC set included field duplicates, field blanks, and internal standards, and were submitted to both laboratories. Field blanks consisted of distilled water sourced from local vendors. An internal standard was established at the beginning of the exploration program in order to provide a consistent chemical matrix to test laboratory dilution procedures. It was collected from a shallow pit dug in the playa that recharged with brine. At the time of digging, pit brine chemistry was thought to be representative of the playa brine aquifer, and so a bulk sample was collected in a 55 gallon drum, to be used as the internal standard throughout the exploration program.
No new lithium data from the brines at BDL and CDL are available at present, but a few previously unpublished historic Li concentrations from the alluvial fans are available from the CADWR data. No new data are available for DDL brines, partly because the brine is not of economic interest for lithium, and partly because there are very few wells in the area. However, a few historic analyses of wells located in the alluvial fans in the Danby basin have been found in the CADWR database [12] and are presented here. Most wells and chemical analyses are from the northern side of all three basins, mostly because there is more road access to the north.
Although different sampling and chemical methods were used for analysis over time, and different detection limits and reporting values apply to the various laboratories, it can be seen from comparison of the various analyses that the concentrations are, in general, similar over time. There is no way to correct historical analyses, if they are indeed different than more recent analyses. However, for the purposes of these analyses for any method biases, but given the high concentrations for the most part, these biases would be small. It is felt that comparison between the different analyses conducted by different laboratories is useful and the quality control that can be done, allows comparison of the new and historic data.

3.4. Geothermometry

Determination of the maximum temperature that the groundwater has been subjected to in the basins was performed using the equilibrium Na–K geothermometer [52] and the empirical Li and Mg geothermometer [53]. The Na–K calculated reservoir temperatures below 150 °C are not reliable and so this method is mostly a check on the higher temperatures determined. For sedimentary basins, the Li–Mg empirical method gives more reasonable results at lower temperatures than the Na-K method [54].

3.5. X-ray Diffraction on Bulk Sediment and Clay Minerals

Initial qualitative screening of 10 BDL sediment samples and one duplicate from various depths revealed significant evaporite content in each of the dried samples. Salts included halite, gypsum, and anhydrite. We attempted to eliminate salts while preparing for quantitative analysis by washing approximately 4 g of each sample in approximately 40 mL of deionized water twice. Solids then were recovered via centrifugation at 2000 rpm for 10 min, and dried.
Samples were prepared for quantitative X-ray diffraction (XRD) using a modified method based on [55]. One gram of homogenized sample was mixed with 20% corundum and ground in a McCrone micronizing mill with 4 mL ethanol for 5 min, generating particle sizes on the order of 10–30 µm. After drying at 60 °C, the mixture was transferred to a plastic scintillation vial with three acrylic balls (approximately 1 cm in diameter) along with 200–800 µL Vertrel® solution (Dupont) and shaken for 10 min. The powder was passed through a 250 µm sieve to break up larger aggregates and loaded onto an XRD sample holder. Samples were analyzed using a Siemens D500 X-ray diffractometer from 5 to 65 degrees two theta using Cu Kα X-ray radiation, with a step size of 0.02 degrees and a dwell time of 2 s per step.
Mineralogical composition was determined using the quantitative mineralogy software RockJock (version 11, U.S. Geological Survey, Boulder, CO, USA) [55]. The software uses a linear combination model and a library of standard mineral diffractograms in MS Excel to calculate the relative abundance of each mineral. Generally, the precision of this method is +/−5%, although this value depends upon the sample composition.

Clay Treatments

The <2 µm fractions of the sediment samples were isolated from 2 samples to perform heat and chemical treatments for qualitative identification of the clay mineralogy. Each sample was ground in a McCrone micronizing mill with 10–20 mL DI water for 5 min and transferred to a 50 mL centrifuge tube. Next, the suspended samples were centrifuged at 1000 rpm for 5 min, which settles the larger minerals to the bottom of the tube and leaves the <2 µm fraction in suspension. This step was repeated twice. Aliquots of the clay suspensions were transferred to silicon wafers (for air dried and unheated, ethylene glycol-treated samples) and glass wafers (for heat treated samples). Depositing thin films of suspended clays naturally orient during the drying process, which produces more pronounced 001 reflections in the diffractograms. Samples were saturated with ethylene glycol by placing them upon the upper tier of a desiccator containing ethylene glycol in the bottom. The desiccator was sealed and placed in a 60 °C oven for at least 8 h before loading the samples for XRD analysis. Additional clay identification was performed by heat treatment of the glycolated oriented sample by bringing the sample to 500 °C for 90 min. The heat-treated samples were then re-glycolated as described above. XRD analysis was performed in between each treatment. Raw X-ray data and metadata are available in [56].

3.6. Bulk Sediment Chemistry

Ten bulk sediment samples from different depths in BDL were collected from cuttings of wells DH 2, DH-5, DH5A, DH-6 and DH-6A, and analyzed at AGAT Lab in Mississauga, ON, Canada. A weighed sample was digested in a Teflon® vessel with hot hydrochloric, nitric, hydrofluoric and perchloric acids then filtered. Residual salts were dissolved in aqua regia and diluted. Samples were then analyzed by ICP-OES and ICP-MS ICP-MS ELAN® DRC II (Perkin Elmer, Shelton, CT, USA) for 49 elements reported in Table 2 and in [10].

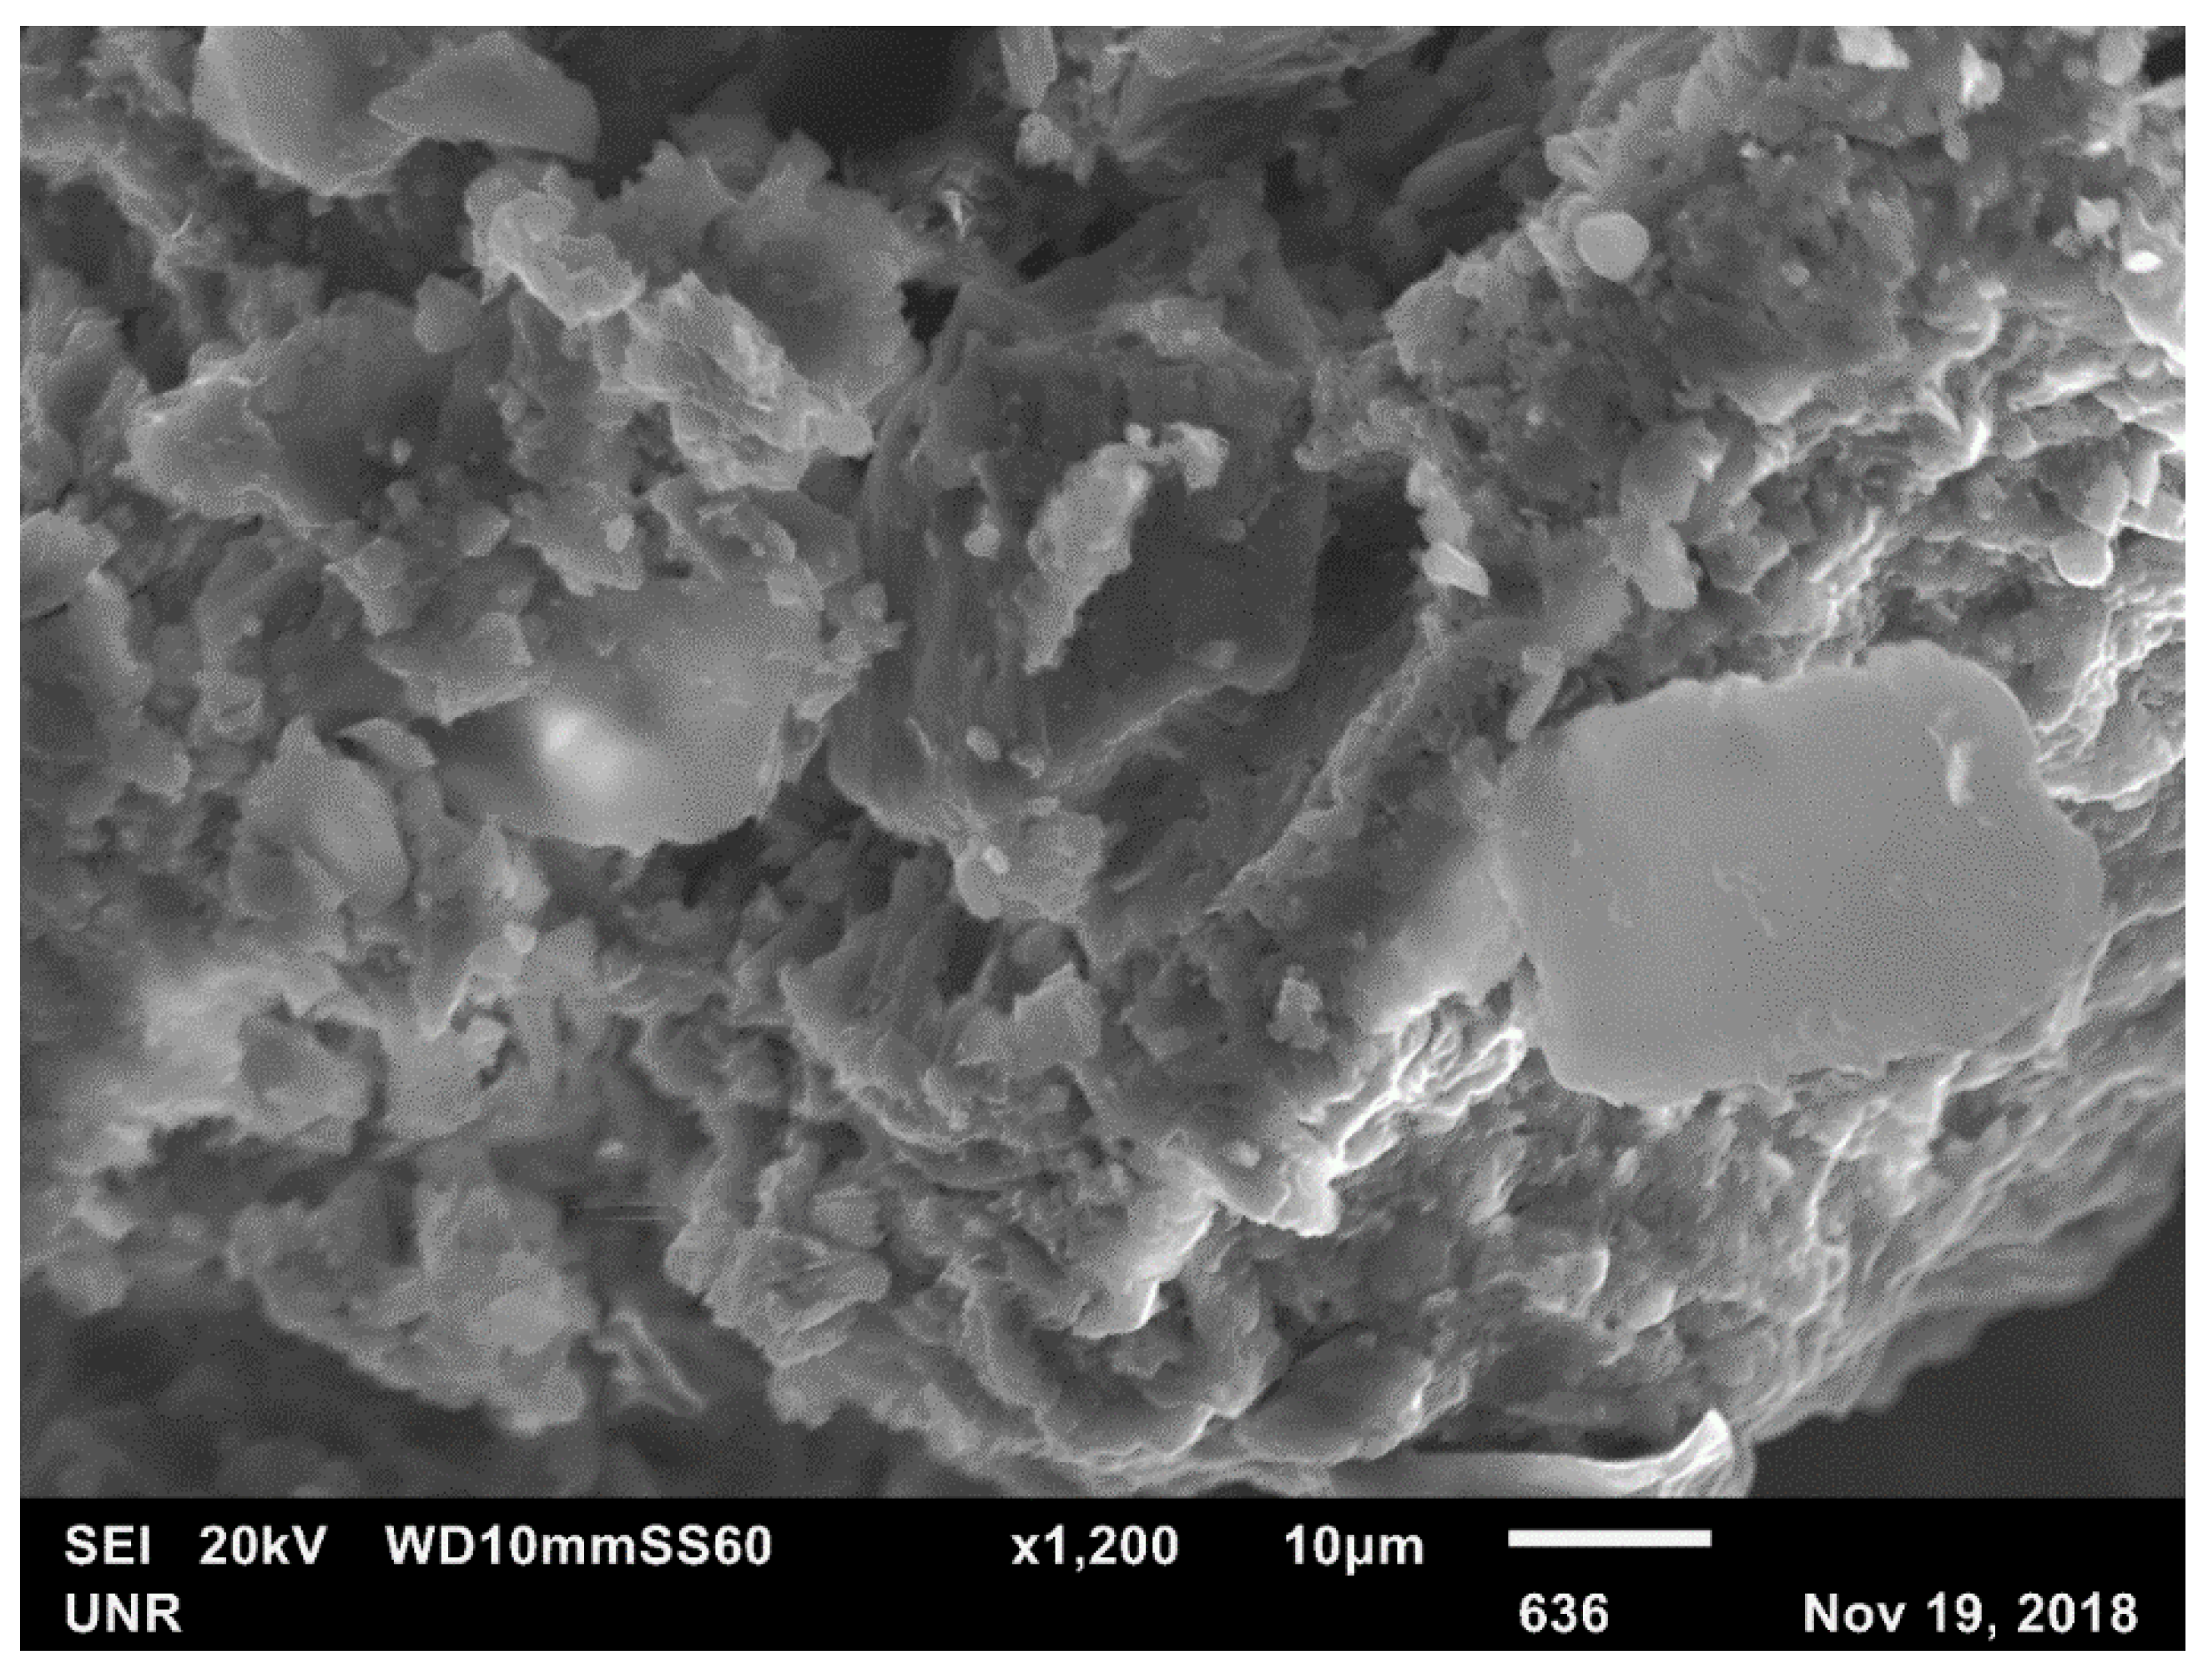
3.7. Scanning Electron Microscope

The same 10 bulk sediment samples from BDL were viewed under a scanning electron microscope at the University of Nevada-Reno (Reno, NV, USA). Samples were coated with carbon in a vacuum and run at 20 kV energy on a W-filament SEM with an embedded JEOL 10 mm2 EDS detector (energy dispersive X-ray spectrometer) (JSM-6100LA, Tokyo, Japan).

4. Results

4.1. Hydrochemistry

4.1.1. Alluvial Fan Water

New chemical data from BDL and CDL wells (data in [12,13]) are similar to previous data presented in [6,7] but show a somewhat larger range of major ion concentrations, particularly in CDL than has been previously presented (data in [12,13]); Figure 6). Data from the DWR database were also examined to provide more information from the northern side of the alluvial fans in BDL and CDL basins, and the northern and eastern side of DDL basin (Figure 3, Figure 4 and Figure 5). Alluvial porewaters show milliequivalent concentrations of Ca > HCO3 and Ca > SO4 in some wells, indicating that when these wells are evaporated to calcite and gypsum saturation, bicarbonate and sulfate will be depleted, leaving Ca behind in solution (Figure 7A,B). Most, but not all, of the wells with Ca > HCO3 are brackish (specific conductance great than approximately 1000 µS/cm), but a few are fresh (specific conductance <500 µS/cm). All of the wells with milliequivalent concentrations of Ca < HCO3 are fresh. There also appears to be two mixing paths for alluvial fan water, particularly in the BDL basin, with one path that has more Ca and another path with more Mg (Figure 6).
Some of these alluvial wells in BDL and CDL have B and F concentrations that are 1 to 5 mg/L, which is relatively high for fresh to brackish water. Unfortunately, very few alluvial wells were analyzed for Li, but those were mostly less than the detection limit (detection limit of 0.1 mg/L). A few have concentrations up to 5 mg/L, suggesting that Li, B and F may not be from the same source because they are not consistently high in the same wells. Boron and fluoride are accessory elements in igneous rocks and weathering of rock in the mountains surrounding all of the basins is the likely source for these elements. The fact that B and F do not concentrate in the brines suggests that they are adsorbed to the sediment (mostly clays) as the water moves to the playa center, as predicted in arid zone soils [57]. Although B adsorption is pH dependent, the pH of Bristol Trough brines (around a pH of 6–7) is not low enough to inhibit adsorption [58], and both B and F are likely to adsorb to illite and montmorillonite clays that are abundant in these basins [59,60].

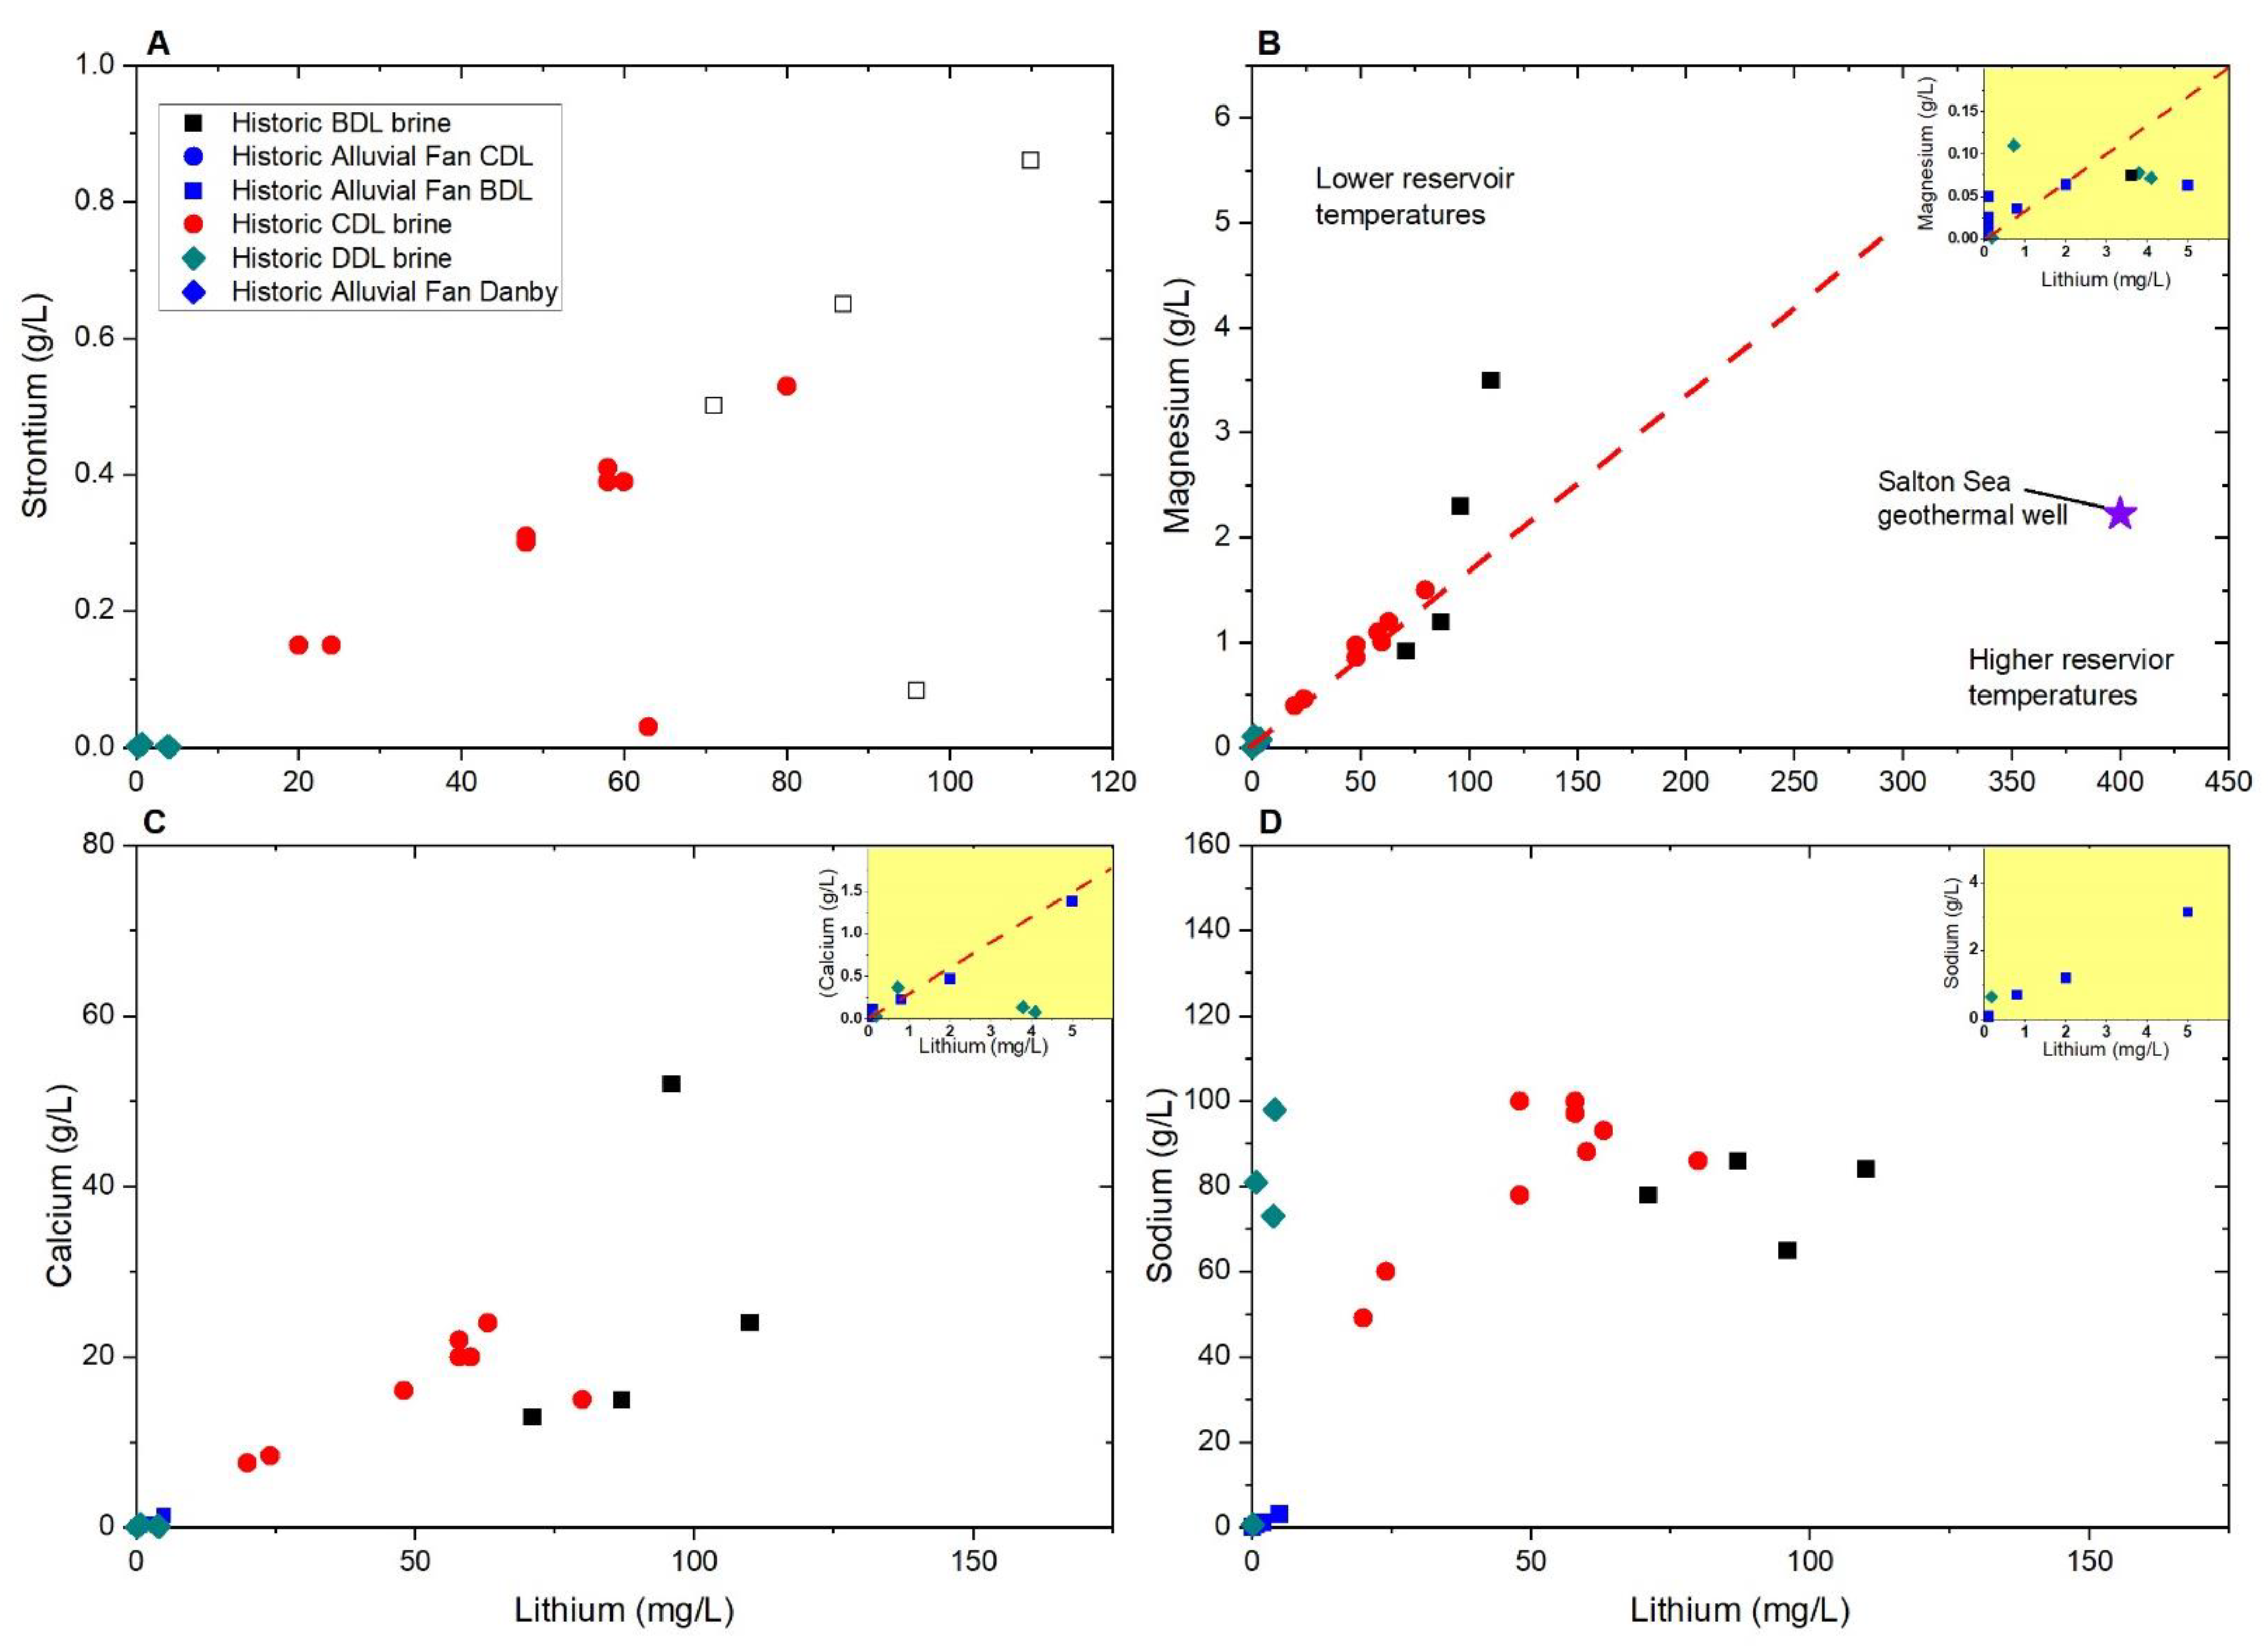
4.1.2. Brine Chemistry

The brine chemistry at BDL has been well documented in numerous publications [7,26,28,34,61], but the brine composition of CDL and DDL are only documented in [6,8]. New data collected in 2017 and 2018 from BDL and CDL [12,13] are consistent with previous analyses but provide more information on the northern margin of BDL and for CDL basin-center brines (Figure 6 and Figure 8A–D). New samples from CDL were collected from several sets of wells used for CaCl2 brine and halite production from depths of 60 to 90 m bls. Bristol and Cadiz Dry Lakes are Na–Ca–Cl brines with low concentrations of sulfate and alkalinity. BDL brines contain more Ca and Li than CDL and DDL, even though the salinities of all brines are similar. Most of the major cations and Sr correlate well in the brines (Figure 8A–D). No Sr data are available from the alluvial fans, but basin-center brines show a strong covariance between Sr and Ca (Figure 8A). Sodium and Ca correlate relatively (Figure 8B) well except for two values from BDL, which may indicate that these two samples have evolved past halite saturation, keeping the Na at the same concentration but increasing the Ca concentrations. Sodium and K appear to have two paths in the brine with lower K in some samples but not others (Figure 8C). Because some wells sampled at different times are on different paths, it is not clear that this variation is real, and it may be caused by analytical error (data in [12,13]). This is supported by the fact that the alluvial fan water shows a single trend. Magnesium and Ca correlate relatively well in the brines (Figure 8D), but alluvial fan water does not show any correlation. This may indicate variable weathering sources of Mg.
Trace element concentrations also tend to correlate well. Lithium and Sr are highly correlated with every major cation in BDL and CDL (Figure 9A–D) except Na, which has been lost to solution by halite precipitation at BDL. Brines on the edge of BDL and some CDL fluids that are below halite saturation do show a correlation between Na and Li, but there are not enough data in DDL to determine whether major cations correlate with lithium.
BDL brines overall are slightly more saline than CDL brines but have also precipitated far more halite than CDL [26], indicating that BDL is more evaporated and evolved than the CDL brine. Boron and F are not correlated in any of the brines (data in [12,13]); Figure 10) and concentrations in the basin-center brines are not much higher than in the alluvial fan water. This suggests that both elements are adsorbed to/precipitate with clay minerals as they get to the playa center.
Danby Dry Lake, which has been used sporadically for salt extraction of brines since the 1880s [62] is less saline than the other two playas and also contains little Ca in the brine (data in [12,13]). Danby Dry Lake is a Na–Cl brine that also contains almost no HCO3. However, SO4 is present between 3.8 and 31 g/L in the saline brines. Only three thin (<0.5 m thick) layers of halite have been found in the top 5 m of the core drilled at the north end of the playa [8]. The core at the south end of the playa has no halite beds and is sandier than the other core. Gypsum deposits are abundant around the edges and south part of the playa and some appear to be the remnant pedestals of older, likely Pleistocene deposits [63].

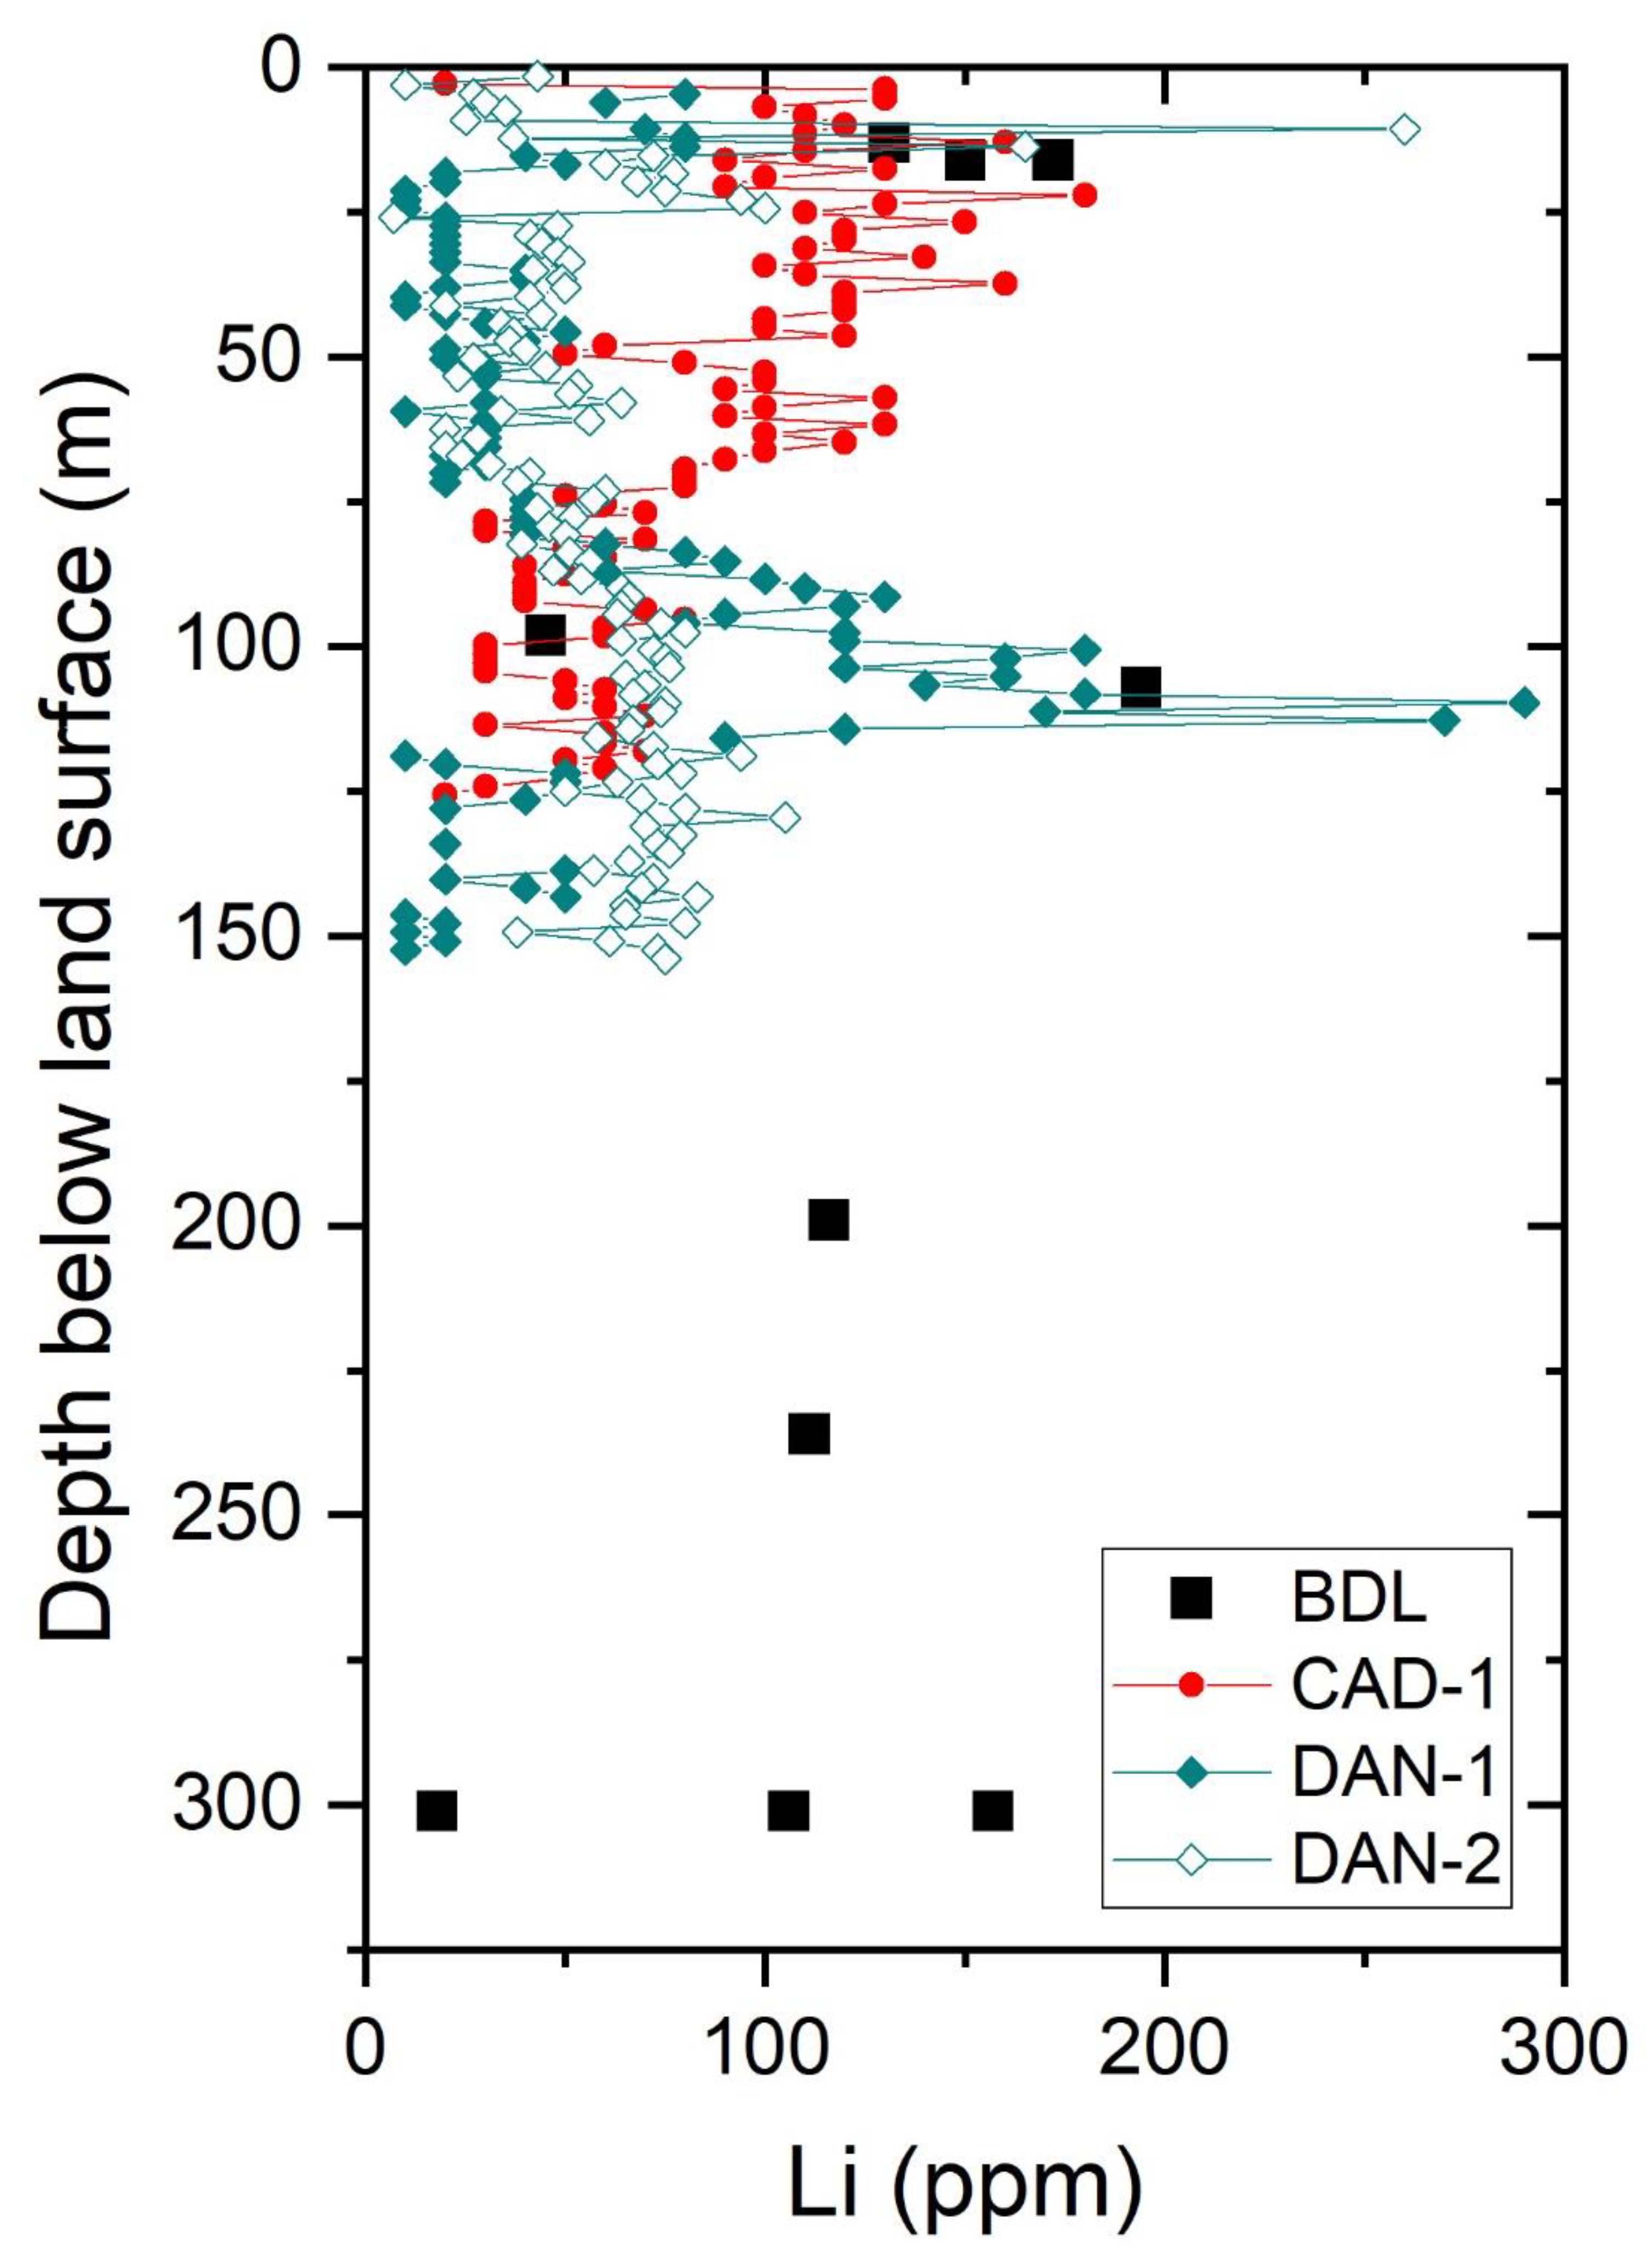
4.2. Sediment Mineralogy and Chemistry

Both samples (DH-2 50-55 and DH-2 350-355) that were included in the clay investigation were scanned with both randomized and oriented orientations. The 060 peak of montmorillonite was not expressed in oriented XRD scans, but its d-spacing in the randomly oriented preparation was diagnostic for differentiating between trioctahedral and dioctahedral smectites. In all samples, we found a bimodal 060 peak with foci near 1.52Å and 1.50Å indicating a mixture of trioctahedral and dioctahedral smectite. The confirmation of trioctahedral smectite was used to continue the investigation into the presence or absence of hectorite clay.
The ethylene glycol solvated 001 peak was clear in every oriented clay sample, and the distinction between stevensite and hecorite is based on the failure of oriented samples to re-expand after heat treatment and subsequent ethylene glycol solvation [64]. The heat treatment collapses the d-spacing of the 001 peak to 14Å, and the 001 peak of a hectorite will re-expand to 17Å after solvation with ethylene glycol, which we demonstrated using the clay mineral society hectorite (SHCa-1) as a control sample. Because the 001 peak of the montmorillonites analyzed in this investigation did not re-expand to 17Å after heat and ethyne glycol treatment, we determined stevensite was present, not hectorite. Although samples were micronized to homogenize before clay separation, and some amount of quartz and feldspar could have been present in the <2 µm random and oriented XRD samples, the presence of non-clay minerals on an oriented slide does not change the location of the 001 peak.Based on the analysis above, the mineralogy of the 10 samples analyzed from BDL show that the composition of the clays and bulk sediment are similar down to 400 m (Table 3). The clay-sized sediment is composed of mostly equal portions of smectite and illite group clays, with most of the remaining clay-sized fraction as mica (Table 3). Kaolinite is generally less than 3% of any individual sample. The non-clay-sized fraction was dominated by potassium feldspar (up to 40%) and quartz (up to 16%), with minor amounts of plagioclase (<12%), calcite (<10%), and gypsum/anhydrite (<6%).
Lithium concentrations were not measured in the previous sediment cores taken from BDL [6]. However, Li concentrations were measured in the 10 BDL samples as part of the current study. These show similar concentrations to those reported in [6,8] for CDL and DDL, respectively (Figure 11). Concentrations of Li in bulk sediments from BDL (Table 2; Figure 11) are relatively low (18–172 ppm; N = 10), with an average of 120 ppm, which is higher than Li concentrations in sediments from CDL (average of 80 ppm; N = 74) and DDL (average of 58 ppm; N = 187) reported in [6,8]. Although lower concentrations at CDL and DDL correlate with the lower salinity and possible open hydrology of CDL and DDL, the difference in sample size between each basin may account for some of these differences. Some Li concentrations in both CDL and DDL are higher than the highest concentrations observed in BDL (Figure 11) and there is no consistent trend with depth in the basins, although CDL lithium concentrations tend to decrease with depth. The 10 samples from BDL show little variation with depth, and at the deepest interval at approximately 395 m, the values range from 18 to 157 ppm Li in three different cores. Danby Dry Lake appears to have two intervals of high concentrations (>200 ppm)—one near the surface in core DAN-2, and one at approximately 100–115 m in depth in core DAN-1. Lithologically, there is no discernable difference in the sediments in these intervals shown in [8] that would explain the high Li concentrations.

5. Discussion

5.1. Hydrology of the Basins

The relatively constant correlation between alluvial fan water and basin-center brines for most elements suggests that evaporation is the main driver for the concentration of these elements. While some Ca and Sr are lost to carbonate, gypsum, and celestite precipitation in the alluvial fans and basin margin [27], the loss of Ca and Sr does not appear to change the ratio of these elements to Li in the BDL and CDL brines. The lack of ratio change, even after precipitation of gypsum may indicate input of an additional source of water, possibly geothermal in origin.
In order to further assess the geothermal influence in the Bristol Trough brines, geothermometry calculations were conducted to constrain the maximum temperature to which the brines were subjected (Table 1). The equilibrium-based Na–K geothermometer does not provide reliable temperatures below 150 °C. Therefore, although temperatures calculated using the Na–K geothermometer agree with the Mg-Li geothermometer, the Na–K geothermometer is used as a check of the Mg–Li geothermometer, because most calculated temperatures are below 150 °C.
Although it has been suggested that the empirical relation between Li and Mg should be linear due to unexplained reasons [54], the decreased solubility of dolomite and ankerite with increasing temperature and the relative incompatibility of Li released by progressive silicate mineral dissolution at higher temperatures has been suggested to decrease the Mg/Li ratio with increasing temperature [50]. Kharaka and Mariner [53] also suggested that due to the almost identical crystalline ion radii of Mg and Li, they can substitute for each other in amphiboles, pyroxenes, micas and clays. Although not explicitly suggested, this would mean that at higher temperatures, Mg is incorporated into these minerals and Li is released. In Bristol Trough chemical analyses, the Mg to Li concentration is not constant in all analyses and is different between the few alluvial fan samples and basin brine samples in BDL (Figure 9B). Alluvial fan waters in BDL give low reservoir temperatures of generally less than 100 °C (data in [12,13]), whereas brine samples yield reservoir temperatures of approximately 160–117 °C. This means that there is either a different source of water between the alluvial fan and basin center, or there are chemical reactions that are either releasing Li or sequestering Mg from the water. Given that other elements correlate relatively closely between the alluvial fan and brine samples, it appears that chemical reactions are more likely to explain the variations in Mg/Li ratios than different fluid sources. If this is correct, the higher reservoir temperatures in the basin center, may overestimate the maximum temperature to which the brines have been subjected.
There is some overlap in calculated temperatures between BDL and CDL brines, but none of the brines have been subjected to apparent temperatures greater than approximately 160 °C using the Mg–Li geothermometer, with slightly higher temperatures using equilibrium geothermometers at BDL (data and calculations in [12,13]). There appears to be a decrease in temperature from BDL to DDL of approximately 50–100 °C, although CDL temperatures only appear to be slightly lower than BDL. Deep Salton Sea geothermal temperatures are approximately 300–400 °C [42,43] and so if geothermal water is entering the basin, it is (1) coming from water that is not as hot as Salton Sea water, (2) coming from a shallower depth that has cooled substantially, or (3) mixing with cool alluvial groundwater. None of the brines in the Bristol Trough have current temperatures greater than approximately 25 °C, which suggests that if heating occurred, it was in the distant past.
Strontium isotopes were analyzed by [26] for celestite nodules on the north and south margin of BDL. The average 87Sr/86Sr ratio of 5 samples was 0.7122424 ± 0.0000941. This value is higher than strontium isotope measurements from Salton Sea geothermal fluids of 0.711225 ± 0.000179 [42,43,65] but is consistent with the strontium isotopic composition of global igneous rocks (granites and rhyolites) [66] that are widespread throughout the basin (Figure 2A). This indicates that strontium is likely sourced from the watershed rather than geothermal fluids, even though there is a strong correlation between Li and Sr (Figure 9A). Araoka [14] found that Li was likely sourced from geothermal fluids in Clayton Valley, Nevada, to the northeast of the Bristol Trough, but found that Sr was likely derived from the local watershed.
Dolginko [67] used fluid inclusions in unaltered halite crystals from the cores analyzed by [25,27] to show that the brine composition has not changed with depth within the top 500 m of sediment. This indicates that if the Li and Ca came from a geothermal source, it was present in the basin more than 3 million years ago [26,28,68], and the brine composition has not changed over time. This is also likely the case for CDL and DDL.

5.2. Groundwater Flow to Playa Center

For discharging playas in Death Valley, California, and Dixie Valley, Nevada, [24] suggested that permeability contrast between playa clays and alluvial fan sands and gravels causes groundwater from alluvial fans to discharge at the edge of the playa though phreatophytes and not flow to the playa center. They indicated that the playas are wet because of continual run-on of surface water to the playa during rainfall events that then seeps into the playa surface and evaporates concentrating the water over time. They further suggested that this process is true for all wet playas. However, this hypothesis is not consistent with salt precipitation patterns. As surface freshwater arrives on the playa it would dissolve any salts that had precipitated previously, but the composition of the incoming water would always be essentially the same and contain higher HCO3 concentrations, because HCO3 is the dominant anion in global river water [69]. This would mean that carbonate minerals would form first in the center of the playa. After carbonate precipitation gypsum would form and then halite. This sequence of precipitation would be vertically stacked in the basin. In Bristol Trough playas, this is not seen in any of the cores, and in fact this sequence is seen laterally most prominently in the BDL basin. Carbonates form mostly in vadose zone calcretes in the fans surrounding the basin, gypsum forms at the transition from alluvial fan to playa clays, and halite forms in the center of the basin (at BDL). Although there are minor amounts of calcite and gypsum in the playa clays (<10%) possibly from run on events, the bulk of these minerals are formed on the edges of the playa. As has been demonstrated in previous work (25–27) the lack of HCO3 and SO4 in the playa center brine at BDL and CDL must be caused by the precipitation of carbonate and sulfate minerals before they enter the center of the playa because these minerals are not present in the basin center.
If the playa center brine was formed solely from geothermal fluids similar to Salton Sea brines entering only in the center of the basin, the chemistry of the playa brines would have higher trace element concentrations (Pb, Fe, Mn, in particular) and likely higher Li concentrations. Unevaporated Salton Sea brines have 200–400 ppm Li [42]. In addition, although the Salton Sea brines appear chemically similar to the brines discussed here (Table 1), the milliequivalent ratio of Na:Ca in Salton Sea brines is approximately 1.7 whereas in BDL and CDL brines it is approximately 5 or higher. Finally, K and Mg concentrations Salton Sea brines are approximately 11–16 g/L and 20–74 mg/L, respectively, whereas Bristol Trough brines have K concentrations between <1 and 4.1 g/L and Mg concentrations between 0.5 and 3.5 g/L (data in [12,13]), which are much lower and the opposite of Salton Sea brines (Table 1). Precipitation of clays cannot account for these differences (see below). Lowenstein et al. [15] suggested that Long Valley Caldera springs contributed to the major ion composition of Searles lake in the past, but this geothermal water is not similar to Bristol Trough brines (Table 1). Geothermal water from the Long Valley Caldera is not a likely to be the source for the Bristol Trough brines because even during the wet Pleistocene epoch, the river system that started in the Long Valley Caldera and flowed to Death Valley did not overflow into Bristol Dry Lake [68].
It appears there is no individual source that can completely account for the chemistry of BDL and CDL brines. It is possible that there is a mixture of the different fresh water and geothermal sources. However, correlations of most solutes are consistent (Figure 8), indicating that the source(s) of the fluids come from the edge of the basins and not from the basin centers. Although the chemistry of the alluvial fan porewater is best characterized in the northern Bristol Trough, it is clear that there is little fresh water near BDL. Yet there is abundant fresh/brackish water in Fenner Valley and in the fans to the north of DDL. Based on the observation that the greatest salinity occurs at BDL and playa brines are progressively less saline from CDL to DDL, it appears that BDL is the only completely closed playa within the trough. Extensive halite deposits occur at BDL down to 500 m bls, whereas CDL and DDL only have limited halite within the upper 10 m of the surface [6,7,8,28]. This indicates that BDL brine has lost substantial Na and Cl to halite precipitation, whereas CDL and DDL brines have not, and that BDL has undergone closed basin evaporation to a greater extent than CDL and DDL.
The similarity in brine chemistry between BDL and CDL suggests that they either have been connected as one lake basin at certain times, or that there is a subsurface connection between the basins (or both). The difference in chemistry between DDL and CDL/BDL indicates that these basins are not connected and the source of ions for the DDL brine is different. The difference is either caused by differences in the surrounding rocks that contribute different ions to the brines in each basin, or by different water sources, such as geothermal water, that have contributed to the DDL brine. The lack of data at DDL makes it difficult to evaluate these possibilities. The presence of a slightly brackish groundwater below the DDL playa indicates that the playa may be open to the southeast and may never reach the same salinity as BDL or CDL. However, DDL is still a very saline brine, and so the openness of this playa is relatively small. It is not possible to calculate the openness of the basin without more data on groundwater flow rates and chemistry in unsampled parts of the basin, and the construction of a basin groundwater flow model.

5.3. Chemistry of Playa Sediments

Droste [70] analyzed clay samples from all the playas in the Bristol Trough (except Alkali Dry Lake) from deep cores drill in the 1950s and from data reported in [34]. The mineralogy of all three playas was similar, consisting mostly of montmorillinite (smectite)/illite clay mixtures with minor amounts of chlorite and kaolinite at all depths. He concluded that because of the similarity of composition and mineral assemblage at all depths and all playas, that the bulk of the sediment was derived from detrital material and that limited reactions had occurred in the clays even at depth. Rosen [26] analyzed 10 clay samples from BDL, in cores collected in the 1980s by Southern California Edison and found that these cores (drilled to >500 m and deeper than the cores analyzed by [70]), also showed little evidence of change in the mineralogical composition. Rosen [26] independently concluded that the clays were likely of detrital origin due to their similarity with depth. The new samples taken from the Standard Lithium cores confirm these previous studies and show that in general the mineralogy of the clays have not changed due to chemical reaction to depths of 500 m. Scanning electron microscope images of the samples show ragged edges on clay and mica grains further indicating that fine-grained material in the cores is mostly detrital (Figure 12). However, sorption reactions could be possible in the clays, and other mineral reactions could have occurred in non-clay portions of the sediment (feldspars, micas, and other accessory minerals).
The lithium concentrations in the sediments of all three playas are relatively low compared to Li in the brine. As with the brine, average Li concentrations in the sediment decrease from BDL to DDL, although some of the highest values in individual samples occur in DDL (Figure 11). Micas are present in all basins and although dissolution of Li from lepidolite micas is a possible source, it would likely be uniform across all the basins.
Tephra layers are another possible local source of Li and are found mostly in BDL sediments, but only 10 beds possibly exist in 500 m of sediment analyzed by [26,28,61] and most beds are less than 10 cm thick. In addition, tephrochronology measurements of the grains were performed on 11 tephra units to obtain ages for the tephras. With the exception of two samples, glass was unweathered [26]. Therefore, the release of Li from tephras within the basin is not likely to provide the bulk of the Li to the brine. However, Miocene volcanic rocks ring each basin and may provide a source.
If Li was coming from a deep geothermal source, Li concentrations might be greater within the deep sediment column. This does not appear to be the case (Figure 11), as BDL concentrations are relatively similar throughout the sediment column, CDL Li concentrations in the sediment are higher at the top of the sediment column, and DDL concentrations are variable, with a concentrated layer at the top of one core and another near the bottom of the other core. The sediment concentrations do not necessarily point to a geothermal source, but if brines are circulating, the source of the Li in the sediment may be difficult to determine. The ratios of the concentrations of major ions in the sediment samples at BDL are similar to the brine composition, and there are no geothermal tracers that appear elevated in the sediment data, although B and F were not analyzed (Table 2). However, in DDL, the lack of Li in the brine compared to the sediment concentrations, which are similar to BDL and CDL sediment concentrations, suggests that if the source was an ancient geothermal fluid, the remnant ions of this fluid have left the basin because of the openness of the basin, compared to BDL and CDL, which are more closed.

5.4. Origin of Calcium and Lithium

Calcium and Li concentrations are well correlated in the BDL and CDL brines, but not in the few brine samples from DDL. Although there are very few analyses or detections of lithium in alluvial fan waters, those that exist appear to correlate with Ca (Figure 9C, inset). The ratio of Li to Ca in the brines is slightly higher in the brines than in the alluvial fan water, but given the difficulties of measuring saline water, the ratios are similar, suggesting that water in the alluvial fans could be a source of Li. The reason that only some alluvial fan wells have milliequivalents Ca:HCO3 ratios greater than one is not clear, but there are several possible explanations: (1) there have simply been too few wells sampled in the alluvial fans to get an accurate picture of the overall composition of the alluvial fan water in the basins. This is particularly true of the south side of the playas, where there are no data. (2) The free circulation of BDL playa water back to the edge of the basin has provided the Ca from the playa center and mixed with the fresh water. However, this is unlikely to be true for CDL or DDL, where free circulation has not likely occurred. (3) Ion exchange reactions are occurring in the soil that releases Ca from non-carbonate minerals (i.e., clays and feldspars) without releasing HCO3. (4) There is a dilute deep source of geothermal water that mixes with cool alluvial fan water along faults at the edge of the basin or in the mountains. This water would have to either cool or occur in a small enough volume to not heat the shallow alluvial groundwater. Although it is not clear whether the high Ca water is coming from dilute deeply circulating fluids rising from faults or from ionic exchange reactions from rock weathering, it is clear that a previous study [9] suggesting that all the alluvial fan water flowing to Bristol and Cadiz playas has milliequivalent Ca:HCO3 ratios <1 is not accurate. If the alluvial fans did not provide groundwater to the playas, then the formation of groundwater-derived gypsum on the playa margin [23] could not occur. Some alluvial fan wells near the playa margin (wells 92, 93, 94, 118; Figure 3) have high Ca and SO4 concentrations and low HCO3 concentrations, indicating that water has not become saturated with gypsum. This type of water is only found near the playa margin and indicates that flow must move towards the playa where no HCO3 and SO4 remain due to calcite and gypsum precipitation.

6. Conclusions

The evidence for local sources or deep geothermal sources is not simple to unravel. While there are abundant volcanic rocks in all three basins (although somewhat less in Danby) that could provide lithium to the playas, and dissolution of feldspars or other rocks that could provide Ca, the inconsistency between Danby (low Li and Ca) and Cadiz and Bristol (high Li and Ca) make local sources difficult to establish. Given that the basins are >5 million years old, there is sufficient time for weathering to occur. No recent geothermal sources are present in the basins other than ~79,000-year-old Amboy Crater. The brines in all basins are relatively homogenous, indicating mixing within each basin, likely driven by density, and so there is no indication of higher concentrations at deep depths. However, Mg–Li geochronometers indicate that heating in Bristol and Cadiz Basins has occurred at some point, likely more than 3.5 million years ago.
Given that there is more consistency in the argument for a geothermal source, it appears that the source of lithium and calcium to Bristol and Cadiz playas likely comes from ancient geothermal sources that are at least 3.5 million years old. This conclusion is based on the consistency of Ca and Li concentrations regardless of the TDS concentrations of the solution and the fact that Danby playa, which is similar in watershed lithologies, age of the basin, and TDS concentrations, has low Li and Ca concentrations. Salton Sea-type geothermal fluids have been invoked by [9] as the source of the Ca and Li to the Bristol Trough brines, but the overall fluid composition of Salton Sea thermal fluids is different from the chemistry of the Bristol and Cadiz brines, especially with respect to K and Mg. Either the geothermal fluid source to the Bristol Trough has a different composition than the Salton Sea fluid, or mineral reactions have removed potassium and magnesium from the brine center. Because the clay minerals in Bristol Trough playa sediments indicate that no diagenetic reactions have occurred in the clays, it is more likely that the source geothermal fluid had a different composition. Lithium concentrations in playa sediments in all three basins are relatively low compared to brine concentrations and do not necessarily indicate a deep geothermal fluid is the source for lithium in the sediments because the lithium concentrations do not show any consistent concentration gradients from deep to shallow sediment.
Bristol Dry Lake is the only completely hydrologically closed basin of the three playas in the Bristol Trough. Evidence for this comes from the abundance of halite precipitated in the sediments of BDL and the lack of halite precipitation in the sediment column in Cadiz and Danby playas, the gradient of lower concentrations of TDS, Ca, and Li concentrations from Bristol to Danby playas, and the presence of a deep relatively freshwater aquifer below Danby playa. Cadiz Dry Lake is likely “more closed” than Danby Dry Lake. Cadiz groundwater (and some surface water) likely flows to Bristol Dry Lake intermittently, and Danby Dry Lake groundwater likely flows out of the basin to the south and east.
In BDL and CDL, the decrease in sulfate concentrations from the alluvial fans to basin-center brines indicates that groundwater from the alluvial fans does flow slowly (over thousands of years) to the playas in these basins, contrary to the hypothesis that alluvial fans only discharge at the playa margin and there is no connection between basin-center brines and alluvial fan water.
There are still some inconsistencies in the hydrology and chemistry of these playas and more hydrologic studies are needed on the margins of these playas, particularly on the southern margins, to better understand the source, flow paths, and concentration mechanisms of lithium and calcium in these playas.

Author Contributions

For research articles with several authors, a short paragraph specifying their individual contributions must be provided. The following statements should be used Conceptualization, M.R.R.; methodology, M.R.R., T.K., and K.C.; software, M.R.R.; validation, M.R.R. and T.K.; formal analysis, M.R.R., T.K., L.L.S. and K.C.; investigation, M.R.R., L.L.S., T.K., K.C., M.V., and R.S.; resources, M.V. and R.S.; data curation, M.R.R., T.K., M.V.; writing—original draft preparation, M.R.R.; writing—review and editing, M.R.R., L.L.S., T.K., K.C., M.V., and R.S.; visualization, M.R.R.; project administration, L.L.S. M.R.R.; funding acquisition, L.L.S., M.R.R. All authors have read and agreed to the published version of the manuscript. Please turn to the CRediT taxonomy for the term explanation.

Funding

Funding for this research was provided by the U.S. Geological Survey Mineral Resources Program and a Technical Assistance Agreement with Standard Lithium Ltd. The U.S. Geological Survey authors have no stake in the lithium exploration of these basins and the interpretations in this manuscript are based solely on the data available. Any use of trade, firm, or product names is for descriptive purposes only and does not imply endorsement by the U.S. Government.

Acknowledgments

The authors thank John Wallis for his professional work in drafting Figure 1, Figure 2, Figure 3, Figure 4 and Figure 5 of this manuscript. C. Justin Mayers provided GIS help in delineating watersheds and his help is also greatly appreciated. David Miller, the U.S. Geological Survey and journal reviewers provided important reviews of this manuscript and their insights have improved the manuscript considerably.

Conflicts of Interest

The authors declare no conflict of interest. The funders had no role in the design of the study; in the collection, analyses, or interpretation of data; or in the writing of the manuscript. However, Standard Lithium Ltd., could not allow publication of unpublished lithium brine data because of Canadian mining law.

References

  1. Bradley, D.C.; Stillings, L.L.; Jaskula, B.W.; Munk, L.; McCauley, A.D. Critical Mineral Resources of the United States—Economic and Environmental Geology and Prospects for Future Supply; Schulz, K.J., DeYoung, J.H., Jr., Seal, R.R., II, Bradley, D.C., Eds.; U.S. Geological Survey: Reston, VA, USA, 2017; pp. K1–K21. [CrossRef]
  2. Vine, J.D. (Ed.) Lithium Resources and Requirements by the Year 2000; U.S. Geological Survey: Reston, VA, USA, 1976; Volume 1005, p. 162.
  3. Vine, J.D. Where on Earth Is All the Lithium? U.S. Geological Survey: Reston, VA, USA, 1980; p. 107.
  4. Rosen, M.R. The importance of groundwater in playas: A review of playa classifications and the sedimentology and hydrology of playas. In Paleoclimate and Basin Evolution of Playa Systems; Rosen, M.R., Ed.; Geological Society of America: Boulder, CO, USA, 1994; Volume 289, pp. 1–18. [Google Scholar]
  5. Gardner, D.L. The Barstow-Bristol Trough central Mojave Desert, California. In Geology and mineral wealth of the California Desert; Fife, D.L., Brown, A.R., Eds.; South Coast Geological Society: Santa Ana, CA, USA, 1980; pp. 204–214. [Google Scholar]
  6. Calzia, J.P.; Moore, S.W. Geophysical, Lithologic, and Water-Quality Data from Cadiz Dry Lake, San Bernardino County, California; U.S. Geological Survey: Reston, VA, USA, 1980. [CrossRef]
  7. Calzia, J.P. Geophysical, Lithologic, and Water Quality Data from Bristol Dry Lake, San Bernardino, California; U.S. Geological Survey: Reston, VA, USA, 1991. [CrossRef]
  8. Calzia, J.P. Geophysical, Lithologic and Water Quality Data from Danby Dry Lake, San Bernardino County, California; U.S. Geological Survey: Reston, VA, USA, 1991. [CrossRef]
  9. Lowenstein, T.K.; Risacher, F. Closed basin brine evolution and the influence of Ca-Cl inflow waters: Death Valley and Bristol Dry Lake California, Qaidam Basin, China, and Salar de Atacama, Chile. Aquat. Geochem. 2009, 15, 71–94. [Google Scholar] [CrossRef]
  10. Gutierrez, C.; Bryant, W.; Saucedo, G.; Will, C. 2010 Geologic Map of California and Fault Activity Map; California Department of Conservation: Sacramento, CA, USA, 2010. Available online: https://www.conservation.ca.gov/cgs/Pages/Program-RGMP/2010_geologicmap.aspx (accessed on 19 March 2020).
  11. Garrett, D.E. Handbook of Lithium and Natural Calcium Chloride—Their Deposits, Processing, Uses, and Properties; Elsevier Academic Press: Amsterdam, The Netherlands, 2004; p. 476. [Google Scholar]
  12. Rosen, M.R. Supplementary Data S1 for Rosen et al. Li and Ca enrichment in the Bristol Dry Lake brine, California. Miner. Zenodo 2019. [Google Scholar] [CrossRef]
  13. Rosen, M.R. Groundwater Quality Data from Bristol and Cadiz Basins, San Bernardino County, California, USA; U.S. Geological Survey: Reston, VA, USA, 2020. [CrossRef]
  14. Araoka, D.; Kawahata, H.; Takagi, T.; Watanabe, Y.; Nishimura, K.; Nishio, Y. Lithium and strontium isotopic systematics in playas in Nevada, USA: Constraints on the origin of lithium. Min. Depos. 2014, 49, 371–379. [Google Scholar] [CrossRef]
  15. Lowenstein, T.K.; Dolginko, L.A.C.; and García-Veigas, J. Influence of magmatic-hydrothermal activity on brine evolution in closed basins: Searles Lake, California. Geol. Soc. Am. Bull. 2016, 128, 1555–1568. [Google Scholar] [CrossRef]
  16. Smith, G.I. Origin of lithium and other components in the Searles Lake evaporites, California. In Lithium Resources and Requirements by the Year 2000; Vine, O.D., Ed.; U.S. Geological Survey: Reston, VA, USA, 1976; Volume 1005, pp. 92–103. [Google Scholar]
  17. Yu, J.-Q.; Gao, C.-L.; Cheng, A.-Y.; Liu, Y.; Zhang, L.; He, X.-H. Geomorphic, hydroclimatic and hydrothermal controls on the formation of lithium brine deposits in the Qaidam Basin, northern Tibetan Plateau, China. Ore Geol. Rev. 2013, 50, 171–183. [Google Scholar] [CrossRef]
  18. Rosen, M.R.; Jones, S. Controls on the groundwater composition of the Wanaka and Wakatipu basins, Central Otago, New Zealand. Hydrogeol. J. 1998, 6, 264–281. [Google Scholar]
  19. Hardie, L.A. The roles of rifting and hydrothermal CaCl2 brines in the origin of potash evaporites: An hypothesis. Am. J. Sci. 1990, 290, 43–106. [Google Scholar] [CrossRef]
  20. Toner, J.D.; Sletten, R.S. The formation of Ca-Cl-rich groundwaters in the Dry Valleys of Antarctica: Field measurements and modeling of reactive transport. Geochim. Cosmochim. Acta 2013, 110, 84–105. [Google Scholar] [CrossRef]
  21. Nurmi, P.A.; Ilmo, T.K.; Lahermo, W. Geochemistry and origin of saline groundwaters in the Fennoscandian shield. Appl. Geochem. 1988, 3, 185–203. [Google Scholar] [CrossRef]
  22. Lowenstein, T.K.; Hardie, L.A.; Timofeeff, M.N.; Demicco, R.V. Secular variation in seawater chemistry and the origin of calcium chloride basinal brines. Geology 2003, 31, 857–860. [Google Scholar] [CrossRef]
  23. Phillips, F.M. Cosmogenic 36Cl ages of Quaternary basalt flows in the Mojave Desert, California, USA. Geomorphology 2003, 53, 199–208. [Google Scholar] [CrossRef]
  24. Jackson, T.R.; Halford, K.J.; Gardner, P.M.; Garcia, A. Evaluating Micrometeorological Estimates of Groundwater Discharge from Great Basin Desert Playas. Groundwater 2018, 56, 909–920. [Google Scholar] [CrossRef] [PubMed]
  25. Handford, C.R. Sedimentology and evaporite genesis in a Holocene continental-sabkha playa Basin-Bristol Dry Lake, California. Sedimentology 1982, 29, 239–253. [Google Scholar] [CrossRef]
  26. Rosen, M.R. Sedimentologic, geochemical, and hydrologic evolution of an intracontinental, closed-basin playa (Bristol Dry Lake, CA): A model for playa Development and Its Implications for Paleoclimate. Ph.D. Thesis, University of Texas at Austin, Austin, TX, USA, 1989. Available online: http://hdl.handle.net/2152/61385 (accessed on 19 March 2020).
  27. Rosen, M.R.; Warren, J.K. The origin and significance of groundwater seepage gypsum from Bristol Dry Lake Ca., USA. Sedimentology 1990, 37, 983–996. [Google Scholar] [CrossRef]
  28. Rosen, M.R. Sedimentologic and geochemical constraints on the hydrologic evolution of Bristol Dry Lake, California, USA. Palaeogeogr. Palaeoclim. Palaeoecol. 1991, 84, 229–257. [Google Scholar] [CrossRef]
  29. Garfunkel, Z. Model for Late Cenozoic tectonic history of the Mojave Desert, California, and for its relation to adjacent regions. Geol. Soc. Am. Bull. 1974, 85, 1931–1944. [Google Scholar] [CrossRef]
  30. Dokka, R.K.; Travis, C.J. Late Cenozoic strike-slip faulting in the Mojave Desert, California. Tectonics 1990, 9, 311–340. [Google Scholar] [CrossRef]
  31. Glazner, A.F.; Bartley, J.M.; Walker, J.D. Magnitude and significance of Miocene crustal extension in the central Mojave Desert, California. Geology 1989, 17, 50–53. [Google Scholar] [CrossRef]
  32. Smith, P. New evidence for a Pliocene marine embayment along the Lower Colorado River area, California and Arizona. Geol. Soc. Am. Bull. 1970, 81, 1411–1420. [Google Scholar] [CrossRef]
  33. Miller, D.M.; Reynolds, R.E.; Bright, J.E.; Starratt, S.W. Bouse Formation in the Bristol basin near Amboy, California, USA. Geosphere 2014, 10, 462–475. [Google Scholar] [CrossRef]
  34. Bassett, A.M.; Kupfer, D.H.; Barstow, F.C. Core logs from Bristol, Cadiz, and Danby Dry Lakes, San Bernardino County, California. U.S. Geological Survey: Reston, VA, USA, 1959; pp. 97–138. [Google Scholar]
  35. Mohorich, L.M. Geothermal resources of the California Desert-a summary review: In Geology and Mineral Wealth of the California Desert; Fife, D.L., Brown, A.R., Eds.; South Coast Geological Society: Santa Ana, CA, USA, 1980; pp. 171–189. [Google Scholar]
  36. Gale, G.K. Geology of the saline deposits, Bristol Dry Lake, San Bernardino County, California. Spec. Rep. Calif. State Min. Bur. 1951, 13, 22. [Google Scholar]
  37. Brown, H. Geology, genesis and mining of pharmaceutical and food grade calcium carbonate at the Amboy Limestone Quarry. In Land of Lost Lakes. The 2003 Desert Symposium Field Trip; Reynolds, R.E., Ed.; California State University, Desert Studies Consortium: Long Beach, CA, USA, 2003; pp. 49–56. [Google Scholar]
  38. Shafer, R.A. Report on Investigations of Conditions Which Determine the Potentials for Development in the Desert Valleys of Eastern San Bernardino County, California; Unpublished Engineering Department Report; Southern California Edison Co.: Rosemead, CA, USA, 1964; p. 172. [Google Scholar]
  39. Thompson, D.G. The Mojave Desert Region, California; U.S. Geological Survey: Reston, VA, USA, 1929; Volume 578, p. 759.
  40. CH2M Hill. Cadiz Groundwater Conservation and Storage Project. July 2010. Available online: https://www.cadizwaterproject.com/wp-content/uploads/2015/07/4_09_Hydrology.pdf (accessed on 19 March 2020).
  41. Hunt, G.S. Ground Water Geology of the Bristol and Cadiz Valleys, San Bernardino County, California. Master’s Thesis, University of Southern California, Los Angeles, CA, USA, 1966; p. 76. [Google Scholar]
  42. California Department of Water Resources. Geothermal Wastes and the Water Resources of the Salton Sea Area; Department of Water Resources: Sacramento, CA, USA, 1970; p. 123. [Google Scholar]
  43. Williams, A.E.; McKibben, M.A. A brine interface in the Salton Sea Geothermal System, California: Fluid geochemical and isotopic characteristics. Geochim. Cosmochim. Acta 1989, 53, 1905–1920. [Google Scholar] [CrossRef]
  44. Howle, J.F.; Evans, W.C.; Galloway, D.L.; Hsieh, P.A.; Hurwitz, S.; Smith, G.A.; Nawikas, J. Hydraulic, Geochemical, and Thermal Monitoring of an Aquifer System in the Vicinity of Mammoth Lakes, Mono County, California, 2015–2017; U.S. Geological Survey: Reston, VA, USA, 2019; p. 90. [CrossRef]
  45. Duffy, C.J.; Al-Hassan, S. Groundwater circulation in a closed desert basin: Topographic scaling and climatic forcing. Water Resour. Res. 1988, 24, 1675–1688. [Google Scholar] [CrossRef]
  46. Neal, J.T. (Ed.) Playas and Dried Lakes, Benchmark Papers in Geology, Dowden; Hutchinson and Ross, Inc.: Stroudsburg, PA, USA, 1975; pp. 1–5. [Google Scholar]
  47. Wood, W.W.; Sanford, W.E. Ground-water control of evaporite deposition. Econ. Geol. 1990, 85, 1226–1235. [Google Scholar] [CrossRef]
  48. Bedford, D.R.; Miller, D.M.; Phelps, G.A. Surficial Geologic Map of the Amboy 30′ × 60′ Quadrangle, San Bernardino County, California; U.S. Geological Survey: Reston, VA, USA, 2010.
  49. Higgins, C.T. Geothermal resources of California. California Geological Map Series, Map No. 4, Division of Mines and Geology; California Department of Conservation: Sacramento, CA, USA, 1980.
  50. Roberts, B.J. Geothermal Resource of the United States: Locations of Identified Hydrothermal Sites and Favorability of Deep Enhanced Geothermal Systems (EGS); National Renewable Energy Laboratory for the US Department of Energy: Golden, CO, USA, 2009. Available online: https://www.nrel.gov/gis/assets/images/geothermal-identified-hydrothermal-and-egs.jpg (accessed on 19 March 2020).
  51. Hereford, R.; Webb, R.H.; Longpré, C.I. Precipitation history and ecosystem response to multidecadal precipitation variability in the Mojave Desert region, 1893–2001. J. Arid Environ. 2006, 67, 13–34. [Google Scholar] [CrossRef]
  52. Fournier, R.O. A revised equation for the Na/K geothermometer. Geotherm. Resour. Counc. Trans. 1979, 3, 221–224. [Google Scholar]
  53. Kharaka, Y.K.; Mariner, R.H. Chemical geothermometers and their application to formation waters from sedimentary basins. In Thermal History of Sedimentary Basins; Naeser, N.D., McCulloh, T.H., Eds.; Springer: New York, NY, USA, 1989; pp. 99–117. [Google Scholar]
  54. Land, L.S.; MacPherson, G.L. Geothermometry from brine analysis: Lessons from the Gulf Coast, USA. Appl. Geochem. 1992, 7, 333–340. [Google Scholar] [CrossRef]
  55. Eberl, D.D. User Guide to RockJock—A Program for Determining Quantitative Mineralogy from X-ray Diffraction Data; U.S. Geological Survey: Reston, VA, USA, 2003; p. 47.
  56. Kane, T.J.; Campbell, K.M.; Rosen, M.R. X-Ray Diffraction Data for Bulk Sediment and Clay Separations Taken from Cores from Bristol Dry Lake, California and Geothermal Springs from Paoha Island (Mono Lake), California; U.S. Geological Survey: Reston, VA, USA, 2019. [CrossRef]
  57. Goldberg, S. Reanalysis of boron adsorption on soils and soil minerals using the constant capacitance model. Soil Sci. Soc. Am. J. 1999, 63, 823–829. [Google Scholar] [CrossRef]
  58. Keren, R.; Gast, R.G. pH-dependent boron adsorption by montmorillonite hydroxy-aluminum complexes. Soil Sci. Soc. Am. J. 1983, 47, 1116–1121. [Google Scholar] [CrossRef]
  59. Cody, R.D. Adsorption and the reliability of trace elements as environment indicators for shales. J. Sediment. Petrol. 1971, 41, 461–471. [Google Scholar]
  60. Rao, N. Fluoride and environment—A review. In Proceedings of the Third International Conference on Environment and Health, Chennai, India, 15–17 December 2003; Bunch, M.J., Madha Suresh, V., Vasantha Kumaran, T., Eds.; Department of Geography, University of Madras: Chennai, India; Faculty of Environmental Studies, York University: Toronto, ON, Canada, 2003; pp. 386–399. Available online: http://www.yorku.ca/bunchmj/ICEH/proceedings/Rao_N_ICEH_papers_386to399.pdf (accessed on 19 March 2020).
  61. Rosen, M.R. Sedimentology, stratigraphy, and hydrochemistry of Bristol Dry Lake, California, USA. In Lake Basins Through Time and Space; Gierlowski-Kordesch, E., Kelts, K., Eds.; AAPG Studies in Geology: Tulsa, OK, USA, 2000; pp. 597–604. [Google Scholar]
  62. Vredenburgh, L.M. Salt production, Danby Dry Lake San Bernardino County, California. In Not a Drop to Drink; Reynolds, R.E., Ed.; California State University Desert Studies Center: Baker, CA, USA, 2014; pp. 60–62. [Google Scholar]
  63. Reynolds, R.E.; Schweich, T.A. Danby Playa: Ringed with salty questions. In Not a Drop to Drink; Reynolds, R.E., Ed.; California State University Desert Studies Center: Baker, CA, USA, 2014; pp. 63–67. [Google Scholar]
  64. Christidis, G.E.; Koutsopoulou, E.; Bish, D. A simple approach to the identification of trioctahedral smectites by X-ray diffraction. Clay Miner. 2013, 48, 687–696. [Google Scholar] [CrossRef]
  65. Doe, B.R.; Hedge, C.E.; White, D.E. Preliminary investigation of the source of lead and strontium in deep geothermal brines underlying the Salton Sea geothermal area. Econ. Geol. 1966, 61, 462–485. [Google Scholar] [CrossRef]
  66. Bataille, C.P.; Willis, A.; Yang, X.; Liu, X.-M. Continental igneous rock composition: A major control of past global chemical weathering. Sci. Adv. 2017, 3, e1602183. [Google Scholar] [CrossRef] [PubMed] [Green Version]
  67. Dolginko, L.A.C. The influence of magmatic activity on brine evolution in closed basins: Searles Lake, California, and Bristol Dry Lake, California. Master’s Thesis, State University of New York at Binghamton, Binghamton, NY, USA, 2014; p. 164. [Google Scholar]
  68. Brown, W.J.; Rosen, M.R. Was there a Pliocene-Pleistocene fluvial-lacustrine connection between Death Valley and the Colorado River? Quat. Res. 1995, 43, 286–296. [Google Scholar] [CrossRef]
  69. Livingstone, D.A. Chemical composition of Rivers and Lakes. In Data of Geochemistry, 6th ed.; Chapter G. US Geological Survey Prof. Paper 440-G; Fleischer, M., Ed.; U.S. Geological Survey: Reston, VA, USA, 1963; p. 64. [Google Scholar]
  70. Droste, J.B. Clay minerals in sediments of Owens, China, Searles, Panamint, Bristol, Cadiz, and Danby lake basins, California. Geol. Soc. Am. Bull. 1961, 72, 1713–1722. [Google Scholar] [CrossRef]
Figure 1. Location map showing watershed boundaries and known wells and coring locations in the Bristol Trough. The ancestral Bristol Basin watershed includes the area before Amboy Crater erupted (approximately 80,000 years ago) and the current Bristol Basin watershed excludes the area cut off by the Amboy Crater lava flows.
Minerals 10 00284 g001
Figure 2. (A) Geologic map of the Bristol Trough showing well locations and watershed outlines. Key to the map is Figure 2B. Geologic base map from [10]. (B) Geologic key to formation names, rock types, and faults is shown in Figure 2A.
Minerals 10 00284 g002aMinerals 10 00284 g002b
Figure 3. Bristol Dry Lake watershed showing locations of wells, springs, and cores known or sampled for this study. Numbers refer to well chemical data found in (data in [12,13]). Wells and springs marked with red outlines have chemical compositions where the milliequivalent Ca:HCO3 ratio is <1.
Minerals 10 00284 g003
Figure 4. Cadiz Dry Lake watershed showing locations of wells, springs, and cores known or sampled for this study. Numbers refer to well chemical data found in (data in [12,13]). Wells and springs with red ring around them show the chemical composition of the groundwater where the milliequivalent Ca:HCO3 ratio is <1.
Minerals 10 00284 g004
Figure 5. Danby Dry Lake watershed showing locations of wells, springs, and cores known or sampled for this study. Numbers refer to well chemical data found in (data in [12,13]). Wells and springs with red ring around them show the chemical composition of the groundwater where the milliequivalent Ca:HCO3 ratio is <1.
Minerals 10 00284 g005
Figure 6. Piper diagram of all data with complete major ion concentrations. Bristol and Cadiz Dry Lake brines plot at the extreme end of the Cl portions of the anion portions of the diagram, but Danby Dry Lake (DDL) brine plots where SO4 is more prevalent. Alluvial fan and marginal water (blue points) show higher concentrations of HCO3 and SO4, but cations plot on a relative mixing line between Na dominated solutions and Na + Ca dominated solutions. There appears to be two mixing lines (red arrows) for alluvial fan water cations (triangle on left), those with more Mg and those with more Ca.
Minerals 10 00284 g006
Figure 7. Correlations of (A) Ca and HCO3 as milliequivalents per liter (meq/L), and (B) Ca and SO4 (meq/L) for alluvial fan wells in the Bristol Trough. The red dashed line represents equal concentrations in meq/L. Sampling points above the red dashed line in 7A have Ca > HCO3 and Ca > SO4 in 7B, and points below the line have Ca < HCO3 and Ca < SO4 in 7A and 7B, respectively.
Minerals 10 00284 g007
Figure 8. Chemical relations between (A) strontium and calcium, (B) sodium and calcium, (C) potassium and sodium, and (D) magnesium and calcium. Insets show lower concentration data in alluvial fan and basin margin wells (note change in concentration units). Many alluvial fan wells do not have trace element data.
Minerals 10 00284 g008
Figure 9. Chemical relations between lithium and (A) strontium, (B) magnesium, (C) calcium, and (D) sodium in historical data. Red dashed lines show trends and are not correlation lines. Insets show lower concentration data in alluvial fan and basin margin wells. Many alluvial fan wells do not have trace element data. Salton Sea geothermal well is show for comparison in Figure 8B. The temperature recorded from this well was 300 °C [42].
Minerals 10 00284 g009
Figure 10. Fluoride (F) plotted against boron (B) for historic brine and alluvial fan well measurements. No correlation is evident between F and B, and brine concentrations are similar or lower than alluvial fan concentrations in all basins for F. Boron concentrations are higher in the CDL and DDL brines than alluvial fan water, but not at BDL. New sampling of Standard Lithium wells did not include fluoride or boron.
Minerals 10 00284 g010
Figure 11. Lithium concentrations in bulk sediment from Bristol, Cadiz and Danby Dry Lake cores. Data from Cadiz and Danby Dry Lakes are from [6,8], respectively. Wells plotted are numbered in Figure 3, Figure 4 and Figure 5 as: BDL, samples from wells 10, 13–16; CDL well CAD-1, well 104; and DDL wells; DAN-1, well 113, DAN-2, well 114. Data from Bristol Dry Lake are from this study.
Minerals 10 00284 g011
Figure 12. Scanning electron microscope image of Sample DH-2, 16 m in depth. The image is mostly of clays and micas (larger grains). Notice the ragged edges of almost all grains, indicating weathering and transport and little, if any, diagenetic growth of minerals.
Minerals 10 00284 g012
Table 1. Major features of the dry lakes in the Barstow-Bristol Trough. Other geothermal waters from the region are included for comparison.
CharacteristicBristol Dry Lake BrineCadiz Dry Lake BrineDanby Dry Lake BrineSalton Sea Geothermal WellLong Valley Geothermal Springs and WellsReferences
Watershed size (km2)Historic: 3130
Current: 2146
42442265--This paper
Brine typeNa–Ca–ClNa–Ca–ClNa–ClNa–Ca–ClNa–HCO3–Cl[6,7,8,26,28,42,43,44]
Average
Maximum
Total dissolved solids (g/L) in basin brines
259
357
255
375
128
187
-
387
-
0.74
This paper
Maximum calcium concentration
(g/L) in basin brines
56400.4400.04[6,7,8,26,28,42], this paper
K:Mg ratio (meq/L)0.2–1.40.3–1.31.0–3.8 2.3– >500138This paper
Maximum lithium
Maximum boron
Maximum fluoride concentration (mg/L)
In basin brines
110
8.8
1.8
80
14
1.6
4.1
3.9
6.4
400
380
18
3.2
11.1
11.4
[6,7,8,26,28,42,44]
Percentage of halite by volume in cores from basin centers 40%<1%; one 1 m thick bed near the surface<1%; three <1 m thick beds near the surface--This paper
Greatest depth of drilling in sediments in the basin * (m)5371522681000>200[6,7,8,34,43,44]
Range of brine temperatures based on Mg:Li and Na:K geothermometry (°C)Mg–Li: 161–152
Na–K: 192– <150
Mg–Li: 153–132
Na–K: <150
Mg–Li: 5–107
Na–K: <150
200–340 **Mg–Li: 220
Na–K: 222
This paper, data from [44] for Long Valley
Bouse Formation presentOne shoreline outcrop 200 m above playaIn coreIn core--[32,33,34]
* None of the basins have been drilled to basement; ** measured temperature [42,43].
Table 2. Selected major and trace element chemistry of bulk sediment samples from Bristol Dry Lake (complete analyses can be found in [12].
CoreDepth (m)Li (ppm)Sr (ppm)Al (%)Ca (%)K (%)Mg (%)Na (%)
DH-2 15–171506174.674.811.971.3410.3
DH-2 107–1091946975.64.922.461.786.7
DH-2 198–2001164295.263.112.181.4613.6
DH-5 12–141317495.725.442.561.246.78
DH-5 235–2371116333.935.951.820.9112.8
DH-5 300–3021064953.644.831.650.8714.8
DH-5A 300–30217.81820.871.030.390.1432.7
DH-6A 15–1717226106.375.122.651.494.06
DH-6 98–100452501.342.480.620.3228.1
DH-6A 300–3021577375.865.032.661.477.26
Table 3. Mineral composition of Bristol Dry Lake sediments from X-ray diffraction (data from [56]).
Sample Name:DH2 50-55DH2 350-355DH2 650-655DH5 40-45DH5 40-45 DuplicateDH5 770-775DH5 985-990DH5A 985-990DH6A 50-55DH6 320-325DH6A 985-990
Depth of Sample (m)15–17107–109198–20012–1412–14235–237300–302300–30215–1798–100300–302
Mineral wt %
Non-clays
Quartz7.45.86.113.611.413.411.215.514.314.212.4
K-feldspar20.517.416.126.826.125.324.536.438.827.318.0
Plagioclase3.51.72.46.77.75.46.011.39.16.81.8
Calcite7.09.56.78.48.57.07.54.85.17.35.2
Halite1.10.12.00.30.40.80.40.60.40.70.5
Anhydrite1.33.00.10.50.511.78.55.51.311.713.8
Gypsum5.60.00.03.64.60.00.00.01.60.00.2
Amphibole2.11.81.23.03.03.12.23.12.22.80.1
Total non-clays48.439.334.663.062.266.760.377.272.870.851.8
Clays
Kaolin group0.51.92.51.90.01.20.40.20.00.71.4
Smectite group20.821.223.113.910.312.816.09.213.312.422.0
Illite group21.831.734.015.717.611.714.07.94.210.621.0
Mica group7.05.04.73.88.76.78.65.38.44.22.1
Chlorite1.50.91.11.71.30.90.80.31.21.31.6
Total clays51.660.765.437.037.833.339.722.827.229.248.2

