Article

Does the Methylene Blue Test Give Equally Satisfactory Results in All Studied Igneous Rocks Relative to the Identification of Swelling Clay Minerals?

by
Panagiota P. Giannakopoulou
1,*,
Petros Petrounias
1,
Aikaterini Rogkala
1,
Paraskevi Lampropoulou
1,
Eleni Gianni
1,
Dimitrios Papoulis
1,
Petros Koutsovitis
1,
Basilios Tsikouras
2 and
Konstantin Hatzipanagiotou
1
1
Section of Earth Materials, Department of Geology, University of Patras, 265 04 Patras, Greece
2
Physical and Geological Sciences, Faculty of Science, Universiti Brunei Darussalam, Jalan Tungku Link, Gadong BE1410, Brunei Darussalam
*
Author to whom correspondence should be addressed.
Minerals 2020, 10(3), 283; https://doi.org/10.3390/min10030283
Submission received: 28 February 2020 / Revised: 16 March 2020 / Accepted: 18 March 2020 / Published: 21 March 2020
(This article belongs to the Special Issue Applied Petrography of Construction Materials)

Abstract

:
The presence or the absence of swelling clay minerals in rocks, which are used in various construction applications, constitutes a determinant factor for their strength, and consequently, in their general behavior in various construction applications, as they have the ability to swell up to 400 times of their usual volume, causing failures to any application in which they participate. The aim of this study is to respond to the question of whether the empirical method of methylene blue yields equally safe and correct results in different types of igneous rocks and if not, which is the determining factor affecting the results. The answer to this complex question is feasible by investigating the microscopic structure and the mineralogy of the studied rocks, and particularly, using the content of specific phyllosilicate minerals which may be related or not with the methylene blue values. According to the results, the methylene blue test seems to work correctly for the intermediate (Group I) and mafic (Group II) examined rocks, but it seems to be wrong for the highly serpentinized ultramafic rocks (up to 70% of serpentine) (Group III).

1. Introduction

Clay minerals are amongst the constituents of rocks which are used as aggregates and belong to the silicate class (phyllosilicate minerals), whereas tetrahedron rings are linked by shared oxygens to other rings in a two-dimensional plane which forms a sheet-like structure [1,2]. These tetrahedral sheets are held together by weakly-bonded cations and usually contain entrapped water molecules between the sheets [3,4]. This type of mineral contains considerable amounts of water caged, often 70–90%, between their sheets. Clay minerals are classified into: the kaolinite, the smectite, the illite, the chlorite and the serpentine group. More specifically, the 1:1 clay minerals, that include the minerals of kaolinite and serpentine groups, are composed by the repetition of one tetrahedral silicate sheet connected to octahedral aluminium hydroxide sheet-creating layers. The silicate-gibbsite layers are tightly bonded one to the other via H-bonds and van der Waals interactions [1]. The 2:1 clay consists of an octahedral sheet sandwiched between two tetrahedral sheets like smectite and vermiculite. Then, the octahedral sheets contain metal ions and based on these ions, clay minerals are classified into two groups: dioctahedral and trioctahedral. Divalent metal ions like Fe2+ and Mg2+ lead to the formation of a trioctahedral clay and trivalent metal ions like Al3+ form a dioctahedral clay.
The illite group belongs to dioctahedral 2:1 clay minerals with non-exchangeable inter-layer cations. The smectite group belongs to both dioctahedral and trioctahedral 2:1 clay minerals with a negatively charged layer. For the neutralization of the structure, interlayered cations are present in the minerals. Water molecules in varying amounts are also present in these minerals for the hydration of the interlayer cations and due to the clay–water interactions. The members within this group, like saponite that belongs to the trioctahedral 2:1 type, vary predominantly in chemical and water content. Generally, smectite presents the smallest size among all the other clay minerals and has the tendency to be concentrated in the fine clay (<0.2 μm) fraction of aggregates’ fines and coatings. Their size translates to a higher surface area, which usually varies between 600 and 800 m2/g [5].
The chlorite group contains a negatively charged layer composed of two tetrahedral sheets sandwiching an octahedral sheet, which is connected via H-bonds to a separate positive octahedral sheet placed between the interlayer spaces [6].
Serpentine constitutes a group of Mg-rich 1:1 trioctahedral layer minerals (Mg6(Si4O10)(OH)8). Its unit cell is composed of four crystallographically distinct O–H groups, which are divided into two different topologies relative to (OH) position, whereas three of them are located at the inner surface between two layers while the other is cited inside the layer. Serpentine consists of three polymorphs: antigorite, lizardite and chrysotile. Chrysotile display cylindrical morphology, antigorite display a structure characterized as wavy. These morphological features can possibly be related with the degree of fit between the lateral dimensions of the tetrahedral and octahedral sheets. Lizardite, in addition, presents as platy and usually contains a small amount of substitution of aluminum or ferric iron for both silicon and magnesium, which seems to be the basic reason for the platy morphology of lizardite. Planar polytypes of the trioctahedral species are far more complicated than those of dioctahedral ones, owing to the fact that the trioctahedral silicate layer displays higher symmetry because all octahedral cationic sites are occupied [7,8,9,10,11].
Certain clay minerals are characterized as inert (1:1 clay minerals) and hence they do not cause harmful effects on constructions such as concrete performance. On the other hand, even the presence of other clays, such as swelling clay minerals (2:1 clay minerals), may negatively influence the mechanical behavior of concrete [12]. A unique feature of swelling clay minerals is their ability to swell in the presence of water. Swelling clay minerals are composed by small, negatively charged plates. Clay particles attract molecules of water when they are slightly polarized. This may lead to the possibility of a drastic volume change in the case that water is absorbed. In construction applications which are performed in soils rich in swelling clay minerals like smectite, engineers have often faced difficulties. This may happen due to the uneven movement induced by the shrink-swell phenomena in these soils and therefore, can result in failures in the applications. Two basic types of swelling can be observed in clay minerals when exposed to water molecules: osmotic swelling and inner crystallines swelling [13].
For avoiding failures in construction applications, it is really important to identify which clay minerals are contained in the aggregates, whereas the swelling properties of them may lead to slope instability. X-ray diffraction (XRD) constitutes the most satisfactory technique to identify and quantify the mineralogy of rocks. Especially, the Rietveld refinement method in XRD quantitative phase analysis exhibited advantages over other analytical methods [14,15,16,17,18]. Among the methods used to identify clay minerals and of swelling clay minerals in aggregates, the methylene blue test has become a common method as it is easily usable and does not need particular equipment when giving an indication of the “cleanliness” of rocks [19]. This method has been performed for clay mineral characterization in clay sciences such as engineering geology as well as often in aggregate mines. The methylene blue test has been used for determining the cation exchange capacity (CEC) and the specific surface area (SSA). Hang and Brindley [20] examined kaolinite, illite and montmorillonite using different measurements and concluded that methylene blue absorption could act to estimate the surface areas as well as the exchange capacities of clay minerals. Chiappone et al. [21] used two MB methods AFNOR (Association Française de Normalisation) and ASTM (American Society for Testing and Materials) to estimate the presence of clay minerals in soils. Yukselen and Kaya [22] evaluated the suitability of the methylene blue test for the determination of the surface area, CEC and swelling potential of clayey soils. For the identification of the activity and the swelling possibility of soils and clay-bearing rocks, several MB tests have been used. The MB test has been used as a quick test to estimate the quality of foundry sand in foundries. The main reason that MB is often used for the estimation of rock swelling is because MB is adsorbed very selectively by ion exchange, which has the swelling clay minerals even in minor concentrations and less selectively by van der Waals interactions. Upon contact with the MB solution molecules, the cations hydrate and orient themselves on a plane halfway between the two layers. This causes a widening of the spacing between the layers and hence results in swelling when MB solution is introduced. As a result, the layer spacing is reduced upon drying, thus resulting in shrinkage. The MB test has also been used for the estimation of the quality of basaltic tuffs as aggregates as well as for the indication of swelling clay minerals in various soils and rocks [23]. As technology evolves across all disciplines of science, new uses of rocks come up, new materials are used in various construction applications and standards and testing methodologies are modified so as to obtain the safest results and conclusions regarding the behavior of various materials in different applications. This is why it is commonly necessary to modify a test such as the methylene blue test depending on each condition.
The present study focuses on responding to a fundamental question concerning the methylene blue test and more specifically, if this test shows equally accurate and satisfactory results in each type of igneous rock used as aggregates. The answer to this complex question is feasible by investigating the rocks through a combination of modern petrographic analytical methods.

2. Materials and Methods
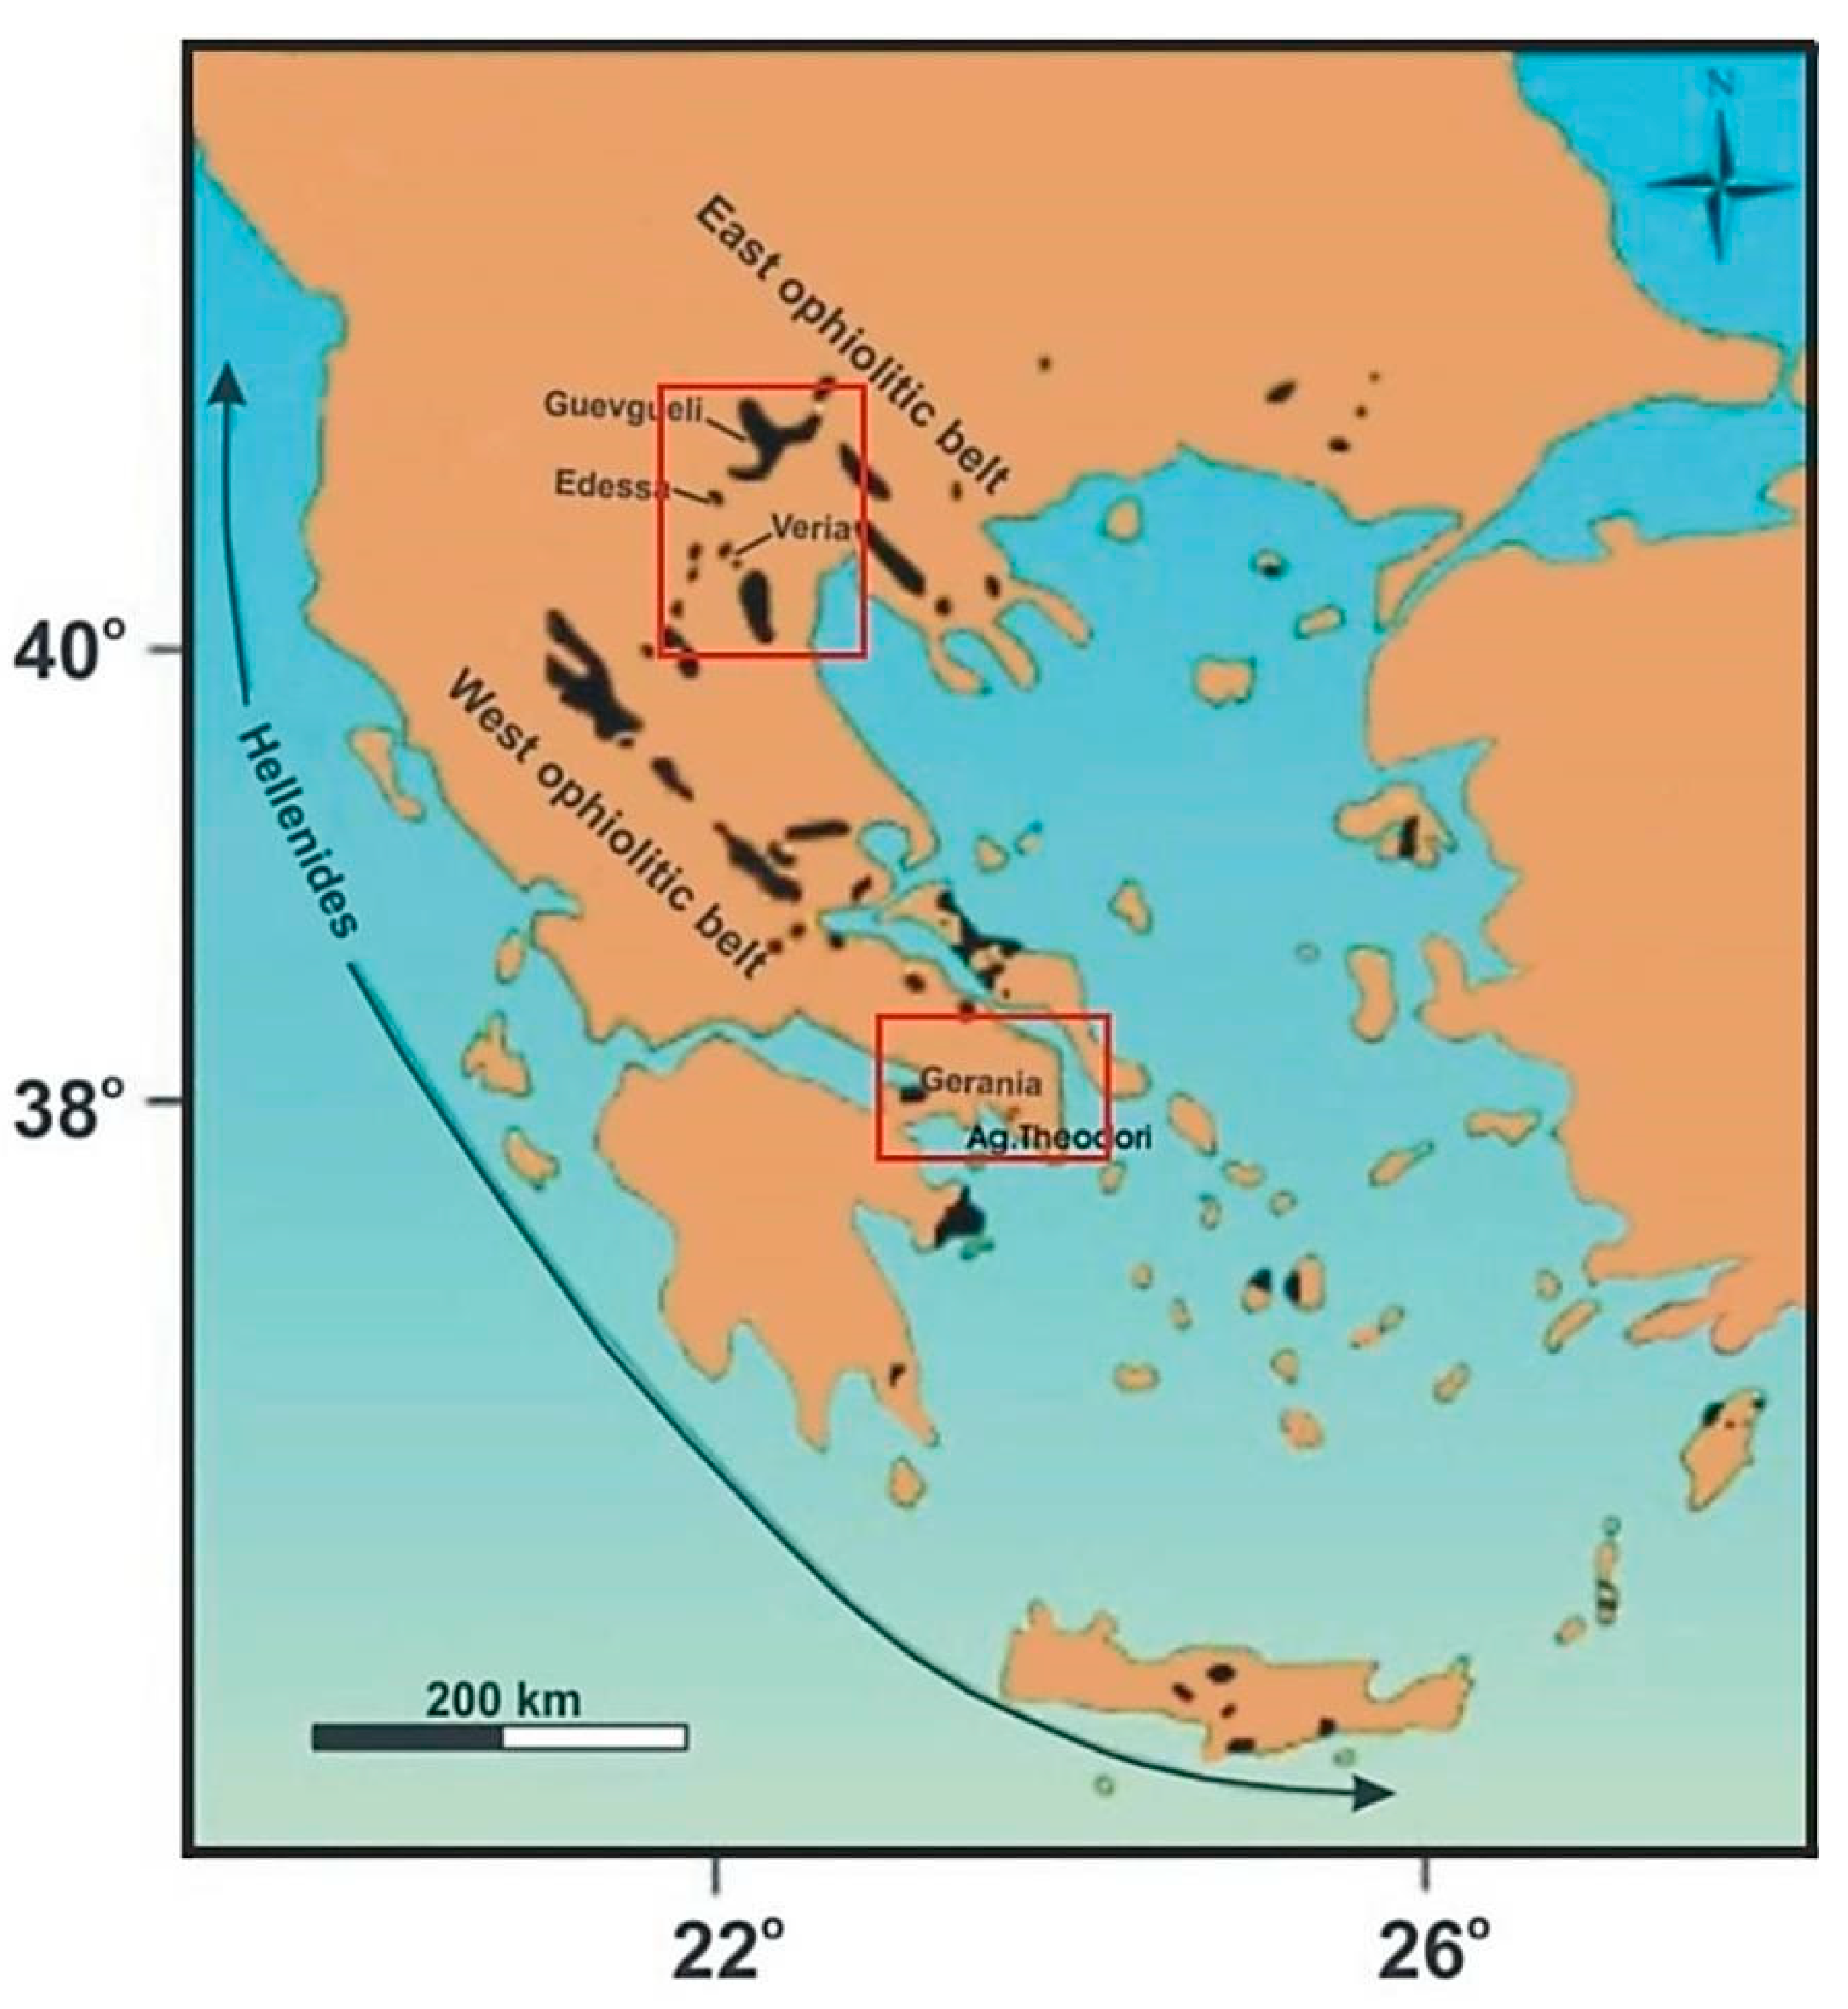
2.1. Materials

In this paper, thirty three intermediate, mafic and ultramafic rock samples from four ophiolite complexes (Greece) and more specifically from Veria-Naousa, Edessa, Gerania and Guevgueli complexes, as well as from their surrounding areas (i.e., Ag. Theodori), were collected and studied for identifying their contained clay minerals (Figure 1).

2.2. Methods

The collected rocks were first examined under a petrographic microscope (Leitz Ortholux II POL-BK Ltd., Midland, ON, Canada) following the EN 932-3 [24] standard. Additionally, X-ray diffractometry (XRD) was also used for determining their primary mineralogy, with the aid of a Bruker D8 Advance Diffractometer (Bruker, Billerica, MA, USA), with Ni-filtered CuKα radiation. The scanning area for bulk mineralogy of the samples covered the 2θ interval 2–70°, with a scanning angle step size of 0.015° and a time step of 0.1 s. The <2 µm clay fraction was separated by settling and dried on glass slides at room temperature. The clay minerals were scanned from 2° to 30° 2θ for each <2 μm specimen and identified from three XRD patterns (after having air-dried at 25 °C, after ethylene glycol treatment and having heated at 490 °C for 2 h). The mineral phases were determined using the DIFFRACplus EVA 12® software (Bruker-AXS, Billerica, MA, USA) based on the ICDD Powder Diffraction File of PDF-2 2006, while the semi-quantitative analyses were performed by TOPAS 3.0® software (TOPAS MC Inc., Oakland, CA, USA), based on the Rietveld method refinement routine. The routine is based on the calculation of a single mineral-phase pattern according to the crystalline structure of the respective mineral, and the refinement of the pattern using a non-linear least squares routine. The quantification errors calculated for each phase according to Bish and Post [16] are estimated to be ~1%. Serpentine and chlorite minerals’ microanalyses were carried out by a JEOL JSM-6300 SEM equipped with energy dispersive and wavelength spectrometers (EDS and WDS) and INCA software at the Laboratory of Electron Microscopy and Microanalysis, University of Patras. Operating conditions were accelerating voltage 25 kV and beam current 3.3 nA, with a 4 μm beam diameter. The total counting time was 60 s and dead-time 40%. Synthetic oxides and natural minerals were used as standards for our analyses. Detection limits are ~0.1% and accuracy better than 5% was obtained. In the next stage, methylene blue tests were performed for the collected rock samples. The principle of the MBF test (methylene blue test) is to add quantities of a standard aqueous solution of methylene blue dye in a sample until absorption of the dye ceases. The MBF value expresses the quality of MBF agent required to cover the total surface of the clay fraction of the sample.
This study was performed according to the EN 933-9 [25] standard and 30 ± 0.1 gr of sample were used in the size of 0/0 125 mm of the tested rocks. Briefly, 500 mL of deionized water is put in a beaker, and the dried sample of minimum 30 gr is added and properly blended. The burette is filled with methylene blue solution (molar mass: 319.86 g/mol) Merck KGaA. The mixer runs for 5 min, before adding 5 mL of dye solution to the beaker. The material in the beaker is mixed at 400 rpm for at least 1 min, and the stain test is conducted on filter paper via a glass rod. In the case that no halo appears, another 5 mL of dye solution is added and mixed for 1 min and another stain test is carried out. Addition of dye and stain tests continue until the appearance of a halo. By the time that the halo is apparent, the mixing continues without adding dye solution and stain tests are made every 1 min. When the halo disappears in the first 4 min, another 5 mL of dye solution is added. If the halo disappears in the first 4 min, another 5 mL of dye solution is added. Vi constitutes the total volume of the dye used. The methylene blue value is calculated according to the equation described below:
MBF = Vi/Mi × 10
where MBF: Methylene blue value; Mi: Mass of test sample part, gr; Vi: Total volume of added dye solution, mL.
In the next stage, the methylene blue test, which was carried out according to the EN 933-9 [25] standard, was modified in order to identify when this test can be more capable to determine more accurately the presence of swelling clay minerals contained in rocks used as aggregates by changing the grain size of the tested rock in order to change its surface area and the mass of the tested rock. In the modified test, 50 ± 0.1 gr in the size of 0/0 75 mm of the tested rocks were examined. Then, the process described in the aforementioned standard was followed for calculating the new modified methylene blue values of the examined rocks using the formula of:
MBF2 = Vi/Mi × 10
where MBF2: Methylene blue value; Mi: Mass of test sample part, gr; Vi: Total volume of added dye solution, mL.

3. Results

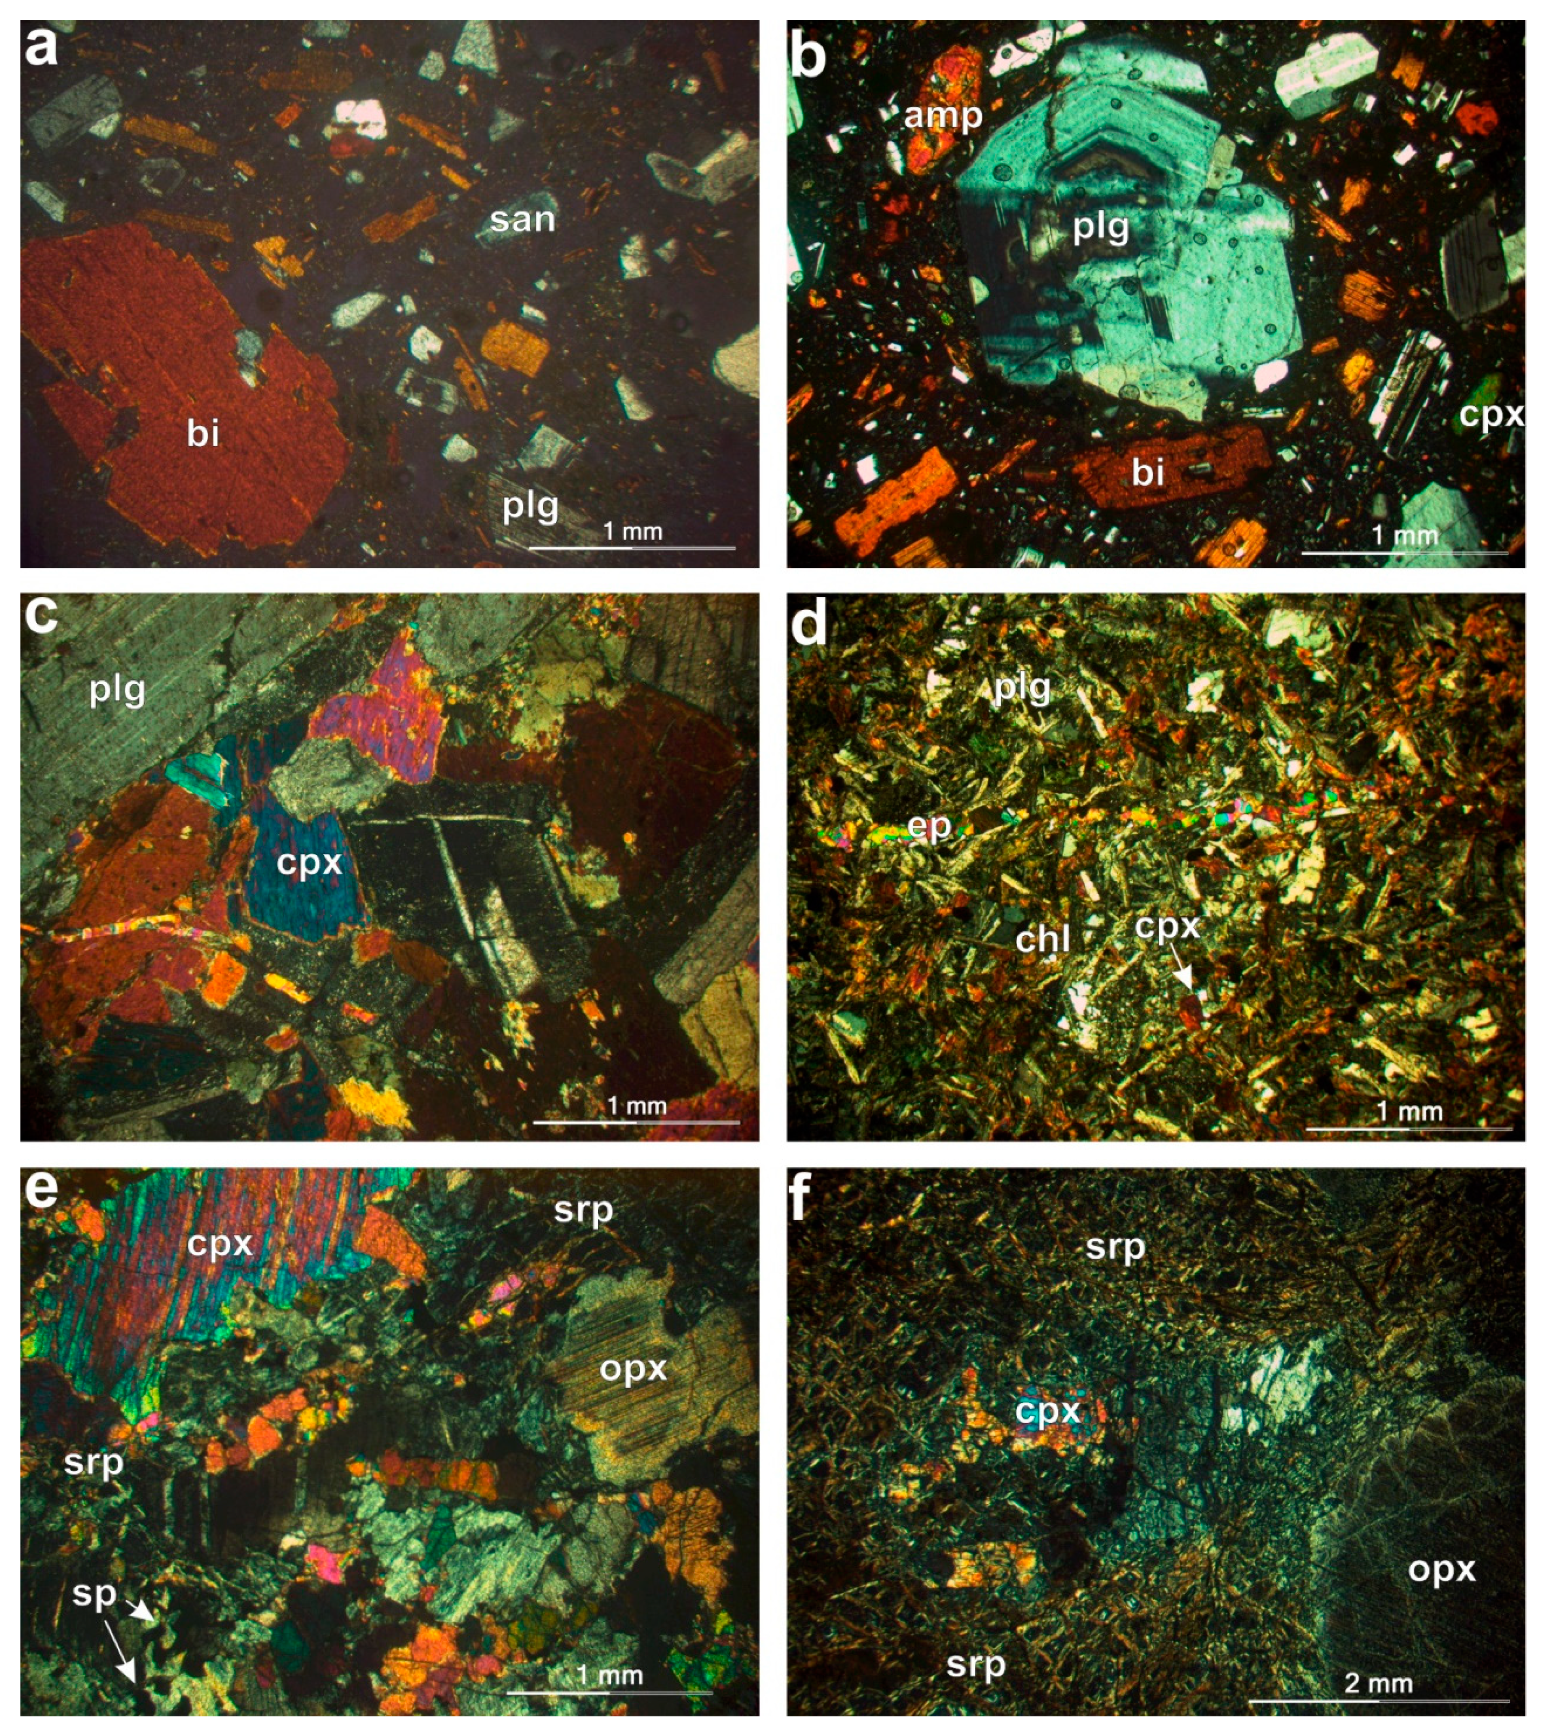
3.1. Petrographic Features of the Examined Rocks Using Polarizing Microscope

Three petrological different types of rocks were examined via polarizing microscope (Group I, II and III) (Figure 2). The first group (Group I) consists of dacite and andesite characterized by variety in their alteration degree. Porphyritic is the main texture of dacites, while quartz, hornblende, plagioclase, biotite and sanidine are their main mineralogical assemblage. Andesite exhibits distinct porhyritic texture and is mostly characterized by tabular sanidine as well as by clinopyroxene and biotite phenocrysts. Additionally, plagioclase phenocrysts are presented as strongly zoned, displaying normal and oscillatory reverse zoning. Moreover, biotite completes their primary mineralogical composition. Accessory minerals are titanite, apatite, zircon as well as magnetite.
Group II is the group of mafic rocks and is comprised by gabbro and diabase. Gabbro mostly consists of clinopyroxene, plagioclase and in less amounts, it contains amphibole. In some mafic rocks, several plagioclase crystals have been transformed to sericite. Quartz, titanite, ilmenite, magnetite and zircon are observed in less amounts, while actinolite, epidote, prehnite and chlorite constitute the secondary minerals. Primary textures are ophitic when they have not been obliterated by deformation. The modal composition of diabase is almost the same as that of gabbro, whereas their primary assemblage contains clinopyroxene and plagioclase and secondary minerals are mainly chlorite. The textures displayed in this lithology are ophitic, subophitic and porphyritic.
The investigated ultramafic samples (Group III) comprise harzburgite, dunite and lherzolite with variety in the amount of the serpentine contained. The dunite displays cataclastic and partially granular texture. Dominant mineralogy contains olivine and less orthopyroxene. Opaque minerals also observed in less amounts. The primary assemblage of the harzburgite consists of orthopyroxene, olivine, less clinopyroxene and Cr-spinel. Lherzolite exhibits cataclastic and porphyroclastic, while in some cases, protogranular texture is observed, and their modal composition consists of olivine, orthopyroxene and clinopyroxene. Moreover, opaque minerals are contained in fewer concentrations. Serpentine, mainly lizardite and antigorite were observed, is the main secondary mineral of all ultramafic samples, displaying mesh, ribbon, bastite and intersertal texture. The main alteration products of the ultramafic rocks are chlorite, talc and magnetite.

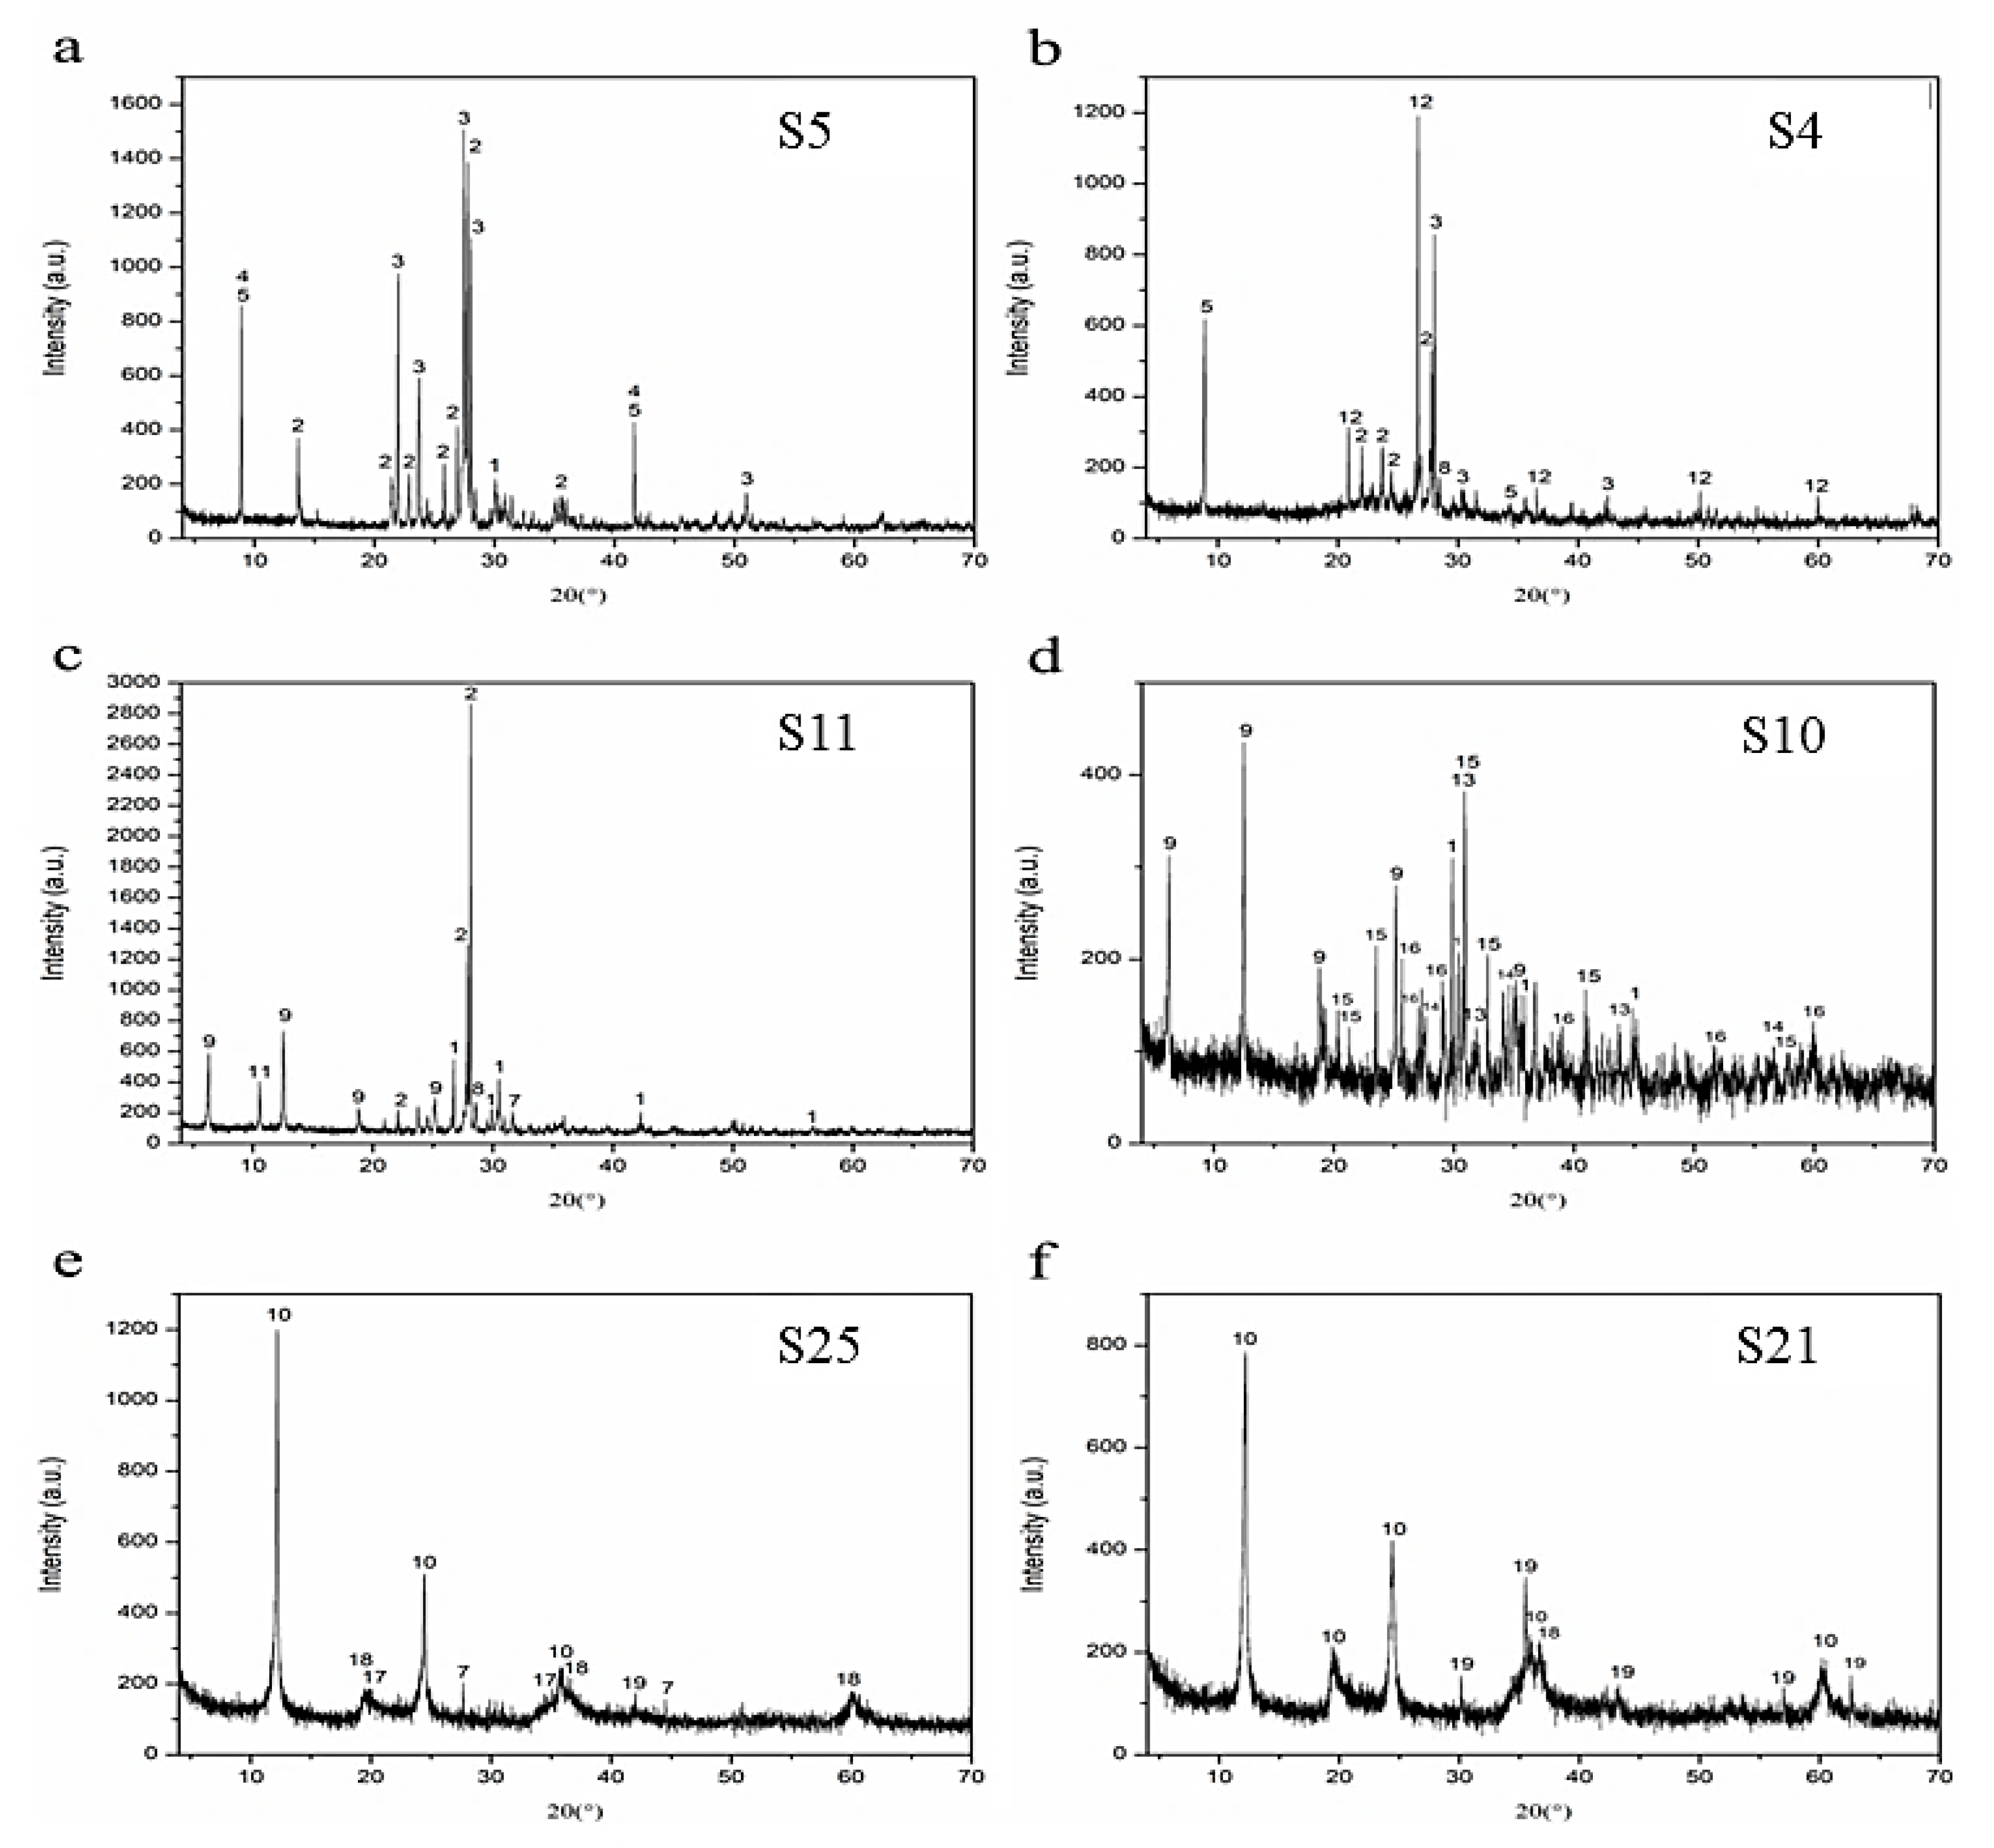
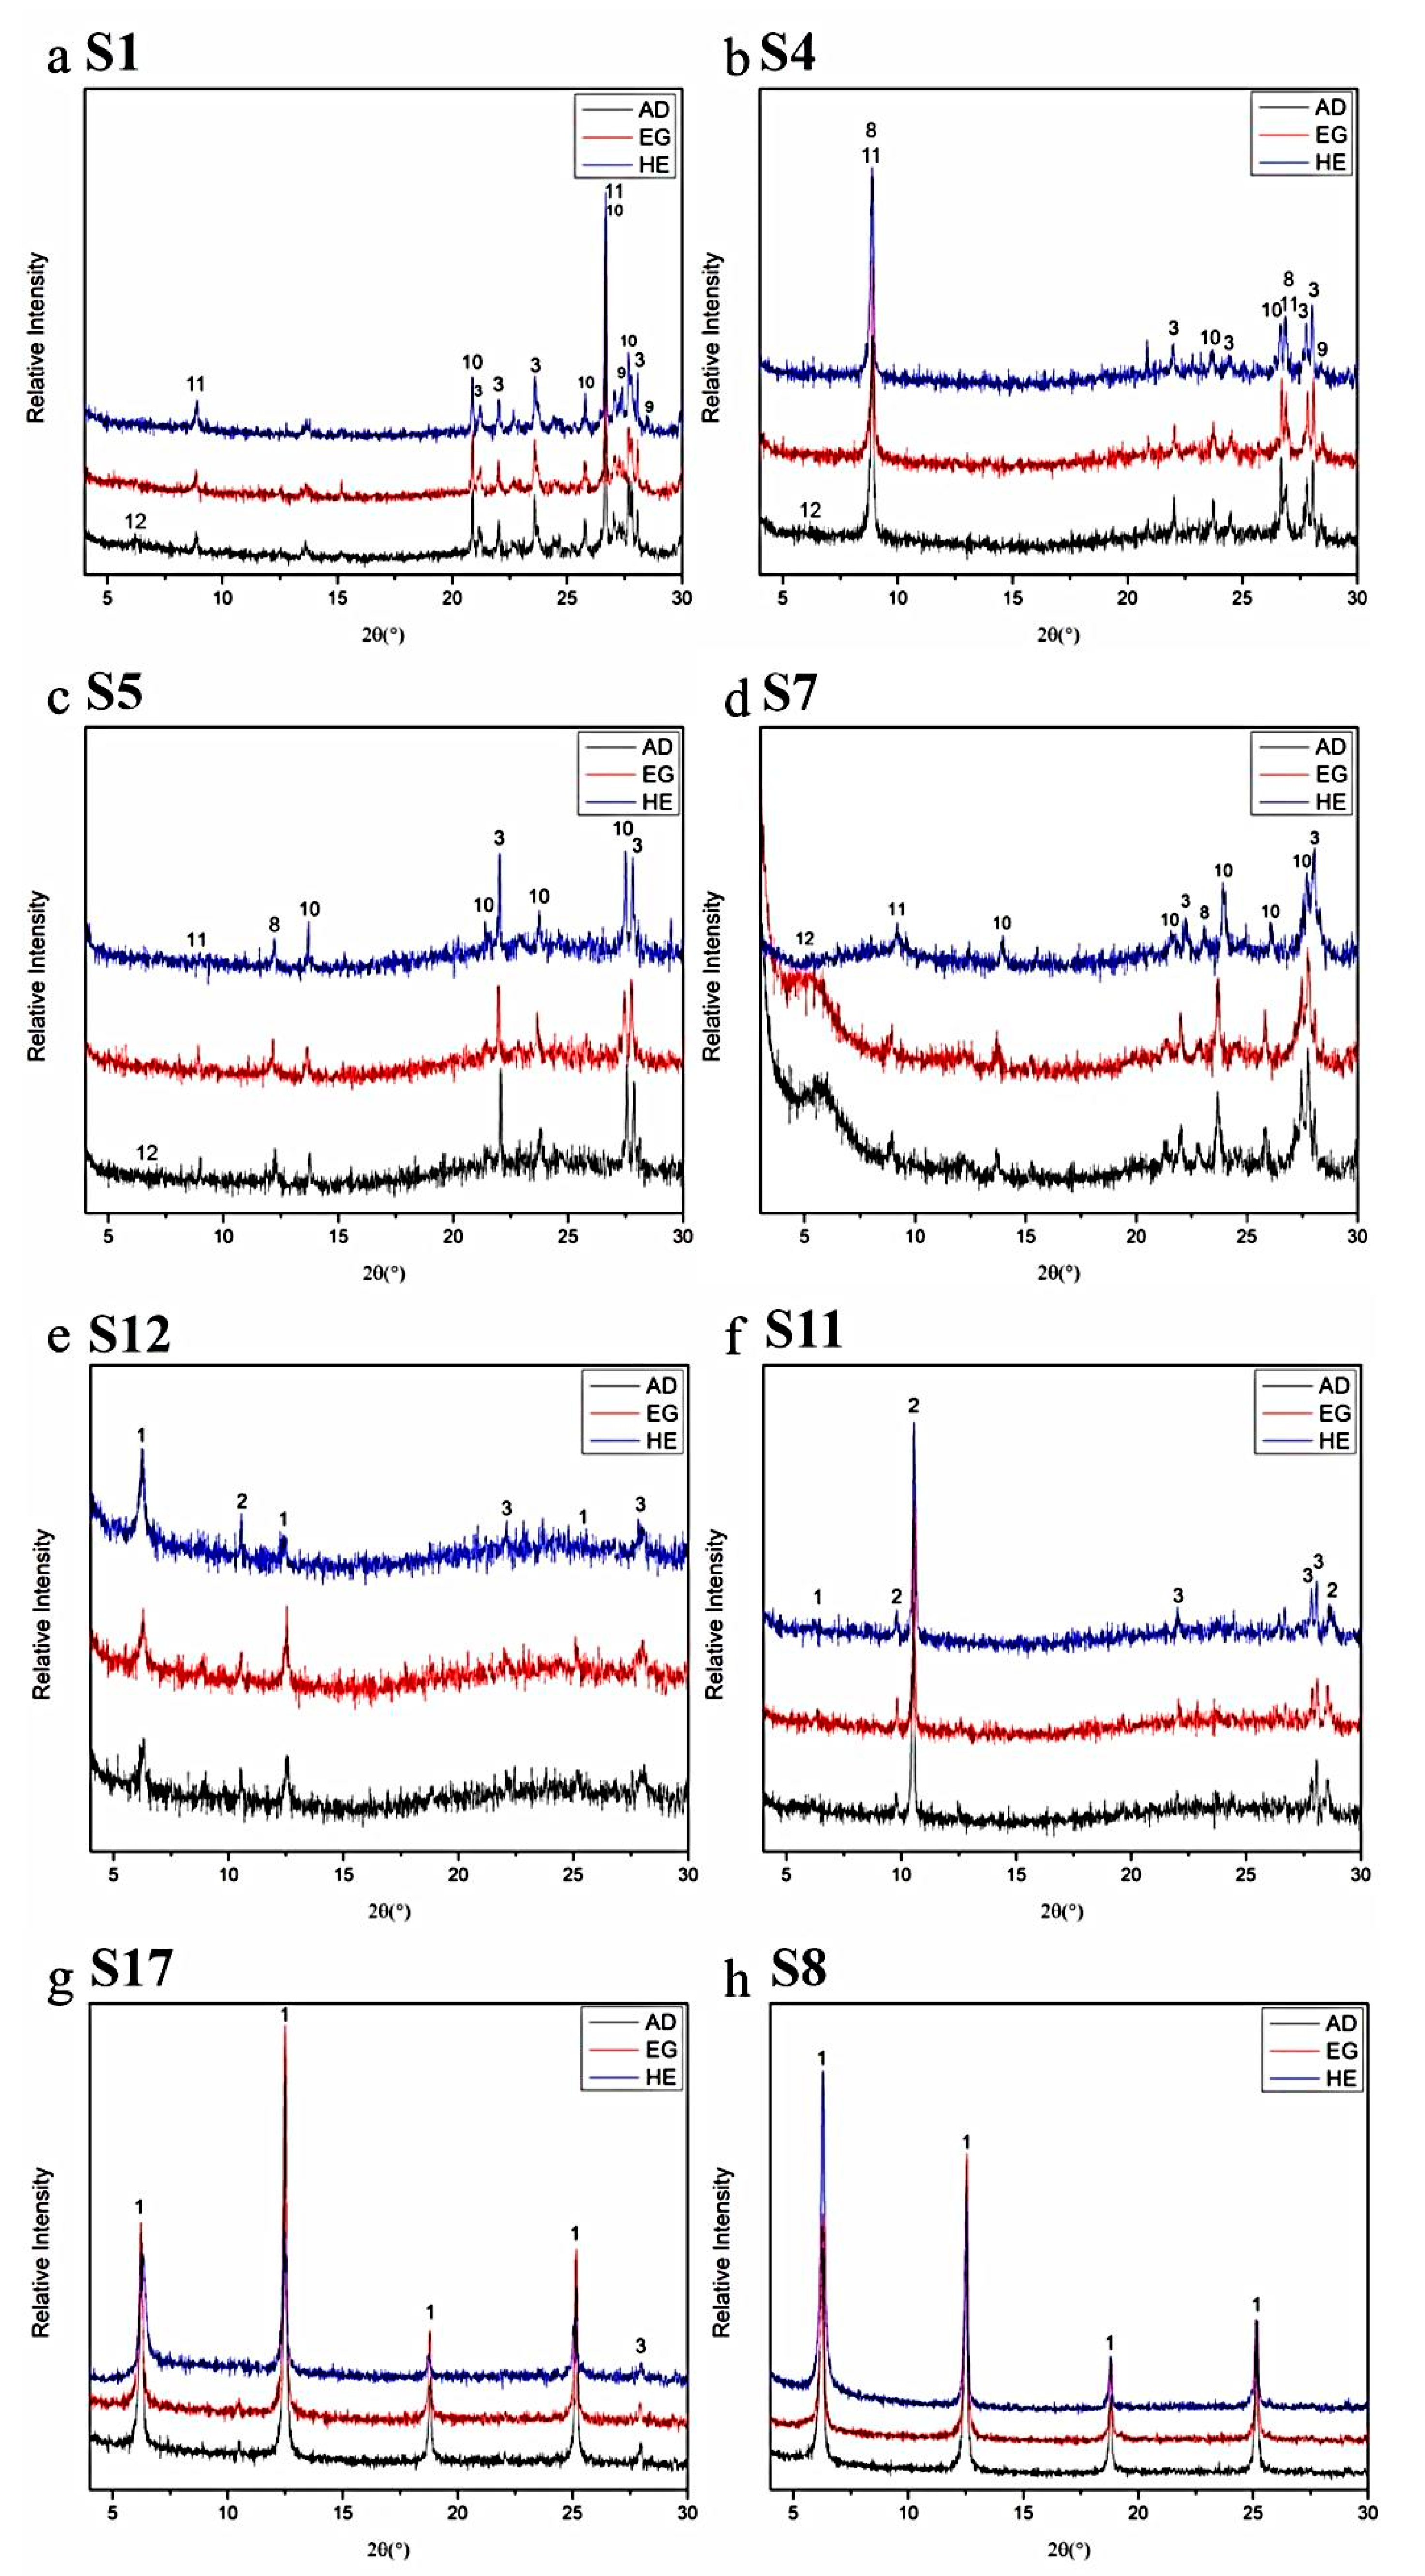
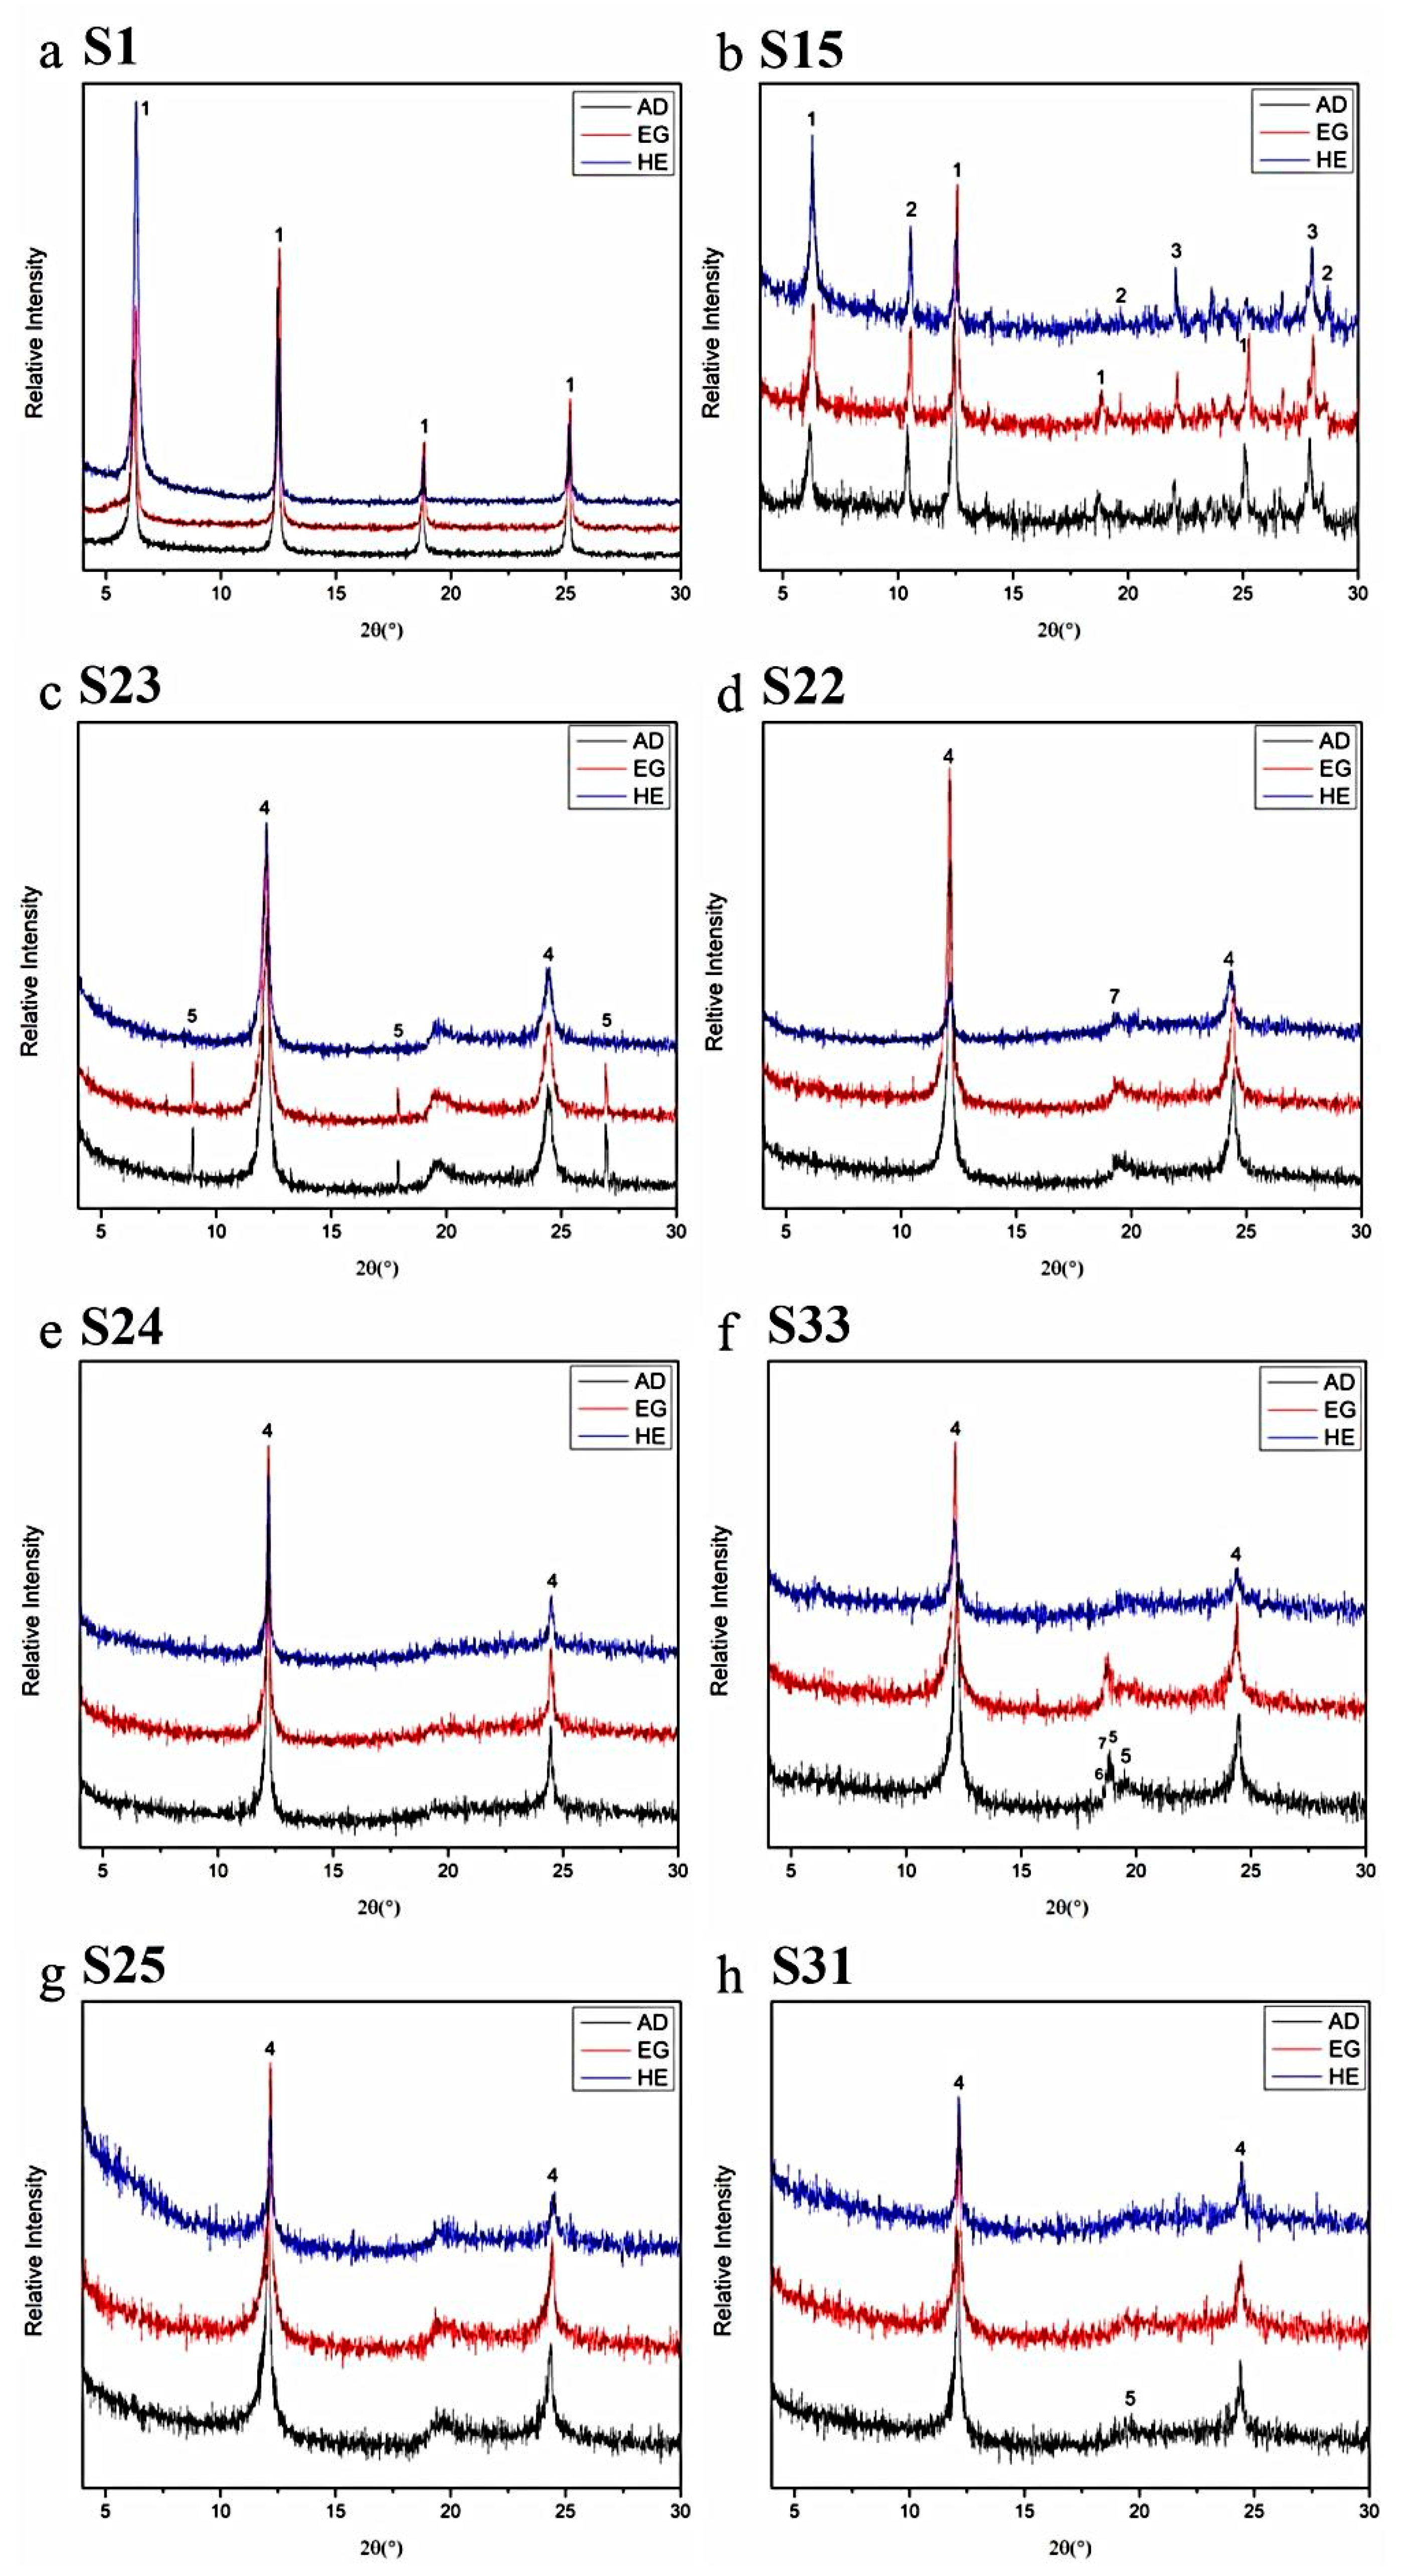
3.2. X-ray Diffractometry of the Examined Rocks

Except for the petrographic study of the examined rocks using an optical microscope, X-ray diffractometry was also used for the identification of their modal composition. Representative XRD patterns of the samples are presented below (Figure 3).
The XRD patterns from Group I revealed the presence of quartz, plagioclase and biotite as the main components of Group I, while in the XRD patterns of Group II, clinopyroxene, plagioclase, hornblende, chlorite and actinolite occur, as well as quartz, titanite, epidote and ilmenite. The XRD patterns of random powder mounts from the investigated ultramafic rocks (Group III) indicated serpentine as the main secondary mineral.
Representative X-Ray diffraction patterns of the clay fraction from all types of lithologies are presented in Figure 4 and Figure 5. The clay fraction of the studied rocks, except from other fine minerals which mainly constitute their primary assemblage, is dominated by illite and smectite in the intermediate rocks (Group I), chlorite in the mafic rocks (Group II) and mainly serpentine in the ultramafic rocks (Group III). More specifically, illite is identified by the reflections at 10 Å, 4.97 Å, 4.48 Å and 3.3 Å. Smectite is identified by the characteristic reflection at 15.4 Å and at 17 Å after ethylene glycol treatment, which shifts at 10 Å after heating. Chlorite displays characteristic reflections at 14.2 Å, 7.1 Å and 3.55 Å, which are not affected after ethylene glycol treatment. Serpentine and talc are identified by the characteristic reflections at 7.3 Å and 9.3 Å respectively, as well as brucite at 18.61 Å, which are not affected upon ethylene glycol treatment.
The quantification of the clay minerals contained in the examined rocks, by the Rietveld refinement method in the bulk XRD patterns, are listed in Table 1. The obtained compositions are in accordance to the petrographic observations reported by the petrographic microscope.

3.3. Chemistry of the Studied Rock Samples

Representative microanalyses of chlorite and serpentine minerals of the studied rocks are cited in Table 2 and presented in Figure 6 and Figure 7. Chlorite’s microanalyses from the examined mafic rocks are shown in Table 2 and presented in Figure 6. Gabbro contains chlorites with slightly higher Fet/(Fet + Mg) ratio (0.30–0.48), Al2O3 and FeO contents (17.43–22.89 wt.%, 16.11–26.56 wt.%, respectively), as well as lower contents of SiO2 and MgO (27.14–31.45 wt.%, 15.18–20.74 wt.%, respectively) than those of diabase (0.28–0.44, 16.95–19.73 wt.%, 15.33–25.73 wt.%, 30.16–34.96, 15.99–21.81 wt.%, respectively). Their compositions range from pychnochlorite to diabantine (Figure 5) in both lithotypes.
Representative microanalyses of serpentine minerals are cited in Table 3 and presented in Figure 7. Serpentine minerals are composed of SiO2 (42.02–46.55 wt.%), MgO (35.94–41.50 wt.%), Fe2O3 (1.91–6.53 wt.%), as well as low contents of Al2O3, TiO2, Cr2O3, NiO, CaO, Na2O and K2O. Serpentine minerals from serpentinized ultramafic containing higher than 70% of serpentine display higher SiO2, MgO, Fe2O3 and lower Al2O3 and CaO contents than those containing lower than 70% of serpentine. In the binary plot of SiO2 versus MgO (Figure 7a), serpentine minerals derived from the serpentinized ultramafic containing higher than 70% of serpentine are mainly antigorite, while those containing lower than 70% of serpentine are mainly plotted in the field of lizardite. This fact is similar to the plot of MgO versus FeO (Figure 7b). FeO was calculated by the Fe2O3 in order to be shown in the diagram in Figure 7b.

3.4. Methylene Blue Tests Results

The MBF values of the intermediate rocks (Group I) range between 6.60 g/kg and 12.00 g/kg. As it is shown in Table 4, the MBF values of Group II vary between 5.20 g/kg and 15.10 g/kg. Regarding the ultramafic examined rocks (Group III), their MBF values range between 5.20 g/kg and 17.50 g/kg. Concerning the modified methylene blue test results, they range from 6.60 g/kg to 12.00 g/kg in the intermediate examined rocks, between 5.70 g/kg and 15.10 g/kg in the mafic investigated samples and from 5.50 g/kg to 17.50 g/kg in the ultramafic rocks.

4. Discussion

The content and the type of the swelling clay minerals have been investigated by several researchers that deal with the study and the use of aggregate rocks in various construction applications. Swelling can occur even with a small percentage of clay minerals and is likely to cause widespread structural failures of rocks, resulting in construction failures. Petrounias et al. [12] have proved that minor amounts of smectite (<3%) in andesites can cause failures and detachments of the aggregates from the cement paste, thus significantly reducing the final strength of the produced concretes. In general, the influence of phyllosilicate minerals, both in the form of swelling and non-swelling types, has been a subject that concerned many researchers (e.g., References [19,28]), because they have a significant effect upon the engineering properties of rocks that are used as aggregates and hence on the applications in which they participate. The influence of swelling phyllosilicate mineral types is understandable by engineering application scientists. Up to now, for scientists to identify swelling in rocks, most often apply a more empirical method (methylene blue test), which indirectly suggests the presence of swelling clay minerals.
This study investigates the question of whether this test can work correctly in various igneous rocks. This question arose after a significant number of empirical tests of methylene blue, which show inconsistency in their results with respect to the mineralogical composition of the rocks examined each time. Combining all these results and indicating significant attention on the mineralogical and petrographic characteristics of rocks, it is observed that the methylene blue values are strongly correlated with the smectite content in intermediate rocks such as dacite and andesite (Group I), as noticed from the diagram of Figure 8.
The range in smectite content is correlated to the different alteration degrees which the intermediate examined rocks present (Figure 2, Figure 3, Figure 4 and Figure 5). Furthermore, the modification of the methylene blue test (MBF 2), performed in this study, seems to be correlated with the smectite content, similarly to the MBF 1 test (unmodified). This fact may be attributed due to the extremely active involvement of smectite even in very small percentages in this type of rock. However, the MBF 2 values are presented as slightly enhanced compared with those of MBF 1, directly dependent on the difference in the particle size and hence, the specific surface of the phyllosilicates, which allows more interactions between the positively charged methylene blue solution with the clay layers.
Concerning the accuracy of the test in mafic rocks, in which chlorite is presented as the unique phyllosilicate mineral, according to the petrographic analyses via polarizing microscope (Figure 2), via X-ray diffractometry (Figure 3) and to the clay fraction analyses (Figure 4 and Figure 5), even in the modified version (MBF 2) or not (MBF 1), it displays remarkable results. As it is shown in diagrams of Figure 9, the methylene blue test does not seem to be altered or misled by the presence of the phyllosilicate chlorite.
However, the methylene blue values in both versions (MBF 1 and MBF 2) are presented partially high, but never directly correlated with chlorite content, nor with its type (diabantine, pycnochlorite) (Figure 6). This swelling property of chlorite is evaluated from the ability of cations to retain their polar molecule shell (water, glycol, glycerol) within the interlayer environment [29]. This property does not exist if the charge of the layer is too high or zero. In general, this property is characteristic of di- and tri-octahedral smectites and vermiculites. Polar molecules are organized into layers whose numbers range regarding the interlayer charge. In the interlayer zone, cations are framed by ethylene glycol molecules, which are weakly bonded to the surface of tetrahedral sheets (hydrogen bonds). Like the water molecules, they are organized into more or less continuous layers. Adsorption of polar molecules alters the c dimension either progressively and regularly or in stages. The total expansion is equal to the sum of each layer able to absorb a varying number of water or ethylene glycol layers. This consideration was not supported by several researchers before 1980 such as Millot [30], who cited the consideration of the presence of pseudo chlorites whose behavior in X-rays and mineralogically is similar to that of typical chlorites in natural conditions and after heating. Millot [30], when trying to approximate the interpretation of the chlorite swelling mechanism, states for the swelling chlorites that this mineral is essentially a chlorite whose brucitic layer is incomplete and forms pillar structures between the 2/1 layers. As a result, he considered that the overall attraction force between the TOT (tetrahedral-octahedral-tetrahedral) sheets was weak enough to allow the input of water or poly alcohol layers, while the poles of its structure withstood heat destruction. However, this partial structural alteration/modification of chlorite has not been systematically studied nor has it been identified by any researcher as causing swelling failures in the engineering applications. This is evident from the uncorrelated sizes between methylene blue and chlorite both before (MBF 1) and after the test modification (MBF 2). Similar to Group I, the values of the modified test of Group II appear to be slightly elevated, which may have happened because of the artificial augmentation of the specific surface area of the pseudo-swelling chlorites.
In contrast to the other groups, Group III (ultramafic rocks) shows a locally systematic correlation between the amount of serpentine and the methylene blue test values. More specifically, as it is shown in the diagrams of Figure 10, there is no systematic relationship between low contents of serpentine (lower than 70%) and the methylene blue test values.
On the other hand, both in MBF 1 and more obvious in MBF 2, it appears that when the serpentine content is more than 70%, a systematic correlation between these sizes is observed. This strong correlation, especially in the modified test, indicates that the methylene blue test displays incorrect values for the strongly serpentinized samples (70% critical value) since no swelling minerals of the smectite group occurs as a result of the combination of analytical methods used for the determination of clay minerals and other minerals. The combination of petrographic methods applied (optical microscopy, X-ray diffractometry and mineral chemistry), shows strong evidence that the highly serpentinized ultramafic rocks (higher than 70% of serpentine content) mainly exhibit antigorite, while those consisting of less than 70% of serpentine mainly include lizardite. Due to oceanic subduction and with increasing pressure and temperature conditions, ultramafic rocks can be hydrothermally serpentinized in percentages of 70%, 80% and 90%, resulting in the formation of antigorite and lizardite. The lower proximity of the MBF test for the serpentinized ultramafic rocks may be due to the conversion of antigorite and lizardite to smectite. This conversion is likely to occur gradually along the edges of the antigorite and lizardite layers and directly be affected by the prevailing conditions of pressure and temperature during the subduction of the oceanic crust in the case when SiO2 is present in the circulating hydrothermal fluids. Ji et al. [31] reached similar conclusions when they experimentally approached the conversion of serpentine to smectite under an artificially created hydrothermal environment, similar to that found in the examined ophiolite complexes, in which the effect of hydrothermal alteration resulted in the formation of variable serpentinized ultramafic rocks, so that they finally imply the likelihood for the conversion of serpentine to smectite in nature. More specifically, a mixture of sodium metasilicate and serpentine was hydrothermally treated in an autoclave at 300 °C under autogenous water pressure for one or two weeks, whereas serpentine, and more specifically, antigorite and lizardite, have been converted to smectite, as identified through several analytical methods. Lizardite and antigorite are polymorphs of the same chemical formula (Mg3Si2O5(OH)4), but with different extents and types of isomorphous substitution (lizardite presents a flat crystal structure with correct geometry of interlayer H-bonds, while antigorite is characterized as more curved with wavy layers) and thus, are characterized by variance in the way that they are converted to smectite [31].
In addition, it is possible in these hydrothermal alteration conditions for serpentinized rocks with at least 70% of serpentine content, mixed layer clays to be present (including smectite) at an undetectable amount by the XRD techniques, which may significantly contribute to swelling. In contrast, the less serpentinized samples, which are significantly less affected by the hydrothermal fluids, may not contain mixed layer clays with smectite in their mineralogical composition. In this study, which deals with the question about how correct the methylene blue test works for various igneous rocks, it is possible to assign a corrected index (MBFcor) that can be used on rocks which mainly have serpentine as the main alteration mineral. The MBFcor index can be attributed to the following type:
MBFcor = (MBF1 × serpentine content)/100
where MBF1 is the methylene blue test values according to EN 933-9 [25] and serpentine content is the amount (%) of serpentine contained in the ultramafic rocks.
In the table below (Table 5), the MBFcor index values of the examined ultramafic rock samples are listed.
The proposed correction index takes into account the critical percentage of serpentine (70%), which in the present study appears to be more important than the rest of the alteration minerals. The final results show that the index corrects the methylene blue test as it is normally performed, taking into account the alteration degree of this lithology. As it is shown in the diagram of Figure 11, a strong correlation between the MBFcor index and the modified methylene blue test, MBF 2, is observed.
This relationship indicates that these two sizes are strongly connected with each other (R2 = 0.93). Since the modified test yielded safer results than MBF 1, as the results of the first test are more representative likely due to the smaller grain size of the material used, we conclude that the values of the corrected index are an indirect and safe approximation of the real values of the methylene blue test in ultrabasic rocks, which is considered necessary as these rocks are widely used in construction applications. The basic disadvantage of the suggested correction is that the percentage of serpentine contained should always be determined. However, the physical interpretation and solution of the problem we face in natural raw materials and therefore in the construction applications in which they participate in, involves the knowledge and the behavior of the mineralogical constituents contained in the structure of the mineral raw materials.

5. Conclusions

The response to the question that was asked to be answered through this study is summarized in the following conclusions:
  • The methylene blue test seems not to work equally, accurately and satisfactorily in all lithotypes of the igneous rocks and therefore, it seems to be strongly influenced by their mineralogical composition.
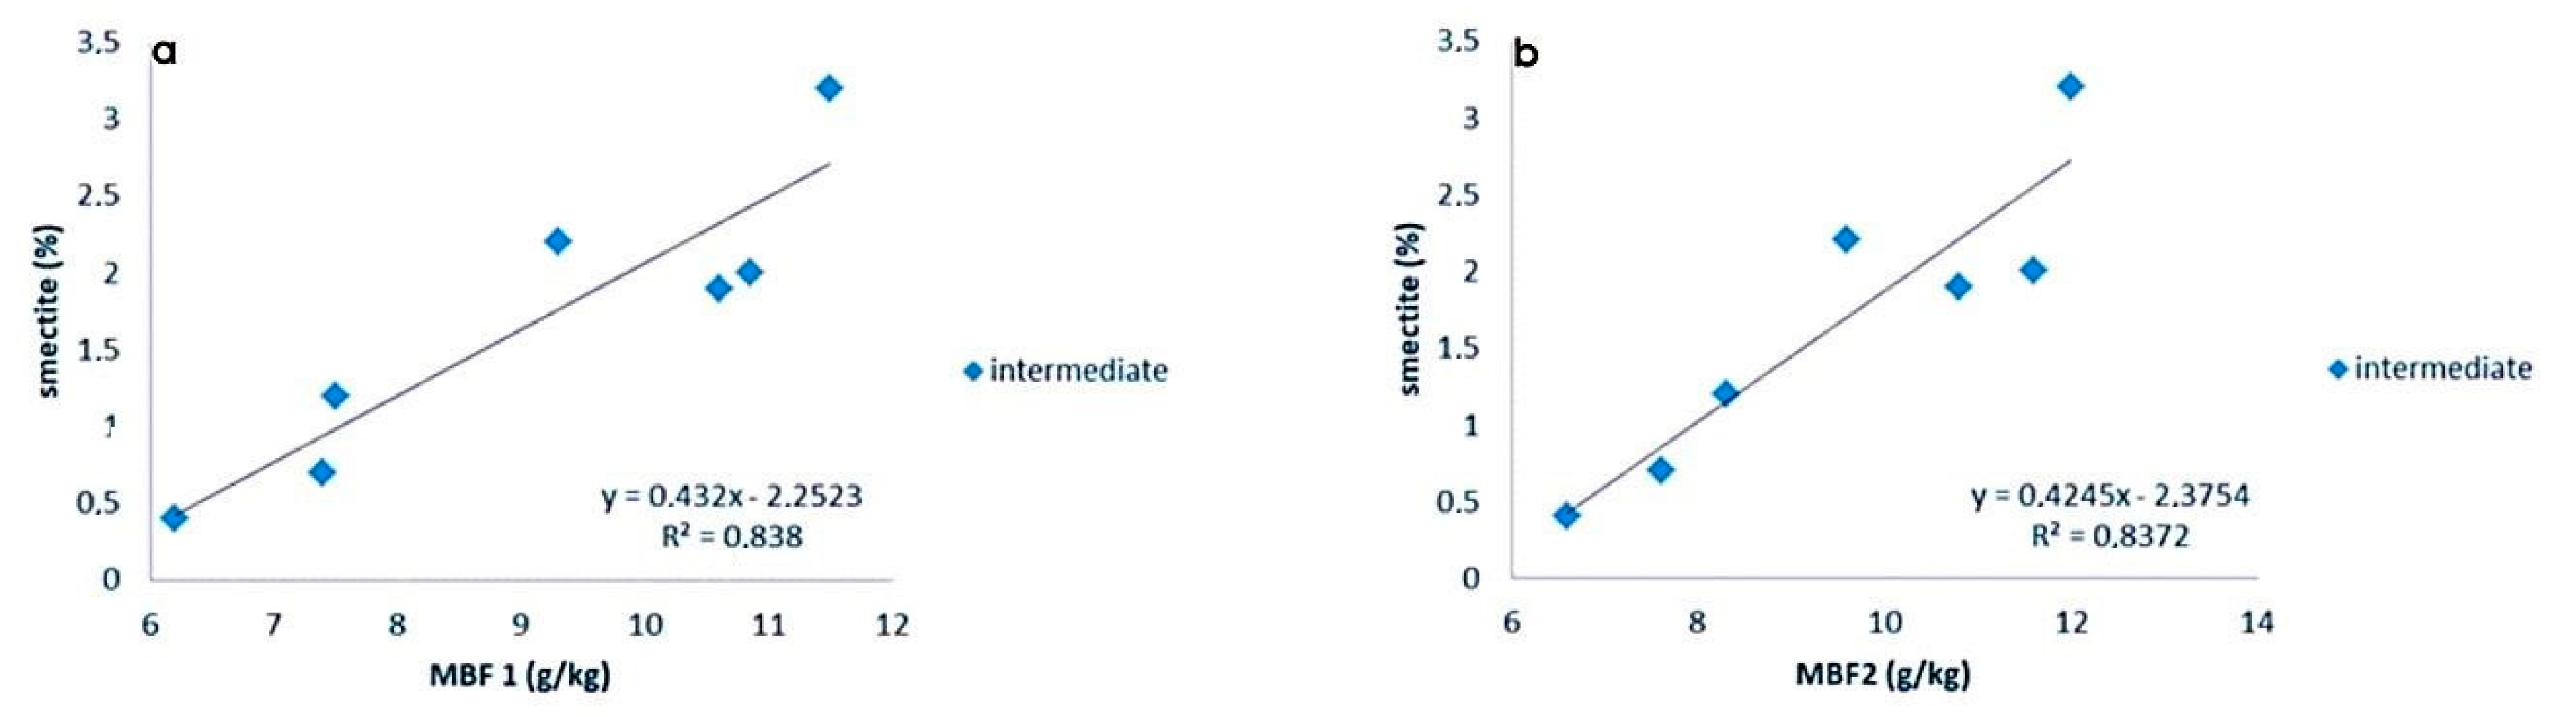
  • Smectite content in the intermediate rocks (Group I) is strongly related both with the methylene blue test values and with the modified test values (as the smectite content increases the methylene blue test values increases, respectively) due to the swelling property of smectite minerals.
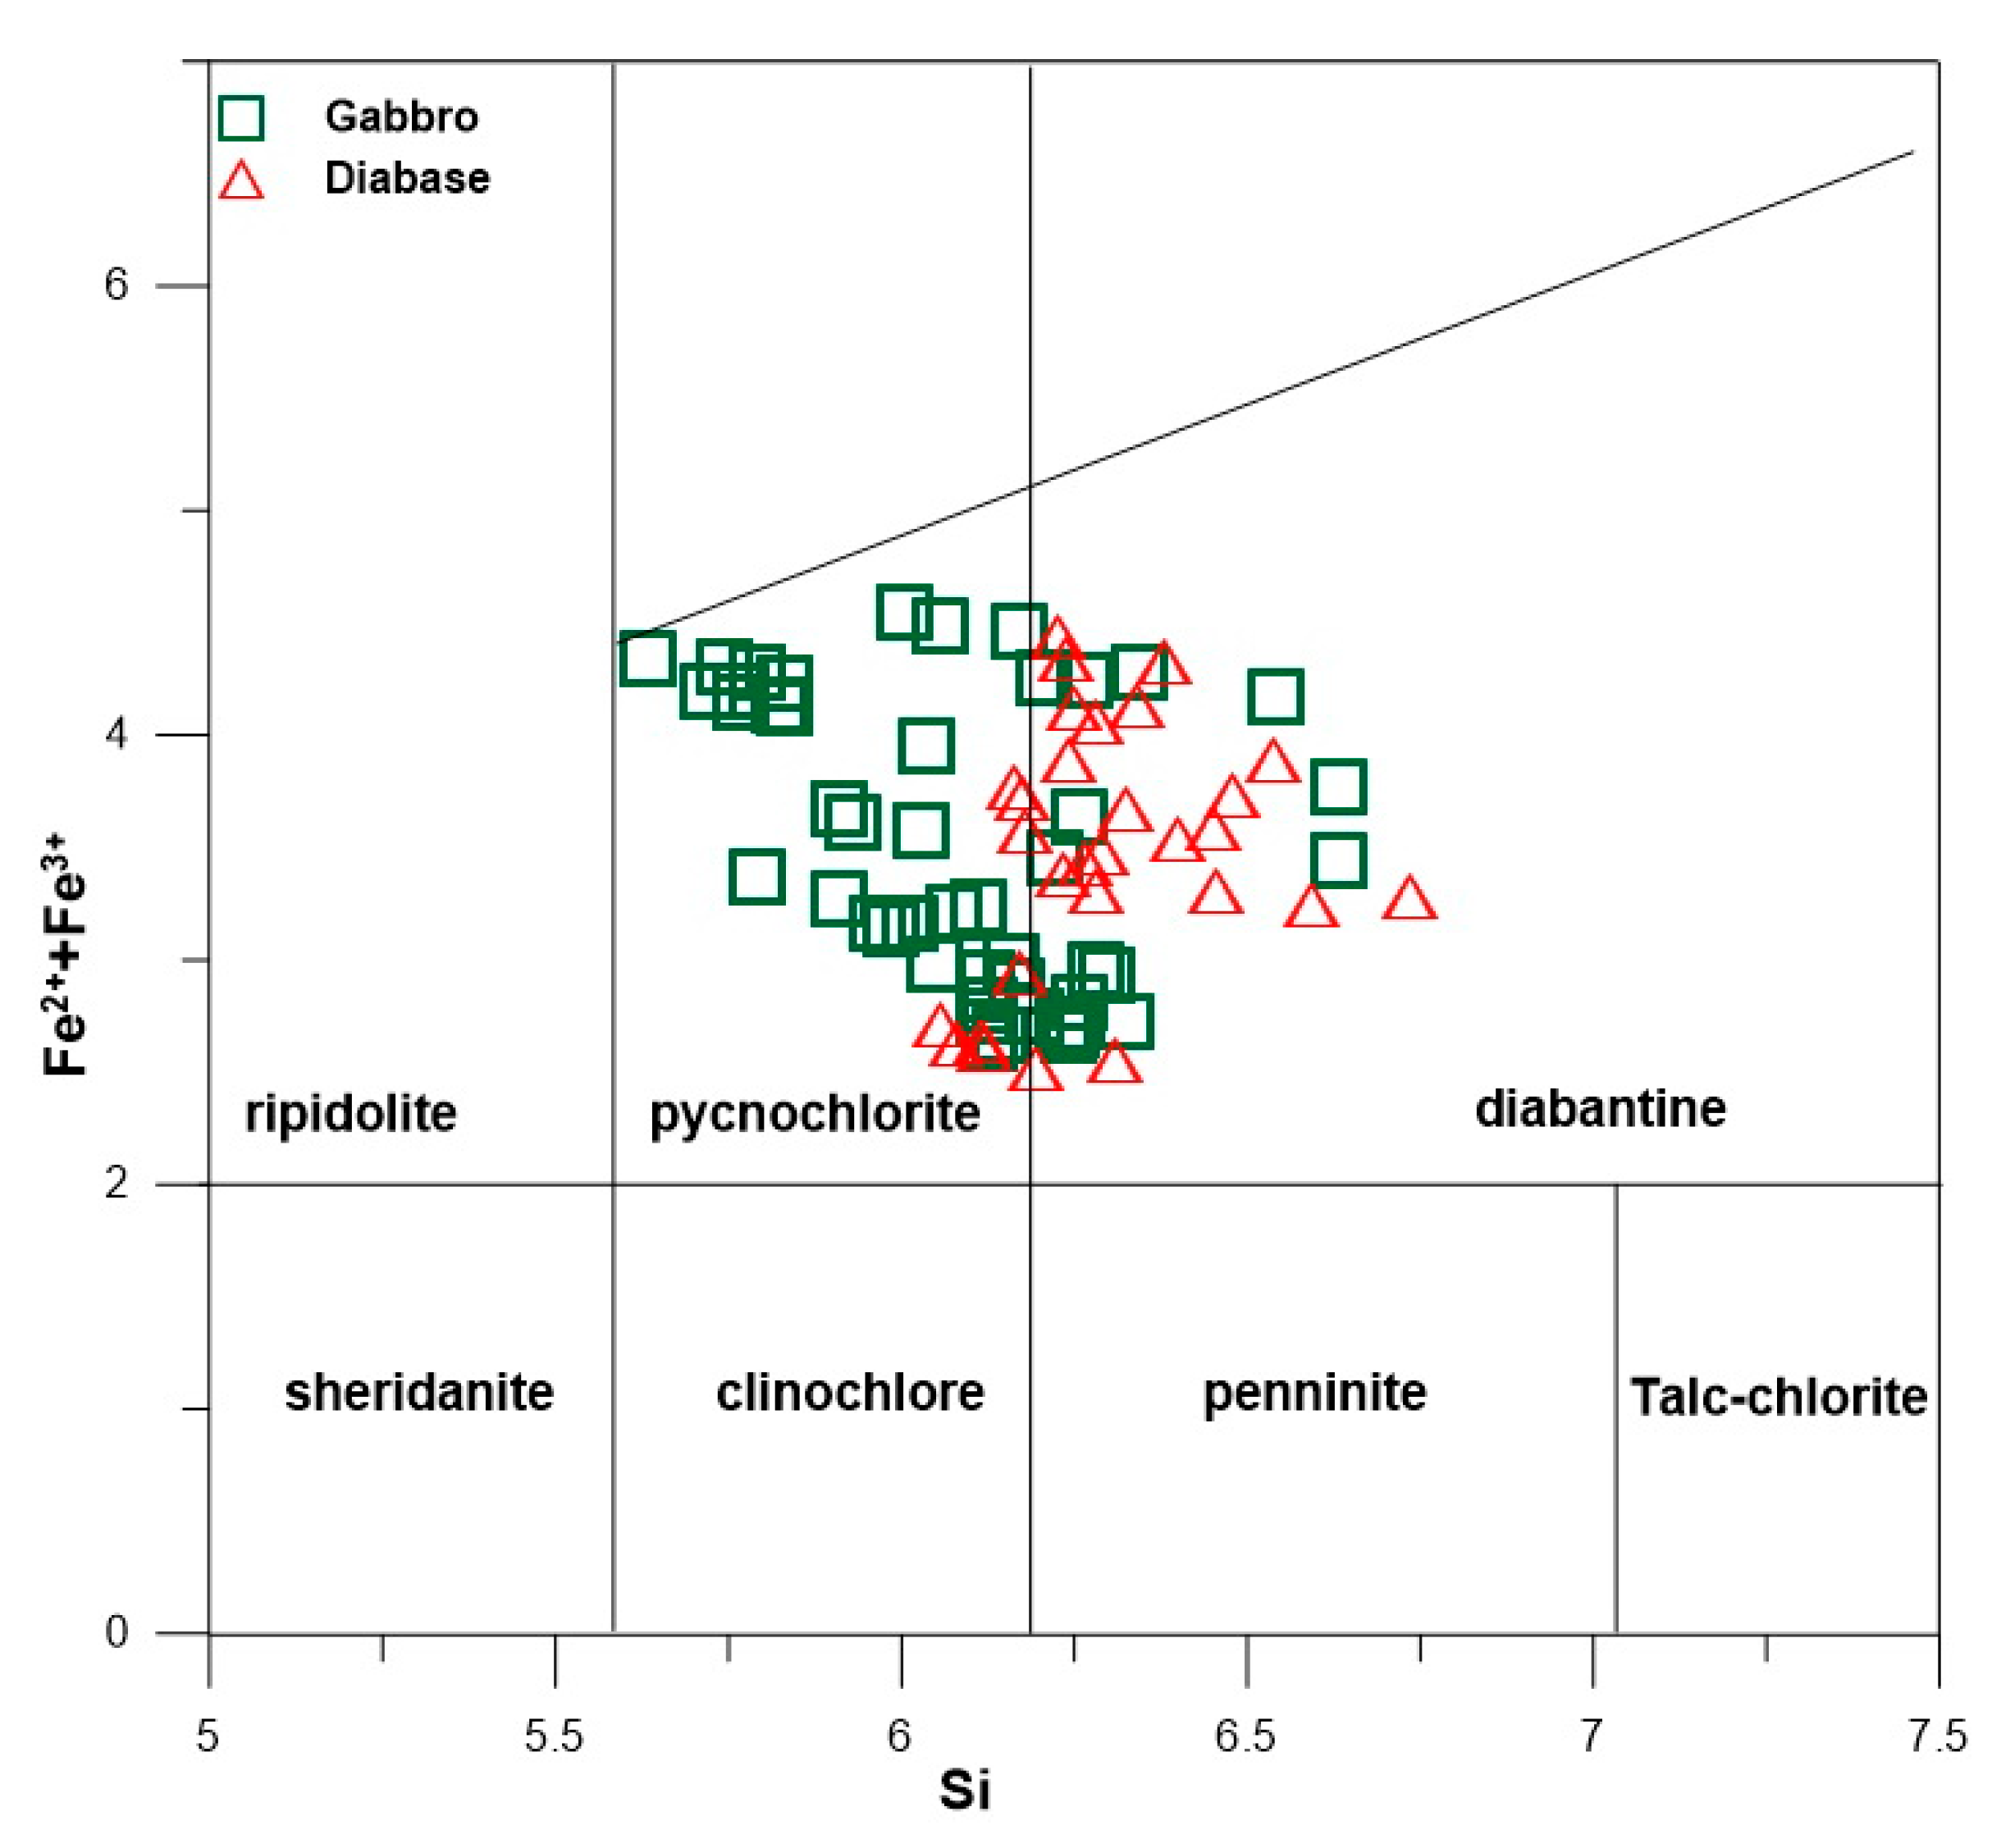
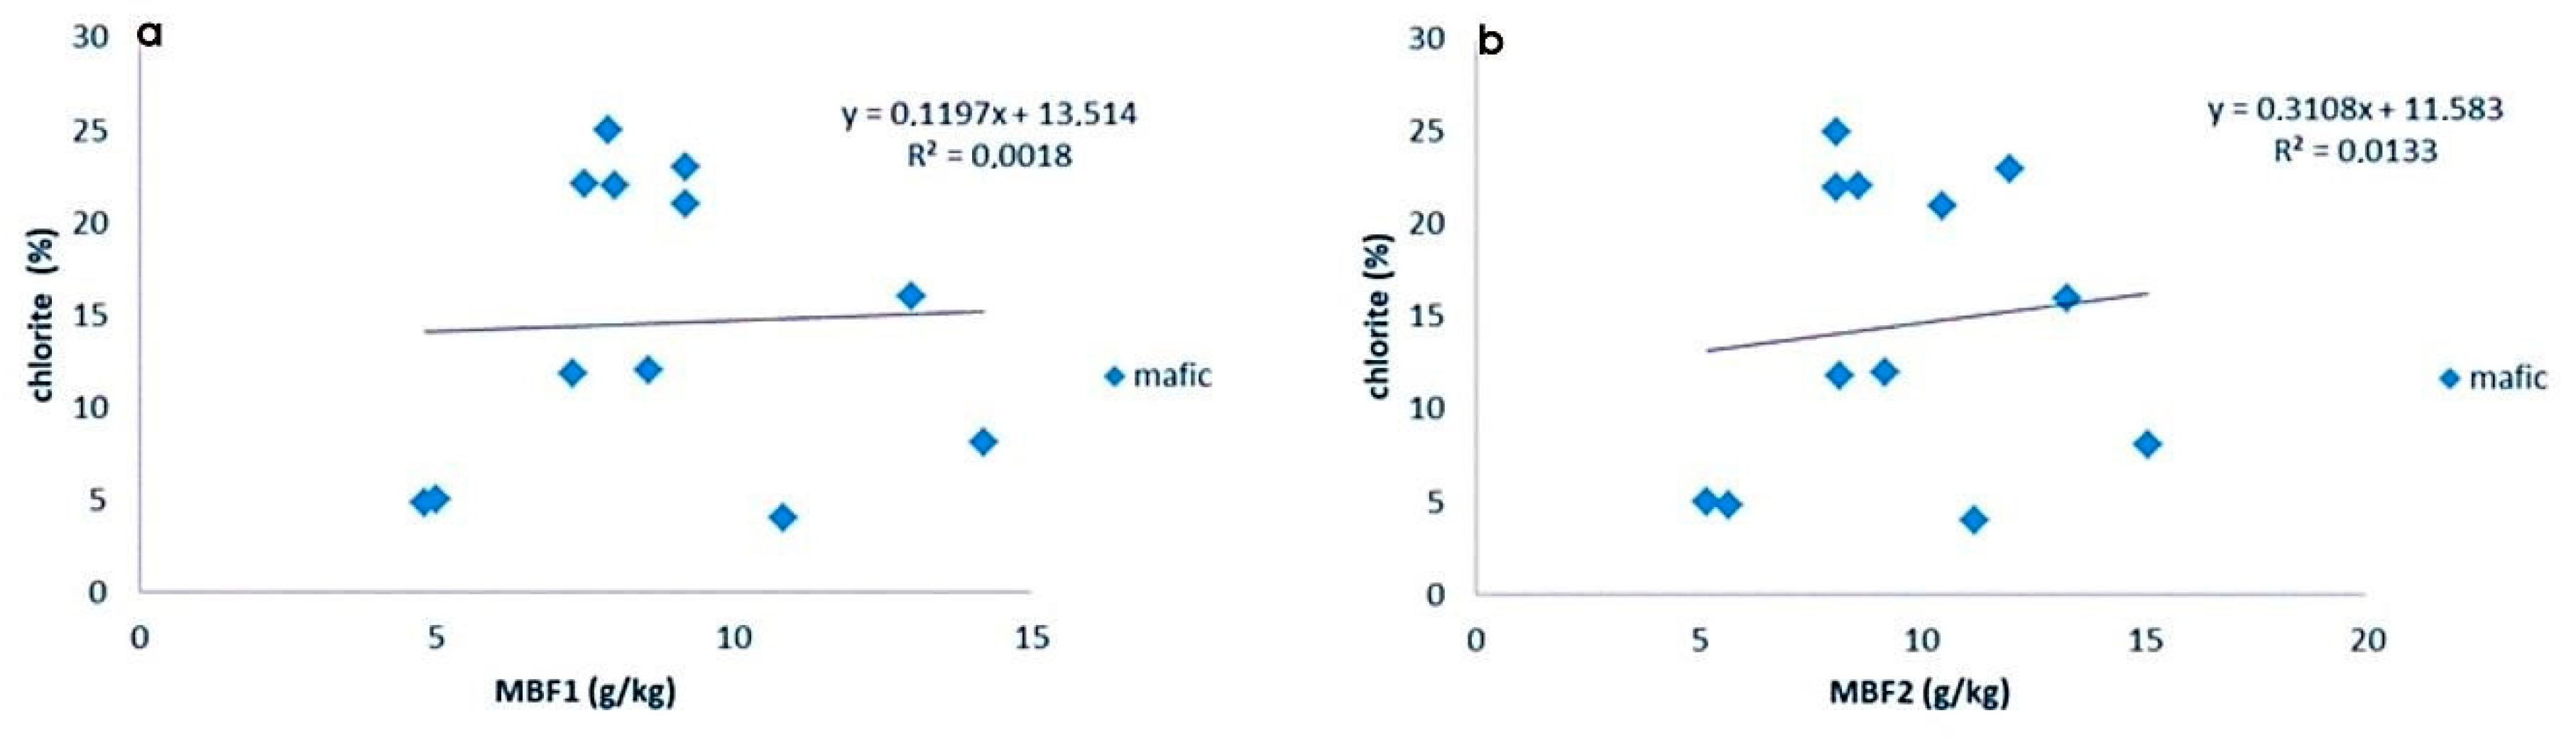
  • The type and the percentage of chlorite content seem not to affect the methylene blue test values in mafic rocks (Group II).
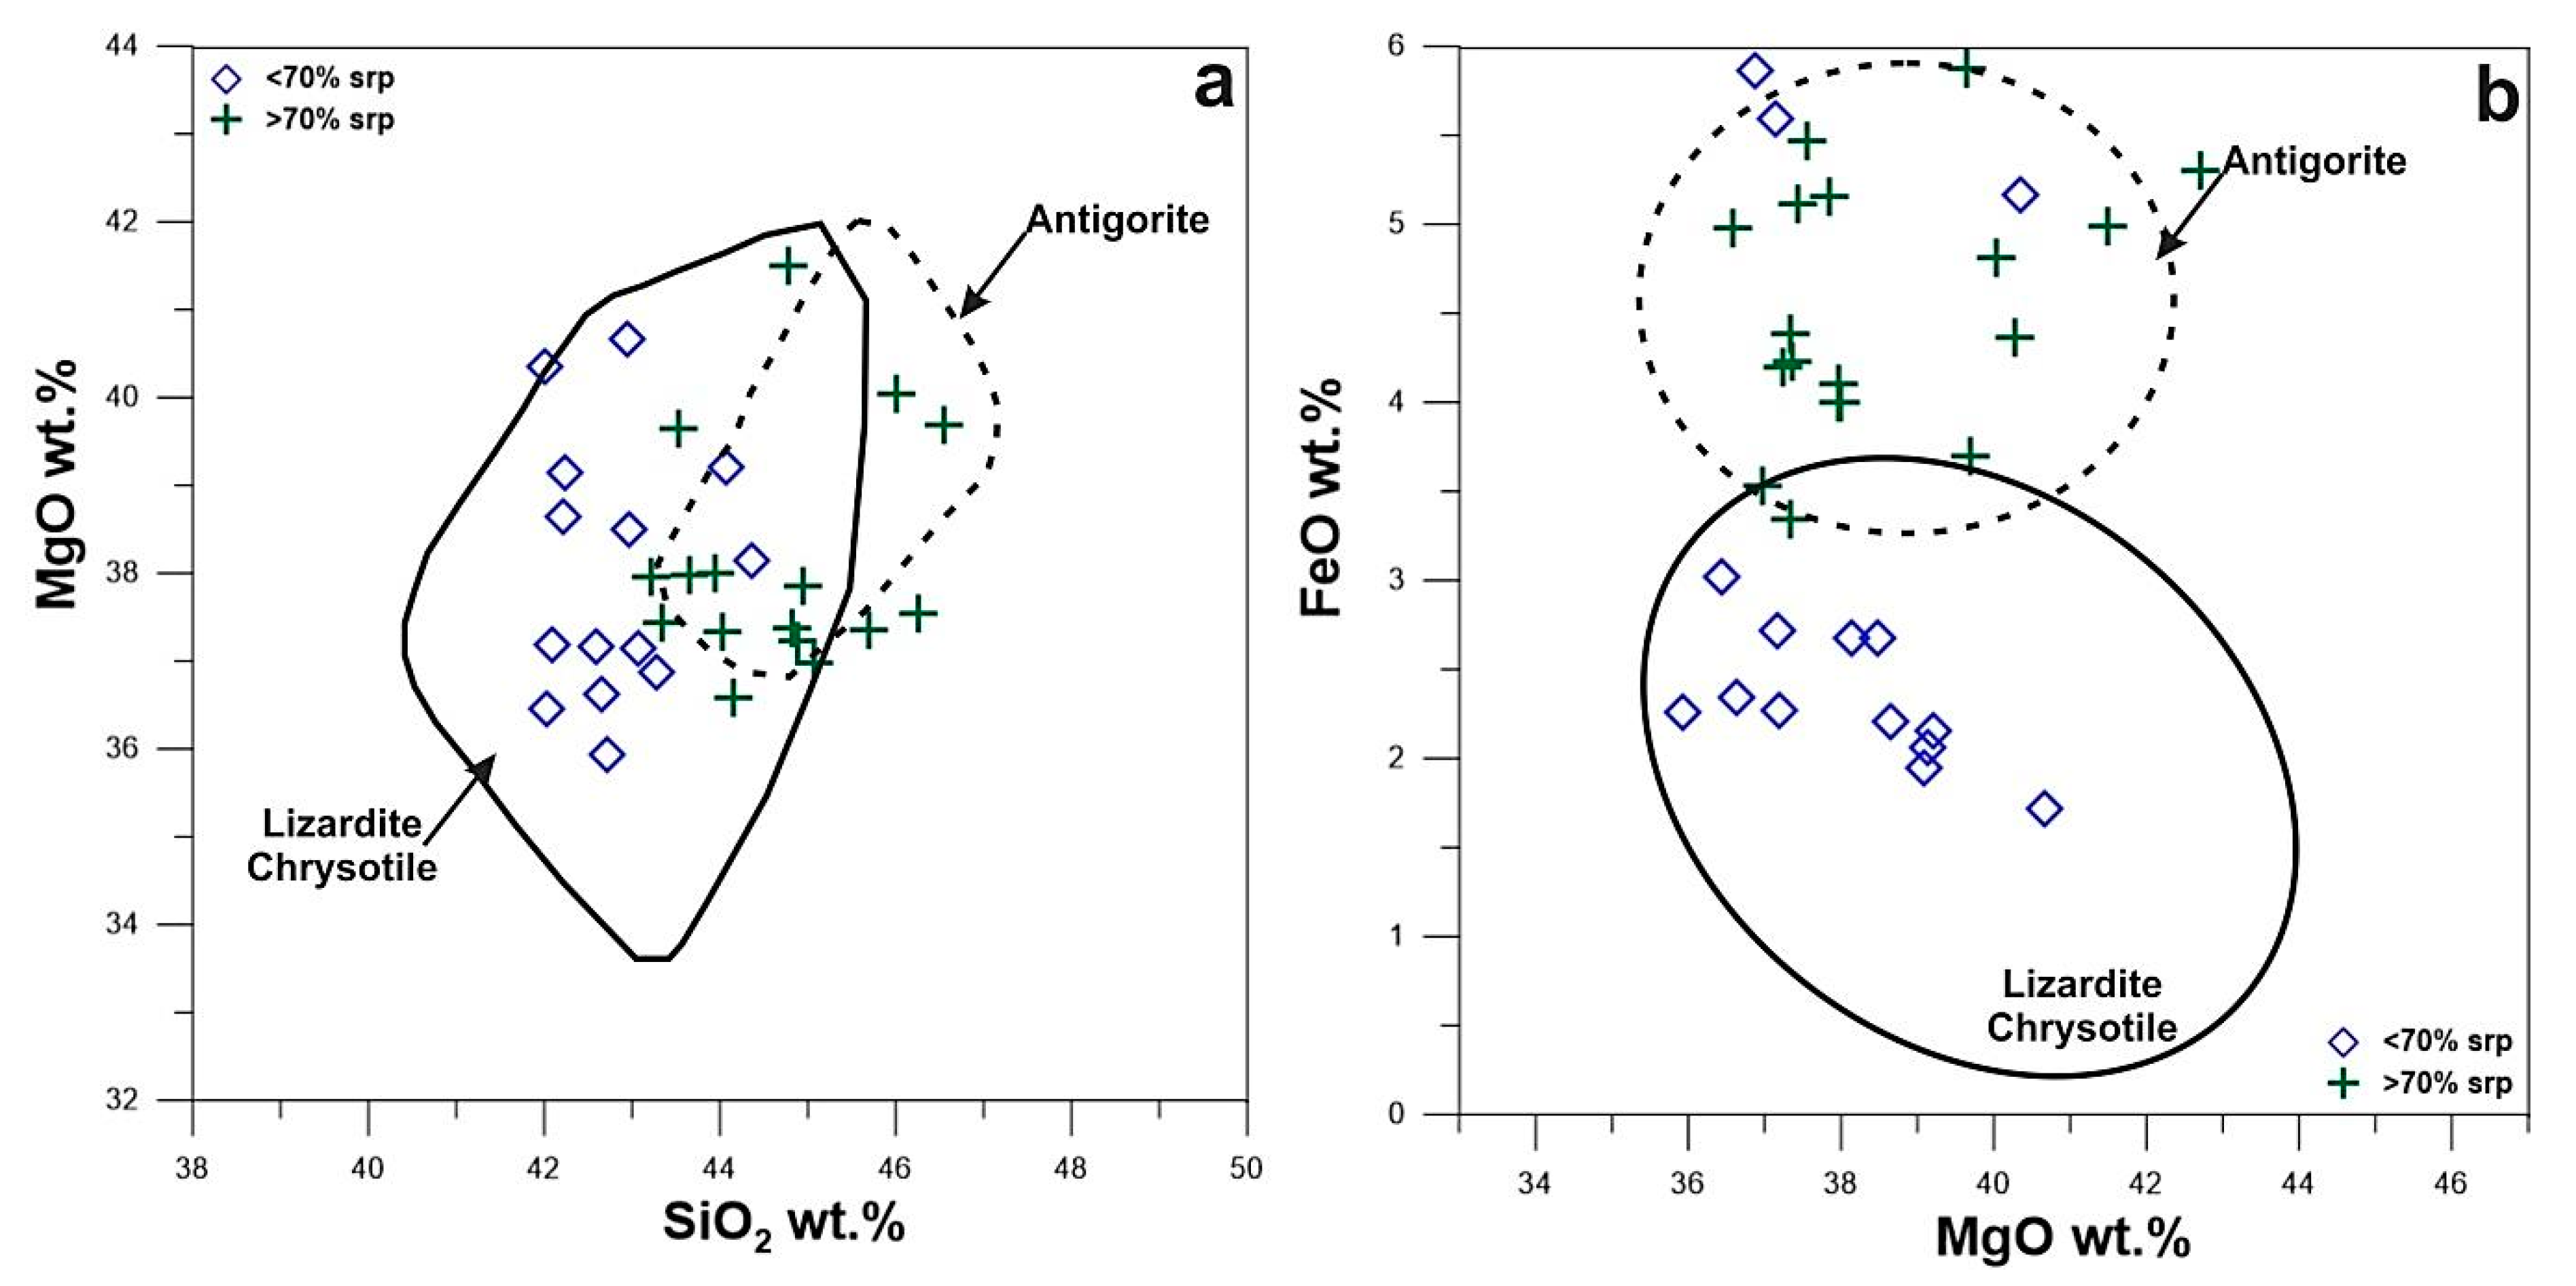
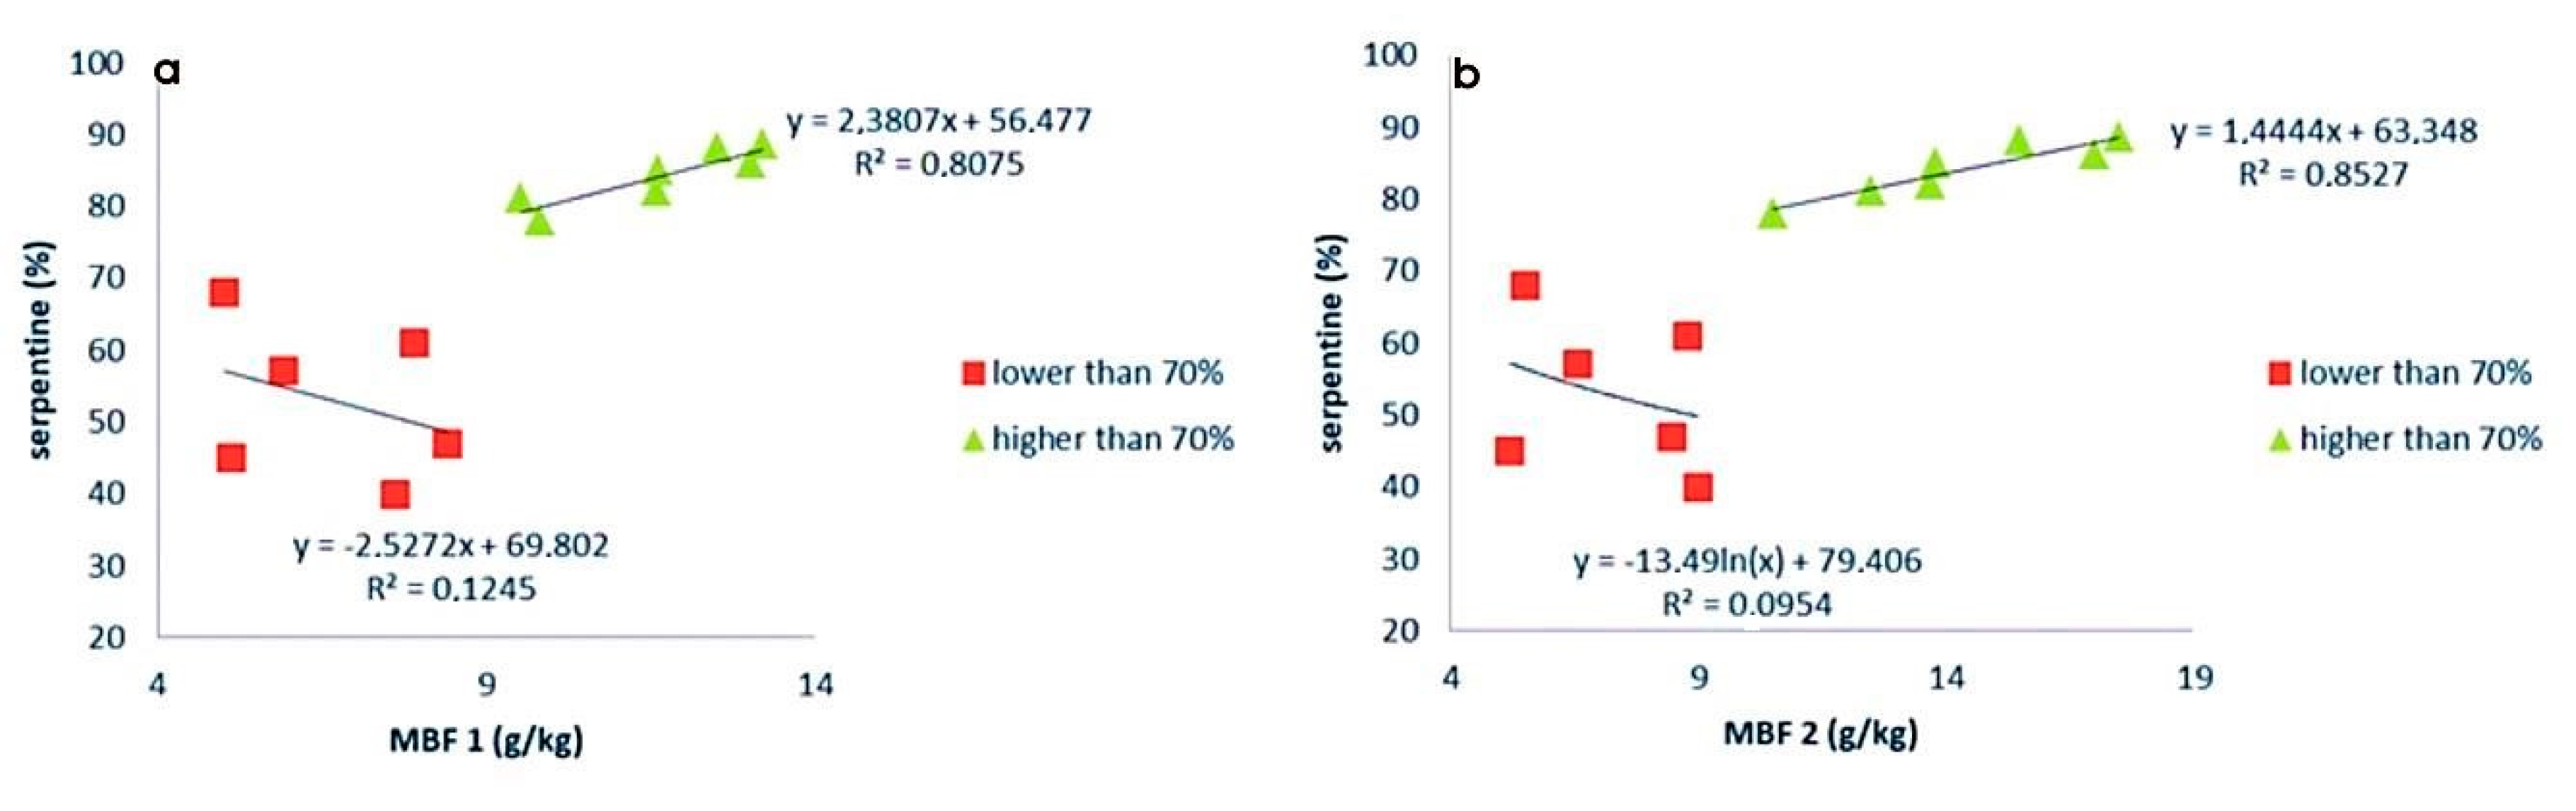
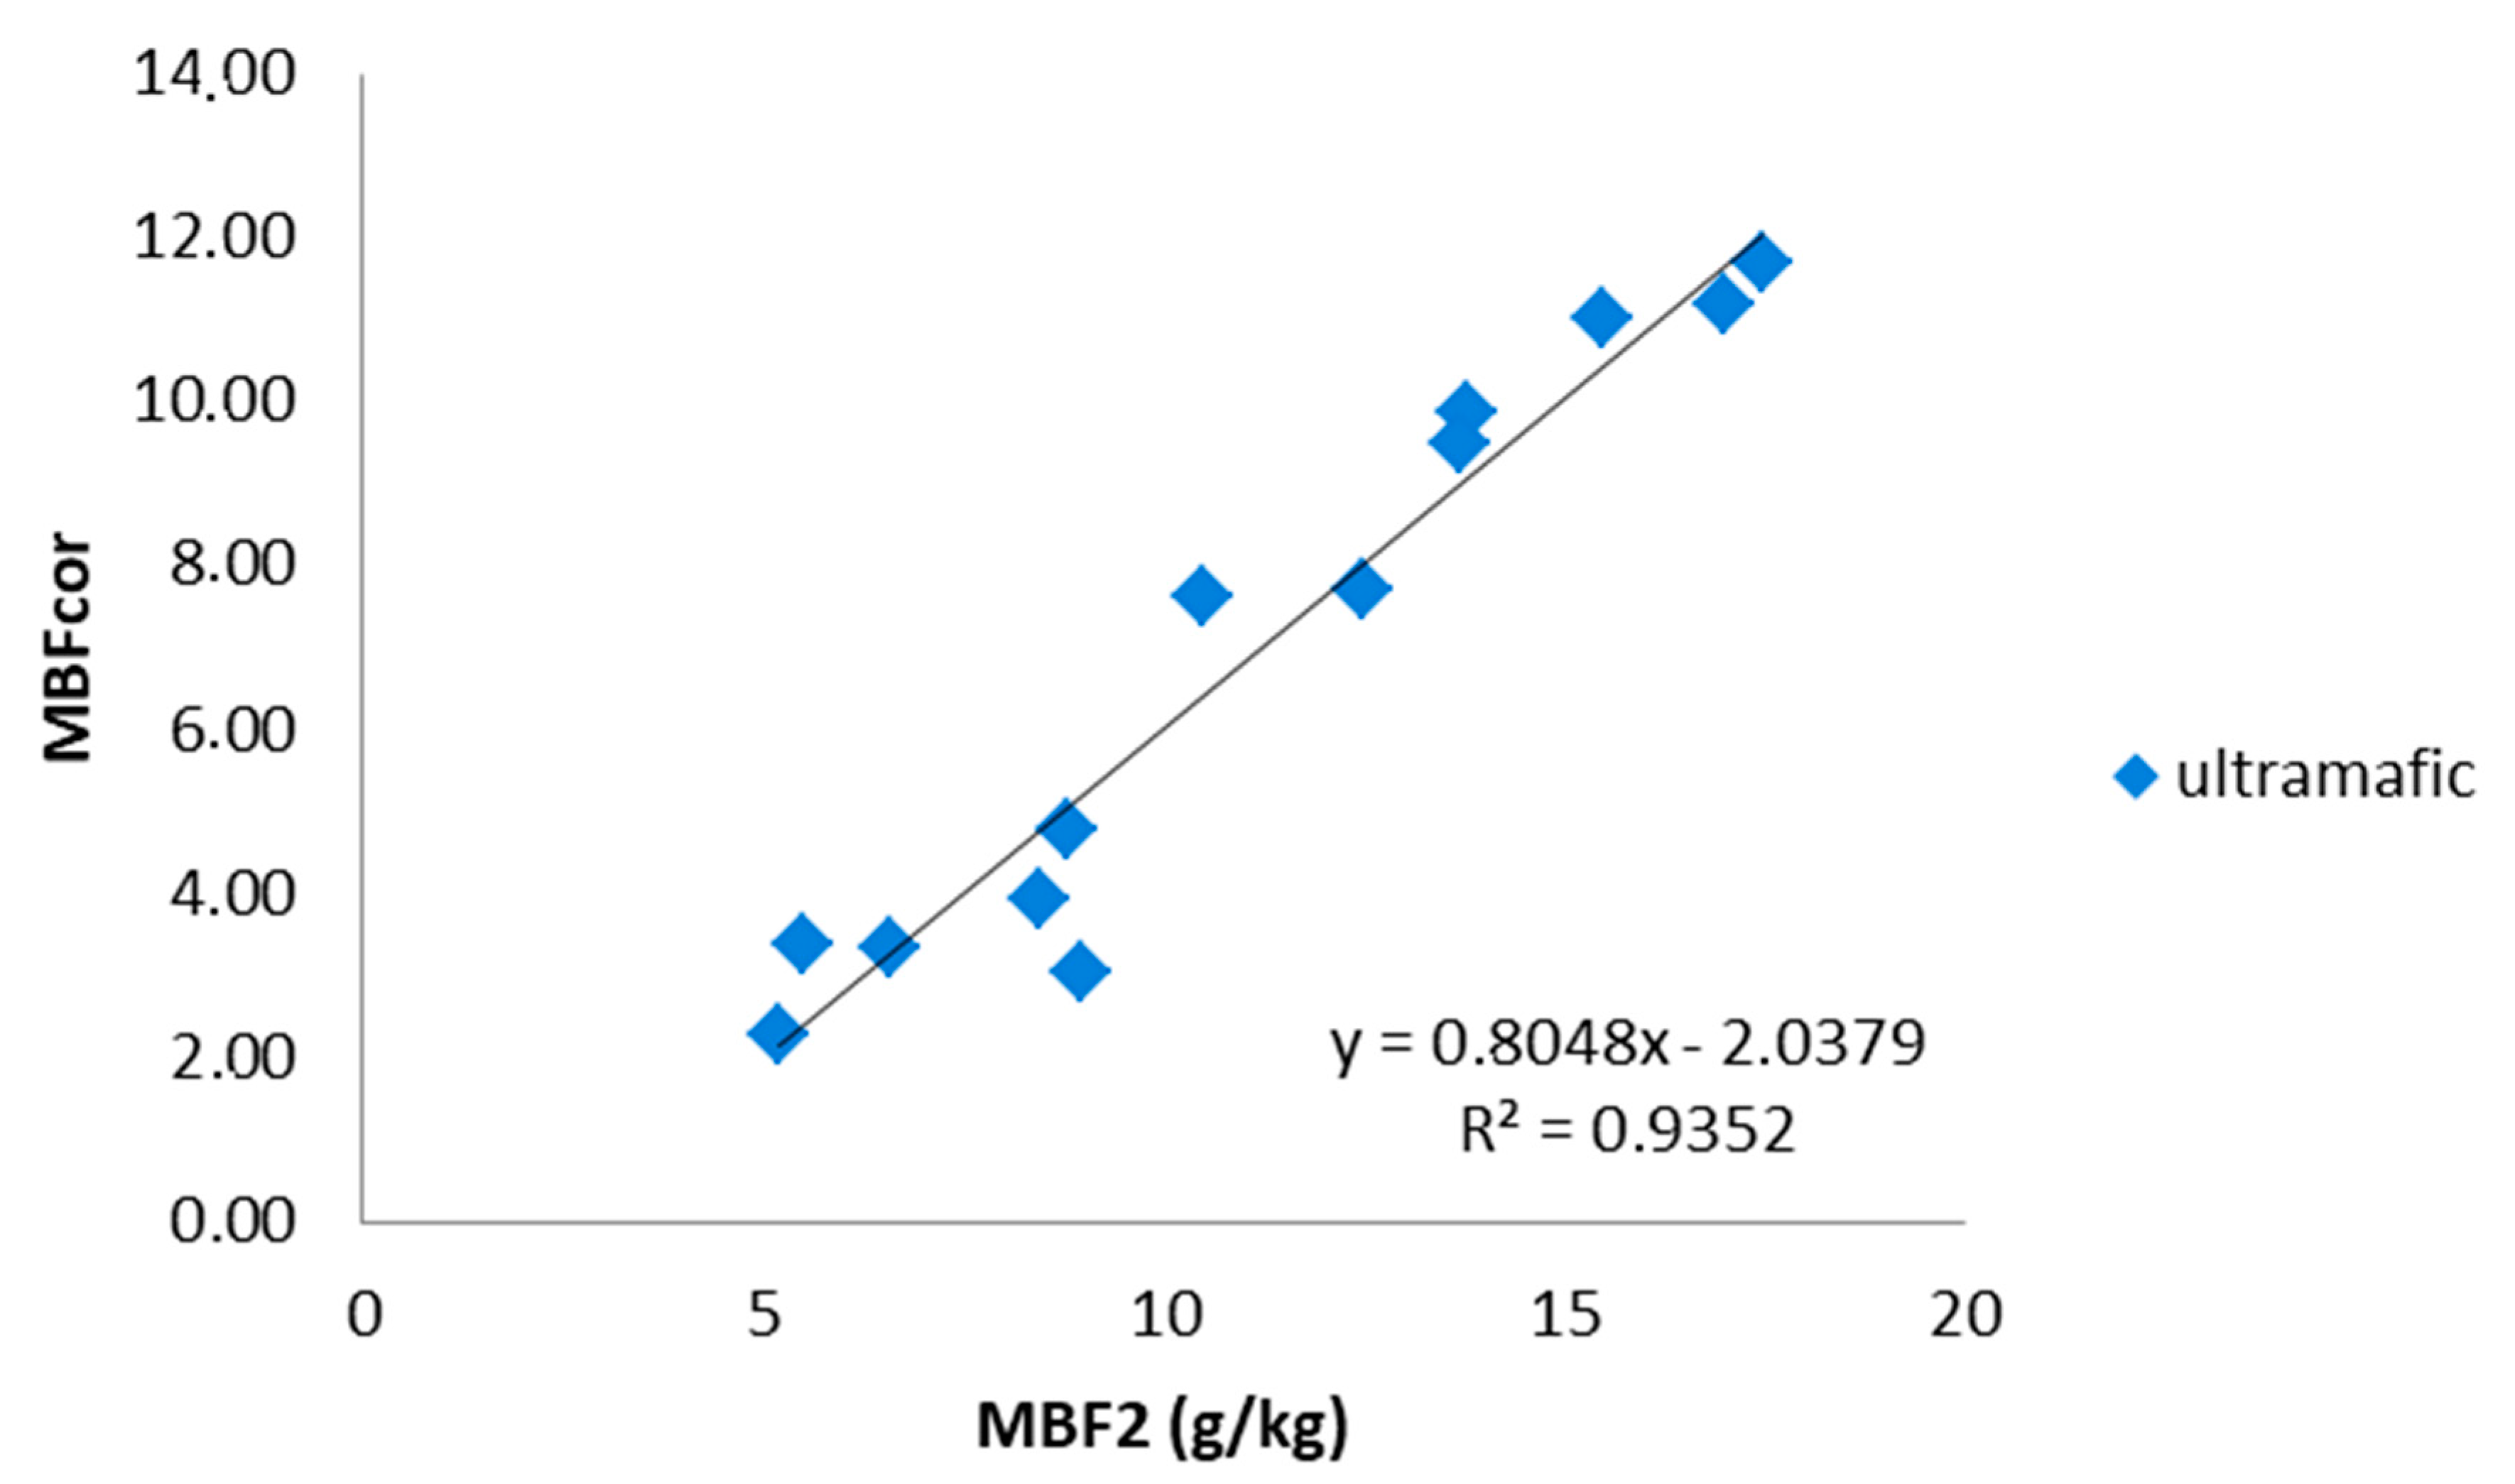
  • The content of serpentine in ultramafic rocks (Group III) is a determinant factor for the accuracy of the methylene blue test in these rocks, whereas 70% of content is shown to be a critical percentage.
To conclude, petrography constitutes the key for solving variable engineering problems emerging from the field of construction applications.

Author Contributions

P.P.G. took part in the performance of laboratory tests, the interpretation of the results and coordinated the research and the writing of the manuscript. P.P. took part in the fieldwork, the performance of the laboratory tests, the interpretation of the results and significantly participated in the manuscript writing. A.R. took part in the fieldwork and carried out the SEM work. P.L. carried out the XRD analyses, and joined in the interpretation of the results. E.G. performed part of the laboratory tests. D.P. participated in the laboratory tests and in the interpretation of the results. P.K. contributed in the performance of the laboratory tests. B.T. took part in the fieldwork and in the interpretation of the results. K.H. performed part of the interpretation of the results. All authors have read and agreed to the published version of the manuscript.

Funding

This research has not received external funding.

Acknowledgments

The authors thank A.K. Seferlis (Lab. El. Microscopy and Microanalysis, Univ. Patras) for his aid.

Conflicts of Interest

The authors declare no conflict of interest.

References

  1. Brigatti, M.F.; Galan, E.; Theng, B.K.G. Structures and mineralogy of clay minerals. Handb. Clay Sci. 2006, 1, 19–86. [Google Scholar]
  2. Sengupta, A.; Kadam, R.M.; Rajeswari, B.; Dhobale, A.R.; Babu, Y.; Godbole, S.V. Characterization of Indian serpentine by X-Ray diffraction, photoacoustic spectroscopy and electron paramagnetic resonance spectroscopy. Appl. Clay Sci. 2010, 50, 305–310. [Google Scholar] [CrossRef]
  3. Brindley, G.W.; Brown, G. Mineralogical Society Monograph No. 5. Crystal structures of clay minerals and their X-ray identification. Miner. Soc. London 1980, 5, 249–303. [Google Scholar]
  4. Chamley, H. Clay Sedimentology; Sringer: Berlin, Germany, 1989. [Google Scholar]
  5. Reid-Soukup, D.; Ulery, A. Soil Mineralogy with Environmental Applications; Soil Science of America, Inc.: Madison, WI, USA, 2002; pp. 467–500. [Google Scholar]
  6. Woodward, D.; Woodside, A.; Jellie, J. Clay in rocks. Soc. Chem. Ind. 2002, 124, 1–12. [Google Scholar]
  7. Wicks, F.J.; Whittaker, E.J.W. A reappraisal of the serpentine minerals. Can. Mineral. 1975, 13, 227–243. [Google Scholar]
  8. Evans, B.W.; Hattori, K.; Baronnet, A. Serpentinite: What, why, where? Elements 2013, 9, 99–106. [Google Scholar] [CrossRef]
  9. Grobety, B. Polytypes and hugher-ordr structures of antigorite: A TEM study. Am. Mineral. 2003, 88, 27–36. [Google Scholar] [CrossRef]
  10. Palacios-Lidon, E.; Grauby, O.; Henry, C.; Astier, J.P.; Barth, C.; Baronnet, A. TEM-assisted dynamic scanning force microscope imaging of (001) antigorite: Surfaces and steps on a modulated silicate. Am. Mineral. 2010, 95, 673–685. [Google Scholar] [CrossRef]
  11. Mellini, M. The crystal structure of lizardite 1T: Hydrogen bonds and polytypism. Am. Mineral. 1982, 67, 587–598. [Google Scholar]
  12. Petrounias, P.; Giannakopoulou, P.P.; Rogkala, A.; Stamatis, P.M.; Tsikouras, B.; Papoulis, D.; Lampropoulou, P.; Hatzipanagiotou, K. The Influence of Alteration of Aggregates on the Quality of the Concrete: A Case Study from Serpentinites and Andesites from Central Macedonia (North Greece). Geosciences 2018, 8, 115. [Google Scholar] [CrossRef] [Green Version]
  13. Madsen, F.T.; Muller Vonmoos, M. The swelling behavior of clays. Appl. Clay Sci. 1989, 4, 143–156. [Google Scholar] [CrossRef]
  14. Bish, D.L.; Howard, S.A. Quantitative phase analysis using the Rietveld Method. J. Appl. Cryst. 1988, 21, 86–91. [Google Scholar] [CrossRef]
  15. Hillier, S. Accurate quantitative analysis of clay and other minerals in sandstones by XRD: Comparison of a Rietveld and a reference intensity ratio (RIR) method and the importance of sample preparation. Clay Miner. 2000, 35, 291–302. [Google Scholar] [CrossRef]
  16. Bish, D.L.; Post, J.E. Quantitative mineralogical analysis using the Rietveld full pattern fitting method. Am. Mineral. 1993, 78, 932–940. [Google Scholar]
  17. Gualtieri, A.F. Accuracy of XRPD QPA using the combined Rietveld-RIR Method. J. Appl. Crystallogr. 2000, 33, 267–278. [Google Scholar] [CrossRef]
  18. McCusker, L.B.; Von Dreele, R.B.; Cox, D.E.; Louer, D.; Scardi, P. Rietveld refinement guidelines. J. Appl. Crystallogr. 1999, 32, 36–50. [Google Scholar] [CrossRef] [Green Version]
  19. Giannakopoulou, P.P.; Petrounias, P.; Tsikouras, B.; Kalaitzidis, S.; Rogkala, A.; Hatzipanagiotou, K.; Tombros, S.F. Using Factor Analysis to Determine the Interrelationships between the Engineering Properties of Aggregates from Igneous Rocks in Greece. Minerals 2018, 8, 580. [Google Scholar] [CrossRef] [Green Version]
  20. Hang, P.T.; Brindley, G.W. Methylene blue adsorption by clay minerals: Determination of surface areas and cation exchange capacities (clay-organic studies XVIII). Clays Clay Miner. 1970, 18, 203–212. [Google Scholar] [CrossRef]
  21. Chiappone, A.; Marello, S.; Scavia, C.; Setti, M. Clay mineral characterization through the methylene blue test: Comparison with other experimental techniques and applications of the method. Can. Geotech. J. 2004, 41, 1168–1178. [Google Scholar] [CrossRef]
  22. Yukselen, Y.; Kaya, A. Comparison of methods for determining specific surface area of soils. J. Geotech. Geoenviron. Eng. ASCE. 2006, 132, 931–936. [Google Scholar] [CrossRef]
  23. Stapel, E.E.; Verhoef, P.N.W. The use of methylene blue absorption test in assessing the quality of basaltic tuff rock aggregate. Eng. Geol. 1989, 26, 233–246. [Google Scholar] [CrossRef]
  24. Part 3: Procedure and Terminology for Simplified Petrographic Description; EN 932; European Standard: Warsaw, Poland, 1996.
  25. EΝ 933-9, Tests for Geometrical Properties of Aggregates—Part 9: Assessment of Fines-Methylene Blue Tests; European Committee for Standardization: Brussels, Belgium, 1998.
  26. Bailey, S.W. Summary of recommendations of AIPEA nomenclature committee on clay minerals. Am. Mineral. 1980, 65, 1–7. [Google Scholar]
  27. Singh, A.K.; Singh, R.B. Genetic implications of Zn- and Mn-rich Cr-spinels in serpentinites of the Tidding Suture Zone, eastern Himalaya, NE India. Geol. J. 2013, 48, 22–38. [Google Scholar] [CrossRef]
  28. Petrounias, P.; Giannakopoulou, P.P.; Rogkala, A.; Lampropoulou, P.; Koutsopoulou, E.; Papoulis, D.; Tsikouras, B.; Hatzipanagiotou, K. The Impact of Secondary Phyllosilicate Minerals on the Engineering Properties of Various Igneous Aggregates from Greece. Minerals 2018, 8, 329. [Google Scholar] [CrossRef] [Green Version]
  29. Douglas, M.C.; MacEwan, D.M.C.; Wilson, M.J. Interlayer and intercalation complexes of clay minerals. In Crystals Structures of Clay Minerals and their Identification; Brindley, G.W., Brown, G., Eds.; Mineralogical Society, London: London, UK, 1980; Volume 5, pp. 197–248. [Google Scholar]
  30. Millot, G. Geologie des argiles; Masson: Paris, France, 1964; 499p. [Google Scholar]
  31. Ji, S.; Zhu, J.; He, H.; Tao, Q.; Zhu, R.; Ma, L.; Chen, M.; Li, S.; Zhou, J. Conversion of serpentine to smectite under hydrothermal condition: Implication for solid-state transformation. Am. Mineral 2018, 103, 241–251. [Google Scholar] [CrossRef] [Green Version]
Figure 1. Simplified map showing the sampling areas in the red rectangles.
Minerals 10 00283 g001
Figure 2. Photomicrographs of representative investigated rocks (XPL: cross polarized light) presenting: (a) Dacite showing porphyritic texture with phenocrysts of plagioclase, biotite and sanidine (sample S4), (b) porphyritic texture in andesite containing phenocrysts of plagioclase, biotite, amphibole and clinopyroxene (sample S6), (c) gabbro exhibiting granular texture (sample S15), (d) diabase exhibiting subophitic texture (sample S9), (e) cataclastic texture in a serpentinized lherzolite with lamellae extinction of clinopyroxene crystals (sample 31), (f) serpentinized lherzolite with few relics of clinopyroxene (sample 27). ep: epidote, san: sanidine; cpx: clinopyroxene, plg: plagioclase, opx: orthopyroxene; sp: spinel; amp: amphibole; chl: chlorite, srp: serpentine, bi: biotite.
Minerals 10 00283 g002
Figure 3. X-ray diffraction (XRD) patterns of the representative investigated samples: (a) andesite (Group I), (b) dacite (Group I), (c) diabase (Group II), (d) gabbro (Group II), (e) serpentinized harzburgite (Group III), (f) serpentinized harzburgite (Group III) (1: clinopyroxene, 2: plagioclase, 3: alkali feldspar, 4: illite, 5: biotite, 6: hematite, 7: orthopyroxene, 8: hornblende, 9: chlorite, 10: serpentine, 11: actinolite, 12: quartz, 13: epidote, 14: titanite, 15: pumpellyite, 16: prehnite, 17:olivine, 18: spinel, 19: magnetite).
Minerals 10 00283 g003
Figure 4. X-ray diffraction patterns of the clay fraction of representative examined samples: (a) dacite (Group I), (b) dacite (Group I), (c) andesite (Group I), (d) andesite (Group I), (e) diabase (Group II), (f) diabase (Group II), (g) gabbro (Group II), (h) diabase (Group II) (AD: air-dried, EG: glycolated, HE: heated, 1: chlorite, 2: actinolite, 3: plagioclase, 8: biotite, 9: hornblende, 10: alkali feldspar, 11: illite, 12: smectite).
Minerals 10 00283 g004
Figure 5. X-ray diffraction patterns of the clay fraction of representative examined samples: (a) gabbro (Group II), (b) gabbro (Group II), (c) serpentinized harzburgite (Group III), (d) serpentinized harzburgite (Group III), (e) serpentinized harzburgite (Group III), (f) serpentinized dunite (Group III), (g) serpentinized harzburgite (Group III), (h) serpentinized lherzolite (Group III) (AD: air-dried, EG: glycolated, HE: heated, 1: chlorite, 2: amphibole, 3: plagioclase, 4: serpentine, 5: talc, 6: brucite, 7: spinel).
Minerals 10 00283 g005
Figure 6. Plots of analyzed chlorite on their classification diagram of the examined mafic rocks according to Bailey [26].
Minerals 10 00283 g006
Figure 7. (a) MgO versus SiO2 plot and (b) FeO versus MgO plot for the analyzed serpentine minerals in examined serpentinized ultramafic. Fields of antigorite, lizardite and chrysotile are from Singh and Singh [27].
Minerals 10 00283 g007
Figure 8. (a) Methylene blue test (MBF 1) plotted against the smectite content of the intermediate studied rocks, (b) modified methylene blue test (MBF 2) plotted against the smectite content of the intermediate studied rocks.
Minerals 10 00283 g008
Figure 9. (a) Methylene blue test (MBF 1) plotted against the chlorite content of the mafic studied rocks, (b) modified methylene blue test (MBF 2) plotted against the chlorite content of the mafic studied rocks.
Minerals 10 00283 g009
Figure 10. (a) Methylene blue test (MBF 1) plotted against the chlorite content of the ultramafic studied rocks, (b) modified methylene blue test (MBF 2) plotted against the chlorite content of the ultramafic studied rocks.
Minerals 10 00283 g010
Figure 11. The modified methylene blue test (MBF 2) plotted against the correction index of the methylene blue test (MBFcor) of the ultramafic rock samples.
Minerals 10 00283 g011
Table 1. Clay minerals’ content from the examined rocks (-, not detected). The quantification errors of 1 wt.% were calculated according to Bish and Post [16].
SamplesGeological SourceGroupSmectite (%)Chlorite (%)Serpentine (%)
S1Ag.TheodoriGroup I-Intermediate2.0--
S2Ag. Theodori2.2--
S3Veria-Naousa0.7--
S4Ag. Theodori1.2--
S5Veria-Naousa0.4--
S6Veria-Naousa1.9--
S7Veria-Naousa3.2--
S8EdessaGroup II-mafic-23.0-
S9Edessa-21.0-
S10Edessa-25.0-
S11Guevgueli-4.0-
S12Guevgueli-5.0-
S13Guevgueli-8.1-
S14Guevgueli-16.0-
S15Guevgueli-13.0-
S16Veria-Naousa-22.0-
S17Veria-Naousa-22.1-
S18Guevgueli-4.8-
S19Guevgueli-12.0-
S20Guevgueli-11.8-
S21EdessaGroup III-ultramafic--88.6
S22Edessa--86.0
S23Edessa--88.0
S24Veria-Naousa--85.0
S25Gerania--78.0
S26Veria-Naousa--81.0
S27Veria-Naousa--82.0
S28Gerania--40.0
S29Gerania--45.0
S30Gerania--47.0
S31Gerania--61.0
S32Gerania--68.0
S33Gerania--57.0
Table 2. Representative electron microanalyses of chlorite from examined mafic rocks (-: below detection limit).
GabbroDiabase
SampleS10S15S8S12
Anal. No (Analytical Number)2825710137946
wt.%
SiO231.4529.3427.1428.3031.3829.9034.9630.7731.5130.1632.1532.00
TiO2----0.46-------
Al2O320.4617.4320.8020.1022.8917.7718.8419.4319.0316.9517.3619.73
Cr2O3--------0.21---
FeO16.1126.5624.9825.3316.3520.7820.3516.4415.3325.7319.7318.22
MgO20.7416.7515.1816.5215.4216.6916.2721.6321.8115.9918.8020.85
NiO-------0.23----
MnO0.26-0.36---0.300.260.23---
CaO----0.310.170.52-----
Na2O------------
K2O-0.22---0.16------
Sum89.0290.3088.4590.2386.8185.4791.2488.7688.1288.8388.0490.80
Formula Units Based on 28 Atoms of Oxygens
Si6.1296.0055.6345.7456.2356.2596.7366.0556.1946.2266.4536.172
Aliv1.8711.9952.3662.2551.7651.7411.2641.9451.8061.7741.5471.828
8.0008.0008.0008.0008.0008.0008.0008.0008.0008.0008.0008.000
Alvi2.8282.2092.7232.5533.5962.6433.0152.5612.6032.3502.5582.655
Ti----0.069-------
Fe2+2.6254.5464.3364.3002.7173.6383.7292.7052.5204.4423.3112.938
Cr--------0.033---
Mn0.043-0.063---0.0490.0430.038---
Mg6.0255.1104.6994.9984.5685.2084.6746.3456.3914.9215.6265.994
Ca----0.0660.0380.107-----
Na------------
K-0.057----------
Ni-------0.036----
11.52211.92211.82211.85111.01611.57011.12411.69211.58511.71211.49411.587
Total19.52219.92219.82219.85119.01619.57019.12419.69219.58519.71219.49419.587
Fet/(Fet + Mg)0.300.470.480.460.370.410.440.300.280.470.370.33
Table 3. Representative electron microanalyses of serpentine minerals from examined ultramafic rocks (-, below detection limit).
>70% Serpentine<70% Serpentine
SampleS21S25S24 S28
Anal. No4814165610135711134468
wt.%
SiO244.8944.0443.2243.5346.0144.1644.7846.5544.0742.9542.9742.7242.5943.0743.2842.02
TiO2-----------0.110.12---
Al2O3-------1.17---1.040.960.980.97-
Fe2O34.673.714.456.535.355.535.554.142.391.912.972.513.026.216.515.75
MnO----------------
MgO37.2337.3337.9639.6540.0336.5841.5039.6939.2040.6638.4935.9437.1737.1536.8740.36
CaO--------1.450.180.220.100.14---
Na2O-----------0.190.13---
K2O-----------0.05----
NiO-------0.28-------0.28
Cr2O3-0.920.81-------------
Sum86.7986.0086.4489.7191.3986.2791.8391.8387.1185.7084.6583.5685.3987.4187.6388.41
Formula Units Based on 7 Atoms of Oxygens
Si2.0872.0692.0301.9852.0422.0731.9882.0462.0452.0202.0472.0762.0422.0062.0121.949
Ti-----------0.0020.002---
Al-------0.061---0.0600.0540.0540.053-
Fe3+0.1630.1310.1570.2240.1790.1950.1850.1370.0830.0680.1060.0920.1090.2180.2280.201
Mn----------------
Mg2.5812.6142.6582.6952.6482.5602.7462.6012.7122.8502.7342.6042.6572.5802.5552.791
Ca--------0.0720.0090.0110.0030.007---
Na-----------0.0180.006---
K-----------0.003----
Ni-------0.010-------0.010
Cr-0.0340.030-------------
Total4.8314.8484.8764.9034.8694.8294.9194.8554.9134.9474.8994.8574.8774.8584.8484.951
Table 4. The results of the methylene blue test (MBF) and the modified methylene blue test (MBF 2) of the examined rocks.
SamplesGroupMBF 1 (g/kg)MBF 2 (g/kg)
S1Group I-Intermediate10.8511.60
S29.309.60
S37.407.60
S47.508.30
S56.206.60
S610.6010.80
S711.5012.00
S8Group II-mafic9.2012.00
S99.2010.50
S107.908.10
S1110.8511.20
S125.005.20
S1314.2015.10
S1413.0013.30
S158.008.70
S168.008.10
S177.508.60
S184.805.70
S198.569.20
S207.308.20
S21Group III-ultramafic13.2017.50
S2213.0017.00
S2312.5015.50
S2411.6013.80
S259.8010.50
S269.5012.50
S2711.5813.70
S287.609.00
S295.105.20
S308.408.46
S317.898.80
S325.005.50
S335.906.58
Table 5. The MBFcor index values of the examined ultramafic rock samples.
SamplesGroupMBFcor
S21Group III-ultramafic11.70
S2211.18
S2311.00
S249.86
S257.64
S267.70
S279.50
S283.04
S292.30
S303.95
S314.81
S323.40
S333.36

