The Viscosity and Atomic Structure of Volatile-Bearing Melilititic Melts at High Pressure and Temperature and the Transport of Deep Carbon

 ,
,  , and
, and
Abstract
:1. Introduction
2. Materials and Methods
3. Results
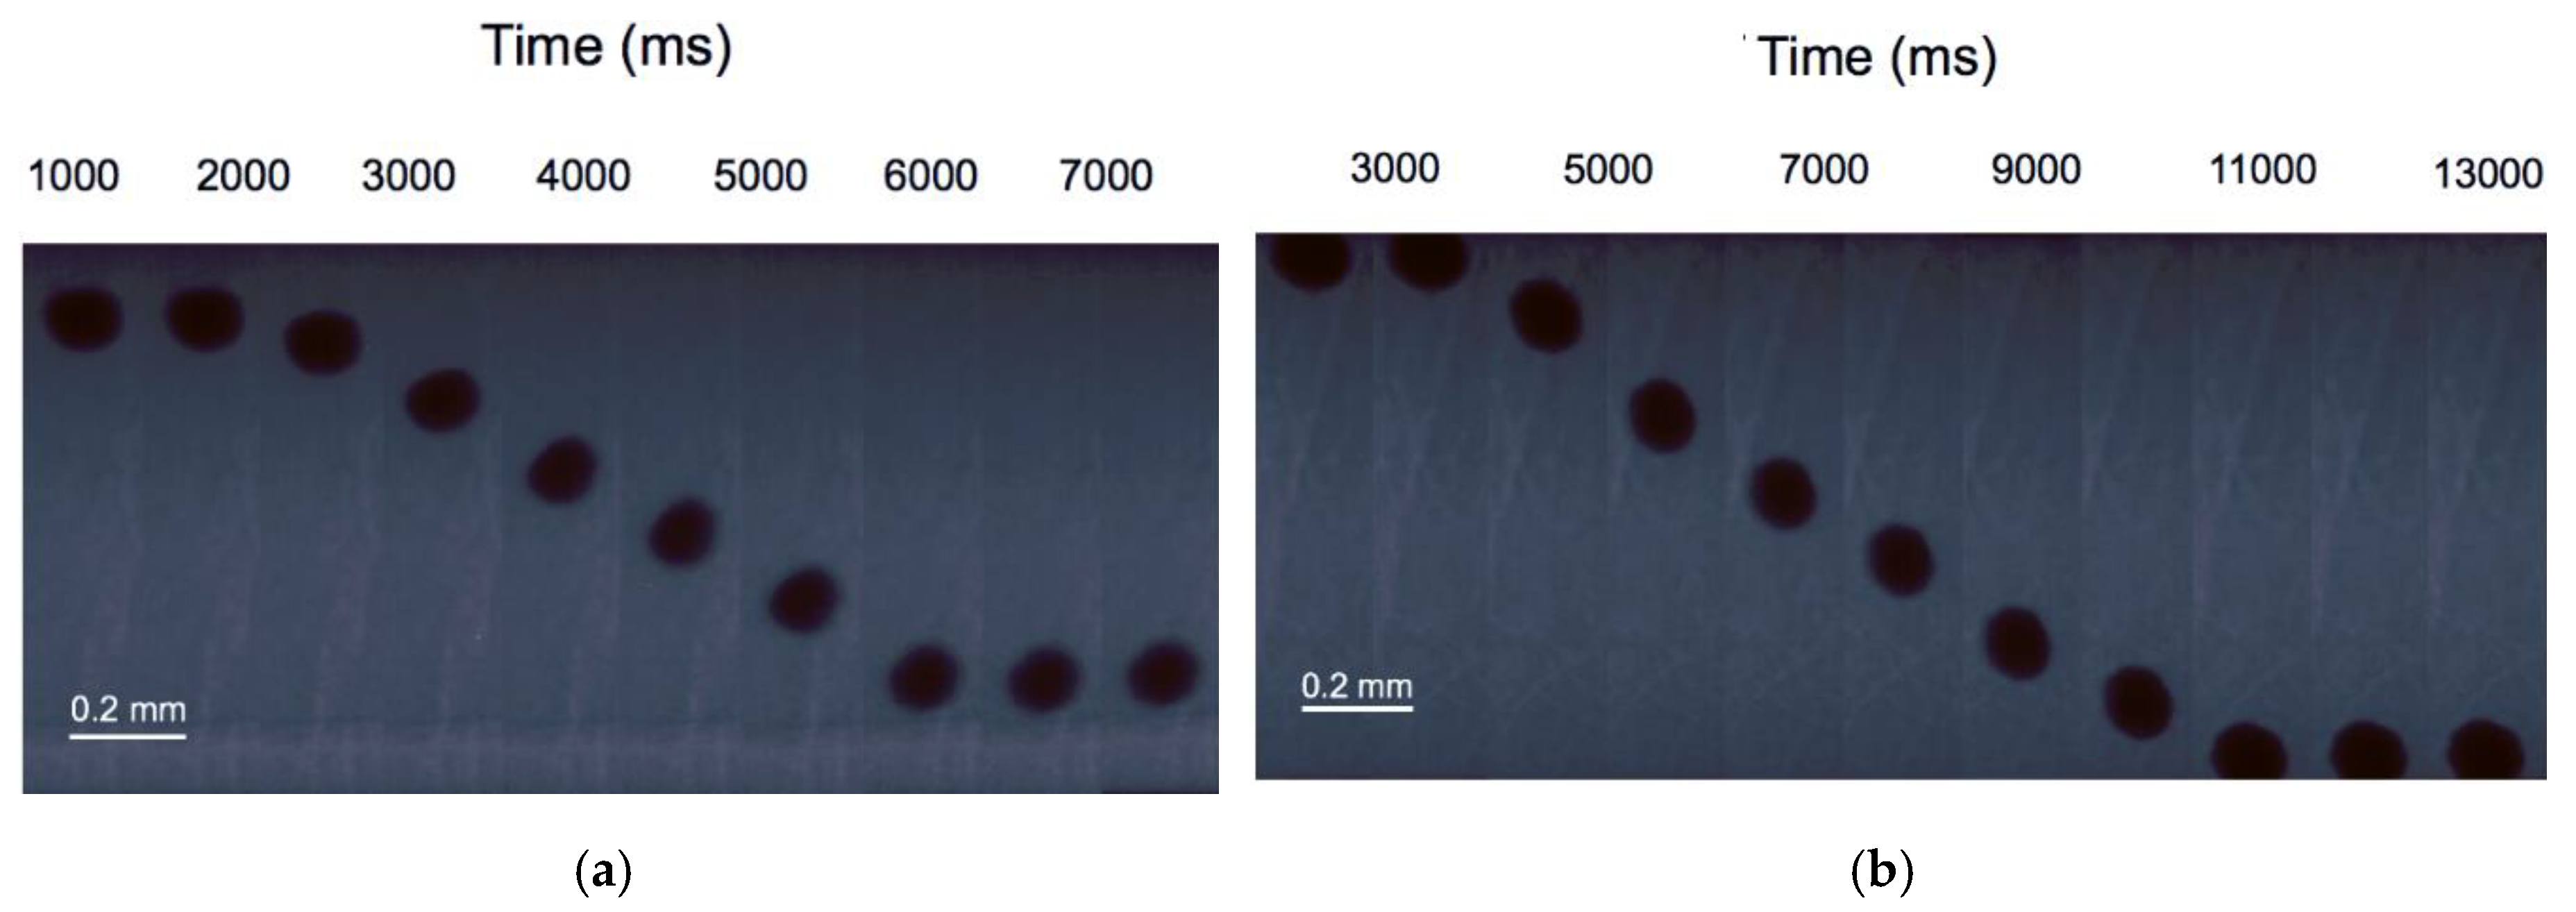
3.1. Melt Viscosity
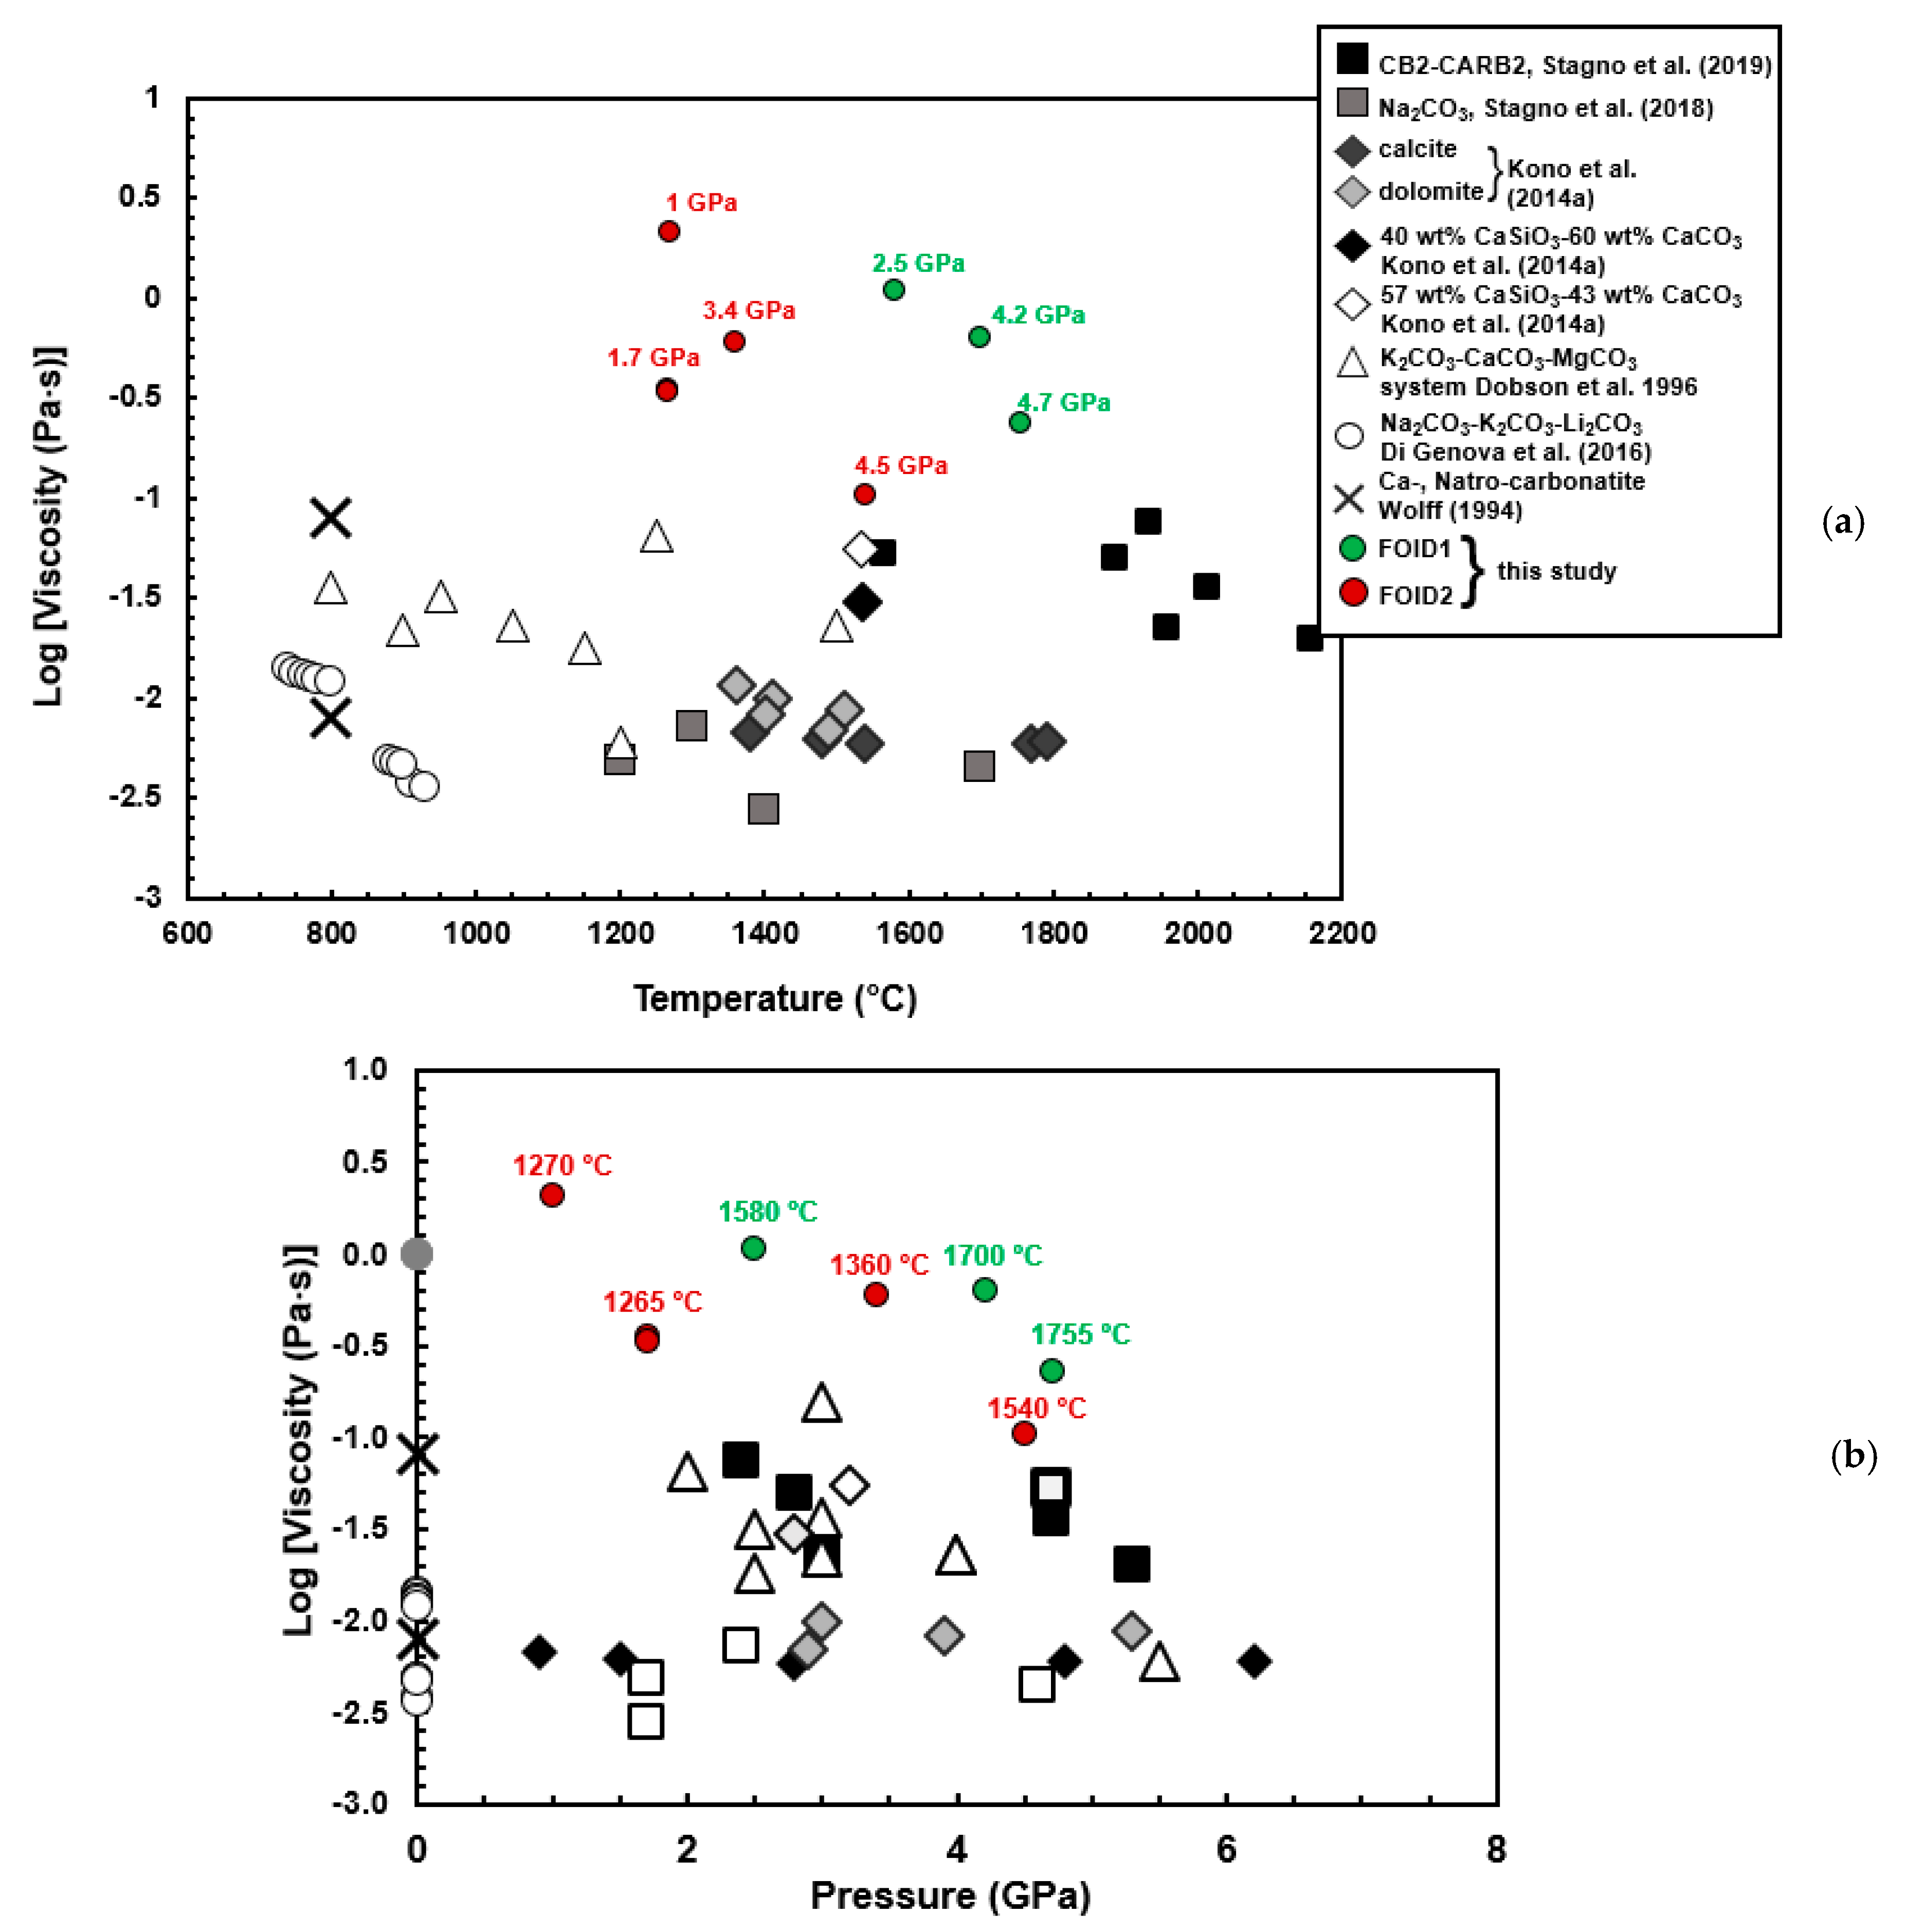
3.2. Effect of Pressure and Temperature on the Viscosity
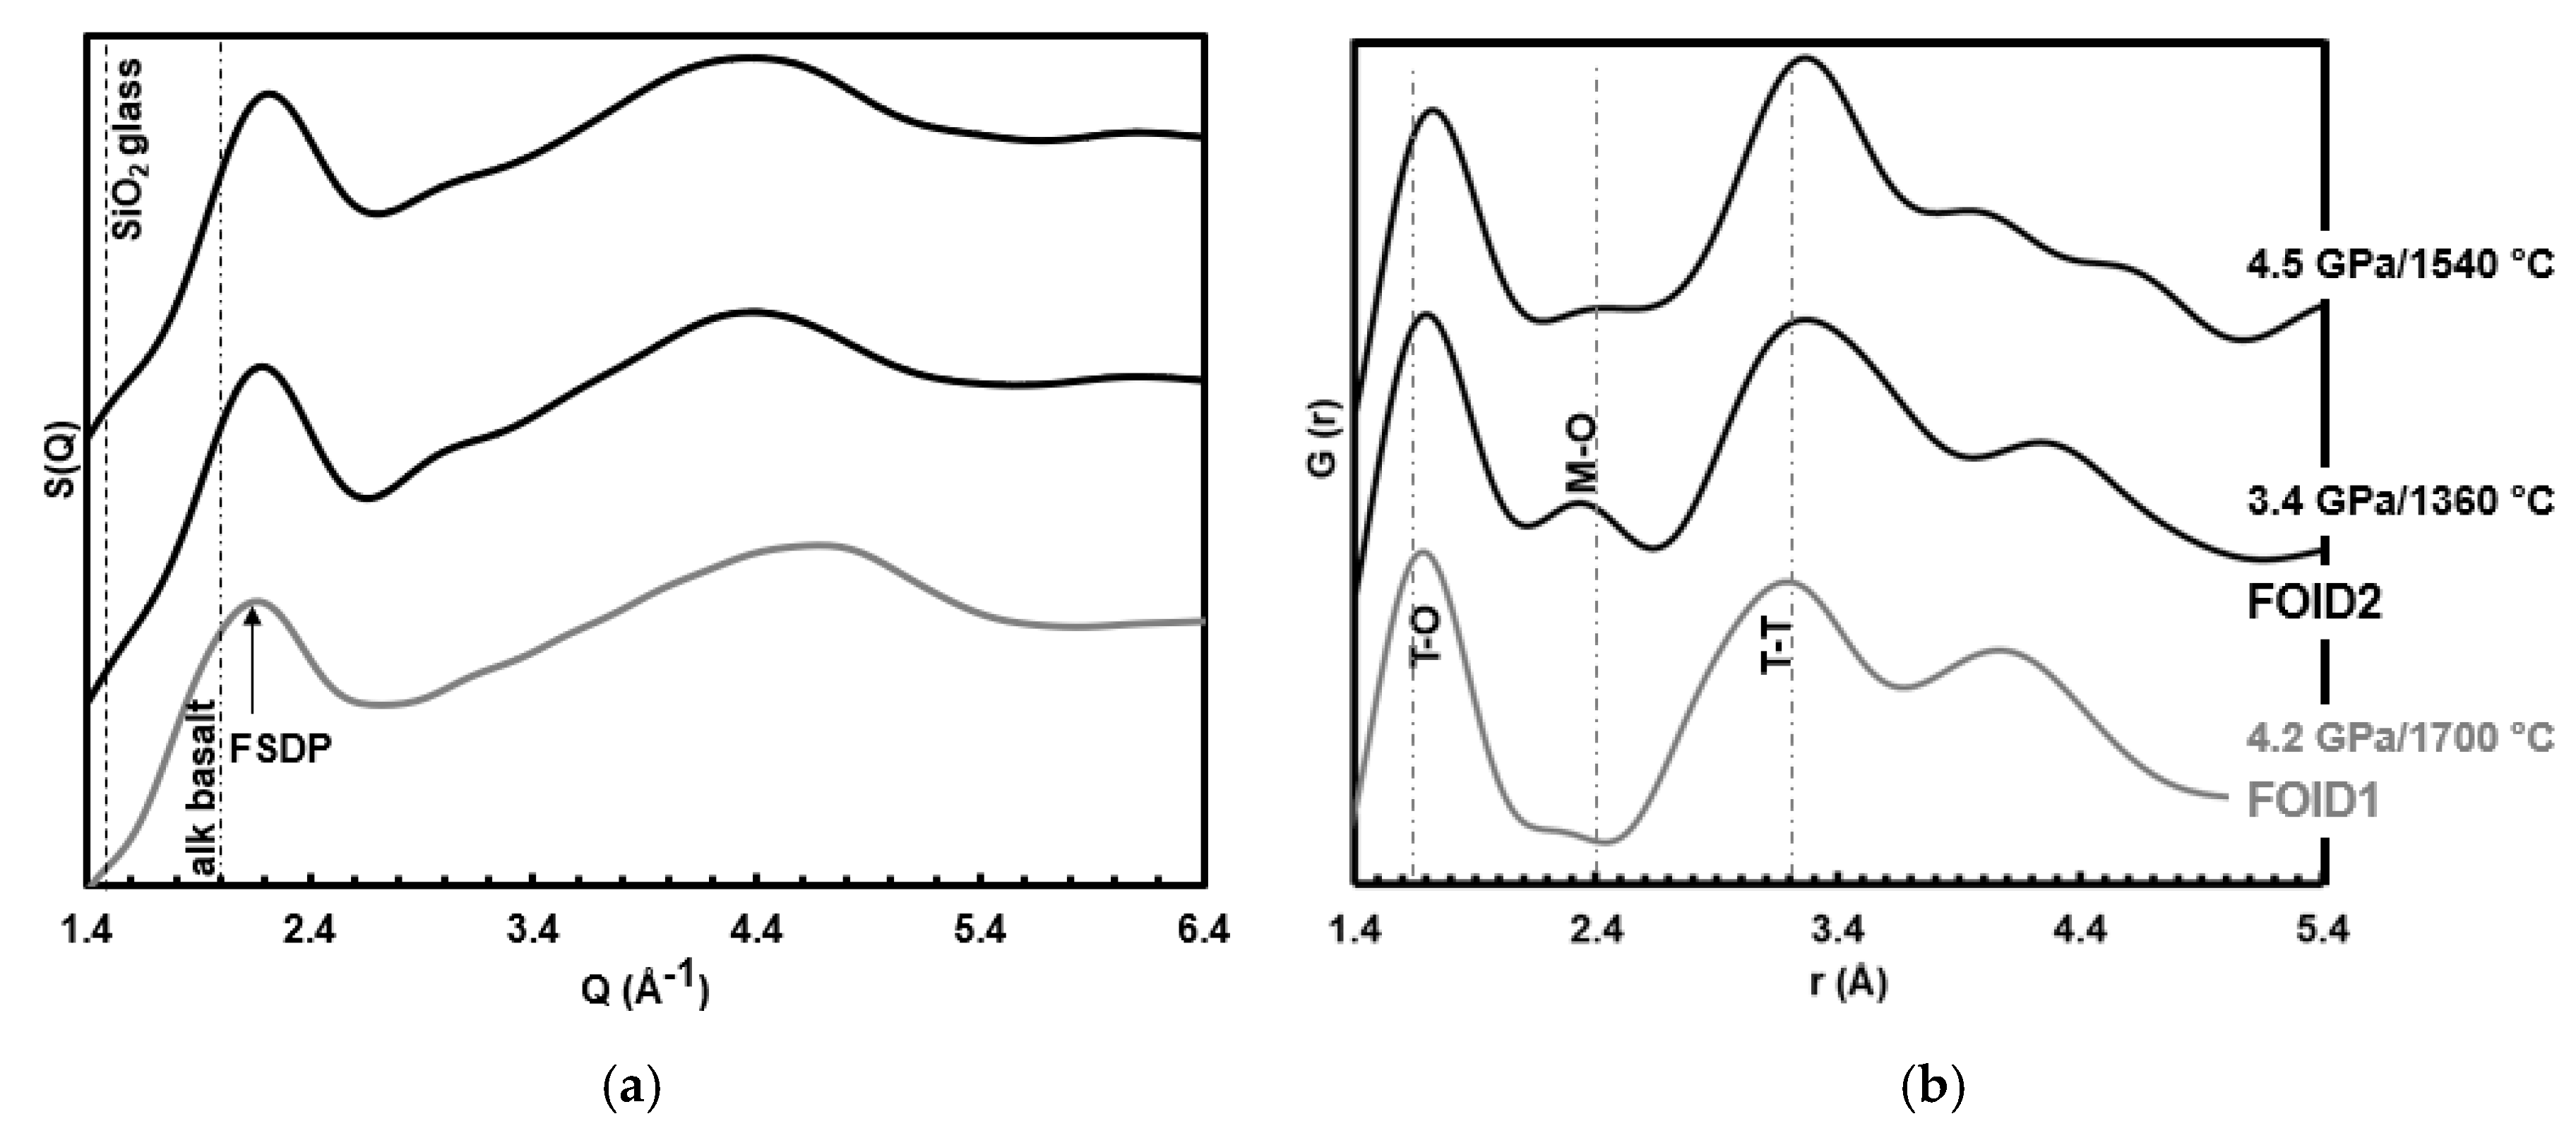
3.3. Melt Structure Measurements
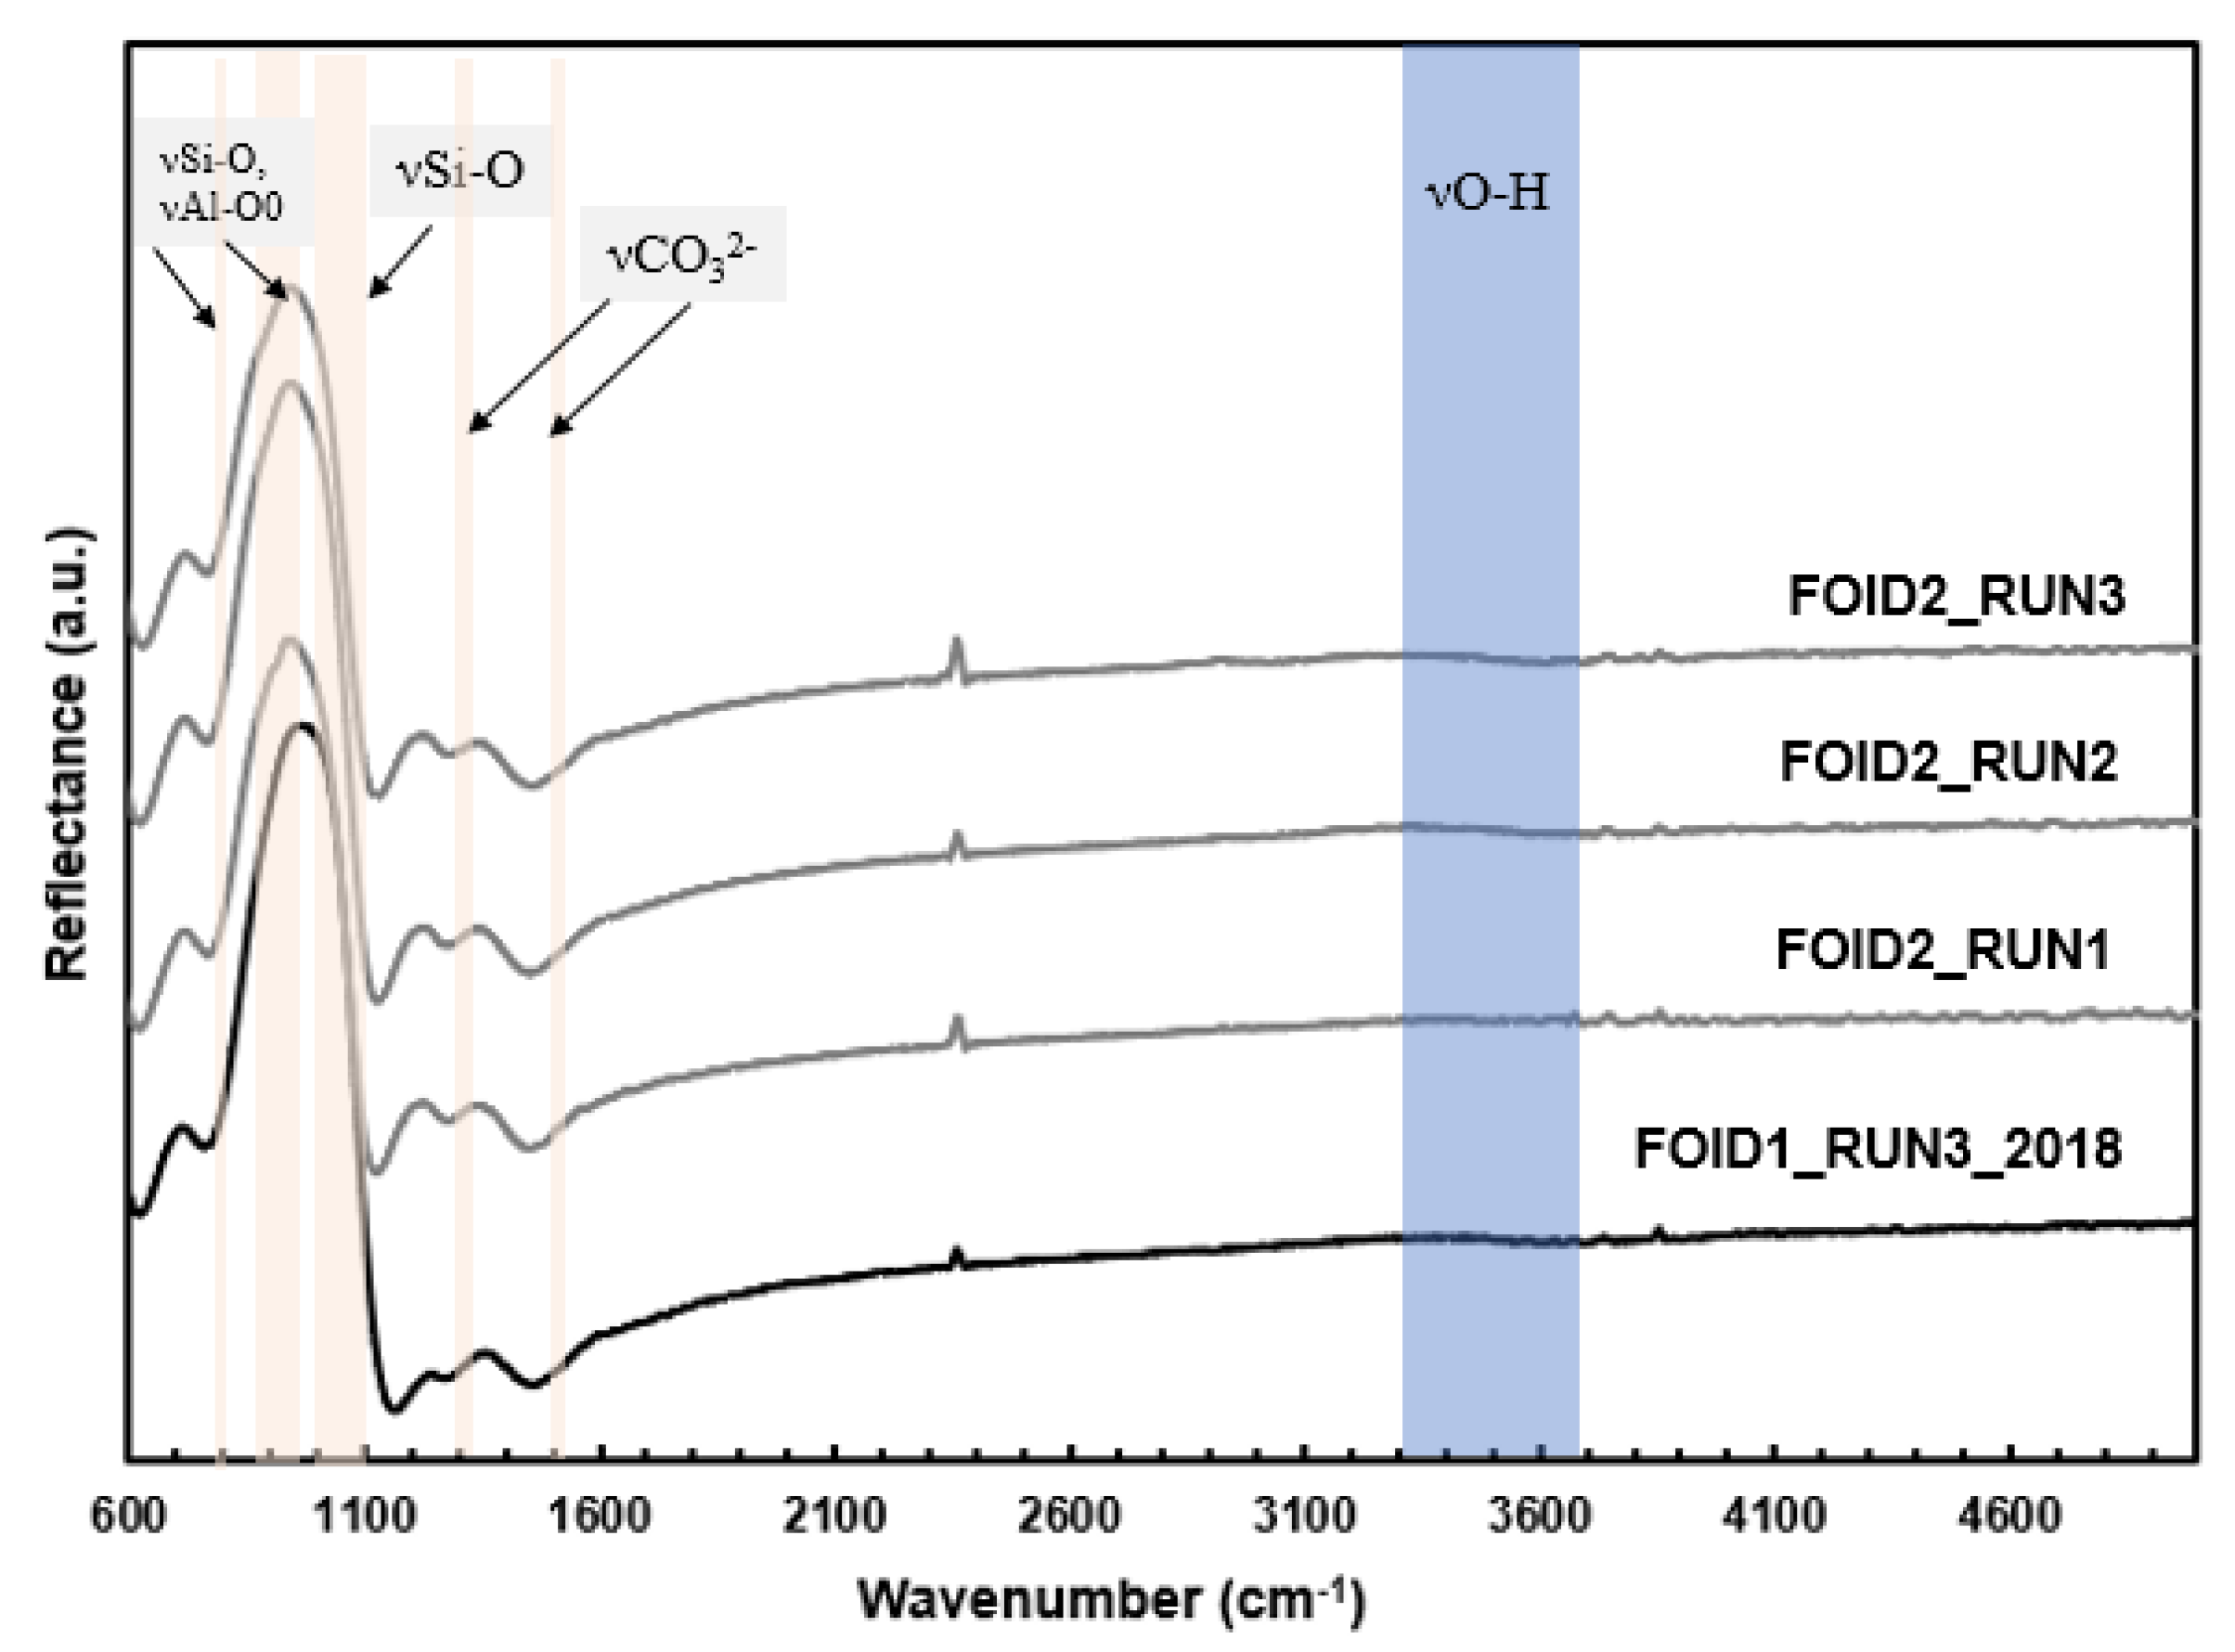
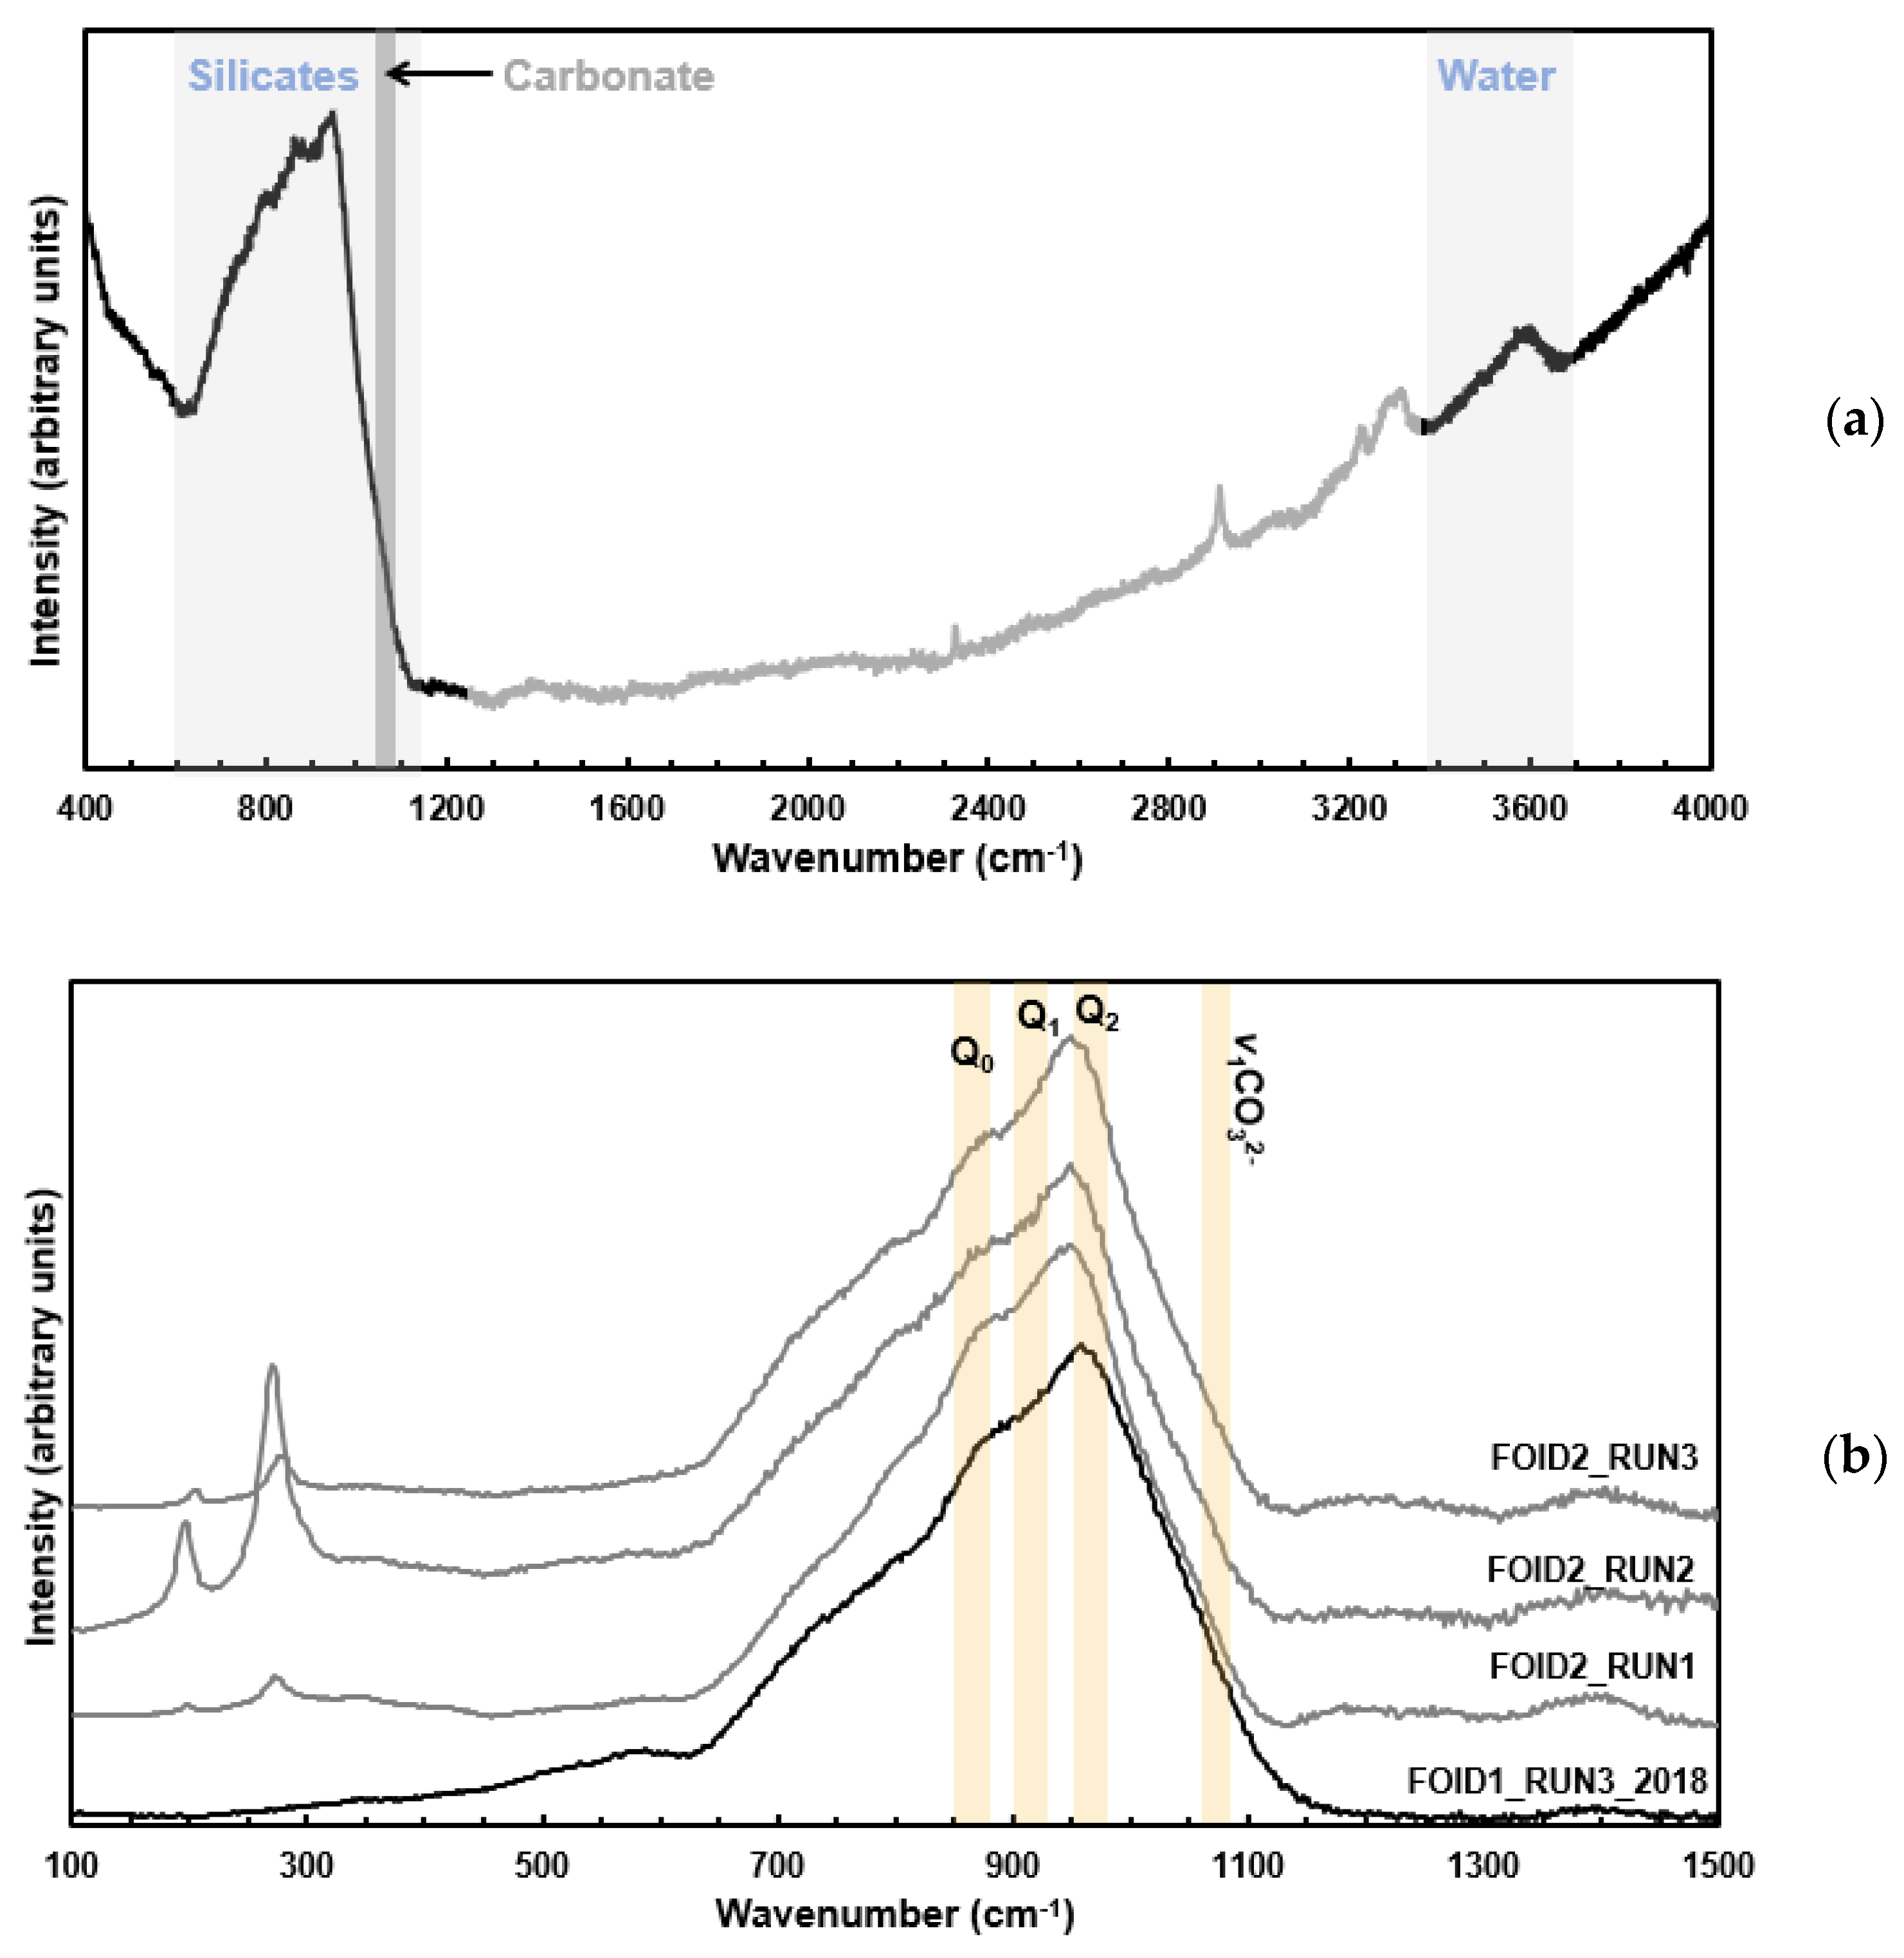
3.4. Infrared Spectroscopy Measurements on Quenched Glasses
3.5. Micro-Raman Spectra of Quenched Glasses
4. Discussion
Melt Mobility and Ascent Rate of Volatile-Bearing Melilitic Magmas during the Archaean and Present-Day Earth’s Upper Mantle
5. Conclusions
Supplementary Materials
Author Contributions
Funding
Acknowledgments
Conflicts of Interest
References
- Hammouda, T.; Keshav, S. Melting in the mantle in the presence of carbon: Review of experiments and discussion on the origin of carbonatites. Chem. Geol. 2015, 418, 171–188. [Google Scholar] [CrossRef]
- Stagno, V. Carbon, carbides, carbonates and carbonatitic melts in the Earth’s interior. J. Geol. Soc. 2019. [Google Scholar] [CrossRef]
- Stagno, V.; Cerantola, V.; Aulbach, S.; Lobanov, S.; McCammon, C.A.; Merlini, M. Carbon-bearing phases throughout Earth’s interior—Evolution through space and time. In Deep Carbon: Past to Present; Orcutt, B., Daniel, I., Dasgupta, R., Eds.; Cambridge University Press: Cambridge, UK, 2019; pp. 66–88. [Google Scholar]
- Gudfinnsson, G.H.; Presnall, D.C. Continuous gradations among primary kimberlitic, carbonatitic, melilititic, basaltic, picritic, and komatiitic melts in equilibrium with garnet lherzolite at 3–8 GPa. J. Petrol. 2005, 46, 1645–1659. [Google Scholar] [CrossRef] [Green Version]
- Wallace, M.E.; Green, D.H. An experimental determination of primary carbonatite magma composition. Nature 1988, 335, 343–346. [Google Scholar] [CrossRef]
- Woolley, A.R.; Kjarsgaard, B.A. Carbonatite occurrences of the world: Map and database. In Geological Survey of Canada 2008, Open File 5796, 1 CD-ROM + 1 Map; Natural Resources Canada: Ottawa, ON, Canada, 2008. [Google Scholar]
- Brey, G.; Green, D. Solubility of CO2 in olivine melilitite at high-pressures and role of CO2 in Earth’s upper mantle. Contrib. Mineral. Petrol. 1976, 55, 217–230. [Google Scholar] [CrossRef]
- Aulbach, S.; Stagno, V. Evidence for a reducing Archean ambient mantle and its effects on the carbon cycle. Geology 2016, 44, 751–754. [Google Scholar] [CrossRef] [Green Version]
- Le Bas, M.J. Nephelinitic and basanitic rocks. J. Petrol. 1989, 30, 1299–1312. [Google Scholar] [CrossRef]
- Dobson, D.P.; Jones, A.P.; Rabe, R.; Sekine, T.; Kurita, K.; Taniguchi, T.; Kondo, T.; Kato, T.; Shimomura, O.; Urakawa, S. In-Situ measurement of viscosity and density of carbonate melts at high pressure. Earth Planet. Sci. Lett. 1996, 143, 207–215. [Google Scholar] [CrossRef]
- Kono, Y.; Kenney-Benson, C.; Hummer, D.; Ohfuji, H.; Park, C.; Shen, G.; Wang, Y.; Kavner, A.; Manning, C.E. Ultralow viscosity of carbonate melts at high pressures. Nat. Commun. 2014, 5, 5091. [Google Scholar] [CrossRef]
- Stagno, V.; Stopponi, V.; Kono, Y.; Manning, C.E.; Irifune, T. Experimental determination of the viscosity of Na2CO3 melt between 1.7 and 4.6 GPa at 1200–1700 °C: Implications for the rheology of carbonatite magmas in the Earth’s upper mantle. Chem. Geol. 2018, 501, 19–25. [Google Scholar] [CrossRef]
- Stagno, V.; Kono, Y.; Stopponi, V.; Masotta, M.; Scarlato, P.; Manning, C.E. The viscosity of carbonate-silicate transitional melts at Earth’s upper mantle pressures and temperatures, determined by the in situ falling-sphere technique. In Carbon in Earth’s Interior; Manning, C.E., Lin, J., Mao, W., Eds.; AGU Monographs: Washington, DC, USA, 2020; in press. [Google Scholar]
- Stagno, V.; Luciani, N.; Narzisi, S.; Faraone, D.B.; Lustrino, M.; Masotta, M.; Scarlato, P. Experimental Constraints on Limestone–Ultrabasic/Basic Melt Interaction at 2 Kbar. Basalt 2017; Kadaň, Czech Republic, 18–22 September 2017. Available online: http://basalt2017.geocon.cz/Stagno.pdf (accessed on 16 March 2020).
- Ulrych, J.; Adamovič, J.; Krmíček, L.; Ackerman, L.; Balogh, K. Revision of Scheumann’s classification of melilitic lamprophyres and related melilitic rocks in light of new analytical data. J. Geosci. 2014, 59, 3–22. [Google Scholar] [CrossRef] [Green Version]
- Cody, G.D.; Ackerson, M.; Beaumont, C.; Foustoukos, D.I.; Le Losq, C.; Mysen, B.O. Water speciation in hydrous alumino-silicate glasses: Discrepancy between solid-state H NMR and NIR spectroscopy in the determination of X-OH and H2O. Geochim. Cosmochim. Acta 2020. in review. [Google Scholar]
- Kono, Y.; Park, C.; Kenney-Benson, C.; Shen, G.; Wang, Y. Toward comprehensive studies of liquids at high pressures and high temperatures: Combined structure, elastic wave velocity, and viscosity measurements in the Paris- Edinburgh cell. Phys. Earth Planet. Inter. 2014, 228, 269–280. [Google Scholar] [CrossRef]
- Kono, Y. Viscosity measurement. In Magmas under Pressure: Advances in High-Pressure Experiments on Structure and Properties of Melts; Kono, Y., Sanloup, C., Eds.; Elsevier: Amsterdam, The Netherlands, 2018; pp. 261–280. [Google Scholar]
- Kono, Y.; Irifune, T.; Higo, Y.; Inoue, T.; Barnhoorn, A. P-V-T relation of MgO derived by simultaneous elastic wave velocity and in situ X-ray measurements: A new pressure scale for the mantle transition region. Phys. Earth Planet. Inter. 2010, 183, 196–211. [Google Scholar] [CrossRef]
- Abramoff, M.D.; Magalhaes, P.J.; Ram, S.J. Image processing with ImageJ. Biophotonics Int. 2004, 11, 36–42. [Google Scholar]
- Dorogokupets, P.I.; Dewaele, A. Equations of state of MgO, Au, Pt, NaCl-B1, and NaCl-B2: Internally consistent high-temperature pressure scales. High Press. Res. 2007, 27, 431–446. [Google Scholar] [CrossRef]
- Ghosh, D.B.; Karki, B.B. Transport properties of carbonated silicate melt at high pressure. Sci. Adv. 2017, 3, e1701840. [Google Scholar] [CrossRef] [Green Version]
- Sakamaki, T.; Suzuki, A.; Terasaki, H.; Urakawa, S.; Katayama, Y.; Funakoshi, K.; Wang, Y.; Hernlund, J.W.; Ballmer, M.D. Ponded melt at the boundary between the lithosphere and asthenosphere. Nat. Geosci. 2013, 6, 1041–1044. [Google Scholar] [CrossRef]
- De Grouchy, C.J.L.; Sanloup, C.; Cochain, B.; Drewitt, J.W.E.; Kono, Y.; Crépisson, C. Lutetium incorporation in magmas at depth: Changes in melt local environment and the influence on partitioning behavior. Earth Planet. Sci. Lett. 2017, 464, 155–165. [Google Scholar] [CrossRef] [Green Version]
- Hudspeth, J.; Sanloup, C.; Kono, Y. Properties of molten CaCO3 at high pressure. Geochem. Perspect. Lett. 2018, 7, 17–21. [Google Scholar] [CrossRef] [Green Version]
- Di Genova, D.; Cimarelli, C.; Hess, K.; Dingwell, D.B. An advanced rotational rheometer system for extremely fluid liquids up to 1273 K and applications to alkali carbonate melts. Am. Mineral. 2016, 101, 953–959. [Google Scholar] [CrossRef] [Green Version]
- Wolff, J.A. Physical properties of carbonatite magmas inferred from molten salt data, and application to extraction patterns from carbonatite–silicate magma chambers. Geol. Mag. 1994, 131, 145–153. [Google Scholar] [CrossRef]
- Funamori, N.; Yamamoto, S.; Yagi, T.; Kikegawa, T. Exploratory studies of silicate melt structure at high pressures and temperatures by in situ X-ray diffraction. J. Geophys. Res. 2004, 109, B03203. [Google Scholar] [CrossRef]
- Meade, C.; Hemley, R.J.; Mao, H.K. High-pressure x-ray diffraction of SiO2 glass. Phys. Rev. Lett. 1992, 69, 1387–1390. [Google Scholar] [CrossRef] [PubMed]
- Creépisson, C.; Morard, G.; Bureau, H.; Prouteau, G.; Morizet, Y.; Petitgirard, S.; Sanloup, C. Magmas trapped at depth and the continental lithosphere-asthenosphere boundary. Earth Planet. Sci. Lett. 2014, 393, 105–112. [Google Scholar] [CrossRef] [Green Version]
- Yamada, A.; Wang, Y.; Inoue, T.; Yang, W.; Park, C.; Yu, T.; Shen, G. High-pressure X-ray diffraction studies on the structure of liquid silicate using a Paris–Edinburgh type large volume press. Rev. Sci. Instrum. 2011, 82, 015103. [Google Scholar] [CrossRef]
- Sakamaki, T.; Wang, Y.; Park, C.; Yu, T.; Shen, G. Structure of jadeite at high pressures up to 4.9 GPa. J. Appl. Phys. 2012, 111, 112623. [Google Scholar] [CrossRef]
- Sanloup, C.; Drewitt, J.W.E.; KonoÔpkovaá, Z.; Dalladay-Simpson, P.; Morton, D.M.; Rai, N.; van Westrenen, W.; Morgenroth, W. Structural change in molten basalt at deep mantle conditions. Nature 2013, 503, 104–107. [Google Scholar] [CrossRef]
- Drewitt, J.W.E.; Jahn, S.; Sanloup, C.; de Grouchy, C.; Garbarino, G.; Hennet, L. Development of chemical and topological structure in aluminosilicate liquids and glasses at high pressure. J. Phys. Condens. Matter 2015, 27, 105103. [Google Scholar] [CrossRef]
- King, P.L.; McMillan, P.F.; Moore, G. Infrared spectroscopy of silicate glasses with application to natural systems. In Infrared Spectroscopy in Geochemistry, Exploration Geochemistry and Remote Sensing; King, P.L., Ramsey, M.S., Swayze, G.A., Eds.; Short Course Series; Mineralogical Association of Canada: Quebec City, QC, Canada, 2007; Volume 33, pp. 93–133. [Google Scholar]
- Moussallam, Y.; Florian, P.; Corradini, D.; Morizet, Y.; Sator, N.; Vuilleumier, R.; Guillot, B.; Iacono-Marziano, G.; Schmidt, B.C.; Gaillard, F. The molecular structure of melts along the carbonatite–kimberlite–basalt compositional joint: CO2 and polymerisation. Earth Planet. Sci. Lett. 2016, 434, 129–140. [Google Scholar] [CrossRef] [Green Version]
- Rossano, S.; Mysen, B.O. Chapter 9: Raman Spectroscopy of Silicate Glasses and Melts in Geological Systems. In Raman Spectroscopy Applied to Earth Sciences and Cultural Heritage; EMU Notes in Mineralogy; Dubessy, J., Caumon, M.-C., Rull, F., Eds.; European Mineralogical Union: Jena, Germany, 2012; Volume 12, pp. xvii + 504. [Google Scholar]
- Yadav, A.K.; Singh, P. A review of structure of oxide glasses by Raman spectroscopy. RSC Adv. 2015, 5, 67583–67609. [Google Scholar] [CrossRef]
- Mysen, B.O.; Virgo, D. Solubility mechanisms of carbon dioxide in silicate melts: A Raman spectroscopic study. Am. Mineral. 1980, 65, 885–899. [Google Scholar]
- Sharma, S.K.; Yoder, H.S., Jr.; Matson, D.W. Raman study of some melilites in crystalline and glassy states. Geochim. Cosmochim. Acta 1988, 52, 1961–1967. [Google Scholar] [CrossRef]
- Solomatov, V.S.; Reese, C.C. Grain size variations in the Earth’s mantle and the evolution of primordial chemical heterogeneities. J. Geophys. Res. 2008, 113, B07408. [Google Scholar] [CrossRef]
- Behn, M.D.; Hirth, G.; Elsenbeck, J.R., II. Implications of grain size evolution on the seismic structure of the oceanic upper mantle. Earth Planet. Sci. Lett. 2009, 282, 178–189. [Google Scholar] [CrossRef] [Green Version]
- Dasgupta, R.; Mallik, A.; Tsuno, K.; Withers, A.C.; Hirth, G.; Hirschmann, M.M. Carbon-dioxide-rich silicate melt in the Earth’s upper mantle. Nature 2013, 493, 211–215. [Google Scholar] [CrossRef] [PubMed]
- Avé Lallemant, H.G.; Mercier, J.-C.C.; Carter, N.L. Rheology of the upper mantle: Inference from peridotite xenoliths. Tectonophysics 1980, 70, 85–114. [Google Scholar] [CrossRef]
- Chu, X.; Korenaga, J. Olivine rheology, shear stress, and grain growth in the lithospheric mantle: Geological constraints from the Kaapvaal craton. Earth Planet. Sci. Lett. 2012, 333–334, 52–62. [Google Scholar] [CrossRef]
- Haggerty, S.E. A diamond trilogy: Superplumes, supercontinents, and supernovae. Science 1999, 285, 851–860. [Google Scholar] [CrossRef]
- Giuliani, A.D.G. Pearson kimberlites: From deep earth to diamond mines. Elements 2019, 15, 377–380. [Google Scholar] [CrossRef]


| Oxides/Samples | FOID1 | FOID2 |
|---|---|---|
| SiO2 | 39.45(49) | 30.99(21) |
| TiO2 | 2.46(8) | 2.31(2) |
| Al2O3 | 11.32(10) | 7.43(2) |
| Fe2O3 | 9.96(49) | 14.31(10) |
| MnO | 0.16(1) | 0.26 |
| MgO | 13.87(13) | 12.32(7) |
| CaO | 13.99(17) | 27.77(27) |
| Na2O | 3.53(7) | 0.43(4) |
| K2O | 3.38(3) | 1.73(1) |
| P2O5 | 1.87(1) | 1.84(1) |
| SO32− | 0.01 | 0.61(1) |
| Totals | 100.00 | 100.00 |
| CO2 | 1.42 | 1.60 |
| H2O | 1.03(10) | 5.73(23) |
| Run | *P (GPa) | *T (°C) | ø Pt Sphere (mm) | Terminal Velocity (mm/s) | Recording Time (f.p.s.) | Viscosity (Pa·s) |
|---|---|---|---|---|---|---|
| FOID1_RUN1 | 2.5 | 1580 | 122 | 0.097(±0.007) | 125 | 1.0855(±0.1441) |
| FOID1_RUN2 | 4.7 | 1755 | 121 | 0.441(±0.022) | 500 | 0.2336(±0.0178) |
| FOID1_RUN3_2018 | 4.2 | 1700 | 85 | 0.089(±007) | 500 | 0.6334(±0.0738) |
| FOID2_RUN1 | 1 | 1270 | 146 | 0.067(±0.007) | 125 | 2.1221(±0.4253) |
| FOID2_RUN2 | 3.4 | 1360 | 142 | 0.225(±0.012) | 250 | 0.6021(±0.3802) |
| FOID2_RUN3 | 4.5 | 1540 | 120 | 0.981(±0.093) | 500 | 0.1044(±0.0320) |
| FOID2_2018 center bottom | 1.7 | 1265 | 134 | 0.343(±0.013) | 250 | 0.3526(±0.0136) |
| FOID2_2018 edge | 1.7 | 1265 | 131 | 0.349(±0.012) | 250 | 0.3374(±0.0168) |
| Run | *Pinitial (GPa) | *Pfinal (GPa) | *Tinitial (°C) | *Tfinal (°C) | FSDP (Å−1) | T–O (Å) | M–O (Å) | T–T (Å) | Crystallized Minerals |
|---|---|---|---|---|---|---|---|---|---|
| FOID1_RUN3_2018 | 4.2 | 3.9+ | 1700 | 1685 | 2.16 | 1.69 | 2.27 | 3.20 | - |
| FOID2_RUN2 | 3.4 | 3.4 | 1360 | 1360 | 2.18 | 1.70 | 2.35 | 3.26 | olivine |
| FOID2_RUN3 | 4.5 | 4.5 | 1540 | 1540 | 2.22 | 1.73 | 2.40 | 3.26 | - |
© 2020 by the authors. Licensee MDPI, Basel, Switzerland. This article is an open access article distributed under the terms and conditions of the Creative Commons Attribution (CC BY) license (http://creativecommons.org/licenses/by/4.0/).
Share and Cite
Stagno, V.; Stopponi, V.; Kono, Y.; D’Arco, A.; Lupi, S.; Romano, C.; Poe, B.T.; Foustoukos, D.I.; Scarlato, P.; Manning, C.E. The Viscosity and Atomic Structure of Volatile-Bearing Melilititic Melts at High Pressure and Temperature and the Transport of Deep Carbon. Minerals 2020, 10, 267. https://doi.org/10.3390/min10030267
Stagno V, Stopponi V, Kono Y, D’Arco A, Lupi S, Romano C, Poe BT, Foustoukos DI, Scarlato P, Manning CE. The Viscosity and Atomic Structure of Volatile-Bearing Melilititic Melts at High Pressure and Temperature and the Transport of Deep Carbon. Minerals. 2020; 10(3):267. https://doi.org/10.3390/min10030267
Chicago/Turabian StyleStagno, Vincenzo, Veronica Stopponi, Yoshio Kono, Annalisa D’Arco, Stefano Lupi, Claudia Romano, Brent T. Poe, Dionysis I. Foustoukos, Piergiorgio Scarlato, and Craig E. Manning. 2020. "The Viscosity and Atomic Structure of Volatile-Bearing Melilititic Melts at High Pressure and Temperature and the Transport of Deep Carbon" Minerals 10, no. 3: 267. https://doi.org/10.3390/min10030267