Geochronology of Uraninite Revisited


Department of Civil and Environmental Engineering and Earth Sciences, University of Notre Dame, Notre Dame, IN 46556, USA
*
Author to whom correspondence should be addressed.
Minerals 2020, 10(3), 205; https://doi.org/10.3390/min10030205
Submission received: 15 January 2020
/
Revised: 21 February 2020
/
Accepted: 22 February 2020
/
Published: 25 February 2020
(This article belongs to the Special Issue Nuclear Forensic Applications in Geoscience and Radiochemistry)
Abstract
:Identification of uraninite provenance for the purpose of nuclear forensics requires a multifaceted approach. Various geochemical signatures, such as chondrite normalized rare earth element patterns, help identify and limit the potential sources of uraninite based on the geological setting of the uranium ore mineralization. The inclusion of accurate age determinations to discriminate geochemical signatures for natural uranium ores may help to potentially restrict geographical areas for provenance consideration. Determining a robust age for uraninite formation is somewhat difficult, due to well known, inherent difficulties associated with open system behavior that involve either uranium and/or lead loss or gain. However, open system behavior should not perturb their Pb isotopic compositions to the same degree as Pb isotopes should not fractionate during alteration processes. Here, a suite of pristine and altered samples of uraninite was examined for their Pb isotope compositions, and these yielded geologically meaningful secondary Pb–Pb isochron ages. The degree of alteration within individual uraninite samples, which is extremely variable, does not appear to affect the calculated ages. The approach adopted here yields insightful age information, and hence, is of great value for source attribution in forensic analyses of raw nuclear materials.
1. Introduction
Uranium deposits have been identified globally in a wide variety of geological settings ranging from primary magmatic occurrences to surficial deposits. Currently, the International Atomic Energy Agency (IAEA) classification is based on fifteen distinct geological settings for uranium deposits with a significant number of designated subtypes [1]. In addition, uranium deposits have formed throughout Earth’s history from the Archean/early Proterozoic to Cenozoic-Recent [1,2,3]. The most abundant and economically viable, primary uranium mineral found in most U deposits is uraninite, nominally UO2+x. Uraninite contains up to 90 wt% UO2, which is significantly more than other primary uranium minerals (U4+), such as coffinite (U(SiO4) nH2O), brannerite (UTi2O6), and davidite ((La, Ce, Ca)(Y, Fe2+, U)(Ti, Fe3+)20(O, OH)38) [4,5,6]. Uraninite can accommodate appreciable amounts of impurities (present at <20 wt% abundances), such as Pb, Th, Ca, and rare earth elements (REEs); therefore, U4+1−x−y−z−uU 6+xREE 3+yM2+z□4−u)O2+x−0.5y−z−2u is a more representative formula for natural uraninite [4,7,8,9]. The abundances of various trace elements in uraninite are a function of both the mode of formation of the deposit, i.e., primarily the temperature at which the deposit formed and availability of elements to incorporate, due to source and fluid chemistry [8,10,11,12], and the age of the deposit [2,13]. For example, uraninite that forms at elevated temperatures (>350 °C) typically contains more Th4+, REEs3+, and Y3+; the main reason being that at higher temperatures, the uraninite crystal structure can more readily accommodate cations of similar ionic radius to U4+ in eightfold coordination [3,8,10,11,14,15]. U4+ has an ionic radius of 1.00 Å in eightfold coordination, whereas, Th4+ and the REEs3+ (plus Y3+) have ionic radii of 1.05 Å and 1.16–0.97 Å, respectively [15,16,17]. The majority of Pb present in uraninite is of radiogenic origin as Pb is incompatible with the uraninite structure [6,18]. Therefore, assuming a closed system and a proportionally very low common Pb component, the Pb present is a function of the age of uraninite formation, since 207Pb and 206Pb accrue, due to the decay of their parent nuclides 235U and 238U over geological time, respectively [8].
In recent years, many studies have investigated the natural variation in the abundances of impurities within uraninite as a provenance tool for the purpose of nuclear forensic analysis, e.g., References [3,10,11,12,14]. The chondrite normalized (CN) rare earth element (REE) signature of uraninite has proven to be the most effective in terms of distinguishing between different geological origins, e.g., References [3,10,11]. A potentially useful tool to aid in determining the genesis (and provenance) of the uraninite, or at the very least eliminating potential sources is to obtain a reliable age of formation; the main reason being that specific deposit types are related with different periods of uranium mineralization in Earth history [2,13,19]. For example, quartz-pebble conglomerates are associated with uranium deposits of Early Proterozoic or older (>2.2 Ga), as they only formed prior to the development of an oxygenated atmosphere [2,13,20]; whereas, unconformity deposits are typically mid–late Proterozoic in age (<2.2 Ga; [2]). Unconformity uranium deposit types are typically located around or within the unconformable contact between crystalline basement rocks and clastic red-beds, which developed under an oxygenated atmosphere. The permeable nature of the red-beds that overlie crystalline basement rocks allowed paleoweathering—a process that was enhanced by the lack of land plants to form large briney aquifers. Uranium was then leached from the surrounding lithologies, e.g., Paleoproterozoic sediments [2,21,22]. However, other deposit types, such as intrusive and sandstone are not time period specific. Therefore, the age of an unknown uraninite sample can be investigated in conjunction with other geochemical signatures, e.g., REE trends to constrain the possible geographical origin of the sample.
To date, geochronological investigations of uraninite have focused primarily on conventional U–Pb methods employing isotope dilution thermal ion mass spectrometry (ID-TIMS), secondary ion mass spectrometry (SIMS), and more recently laser ablation inductively coupled plasma mass spectrometry (LA-ICP-MS), or U–Th–Pb chemical dating by electron microprobe analysis (EMPA); [4,5,23,24,25,26]. Determining an accurate age of uraninite formation has proved problematic, due to the heterogeneity of uraninite on the micrometer scale (e.g., References [27,28]), which are hypothesized to result from both auto-oxidation and further alteration related to subsequent tectonic or fluid events; these can mobilize both U and Pb leading to discordant U–Pb ages, due to open system behavior (e.g., References [6,26,29,30,31]). Thus, the majority of previous studies have either focused on sampling the ‘pristine’ portion of uraninite grains for TIMS-based investigations, or carefully selecting areas for in-situ analysis by SIMS, LA-ICP-MS, and EMPA so as to minimize the amount or avoid sampling of altered uraninite; the latter may represent a later, overprinting event rather than the age of original mineralization and analyses incorporating both fractions would give a mixed age with no corresponding geologic event.
This study reports geochronological results for a suite of uraninites from various deposits worldwide that focuses on determining secondary Pb isochron ages using Pb isotope ratios measured in both pristine and altered sections of individual uraninite samples. Previous studies have used the secondary Pb isochron method of uraninite age dating, but these have either focused solely on the pristine areas of the uraninite, or minerals associated with the uranium mineralization (e.g., References [30,32]). In this study, rather than identifying all (potentially multiple) disturbances/alteration events that have occurred to individual uraninite samples, we examined the end members (or their best proximation, respectively) to describe the secondary Pb isochron, i.e., the pristine and altered sections of uraninite samples. Therefore, the secondary Pb isochrons produced by the method adopted here cannot distinguish between different alteration events that have occurred, but rather reflect the sum of alteration episodes. However, if alteration completely overprints the pristine uraninite (e.g., remineralization), then the resultant secondary Pb isochron date will solely reflect this last event and all parts of the system are in equilibrium. In addition, due to the uranium-rich environment (UO2 > 70 wt%) abundances of 207Pb and 206Pb will increase quickly over geological time such that incorporation of any common Pb during secondary alteration events will have minimal impact on the 207Pb/204Pb and 206/204Pb ratios. The 207Pb–206Pb ages calculated in this study using both the pristine and altered sections of the uraninite are then compared to existing geochronological data for the corresponding deposits and calculated U/Pb ages, and in most cases, there is excellent agreement. Hence, the main advantage of the approach adopted here is that the inherent heterogeneity of the uraninite, as a result of alteration, can be used to produce reliable and valid ages. This is an important advantage for nuclear forensic analysis as increasing the number of potential signatures that can be used to identify interdicted (illicit) nuclear materials further aids in discerning source attribution information.
2. Samples and Methods
All uraninite samples analyzed in this study were obtained from the “Ewing Collection” of minerals and rocks housed at the University of Notre Dame (Notre Dame, IN, USA) and are listed in Table 1. The selected samples represent five distinct deposit types as classified by the 2018 IAEA, and this nomenclature has been adopted here; intrusive related (type 1), granite-related (type 2), metamorphite (type 6), Proterozoic unconformity (type 7), and sandstone (type 9). The samples investigated here represent a large range in ages from the Paleo–Neoproterozoic to Cenozoic/Recent.
Four intrusive non-granite related uraninite were investigated; Yancey, Bancroft, Cardiff, and Foster Lake. Yancey is a Paleozoic pegmatite-hosted uraninite from the Spruce Pine pegmatite, Yancey County, North Carolina, which forms part of the Spruce Pine thrust block. The pegmatite crosscuts Precambrian interlayered mica and amphibole gneiss and schist of the Ashe Formation in the Blue Ridge of the Appalachian Mountains [33,34]. Dating of the Spruce Pine pegmatites has included whole rock Rb–Sr ages on two pegmatites with reported dates of 404 and 392 Ma, and U–Pb dating of zircons from the pluton yield a date of 377 Ma [34]. The Bancroft and Cardiff samples are both from the Bancroft region of Ontario, Canada. Uranium mineralization is associated with the fenite-carbonatite and granitic pegmatite post-tectonic plutonic event hosted within the Central Metasedimentary Belt of the Proterozoic Grenville Province [35]. The uranium mineralization age of 1030–1070 Ma was determined by U–Pb dating of zircons and monazite from the fenite-carbonatite and granitic pegmatite and U–Th–Pb dating of uraninite and thoranite (ThO2) [35,36,37]. The Foster Lake sample is from northern Saskatchewan, Canada. The primary uraninite mineralization is hosted in the margins of pegmatites within biotite-schist belts. The pegmatites occur both as sheets and cross-cutting dykes at fault intersections of the Wollaston Group and Archean basement contacts [38,39,40]. The published range of ages (1169–1860 Ma; Table 1) is large (~600 Ma) for uraninite deposits located within northern Saskatchewan. These ages were determined based on the U–Th–Pb isotope systematics of uraninite grains, which reflect various remineralization events at 1429 to 1649 Ma and 1169 to 1233 Ma, which resulted in either U and/or Pb loss or gain [41].
The granite-related sample is from Jachymov, Czech Republic. This uranium deposit is related to Erzgebirge granites generated during the collisional stage of the Variscan Orogen, where late Carboniferous granites intruded metamorphic rocks, primarily mica schists and phyllites [1,42,43]. The primary uranium mineralization was dated at 260–285 Ma by U–Pb analysis of uraninite [42,44].
The four metamorphite uraninite samples represent worldwide deposits, and they are from Great Bear Lake (Canada), Shinkolobwe (Democratic Republic of Congo), Marshall Pass (USA), and Northern Territory (Australia). The Great Bear sample is from the Great Bear Lake region of Northwest Territories, Canada. The uraninite is found within quartz, and carbonate gangue in pumice-dominated pyroclastic flows of late Paleoproterozoic-age, 1640–2340 Ma [45]. Similar to the Foster Lake uraninite, there is a large range of dates determined for uraninite mineralization from the Great Bear Lake region. The oldest age of 2058 ± 34 Ma is suggested to represent the formation of primary uraninite mineralization in the area [45]. A secondary mineralization event occurred at 1860 ± 20 Ma, due to granitic intrusions, which remobilized the uranium [17,45]. A number of other remobilization events occurred related to various geological events, such as diabase intrusion at Echo Bay at 1424 Ma, and marine transgressions and regressions during the Cambrian and Devonian, which are proposed as the cause of the younger ages of 600 and 440 Ma [45]. The Shinkolobwe uraninite originates from the Shinkolobwe Mine in the Democratic Republic of the Congo. The uraninite is located within fractures of siliceous dolomite and dolomitic shale of the lower Roan Group of the Neoproterozoic Katanga Supergroup that unconformably overlies basement [10,25]. The U mineralization was a result of fluid mobilization, due to the development of the proto-oceanic rift basin [10,25]. Uraninite mineralization from Skinkolobwe area has been dated by 207Pb/206Pb concordant ages of 615 to 655 Ma [25]. The Marshall Pass, Colorado, uraninite formed as a result of hydrothermal activity. The uraninite is located in brecciated zones and fault-controlled Pennsylvanian Belden Formation limestone. The main uranium orebody is located along the pre-Tertiary Chester reverse fault, which thrusts crystalline Proterozoic rocks westward over Paleozoic sequences [14,46]. The Marshall Pass uraninite mineralization age was calculated using U–Th–Pb (EMPA analysis) yielding a range of ages between 80 and 143 Ma [46]. The Australian sample is from Northern Territory, Australia. A mine location is not known for this sample; however, the CN-REE signature indicates that it is a metamorphite-related deposit [3,12].
The one unconformity type deposit uraninite investigated here is from Rabbit Lake, northern Saskatchewan, Canada. The orebody is located within the Wollaston domain, 10–100 meters below the Helikian sub-Athabasca Formation unconformity [47]. The U/Pb ratios for pitchblende (UO2) and coffinite indicate a primary mineralization age of 1328 Ma with a second generation forming between 1000 and 1110 Ma [47,48].
All three sandstone-type uraninite are from San Juan County, Utah; Adair Mine, Big Indian Wash, and Happy Jack. Adair Mine is a uraninite from Cane Spring Canyon, which is hosted in the Moss Back member of the Triassic Chinle Formation. The Moss Back member consists of calcite-cemented sandstone that grades into calcareous siltstone interbedded with limestone, shale and minor sandy layers [49]. The Happy Jack sample from the White Canyon area (Utah) is further classified as a tabular sandstone, and is hosted in the Shinarump member of the Chinle Formation and extends into the underlying Moenkopi Formation [50,51]. Big Indian Wash is hosted below both the Moss Back and Shinarump member in the Cutler formation located Permian-Triassic unconformity and consists of alternating lenses of mudstone, calcareous siltstone, and arkosic sandstone [50]. It is proposed that there are two stages of uranium mineralization within the Colorado Plateau with the oldest being syngenetic with the Chinle Formation and secondary mineralization that occurred during the Late Jurassic [50,52,53,54]. There are reported apparent ages for uranium ore associated with the Chinle formation based on their U/Pb ratios [52,53].
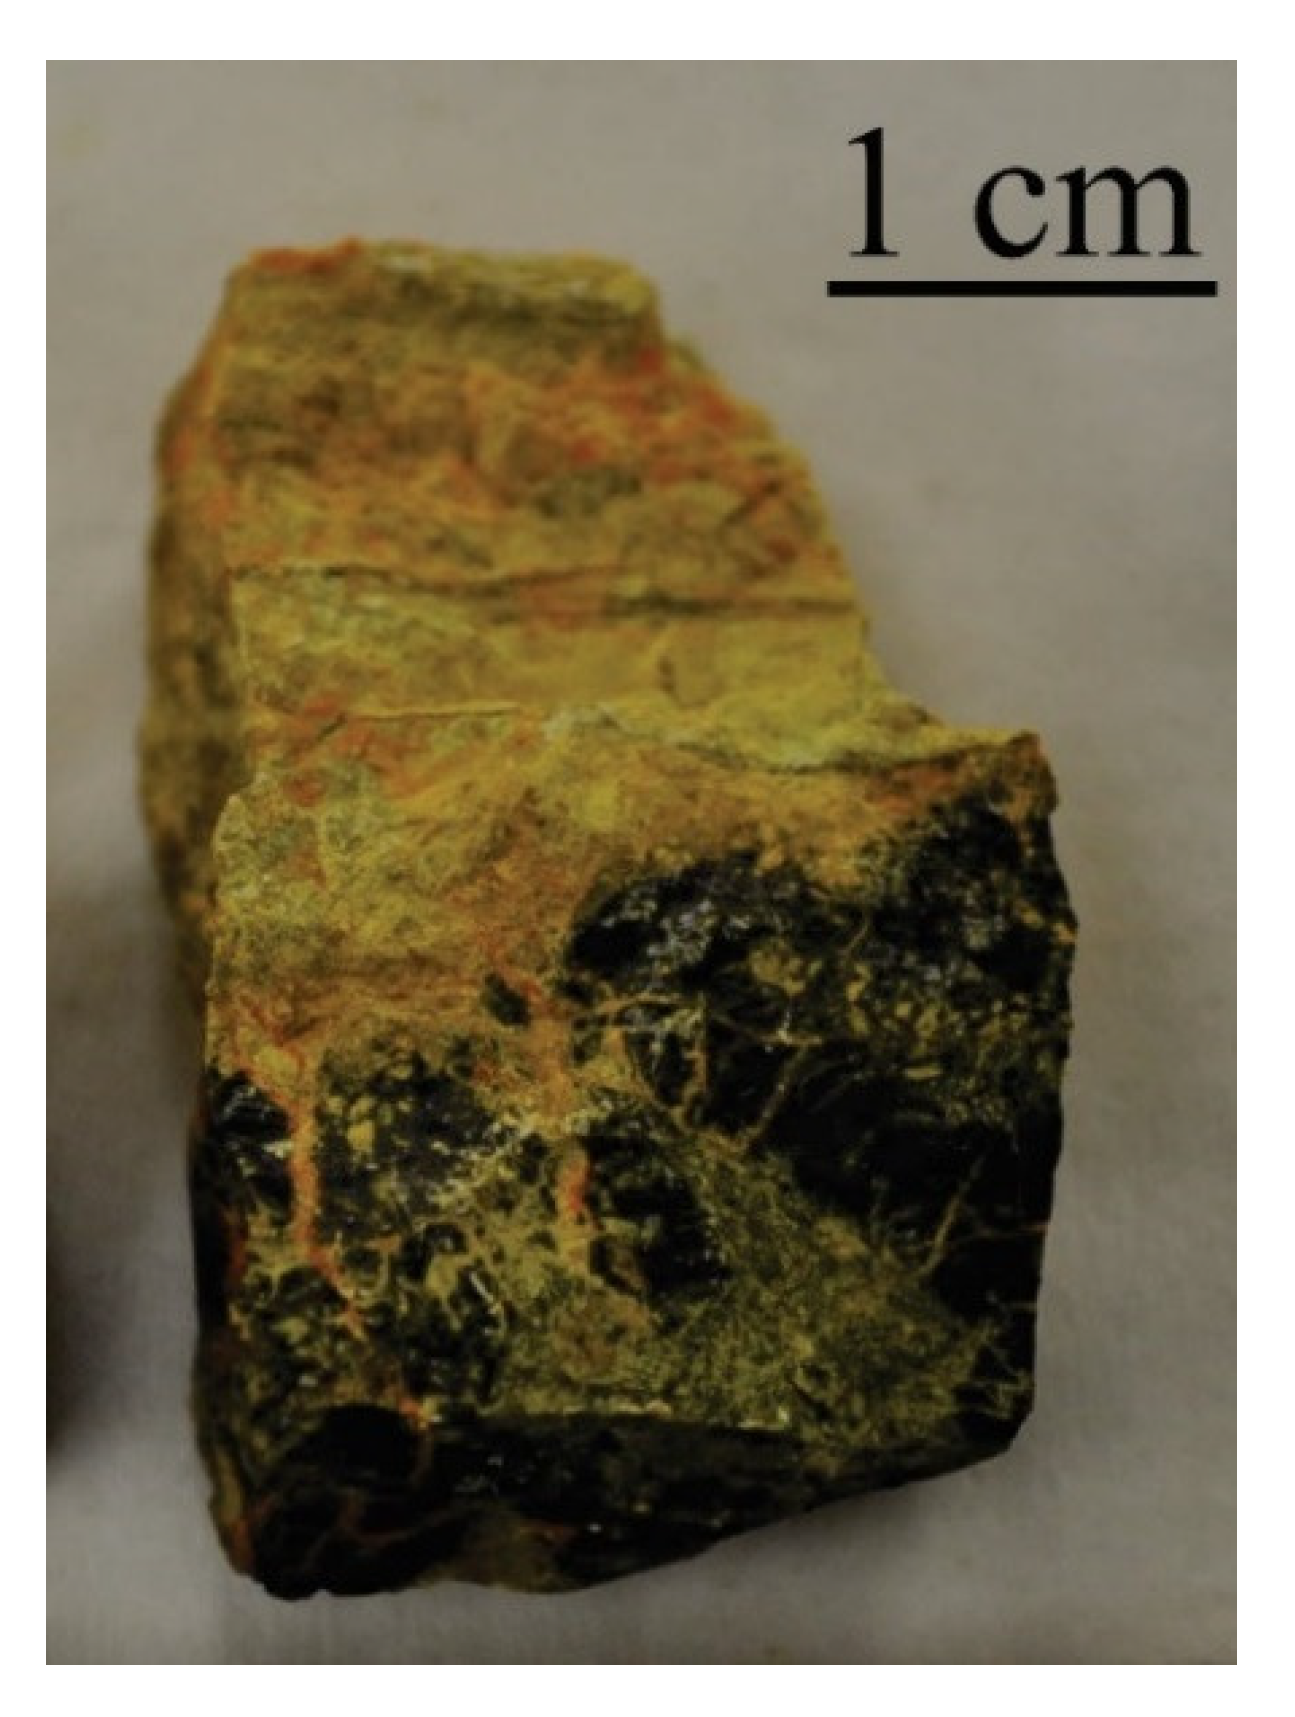
Each uraninite had aliquots prepared for both solutions (isotopic using multi collector ICP-MS) and in-situ (elemental, using microprobe and µXRF) analyses. For solution analysis, each uraninite sample was visually inspected and subsequently aliquoted based on its luster, color, and hardness/brittleness, as a means of sub-dividing samples into pristine (UO2 > 80 wt%; typically-metallic/submetallic, brown-black, hard; Figure 1) and altered aliquots (UO2 < 80 wt%; typically-dull, yellow/green/light brown, soft/brittle; Figure 1). For samples that exhibit primarily ‘mixed’ morphologies, i.e., no clear separation of pristine and altered regions, then a third aliquot identified as “bulk” was prepared (e.g., Bancroft, Foster Lake, Happy Jack, Adair Mine, and Big Indian Wash). All samples were prepared and analyzed within the Midwest Isotope and Trace Element Research Analytical Center (MITERAC) at the University of Notre Dame (Notre Dame, IN, USA). The uraninite samples were powdered using an agate pestle and mortar with ca. 0.05g of the sample is digested using a two-acid method (HNO3 and HF). The lead separation was accomplished by a two-step anion-exchange chromatographic procedure modified after Manhes et al. [55]. Following lead separation, the sample was evaporated to dryness and re-dissolved in 2% HNO3 solution spiked with NIST SRM 997 Thallium standard (5 ng/g) to approximate 25 ng/g of Pb based on the 208Pb concentration for ICP-MS analysis. Simultaneous measurements were acquired for all Pb and Tl isotopes on a Nu Plasma II Multi-Collector ICP-MS with the following cup configuration set up; 208Pb on H2, 207Pb on H1, 206Pb on Ax, 205Tl on L1, 204Pb on L2, 203Tl on L3, and 202Hg on L4 (Table S3). Samples were introduced with a desolvating nebulizing system (DSN-100 from Nu Instruments), using the 205Tl/203Tl ratio (2.3871) to correct for instrumental mass bias. An on-peak correction based on the measured 202Hg and the natural 204Hg/202Hg ratio of 0.229 was applied to the measured 204Pb to correct for any possible 204Hg interference on 204Pb measured during analyses [56,57]. External reproducibility was monitored by repeated measurements of a 25 ng/g NIST SRM 981 (Pb) spiked with NIST SRM 997 (Tl) and yields weighted mean values (2σ) of 206Pb/204Pb = 16.939 ± 0.004, 207Pb/204Pb = 15.492 ± 0.004, 208Pb/204Pb = 36.700 ± 0.014, and 207Pb/206Pb = 0.91462 ± 0.00015 (n = 6, Table S3), which are in good agreement with the published NIST SRM 981 values [58]. A procedural blank was processed through anion-exchange chemistry along with the uraninite samples, which corresponds to a maximum Pb concentration of 0.002 ng/g. Isoplot v4.15 excel-based macro was employed for calculating the secondary Pb–Pb isochron ages and using the invariant 238U/235U ratio of 137.88 [59]. The 206Pb/238U and 207Pb/235U ratios displayed in the Concordia plots for all samples examined here were calculated using the measured Pb isotopic compositions (Table 2), the invariant 238U/235U ratio of 137.88 [59], and average concentrations (wt%) of Pb and U for pristine, altered, and bulk portions as determined by EMPA.
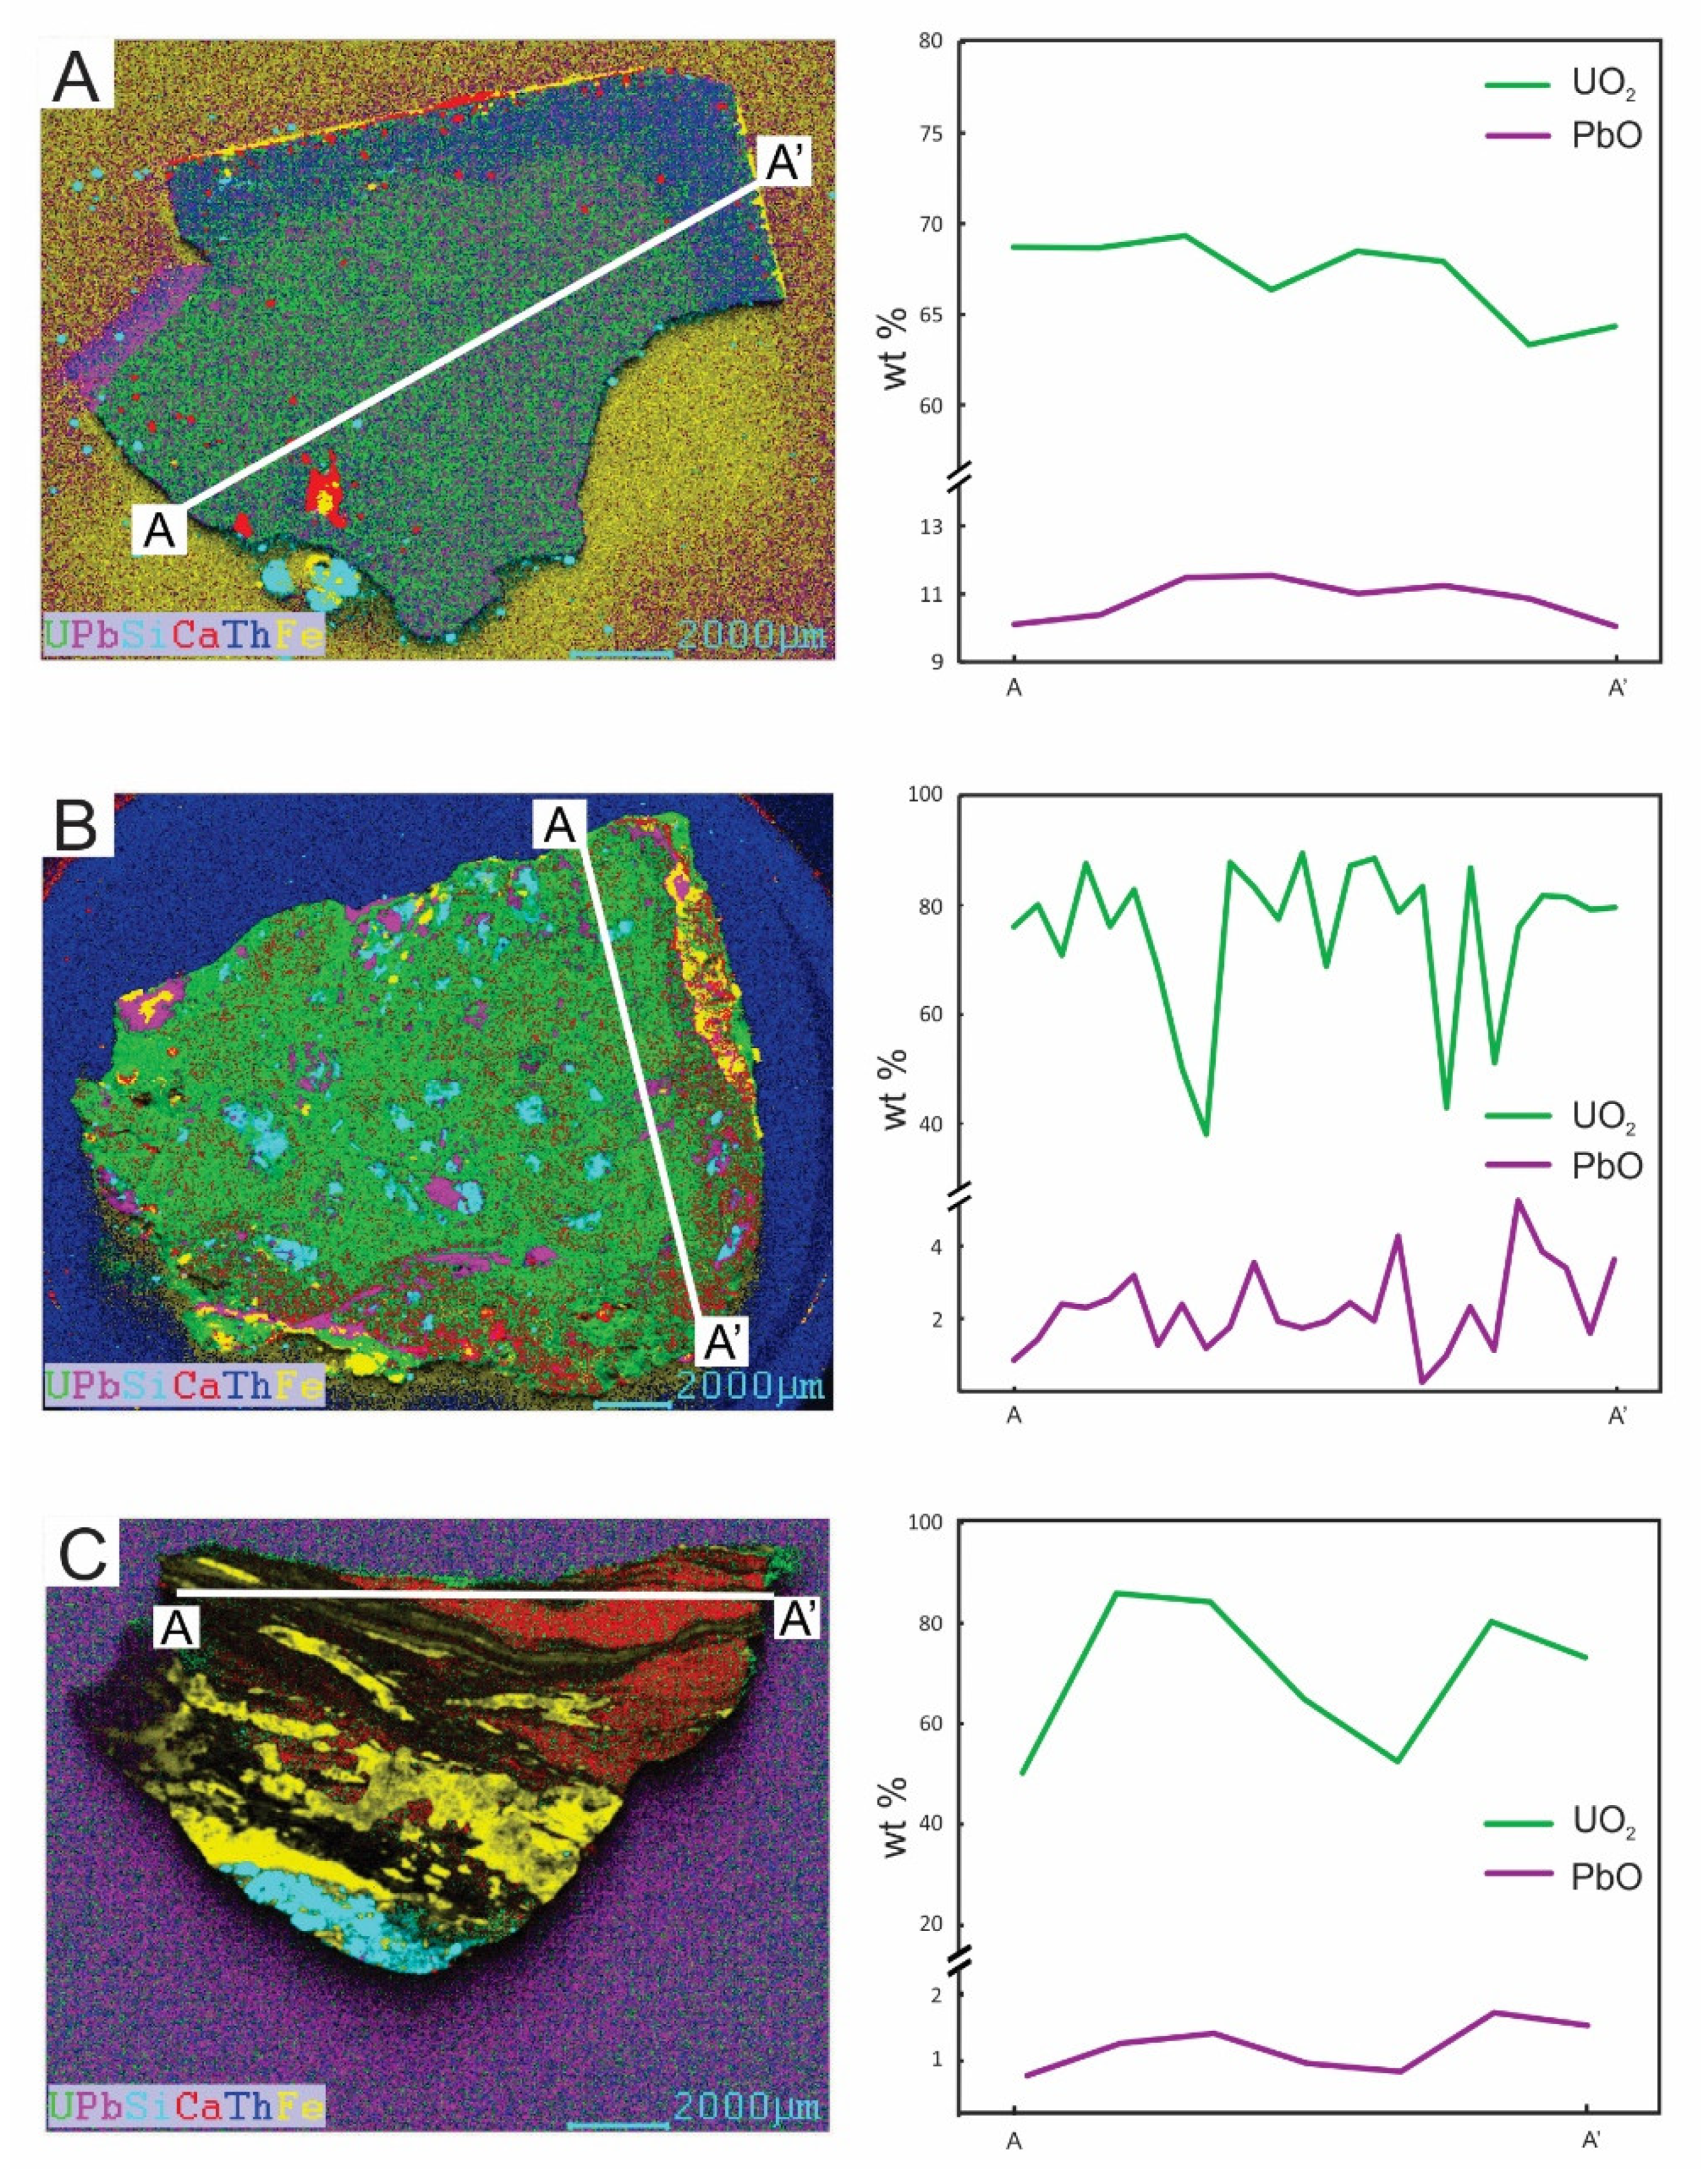
Samples prepared for in-situ analysis consisted of a small cut portion, ca. 1 cm2, which were possible included the transition from pristine to altered uraninite. The 1 cm2 sample was placed in epoxy, cured, and polished. Micro X-ray fluorescence (µ-XRF; EDAX Orbis Micro EDXRF) was used to map the spatial distribution of the major elements (U, Pb, Si, Ca, Th, and Fe) found in uraninite (Figure 2 and Figure S1). The elemental maps produced by µ-XRF were used to determine the appropriate location of transects through which the transition from pristine to altered uraninite could be investigated by EMPA. The major elemental oxide abundances were determined using a Cameca SX-50 EMP for 16 elements; U, Pb, Th, Si, Fe, Al, Mn, Ti, As, V, Ca, Zr, K, P, S, and Y [27]; Figure 2, Table S1). Standard EMP operating conditions included an accelerating voltage of 15 kV and beam size of ca. 3 µm with a beam current of 100 nA. A suite of well characterized standards were used to calibrate the EMP prior to each analytical session and included; synthetic uranium dioxide (UO2), galena (PbS), synthetic thorium dioxide (ThO2), synthetic zircon (ZrSiO4), anorthite glass (CaAl2Si2O8), titanium dioxide (TiO2), Mn metal, synthetic Y-Al garnet (Y3Al5O12), synthetic calcium phosphide (Ca2P), synthetic vanadium oxide (V2O3), K-feldspar, Mn-bearing olivine, and asbestos. EMPA analyses (Table S1) and associated µXRF elemental maps (Figure 2 and Figure S1) are included here to illustrate the heterogeneity observed within the samples, and the various alterations that have occurred within the samples. However, this latter topic is outside the scope of this study and will not be discussed further here.
In-situ REE concentrations for all samples were collected using a Thermo Finnigan Element 2 sector field high resolution (HR) ICP-MS coupled to a New Wave Research UP219 Nd:YAG laser ablation system (Table S2). Typical analytical conditions included 30 µm spot, a repetition rate of 5 Hz, and a corresponding energy density of ~12 J cm−2. Background ion signal measurements were determined for 30 s with the shutter closed followed by 60 s of the sample ablation. NIST SRM 610 glass wafer was used as the external standard with Pb (or Ca) abundance from EMPA used as the internal standard. Data reduction were conducted using GLITTER software [60].
3. Results
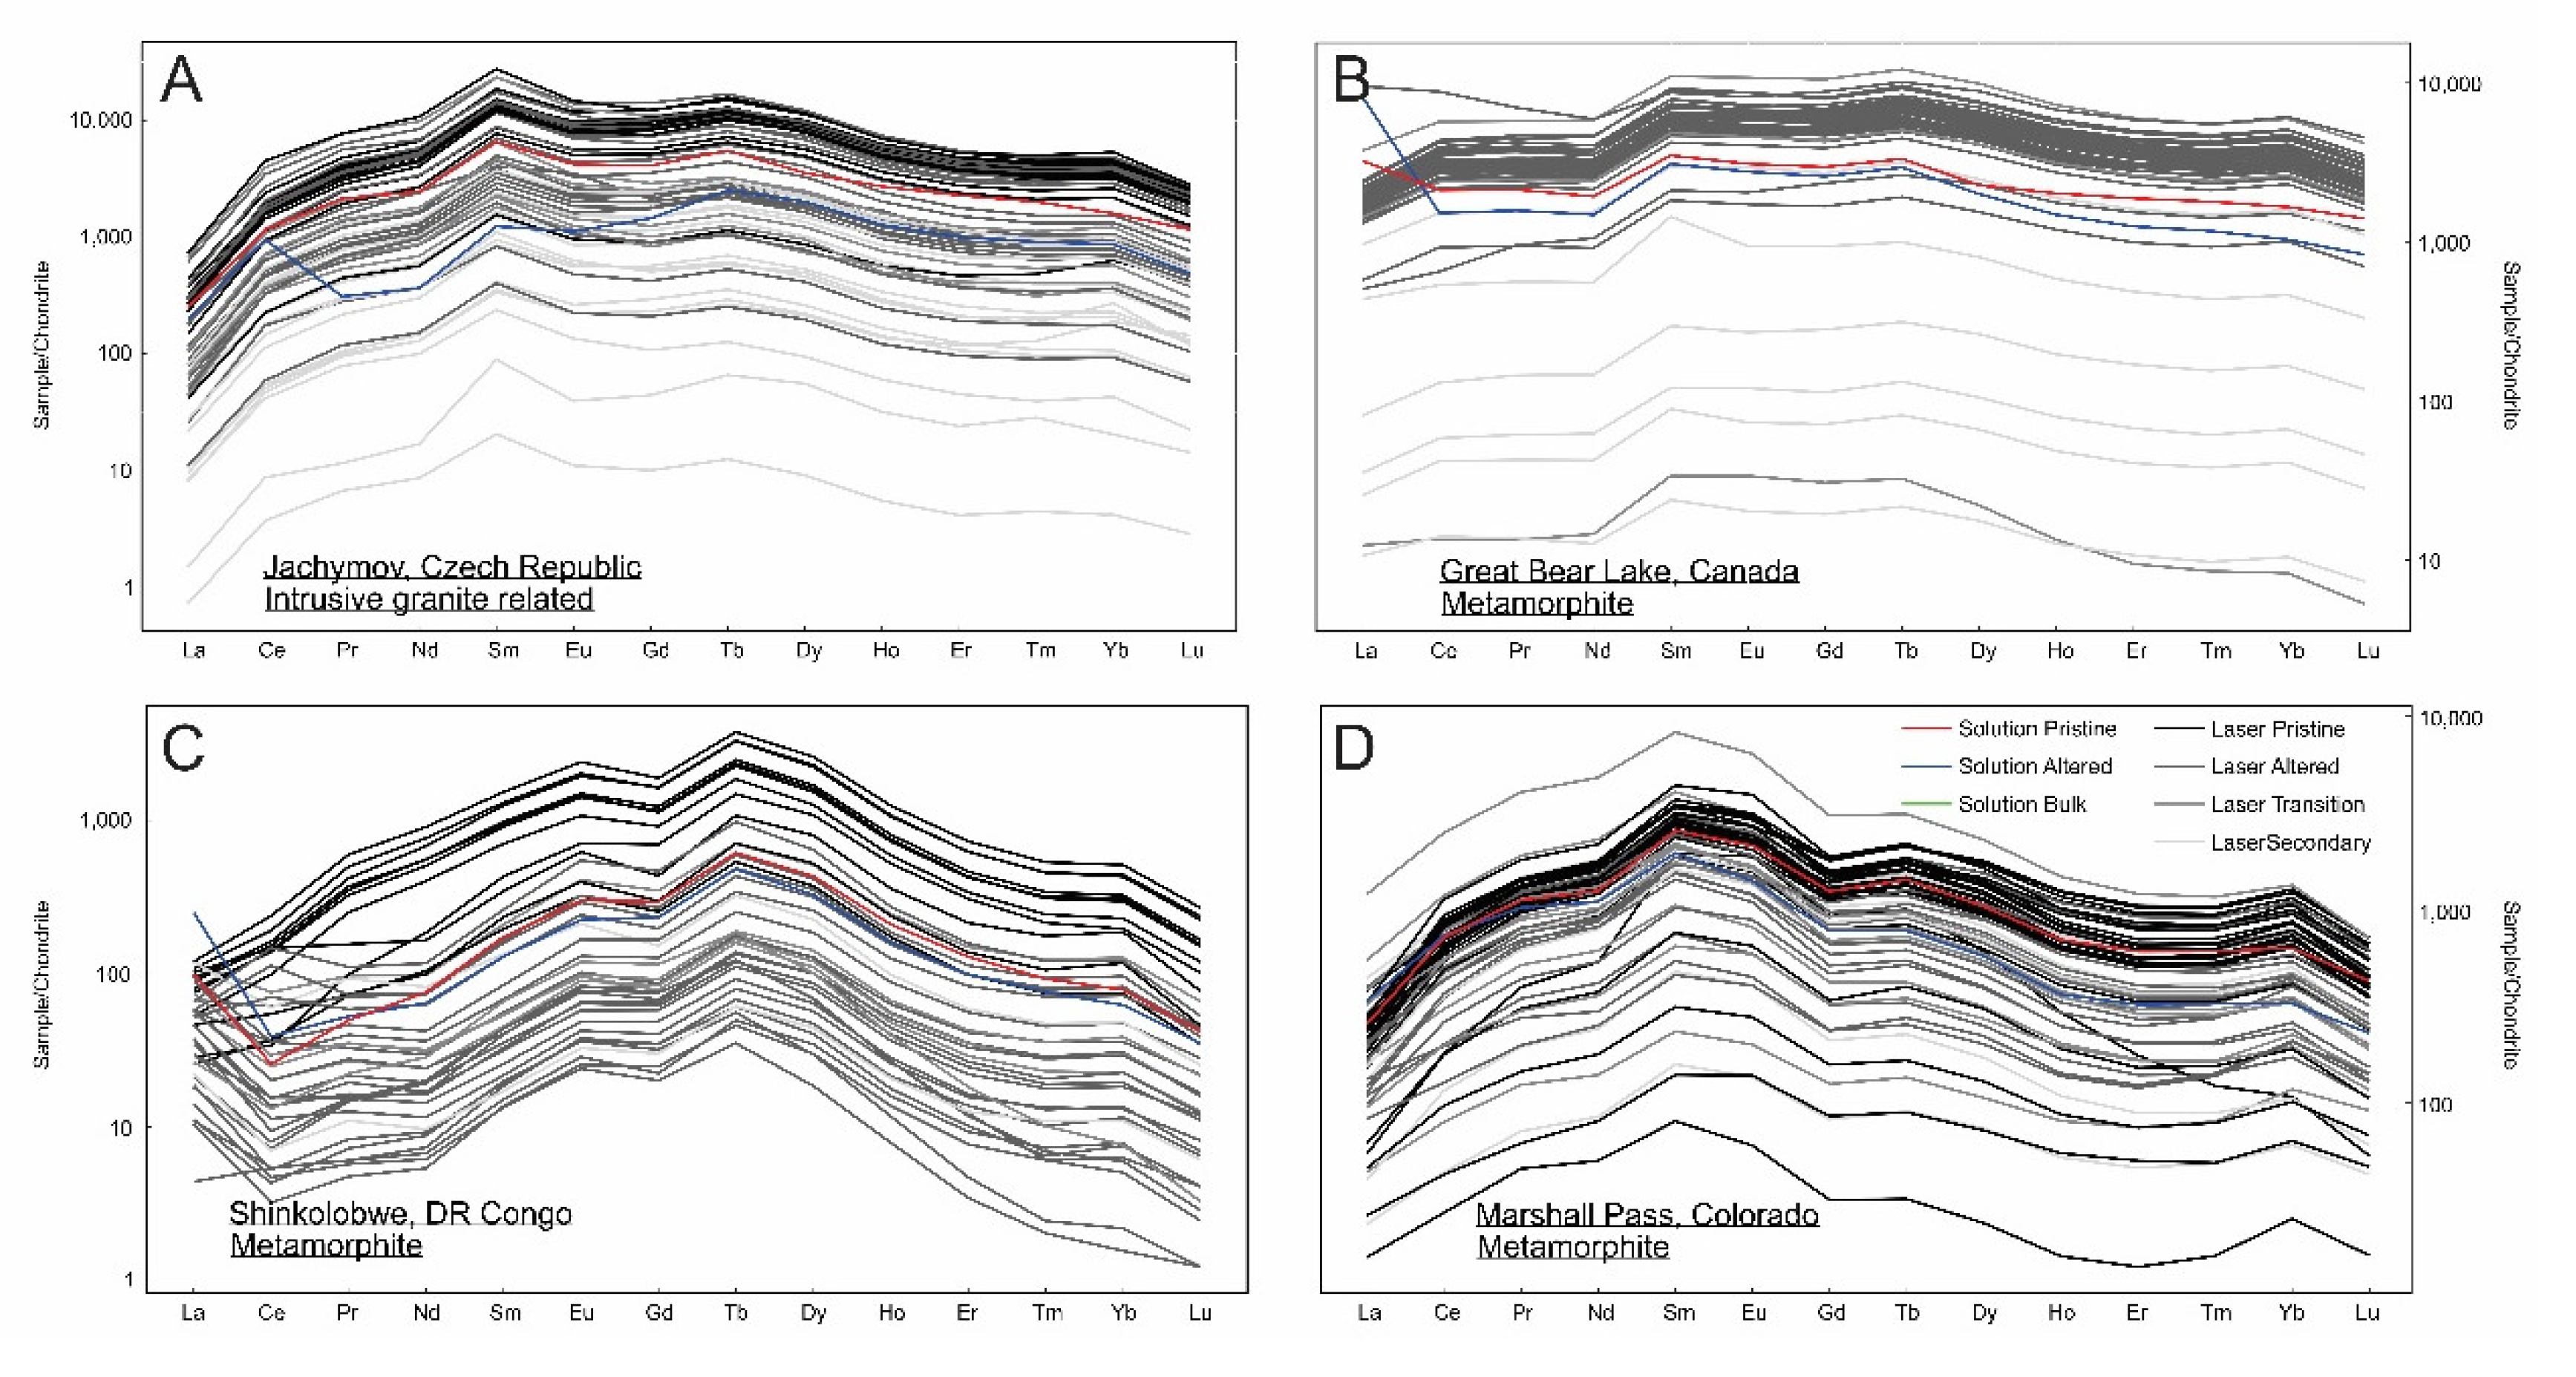
The chondrite normalized REE patterns for a number of the samples are shown in Figure 3. The degree of alteration, i.e., loss of U, perturbs the absolute concentration of the REEs, potentially by several orders of magnitude (e.g., Marshall Pass). However, in general, the variable degree of alteration does not affect the CN-REE pattern (Figure 3). Some variations are evidenced in the La and Ce contents within the REE patterns (e.g., Shinkolobwe and Rabbit Lake samples), which has been attributed to space-charge effect [61]. Of note, the CN-REE curves determined for the Jachymov uraninite sample are not representative of the typical pattern observed for intrusive granite related samples. Deposits of this latter type typically exhibit a negative slope with a negative Eu anomaly, whereas, the pattern illustrated in Figure 3 is similar to those for samples of metamorphite origin (i.e., MREE enrichment; e.g., Great Bear, Shinkolobwe, and Marshall Pass; Figure 3; [3,10,11]). All other uraninites examined in this study have CN-REE patterns that are similar in characteristic to their deposit type (Figure 3 and Figure S2).
The lead isotopic compositions for all uraninites investigated here are reported in Table 2. The 206Pb/204Pb and 207Pb/204Pb ratios define a large range, 67.53–364451 and 18.352–27065, respectively (Table 2). The range generally reflects the age of the associated deposit, with the youngest sample from Marshall Pass having the lowest ratios for both 206Pb/204Pb and 207Pb/204Pb, whereas, the older samples have higher ratios, such as Bancroft and Cardiff (Table 2). Similarly, the range observed in the 208Pb/204Pb is large, 30.821–27072, with the lowest ratio seen in metamorphites and the largest in intrusive non-granite related deposits (Table 2), which corresponds to the higher concentration of Th recorded in the intrusive non-granite related deposits (Table S1) relative to the other deposit types [12]. The 232Th/204Pb ratios were calculated based on the Th and Pb concentrations (and Pb isotope ratios) in each aliquot. 232Th–208Pb isochrons were plotted for each sample, but not reported, since these reflect open system, and therefore, do not yield geologically meaningful ages (Table S3). The proportion of 204Pb varies from 0.0004% to 0.79% with the intrusive non-granite related samples, typically having the lowest 204Pb component (Table 3). In addition, calculated 206Pb/238U and 207Pb/235U dates for individual samples are given in Table 3, and these are plotted within corresponding Concordia diagrams (Figure 4 and Figure S3). For most samples, there is excellent agreement between the calculated dates using both methods; however, discrepancies are noted for samples containing a greater proportion of common Pb (e.g., Great Bear, Jachymov, Marshall Pass).
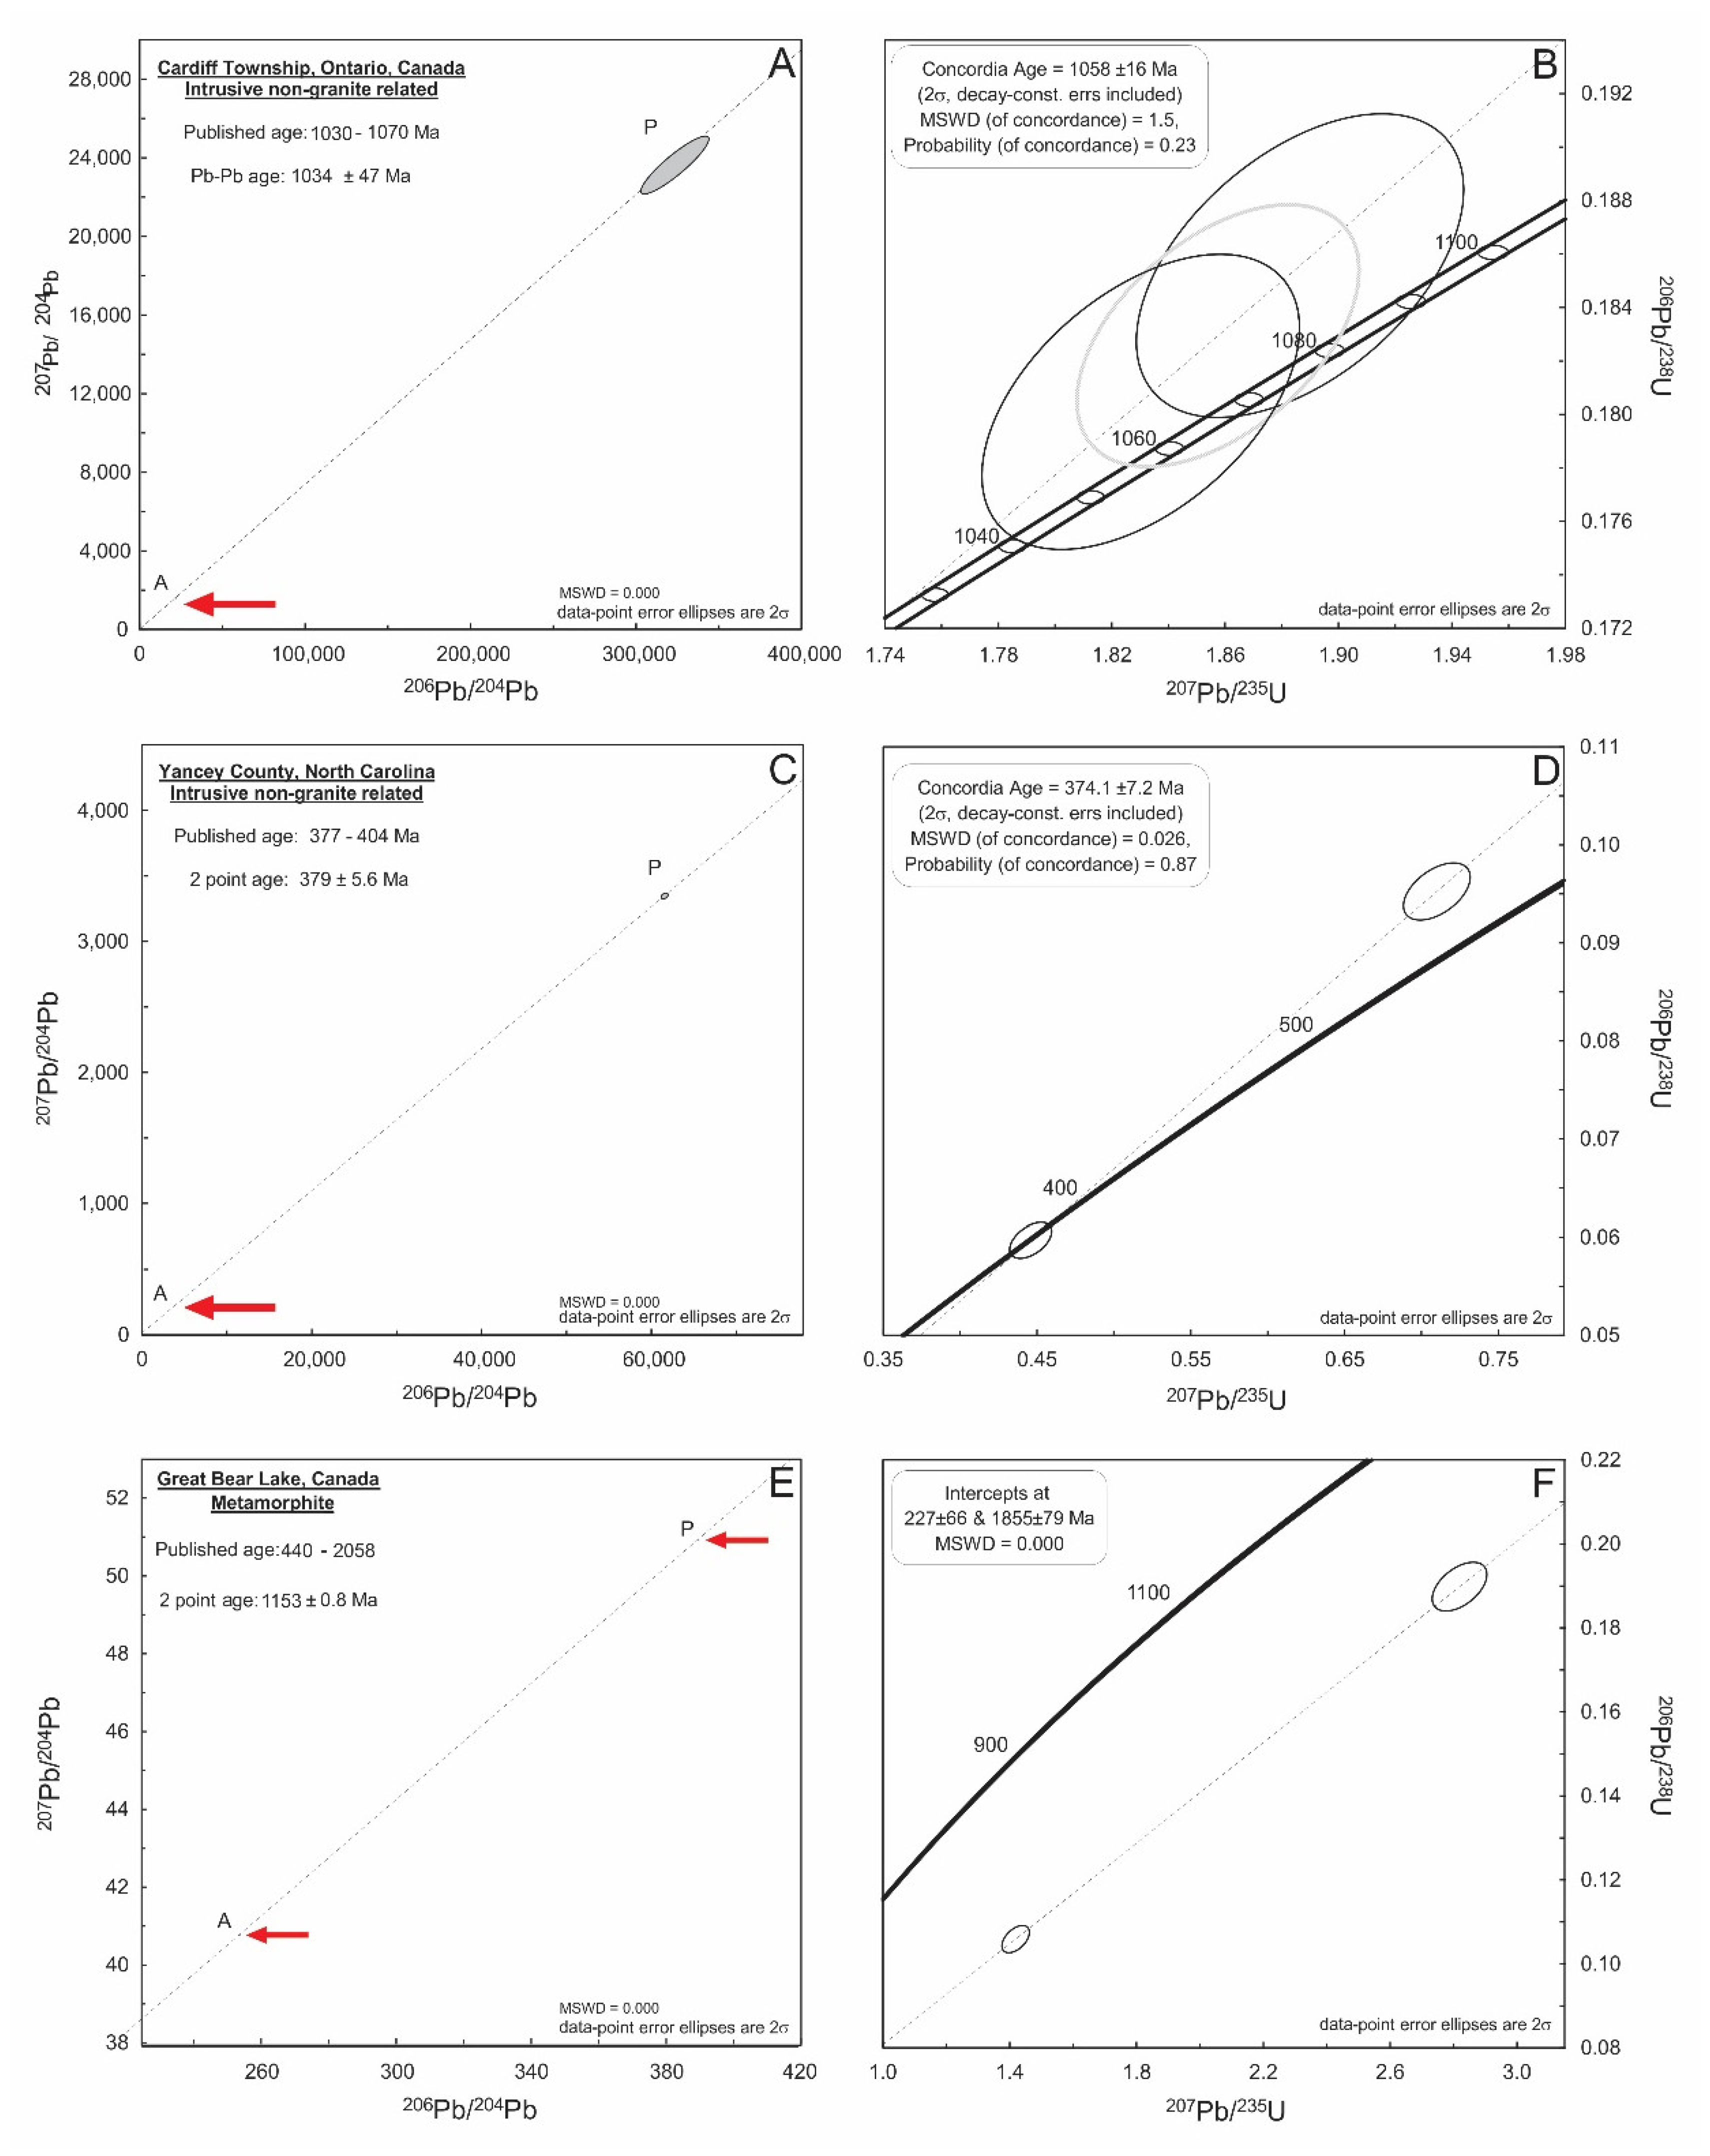
Both the secondary Pb–Pb isochron and concordant U–Pb calculated ages (1034 ± 47 Ma and 1058 ± 16 Ma, respectively) for the Cardiff uraninite are within the uncertainty of each other, and therefore, represent an example of closed U–Pb and closed Pb–Pb systems (Figure 4a,b, Table 3). Moreover, these ages are consistent with the uranium mineralization associated with the pegmatite intrusion in the region at 1030–1070 Ma (Table 1) [35]. The calculated U–Pb and Pb–Pb dates for Yancey uraninite (Figure 4c,d, Table 3) corroborate both the reported Rb–Sr and U–Pb ages of 377–404 Ma for the pegmatite intrusions associated with the Spruce Pine Plutonic Suite (Table 1) [34]. The pristine aliquot for the Yancey uraninite yields a concordant calculated age of 374.1 ± 7.2 Ma, whereas, the altered aliquot shows U gain (Figure 4d, Table 3). The secondary Pb–Pb isochron age of 379 ± 5.6 Ma is in excellent agreement with the U–Pb concordant date for the pristine aliquot, thus, indicating that the Pb–Pb system behaved in a closed manner and provides a meaningful geologic age. The Great Bear Lake uraninite yields a date of 1153 ± 0.8 Ma based on the secondary Pb–Pb isochron, which is consistent with regional scale fluid mobility associated with emplacement of the Coppermine River basalts, and as proposed for uraninites from the Mountain Lake and JD deposit of Echo Bay (1076 ± 96 Ma and 1092 ± 115 Ma) [45,62]. Alternatively, this date could reflect remobilization of uranium during the Grenville Orogeny, as the Great Bear batholith is located at the outer limits of the area affected by hydrothermal activity associated with this orogeny [45]. However, the calculated U–Pb ages for the Great Bear uraninite indicate open system behavior, since pristine and altered aliquots show extreme discordance, due to Pb loss, and define a discordia with upper and lower intercept ages of 1855 ± 79 Ma and 227 ± 66 Ma, respectively. The upper intercept age corresponds with the secondary mineralization event that occurred at 1860 ± 20 Ma, due to granitic intrusive activity, which remobilized uranium and formed numerous uraninite-bearing ‘black sand’ placers [45].
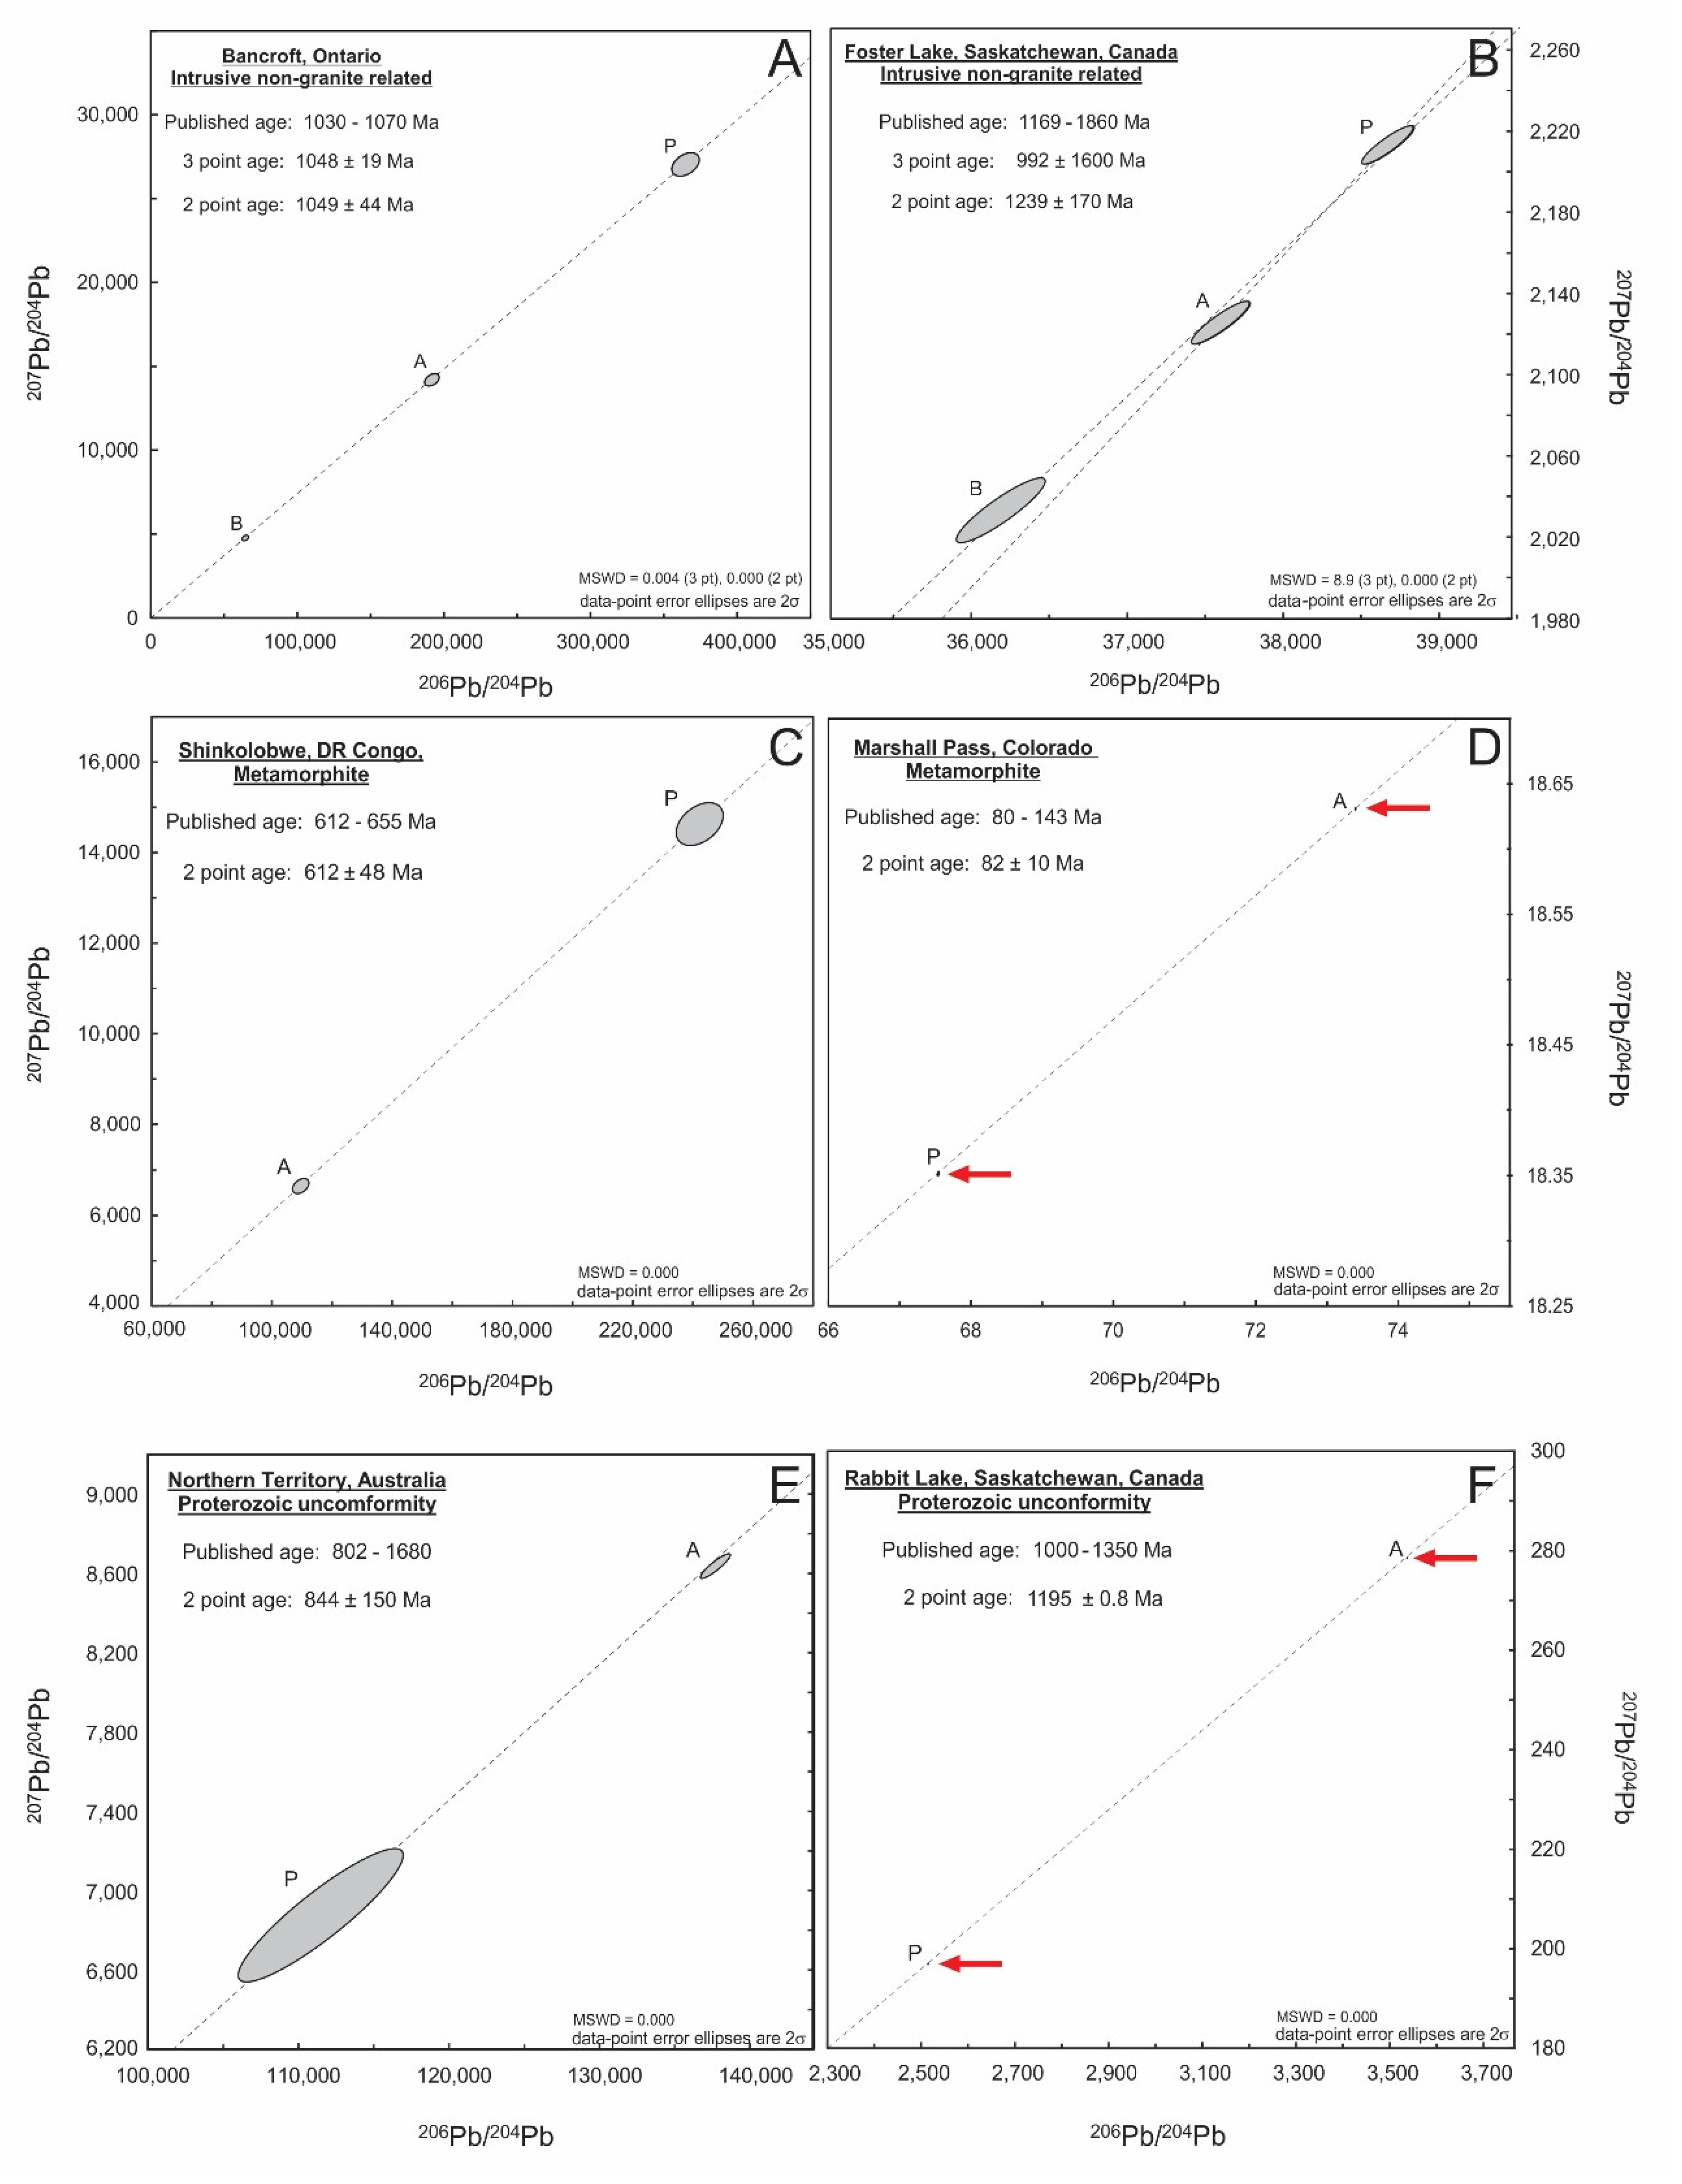
The Bancroft uraninite secondary Pb–Pb isochron (1049 ± 44 Ma) and calculated concordant U–Pb ages (1044 ± 16 Ma) are within uncertainty of each other (Figure 5a and Figure S3, Table 3). As with the Cardiff uraninite the ages determined for the Bancroft uraninite are consistent with the timing of uranium mineralization at 1030–1070 Ma (Table 1), due to pegmatite intrusion in the region [35]. The secondary Pb–Pb isochron date for Foster Lake uraninite is 1239 ± 170 Ma (Figure 5b), whereas, the U–Pb ages are discordant showing significant Pb loss, with an upper intercept date of 500 ± 140 Ma and a lower intercept of near zero (11 ± 41 Ma). The secondary Pb–Pb isochron date for Foster Lake does correspond with previously reported U–Pb ages (Table 1) for uranium remineralization ages (1169 to 1233 Ma) within the Athabasca Basin [41,63]. The secondary Pb–Pb isochron (612 ± 1.9 Ma) and concordant U–Pb (608 ± 11 Ma) ages determined here for Shinkolobwe (Figure 5c and Figure S3, Table 3) are within the uncertainty of the SIMS-determined U–Pb ages (612 ± 1.9 Ma and 652.3 ± 1.9 Ma) for nine uraninite samples from the same region that are related to continental rifting at (Table 1; [25]). The uraninite from the Marshall Pass area is associated with large scale fluid mobility during the Laramide orogeny at ~80 Ma, and corroborates the secondary Pb–Pb isochron age of 82 ± 10 Ma obtained here for the Marshall Pass sample (Figure 5). However, the U–Pb ages are discordant and define upper and lower intercept ages of 340 ± 180 Ma and 0 Ma, respectively (Figure S3). The Marshall Pass uraninite has the largest fraction (0.79%) of common Pb of the uraninites investigated in this study with the altered aliquot characterized by a more radiogenic signature relative to the pristine fraction; the latter may be attributed to hydrothermal activity that contained common Pb from a radiogenic (older) source. The Australian uraninite yields a secondary Pb–Pb isochron age of 844 ± 150 Ma (Figure 5e), whereas, the U–Pb ages define a discordia with a younger upper intercept age at 684 ± 45 Ma (Figure S3). The secondary Pb–Pb age of 1195 ± 0.8 Ma for the Rabbit Lake uraninite (Figure 5f) is within the uncertainty of the upper intercept age of 1348 ± 160 Ma for this sample (Figure S3). The secondary Pb–Pb age in conjunction with the low SiO2 and CaO wt% abundances correlate with stage 1 mineralization in the Athabasca Basin region (Table S1) [64].
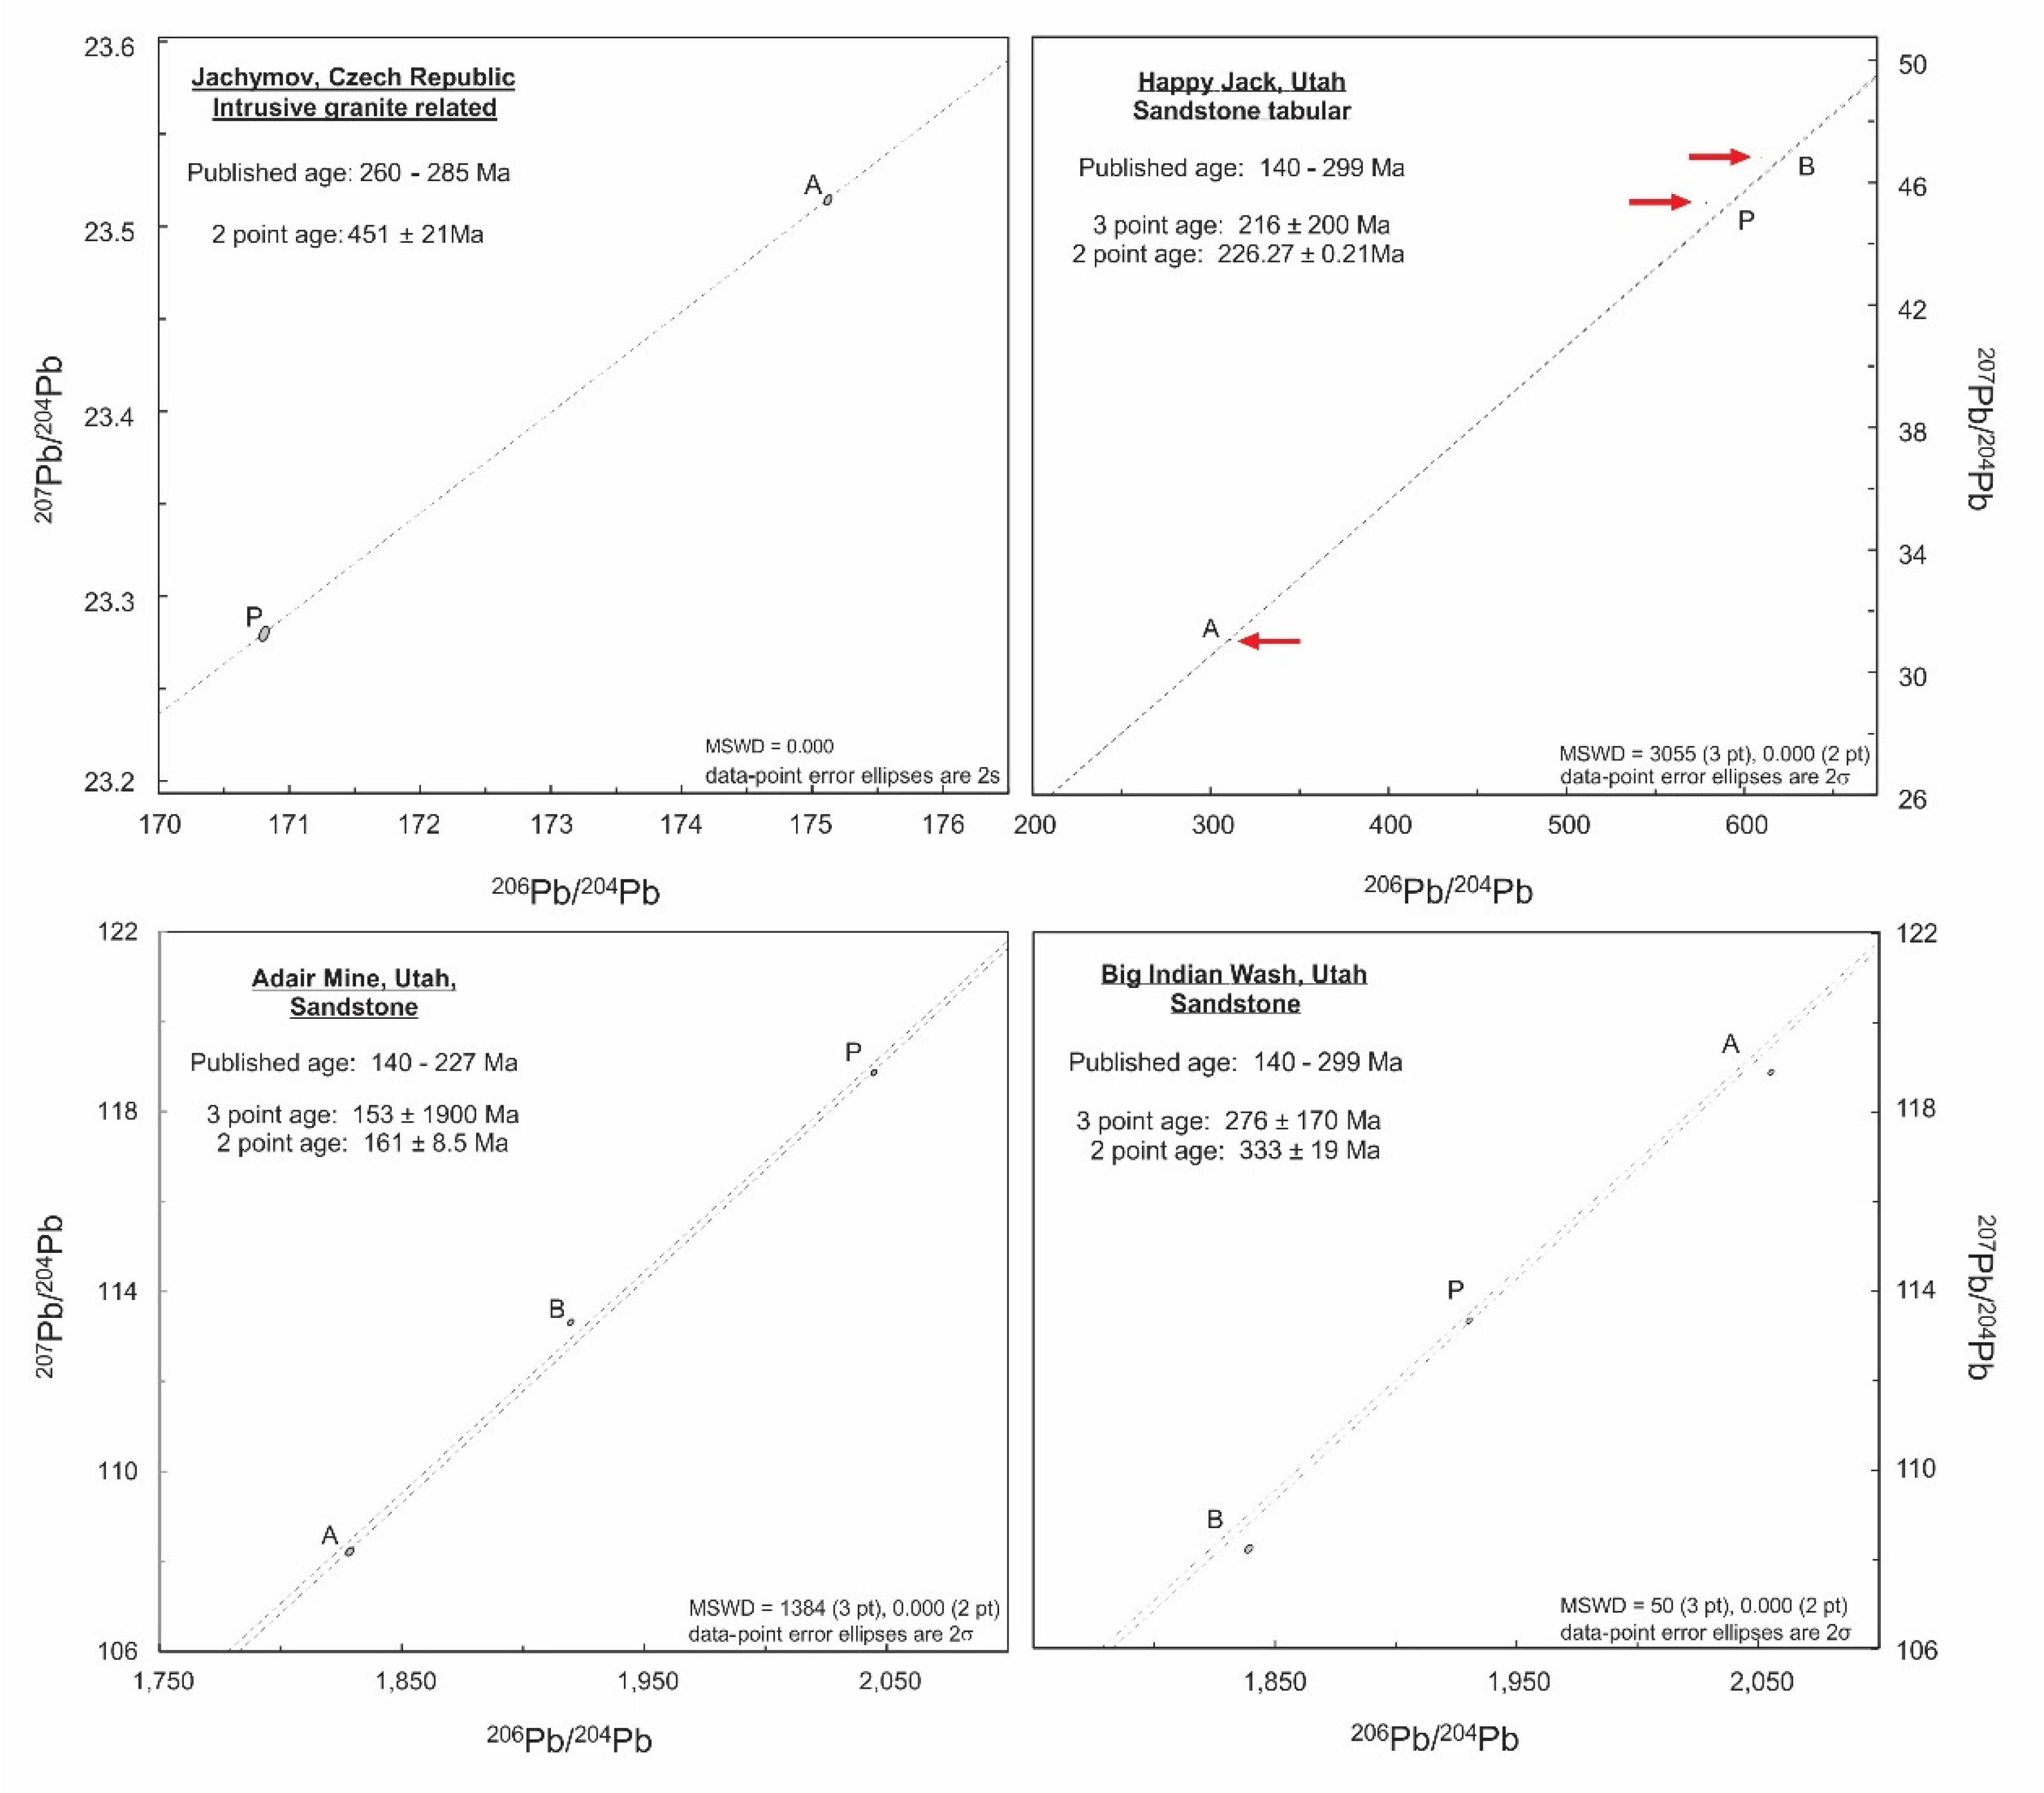
The Jachymov uraninite is the only sample investigated here that yields a secondary Pb–Pb isochron age (451 ± 21 Ma) that is older than the range of published U–Pb ages for this locality (260–285 Ma; [1,42,44,65]; Figure 6), whereas, the two aliquots, altered and pristine, each yield two apparent concordant U–Pb ages of 253.2 ± 5.1 Ma and 204.6 ± 4.2 Ma, respectively (Figure S3, Table 3). The altered aliquot of the Jachymov sample yields a more radiogenic signature (i.e., older age) relative to the pristine sample and may be the result of uranium remobilization (i.e., U gain). In addition, the Jachymov uraninite is characterized by a relatively high fraction of 204Pb (0.42%). The dates obtained for secondary Pb–Pb isochrons and U–Pb ratios for the sandstone-hosted uraninite samples from Utah, Adair Mine, Big Indian Wash, and Happy Jack are within uncertainty of published mineralization ages for these deposits (Table 1 and Table 3; Figure 6). These Colorado Plateau hosted uranium deposits are located within Permian and Triassic formations [50,54,66]. Samples from the Big Indian Wash U deposit, which is located within the Permian Cutler Formation, define a calculated secondary (2-point) Pb–Pb age of 333 ± 19 Ma and the combined three aliquots (bulk, pristine, altered) define a discordia line with a corroborating (given associated uncertainty) upper intercept age of 261 ± 75 Ma (Figure S3). The Adair Mine uraninite sample, which is hosted within the Triassic Chinle formation, yields a secondary Pb–Pb age of 161 ± 8.5 Ma (Figure 6) and this overlaps (given associated uncertainty) with the upper intercept age of 205 ± 44 Ma (Figure S3, Table 3). The altered aliquot for the Adair Mine uraninite seems to have experienced slight U gain, whereas, the pristine sample records Pb loss (Figure S3); the bulk fraction, which most likely represents a mixture of these two components yields a calculated U–Pb age of 142 ±3.0 Ma (Figure S3) and is similar to the secondary Pb–Pb age reported here (Figure 6).
The altered aliquot in five of the samples investigated here (Jachymov, Marshall Pass, Australia, Rabbit Lake, and Big Indian Wash) show a more radiogenic composition than the pristine aliquots (Figure 5 and Figure 6). The Jachymov and Marshall Pass samples are characterized by a higher proportion of 204Pb (Table 3), which suggests the incorporation of Pb from another source, whereas, Australia, Rabbit Lake, and Big Indian Wash reflect the remobilization of U. The bulk aliquot examined in five samples (Bancroft, Foster Lake, Happy Jack, Adair Mine, and Big Indian Wash) varies in its position on the secondary Pb–Pb isochron, e.g., it is the least radiogenic in for the Bancroft, Foster Lake, and Big Indian Lake (Figure 5 and Figure 6), whereas, it is the most radiogenic in Happy Jack (Figure 6) and sits between both the pristine and altered in the Adair Mine sample. The variation in the relative position of the bulk aliquot reflects the proportion of pristine and altered uraninite within the bulk sample, as well as other phases, i.e., not uraninite. In addition, the incorporation of non-uraninite phases within the bulk aliquot will most likely result in producing a different Pb–Pb isochron. For example, the Bancroft sample contains a limited amount of non-uraninite phases (Figure S1); therefore, the bulk aliquot is positioned on the same isochron as the altered and pristine aliquots (Figure 5). In contrast, the Foster Lake sample has both significant silica- and iron-rich phases (Figure S1), which have been included within the bulk aliquot at sufficient levels to produce a different Pb–Pb isochron (Figure 5).
4. Discussion
With the exception of the results for the Jachymov uraninite, the remaining calculated secondary Pb–Pb isochron dates reported in this study yield geologically meaningful ages, for either primary uraninite mineralization (e.g., Bancroft and Cardiff), or remineralization events (e.g., Foster Lake). The ages calculated based on both secondary Pb–Pb isochrons and U–Pb ratios or 207Pb/206Pb upper intercept dates for uraninites from Yancey, Bancroft, Cardiff, and Shinkolobwe are in excellent agreement with each other, and with previously reported uraninite mineralization ages for their respective locations (Table 1). Moreover, the dates reported here for Rabbit Lake uraninite, and the three sandstone deposits from Utah (Adair mine, Big Indian Wash, and Happy Jack) are in agreement (within uncertainty) of both methods and the known uraninite mineralization ages (Table 1). Comparison between the U–Pb and secondary Pb–Pb isochron ages obtained here for uraninite that has undergone either U gain (e.g., Rabbit Lake) or Pb loss (e.g., Happy Jack) does not necessarily produce erroneous results; the main reason being for the majority of uraninites examined here, the pristine, altered, and ± bulk fractions simply move along a single discordia, and thus, preserve the original 207Pb/206Pb upper intercept age corresponding to uraninite mineralization. In addition, a recent study by Lewis et al. [67] demonstrates that the two-point (i.e., altered and pristine aliquots) secondary Pb–Pb isochron method adopted here based on solution mode (SM)-MC-ICP-MS data yields reliable ages as these were corroborated by laser ablation (LA)-MC-ICP-MS Pb–Pb dating results. The LA-MC-ICP-MS Pb isotope data from Lewis et al. (2020), which represent high spatial resolution analyses acquired at the 10s of micron scale for >2 points per each sample of uraninite, illustrate that the Pb isotope compositions are indeed confined to one secondary isochron (i.e., degree of discordance is variable along a single line). Therefore, analyzing more than two aliquots per sample for SM-MC-ICP-MS analysis (i.e., using various amounts of altered and pristine sections for each sample) should not result in a different calculated age. Rather, additional analyses will include either plot along the existing Pb–Pb isochron, or show a bimodal distribution depending on the proportion of altered to pristine uraninite within each aliquot.
The discrepancy observed between the two dating methods for the Foster Lake uraninite, with a much younger upper intercept 207Pb/206Pb age of 500 ± 140 Ma based on significantly discordant analyses may represent later fluid movement related to the Appalachian orogeny that overprinted the original mineralization age [68]. However, the secondary Pb–Pb age still retains the remineralization age of 1239 ± 170 Ma as the uraninite remained closed and did not incorporate U and/or Pb from external sources (i.e., aliquots simply moved along one discordia). The specific location of the Australian uraninite is not known; however, given the secondary Pb–Pb isochron age of 844 ± 150 Ma, it may be related to a post-ore mineral-forming event associated with the Jabiluka unconformity deposit, Alligator Rivers Uranium Field, Northern Territory, Australia. The main uraninite mineralization at Jabiluka occurred at 1680 Ma with three younger age populations at 1302 ± 37 Ma, 1191 ± 27 Ma (Grenville orogeny), and 802 ± 57 Ma (breakup of Rodina) [69]. The fluid movement associated with the latter is within the uncertainty of the date (844 ± 150 Ma) reported for the Australian sample investigated here [69].
Samples that are characterized by higher common Pb component (Table 3), such as the Great Bear Lake, Marshall Pass, and Jachymov uraninites yield a significant difference between the ages calculated using both methods. The 207Pb/206Pb upper intercept age of 1855 ± 79 Ma for the Great Bear Lake uraninite is older than the corresponding secondary Pb–Pb isochron age (1153 ± 0.8 Ma), and may be attributed to significant Pb loss and open system behavior (Figure 4). Similar to the Great Bear uraninite, the 207Pb/206Pb upper intercept age of 340 ± 180 Ma (Figure S3) for the Marshall Pass sample is considerably older than the secondary Pb–Pb isochron date of 82 ± 10 Ma, which may also be attributed to significant Pb loss.
The Jachymov uraninite secondary Pb–Pb isochron calculated age is 451 ± 21 Ma, which is older than the literature age range of 260–285 Ma (Figure 4, Table 1; [42,44]). The CN-REE pattern described for this sample (Figure 3) is not in agreement with the typical trend identified for intrusive granite-related deposit types, or with other CN-REE patterns produced from samples from this location [3,10]; this discrepancy may be attributed to an alternate (regional) source for the uranium (e.g., Silurian U-rich black shale involved in the Variscan Orogen [70]). In addition, the U–Pb ratio for both the altered and pristine aliquots yield concordant dates of 253.2 ± 5.1 Ma and 204.6 ± 4.2 Ma, respectively. However, given its low probability of concordance, the altered fraction has clearly gained U as it plots slightly above the Concordia curve (Figure S3). The XRF map for the Jachymov uraninite (Figure S1) illustrates the presence of abundant small veins and discrete Pb- and/or Si-rich regions. The erroneous secondary Pb–Pb isochron ages of 451 ± 21 Ma for the Jachymov uraninite suggests that there may have been sampling bias when selecting the areas for pristine and altered aliquots, which resulted in a larger proportion of secondary (non-uraninite-related) phases being selected for Pb analysis. However, of importance is that all remaining samples investigated in this work have also experienced various degrees of alteration (e.g., Figure S1), but nonetheless still yield geologically meaningful secondary Pb–Pb isochron ages.
In summary, based on the results reported in this study, it is clear that geologically meaningful secondary Pb–Pb isochron ages may be obtained for uraninite regardless of the degree of secondary alteration. The main reason being that Pb loss or U gain is occurring within a closed system; i.e., contributions from external sources for either element is not recorded as multiple aliquots from individual samples remain on a single discordia. Moreover, the findings reported here indicate that nuclear forensic investigations are most effective when a multi-faceted approach involving geochemical, isotopic, and geochronological signatures are acquired.
5. Conclusions
The geochronological results reported here demonstrate that secondary Pb–Pb isochrons dates based on combined pristine and altered portions of individual uraninite samples yield geologically meaningful and valid ages. Hence, this study demonstrates that the Pb isotope systematics of uraninite are not necessarily perturbed by varying degrees of alteration involving either U and/or Pb loss or gain resulting from events that occurred subsequent to primary ore mineralization. The novel geochronological approach adopted here for the dating of uraninite will prove valuable in source attribution investigations of raw nuclear materials, in particular for interdicted samples that were intercepted by law enforcement, where shorter analytical processing time is of critical importance. Moreover, combining geochronological information with chondrite normalized REE patterns will most certainly aid in effectively fingerprinting the provenance of raw U ores for nuclear forensic purposes.
Supplementary Materials
The following are available online at https://www.mdpi.com/2075-163X/10/3/205/s1, Figure S1: µXRF elemental map, Figure S2: CN-REE Patterns, Figure S3: U–Pb Concordia diagrams, Table S1: EMPA abundance, Table S2: REE (ppm) LA-ICP-MS, Table S3: Pb analysis.
Author Contributions
Conceptualization, A.S. and L.C.; Methodology, A.S. and L.C.; Investigation, L.C.; Writing—Original Draft Preparation, L.C. and A.S.; Writing—Review and Editing, L.C. and A.S.; Funding Acquisition, A.S. All authors have read and agreed to the published version of the manuscript.
Funding
This research was funded by the United States Department of Homeland Security, grant number DHS-14-DN-077-191 ARI-01.
Acknowledgments
The authors thank Ian Steele for his expertise with electron microprobe analysis and the Center of Environmental Science and Technology (CEST) at the University of Notre Dame for training and use of the µ-XRF. All uraninite samples were obtained from the Rod Ewing Mineral Collection, housed at the University of Notre Dame. The authors are grateful for most of the comments and constructive criticisms provided by seven reviewers of our manuscript, which have improved the quality of our paper.
Conflicts of Interest
The authors declare no conflict of interest. The funders had no role in the design of the study; in the collection, analyses, or interpretation of data; in the writing of the manuscript, or in the decision to publish the results.
References
- IAEA. Geological Classification of Uranium Deposits and Description of Selected Examples; IAEA-TECDOC: Vienna, Austria, 2018; pp. 1–430. [Google Scholar]
- Cuney, M. Evolution of uranium fractionation processes through time: Driving the secular variation of uranium deposit types. Econ. Geol. 2010, 105, 553–569. [Google Scholar] [CrossRef]
- Spano, T.; Simonetti, A.; Wheeler, T.; Carpenter, G.; Freet, D.; Balboni, E.; Dorais, C.; Burns, P.C. A novel nuclear forensic tool involving deposit type normalized rare earth element signatures. Terra Nov. 2017, 29, 294–305. [Google Scholar] [CrossRef]
- Alexandre, P.; Kyser, T.K. Effects of cationic substitutions and alteration in uraninite, and implications for the dating of uranium deposits. Can. Mineral. 2005, 43, 1005–1017. [Google Scholar] [CrossRef]
- Cross, A.; Jaireth, S.; Rapp, R.; Armstrong, R. Reconnaissance-style EPMA chemical U–Th–Pb dating of uraninite. Aust. J. Earth Sci. 2011, 58, 675–683. [Google Scholar] [CrossRef]
- Finch, R.; Murakami, T. Systematics and paragenesis of uranium minerals. Uranium Mineral. Geochem. Environ. 1999, 38, 91–179. [Google Scholar]
- Alexandre, P.; Kyser, K.; Layton-Matthews, D.; Joy, B.; Uvarova, Y. Chemical compositions of natural uraninite. Can. Mineral. 2015, 53, 595–622. [Google Scholar] [CrossRef]
- Janeczek, J.; Ewing, R.C. Structural formula of uraninite. J. Nucl. Mater. 1992, 190, 128–132. [Google Scholar] [CrossRef]
- Plášil, J. Oxidation-hydration weathering of uraninite: The current state-of-knowledge. J. Geosci. 2014, 59, 99–114. [Google Scholar] [CrossRef] [Green Version]
- Frimmel, H.E.; Schedel, S.; Brätz, H. Uraninite chemistry as forensic tool for provenance analysis. Appl. Geochem. 2014, 48, 104–121. [Google Scholar] [CrossRef]
- Mercadier, J.; Cuney, M.; Lach, P.; Boiron, M.C.; Bonhoure, J.; Richard, A.; Leisen, M.; Kister, P. Origin of uranium deposits revealed by their rare earth element signature. Terra Nov. 2011, 23, 264–269. [Google Scholar] [CrossRef]
- Corcoran, L.; Simonetti, A.; Spano, T.L.; Lewis, S.R.; Dorais, C.; Simonetti, S.; Burns, P.C. Multivariate analysis based on geochemical, isotopic, and mineralogical composition of uranium-rich samples. Minerals 2019, 9, 537. [Google Scholar] [CrossRef] [Green Version]
- Dahlkamp, F.J. The time related occurrence of uranium deposits. Miner. Depos. 1980, 15, 69–79. [Google Scholar] [CrossRef]
- Balboni, E.; Jones, N.; Spano, T.; Simonetti, A.; Burns, P.C. Chemical and Sr isotopic characterization of North America uranium ores: Nuclear forensic applications. Appl. Geochem. 2016, 74, 24–32. [Google Scholar] [CrossRef] [Green Version]
- Shannon, R.D. Revised effective ionic radii and systematic studies of interatomie distances in halides and chaleogenides. Acta Cryst. 1976, 32, 751–767. [Google Scholar] [CrossRef]
- Eglinger, A.; André-Mayer, A.S.; Vanderhaeghe, O.; Mercadier, J.; Cuney, M.; Decrée, S.; Feybesse, J.L.; Milesi, J.P. Geochemical signatures of uranium oxides in the Lufilian belt: From unconformity-related to syn-metamorphic uranium deposits during the Pan-African orogenic cycle. Ore Geol. Rev. 2013, 54, 197–213. [Google Scholar] [CrossRef]
- Balboni, E.; Simonetti, A.; Spano, T.; Cook, N.D.; Burns, P.C. Rare-earth element fractionation in uranium ore and its U(VI) alteration minerals. Appl. Geochem. 2017, 87, 84–92. [Google Scholar] [CrossRef]
- Janeczek, J.; Ewing, R.C. Mechanisms of lead release from uraninite in the natural fission reactors in Gabon. Geochim. Cosmochim. Acta 1995, 59, 1917–1931. [Google Scholar] [CrossRef]
- Kyser, K.; Hiatt, E.; Renac, C.; Durocher, K.; Holk, G.; Deckart, K. Diagenetic fluids in paleo-and meso-Proterozoic sedimentary basins and their implications for long protracted fluid histories. Miner. Assoc. Canada Short Course 2000, 28, 225–262. [Google Scholar]
- Hazen, R.M.; Ewing, R.C.; Sverjensky, D.A. Evolution of uranium and thorium minerals. Am. Mineral. 2009, 94, 1293–1311. [Google Scholar] [CrossRef]
- Richard, A.; Pettke, T.; Cathelineau, M.; Boiron, M.C.; Mercadier, J.; Cuney, M.; Derome, D. Brine-rock interaction in the athabasca basement (mcarthur river U deposit, Canada): Consequences for fluid chemistry and uranium uptake. Terra Nov. 2010, 22, 303–308. [Google Scholar] [CrossRef]
- Cui, T.; Yang, J.; Samson, I.M. Tectonic deformation and fluid flow: Implications for the formation of unconformity-related uranium deposits. Econ. Geol. 2012, 107, 147–163. [Google Scholar] [CrossRef]
- Bowles, J.F.W. Age dating of individual grains of uraninite in rocks from electron microprobe analyses. Chem. Geol. 1990, 83, 47–53. [Google Scholar] [CrossRef]
- Chipley, D.; Polito, P.A.; Kurtis Kyser, T. Measurement of U–Pb ages of uraninite and davidite by laser ablation-HR-ICP-MS. Am. Miner. 2007, 92, 1925–1935. [Google Scholar] [CrossRef]
- Decrée, S.; Deloule, É.; De Putter, T.; Dewaele, S.; Mees, F.; Yans, J.; Marignac, C. SIMS U–Pb dating of uranium mineralization in the katanga copperbelt: Constraints for the geodynamic context. Ore Geol. Rev. 2011, 40, 81–89. [Google Scholar] [CrossRef]
- Sharpe, R.; Fayek, M. Mass bias corrections for U–Pb isotopic analysis by secondary ion mass spectrometry: Implications for U–Pb dating of uraninite. Rapid Commun. Mass Spectrom. 2016, 30, 1601–1611. [Google Scholar] [CrossRef] [PubMed]
- Lewis, S.R.; Simonetti, A.; Corcoran, L.; Spano, T.L.; Chung, B.W.; Teslich, N.E.; Burns, P.C. Characterization of uraninite using a FIB–SEM approach and its implications for LA–ICP–MS analyses. J. Radioanal. Nucl. Chem. 2018, 318, 1389–1400. [Google Scholar] [CrossRef]
- Martz, P.; Mercadier, J.; Perret, J.; Villeneuve, J.; Deloule, E.; Cathelineau, M.; Quirt, D.; Doney, A.; Ledru, P. Post-crystallization alteration of natural uraninites: Implications for dating, tracing, and nuclear forensics. Geochim. Cosmochim. Acta 2019, 249, 138–159. [Google Scholar] [CrossRef]
- Frondel, C. Systematic Mineralogy of Uranium and Thorium; US Government Printing Office: Washington, WA, USA, 1958; pp. 1–400.
- Kotzer, T.G.; Kyser, T.K. O, U, and Pb isotopic and chemical variations in uraninite: Implications for determining the temporal and fluid history of ancient terrains. Am. Mineral. 1993, 78, 1262–1274. [Google Scholar]
- Cloutier, J.; Kyser, K.; Olivo, G.R.; Alexandre, P.; Halaburda, J. The Millennium uranium deposit, Athabasca Basin, Saskatchewan, Canada: An atypical basement-hosted unconformity-related uranium deposit. Econ. Geol. 2009, 104, 815–840. [Google Scholar] [CrossRef]
- Andersen, T.; Grorud, H.F. Age and lead isotope systematics of uranium-enriched cobalt mineralization in the modum complex, south norway implications for precambrian crustal evolution in the SW part of the baltic shield. Precambrian Res. 1998, 91, 419–432. [Google Scholar] [CrossRef]
- Brobst, D.A. Geology of the Spruce Pine District Avery, Mitchell, and Yancey Counties North Carolina; US Government Printing Office: Washington, WA, USA, 1962.
- Swanson, S.E.; Veal, W.B. Mineralogy and petrogenesis of pegmatites in the spruce pine district, north carolina, USA. J. Geosci. 2010, 55, 27–42. [Google Scholar] [CrossRef] [Green Version]
- Desbarats, A.J.; Percival, J.B.; Venance, K.E. Trace element mobility in mine waters from granitic pegmatite U-Th-REE deposits, bancroft area, ontario. Appl. Geochem. 2016, 67, 153–167. [Google Scholar] [CrossRef]
- Hogarth, D.D.; Breemen, O. Van geology and age of the lac a la perdrix fenite, southern gatineau district, Quebec. Radiogenic Age Isot. Stud. 1996, 9, 33–41. [Google Scholar]
- Robinson, S.C. Economic uranium deposits in granitic dykes bancroft district, ontario. Geol. Surv. Can. Ottawa 1960, 6, 513–521. [Google Scholar]
- Mawdsley, J. Uraninite-bearing deposits, charlebois lake area, northeastern Saskatchewan. Can. Inst. Min. Metall. Pet. Bull. 1952, 482, 366–375. [Google Scholar]
- Mckeough, M.A.; Lentz, D.R.; Brown, J.A. Geology and associated pegmatite-and vein-hosted uranium mineralization of the kulyk, eagle, and karin lakes regions, wollaston domain, northern saskatchewan. Sask. Geol. Surv. 2010, 2, 1–23. [Google Scholar]
- McKeough, M.A.; Lentz, D.R.; Mcfarlane, C.R.M.; Brown, J. Geology and evolution of pegmatite-hosted U-Th ± REE-Y-Nb mineralization, Kulyk, Eagle, and Karin Lakes region, Wollaston Domain, northern Saskatchewan, Canada: Examples of the dual role of extreme fractionation and hybridization processes. J. Geosci. 2013, 58, 321–346. [Google Scholar] [CrossRef] [Green Version]
- Annesley, I.R.; Madore, C.; Bonli, T. Uraninite-bearing granitic pegmatite, moore lakes, saskatchewan: Petrology and U-Th-Pb chemical ages. Sask. Geol. Surv. 2000, 2, 201–211. [Google Scholar]
- Kríbek, B.; Žák, K.; Dobeá, P.; Leichmann, J.; Pudilová, M.; René, M.; Scharm, B.; Scharmová, M.; Hájek, A.; Holeczy, D.; et al. The Rožná uranium deposit (Bohemian Massif, Czech Republic): Shear zone-hosted, late Variscan and post-Variscan hydrothermal mineralization. Miner. Depos. 2009, 44, 99–128. [Google Scholar] [CrossRef]
- Ondruš, P.; Veselovský, F.; Gabašová, A.; Vavřín, I.; Skála, R.; Draábek, M.; Hloušek, J.; Šrein, V.; Sejkora, J. Primary minerals of the Jáchymov ore district. J. Czech Geol. Soc. 2003, 48, 19–147. [Google Scholar]
- Ondrus, P.; Veselovský, F.; Gabašová, A.; Hloušek, J.; Srein, V. Geology and hydrothermal vein system of the Jachymov (Joachimsthal) ore district. J. Geosci. 2003, 48, 3–18. [Google Scholar]
- Miller, R.G. The geochronology of uranium deposits in the great bear batholith, northwest territories. Can. J. Earth Sci. 1982, 19, 1428–1448. [Google Scholar] [CrossRef]
- Deditius, A.P.; Utsunomiya, S.; Ewing, R.C. Fate of trace elements during alteration of uraninite in a hydrothermal vein-type U-deposit from Marshall Pass, Colorado, USA. Geochim. Cosmochim. Acta 2007, 71, 4954–4973. [Google Scholar] [CrossRef]
- Hoeve, J.; Sibbald, T.I.I. On the genesis of rabbit lake and other unconformity-type uranium deposits in northern saskatchewan, Canada. Econ. Geol. 1978, 73, 1450–1473. [Google Scholar] [CrossRef]
- Baadsgaard, H.; Cummino, G.L.; Worden, J.M. U–Pb geochronology of minerals from the midwest uranium deposit, northern saskatchewan. Can. J. Earth Sci. 1984, 21, 642–648. [Google Scholar] [CrossRef]
- Corey, A.S. Mineralogy and Petrology of the Uranium Deposits of Cane Springs Canyon, San Juan and Grand Counties, Utah; USAEC Grand Junction Operations Office: Grand Junction, CO, USA, 1959. [Google Scholar]
- Chenoweth, W.L. Uranium deposits of the canyonlands area. USA Energy Res. Dev. Adm. 1975, 134, 635–646. [Google Scholar]
- Trites, A.F.; Chew, R., III. Geology of the happy jack mine white canyon area san juan county, Utah. Geol. Surv. Bull. Contrib. Geol. Uranium 1955, 1009-H. [Google Scholar] [CrossRef]
- Reynolds, R.L.; Hudson, M.R.; Fishman, N.S.; Campbell, J.A. Paleomagnetic and petrologic evidence bearing on the age and origin of uranium deposits in the permian cutler formation, lisbon valley, Utah. Geol. Soc. Am. Bull. 1985, 96, 719–730. [Google Scholar] [CrossRef]
- Ludwig, K.R.; Simmons, K.R.; Webster, J.D. U–Pb isotope systematics and apparent ages of uranium ores, ambrosia lake and smith lake districts, grants mineral belt, New Mexico. Econ. Geol. 1984, 79, 322–337. [Google Scholar] [CrossRef]
- Sanford, R.F. Preliminary model of regional Mesozoic groundwater flow and uranium deposition in the colorado plateau. Geology 1982, 10, 348–352. [Google Scholar] [CrossRef]
- Manhes, G.; Minster, J.F.; Allègre, C.J. Comparative uranium-thorium-lead and rubidium-strontium study of the Saint Sèverin amphoterite: Consequences for early solar system chronology. Earth Planet. Sci. Lett. 1978, 39, 14–24. [Google Scholar] [CrossRef]
- Simonetti, A.; Gariépy, C.; Banic, C.M.; Tanabe, R.; Wong, H.K. Pb isotopic investigation of aircraft-sampled emissions from the Horne smelter (Rouyn, Québec): Implications for atmospheric pollution in northeastern North America. Geochim. Cosmochim. Acta 2004, 68, 3285–3294. [Google Scholar] [CrossRef]
- Simonetti, A.; Gariépy, C.; Carignan, J. Pb and Sr isotopic compositions of snowpack from Quebec, Canada: Inferences on the sources and deposition budgets of atmospheric heavy metals. Geochim. Cosmochim. Acta 2000, 64, 5–20. [Google Scholar] [CrossRef]
- Baker, J.; Peate, D.; Waight, T.; Meyzen, C. Pb isotopic analysis of standards and samples using a 207Pb–204Pb double spike and thallium to correct for mass bias with a double-focusing MC-ICP-MS. Chem. Geol. 2004, 211, 275–303. [Google Scholar] [CrossRef]
- Ludwig, K.R. User’s manual for Isoplot version 3.75–4.15: A geochronological toolkit for Microsoft Excel. Berkeley Geochronol. Cent. Spec. Publ. 2012, 5, 1–75. [Google Scholar]
- Van Achterberg, E.; Ryan, C.; Jackson, S.; Griffin, W. Data reduction software for LA-ICP-MS. Laser Ablation ICP MS Earth Sci. 2001, 29, 239–243. [Google Scholar]
- Lach, P.; Mercadier, J.; Dubessy, J.; Boiron, M.C.; Cuney, M. In situ quantitative measurement of rare earth elements in uranium oxides by laser ablation-inductively coupled plasma-mass spectrometry. Geostand. Geoanalytical Res. 2013, 37, 277–296. [Google Scholar] [CrossRef]
- Rice, S.; Kyser, K. Fluid history and uranium mineralization in the hornby bay basin, nunavut, Canada. In Proceedings of the 2010 CSPG/CSEG/CWLS GeoConvention, Working with the Earth, Calgary, AB, Canada, 10–14 May 2010; pp. 1–4. [Google Scholar]
- McKechnie, C.L.; Annesley, I.R.; Ansdell, K.M. Radioactive Abyssal granitic pegmatites and leucogranites in the wollaston domain, northern saskatchewan, Canada: Mineral compositions and conditions of emplacement in the fraser lakes area. Can. Miner. 2012, 50, 1637–1667. [Google Scholar] [CrossRef]
- Fayek, M.; Kyser, T.K. Characterization of multiple fluid-flow events and rare-earth-element mobility associated with formation of unconformity-type uranium deposits in teh athabasca basin, saskatchewan. Can. Miner. 1997, 35, 627–658. [Google Scholar]
- Förster, H.J.; Rhede, D.; Stein, H.J.; Romer, R.L.; Tischendorf, G. Paired uraninite and molybdenite dating of the königshain granite: Implications for the onset of late-variscan magmatism in the lausitz block. Int. J. Earth Sci. 2012, 101, 57–67. [Google Scholar] [CrossRef] [Green Version]
- Irmis, R.B.; Mundil, R.; Martz, J.W.; Parker, W.G. High-resolution U–Pb ages from the upper triassic chinle formation (New Mexico, USA) support a diachronous rise of dinosaurs. Earth Planet. Sci. Lett. 2011, 309, 258–267. [Google Scholar] [CrossRef]
- Lewis, S.R.; Simonetti, A.; Corcoran, L.; Simonetti, S.S.; Dorais, C.; Burns, P.C. The role of continental crust in the formation of uraninite-based ore deposits. Minerals 2020, 10, 136. [Google Scholar] [CrossRef] [Green Version]
- Dieng, S.; Kyser, K.; Godin, L. Genesis of multifarious uranium mineralization in the beaverlodge area, northern saskatchewan, Canada. Econ. Geol. 2015, 110, 209–240. [Google Scholar] [CrossRef]
- Polito, P.A.; Kyser, T.K.; Thomas, D.; Marlatt, J.; Drever, G. Re-evaluation of the petrogenesis of the Proterozoic Jabiluka unconformity-related uranium deposit, northern territory, Australia. Miner. Depos. 2005, 40, 257–288. [Google Scholar] [CrossRef]
- Romer, R.L.; Cuney, M. Phanerozoic uranium mineralization in variscan europe—More than 400 ma of tectonic, supergene, and climate-controlled uranium redistribution. Ore Geol. Rev. 2018, 102, 474–504. [Google Scholar] [CrossRef]
Figure 1.
Image of the Northern Territory, Australia uraninite sample (Australia, #516). This sample illustrates the variation that can be observed between a pristine (UO2 > 80 wt%, base of the sample) and an altered portion (UO2 < 80 wt%, mid–top of the sample) within a single specimen.
Figure 1.
Image of the Northern Territory, Australia uraninite sample (Australia, #516). This sample illustrates the variation that can be observed between a pristine (UO2 > 80 wt%, base of the sample) and an altered portion (UO2 < 80 wt%, mid–top of the sample) within a single specimen.

Figure 2.
XRF elemental maps for three uraninite samples investigated here: (A) Bancroft, (B) Marshall Pass, and (C) Adair Mine are shown on the left. Each of the XRF maps has a transect indicated A to A’, which corresponds to the UO2 and PbO abundances profile given in the line graphs. The transects illustrate the degree of alteration within each sample.

Figure 3.
Chondrite normalized REE patterns for the (A) Jachymov, (B) Great Bear Lake, (C) Shinkolobwe, and (D) Marshall Pass uraninite samples. The gray and black indicate UO2 wt% abundance; black ≥ 80 wt%, gray 80 = altered (UO2 70–80 wt%), gray 60 = transition (UO2 50–70 wt%), and gray 40 = secondary (UO2 < 50 wt%). The colored line (red = pristine, blue = altered, and green = bulk) indicate abundances determined by solution-ICP-MS.

Figure 4.
Secondary Pb–Pb isochrons plots and corresponding Concordia diagrams illustrating results for Cardiff (A,B), Yancey (C,D), and Great Bear (E,F) uraninite samples. Symbol size (including associated uncertainty) for certain analyses within the secondary Pb–Pb isochrons are difficult to see, due to large range (scaling) of Pb isotope compositions. Therefore, a red arrow is shown to indicate the position of these analyses. Ellipses for calculated U–Pb ratios for samples illustrated in Concordia plots encompass all sources of uncertainty, and these have been propagated at the 2 level (average of ~2.5%).

Figure 5.
Secondary Pb–Pb isochron for the remaining 2 intrusive non-granite related samples, (A) Bancroft, and (B) Foster Lake, two metamorphite deposit related samples, (C) Shinkolobwe, and (D) Marshall Pass, and the Proterozoic unconformity related samples, (E) Northern Territory, Australia, and (F) Rabbit Lake. Symbol size (including associated uncertainty) for certain analyses are difficult to see, due to large range (scaling) of Pb isotope compositions. Therefore, a red arrow is shown to indicate the position of these analyses.

Figure 6.
Secondary Pb–Pb isochron for Jachymov (A) the intrusive granite related sample and the three sandstone type related samples, (B–D) Symbol size (including associated uncertainty) for certain analyses are difficult to see, due to large range (scaling) of Pb isotope compositions. Therefore, a red arrow is shown to indicate the position of these analyses.


Table 1.
Sample location, published age range, and associated International Atomic Energy Agency (IAEA) designation.
Table 1.
Sample location, published age range, and associated International Atomic Energy Agency (IAEA) designation.
| Sample Name | Location | Age Range (Ma) | Type |
|---|---|---|---|
| Marshall Pass | Marshall Pass, Colorado, USA | 80–143 | Metamorphite |
| Adair Mine | Cane Spring Canyon, Utah, USA | 140–227 | Sandstone |
| Big Indian Wash | Big Indian Wash, Utah, USA | 140–299 | Sandstone |
| Happy Jack | Happy Jack, Utah, USA | 140–299 | Sandstone–tabular |
| Jachymov | Jachymov, Czech Republic | 260–285 | Intrusive granite related |
| Yancey | Yancey County, North Carolina, USA | 377–404 | Intrusive non-granite related |
| Shinkolobwe | Shinkolobwe, DR Congo | 612–655 | Metamorphite |
| Bancroft | Bancroft, Ontario, Canada | 1030–1070 | Intrusive non-granite related |
| Cardiff | Cardiff Township, Ontario, Canada | 1030–1070 | Intrusive non-granite related |
| Australia | Northern Territory, Australia | 802–1680 | Metamorphite |
| Rabbit Lake | Rabbit Lake, Saskatchewan, Canada | 1000–1350 | Proterozoic unconformity |
| Foster Lake | Saskatchewan, Canada | 1169–1860 | Intrusive non-granite related |
| Great Bear | Northwest Territories, Canada | 440–2058 | Metamorphite |
Table 2.
Pb isotope compositions for samples (pristine, altered, and bulk) analyzed in this study.
| Sample | 206Pb/204Pb ± 2σ | 207Pb/204Pb ± 2σ | 208Pb/204Pb ± 2σ | 207Pb/206Pb ± 2σ | 208Pb/206Pb ± 2σ | |
|---|---|---|---|---|---|---|
| Marshall Pass (M) | A | 73.400 ± 4 | 18.631 ± 1 | 39.743 ± 2 | 0.2538380 ± 62 | 0.5414685 ± 179 |
| P | 67.53 ± 1 | 18.352 ± 1 | 39.762 ± 2 | 0.2717401 ± 268 | 0.5888985 ± 765 | |
| Big Indian Wash (SS) | A | 6439 ± 14 | 340.9 ± 8 | 38.873 ± 90 | 0.0529373 ± 22 | 0.0060277 ± 43 |
| P | 5666 ± 3 | 299.8 ± 1 | 38.523 ± 19 | 0.0529179 ± 7 | 0.0067985 ± 8 | |
| B | 3191 ± 2 | 172.40 ± 1 | 38.259 ± 22 | 0.0540202 ± 9 | 0.0119880 ± 12 | |
| Adair Mine (SS) | A | 1828 ± 1 | 108.2 ± 1 | 38.217 ± 26 | 0.0592047 ± 17 | 0.0209006 ± 29 |
| P | 2044 ± 1 | 118.9 ± 1 | 38.013 ± 16 | 0.0581586 ± 14 | 0.0185928 ± 11 | |
| B | 1919 ± 1 | 113.3 ± 1 | 38.042 ± 18 | 0.0590439 ± 11 | 0.0198196 ± 22 | |
| Happy Jack (SS) | A | 310.72 ± 1 | 31.082 ± 1 | 38.548 ± 2 | 0.1000328 ± 9 | 0.1240603 ± 15 |
| P | 592.51 ± 2 | 45.363 ± 2 | 39.149 ± 2 | 0.0765611 ± 6 | 0.0660723 ± 7 | |
| B | 623.8 ± 2 | 46.826 ± 2 | 38.621 ± 1 | 0.0750658 ± 6 | 0.0619123 ± 8 | |
| Jachymov | A | 175.20 ± 2 | 23.512 ± 2 | 38.437 ± 3 | 0.1342244 ± 55 | 0.2194110 ± 194 |
| (I-G) | P | 171.10 ± 3 | 23.285 ± 3 | 38.405 ± 5 | 0.136112 ± 39 | 0.2245024 ± 131 |
| Yancey (I) | A | 2229.5 ± 2 | 135.16 ± 1 | 64.879 ± 5 | 0.0606215 ± 3 | 0.0290996 ± 11 |
| P | 61570 ± 339 | 3351 ± 18 | 809.54 ± 441 | 0.0544176 ± 7 | 0.0131469 ± 14 | |
| Shinkolobwe (M) | A | 109489 ± 2230 | 6652 ± 136 | 41.067 ± 841 | 0.0607383 ± 90 | 0.0003715 ± 32 |
| P | 242126 ± 6380 | 14640 ± 386 | 45.270 ± 1220 | 0.0604644 ± 6 | 0.0001845 ± 11 | |
| Bancroft (I) | A | 191537 ± 4030 | 14220 ± 299 | 16637 ± 350 | 0.0742485 ± 26 | 0.0870533 ± 32 |
| P | 364451 ± 7630 | 27065 ± 566 | 27072 ± 566 | 0.0742627 ± 7 | 0.0742820 ± 10 | |
| B | 64360 ± 1820 | 4783 ± 135 | 5263 ± 149 | 0.0743094 ± 26 | 0.0817761 ± 59 | |
| Cardiff (I) | A | 21700 ± 68 | 1610 ± 5 | 1445 ± 5 | 0.0742099 ± 14 | 0.0666116 ± 29 |
| P | 320237 ± 16000 | 23623 ± 1180 | 20109 ± 1000 | 0.0737725 ± 16 | 0.0627921 ± 11 | |
| Australia (M) | A | 137948 ± 796 | 8637 ± 50 | 45.663 ± 263 | 0.0626104 ± 14 | 0.0003293 ± 5 |
| P | 112292 ± 4380 | 6913 ± 269 | 30.821 ± 1160 | 0.0615632 ± 13 | 0.0002720 ± 14 | |
| Rabbit Lake (U) | A | 3535.2 ± 6 | 278.68 ± 5 | 53.734 ± 9 | 0.0788313 ± 6 | 0.0151997 ± 4 |
| P | 2513.1 ± 7 | 196.99 ± 6 | 53.690 ± 15 | 0.0783857 ± 7 | 0.0213645 ± 6 | |
| Foster Lake (I) | A | 37590 ± 151 | 2127 ± 9 | 415.4 ± 17 | 0.0565942 ± 8 | 0.0110505 ± 13 |
| P | 38659 ± 134 | 2215 ± 8 | 400.8 ± 14 | 0.0572888 ± 5 | 0.0103660 ± 8 | |
| B | 36181 ± 232 | 2035 ± 13 | 429.0 ± 28 | 0.0562499 ± 5 | 0.0118575 ± 6 | |
| Great Bear (M) | A | 252.00 ± 1 | 40.778 ± 1 | 35.629 ± 1 | 0.1618002 ± 15 | 0.1413268 ± 19 |
| P | 381.90 ± 6 | 50.936 ± 8 | 35.605 ± 5 | 0.1333921 ± 17 | 0.0932369 ± 16 |
Aliquot types: P = Pristine; A = Altered; B = Bulk. M = metamorphite, SS = sandstone, I-G = intrusive granite related, I = intrusive non-granite related, and U = Proterozoic unconformity.
Table 3.
204Pb fraction and calculated 207Pb*/235U and 207Pb*/235U ratios and corresponding ages for each uraninite sample aliquot (pristine, altered, and bulk).
Table 3.
204Pb fraction and calculated 207Pb*/235U and 207Pb*/235U ratios and corresponding ages for each uraninite sample aliquot (pristine, altered, and bulk).
| Sample | Aliquot | 204Pb Fraction% | 207Pb*/235U | 206Pb*/238U | 207Pb*/235U Age ± 2σ † | 206Pb*/238U Age ± 2σ † |
|---|---|---|---|---|---|---|
| Marshall Pass (M) | A | 0.75 | 0.13111 | 0.01733 | 125 ± 3 | 111 ± 3 |
| P | 0.79 | 0.09761 | 0.01270 | 95 ± 2 | 81 ± 2 | |
| Big Indian Wash (SS) | A | 0.015 | 0.21915 | 0.03105 | 201 ± 5 | 197 ± 5 |
| P | 0.017 | 0.14787 | 0.02104 | 140 ± 4 | 134 ± 3 | |
| B | 0.029 | 0.21822 | 0.03079 | 200 ± 5 | 195 ± 5 | |
| Adair Mine (SS) | A | 0.051 | 0.28805 | 0.04124 | 247 ± 6 | 261 ± 7 |
| P | 0.045 | 0.09367 | 0.01350 | 91 ± 2 | 86 ± 2 | |
| B | 0.048 | 0.15100 | 0.02216 | 143 ± 4 | 141 ± 4 | |
| Happy Jack (SS) | A | 0.26 | 0.03624 | 0.00497 | 36.1 ± 0.9 | 31.9 ± 0.8 |
| P | 0.15 | 0.05081 | 0.00711 | 50.3 ± 1.3 | 45.7 ± 1.1 | |
| B | 0.14 | 0.11921 | 0.01677 | 114 ± 3 | 107 ± 3 | |
| Jachymov (I-G) | A | 0.42 | 0.28125 | 0.04047 | 252 ± 6 | 256 ± 6 |
| P | 0.43 | 0.22332 | 0.03223 | 205 ± 5 | 205 ± 5 | |
| Yancey (1) | A | 0.041 | 0.71005 | 0.09525 | 545 ± 14 | 586 ± 15 |
| P | 0.0015 | 0.44584 | 0.05968 | 374 ± 9 | 374 ± 9 | |
| Shinkolobwe (M) | A | 0.0009 | 0.01332 | 0.00159 | 13.4 ± 0.3 | 10.3 ± 0.3 |
| P | 0.0004 | 0.82091 | 0.09856 | 609 ± 15 | 606 ± 15 | |
| Bancroft (I) | A | 0.0004 | 1.95489 | 0.19116 | 110 ± 28 | 1128 ± 28 |
| P | 0.0002 | 1.79587 | 0.17548 | 1044 ± 26 | 1042 ± 26 | |
| B | 0.0013 | 1.86875 | 0.18294 | 1070 ± 27 | 1083 ± 27 | |
| Cardiff (I) | A | 0.00004 | 1.83023 | 0.18047 | 1056 ± 26 | 1070 ± 27 |
| P | 0.0003 | 1.88643 | 0.18557 | 1076 ± 27 | 1097 ± 27 | |
| Australia (M) | A | 0.0007 | 1.33789 | 0.15524 | 862 ± 22 | 930 ± 23 |
| P | 0.0008 | 0.43880 | 0.05180 | 369 ± 9 | 326 ± 8 | |
| Rabbit Lake (U) | A | 0.026 | 3.20778 | 0.31102 | 1459 ± 36 | 1746 ± 44 |
| P | 0.036 | 3.31906 | 0.33109 | 1486 ± 37 | 1844 ± 46 | |
| Foster Lake (I) | A | 0.0025 | 0.10785 | 0.01392 | 104 ± 3 | 89 ± 2 |
| P | 0.0024 | 0.16604 | 0.02116 | 156 ± 4 | 135 ± 3 | |
| B | 0.0026 | 0.14180 | 0.01841 | 135 ± 3 | 118 ± 3 | |
| Great Bear (M) | A | 0.3 | 2.81885 | 0.18984 | 1361 ± 34 | 1121 ± 28 |
| P | 0.21 | 1.41872 | 0.10588 | 897 ± 22 | 649 ± 16 |
Notes: † The uncertainties (2σ level) associated with calculated 207Pb/235U and 206Pb/238U ages are propagated (using quadratic equation) for all sources of error, including the external reproducibility for the UO2 and PbO wt% abundance determinations by EMPA as the latter is the most significant source of uncertainty (average value of 2.5%; 2σ). Aliquot types: P = Pristine; A = Altered; B = Bulk. M = metamorphite, SS = sandstone, I-G = intrusive granite related, I = intrusive non-granite related, and U = Proterozoic unconformity.
© 2020 by the authors. Licensee MDPI, Basel, Switzerland. This article is an open access article distributed under the terms and conditions of the Creative Commons Attribution (CC BY) license (http://creativecommons.org/licenses/by/4.0/).
Share and Cite
MDPI and ACS Style
Corcoran, L.; Simonetti, A. Geochronology of Uraninite Revisited. Minerals 2020, 10, 205. https://doi.org/10.3390/min10030205
AMA Style
Corcoran L, Simonetti A. Geochronology of Uraninite Revisited. Minerals. 2020; 10(3):205. https://doi.org/10.3390/min10030205
Chicago/Turabian StyleCorcoran, Loretta, and Antonio Simonetti. 2020. "Geochronology of Uraninite Revisited" Minerals 10, no. 3: 205. https://doi.org/10.3390/min10030205
Note that from the first issue of 2016, this journal uses article numbers instead of page numbers. See further details here.