Article

The Role of Continental Crust in the Formation of Uraninite-Based Ore Deposits

by
Stefanie R. Lewis
1,*,
Antonio Simonetti
1,
Loretta Corcoran
1,
Stefanie S. Simonetti
1,
Corinne Dorais
1 and
Peter C. Burns
1,2
1
Department of Civil and Environmental Engineering and Earth Sciences, University of Notre Dame, Notre Dame, IN 46556, USA
2
Department of Chemistry and Biochemistry, University of Notre Dame, Notre Dame, IN 46556, USA
*
Author to whom correspondence should be addressed.
Minerals 2020, 10(2), 136; https://doi.org/10.3390/min10020136
Submission received: 19 December 2019 / Revised: 29 January 2020 / Accepted: 3 February 2020 / Published: 6 February 2020
(This article belongs to the Special Issue Nuclear Forensic Applications in Geoscience and Radiochemistry)

Abstract

:
This study reports trace element abundances and Pb, Sr, and U isotopic signatures of uraninite from a variety of ore deposits in order to establish baseline forensic information for source attribution of raw, natural U-rich samples. Trace element concentrations, reported here, provide insights into uraninite crystal substitution mechanisms and possible crustal sources of U, including mobility of trace elements between pristine versus altered fractions. Spatially resolved laser ablation (LA) multicollector (MC) inductively coupled plasma mass spectrometry (ICP-MS) analyses were used to determine secondary 207Pb-206Pb isochron ages, and these were validated by corroborative results obtained by solution mode (SM) MC-ICP-MS for the same sample. Secondary Pb-Pb isochron ages obtained, in this study, indicate that uraninite alteration occurs shortly after ore mineralization. Initial 87Sr/86Sr values correlate in general with host craton age, and therefore suggest that uraninite ore formation is closely linked to the nature of the bedrock geology. The δ238U values are explained by invoking multiple physicochemical conditions and parameters such as temperature, nuclear field shift, oxidation, and source rock composition. The δ234U values indicate that the uraninites, investigated here, have undergone recent alteration, but the latter has not perturbed the Pb-Pb secondary isochron ages.

1. Introduction

Uranium deposits of economic interest are located on most continents and are classified according to their host rock lithology, nearby tectonic structures, and mode of alteration [1]. The physicochemical conditions prevailing during U ore formation are complex and evolve continuously with time as evidenced by the occurrence of several generations of uraninite within one deposit (e.g., [2]), which is the main constituent mineral. Trace and major element incorporation by uraninite (UO2+x) is extremely complex and results in a diverse chemical composition; thus, a more representative formula is (U4+1−x−y−z−uU6+xREE3+yM2+z4−u)O2+x−0.5y−z−2u, where M are divalent metal ions and □ represents a vacancy [3]. Uraninite has been the focus of numerous past investigations to understand its variable chemical nature, and because it is the most important raw material used for the production of fuel destined for nuclear reactors.
Natural uranium has three main isotopes, 234U, 235U, and 238U, of which only 235U is fissile. The latter feature of uranium has prompted the illicit trafficking of this material for the past several decades, in particular subsequent to the demise of the former Soviet Union [4]. In efforts to combat illegal trafficking of nuclear materials, characteristic chemical and isotopic signatures have been established to help identify the origin of intercepted material. In the past, nuclear forensic signatures have been based on major and trace element concentrations, isotopic ratios (Pb, Sr, U), and morphological differences. Trace element signatures have proven effective for deposit type and provenance identification (e.g., [5,6]). Isotopic tracers employed for uraninite, such as those of U, Pb, and Sr, reported here, provide information about a material’s age, origin, and possible processing enrichment history. In recent years, improvements in analytical methods and equipment have enhanced the reporting of chemical and isotopic signatures at faster time scales and with lower detection limits (e.g., [7,8]). Consequently, there has been renewed interest and more detailed investigations into the U isotope signatures of nuclear materials, such as uraninite (e.g., [9,10]).
Geochronological investigations of nuclear materials, such as those employing the 230Th dating technique (e.g., [11,12]) also provide insightful forensic signatures. Investigating the geochronological history of uraninite is important to understand how uranium deposits form and develop over time. Several previous studies have adopted U-Pb age dating techniques applied to uraninite in order to unravel the complex formational history of uranium deposits (e.g., [13,14]). Application of the U-Pb geochronometer for uraninite dating does pose some important challenges that are associated with the potential loss or gain of Pb or U. Moreover, the U-Pb dating method relies on the use of a 238U/235U ratio that is naturally variable, and therefore propagates an additional uncertainty into the age calculation [15].
Alternatively, the secondary 207Pb-206Pb isochron age dating method is independent of the 238U/235U variance in nature, and therefore has one less source uncertainty. Pb has four isotopes 204, 206, 207, and 208; 204Pb is the sole isotope that is non-radiogenic in origin, i.e., occurs in primordial abundance. 206Pb and 207Pb are the stable daughter products from the radioactive decay of 238U and 235U, respectively, whereas 208Pb is produced from 232Th decay. The rapid determination of accurate secondary isochron Pb-Pb ages for nuclear materials, such as uraninite, is an effective nuclear forensic tool for deciphering a sample’s provenance (e.g., [16]). Traditionally, secondary Pb-Pb isochron dating of geological materials and minerals involves a labor-intensive procedure that includes sample digestion, which is then followed by separation of Pb using ion exchange chromatography; the whole process can take several weeks to complete (e.g., [17]). Alternatively, the application of laser ablation inductively coupled plasma mass spectrometry (LA-ICP-MS) technique has several advantages over the traditional, bulk digestion solution mode (SM) ICP-MS method; these include ease of sample preparation, fast throughput, and detailed chemical and isotopic information obtained at high spatial resolution (10s to 100s of micron scale, e.g., [7]). LA-ICP-MS investigations that report combined trace element and isotope data of minerals at high spatial resolution provide critical insights into open-system processes involving multiple endmember components, such as crustal contamination of granitic magmas (e.g., [18]).
On the basis of previous investigations of uranium ore deposits (e.g., [19,20]), it is clear that continental crust plays a pivotal role in the formation of U ore deposits, from providing the source of the U to the mode of occurrence (e.g., roll front vs. intrusive related). Thus, the age and type of continental material available for sourcing are important factors in controlling the isotopic (Pb, Sr, Nd) nature of the uraninite that is produced. For example, the Rb-Sr and Sm-Nd geochronometers are commonly used for age dating and provenance identification of geologic materials (e.g., [21]). Strontium has four stable isotopes (84, 86, 87, and 88) with 87Sr being produced from the radioactive decay of 87Rb. Accurate Rb-Sr age determinations are only obtained in a closed system. Age-corrected initial 87Sr/86Sr ratios (and corresponding ɛSr values) provide information in relation to source region(s), even during open system behavior. For example, Varga et al. [22] investigated the Sr isotope systematics of uranium deposits worldwide; these record a large range of values that are a function of their age and variable Rb/Sr ratios.
Uranium ore deposits are impacted by a range of geochemical processes that include hydrothermal activity, metamorphism, and magmatism, and these certainly affect the various radiogenic isotope systems. Natural variations in the 238U/235U ratio are attributed to several factors, such as nuclear field shift, temperature, oxidation state, and source rock composition. Nuclear field shift is a mass-independent effect used to predict the dependence of isotopic fractionation on temperature and is particularly important for heavy elements [23,24]. It has been argued previously that the difference in 238U/235U ratios between low- and high-temperature U ore deposits is related to the temperature dependence of the nuclear field shift [25,26]. As temperature increases, the magnitude of the isotope shift decreases [26]. Oxidation states also affect uranium mobility. In contrast to other oxidation dependent isotopes (e.g., Mo), the heavier 238U isotope is favored in the lower oxidation state [24], thus, the U4+ state is linked to higher 238U/235U values. At low temperature, oxidizing fluids mobilize U6+ until it encounters a reducing environment resulting in the crystallization or re-crystallization of uraninite as the insoluble U4+ state. Uranium leached from ore during alteration/recrystallization results in minerals enriched in 234U [9], and therefore the 238U/234U ratio is primarily used to evaluate recent fluid alteration events. Given the short half-life of 234U, the 238U/234U ratio yields a result consistent with secular equilibrium if the deposit or mineral has not experienced alteration within the past 2.5 million years [9].
This study reports trace element abundances and Pb, Sr, and U isotopic ratios of uraninites (n = 15) from ore deposits within North America and one from the Democratic Republic of the Congo in relation to establishing baseline signatures for nuclear forensic applications. Secondary Pb-Pb isochron ages for several uraninite samples were obtained by both SM- and LA-multicollector (MC) ICP-MS. The reported ages and isotopic ratios are discussed in relation to providing insights into possible source rock compositions and environmental conditions present during the crystallization of uraninite.

2. Materials and Methods

2.1. Sample Descriptions

Uraninite samples, examined here, are from the “Ewing Collection” housed at the University of Notre Dame. Fourteen uraninite samples are from locations throughout North America and one from Shinkolobwe, Democratic Republic of the Congo (Table 1). Several samples listed in Table 1 have been examined previously for their trace elements (i.e., REEs) and Sr isotope compositions [27,28] with the exception of those from Mitchell, Marshall 2, and Moonlight. None of the samples listed in Table 1 have previously been analyzed for their U or Pb isotope compositions.
The uraninite from the counties of Yancey and Mitchell (NC, USA) are both hosted by the Spruce Pine pegmatite, which crosscuts Precambrian age interlayered mica and amphibole gneiss and schist [29]. The uraninite from Ruggles Mine in Grafton County (NH, USA) occurs as dendritic intergrowths within a pegmatite hosted by Devonian-aged Littleton Formation; the latter consists of quartz-mica schist, quartzite, amphibolite, and other high-grade metamorphic rock [30,31,32].
The Great Bear uraninite is hosted by late Aphebian-aged units comprised of pumice-dominated pyroclastic flows with subordinate ash and plutons within the Great Bear Lake region of Northwest Territories (Canada). This region is known for the occurrence of several U-Ag-Bi-Cu-Co-Ni-As minerals that are found within quartz and carbonate gangue [33]. Several remobilization events have been recorded at the Echo Bay location that are associated with a diabase intrusion [34,35]. The Shinkolobwe Mine (Democratic Republic of the Congo) is part of the Shaban area of the Katanga system, known for ore deposits of U, Cu, Co, and Ni. Fractures that occur within dominantly siliceous dolomite, and dolomitic and carbonaceous shales partially affected by Mg-metasomatism are host to the uraninite mineralization [34,35].
Four uraninite samples (Marshall 1, 2, 3, and 4) are investigated from the areas of Marshall Pass and Sargents, Colorado (USA). Hydrothermal activity resulted in the formation of colloform and fine-grained uraninite within fault-controlled veins and breccia zones of Pennsylvanian-aged limestone proximal to intersections of Proterozoic and Paleozoic sequences [36,37]. Billiken Lode and Jefferson uraninite are both from Jefferson County (CO, USA) from deposits that contain complexly folded and faulted Proterozoic metasediments, which host uraninite and accessory minerals ankerite, quartz, calcite, and potassium feldspar [35,36].
The uraninite within the collapse breccia structure from Orphan Lode (Grand Canyon National Park, AZ, USA) is found disseminated within the Pennsylvanian and Permian host rock matrix of limestone, sandstone, and shale [38,39]. Moonlight Mine ore (Navajo County, AZ, USA) occurs as both grains and cement and is found within an Upper Triassic channel deposit of sandstone and conglomerate. Skyline Mine uraninite (Monument Valley, UT, USA) is located within tabular sandstones of Upper Triassic age of the Chinle Formation [40].

Uranium Deposits

Uraninite occurrences on a global scale are categorized by their respective deposit type and subtype using the classification scheme outlined by the International Atomic Energy Agency (IAEA) [2]. Deposit types that were classed using an older identification system have been renamed, for example, ”vein type” is no longer a utilized term. A total of thirteen types are investigated, here, and are listed below with respect to their temperature of formation (from high to low): intrusive, granite-related endogranitic, granite-related perigranitic, polymetallic iron oxide breccia complex, volcanic-related, metasomatite, metamorphite-monometallic, metamorphite-polymetallic, Proterozoic unconformity basement-hosted, Proterozoic unconformity contact, palaeo-quartz-pebble conglomerate, collapse breccia pipe, and sandstone (Table 1). Several U ore deposit types are not listed in Table 1, however, these are described below since they are cited in the discussion section for comparative purposes.
Intrusive deposits usually form as a result of either partial melting or fractional crystallization [41]. Intrusive deposits included in this study are from pegmatites and are considered high-grade ore [2]. Granite-related endogranitic deposits are located within veins or disseminations within the granite. Granite-related perigranitic deposits originate in veins surrounding the granitic plutons [2]. Low grade ore is produced in polymetallic iron oxide breccia complex deposits; these are broadly linked to iron oxide-copper-gold deposits. Volcanic-related deposits occur within or near volcanic calderas filled with volcanic sediments and consist of medium grade ores. Metasomatite deposits, which are associated with low to medium grade ore, are related to Na- or K-metasomatism.
Metamorphite deposits involve fluids characterized by higher temperatures, 200 to 400 °C [24], and these are variable in grade, size, and tonnage. Metamorphite deposits that are structure-bound (examined here) occur as monometallic veins associated with traces of other metallic minerals, or as polymetallic veins found with Co, Cu, Fe, Mo, Ni, Pb, Zn, Ag, and As metallics [2]. Uraninite from metamorphite deposits, examined here, that formed within hydrothermal environments are associated with lower temperatures of formation than typical metamorphites. Uranium deposits that occur immediately above, below, or span an unconformable contact that separates Archean-Paleoproterozoic crystalline basement rock from Proterozoic red beds are defined as Proterozoic unconformity deposits. Unconformity contact deposits are situated directly above the unconformity at the base of the overlying sediment, whereas basement-hosted deposits are found below the unconformity in metasedimentary rocks [2].
Palaeo quartz-pebble conglomerate deposits consist of uraninite and brannerite hosted in pyrite-rich quartz-pebble conglomerates [2]. Collapse breccia pipe deposits produce high-grade ore within cylindrical, vertical filled pipes in sedimentary basins; currently the only known examples are within the Grand Canyon region of the USA sandstone deposits, which form at ambient temperatures when ground water removes and transports the mobile U6+ through the sandstone until a reductant is encountered; consequently, U4+ minerals form, such as uraninite [24]. Several episodes of mobilization and crystallization can occur in a single sandstone deposit resulting in several generations of uraninite.

2.2. Methods

2.2.1. In Situ Pb Isotope Ratios by LA-MC-ICP-MS

Small portions (~1 cm2) of uraninite were cut and placed fresh surface down into a 1 inch round mount that was then filled with epoxy and cured before being polished. X-ray fluorescence (XRF) elemental maps were generated using an EDAX Orbis Micro EDXRF with the following conditions: 40 kV voltage, 300 µA, and 100 µs dwell time. XRF maps were used to identify viable areas with sufficient Pb abundances for laser ablation (LA) MC-ICP-MS measurements. In situ Pb isotopes were obtained using a Nu Plasma II MC-ICP-MS instrument located within Midwest Isotope and Trace Element Research Analytical Center (MITERAC) at the University of Notre Dame. Analyses were conducted using 25 µm spot sizes at 8 Hz and corresponding energy density of ~10 to 11 J/cm2. Groupings of 5 ablations of samples were bracketed by the amazonite feldspar in-house standard to monitor and correct for instrumental drift and mass bias (procedure after [42,43]).

2.2.2. Bulk Sample Trace Element Abundances by ICP-MS

For each sample of uraninite, aliquots were separated by hand picking, then powdered and digested for SM-ICP-MS and SM-MC-ICP-MS analyses. When possible, the samples were separated into ”pristine’ and ”altered” fractions based on color, morphology, and luster. For example, lustrous black portions were considered pristine sections of samples, whereas yellow and orange fractions were deemed altered uraninite or containing secondary-U minerals. Approximately 50 mg of powdered sample was placed into 15 mL, precleaned Savillex© Teflon beakers for digestion using ~4 mL of high purity, concentrated HNO3 produced with the use of a Savillex© DST-1000, sub-boiling, acid purification system. Aliquots from the digested solutions were used for both trace element concentrations and isotopic measurements. Solution mode analyses were conducted on a Nu Instruments Attom high resolution (HR) ICP-MS operating at medium mass resolution (M/ΔM ≈ 2500). A standard-spike addition method was employed to correct for matrix effects and instrumental drift (after [44]). Trace element abundance determinations using the analytical method, adopted here, were validated by Balboni et al. [28] based on repeated analyses of CUP2 (uranium oxide concentrate) certified reference material, both with and without chemical separation of the U-rich matrix via ion exchange chromatography.

2.2.3. Bulk Sample Pb, Sr, and U Isotope Ratios by SM-MC-ICP-MS

Pb was isolated by processing digested samples through ion exchange chromatography using AG1-X8 (200 to 400 mesh) resin following the procedure by Manhès et al. [45]. The analytical protocol for determining the Pb isotope compositions followed that of Simonetti et al. [46]. The purified Pb aliquot was spiked with a NIST SRM 997 thallium standard solution (2.5 ppb) prior to aspiration into the MC-ICP-MS instrument. Pb and Tl isotopes and 202Hg were measured using seven Faraday cups on the Nu Plasma II MC-ICP-MS instrument. The 205Tl/203Tl was measured for monitoring the instrumental mass bias (exponential law, 205Tl/203Tl = 2.3887), and 202Hg was recorded for the 204Hg interference correction on 204Pb. Prior to sample introduction, a baseline measurement of the gas and acid blank (“on-peak-zero”) was conducted for 30 s. Data acquisition involved 2 blocks of 25 scans (each scan was 10 s). A 25 ppb solution of the NIST SRM 981 Pb standard (spiked with 6 ppb NIST SRM 997 Tl standard) was also analyzed periodically throughout the analytical session. Repeated measurements (n = 4) of the NIST SRM 981 + Tl standard solution yielded the following average values and associated (2σ) standard deviations: 206Pb/204Pb = 16.935 ± 0.003, 207Pb/204Pb = 15.488 ± 0.002, and 208Pb/204Pb = 36.686 ± 0.008.
For Sr separation, the ion exchange columns contained 1.7 mL of 200 to 400 mesh AG50W-X8 resin following a modified procedure by Crock et al. [47]. The resin bed volume was cleaned with high purity 6 N HCl and 18 MΩ cm−2 H2O and, then, conditioned with 5 mL of high purity 2.5 N HCl. The sample aliquot was, then, loaded onto the resin in 0.25 mL of 2.5 N HCl, washed with 9.75 mL of 2.5 N HCl, and eluted with 4 mL of 2.5 N HCl. Subsequent to ion exchange separation, the Sr-bearing aliquots were dried down and later taken up in 2% HNO3 (~2 mL) and aspirated into the ICP torch using a desolvating nebulizing system (DSN-100, Nu Instruments Inc., Wrexham, UK). Strontium isotope measurements were conducted using a Nu Plasma II MC-ICP-MS instrument following the protocol outlined in Balboni et al. [27]. Strontium isotope data were acquired in static, multicollection mode using 5 Faraday collectors for a total of 400 s, consisting of 40 scans of 10 s integrations. Accuracy and reproducibility of the analytical protocol were verified by the repeated analysis of a 100 ppb solution of the NIST SRM 987 strontium isotope standard during the course of this study, which yielded an average value of 0.71025 ± 0.00004 (n = 4). The ɛSr values, reported here, are calculated using 87Sr/86Sr initial ratios for the samples and the following equation:
ɛ Sr = ( Sr initial BABI 1 ) × 1000 ,
where BABI (basaltic achondrite best initial) 87Sr/86Sr = 0.69908 [48].
Uranium was purified from digested uraninite samples using UTEVA resin as outlined in Martinelli et al. [49]. Two Faraday collectors were used to measure the 238U and 235U ion signals, whereas the 234U ion signal was recorded on a discrete dynode secondary electron multiplier. Ion signals were collected for 40 scans of 10 s integrations each (400 s total). Analyses were conducted using a standard-sample bracketing technique. Instrumental mass bias corrections employed the exponential law and the certified 238U/235U, 238U/234U, and 235U/234U ratios for the CRM 112A standard (New Brunswick Laboratory, Argonne, IL, USA). The internal in-run precision (2σ level) was orders of magnitude lower than the calculated external reproducibility based on the repeated measurements of the CRM 112A standard, and thus the latter uncertainties were reported, here. Delta values for the U isotope measurements were determined using the following equation:
δ x U = ( sample standard 1 ) × 1000 ,
where x represents the isotope ratio of interest (238U/235U or 234U/238U). The δ238U values, calculated here, use the CRM 112A standard certified 238U/235U value of 137.849 (Brunswick Laboratory). The δ234U value is calculated using the CRM 112A standard secular equilibrium 234U/238U value of 5.4970 × 10⁻⁵ [50]. Additionally, method validation was established by Spano et al. [51] by repeated measurement of uranium standards IRMM-184 (natural U) and IRMM-185 (enriched 235U ~1.97%) using the analytical protocol, adopted here, and these yielded an external reproducibility (2σ level) of between 0.73‰ and 0.99‰, 13.6‰ and 3.4‰, and 9.3‰ and 5.6‰ for the 238U/235U, 234U/238U, and 235U/234U ratios, respectively.

3. Results

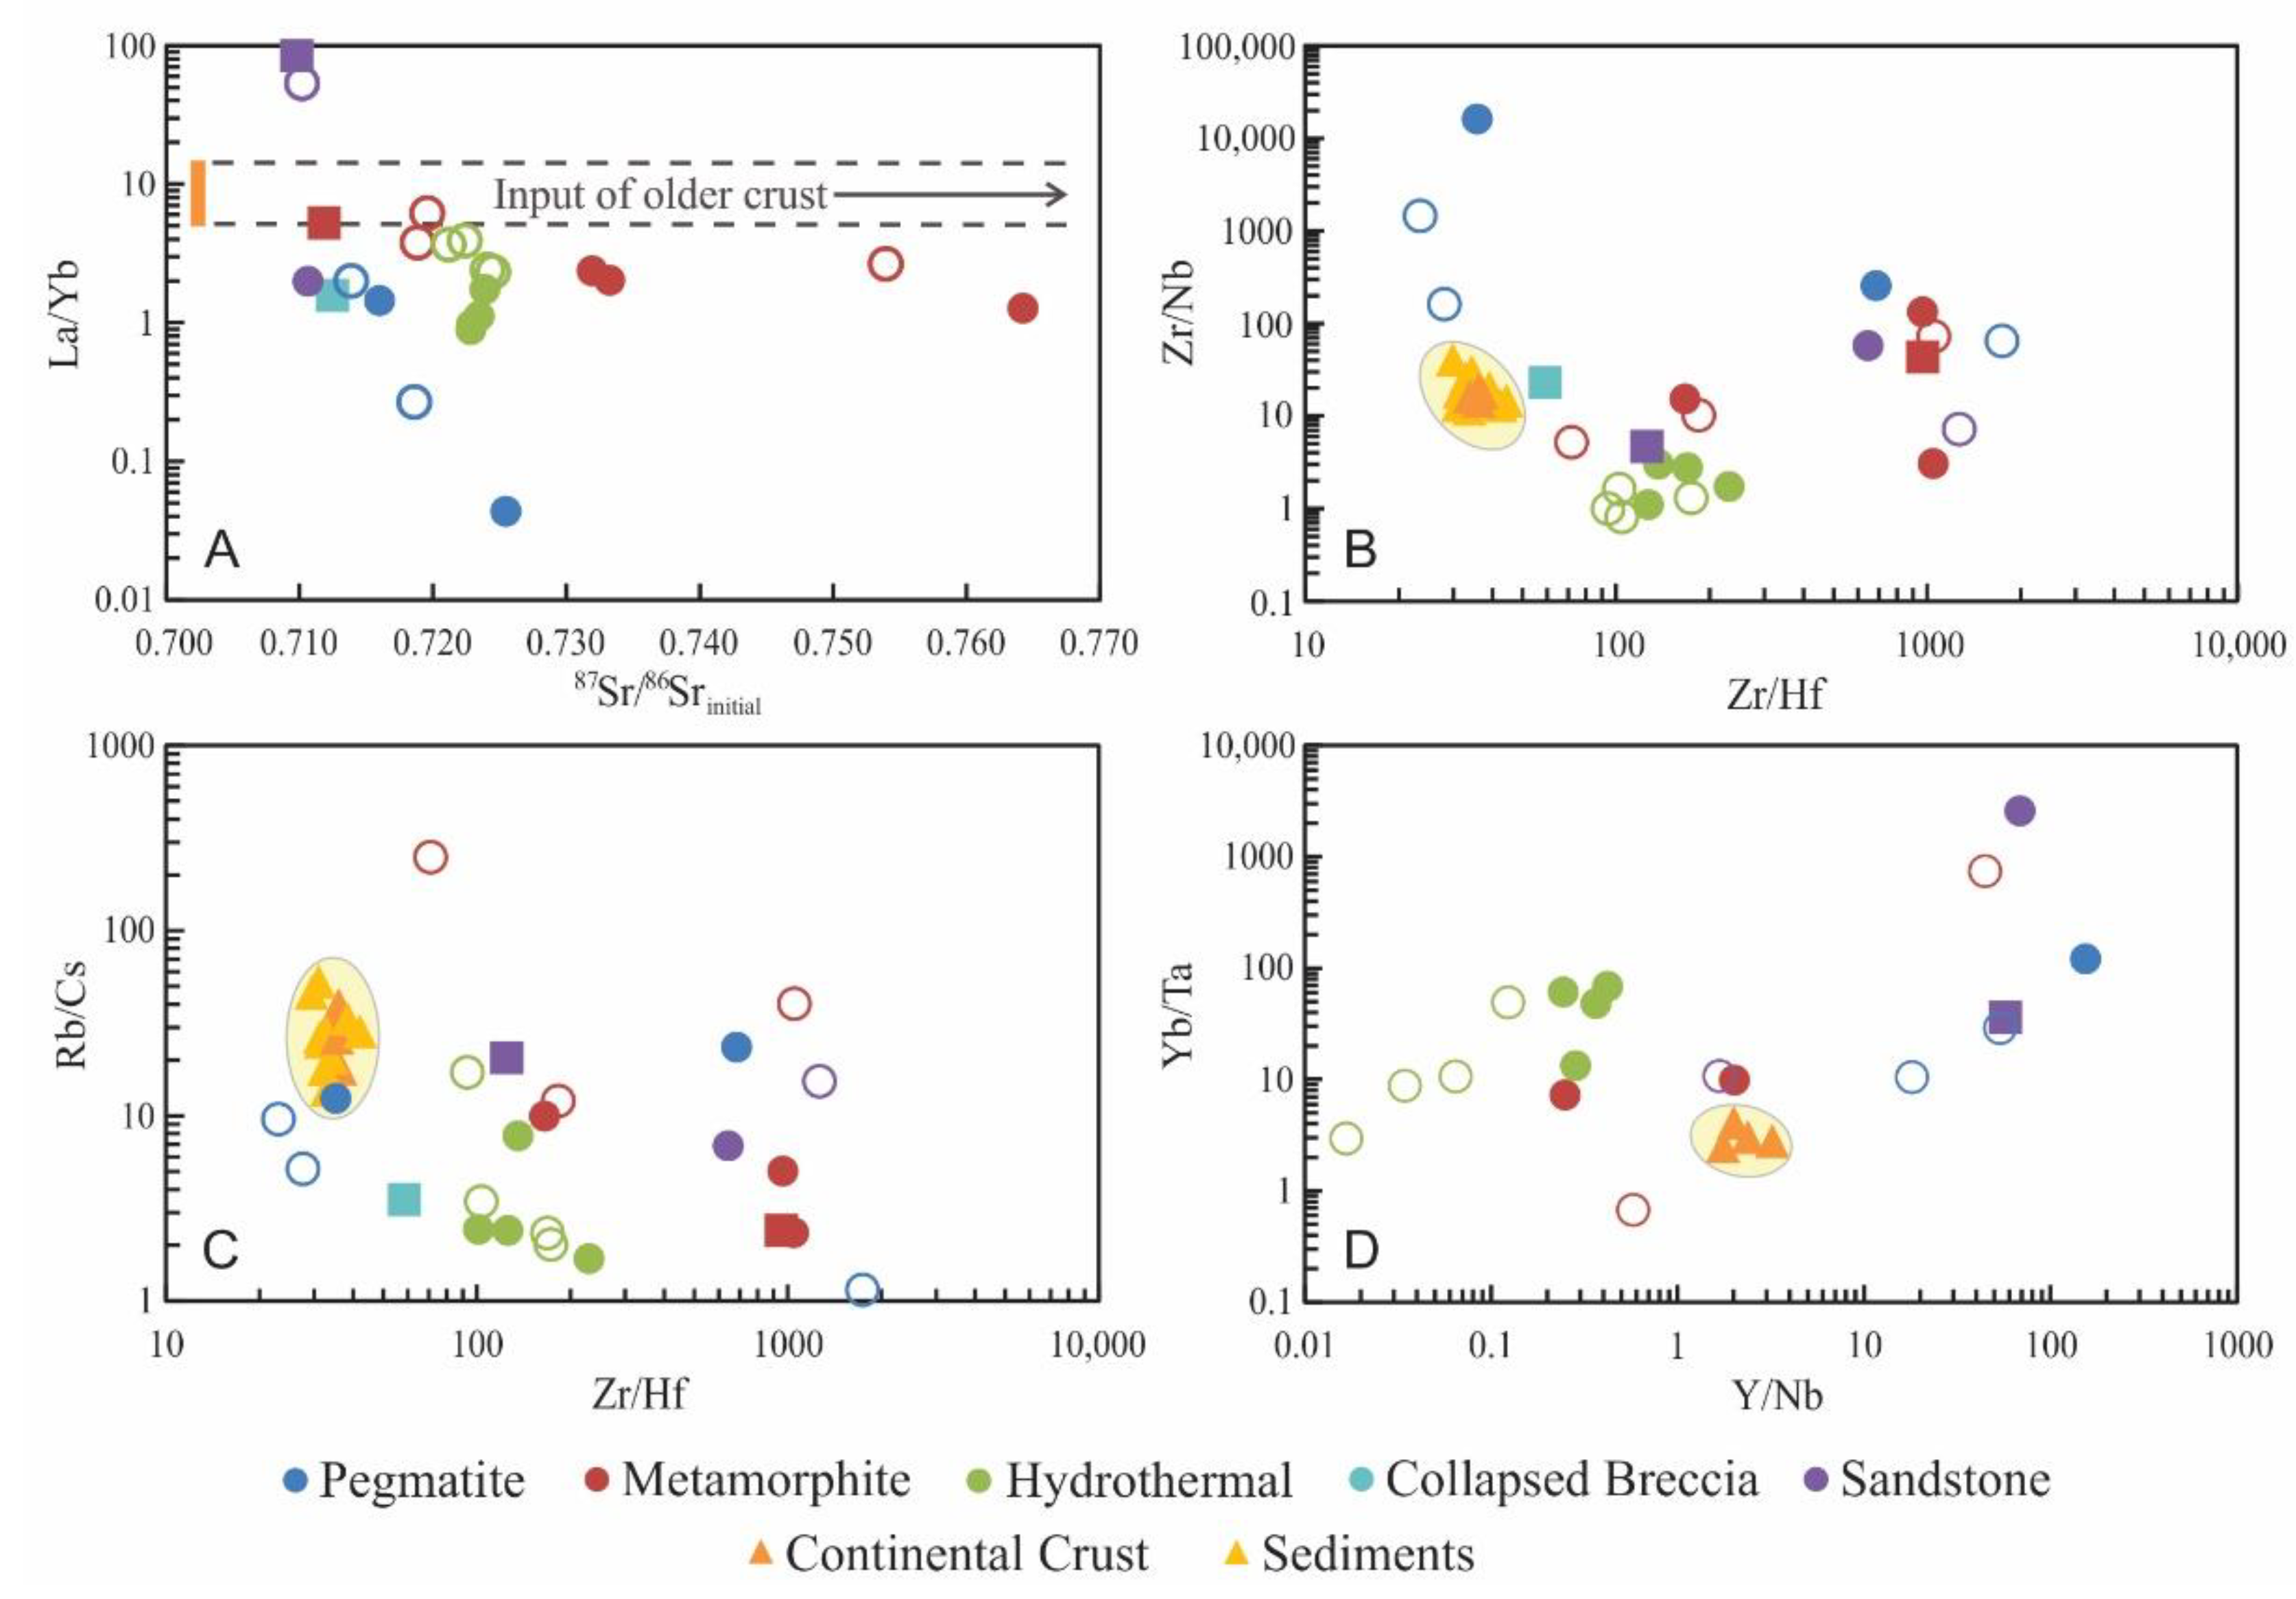
3.1. Trace Element Abundances

Table 2 lists the trace element abundances determined for the uraninite samples, investigated here. Figure 1 illustrates various trace element ratios and initial 87Sr/86Sr of the uraninite samples, investigated here, as a function of their deposit type. These ratios indicate the relative preferential incorporation of trace elements into uraninite, and are compared to canonical values for lower, middle, and upper crust [52], and crustal sediments [53,54]. Figure 1A indicates that uraninite samples from metamorphite deposits are characterized by the highest initial 87Sr/86Sr values followed by (in order of decreasing ratios) those from metamorphite-hydrothermal, intrusive, collapsed breccia, and sandstone. Compared to the La/Yb values for continental crust [52], those for most of the uraninite samples, investigated here, are lower (Figure 1A). For the same uraninite sample, analyses of altered fractions yield higher La/Yb values as compared with their pristine counterparts (open vs. filled symbols in Figure 1A and Table 2). Figure 1B indicates that Zr abundances are higher relative to both Nb and Hf contents for the uraninite samples, investigated here; relative to continental crust, uraninite samples, studied here, have comparable Zr/Nb ratios but higher Zr/Hf values (Figure 1B). Uraninite samples that are associated with abundant zircons (Ruggles and Mitchell intrusive pegmatite deposits) exhibit higher Hf contents (Table 2) and, consequently, lower Zr/Hf values. Figure 1C demonstrates that Zr/Hf ratios are at least an order of magnitude higher than their corresponding Rb/Cs values. Ruggles and Mitchell uraninite samples contain similar Zr/Hf ratios relative to continental crust and sediments (Table 2). The data in Figure 1D (and Table 2) indicates that altered fractions of the uraninite samples contain higher Nb and Ta abundances relative to their corresponding pristine aliquots.

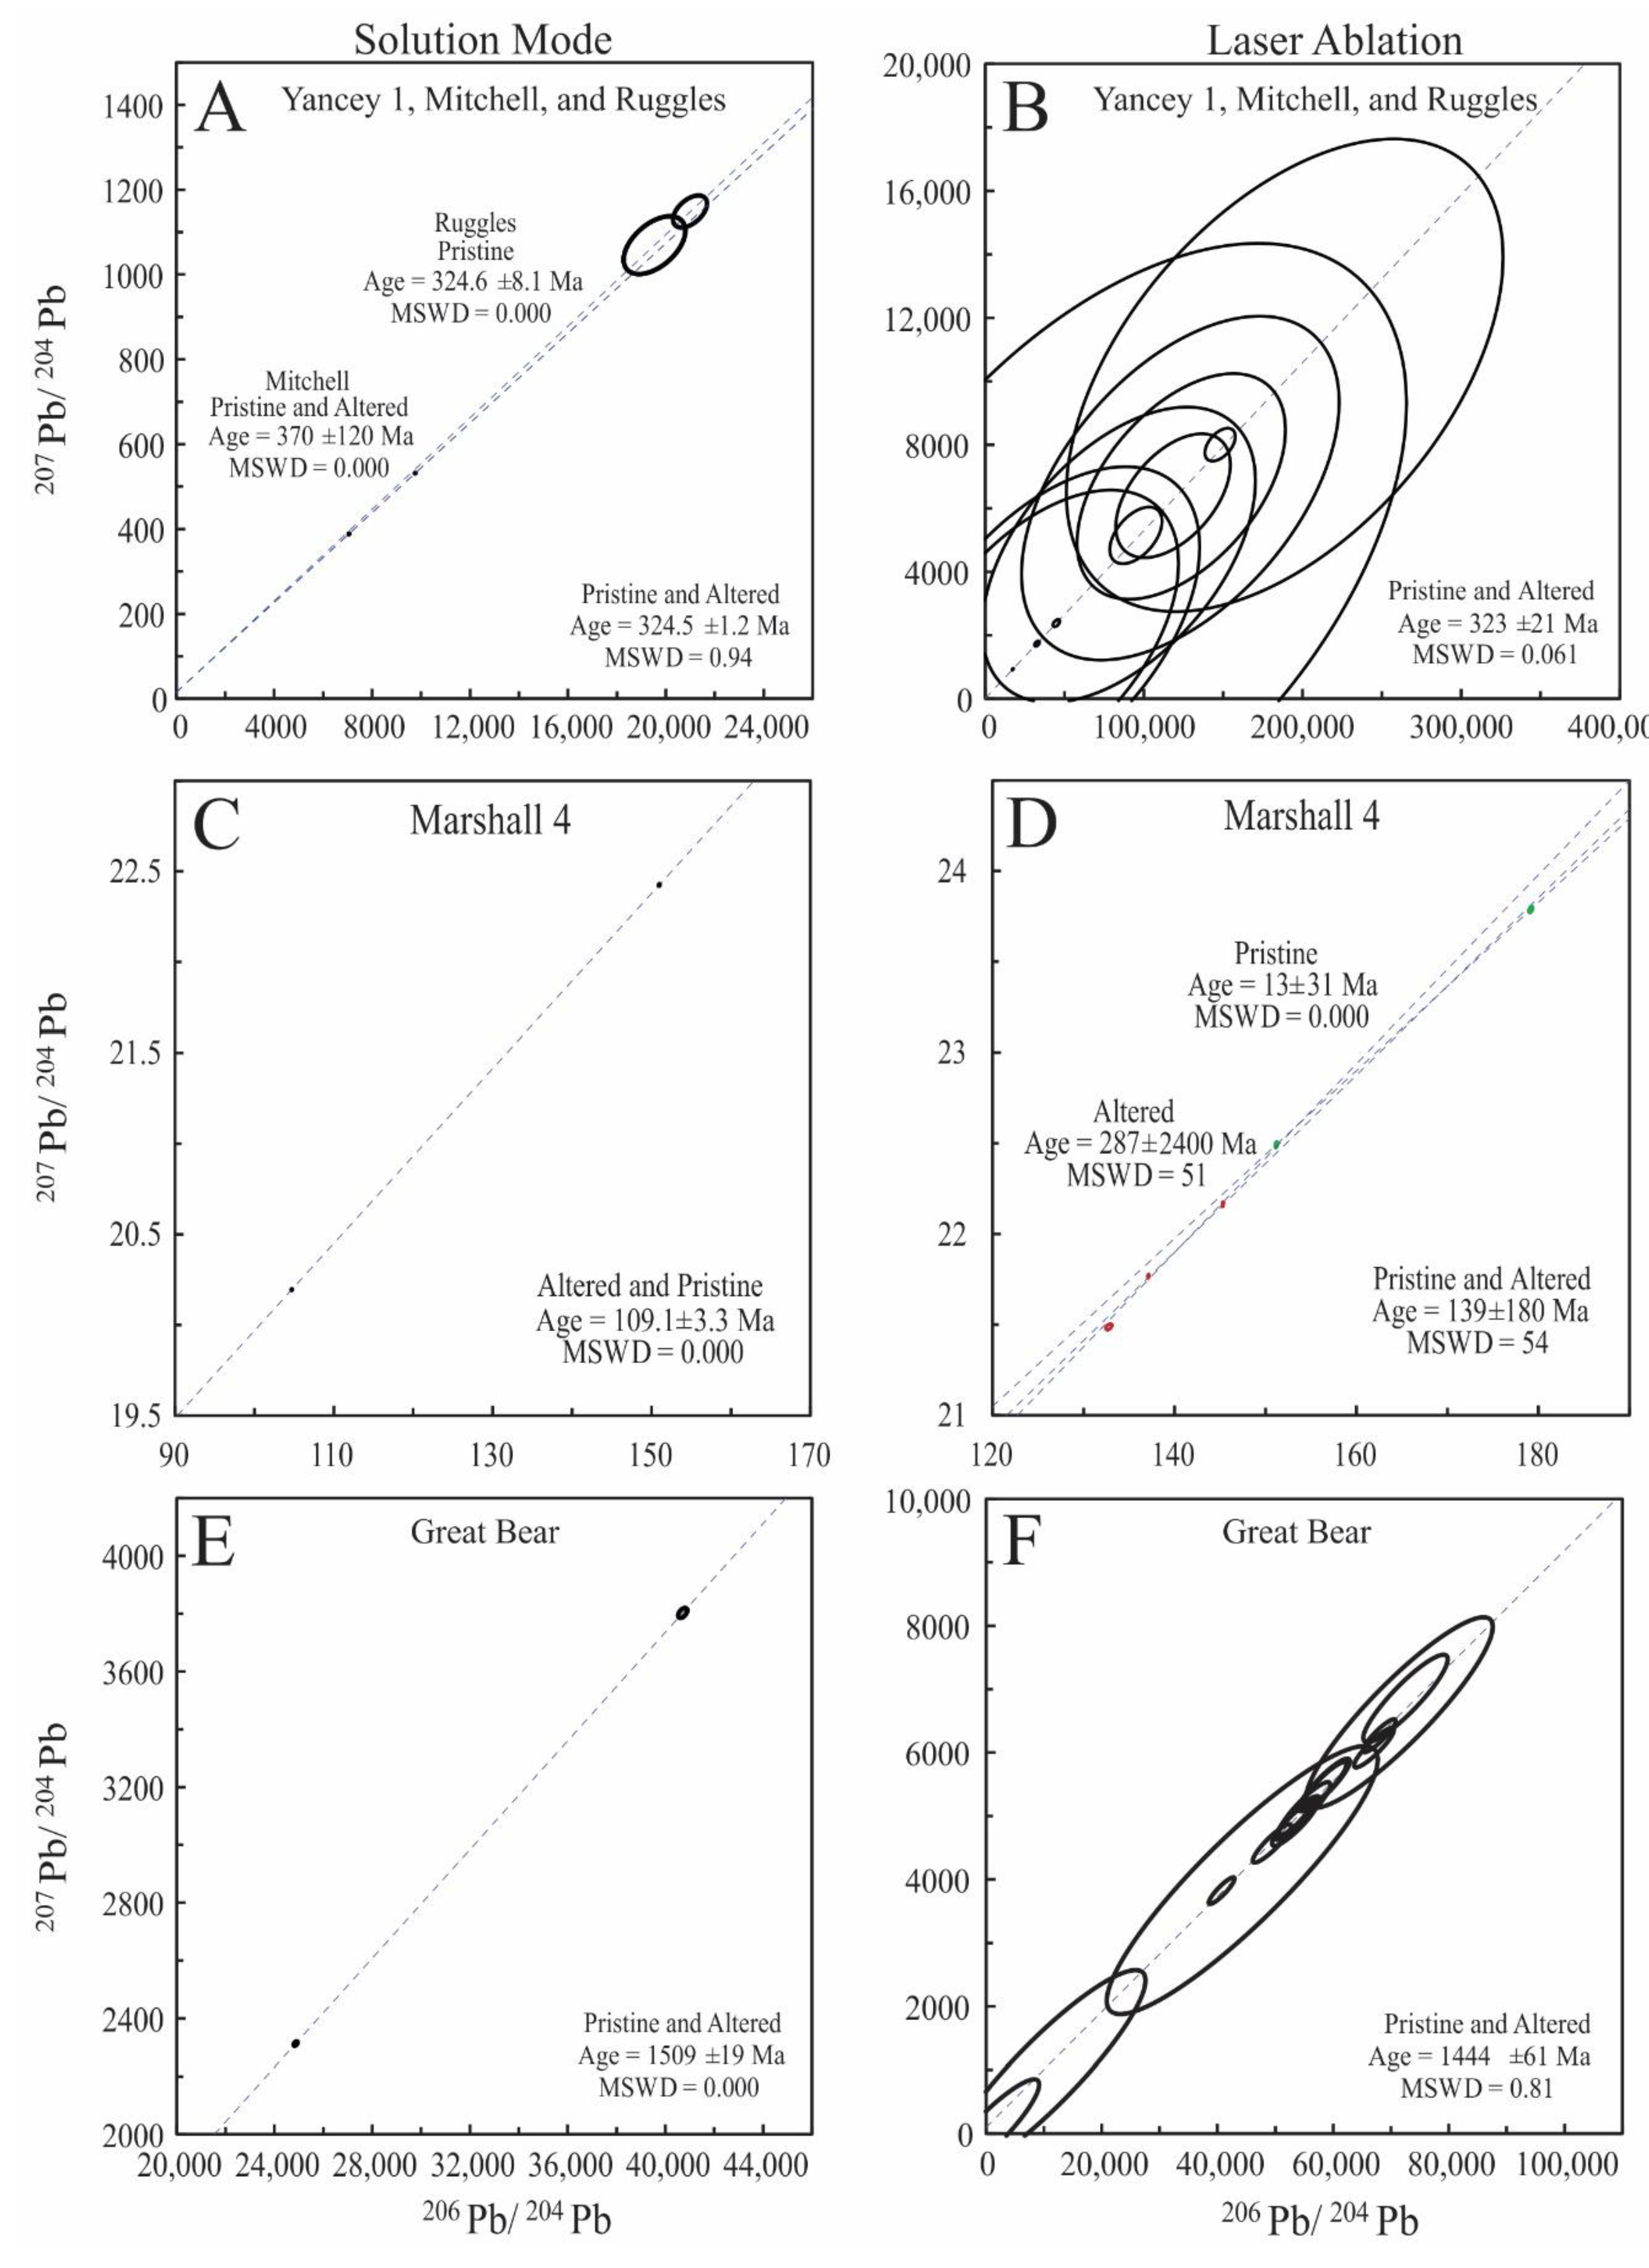
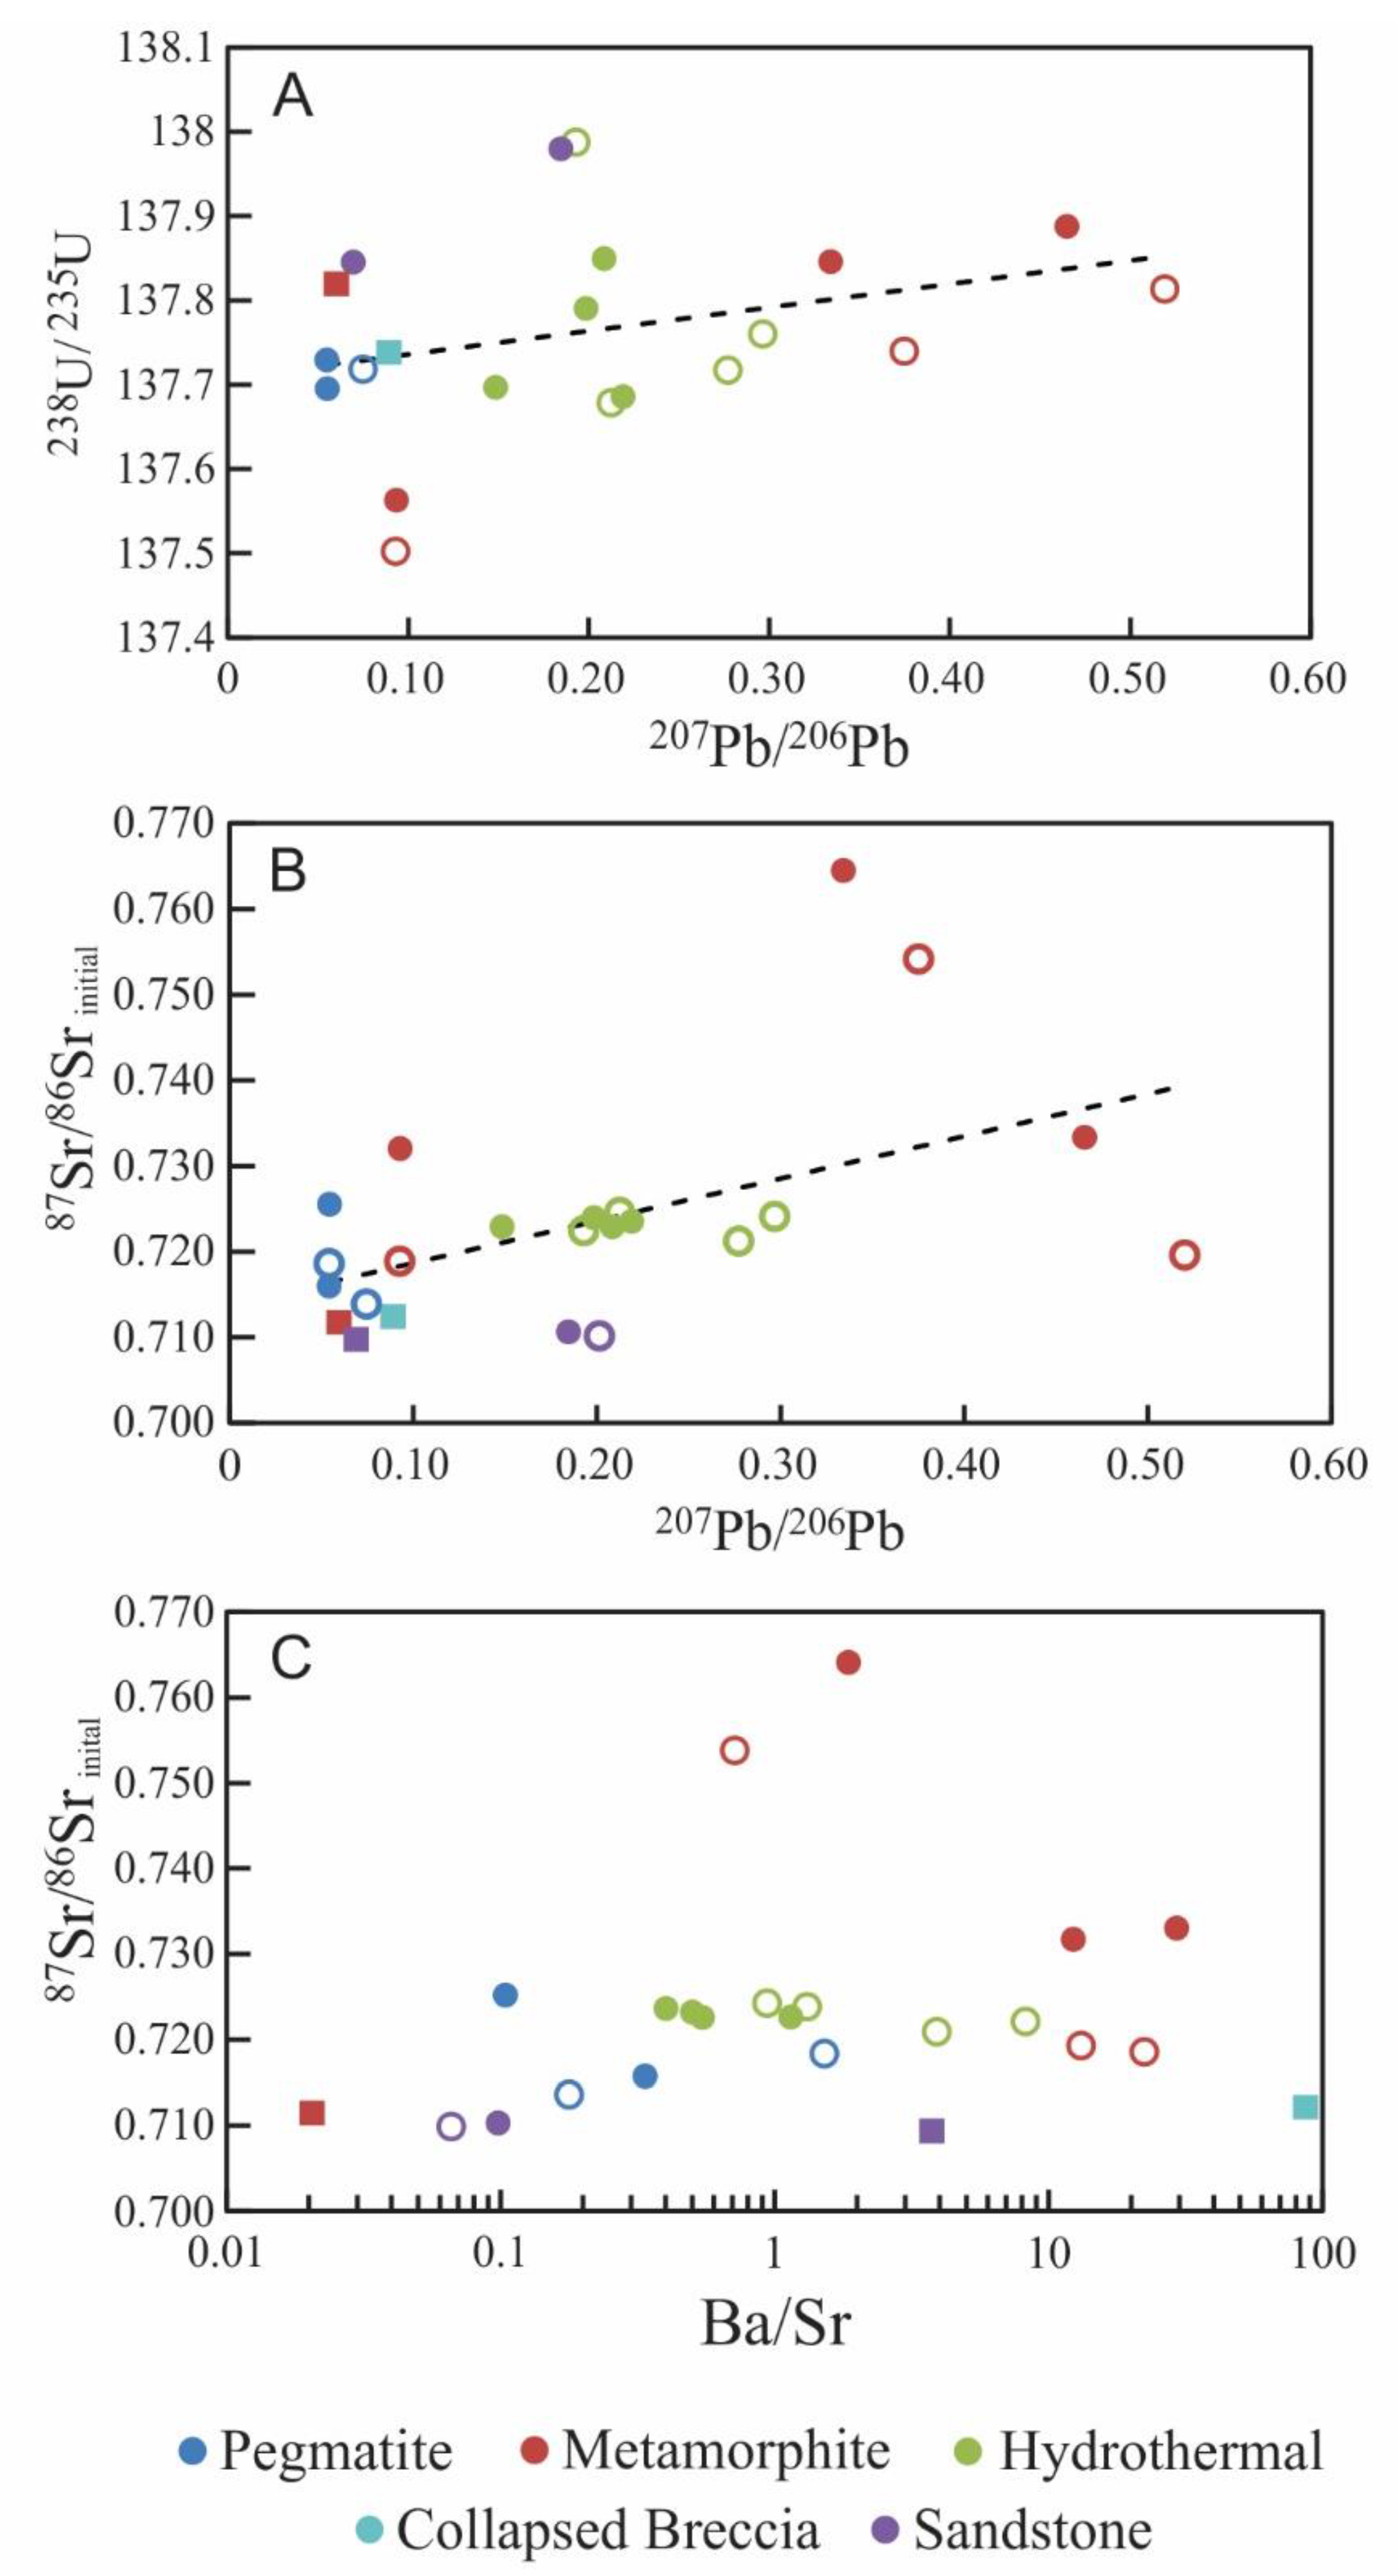
3.2. Secondary Pb-Pb Isochron Ages

Pb isotope ratios obtained by SM- and LA-MC-ICP-MS are listed in Table 3 and Table 4, respectively. Selected secondary Pb-Pb isochrons based on both SM- and LA-MC-ICP-MS-generated data were produced using Isoplot (v. 4.0; [55]) and are shown in Figure 2 (see Figure S1 for all other Pb-Pb isochrons for remaining samples).
Reported ages for the pegmatite host to the uraninites from Mitchell and Yancey counties are Paleozoic in age and range between 252 and 542 Ma [29]. A U-Pb age of 304 Ma (no associated uncertainty) is reported for uraninite from the Ruggles Mine [31]. In this study, uraninite from Mitchell and Ruggles yield Pb-Pb secondary isochron ages of 370 ± 120 Ma and 324.6 ± 8.1 Ma, respectively. In comparison, LA-MC-ICP-MS analyses of uraninite yield ages of 370 ± 110 Ma for Mitchell, 370 ± 1600 Ma for Yancey 1, and 327 ± 110 Ma for Ruggles. Given their proximal geographic location to one another in the Appalachian Mountain belt, a combined secondary Pb-Pb isochron including all three sites results in uraninite ages of 324.5 ± 1.2 Ma and 323 ± 21 Ma for SM- and LA-MC-ICP-MS methods, respectively (Figure 2).
Uraninite from the Great Bear area is the oldest documented sample investigated in this study. The Great Bear region is identified by several uranium deposits with variable ages; mineralization at Echo Bay has been dated between 1500 ± 10 and 1424 ± 29 Ma by U-Pb dating [33]. Here, we report secondary Pb-Pb isochron ages of 1509 ± 19 and 1444 ± 61 Ma for SM and LA-MC-ICP-MS-based data, respectively (Figure 2). Using SM-MC-ICP-MS, the secondary Pb-Pb isochron age of −68 ± 7.2 Ma for the uraninite from Jefferson does not agree with the reported U-Pb age of 69.3 ± 1.1 Ma for the Jefferson County Schwartzwalder deposit [57]. Similarly, the LA-MC-ICP-MS yielded a secondary Pb-Pb isochron age of 97 ± 20 Ma, which, given the associated uncertainty, overlaps with the age provided by Ludwig et al. [57]. The Billiken uraninite, also located in Jefferson County, yields a secondary Pb-Pb isochron age of 537 ± 18 Ma (SM-MC-ICP-MS) and 733 ± 1200 Ma (LA-MC-ICP-MS). Previously reported ages for uraninite mineralization within this area range between 44.0 and 444.7 Ma, with a second, younger generation of Tertiary uraninite at ~35 Ma [37]. Analyses conducted using SM-MC-ICP-MS from Marshall 1, 2, 3, and 4 yield ages of 96.84 ± 0.9 Ma, 126.8 ± 5.5 Ma, 35.9 ± 5.2 Ma, and 109.1 ± 3.3 Ma, respectively. Marshall 1, 2, 3, and 4, respectively, yield ages of 191 ± 170 Ma, 84 ± 130 Ma, 109 ± 200 Ma, and 139 ± 180 Ma by LA-MC-ICP-MS. Re-examination of the Marshall 2 LA-MC-ICP-MS analyses determined an age of lower uncertainty at 147 ± 25 Ma. Uraninite from the Skyline Mine in SE Utah records an age of 110.0 ± 8.8 Ma and 176 ± 91 Ma by SM-MC-ICP-MS and LA-MC-ICP-MS analyses, respectively. Uranium ores within SE Utah record three mineralization events, i.e., Late Triassic-Early Jurassic, Late Jurassic, and Early Cretaceous [38]. LA-MC-ICP-MS analyses of the Shinkolobwe uraninite has a secondary Pb-Pb isochron that yields an age of 617 ± 1600 Ma, which overlaps (given the large associated uncertainty) with published ages of 670 ± 20 Ma and 620 ± 10 Ma [58], while Decree et al. [34] reported an age of 652.3 ± 7.3 Ma for Sinkolobwe uraninite.

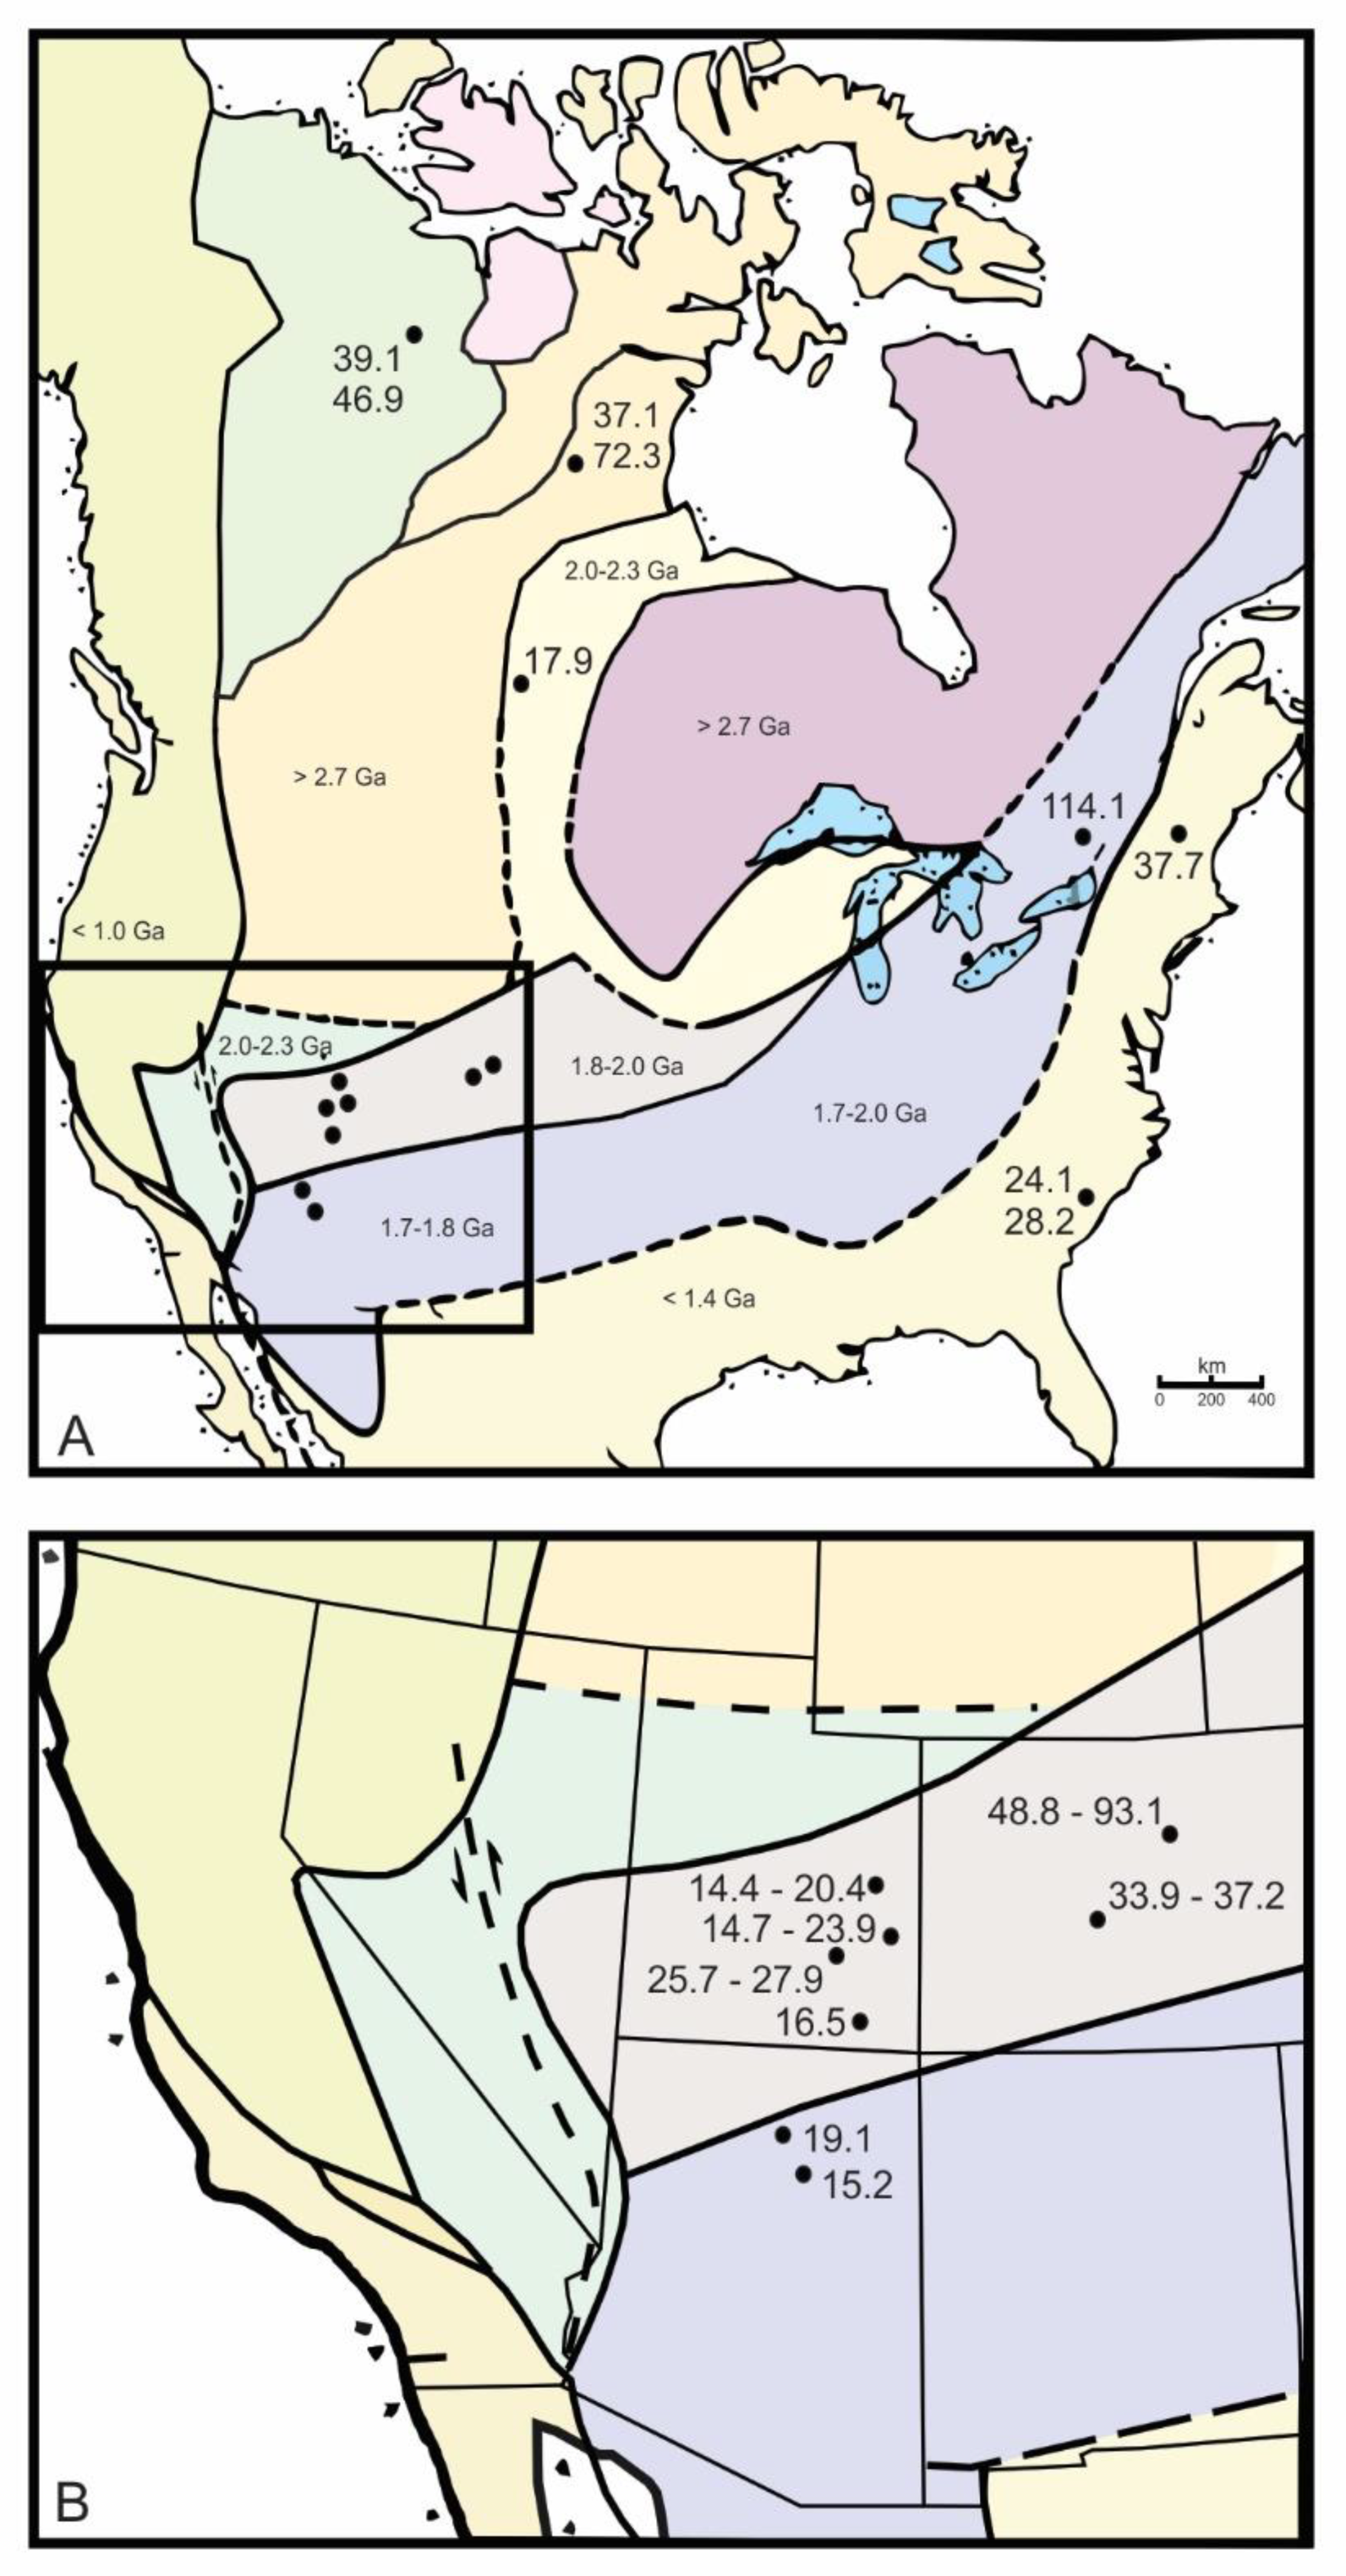
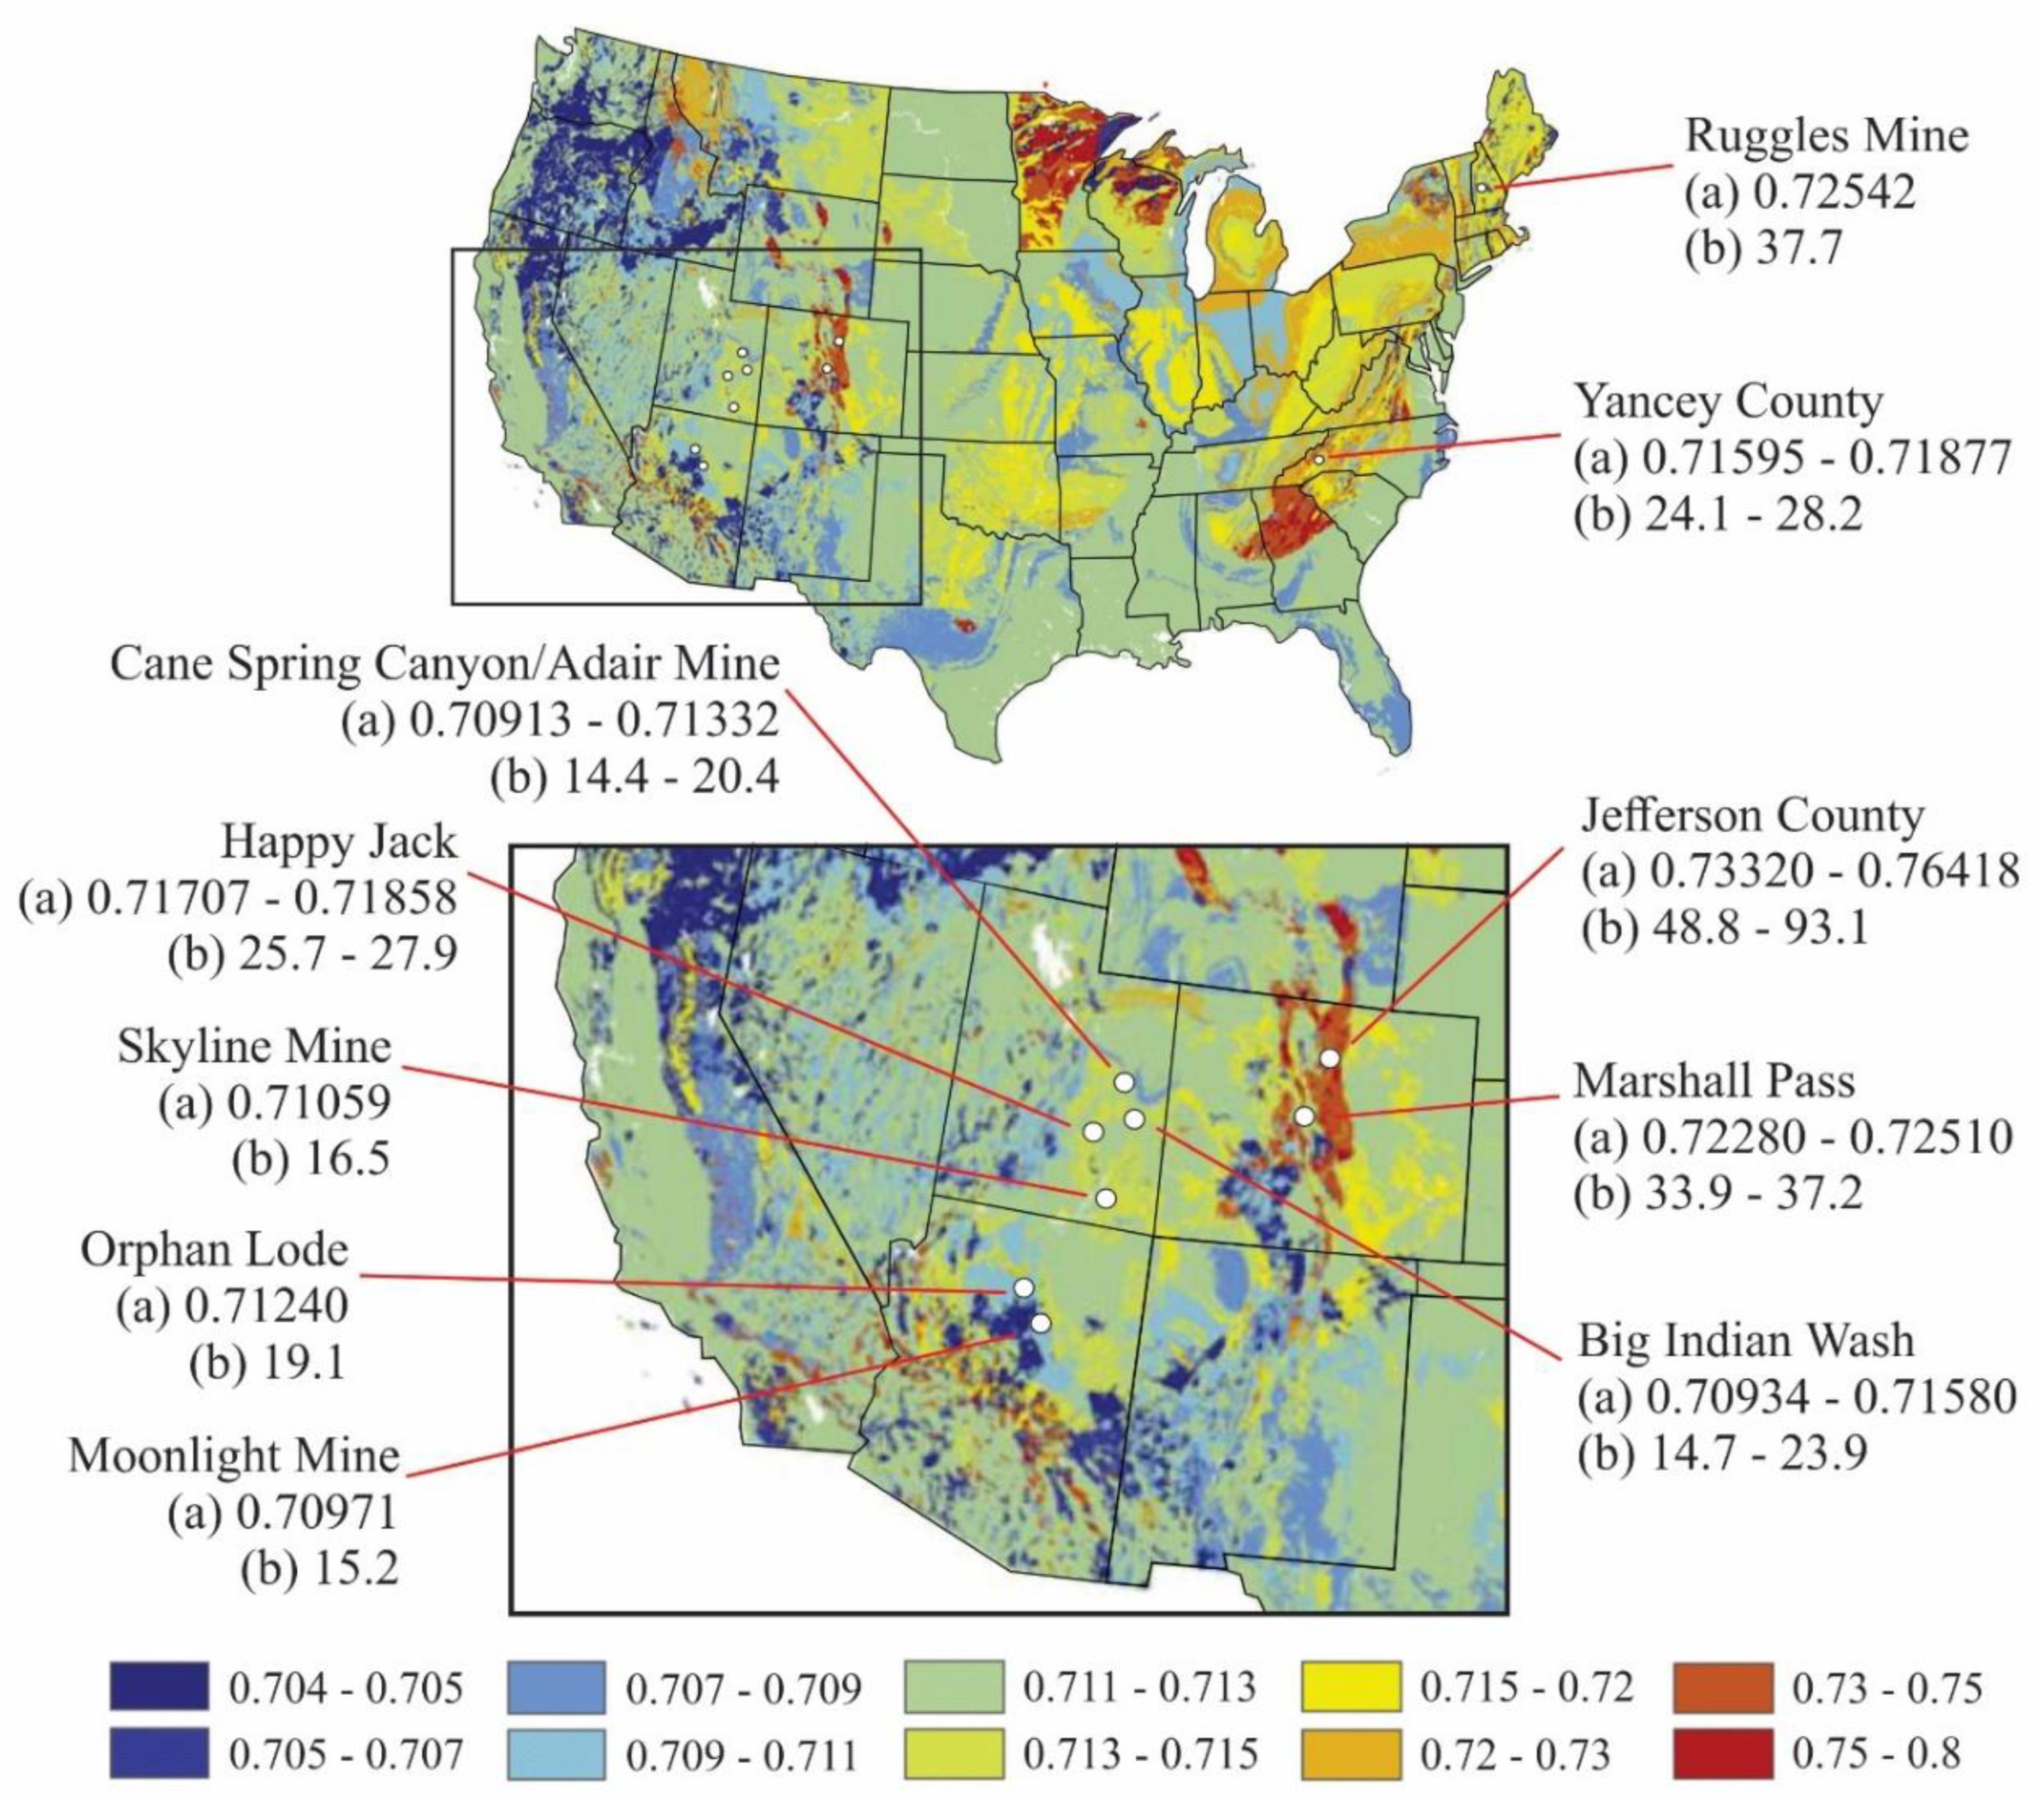
3.3. Sr Isotope Data
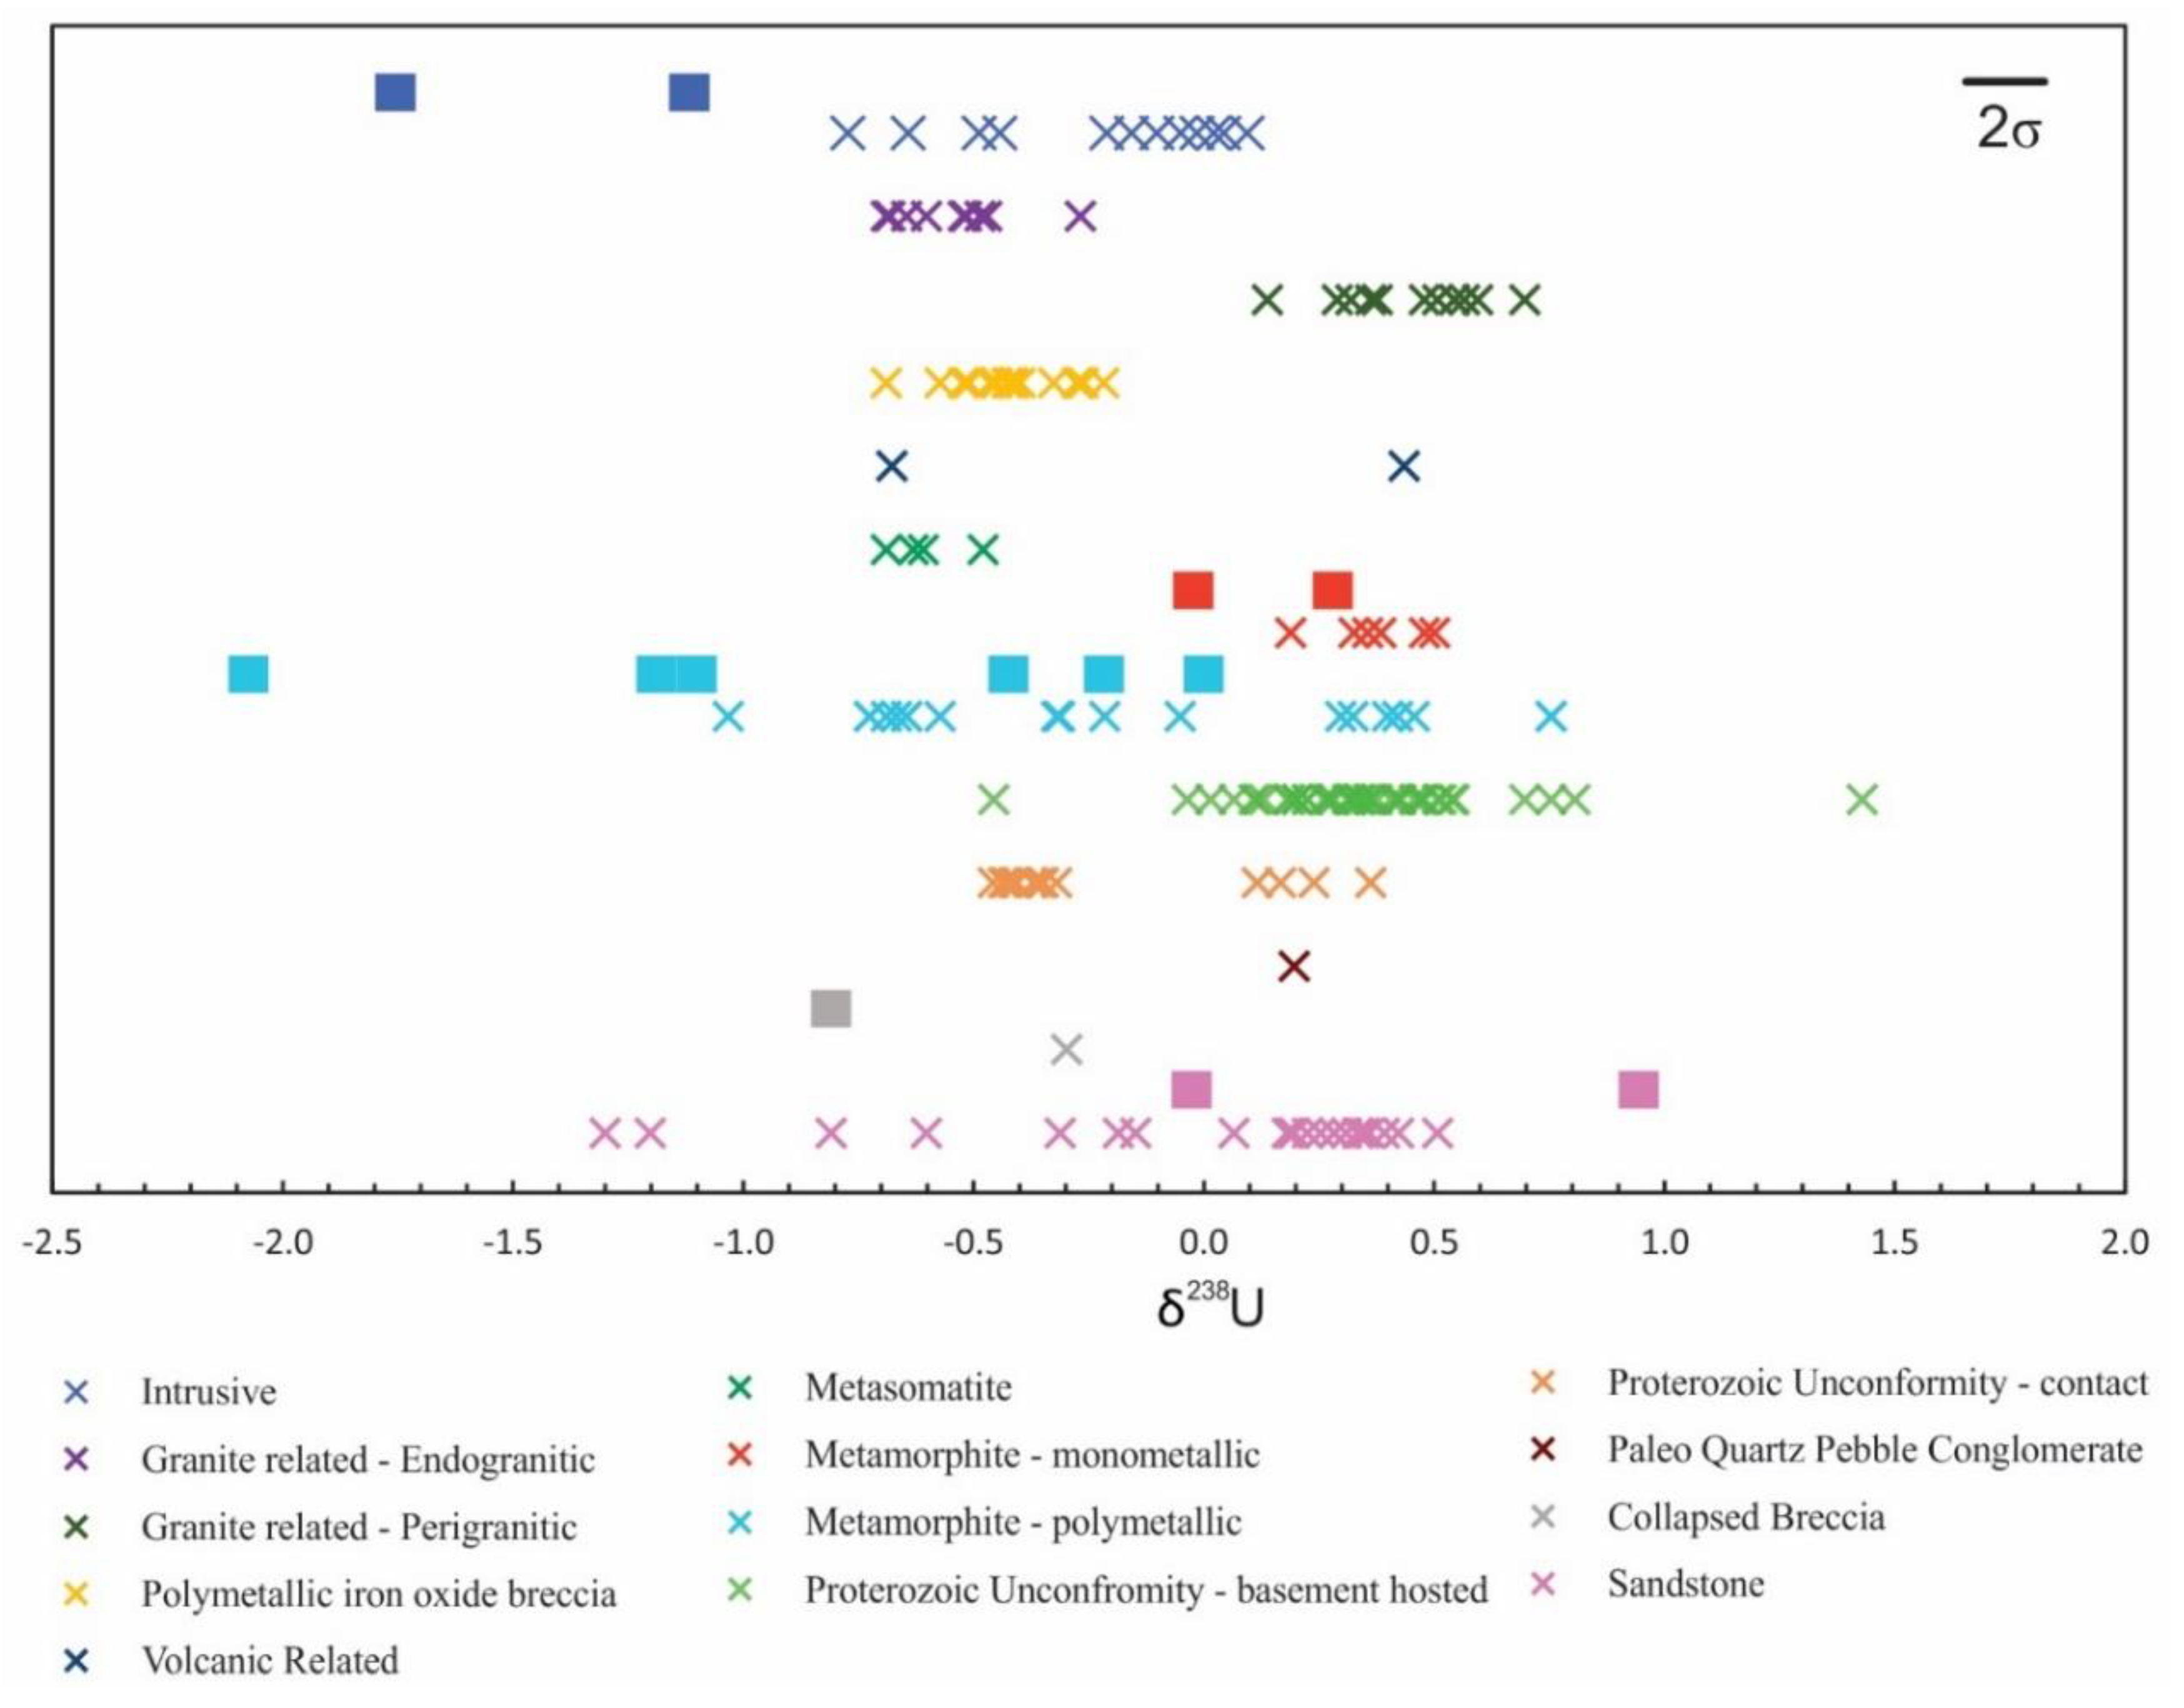
Sr isotope results, obtained here, are listed in Table 5. Sr concentrations for uraninite samples, investigated here, range from 60 to 1089 ppm (Table 2). All initial 87Sr/86Sr ratios are well above the present-day Bulk Earth value of 0.7045 indicative of a significant crustal signature (Table 5). The Rb-Sr isotope results yield erroneous Rb-Sr isochron ages (Figure S2). Initial 87Sr/86Sr and corresponding ɛSr values, as defined above, were calculated based on the secondary Pb-Pb isochron ages, reported here. Literature values were used in the event that a secondary Pb-Pb isochron age was not determined. The ɛSr values define a broad range of values between +14.4 and +114.1 (Table 5 and [59]). In Figure 3, North American craton Nd model ages based on the Bennett and DePaolo’s [21] study are compared to the ɛSr values calculated for uraninite investigated in this study (n = 12) and for uraninite (n = 15) analyzed previously [59]. Overall, the ɛSr values increase from the margins to the central regions of the North American craton with the highest values in Canada, with the exception of uraninite from Rabbit Lake, Saskatchewan, Canada at +17.9 (Figure 3). Rabbit Lake uraninite is classified as a Proterozoic unconformity ore deposit, and thus could have experienced higher degrees of alteration during open system processes. This general trend of increasing ɛSr values relative to geographic position in North America is also evident within the southwestern region of the United States (Figure 3B). In the central section of the region shown in Figure 3B, the craton age ranges between 1.8 and 2.0 Ga and corresponds to uraninite samples from 11 locations, investigated here. The ɛSr values for uraninite from Skyline, Happy Jack, Big Indian, Cane Spring Canyon, and Adair Mine are distinctively lower as compared with those from Jefferson and Marshall Pass (further to the east).
Uraninite samples linked to a pegmatitic origin can be separated into two groups (Figure 3A and Table 5). Uranium deposits located within the eastern coastal region of the USA, where craton ages are <1.4 Ga, are linked to ɛSr values that range between +24.1 and +37.7; whereas uraninite with ɛSr values of +72.3 (>2.7 Ga) and +114.1 (1.7 to 2.0 Ga) are from deposits located within the older cratons of Canada (Figure 3A).
Uraninite samples linked to a pegmatitic origin can be separated into two groups (Figure 3A and Table 5). Uranium deposits located within the eastern coastal region of the USA, where craton ages are <1.4 Ga, are linked to ɛSr values that range between +24.1 and +37.7; whereas uraninite with ɛSr values of +72.3 (>2.7 Ga) and +114.1 (1.7–2.0 Ga) are from deposits located within the older cratons of Canada (Figure 3A).
Bataille and Bowen [60] modeled the 87Sr/86Sr variation of bioavailable Sr (i.e., isoscape maps) across the USA, which are based on reported literature values for various types of geologic samples (rock lithologies, fluvial, and vegetation). Figure 4 superimposes the sample locations and corresponding ɛSr values for samples investigated in this study within the USA isoscapes map from Bataille and Bowen [60].

3.4. U Isotope Data

U isotope ratios for uraninite, investigated here, are listed in Table 5. For this study, the average external reproducibility (2σ level) associated with the 238U/235U, 234U/238U, and235U/238U ratios are 0.3‰, 8.18‰, and 0.79‰, respectively. Figure 5 displays the δ238U values for pristine solutions of uraninite, obtained here, as compared with those from several previous analogous studies of uraninite (Table S1).
The δ238U values for uraninite from a deposit type yield a range of values that are either all negative or all positive (not mixed) with the exception of those from metamorphite polymetallic, sandstone, and Proterozoic unconformity contact deposits (Figure 5). Granite-related deposits were separated into two subtypes; deposits of an endogranitic nature yield negative δ238U values, whereas perigranitic uraninite are characterized by positive values (Figure 5).
Secular equilibrium is affected by fluid–mineral interaction either by post depositional alteration, or chemical weathering induced leaching [24]. Negative δ234U values indicate the loss of U, whereas positive δ234U values are associated with U gain. The majority (69%) of δ234U values, determined here, are between −10‰ and +10‰. Proterozoic unconformity basement-related uraninite is the only type with δ234U values greater than +10 (Table 5 and Table S1).
Figure 6 illustrates an overall positive trend between 207Pb/206Pb and 238U/235U ratios for uraninite examined in this study. Great Bear uraninite is characterized by the lowest 238U/235U at 137.56. A positive array is observed when 207Pb/206Pb ratios are plotted against initial 87Sr/86Sr values (Figure 6B). Figure 6C displays Ba/Sr ratios (log scale) versus initial 87Sr/86Sr values and the result is also an overall positive trend.

4. Discussion

A large concentration of uranium deposits are located within the western USA [63]. This presumably results from the prolonged tectonic activity in the area, such as the Laramide orogeny, which occurred between 80 and 35 million years ago [64], although it is most likely not the only factor. Such regional tectonic events could have had a significant impact on the geochemistry and isotopic signatures associated with uraninite mineralization.
Figure 1A–D indicates that trace element abundances and their incorporation within uraninite is controlled primarily by the crystal structure, and these display some fractionation relative to canonical values for continental crust [52] and sediments [53,54]. Detailed examination of trace elemental ratios for pristine and corresponding altered sections for the same uraninite sample indicate higher La/Yb ratios for the latter (Figure 1A and Table 2). If the La/Yb ratio serves as a proxy for monitoring the degree of light vs. heavy rare earth elements (LREE/HREE) enrichment, then the results shown in Figure 1A suggest the larger LREEs are preferentially incorporated into uraninite alteration products. The latter feature has also been documented in a recent study by Balboni et al. [29]. Figure 1B,D indicates greater variation for Nb abundances relative to the other trace elements depicted in Figure 1 as the former span >4 orders of magnitude. In general, Figure 1D displays the removal of the more mobile elements Ta and Nb from pristine uraninite into altered sections, which is facilitated by the similar ionic radii of Y and Yb with that of uranium. Moreover, the mobility of Ta and Nb is dependent on the chemistry of the fluid/melt, and in turn the degree of interaction between the host rock and corresponding source rock [6]. The higher and more variable Zr/Hf ratios as compared with Rb/Cs values (Figure 1C) is not a crystallographic-controlled feature but is rather a source-dominated result. For example, sample 625 is from a sandstone-type deposit (Moonlight Mine) and thus its high Zr/Hf ratio could reflect the presence of detrital zircon in the precursor host rock. The remaining uraninite samples with high Zr/Hf values could simply reflect regional host rock source compositions or the result of U ore formation processes, such as metamorphism (e.g., Great Bear). The high Rb/Cs ratio for the altered Billiken sample could be attributed to contamination by K-feldspar from the host rock (Figure 1C). Figure 1A illustrates that initial 87Sr/86Sr values are age dependent, i.e., older metamorphite uraninites is characterized by higher initial Sr values, whereas much younger pegmatitic uraninite plot at lower ratios; intermediate initial Sr isotope values are recorded by uraninite aged between ~44 and 440 Ma. This interpretation is consistent with that postulated by [65].
Figure 6A plots 238U/235U vs. 207Pb/206Pb ratios for the uraninite samples, investigated here, and the latter value reflects a combined contribution from both common and radiogenic Pb sources; increased contributions from both components result in higher 207Pb/206Pb ratios since older deposits contain more radiogenic Pb. However, there does not seem to be a definitive temporal variation in the 238U/235U ratios (Figure 6A). The Great Bear uraninite is the oldest sample in this study and has the lowest 238U/235U ratio, which is attributed to vastly different paleo environmental conditions (e.g., oxidation state [19]) at the time of mineralization (Figure 6A). Figure 6B displays an overall positive trend between initial 87Sr/86Sr and 207Pb/206Pb, which could be attributed to radiogenic in-growth over time; i.e., samples with higher initial ratios for both isotope systems are older. Moreover, the overall positive correlation between Ba/Sr and initial 87Sr/86Sr ratios could be attributed to the increasing involvement of K-feldspar, which preferentially incorporates both Ba and Rb within the host crust (Figure 6C). For example, K-feldspar is an abundant mineral in high pressure and temperature metamorphic terrains, such as the one hosting the Great Bear uraninite deposit. The results, presented here, indicate that despite the complex chemical nature of uraninite and its capacity to incorporate a variety of trace elements, it is nonetheless still possible to identify specific deposit locations that occur within proximity of each other (e.g., <300 km apart in southwestern USA) due to their contrasting isotope signatures (Figure 1, Figure 3 and Figure 6).
Accurate and rapid assessment of forensic signatures for intercepted illicit nuclear material requires reliable, proven, and state-of-the-art analytical techniques. Traditional isotopic measurements are conducted using acid digestion followed by ion exchange chromatography, which can take weeks to complete [17]. Recent advances in MC-ICP-MS instrumentation combined with laser ablation technology have provided the ability to obtain accurate chemical (e.g., [51]) and isotopic results within days (e.g., [66]).
The secondary Pb-Pb isochron ages, obtained here, by both SM- and LA-MC-ICP-MS are in general within good agreement of one another, and with previously documented ages for these same U ore deposits (Figure 2 and Figure S1). Hence, these results support the use of the LA-MC-ICP-MS method for common Pb age dating of uraninite as a viable nuclear forensic tool. Isotopic measurements conducted using SM-MC-ICP-MS are associated with much lower uncertainties as compared with those obtained by LA-MC-ICP-MS. In general, laser ablation analyses are associated with a higher uncertainty because, unlike solution mode analyses, the elements of interest are not separated from the U-rich matrix and the laser ablation ion signals are transient in nature; i.e., are not stable and decrease as a function of time of analysis. For Shinkolobwe, the uraninite matrix appeared to be ”softer” as compared with the remaining uraninite samples, which influenced and reduced the efficiency of the ablation process. Marshall Pass samples were heavily altered throughout, which could have affected the ablation process via the presence of micro fractures within the uraninite resulting in higher uncertainties (i.e., less stable ion signals). Nevertheless, the LA-MC-ICP-MS analyses provide valuable information on the relative ages of uraninites, being investigated, i.e., whether it is billions of years old, or formed within the last 100 million years. In a nuclear forensic analysis, this type of information will prove useful in constraining the possible U deposits of origin.
Lewis et al. [67] showed that uraninite could be texturally and compositionally heterogeneous at the micron scale. Application of the LA-MC-ICP-MS method provides spatially resolved ages for both the mineralization and the associated alteration of uraninite, which can both be easily masked by bulk sample analysis by SM-MC-ICP-MS. Analyses conducted using LA-MC-ICP-MS have the capability to specifically target regions of interest on a sample at the 10 to 100 s of micron scale and hence avoid potential contamination from mineral inclusions and host rock materials. Uraninites from Jefferson, Billiken, and Shinkolobwe are the only three samples that did not give reliable ages. Ages determined for the uraninite from Billiken Lode of 537 ± 37 and 733 ± 1200 Ma do not match the previously documented age of 69.3 ± 1.1 Ma; this discrepancy can be explained by possible contamination from the host rock (Proterozoic age). This is supported by further examination of the LA-MC-ICP-MS analyses, since two separate secondary Pb-Pb isochrons associated with lower uncertainties yield a younger (476 ± 110 Ma) and older (1255 ± 65 Ma) age, the latter result is closer in age to that of the host rock for the Billiken uraninite sample (Figure S1).
Isotopic measurements of both digested pristine and altered uraninite fragments were used to generate two-point secondary Pb-Pb isochrons for SM-MC-ICP-MS analyses. The agreement between ages, obtained here, with those previously documented for uraninite indicates that the alteration event occurred soon after the time of mineralization. Evidence for more recent alteration events is also corroborated by the negative δ234U values (Table 5), which can be attributed to uranium leaching [9]. Comparison between ages obtained by LA-MC-ICP-MS for the pristine (>80 wt% UO2) and altered (<80 wt% UO2) regions in Marshall 4 uraninite suggest the alteration occurred relatively soon after its crystallization (Figure 2). Marshall 3 yields the youngest age via SM-MC-ICP-MS; however, the LA-MC-ICP-MS results for this same sample has pristine uraninite yielding an age of 145 ± 240 Ma and altered areas give −122 ± 55 Ma. Thus, the latter result obtained by SM-MC-ICP-MS for Marshall 3 reflects a very recent alteration event, which is supported by the δ234Uvalue of −64.69. On the basis of the ages obtained in this study of 1509 ± 19 and 1444 ± 61 Ma by SM- and LA-MC-ICP-MS, respectively, the uraninite from Great Bear is further confirmed to originate from the Echo Bay mine (1500 ± 10 to 1424 ± 29 Ma) within the Great Bear region.
The erroneous and negative Rb-Sr isochron ages indicate that the uraninite samples were affected by open system behavior most likely involving hydrothermal fluids. Rubidium has a much larger radius (1.48 Å) compared to both Sr (1.13 Å) and U (1.0 Å). Thus, this large difference in ionic radius can render Rb incompatible within the uraninite structure. In contrast, Sr can substitute for Ca (an important impurity) in eight-fold coordinated sites within UO2+x making Sr more compatible. The different geochemical properties between Rb and Sr could cause a fractionation between the parent and daughter isotope during fluid interaction, which does not affect the Pb isotopes. Alteration events must have occurred during the last 2.5 Ma within the southwestern USA, as indicated by the range of negative δ234U values from −2 to −65 (and up to +47), which could also have disturbed the Rb-Sr isotope systematics of uraninite. The elevated 87Sr/86Sr values, reported here, suggest that the source of Sr, similar to that for the U, is predominantly of crustal origin. This interpretation is corroborated by the fact that older Nd-model craton ages [21] are associated with higher initial 87Sr/86Sr (and ɛSr values) for uraninites, investigated here (Figure 3). The influence of the host rock on uraninite mineralization is further emphasized by the correlation between higher predicted 87Sr/86Sr values based on isoscape maps for the continental USA [60] and higher Sr values, reported here (Figure 4).
Several recent studies have investigated the main mechanism behind U isotope fractionation. Figure 5 illustrates the U isotope fractionation associated with several types of U deposits. Higher δ238U values are preferred within the lower oxidation state as per the nuclear field shift [9]. Although U isotope fractionation is dominated by reduction of U, the oxidation state is overprinted by increasing temperature [24]; as the temperature increases, the degree of isotopic fractionation decreases [9]. However, pegmatitic-type U ore deposits within the Appalachian mountain belt (Ruggles and Yancey) display lower δ238U values than previously documented [9], as low as −1.76 (Figure 5). These negative δ238U values indicate that although temperature plays an important role during uraninite formation, it is not the sole mechanism responsible for U fractionation. Similar to the results from Uvarova et al. [9], U deposits associated with lower ore grades tend to have more negative δ238U values than those associated with higher ore grades (Figure 5). Metamorphite and sandstone uranium deposits share similar mechanisms for ore formation with continual remobilization and crystallization of uraninite. The latter could be responsible for the highly variable δ238U values [62], shown in Figure 5. The range of δ238U values can also be related to the degree of U leaching from the host rock [24], which is linked to fluid interaction and the preferential removal of weakly bound 234U. However, careful examination of all the data, reported here, indicates that there is no correlation between δ238U and δ234U values (Figure S3).

5. Conclusions

Ages obtained for uraninite based on secondary Pb-Pb isochrons are in good agreement with those reported in the literature for the U ore deposits investigated here. Moreover, age results obtained by SM-MC-ICP-MS corroborate those determined by LA-MC-ICP-MS. The latter method provides spatially resolved age information for mineralization and alteration of uraninite in a shorter period of time as compared with conventional dating methods (e.g., ID-TIMS). LA-MC-ICP-MS measurements are associated with higher uncertainties as compared with those obtained by SM-MC-ICP-MS; however, useful age information can still be obtained from the former, i.e., clearly distinguish between uraninites that are characterized by vastly distinct ages. The trace element concentrations for uraninite indicate that the crystal structure dictates the incorporation of impurities followed by element availability. The large ionic radius of Rb (in particular relative to U and Pb) renders it more mobile during secondary alteration (open system) processes, consequently, eliminating the effectiveness of the Rb-Sr geochronometer for age determination of uraninite. Initial 87Sr/86Sr ratios for uraninite samples, investigated here, are in general positively correlated with the age of the host craton, i.e., higher initial 87Sr/86Sr values are found within older cratons. The U isotope signatures determined for uraninite, examined here, further support the variety of processes responsible for isotope fractionation, and these include temperature, the nuclear field effect, oxidation, and source rock composition.

Supplementary Materials

The following are available online at https://www.mdpi.com/2075-163X/10/2/136/s1, Figure S1: Secondary Pb-Pb isochrons determined using SM- and LA-MC-ICP-MS for uraninites from this study, Figure S2: Rb-Sr isochrons obtained by SM-MC-ICP-MS. All ellipses are at the 2σ level for uncertainty, Figure S3: δ238U and δ234U values, Table S1: Complied list of uraninites from several previous studies.

Author Contributions

Conceptualization, A.S. and S.R.L.; funding acquisition, A.S.; investigation, S.L, L.C., and S.S.S.; methodology, A.S., S.S.S., and C.D.; resources, P.C.B.; writing—original draft preparation, S.R.L. and A.S.; writing—review and editing, S.R.L., A.S., L.C., S.S.S., C.D., and P.C.B. All authors have read and agreed to the published version of the manuscript.

Funding

This research was funded by the United States Department of Homeland Security, grant number 2014-DN-077-ARI082.

Acknowledgments

The authors thank Ian Steele for his assistance and expertise with operation of the EMP and Notre Dame’s Center of Environmental Science and Technology (CEST) for use of the µ-XRF.

Conflicts of Interest

The authors declare no conflict of interest. The funders had no role in the design of the study; in the collection, analyses, or interpretation of data; in the writing of the manuscript, or in the decision to publish the results.

References

  1. Hore-Lacy, I. Uranium for Nuclear Power: Resources, Mining and Transformation to Fuel; Woodhead Publishing: Cambridge, UK, 2016. [Google Scholar]
  2. IAEA. Geological Classification of Uranium Deposits and Description of Selected Examples; IAEA-TECDOC-1842; IAEA: Vienna, Austria, 2018; pp. 1–430. [Google Scholar]
  3. Janeczek, J.; Ewing, R.C. Structural formula of uraninite. J. Nucl. Mater. 1992, 190, 128–132. [Google Scholar] [CrossRef]
  4. Moody, K.J.; Hutcheon, I.D.; Grant, P.M. Nuclear Forensic Analysis; Taylor and Francis Group: Abingdon, UK, 2005. [Google Scholar]
  5. Mercadier, J.; Cuney, M.; Lach, P.; Boiron, M.; Bonhoure, J.; Richard, A.; Leisen, M.; Kister, P. Origin of uranium deposits revealed by their rare earth element signature. Terra Nova 2011, 23, 264–269. [Google Scholar] [CrossRef]
  6. Frimmel, H.E.; Schedel, S.; Brätz, H. Uraninite chemistry as forensic tool for provenance analysis. Appl. Geochem. 2014, 48, 104–121. [Google Scholar] [CrossRef]
  7. Bellucci, J.J.; Simonetti, A.; Koeman, E.C.; Wallace, C.; Burns, P.C. A detailed geochemical investigation of post-nuclear detonation trinitite glass at high spatial resolution: Delineating anthropogenic vs. natural components. Chem. Geol. 2014, 365, 69–86. [Google Scholar] [CrossRef]
  8. Dustin, M.K.; Koeman, E.C.; Simonetti, A.; Torrano, Z.; Burns, P.C. Comparative investigation between in situ laser ablation versus bulk sample (solution mode) inductively coupled plasma mass spectrometry (ICP-MS) analysis of trinitite post-detonation materials. Appl. Spectrosc. 2016, 70, 1446–1455. [Google Scholar] [CrossRef] [PubMed]
  9. Uvarova, Y.A.; Kyser, T.K.; Geagea, M.L.; Chipley, D. Variations in the uranium isotopic compositions of uranium ores from different types of uranium deposits. Geochim. Cosmochim. Acta 2014, 146, 1–17. [Google Scholar] [CrossRef]
  10. Martz, P.; Mercadier, J.; Perret, J.; Villeneuve, J.; Deloule, E.; Cathelineau, M.; Quirt, D.; Doney, A.; Ledru, P. Post-crystalliztion alteration of natural uraninites: Implications for dating, tracing, and nuclear forensics. Geochim. Cosmochim. Acta 2019, 249, 138–159. [Google Scholar] [CrossRef]
  11. Cross, A.; Jaireth, S.; Rapp, R.; Armstrong, R. Reconnaissance-style EPMA chemical U–Th–Pb dating of uraninite. Aust. J. Earth Sci. 2011, 58, 675–683. [Google Scholar] [CrossRef]
  12. Finger, F.; Waitzinger, M.; Förster, H.J.; Kozlik Raith, J.G. Identification of discrete low-temperature thermal events in polymetamorphic basement rocks using high spatial resolution FE-SEM-EDX U-Th-Pb dating of uraninite microcrystals. Geology 2017, 45, 991–994. [Google Scholar] [CrossRef]
  13. Zong, K.Q.; Chen, J.Y.; Hu, Z.C.; Liu, Y.S.; Li, M.; Fan, H.H.; Meng, Y.N. Insitu U-Pb dating of uraninite by fs-LA-ICP-MS. Sci. China Earth Sci. 2015, 58, 1731–1740. [Google Scholar] [CrossRef]
  14. Shabaga, B.M.; Fayek, M.; Quirt, D.; Jefferson, C.W.; Camacho, A. Mineralogy, geochronology, and genesis of the Andrew Lake uranium deposit, Thelon Basin, Nunavut, Canada. Can. J. Earth Sci. 2017, 54, 850–868. [Google Scholar] [CrossRef]
  15. Amelin, Y.; Kaltenbach, A.; Iizuka, T.; Stirling, C.H.; Ireland, T.R.; Petaev, M.; Jacobsen, S.B. U–Pb chronology of the Solar System’s oldest solids with variable 238U/235U. Earth Planet. Sci. Lett. 2010, 300, 343–350. [Google Scholar] [CrossRef]
  16. Corcoran, L.; Simonetti, A. Geochronology of uraninite revisited. Minerals 2020, in press. [Google Scholar]
  17. Hutcheon, I.D.; Kristo, M.J.; Knight, K.B. Nonproliferation nuclear forensics. In Uranium: From Cradle to Grave; Burns, P.C., Sigmon, G.E., Eds.; Mineralogical Association of Canada: Québec, QC, Canada, 2013; Volume 43, pp. 15–119. [Google Scholar]
  18. Alves, A.; de Assis Janasi, V.; Simonetti, A.; Heaman, L. Microgranitic enclaves as products of self-mixing events: A study of open-system processes in the Mauá Granite, São Paulo, Brazil, based on in situ isotopic and trace elements in plagioclase. J. Petrol. 2009, 50, 2221–2247. [Google Scholar] [CrossRef]
  19. Cuney, M. Evolution of uranium fractionation processes through time: Driving the secular variation of uranium deposit types. Econ. Geol. 2010, 105, 553–569. [Google Scholar] [CrossRef]
  20. Kirchenbaur, M.; Maas, R.; Ehrig, K.; Kamenetsky, V.S.; Strub, E.; Ballhaus, C.; Münker, C. Uranium and Sm isotope studies of the supergiant Olympic Dam Cu–Au–U–Ag deposit, South Australia. Geochim. Cosmochim. Acta 2016, 180, 15–32. [Google Scholar] [CrossRef]
  21. Bennett, V.C.; DePaolo, D.J. Proterozoic crustal history of the western United States as determined by neodymium isotopic mapping. Geol. Soc. Am. Bull. 1987, 99, 674–685. [Google Scholar] [CrossRef]
  22. Varga, Z.; Wallenius, M.; Mayer, K.; Keegan, E.; Millet, S. Application of lead and strontium isotope ratioe measurements for the origin assessment of uranium ore concentrates. Anal. Chem. 2009, 81, 8327–8334. [Google Scholar] [CrossRef]
  23. Yang, S.; Liu, Y. Nuclear field shift effects on stable isotope fractionation: A review. Acta Geochim. 2016, 35, 227–239. [Google Scholar] [CrossRef] [Green Version]
  24. Andersen, M.B.; Stirling, C.H.; Weyer, S. Uranium isotope fractionation. Miner. Geochem. 2017, 82, 799–850. [Google Scholar] [CrossRef]
  25. Bopp, C.J., IV; Lundstrom, C.C.; Johnson, T.M.; Glessner, J.J.G. Variations in 238U/235U in uranium ore deposits: Isotopic signatures of the U reduction process? Geology 2009, 37, 611–614. [Google Scholar] [CrossRef]
  26. Brennecka, G.A.; Borg, L.E.; Hutcheon, I.D.; Sharp, M.A.; Anbar, A.D. Natural variations in uranium isotope ratios of uranium ore concentrates: Understanding the 238U/235U fractionation mechanism. Earth Planet. Sci. Lett. 2010, 291, 228–233. [Google Scholar] [CrossRef]
  27. Balboni, E.; Jones, N.; Spano, T.; Simonetti, A.; Burns, P.C. Chemical and Sr isotopic characterization of North America uranium ores: Nuclear forensic applications. Appl. Geochem. 2016, 74, 24–32. [Google Scholar] [CrossRef] [Green Version]
  28. Balboni, E.; Simonetti, A.; Spano, T.; Cook, N.; Burns, P.C. Rare-earth element fractionation in uranium ore and its U(VI) alteration. Appl. Geochem. 2017, 87, 84–92. [Google Scholar] [CrossRef]
  29. Brobst, D.A. Geology of the Spruce Pine District Avery, Mitchell, and Yancey Counties North Carolina; Bulletin 1122-A; U.S. Geological Survey: Reston, VA, USA, 1962.
  30. Shaub, B.M. The occurrence, crystal habit and composition of the uraninite from the Ruggles Mine, near Grafton Center, New Hampshire. Am. Miner. 1938, 23, 334–341. [Google Scholar]
  31. Olson, J.C. Mica-bearing Pegmatites of New Hampshire; Geological Survey Bulletin; US Government Printing Office: Washington, DC, USA, 1941.
  32. Korzeb, S.L.; Foord, E.E.; Lichte, F.E. The chemical evolution and paragenesis of uranium minerals from the Ruggles and Palermo Granitic Pegmatites, New Hampshire. Can. Miner. 1997, 35, 135–144. [Google Scholar]
  33. Miller, R.G. The geochronology of uranium deposits in the Great Bear batholith, Northwest Territories. Can. J. Earth Sci. 1982, 19, 1428–1448. [Google Scholar] [CrossRef]
  34. Decrée, S.; Deloule, É.; De Putter, T.; Dewaele, S.; Mees, F.; Yans, J.; Marignac, C. SIMS U-Pb dating of uranium mineralization in the Katanga Copperbelt: Constraints for the geodynamic context. Ore Geol. Rev. 2011, 40, 81–89. [Google Scholar] [CrossRef]
  35. Dahlkamp, F.J. Uranium Ore Deposits; Springer: Berlin/Heidelberg, Germany; New York, NY, USA, 1991. [Google Scholar]
  36. Zhao, D.; Ewing, R.C. Alteration products of uraninite from the Colorado Plateau. Radiochim. Acta 2000, 88, 739–749. [Google Scholar] [CrossRef]
  37. Deditius, A.P.; Utsunomiya, S.; Ewing, R.C. Fate of trace elements during alteration of uraninite in a hydrothermal vein-type U-deposit from Marshall Pass, Colorado, USA. Geochim. Cosmochim. Acta 2007, 71, 4954–4973. [Google Scholar] [CrossRef]
  38. Granger, H.C.; Raup, R.B. Reconnaissance Study of Uranium Deposits in Arizona; Geological Survey Bulletin; US Government Printing Office: Washington, DC, USA, 1962.
  39. Burns, P.C.; Finch, R. Uranium: Mineralogy, Geochemistry and the Environment; Mineralogical Society of America: Washington, DC, USA, 1999. [Google Scholar]
  40. Johnson, H.S.; Thordarson, W. Uranium Deposits of the Moab, Monticello, White Canyon and Monument Valley Districts Utah and Arizona; Geological Survey Bulletin; US Government Printing Office: Washington, DC, USA, 1966.
  41. Fayek, M. Uranium Ore Deposits—A Review. In Uranium: From Cradle to Grave; Burns, P.C., Sigmon, G.E., Eds.; Mineralogical Association of Canada: Québec, QC, Canada, 2013; Volume 43, pp. 121–146. [Google Scholar]
  42. Schmidberger, S.S.; Simonetti, A.; Heaman, L.M.; Creaser, R.A.; Whiteford, S. Lu‒Hf, in-situ Sr and Pb isotope and trace element sustematics for mantle eclogites from the Diavik diamond mine: Evidence for Paleoproterozoic subduction beneath the Slave craton. Can. Earth Planet. Sci. Lett. 2007, 254, 55–68. [Google Scholar] [CrossRef]
  43. Schurr, M.R.; Donohue, P.H.; Simonetti, A.; Dawson, E. Multi-element and lead isotope characterization of early nineteenth century pottery sherds from Native American and Euro-American sites. J. Archaeol. Sci. Rep. 2018, 20, 390–399. [Google Scholar] [CrossRef]
  44. Jenner, G.A.; Longerich, H.P.; Jackson, S.E.; Fryer, B.J. ICP-MS- A powerful tool for high-precision trace-element analysis in Earth sciences: Evidence from analysis of selected U.S.G.S reference samples. Chem. Geol. 1990, 83, 133–148. [Google Scholar] [CrossRef]
  45. Manhes, G.; Minster, J.F.; Allègre, C.J. Comparative uranium-thorium-lead and rubidium-strontium study of the Saint Sèverin amphoterite: Consequences for early solar system chronology. Earth Planet. Sci. Lett. 1978, 39, 14–24. [Google Scholar] [CrossRef]
  46. Simonetti, A.; Gariépy, C.; Banic, C.M.; Tanabe, R.; Wong, H.K. Pb isotopic investigation of aircraft-sampled emissions from the Horne smelter (Rouyn, Québec): Implications for atmospheric pollution in northeastern North America. Geochim. Cosmochim. Acta 2004, 68, 3285–3294. [Google Scholar] [CrossRef]
  47. Crock, J.G.; Lichte, F.E.; Wildeman, T.R. The group separation of the rare-earth elements and yttrium from geologic materials by cation-exchange chromatography. Chem. Geol. 1984, 45, 149–163. [Google Scholar] [CrossRef]
  48. Faure, G.; Mensing, T.M. Isotopes: Principles and Applications; Wiley-Blackwell: Hoboken, NJ, USA, 2005. [Google Scholar]
  49. Martinelli, R.E.; Hamilton, T.F.; Williams, R.W.; Kehl, R.W. Separation of uranium and plutonium isotopes for measurement by multi collector inductively coupled plasma mass spectroscopy. J. Radioanal. Nucl. Chem. 2009, 282, 343–347. [Google Scholar] [CrossRef]
  50. Cheng, H.; Edwards, R.L.; Shen, C.C.; Polyak, V.J.; Asmerom, Y.; Woodhead, J.; Hellstrom, J.; Wang, Y.; Kong, X.; Spötl, C.; et al. Improvements in 230Th dating, 230Th and 234U half-life values, and U–Th isotopic measurements by multi-collector inductively coupled plasma mass spectrometry. Earth Planet. Sci. Lett. 2013, 371, 82–91. [Google Scholar] [CrossRef]
  51. Spano, T.L.; Simonetti, A.; Balboni, E.; Dorais, C.; Burns, P.C. Trace element and U isotope analysis of uraninite and ore concentrate: Applications for nuclear forensic investigations. Appl. Geochem. 2017, 84, 277–285. [Google Scholar] [CrossRef]
  52. Rudnick, R.L.; Gao, S. Composition of the continental crust. In The Crust; Volume 3 Treatise on Geochemistry; Rudnick, R.L., Ed.; Elsvier-Pergamon: Oxford, UK, 2005. [Google Scholar]
  53. McLennan, S.M. Relationships between the trace element composition of sedimentary rocks and upper continental crust. Geochem. Geophys. Geosyst. 2001, 2. [Google Scholar] [CrossRef]
  54. Gromet, L.P.; Dymek, R.F.; Haskin, L.A.; Korotev, R.L. The “North American shale composite”: Its compilation, major and trace element characteristics. Geochim. Cosmochim. Acta 1984, 48, 2469–2482. [Google Scholar] [CrossRef]
  55. Ludwig, K.R. Isoplot 4.0: A Geochronological Toolkit for Microsoft Excel; Berkeley Geochronology Center Special Publication: Berkeley, CA, USA, 2008. [Google Scholar]
  56. Balboni, E.; (University of Notre Dame, Notre Dame, IN, USA). Personal communications, 2008.
  57. Ludwig, K.R.; Wallace, A.R.; Simmons, K.R. The Schwartzwalder Uranium Deposit, II: Age of Uranium Mineralization and Lead Isotope Constraints on Genesis. Econ. Geol. 1985, 80, 1858–1871. [Google Scholar] [CrossRef]
  58. Meneghel, L. The Occurrence of Uranium in the Katanga System of Northwestern Zambia. Econ. Geol. 1981, 76, 56–68. [Google Scholar] [CrossRef]
  59. Corcoran, L.; Simonetti, A.; Spano, T.L.; Lewis, S.R.; Dorais, C.; Simonetti, S.; Burns, P.C. Multivariant analysis of geochemical composition of uranium-rich samples. Minerals 2019, 9, 537. [Google Scholar] [CrossRef] [Green Version]
  60. Bataille, C.P.; Bowen, G.J. Mapping 87Sr/86Sr variations in bedrock and water for large scale provenance studies. Geochem. Geol. 2012, 304, 39–52. [Google Scholar] [CrossRef]
  61. Hiess, J.; Condon, D.; McLean, N.; Noble, S. 238U/235U Systemics in terrestrial uranium-bearing minerals. Science 2012, 335, 1610–1614. [Google Scholar] [CrossRef] [Green Version]
  62. Chernyshev, I.V.; Golubev, V.N.; Chugaev, A.V.; Baranova, A.N. 238U/235U isotope ratio variations in minerals from hydrothermal uranium deposits. Geochem. Int. 2014, 52, 1013–1029. [Google Scholar] [CrossRef]
  63. Berge Exploration Inc. United States Uranium Resource Map; Berge Exploration: Denver, CO, USA, 1978. Available online: https://www.loc.gov/item/79692715/ (accessed on 6 December 2019).
  64. Livaccari, R. Role of crustal thickening and extensional collapse in the tectonic evolution of the Sevier-Laramide orogeny, western United States. Geology 1991, 19, 1104–1107. [Google Scholar] [CrossRef]
  65. Robb, L. Introduction to Ore-Forming Processes; Blackwell Publishing: Hoboken, NJ, USA, 2005. [Google Scholar]
  66. Krachler, M.; Varga, Z.; Nicholl, A.; Wallenius, M.; Mayer, K. Spatial distribution of uranium isotopes in solid nuclear materials using laser ablation multi-collector ICP-MS. Microchem. J. 2018, 140, 24–30. [Google Scholar] [CrossRef]
  67. Lewis, S.R.; Simonetti, A.; Corcoran, L.; Spano, T.L.; Chung, B.W.; Teslich, N.E.; Burns, P.C. Characterization of uraninite using a FIB–SEM approach and its implications for LA–ICP–MS analyses. J. Radioanal. Nucl. Chem. 2018, 318, 1389–1400. [Google Scholar] [CrossRef]
Figure 1. Binary plots illustrating trace element concentration ratios (determined using solution mode ICP-MS) for uraninite based on deposit type. (A) 87Sr/86Srinitial vs. La/Yb, orange rectangle indicates range of La/Yb values for continental crust; (B) Zr/Hf vs. Zr/Nb; (C) Zr/Hf vs. Rb/Cs; (D) Y/Nb vs. Yb/Ta. Solid circles represent pristine fraction of uraninite, whereas open circles denote altered areas, and square symbols indicate bulk aliquots as pristine and altered segments could not be physically separated. The yellow fields (orange triangles) denote values for crust [52] and sediment [53,54].
Minerals 10 00136 g001
Figure 2. Secondary Pb-Pb isochrons of selected uraninite, investigated in this study. (A,C,E) represent analyses obtained using SM-MC-ICP-MS; whereas (B,D,F) illustrate results acquired by LA-MC-ICP-MS. (A,B) compare age results between pristine and altered uraninite sections from Yancey 1, Mitchell, and Ruggles, (C,D) compare ages for pristine and altered regions of uraninite from Marshall 2, and (E,F) show dating results for uraninite (pristine and altered) from Great Bear region.
Minerals 10 00136 g002
Figure 3. ƐSr values (as defined in text) of uraninite from this study and Corcoran et al. [59]. Colors do not have any geological significance. (A) Map of North American cratons with associated Nd model ages modified from Bennett and DePaolo [21]; (B) inset of western United States.
Minerals 10 00136 g003
Figure 4. Initial 87Sr/86Sr (a) and ƐSr values (b, as defined in text) of uraninite from this study and Corcoran et al. [59] overlain on 87Sr/86Sr isoscape map for continental U.S. (from Bataille and Bowen [60]).
Minerals 10 00136 g004
Figure 5. Natural 238U/235U ratios of uraninite plotted as δ238U (defined in text) based on their deposit type. Uraninites from this study (solid squares) and several other previous studies (X symbols), which include: [9,20,25,50,51,59,61,62]. Solid line in upper right corner represents external reproducibility.
Minerals 10 00136 g005
Figure 6. Isotopic and Ba/Sr signatures of uraninite from several deposit types. (A) 207Pb/206Pb vs. 238U/235U; (B) 207Pb/206Pb vs. 87Sr/86Sr; (C) Ba/Sr vs. 87Sr/86Sr (AC). Solid circles denote pristine sample, open circles represent altered fraction, and square symbols represent bulk samples where pristine and altered aliquots could not be separated.
Minerals 10 00136 g006
Table 1. A list of uraninite samples, reported here, with their accompanying deposit type and source location. Uraninite sample number corresponds to the Ewing Collection sample number.
NameLocationSampleType
MitchellMitchell County, NC334Intrusive anatectic
Yancey 1Webb Mine, Yancey County, NC336Intrusive anatectic
Yancey 2Yancey County, NC513Intrusive anatectic
RugglesRuggles Mine, Grafton, NH344Intrusive anatectic
BillikenBilliken Lode, Critchell, Jefferson County, CO522Metamorphite monometallic vein
JeffersonJefferson County, CO637Metamorphite monometallic vein
Great BearGreat Bear Lake, NWT, Canada626Metamorphite polymetallic vein
ShinkolobweShinkolobwe, Congo437Metamorphite polymetallic vein
Marshall 1Marshall Pass area, Gunnison County, CO530Metamorphite hydrothermal vein
Marshall 2Marshall Pass area, Gunnison County, CO531Metamorphite hydrothermal vein
Marshall 3Marshall Pass, CO623Metamorphite hydrothermal vein
Marshall 4Near Sargents, CO624Metamorphite hydrothermal vein
OrphanOrphan Lode, Grand Canyon, AZ1304Collapsed Breccia
SkylineSkyline Mine, Monument Valley, UT625Sandstone Tabular
MoonlightMoonlight Mine, AZ815Sandstone Basal
Table 2. Trace element abundances (ppm) determined by solution mode (SM) inductively coupled plasma mass spectrometry (ICP-MS).
Sample NameRb Sr Y Zr Nb Cs Ba La Yb Hf Ta La/YbZr/NbZr/HfRb/CsY/NbYb/Ta
Intrusive
334A29.1749910269417.05.613364.331.797.61.12.03159285.25429
33611.830742,57611194.40.51032421661.6bdl1.4625268423.59597bdl
513A16.118821,0795098.014.0286158590.20.30.00.276317371.12621bdl
34429.65771043109,6276.82.460.05.011731141.00.0416,1633512.4154121
344A15737519715,65910.916.41042.032.76803.10.061435239.61811
Metamorphite
52220.61089594970,96823,9608.831,95548223567.932.52.05310452.30.27
522A15631621.136371.80.6414768.010.85.12.26.28571249.10.35
63735.530486063564273.656684.665.738.56.71.29151659.9210
637A37.240342272307303.128959.722.139.532.82.691018312.011
62621.414627,454553042.44.3179213155485.7bdl2.401309645.0648bdl
626A26.41093871616286.80.7243128774.25.90.13.8671104940.345742
437B12.29675575158737.75.119.821039.81.7bdl5.28429592.4148bdl
Hydrothermal
53029.0217727582519973.724887.989.943.01.90.982.91367.80.448
530A93.710831.38779095.542223.06.29.40.73.731.093.217.20.09
53133.245014289819587119.618125614542.82.41.761.72291.70.261
531A40.56606356490514420.1620183.978.037.51.62.361.3173.12.00.149
62332.930613088319310614.115314713149.41.91.122.71682.30.469
623A54.02001473584228222.126344.218.035.41.72.461.6101.12.40.111
62436.532010694023376215.217412714232.010.70.901.11262.40.313
624A59.431377.93635465617.3257869.117.435.25.93.970.8103.33.40.03
Collapsed Breccia
1304B40.76027981777.911.6517330.7193.0bdl1.6022583.5353bdl
Sandstone
62533.62733720306454.44.926.85222594.80.12.02566446.9682587
625A32.631310845064.42.120.7239.84.30.40.455.367126415.4211
815B61.79977225712.53.037316447.20.50.288.9512520.75836
Upper Cont. Crust8232021193124.96283125.30.915.50163616.722
Mid. Cont. Crust6528220149102.2532242.24.40.610.91153429.524
Lower Cont. Crust11348166850.325981.51.90.65.33143636.733
Bulk Cont. Crust493201913282456201.93.70.710.53173624.523
River113--19117.18.8463543.3-5.771.39-11.233.112.8--
Loess73--30212.73.845827.9-8.90.92-23.833.919.2--
NASC125142-200-5.263631.13.066.31.1210.16-31.724.0-2.7
PAAS160--21018665038.2-51.28-11.742.026.7--
Russian144--21314-67733.5-6.6--15.232.3---
CondieF163--20115.4-55138.8-4.61.4-13.143.7---
GLOSSg57.2--1308.943.4877628.8-4.060.63-14.532.016.4--
PM235--16814.24.7882333-5.45--11.830.849.2--
AM141--1559.75.5764626.1-4.96--16.031.325.3--
Tillite80--1679.42.647625.7-4.370.61-17.838.230.8--
Condie25--1054-15010.3-3.10.3-26.333.9---
Condie 90--14710-62528-3.80.83-14.738.7---
PM61--2857.711.4240327.2-9.68--37.029.443.0--
AM67--1556.732.5744120.7-4.73--23.032.826.1--
Note: bdl, below detection limit; (-), value not reported; A, altered; B, bulk; crustal values are from Rudnick and Gao [52]; sediment values are from McLennan [53] and Gromet et al. [54].
Table 3. Isotopic Pb ratios determined by solution mode (SM) multicollector (MC) ICP-MS.
Sample206Pb/204Pb207Pb/204Pb208Pb/204Pb207Pb/206Pb208Pb/206Pb
Intrusive
33419,53620601069.3111.424022.40.05460.0000110.01210.000023
334A6970.050252.260.01046.240.0100.07500.0000020.06640.000002
33620,98911361148.761.822111.10.05470.0000270.01050.000072
513A13,509707403.8265.960.3160.05480.0000030.00490.000005
344705116.5388.40.90452.430.1190.05510.0000020.00740.000003
344A976010.35320.5657.010.0530.05450.0000010.00580.000002
Metamorphite
52236.50.01116.970.00538.900.0110.46490.0000371.06570.000050
522A32.20.001016.720.000738.820.0020.51900.0000101.20530.000032
63753.30.00417.780.00238.970.0040.33390.0000080.73170.000027
637A46.70.005917.490.00138.990.0030.37470.0000330.83530.000087
62640,711306380328.636.020.2540.09340.0000020.00090.000001
626A24,862132.8231312.3435.940.1410.09300.0000060.00140.000004
437B235,35841,20014,209248058.426.560.06040.0000030.00030.000011
Hydrothermal
53094.90.00419.780.001040.470.0030.20860.0000040.42660.000013
530A66.50.00199818.420.000640.490.0010.27710.0000030.60910.000010
531101.30.01820.100.002240.330.0040.19840.0000180.39810.000065
531A92.60.00319.680.000740.320.0020.21250.0000020.43530.000008
62389.00.01319.510.002440.460.0050.21900.0000080.45440.000022
623A61.40.05818.220.006140.450.0150.29650.0002020.65850.000640
624151.00.05422.430.006640.400.0070.14850.0000130.26760.000065
624A104.70.01820.200.002940.250.0060.19290.0000110.38450.000032
Collapsed Breccia
1304B426.10.66238.040.05539.110.0590.08930.0000300.09170.000073
Sandstone
625110.20.01420.350.00338.550.0050.18460.0000070.34960.000018
625A98.20.00519.770.001138.520.0030.20130.0000050.39240.000013
815B8430.6158.730.03938.510.0230.06960.0000060.04560.000014
Note: A = altered; B = bulk.
Table 4. Isotopic Pb ratios obtained by laser ablation (LA) MC-ICP-MS and wt% UO2 and PbO determined by electron microprobe (EMP).
Sample_Location206Pb/204Pb207Pb/204Pb208Pb/204Pb207Pb/206Pb208Pb/206Pbwt% UO2wt% PbO
Intrusive
334_1794,93813,465514572910191420.05420.0000140.010760.0000371.13.64
334_21123,51153,6646688290420108540.05420.0000040.016380.0001978.34.04
334_26118,34929,4866395159411732920.05400.0000030.009910.00000283.13.84
334_3147,991784380034231083570.05410.0000030.007320.00000266.75.42
334_224740.8640.150.0543.570.020.08470.0000560.091860.0001336.50.86
336_1a36,40669,797196837624849180.05400.0000050.013150.00002--
336_241,74476,285225141325499920.05400.0000050.012970.00002--
336_3122,92581,79066354425165410940.05400.0000040.013320.00001--
336_478,763152,57042528245101919910.05400.0000050.013060.00001--
336_584,11470,387453538019628020.05390.0000050.011400.00002--
336_6188,717112,46110,1896082217112330.05400.0000070.010410.00001--
344_5732,5701274173867.21263.710.05340.0000230.003910.0000490.24.11
344_744,7421735238292.21344.250.05320.0000090.003050.0000388.14.09
344_12136,30375,079721639762931610.05290.0000040.002130.00000585.94.69
344_2817,53220294210.8072.10.680.05370.0000110.004120.0000289.83.53
344_2117,20231192316.33730.810.05370.0000220.004290.0000488.14.14
Metamorphite
522_838.50.0117.00.00138.790.0020.44140.0001301.006480.0003467.81.33
522_1738.40.0217.00.00238.760.0040.44200.0002361.008170.0005960.42.46
522_2739.70.0517.10.00338.780.0020.43010.0005210.978020.0013348.31.50
522_1037.30.0416.90.00238.740.0020.45310.0004711.038110.0012074.56.12
637_15a66.160.00818.390.002438.940.00510.27790.0000290.588590.00005--
637_1661.640.00618.170.001938.940.00370.29480.0000230.631720.00004--
637_21b60.630.00618.120.001638.940.00350.29890.0000210.642250.00004--
637_11a59.900.00718.090.001738.940.00370.30190.0000290.650060.00006--
626_167,06028246079255.136.581.550.09070.000030.000540.000003--
626_240,72918313823172.336.281.240.09390.000060.000900.00002--
626_367,97723306266213.935.411.220.09220.000020.000520.000003--
626_453,42632594897300.236.692.260.09170.000070.000690.000004--
626_553,37825284971235.539.281.920.09320.000030.000720.00001--
626_653,83730614969282.637.202.130.09230.000040.000690.000004--
626_755,10436175121337.940.882.770.09290.000320.000730.000003--
626_871,44713,2046632122833.566.680.09280.000050.000480.000002--
626_972,5125969685356438.303.160.09450.000040.000530.000001--
626_1044,30519,1533991172726.2911.130.09010.000040.000580.00001--
626_1110,24914,152955.2132011.567.460.09320.000060.000900.00001--
626_12529.71707646.4686601.253.380.09310.000090.000460.00001--
626_1349,4352727456824740.602.240.09300.000290.000820.000002--
626_1458,4443162548729742.142.280.09390.000040.000720.000002--
626_1558,4763616549034039.112.600.09380.000040.000660.000002--
437_12852066,7895084026-0.371.540.06020.0000070.000020.00000188.57.10
437_17187,980128,04511,34077186.825.110.06030.0000070.000040.000000486.57.21
437_2836,30765,603217839471.491.490.06000.0000090.000020.00000188.97.22
437_1976,32871,136460142813.963.980.06030.0000070.000060.00000187.97.35
437_2040,12161,256241936920.690.860.06030.0000060.000010.00000188.26.89
Hydrothermal
530_12130.11.1921.430.06540.510.040.16490.0010620.311850.0029076.70.51
530_15143.60.0622.150.00640.440.010.15420.0000290.281510.0000787.71.32
530_8149.20.1322.410.00740.410.010.15020.0000950.270920.0002489.31.15
530_19141.40.0922.020.00640.440.010.15580.0000670.286080.0001886.11.52
530_25133.90.6121.630.03040.480.010.16160.0005160.302480.0013882.20.74
531_5125.80.4721.30.02240.400.0050.16950.0004570.321410.0012186.41.16
531_1137.80.4321.90.02040.380.010.15890.0003520.293180.0009283.81.17
531_1086.50.4319.50.02140.560.010.22500.0008840.469190.0023383.90.12
531_22103.50.0820.20.00540.390.0040.19530.0001190.390310.0003187.71.39
531_21113.20.3020.70.01540.410.010.18260.0003500.357030.0009385.11.59
623_18105.40.2420.230.01340.350.0110.19190.0003260.382860.0008883.70.42
623_22130.10.1321.420.00740.500.0070.16460.0001100.311300.0003084.12.16
623_37153.80.0822.590.00540.470.0070.14680.0000500.262980.0001383.61.91
623_34135.30.0421.740.00440.430.0070.16060.0000380.298690.0000974.81.48
623_43144.00.1522.110.00940.420.0090.15360.0001160.280790.0003173.71.56
624_20132.80.2721.490.01440.220.0070.16180.0002340.303070.0006064.51.49
624_15137.10.0521.770.00940.450.0190.15870.0000190.295040.0000567.31.00
624_7145.30.0722.160.01140.450.0200.15250.0000170.278310.0000476.91.31
624_22151.20.1022.490.01440.590.0250.14880.0000410.268490.0001282.81.89
624_a179.10.1723.790.01440.550.0190.13290.0000670.226320.00018--
Collapsed Breccia
1304_1536.41.344.070.0638.850.040.08220.00010.072400.000281.81.30
1304_6559.01.545.820.0838.830.050.08190.00010.069560.000266.31.18
1304_4541.02.844.440.1138.780.050.08220.00030.071790.000472.61.20
1304_9724.85.552.950.2838.790.050.07300.00020.053620.000478.71.52
1304_2567.01.645.400.1238.800.050.08000.00020.068440.000283.81.35
Sandstone
625_27109.90.0320.270.00238.490.0040.18440.0000340.350170.0000862.61.19
625_4115.40.0920.540.00538.460.0060.17790.0001030.333220.0002773.31.21
625_15122.30.0920.890.00738.510.0120.17090.0000860.315030.0002293.50.05
625_9122.30.1320.890.00938.500.0110.17080.0001240.314790.0003386.70.13
625_30111.30.0920.340.00638.490.0080.18290.0001040.346000.0002780.70.02
Note: wt% UO2 indicates if the analysis was taken for a pristine or altered region; (-), not analyzed; 626 analyses were previously obtained by Balboni [56].
Table 5. Sr and U isotopic compositions obtained by SM-MC-ICP-MS.
Sample87Sr/86Sr84Sr/86Sr85Rb87Rb/86Sr87Sr/86SrinitialƐSr235U/238U238U/235U234U/238U234U/235U235U/234Uδ238Uδ234U
Intrusive
334--------0.00727137.615.441 × 10−50.00749133.55−1.76−10.28
334A0.714400.000010.056400.000020.000510.110.7138221.10.00726137.725.335 × 10−50.00735136.10−0.95−29.40
3360.716530.000040.056210.000050.000070.110.7159524.1-------
513A0.719840.000030.056210.000070.000130.250.7185527.90.00726137.735.400 × 10−50.00744134.41−0.87−17.60
3440.726100.000010.056240.000040.000250.150.7254237.70.00726137.705.432 × 10−50.00748133.71−1.12−11.75
344A--------0.00725137.845.481 × 10−50.00756132.25−0.09−2.82
Metamorphite
5220.733620.000070.054750.000080.001830.050.7332048.80.00725137.895.282 × 10−50.00728137.270.28−39.05
522A0.730360.000010.056510.000010.000351.440.7195329.20.00726137.815.757 × 10−50.00794125.99−0.2647.35
6370.764510.000020.056340.000020.000530.340.7641893.10.00725137.855.450 × 10−50.00751133.12−0.03−8.62
637A0.754170.000020.056280.000020.000570.270.7539278.40.00726137.745.332 × 10−50.00734136.16−0.79−30.05
6260.741010.000050.054710.000050.002420.430.7318946.90.00727137.565.351 × 10−50.00736135.90−2.08−26.63
626A0.733790.000050.055540.000060.000710.700.7187828.20.00727137.505.500 × 10−50.00756132.21−2.520.63
437B0.712080.000070.054270.000380.001830.040.7117618.10.00726137.825.506 × 10−50.00759131.78−0.221.66
Hydrothermal
5300.723360.000020.056450.000010.000620.390.7228334.00.00725137.855.241 × 10−50.00722138.470.00−46.60
530A0.724540.000010.056340.000010.000462.510.7211331.50.00726137.725.483 × 10−50.00756132.35−0.96−2.61
5310.724220.000010.056400.000020.000310.210.7238435.40.00726137.795.261 × 10−50.00725137.88−0.43−43.01
531A0.724780.000010.056200.000040.000960.180.7244636.30.00726137.685.608 × 10−50.00772129.54−1.2420.11
6230.723580.000010.056440.000010.000320.310.7234234.80.00726137.695.141 × 10−50.00708141.22−1.19−64.69
623A0.724430.000010.056610.000010.001280.780.7240435.70.00726137.765.563 × 10−50.00766130.49−0.6512.00
6240.723300.000010.056420.000010.001200.330.7228033.90.00726137.705.225 × 10−50.00720138.94−1.11−49.46
624A0.723180.000020.056390.000010.000310.550.7223433.30.00725137.995.488 × 10−50.00757132.071.00−1.72
Collapsed Breccia
1304B0.715550.000020.056460.000010.000551.970.7124019.10.00726137.745.366 × 10−50.00739135.28−0.81−23.78
Sandsonte
6250.711130.000020.056040.000040.000450.360.7105916.50.00725137.985.201 × 10−50.00718139.290.95−53.84
625A0.710600.000020.056550.000010.000420.300.7101415.80.00734136.195.532 × 10−50.00754132.71−12.016.45
815B0.710160.000010.056390.000020.000410.180.7097115.20.00725137.855.413 × 10−50.00746133.99−0.03−15.25
Note: (-), not analyzed; italicized number indicates an initial 87Sr/86Sr value derived from literature data; A, altered; B, bulk.

