Article

Rare Earth Element Determination in Uranium Ore Concentrates Using Online and Offline Chromatography Coupled to ICP-MS

1
Chemical Sciences Division, Oak Ridge National Laboratory, Oak Ridge, TN 37830, USA
2
Chemistry Department, University of Missouri, Columbia, MO 65211, USA
*
Author to whom correspondence should be addressed.
Minerals 2020, 10(1), 55; https://doi.org/10.3390/min10010055
Submission received: 17 December 2019 / Revised: 3 January 2020 / Accepted: 4 January 2020 / Published: 8 January 2020
(This article belongs to the Special Issue Nuclear Forensic Applications in Geoscience and Radiochemistry)

Abstract

:
The determination of trace elements, particularly rare earth elements, in uranium ore concentrates (UOCs) is important as the pattern can be indictive ore characteristics. Presented here is a methodology for accurately quantifying rare earth elements (REE) in UOCs. To improve the measurement uncertainty, isotope dilution mass spectrometry (IDMS) was utilized over other quantification techniques such as external calibration or standard addition. The isotopic determinations were measured by inductively coupled plasma-mass spectrometry (ICP-MS). To obtain high-fidelity isotopic measurements, separation of the REE from the uranium matrix was achieved by high-performance ion chromatography (HPIC), reducing the isobaric interferences. After separation, the target analytes were analyzed in two different modalities. For high precision analysis, the separated analytes were collected and measured by ICP-MS in an “offline” fashion. For a rapid approach, the separated analytes were sent directly into an ICP-MS for “online” analysis. These methods have been demonstrated to accurately quantify the REE content in a well-characterized UOC sample.

1. Introduction

Uranium is distributed at low concentrations (1–2 µg g−1) throughout the earth’s crust [1,2] and is commonly found in certain mineral deposits such as sandstone and quartz pebble conglomerate [1,3]. Mineral deposits with elevated uranium composition containing up to 2000 µg U g−1 is commonly referred to as low-grade uranium ore. In rare cases uraninite ore can be found (e.g., Canada) which contain up to 70% U, by weight [2]. Most of the world’s supply of uranium comes from low-grade uranium mineral deposits which need to be extracted and concentrated [1].
After the uranium has been extracted, high levels of trace elements are commonly present. These trace elements can vary based on the mineral type, processing equipment, as well as chemical reagents used in the leaching process. Depending on the intended use of the uranium, impurities in the uranium ore concentrate (UOC) may be removed by precipitation and subsequent rinsing [1]. However, rare earth elements (REE) can persist through the production process. The REE pattern is not typically perturbed during chemical processing; hence it may provide information regarding the ore location [3,4,5,6,7,8]. For example, unconformity type ores tend to have lower concentrations of light REEs than heavy REEs [9]. Because of this, measuring the concentrations of REEs accurately is important in the field of forensics. Additionally, the presence/absence of REEs could provide information regarding the production method. After fuel consumption, REEs are produced through fission (e.g., Nd and Hf) can be determined to model reactor flux in the core during operation.
REEs are traditionally measured by inductively coupled plasma-mass spectrometry (ICP-MS) through external calibration with matrix-matched standards. This methodology suffers from complexity due to matrix interferences, lack of matrix-matched certified reference materials, and preparation effects which can increase measurement uncertainty [10,11]. Isotope dilution mass spectrometry (IDMS) is an alternate quantitative approach that can reduce these uncertainties. IDMS is a primary method for quantifying elemental concentrations in samples through isotopic ratios that offers high precision and accuracy and can also be traceable to certified reference materials [12,13]. Isotope dilution consists of gravimetrically adding a known amount of an enriched isotope to perturb the analyte’s isotopic composition. This change in the isotope ratio is then measured to determine the analyte concentration using Equation (1). Where A refers to the concentration of the enriched isotopic spike, B refers to the concentration of the sample, s refers to the spike, n refers to the unknown, and m refers to the mixture of the two. This method has been proven to produce accurate results in various sample matrices [10,12,13,14].
B n A s = 1 ( B A ) s ( A B ) m ( A B ) m ( A B ) n ,
The major drawback to IDMS is that multiple isotopes must be accurately measured for each analyte of interest, which can be problematic for REEs due to isobaric interferences. In order to accurately quantify REEs by IDMS, the element of interest should be separated from other mass interfering REEs and the uranium matrix [15]. Separating the analytes from the uranium matrix is especially important because heavy ions traverse more efficiently through the sample/skimmer cones of the ICP-MS than lighter ions. Therefore, a greater population of heavy ions will depress the lighter ions and cause a reduction in sensitivity [16].
Various resins such as TRU (TRansUanium) and UTEVA (Uranium and TEtraValents Actinides) are used to separate trace elements from uranium matrices [17,18,19,20,21], but these extraction resins do not separate the individual REEs from each other. Ion chromatography has been used to separate actinides and uranium fission products since the 1980s, and subsequently has been applied to REEs separations in environmental samples and uranium material such as nuclear fuel or irradiated material [14,22,23,24,25]. Recently, methods using high-performance ion chromatography (HPIC) have been developed to separate a wide variety of elements, including REEs, from various sample types including spent nuclear fuel [14], sediment and soil samples [26,27], irradiated highly enriched uranium targets [28], and transplutonium elements created from an irradiated californium target [29]. Often, HPIC uses a cation exchange column to separate lanthanides based on charge density. Elements with a higher charge density, and smaller cation radii, are more strongly retained by the anions in the column and are eluted later than elements with lower charge density [30,31]. HPIC can be used in conjunction with ICP-MS to analyze the trace REE components after separation. The HPIC system can either be directly connected to the ICP-MS for measurements of isotopes as they elute from the column (online) or the REE fractions can be collected and subsequently analyzed (offline).
The goal of this study is to develop a methodology to separate and quantify REEs present in UOCs accurately and with low measurement uncertainty. Here, REEs were examined in a UOC reference material by IDMS. The separated analytes were measured by ICP-MS directly after being eluted from the column (on-line) and, for comparison purposes, fractions were collected and analyzed off-line. Here, the two methods, offline and online HPIC-ICP-MS, were used to compare the precision and accuracy of the methodology.

2. Materials and Methods

2.1. Chemicals and Reagents

All samples and reagents were prepared with Fisher Chemical Optima grade acids (nitric, HNO3 and hydrochloric, HCl) and ultrapure water (18.2 MΩ·cm) obtained from a ThermoScientific (Waltham, MA, USA) Barnstead GenPure xCAD Plus water purification system. The reagents utilized for the HPIC separations included 0.1 M oxalic acid (C2H2O4, 99.999% trace metals basis, recrystallized, Sigma-Aldrich Co., St. Louis, MO, USA) and 0.1 M diglycolic acid (DGA, C4H6O5) (recrystallized) (>98% Acros Organics, Morris Plains, NJ, USA), both buffered to a pH of 4.8 with ammonium hydroxide (NH4OH, 20–22% as NH3, trace metals grade, Fisher Scientific). Standard solutions for quantification were prepared from stock solutions (ICP-MS-68B-A, High Purity Standards, Charleston, SC, USA). The reference material utilized for these studies was a UOC (CUP-2) produced at the Blind River uranium refinery in Canada. This reference material (approximately 75% U by weight) has recommended values for several trace elemental impurities, none of which include REEs. CUP-2 characterization data for REEs presented here will be compared to previously reported results [32]. The high levels of REEs present, while not certified, make CUP-2 an ideal quality control sample that has been utilized in several inter-laboratory programs.

2.2. Enriched Stable Isotope Spikes

Enriched stable isotope spikes were obtained from the National Isotope Development Center at Oak Ridge National Laboratory (ORNL). These isotopes were dissolved with HNO3 using a CEM Discover SP-D microwave (Mathews, NC, USA) in a polytetrafluoroethylene (PTFE) lined quartz digestion tube sealed with PTFE lined caps. Each digestion was prepared gravimetrically and weighted before and after digestion. After digestion, the spikes were diluted to a final concentration of approximately 1–2 mg g−1 solution. For the IDMS quantification, the sample was spiked with a known amount of an isotopically enriched standard, in order to achieve approximately a 1:1 ratio between the two isotopes being compared. The standards used for spiking were enriched with the following isotopes: 148Nd (93%), 150Sm (87%), 151Eu (96%), 152Gd (28%), 160Dy (79%) 164Er (63%), 173Yb (95%), and 176Lu (83%). The concentrations of the spike solutions were determined through reverse-IDMS with a known concentration of NIST traceable, natural abundance, single element standards (High Purity Standards, Charleston, SC, USA). These isotopic measurements were determined by a Neptune (Thermo Instruments, Bremen, Germany) double-focusing multi-collector (MC-)ICP-MS, which was equipped with nine faraday collectors and one secondary electron multiplier, as previously described [10].

2.3. Instrumentation

A ThermoScientificTM Dionex ICS-5000+ HPIC system (Sunnyvale, CA, USA) utilizing an AS-AP autosampler was employed for REE separations. This autosampler is unique in that it also has fraction collector capabilities. In this configuration, the autosampler needle is used initially to collect and inject the sample onto the column. After separation, the eluent is subsequently re-routed through the probe into respective fraction collection vials. This HPIC system is equipped with two quaternary gradient mixing pumps. Samples were loaded via 100 µL injection. Chromatographic separation of REEs was achieved using an IonPac CG5A guard column and a 250 × 4 mm IonPac CS5A analytical column. The CS5A column contains both cation and anion exchange sites, with sulfonic acid and alkanol quaternary ammonium functional groups.
Offline analysis of the separated REE fractions was performed by ICP-MS. The iCAP RQ (Thermo Scientific, Bremen, Germany) was used to optimize the initial separations and collection times. The Element 2 (Thermo Scientific, Bremen, Germany) was utilized for precise isotope ratio measurements to quantify the REEs within the reference material by IDMS. Final separated fractions were introduced through a self-aspirating nebulizer (100 µL min−1) into a stable sample introduction (SSI) dual quartz spray chamber housed within a PC3 Peltier Cooler (Elemental Scientific Inc., Omaha, NE, USA).
Online separations were performed on a hyphenated HPIC-ICP-MS system comprised of a Dionex ICS-5000+ HPIC system coupled to a Thermo Scientific iCAPQ quadrupole ICP-MS. This chromatographic system consisted of a metal-free HPIC pump gradient mixing capabilities for up to four eluents, a 50 µL injection loop, an IonPac CS5A column with an IonPac CG5A guard column, and a thermal compartment set at 35 °C to ensure consistent elution times. Throughout the experiment, the eluent flow rate was at a fixed rate of 1 mL min−1. The columns were connected to the nebulizer of the ICP-MS using poly-ether ether ketone (PEEK) tubing via a mixing tee-piece. Nitric acid (HNO3, Optima, 5%) was pumped into the mixing tee-piece at 0.1 mL min−1 to acidify the eluent, post-column, prior to nebulization to aid in ionization and to increase analytical stability. The iCAP Q was fitted with a high solids nebulizer and a high matrix skimmer cone insert (3.5 mm).
All online measured isotope ratios reported reference the integrated isotopic peak areas in a transient signal using an m/z trace and a pre-determined elution time. Thermo Fisher Scientific Qtegra software package was employed for the analysis, signal smoothing, and peak fitting. Signal smoothing enabled the fitted peak areas between isotope peaks from the same element to be compared, yielding isotopic ratios in atom percent. The peak fitting and smoothing settings applied to determine peak area, found within the “Peak Detection” settings of the Qtegra software, are as detailed previously [27,28,33]. Where slight peak overlap occurred for Yb and Lu the isobaric peaks were statistically deconvoluted using the “multiple peak fitting” function of the OriginLab® OriginPro® 2018 graphing software (OriginLab Corporation, Wellesley Hills, MA, USA). A Gaussian function together with a Levenberg Markquardt iteration algorithm was employed and a natural mixed lanthanide standard was employed as a control.

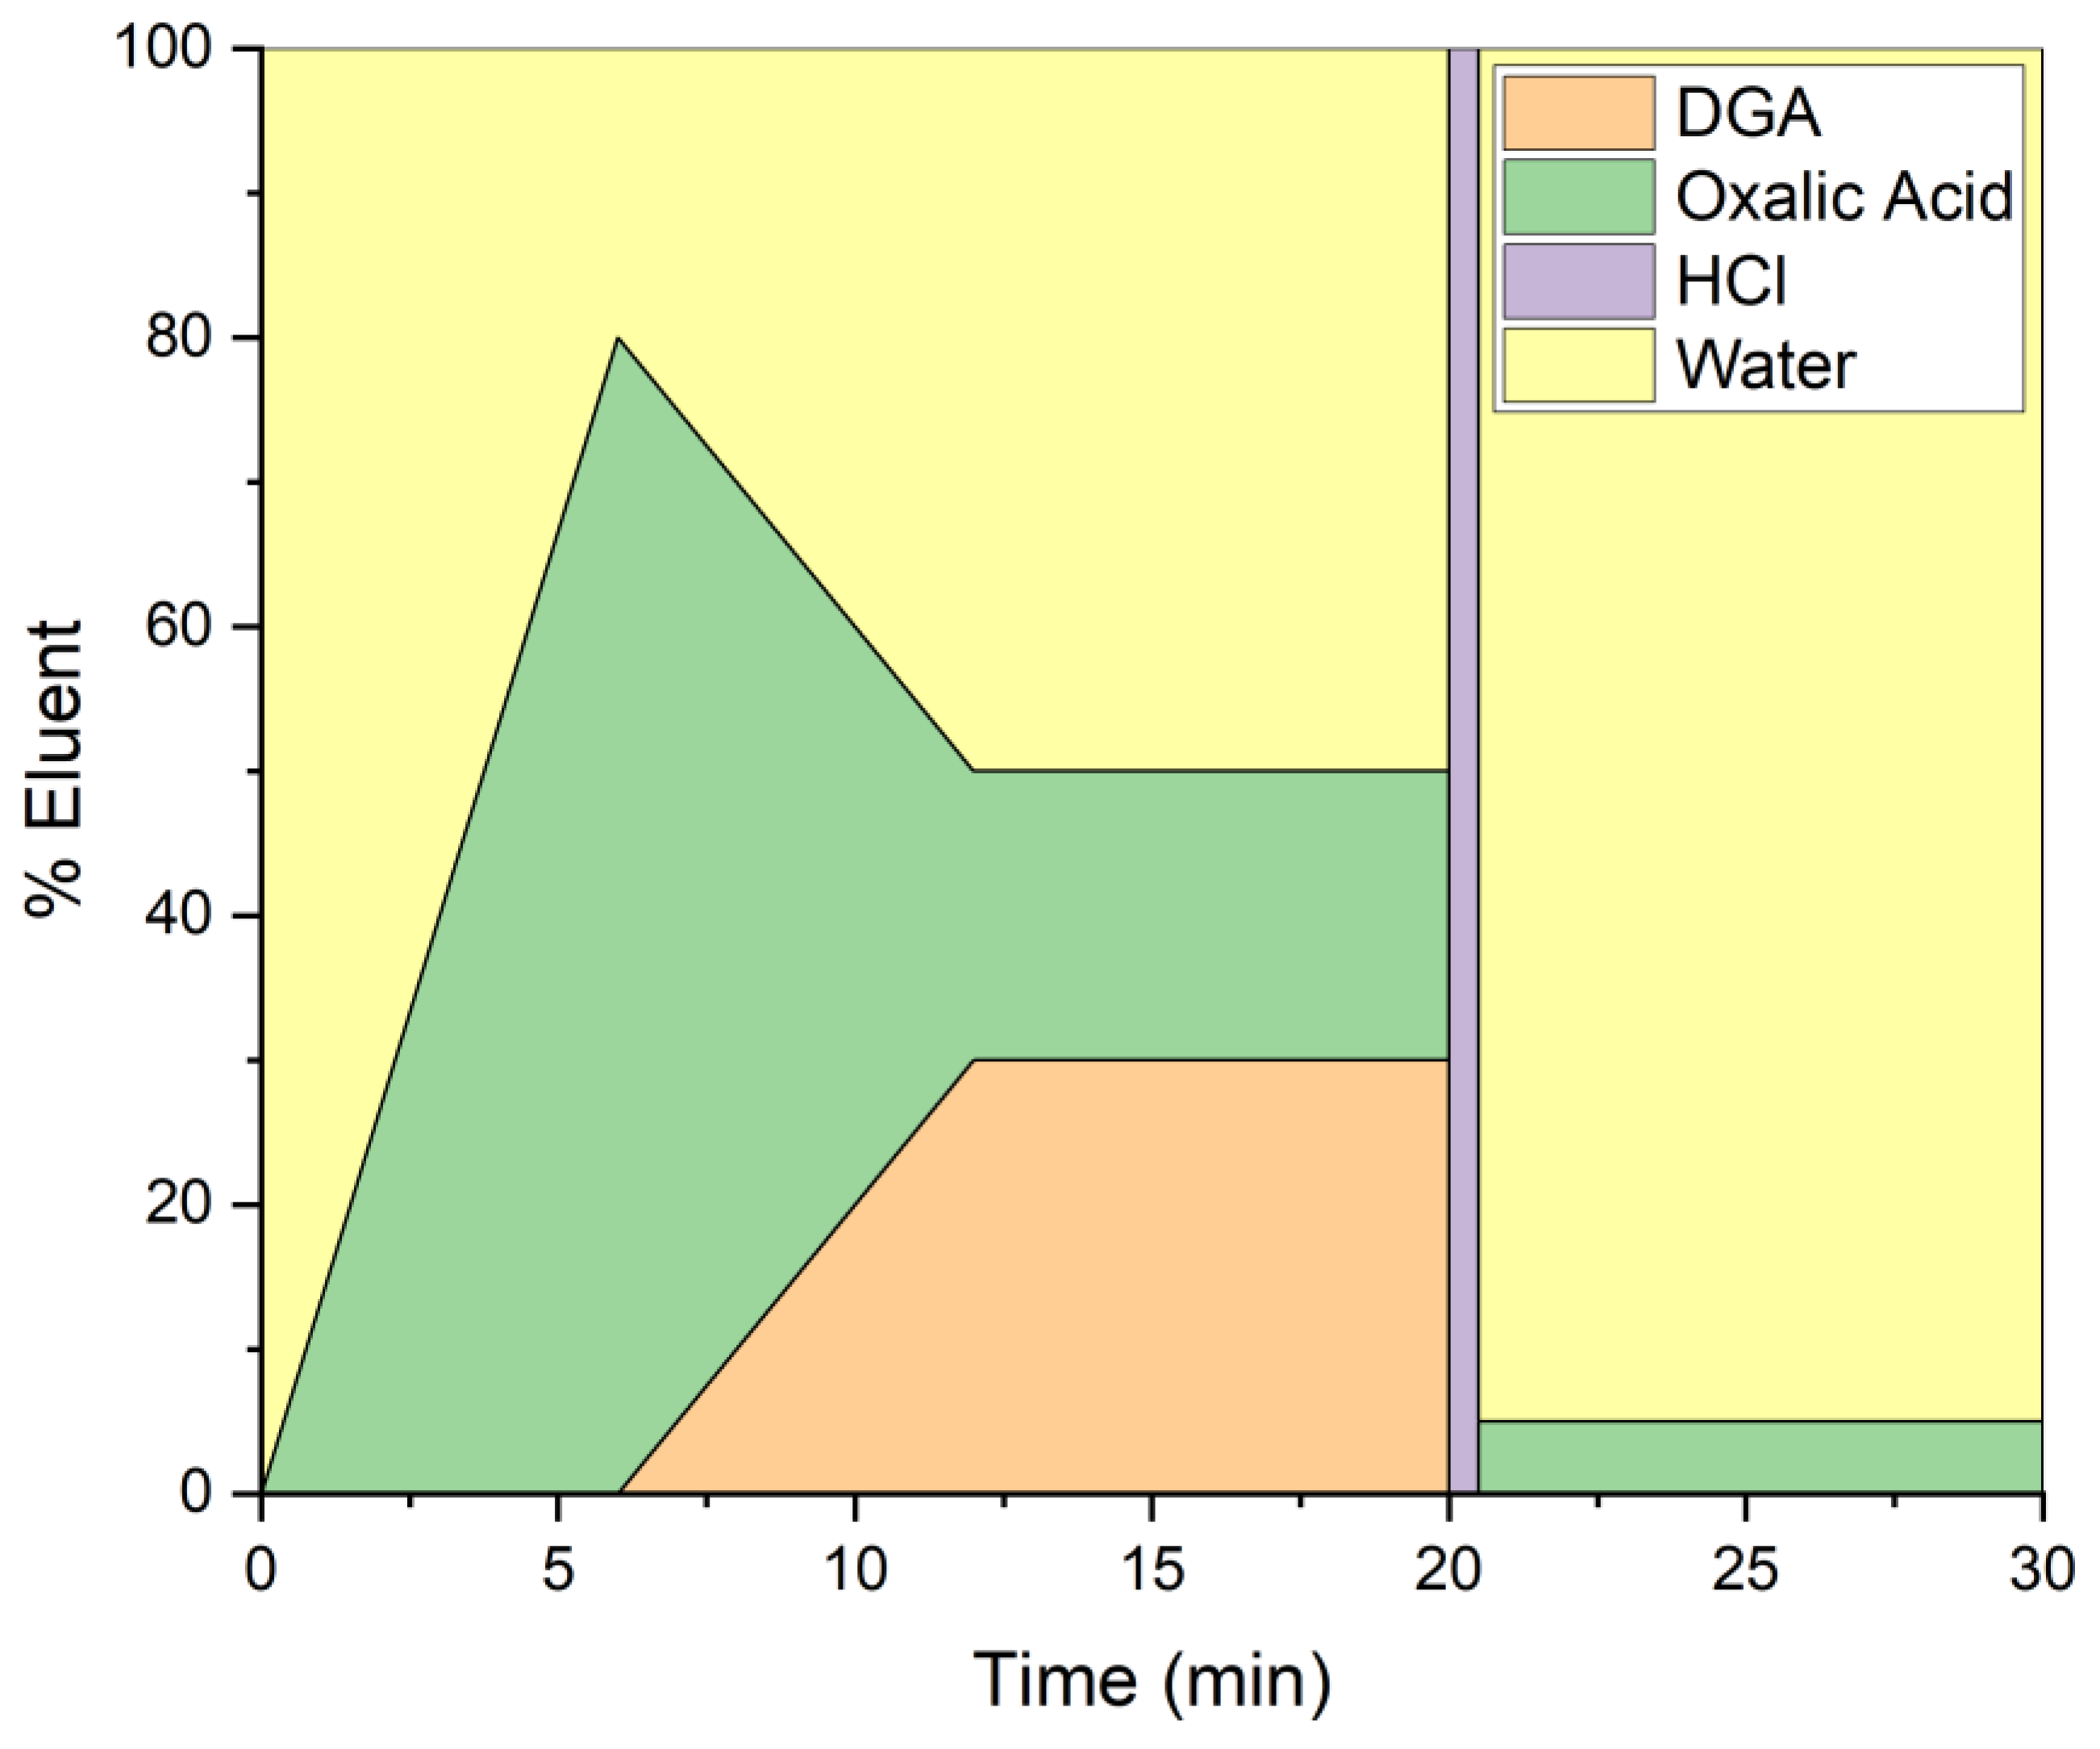
2.4. HPIC Separation

The offline separation protocol was adapted from Roach et al. [28]. Each injection had ~30 min separation (1 mL min−1) which included a 5 min washing step (5% oxalic acid and 95% water) at the end of the separation. The sample was loaded onto the column in water and then followed an elution profile seen in Figure 1 to separate the REEs. The uranium matrix was subsequently removed. Fractions were collected in 30 s increments starting at 6 min, which is when the oxalic acid eluent was first introduced to the column, for a preliminary screen to determine elution time. Subsequently, fractions were collected only at the times that each element was eluted from the column.
The online separation scheme, due to the requirement of complete peak resolution and cleaner baselines for signal processing, employed a slightly modified version of that used for the offline separation. These modifications included a 15% decrease in DGA from 14–16 min, and an extended HCl column cleaning and uranium removal stage. A five-fold dilution of the spiked UOC sample was injected and a natural lanthanide standard was measured alongside the sample to determine mass bias using a previously reported method [33].

3. Results and Discussion

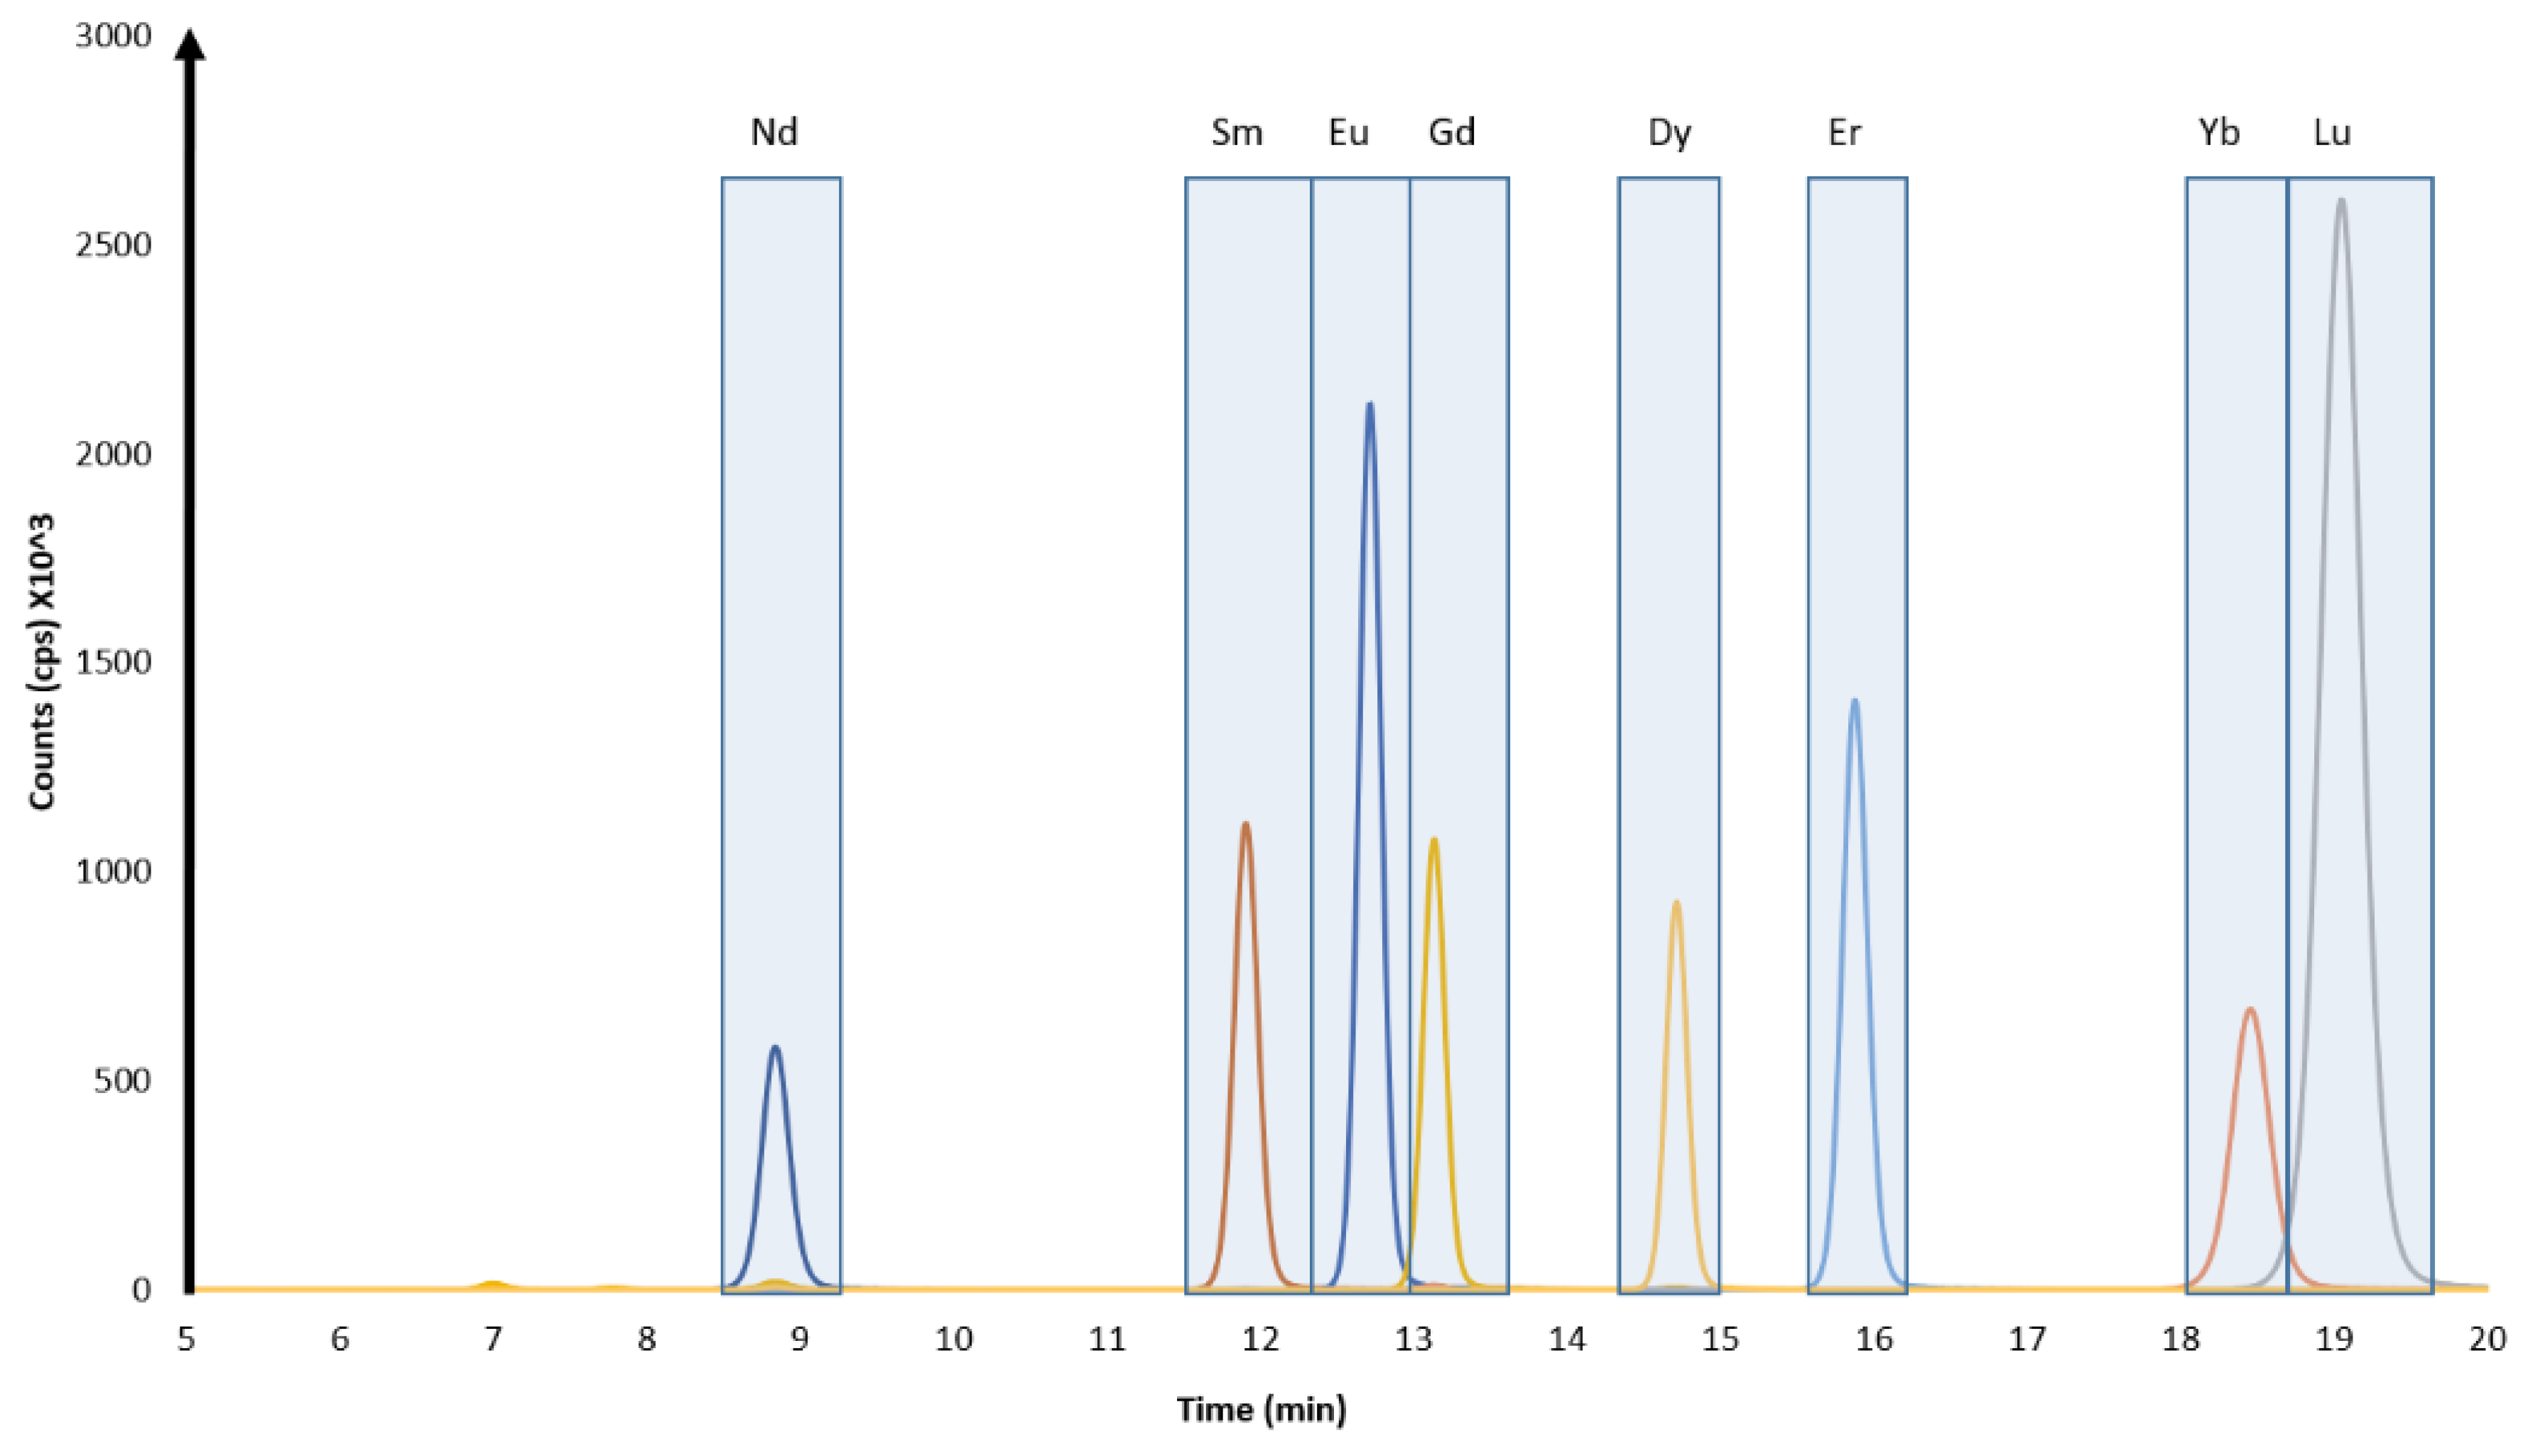
3.1. Chromatographic Separations

The separation of REE within a U sample is vital due to the amount of isobaric and polyatomic interferences which could be present (Table 1). For IDMS measurements two isotopes of each element are needed making the separation of these interferences even more important. For example, the measurement of 164Er has a direct isobaric interference with 164Dy (28% natural abundance). In addition to isobaric interferences, polyatomic interferences (148Nd16O) are created which increases the complexity with the 164Er measurement. While there are other polyatomic interferences that could be present (i.e., hydrides), oxides are the predominant species that hinder the measurement. The REE suite has significant isobaric and polyatomic interferences, hence separation is vital for precise isotope ratio measurements.
To eliminate the interference effects for the IDMS measurement, the REE are separated by an ion-exchange column and elute in order of their atomic radii (largest to smallest) [27,31]. A representative chromatogram of the elution profile of the REEs of interest can be seen in Figure 2. The blue boxes around each peak indicate where each fraction was targeted if offline analysis was warranted. There are two elemental systems where slight coelution in the fractions was observed. The first, Eu and Gd, does not suffer from isobaric interferences between these elements (Table 1) and thus the IDMS calculation is not affected. The second, Yb and Lu (176Yb and 176Lu), requires a correction to remove the Yb counts from the Lu fraction. This correction is made using Equation (2).
C x C y A y A x
In this equation, Cx refers to the counts of the isotope of interest, Cy is the counts from the interfering analyte at an unperturbed mass and its respective abundance (Ay), and Ax is the abundance of the isotope interfering with Cx at the same mass. It is assumed that the isotopes are present in natural abundance. Fraction collection times were set-up with the aim to reduce interferences with the elements of interest. For example, Lu was collected later in time with partial loss of Lu recovery. Absolute recovery is not necessary for quantification as the IDMS ratio being monitored is unchanged.
The HPIC-ICP-MS method was verified using a multi-element solution (ICP-MS-68A-A) spiked with the corresponding REE enriched isotopes for IDMS quantification. The concentration of each REE was determined within the uncertainty of the certified values. This also served to confirm the concentration of the spike isotopes.
This separation was also studied to determine the effects of different uranium sample loading on the chromatography robustness. The uranium samples, ranging between 10–2000 µg g−1, containing µg levels of REE, were run on the HPIC using the method described above. Minor peak shifts (<30 s) were observed in elution times for the REEs between lowest and highest amounts of U loaded onto the column. However, the resolution between REE peaks remained relatively unchanged. The successful separation of REE in a sample containing 200 µg U (100 µL injection), suggests that samples do not need to be diluted prior to separation, which maintains higher concentrations of REEs.

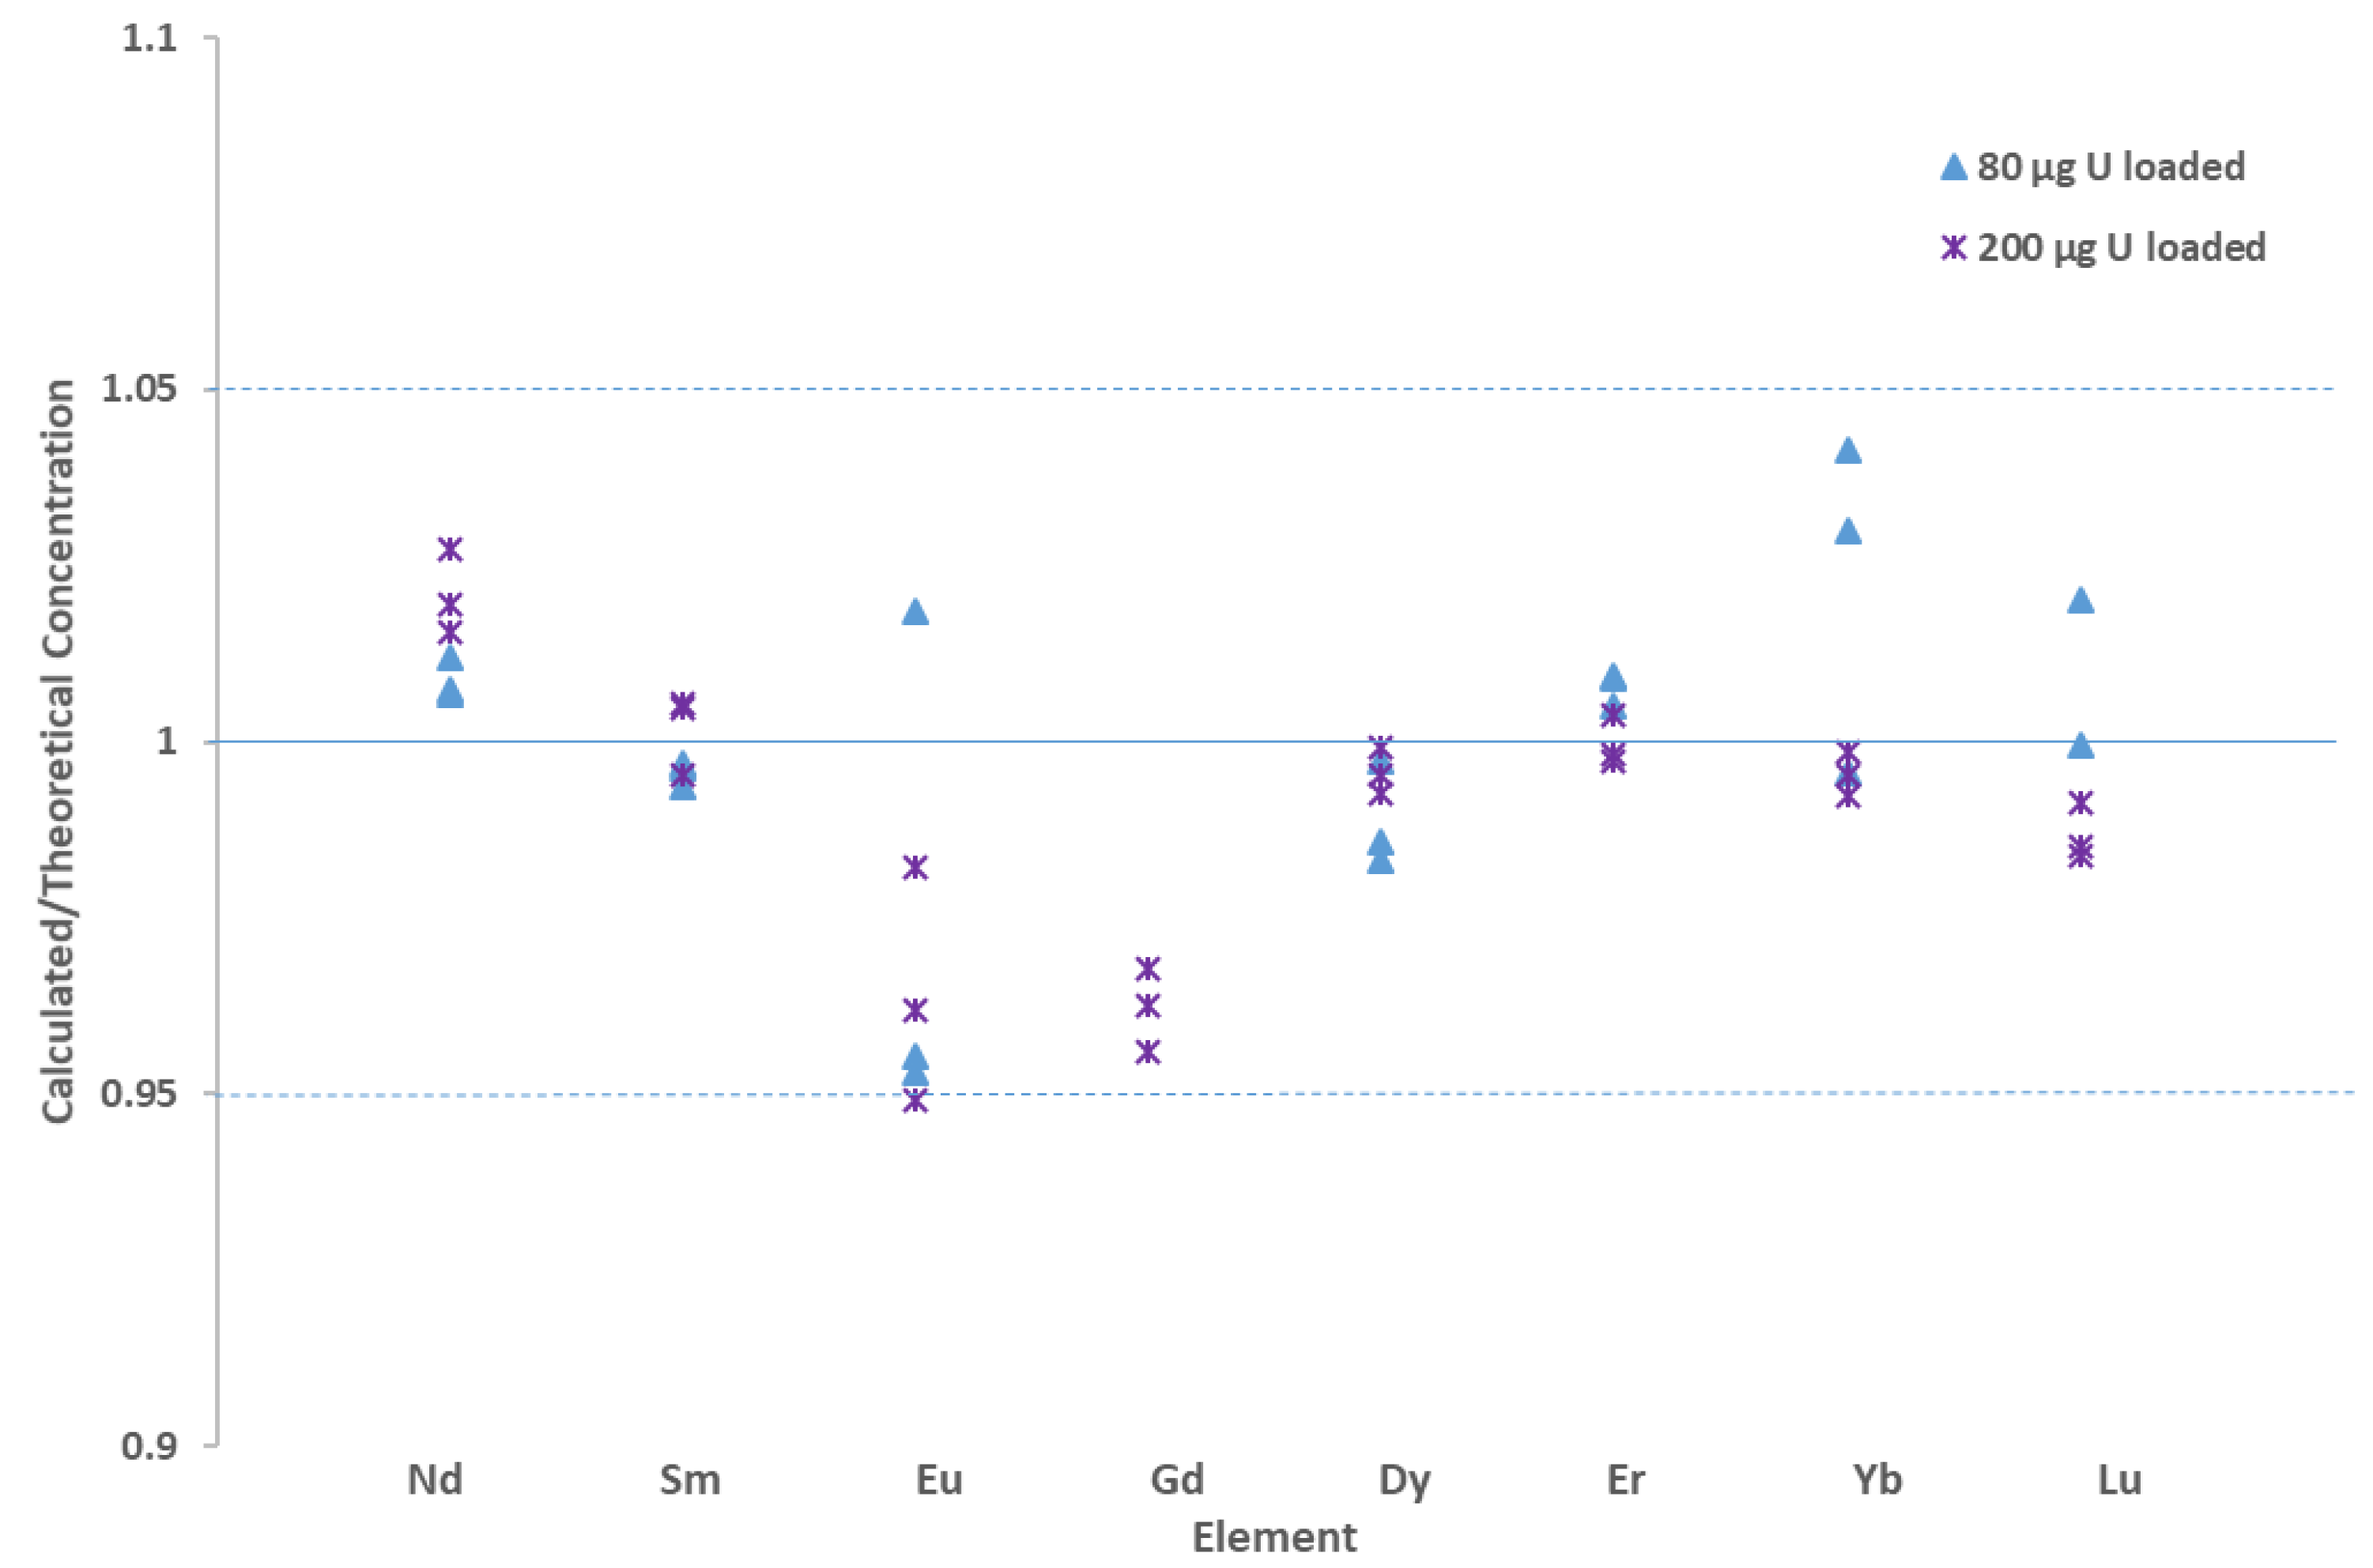
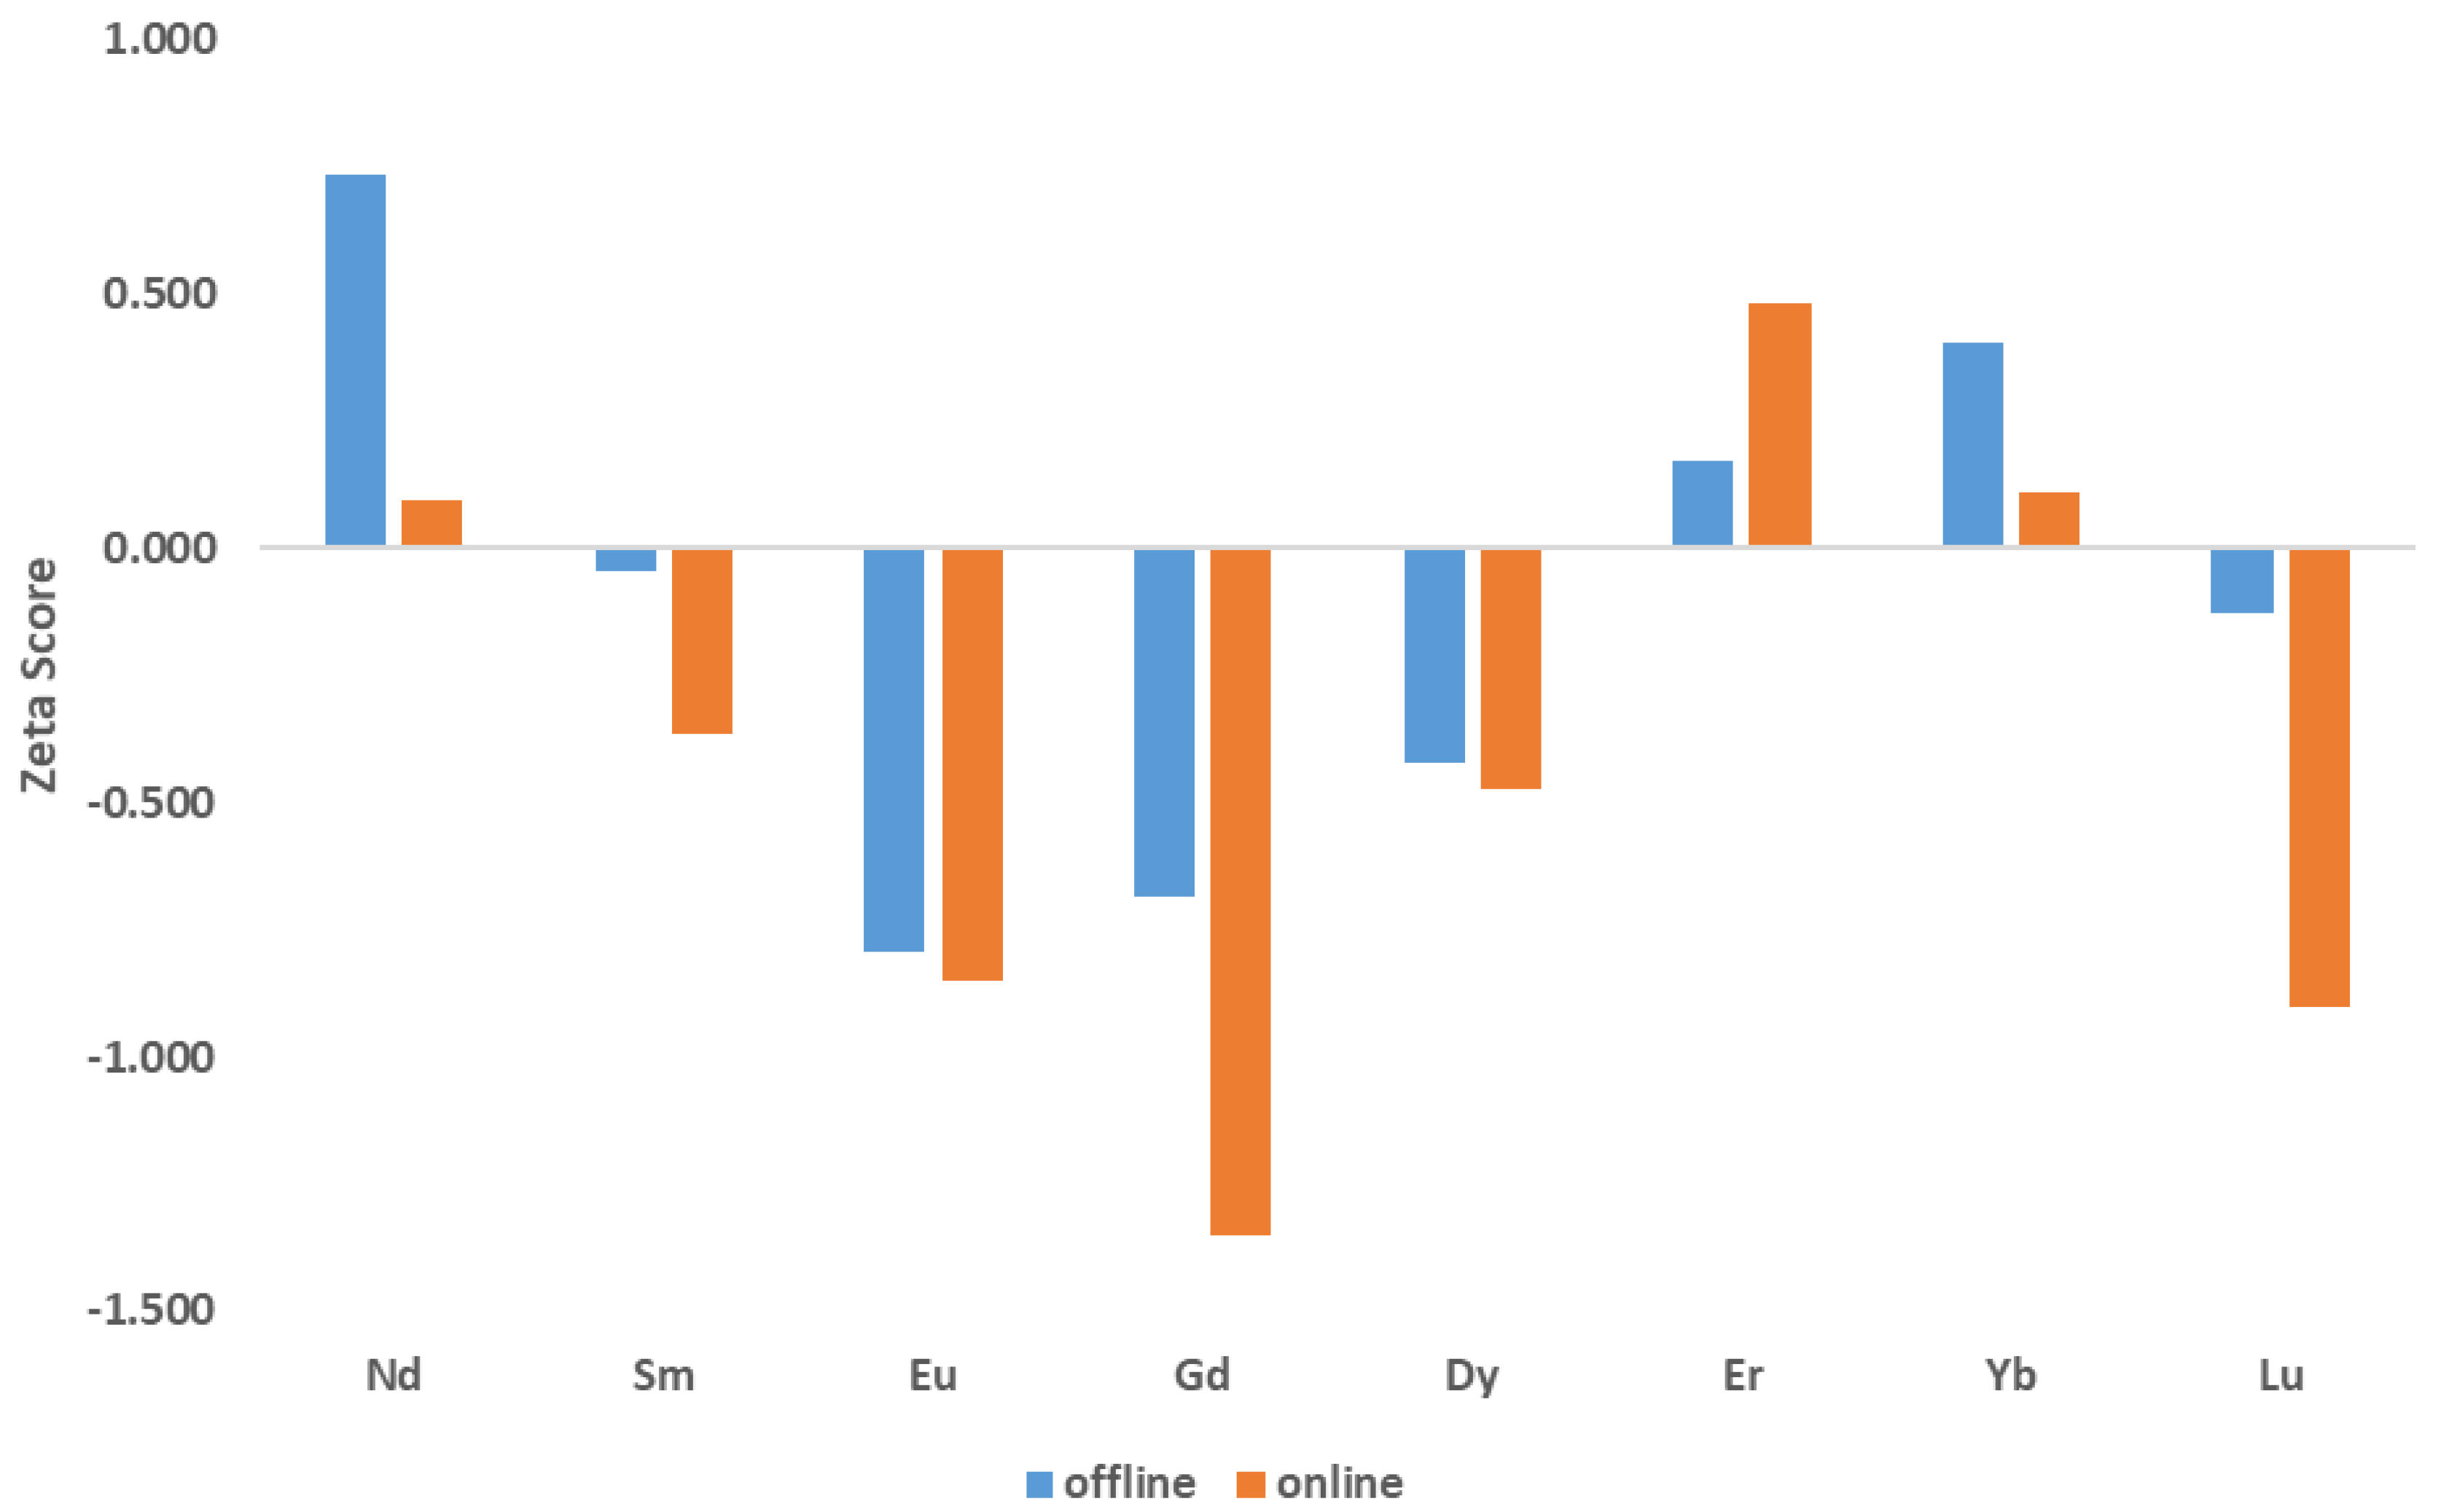
3.2. Offline UOC Separations

A sample of CUP-2 (~4000 µg U g−1 sample) was spiked with various enriched isotopes of REEs, in order to achieve a 1:1 ratio between the quantifying isotope pairs. Two test solutions were created from the spiked CUP-2 stock. These aliquots were made such that 80 µg and 200 µg U were injected onto the column. Method blanks comprised of 2% HNO3 were run between samples using the same HPIC method to test for washout and were utilized as blank subtraction prior to IDMS calculation. A total of eight fractions were collected for the elements being measured, as depicted in Figure 2. The fractions were then diluted 10x with 2% HNO3 to reduce matrix loading and premature wear on ICP-MS consumables. Diluted fractions were subsequently analyzed on a magnetic sector ICP-MS.
Most of the REEs were resolved from isobaric and polyatomic interferences in the CUP-2 sample. Only the Lu fraction had a significant interference present, 176Yb, which comprised approximately 30% of the total 176Lu counts. This interference was corrected (Equation (2)) to account for the Yb contribution. The REE concentrations determined were comparable (<5% relative difference, %RD) to previously reported values [32]. There was a slight improvement with the analysis with the larger mass loading as seen in Figure 3, this is due to the improved counting statistics with the collected REE fractions. There were slight issues with the Gd analysis, at the smaller sample loading, which is somewhat expected with the low natural abundances for the isotopes chosen (152Gd and 154Gd, 0.2% and 2%, respectively). The larger U loading did not negatively impact the overall methodology (separation and analysis). With larger loading, the sample can be directly injected into the HPIC, thus improving the overall method sensitivity.

3.3. Online UOC Analysis

The 4000 µg spiked CUP-2 solution was diluted so that 40 µg of U was injected into the column. For the online analysis, there was a complete resolution between the REE with the exception of the Lu/Yb pair. As with the offline separation, Lu was the only element that was not fully separated from its isobaric interferences (176Yb) and was statistically deconvoluted prior to the IDMS calculation. The expanded uncertainty associated with the measurement (2σ) of the online analysis was higher (~2x) than the offline measurements (Table 2). This is due to the lack of replicate measurements during online analysis that offline analysis provides. It should be noted that the uncertainty associated with the IDMS spiking (i.e., uncertainty in the spike concentration) was not included in this expanded uncertainty determination, as the sample was the same for each measurement. In general, the concentration of REEs calculated through the offline and online methodologies agreed closely and were similar to previously reported concentrations.
The REE concentrations found using the methods described here were also compared to previously reported values [32] through zeta scores (ζ) which were calculated according to Equation (3). They are calculated based on the experimental result (X) along with the expanded uncertainty µ(x) and the comparator result (Xa) and its uncertainty µ(xa) through Equation (3).
ζ = X X a ( μ 2 ( x ) + μ 2 ( x a ) .
Scores of ±1 are traditionally considered highly acceptable, while scores greater than ±2 are generally considered questionable. The zeta scores for both online and offline analysis of CUP-2 are shown in Figure 4. The low zeta scores lend confidence to both analysis methods.

3.4. Limits of Detection

The instrument blank, 2% HNO3 analyzed on the ICP-MS between each sample, and the method blank, 2% HNO3 injected into the HPIC and analyzed using the same methodology. As expected, there was more count variability in the method blanks simply due to chromatographic separations. The method blanks were used for background subtraction. The limits of detection and quantification (LOD and LOQ) for the method were determined by multiplying the standard deviation of the method blanks by 3 and 10 for the LOD and LOQ, respectively. These limits were calculated to be applicable to their corresponding concentration of REE per gram of U and can be seen in Table 3. The LODs and LOQs for all the elements were in the sub- ng g−1 U range with the exception of the LOQ of Gd and Nd for the offline separation which was 1.4 and 1.1 ng g−1 U, respectively. It should be noted that these LODs are primarily meant to serve as a first pass demonstration of the overall methodology sensitivity. The LOD and LOQ for the offline method were in general higher in comparison to the online. The lower quantification limits for the online method could be explained by considering that entire sample is injected onto the column and analyzed by the ICP-MS adding the counts via integration; however, the offline system might only collect a small fraction of the sample to minimize carryover from an interfering analyte thereby lowering the overall signal. For example, the fraction collection of Eu in offline mode collected the early portion of the peak to avoid any Gd interference. Subsequently, the Gd fraction collected the later peak to avoid any Eu interference. Additionally, for offline analysis, the sample was diluted post column in order to minimize the caustic effects of the organic matrix on the ICP consumables. This was especially important with the longer integration times necessary for precise isotopic measurements in comparison to the online analysis. Ultimately, the offline method detection limits could be hindered due to limitations associated with fraction collection as well as pre-ICP analysis dilutions. However, the offline method has the added benefit of injecting a less dilute UOC which increases the REE concentrations and enables the measurement of more precise isotope ratios.

4. Conclusions

The primary goal of this project was to develop a method that provided accurate and precise quantification of REEs in UOC through HPIC separations and IDMS. Overall, by utilizing IDMS, in comparison to external calibration-based quantification platforms, the uncertainty was minimized. In order to perform IDMS on REE, a separation was required and successfully achieved here by HPIC. The method was compared by performing the IDMS measurements offline by a magnetic sector ICP-MS as well as directing the separated eluents into a quadrupole ICP-MS. Here, while the overall measurement accuracy was relatively the same, the measurement uncertainty was indeed improved by high precision isotopic measurements achieved by the offline analysis. Overall, this method was effective at quantifying REE in a minimally processed UOC sample.

Author Contributions

Conceptualization, B.T.M., B.W.T., and C.R.H.; methodology, V.C.B., B.T.M., B.D.R., S.C.M., K.T.R., S.K.W., and C.R.H.; formal analysis, V.C.B., B.T.M., B.D.R., S.K.W., C.R.H.; writing—original draft preparation, V.C.B., B.T.M., S.C.M., K.T.R., J.D.B., C.R.H. writing—review and editing, V.C.B., B.T.M., B.D.R., S.C.M., K.T.R., B.W.T., S.W., J.D.B., and C.R.H. All authors have read and agreed to the published version of the manuscript.

Funding

This work was supported by the Department of Energy’s National Nuclear Security Administration under contract DE-AC05-00OR22725 with UT-Battelle, LLC. Oak Ridge National Laboratory is managed by UT-Battelle for the Department of Energy under Contract DE-AC05-000R22725. This research was also supposed in part by an appointment to the HERE program at Oak Ridge National Laboratory.

Conflicts of Interest

This manuscript has been authored in part by UT-Battelle, LLC, under contract DE-AC05-00OR22725 with the US Department of Energy (DOE). The US government retains and the publisher, by accepting the article for publication, acknowledges that the US government retains a nonexclusive, paid-up, irrevocable, worldwide license to publish or reproduce the published form of this manuscript, or allow others to do so, for US government purposes. DOE will provide public access to these results of federally sponsored research in accordance with the DOE Public Access Plan (http://energy.gov/downloads/doe-public-access-plan).

References

  1. Moody, K.J.; Grant, P.M.; Hutcheon, I.D. Nuclear Forensic Analysis; CRC Press: Boca Raton, FL, USA, 2014. [Google Scholar]
  2. IAEA. World Distribution of Uranium Deposits (UDEPO), with Uranium Deposit Classification, 2009 ed.; International Atomic Energy Agency: Vienna, Austria, 2009. [Google Scholar]
  3. Keegan, E.; Wallenius, M.; Mayer, K.; Varga, Z.; Rasmussen, G. Attribution of uranium ore concentrates using elemental and anionic data. Appl. Geochem. 2012, 27, 1600–1609. [Google Scholar] [CrossRef]
  4. Varga, Z.; Katona, R.; Stefánka, Z.; Wallenius, M.; Mayer, K.; Nicholl, A. Determination of rare-earth elements in uranium-bearing materials by inductively coupled plasma mass spectrometry. Talanta 2010, 80, 1744–1749. [Google Scholar] [CrossRef] [PubMed]
  5. Varga, Z.; Wallenius, M.; Mayer, K.; Meppen, M. Analysis of uranium ore concentrates for origin assessment. Proc. Radiochem. A Suppl. Radiochim. Acta 2011, 1, 27–30. [Google Scholar]
  6. Varga, Z.; Krajkó, J.; Peńkin, M.; Novák, M.; Eke, Z.; Wallenius, M.; Mayer, K. Identification of uranium signatures relevant for nuclear safeguards and forensics. J. Radioanal. Nucl. Chem. 2017, 312, 639–654. [Google Scholar] [CrossRef] [Green Version]
  7. Spano, T.L.; Simonetti, A.; Balboni, E.; Dorais, C.; Burns, P.C.; Hixon, A.E. Trace Element Signatures of UOCs: Provenance Indicator. Available online: https://www.researchgate.net/publication/280234351_Trace_Element_Signatures_of_UOCs_Provenance_Indicator (accessed on 20 May 2019).
  8. Spano, T.L.; Simonetti, A.; Balboni, E.; Dorais, C.; Burns, P.C. Trace element and U isotope analysis of uraninite and ore concentrate: Applications for nuclear forensic investigations. Appl. Geochem. 2017, 84, 277–285. [Google Scholar] [CrossRef]
  9. Mercadier, J.; Cuney, M.; Lach, P.; Boiron, M.C.; Bonhoure, J.; Richard, A.; Leisen, M.; Kister, P. Origin of uranium deposits revealed by their rare earth element signature. Terra Nova 2011, 23, 264–269. [Google Scholar] [CrossRef]
  10. Rogers, K.T.; Giaquinto, J.; Essex, R.M.; Metzger, S.C.; Ticknor, B.W.; Hexel, C.R. Trace impurity analysis in uranium oxide via hybrid quantification techniques—gravimetric standard addition and isotope dilution mass spectrometry. J. Radioanal. Nucl. Chem. 2018, 318, 685–694. [Google Scholar] [CrossRef]
  11. Junior, O.O.; Sarkis, J. Determination of impurities in uranium oxide by inductively coupled plasma mass spectrometry (ICPMS) by the matrix matching method. J. Radioanal. Nucl. Chem. 2002, 254, 519–526. [Google Scholar] [CrossRef]
  12. Fassett, J. Inorganic Trace Analysis by Isotope Dilution Mass Spectrometry-New. J. Res. Natl. Bur. Stand. 1988, 93, 417–418. [Google Scholar] [CrossRef]
  13. Fassett, J.D.; Paulsen, P.J. Isotope dilution mass spectrometry for accurate elemental analysis. Anal. Chem. 1989, 61, 643A–649A. [Google Scholar] [CrossRef]
  14. Perna, L.; Bocci, F.; de las Heras, L.A.; De Pablo, J.; Betti, M. Studies on simultaneous separation and determination of lanthanides and actinides by ion chromatography inductively coupled plasma mass spectrometry combined with isotope dilution mass spectrometry. J. Anal. At. Spectrom. 2002, 17, 1166–1171. [Google Scholar] [CrossRef]
  15. Vesterlund, A.; Ramebäck, H. Avoiding polyatomic interferences in measurements of lanthanides in uranium material for nuclear forensic purposes. J. Radioanal. Nucl. Chem. 2019, 321, 723–731. [Google Scholar] [CrossRef] [Green Version]
  16. Olesik, J.W. Elemental analysis using ICP-OES and ICP/MS. Anal. Chem. 1991, 63, 12A–21A. [Google Scholar] [CrossRef]
  17. Bruzzoniti, M.; Cavalli, S.; Mangia, A.; Mucchino, C.; Sarzanini, C.; Tarasco, E. Ion chromatography with inductively coupled plasma mass spectrometry, a powerful analytical tool for complex matrices: Estimation of Pt and Pd in environmental samples. J. Chromatogr. A 2003, 997, 51–63. [Google Scholar] [CrossRef]
  18. Wylie, E.M.; Manard, B.T.; Quarles, C.D., Jr.; Meyers, L.A.; Xu, N. An automated micro-separation system for the chromatographic removal of uranium matrix for trace element analysis by ICP-OES. Talanta 2018, 189, 24–30. [Google Scholar] [CrossRef] [PubMed]
  19. Quarles, C.D., Jr.; Manard, B.T.; Wylie, E.M.; Xu, N. Trace elemental analysis of bulk uranium materials using an inline automated sample preparation technique for ICP-OES. Talanta 2018, 190, 460–465. [Google Scholar] [CrossRef] [PubMed]
  20. Gao, J.; Manard, B.T.; Castro, A.; Montoya, D.P.; Xu, N.; Chamberlin, R.M. Solid-phase extraction microfluidic devices for matrix removal in trace element assay of actinide materials. Talanta 2017, 167, 8–13. [Google Scholar] [CrossRef] [Green Version]
  21. Manard, B.T.; Metzger, S.C.; Quarles, C.D., Jr.; Rogers, K.T.; Ticknor, B.W.; Bostick, D.A.; McBay, E.H.; Hexel, C.R. Evaluation and Specifications for In-Line Uranium Separations Using Inductively Coupled Plasma Optical Emission Spectroscopy (ICP-OES) Detection for Trace Elemental Analysis. Appl. Spectrosc. 2019, 0003702819837650. [Google Scholar] [CrossRef]
  22. Truscott, J.B.; Jones, P.; Fairman, B.E.; Evans, E.H. Determination of actinides in environmental and biological samples using high-performance chelation ion chromatography coupled to sector-field inductively coupled plasma mass spectrometry. J. Chromatogr. A 2001, 928, 91–98. [Google Scholar] [CrossRef]
  23. Betti, M.; Menichetti, L.; Moreno, J.B.; Fuoco, R. A preliminary study for the determination of long-lived radionuclides (second transition group 4-d) in environmental samples by ion chromatography inductively coupled plasma-mass spectrometry (IC-ICP-MS). Microchem. J. 2000, 67, 285–290. [Google Scholar] [CrossRef]
  24. Betti, M. Use of ion chromatography for the determination of fission products and actinides in nuclear applications. J. Chromatogr. A 1997, 789, 369–379. [Google Scholar] [CrossRef]
  25. Röllin, S.; Kopatjtic, Z.; Wernli, B.; Magyar, B. Determination of lanthanides and actinides in uranium materials by high-performance liquid chromatography with inductively coupled plasma mass spectrometric detection. J. Chromatogr. A 1996, 739, 139–149. [Google Scholar] [CrossRef]
  26. Schwantes, J.M.; Rundberg, R.S.; Taylor, W.A.; Vieira, D.J. Rapid, high-purity, lanthanide separations using HPLC. J. Alloys Compd. 2006, 418, 189–194. [Google Scholar] [CrossRef]
  27. Roach, B.D.; Fenske, E.K.; Ilgner, R.H.; Hexel, C.R.; Haverlock, T.J.; Giaquinto, J.M. Development of a fast and efficient analytical technique for the isotopic analysis of fission and actinide elements in environmental matrices. J. Chromatogr. A 2019, 1587, 155–165. [Google Scholar] [CrossRef] [PubMed]
  28. Fenske, E.K.; Roach, B.D.; Glasgow, D.C.; Ilgner, R.H.; Giaquinto, J.M. Rapid measurements of 235U fission product isotope ratios using an online, high-pressure ion chromatography inductively coupled plasma mass spectrometry protocol with comparison to isotopic depletion models. J. Radioanal. Nucl. Chem. 2019, 320, 153–163. [Google Scholar] [CrossRef]
  29. Roach, B.D.; Giaquinto, J.M.; Keever, T.J. Integration of a hyphenated HPIC-ICPMS protocol for the measurement of transplutonium isotopic mass distributions for 252Cf campaigns at Oak Ridge National Laboratory. J. Radioanal. Nucl. Chem. 2018, 318, 407–413. [Google Scholar] [CrossRef]
  30. Cotton, S. Lanthanide and Actinide Chemistry; John Wiley & Sons: Hoboken, NJ, USA, 2013. [Google Scholar]
  31. Nash, K.L. A review of the basic chemistry and recent developments in trivalent f-elements separations. Solvent Extr. Ion Exch. 1993, 11, 729–768. [Google Scholar] [CrossRef]
  32. Eppich, G.; Kips, R.; Lindvall, R. Compilation of LLNL CUP-2 Data; Technical Report; Lawrence Livermore National Lab.: Livermore, CA, USA, 2016. [Google Scholar] [CrossRef]
  33. Roach, B.D.; Fenske, E.K.; Glasgow, D.C.; Partridge, J.D.; Keever, T.J.; Giaquinto, J.M. Rapid concentration and isotopic measurements of ultra-trace 235U fission products with comparison to an ORIGEN isotope depletion model. Talanta 2019. [Google Scholar] [CrossRef]
Figure 1. High-performance ion chromatography (HPIC) separation profile employed for rare earth elements.
Minerals 10 00055 g001
Figure 2. Representative chromatogram of rare earth elements (REE) elution profile. Shaded areas highlight approximate collection intervals of fractions for ICP-MS analysis.
Minerals 10 00055 g002
Figure 3. Concentrations of rare earth elements in CUP-2 shown as a ratio of determined concentration to the previously reported (thermotical) CUP-2 concentrations at different mass loadings.
Minerals 10 00055 g003
Figure 4. Representation of the calculated zeta scores comparing the offline and online methodologies.
Minerals 10 00055 g004
Table 1. Inductively coupled plasma-mass spectrometry (ICP-MS) isobaric and polyatomic interferences (* denotes the enriched spiked utilized).
ElementIsotopeNatural Abundance %Isobaric Interference (Natural Abundance %)Polyatomic Interferences
Nd146Nd (17.19) 130Ba16O, 98Ru16O3
148 *Nd (5.76) 132Ba16O, 100Ru16O3
Sm150 *Sm (7.38)Nd (5.64)134Ba16O, 102Ru16O3
152Sm (26.75)Gd (0.2)136Ba16O, 136Ce16O
Eu151 *Eu (47.81) 135Ba16O
153Eu (52.19) 137Ba16O
Gd152 *Gd (0.2)Sm (26.75)136Ba16O, 136Ce16O
154Gd (2.18)Sm (22.75)138Ba16O, 138La16O
Dy160 *Dy (2.33) 144Nd16O, 144Sm16O
161Dy (18.90) 145Nd16O
Er164 *Er (1.60)Dy (28.26)148Nd16O
166Er (33.50) 150Sm16O, 150Nd16O
Yb173 *Yb (16.10) 157Gd16O
174Yb (32.03) 158Gd16O
Lu175Lu (97.40) 159Gd16O, 159Tb16O
176 *Lu (2.60)Yb (13.00)160Dy16O
Table 2. Concentration of REEs in CUP-2 with offline and online analysis compared to previously reported concentrations [32] with expanded measurement uncertainty at 2σ.
ElementReported Concentration (µg g−1 U)Offline Concentration (µg g−1 U)Difference %Online Concentration (µg g−1 U)Difference %
Nd26.29 ± 0.3826.68 ± 0.37+1.4726.37 ± 1.07+0.31
Sm12.29 ± 0.1312.28 ± 0.18−0.1312.17 ± 0.30−1.02
Eu1.01 ± 0.020.98 ± 0.04−3.000.96 ± 0.06−5.36
Gd19.48 ± 0.2819.16 ± 0.37−1.6818.50 ± 0.67−5.0
Dy24.72 ± 0.3824.52 ± 0.32−0.7824.45 ± 0.42−1.08
Er11.50 ± 0.2011.54 ± 0.12+0.3911.69 ± 0.34+1.71
Yb9.05 ± 0.109.13 ± 0.10+0.889.08 ± 0.28+0.31
Lu1.09 ± 0.021.09 ± 0.02−0.121.05 ± 0.05−3.98
Table 3. Calculated limits of detection and limits of quantification.
ElementOffline LOD (µg g−1 U)Offline LOQ (µg g−1 U)Online LOD (µg g−1 U)Online LOQ (µg g−1 U)
Nd0.0440.150.00840.028
Sm0.00950.0320.0180.059
Eu0.0280.0940.0220.072
Gd0.341.140.00930.01
Dy0.0210.0690.00170.0055
Er0.00850.0280.00380.013
Yb0.00520.0170.000910.0031
Lu0.00750.0250.00150.0051

