Transition of Sulphide Self-Heating from Stage A to Stage B †


Abstract
:1. Introduction
2. A Brief Review of Self-Heating Literature Related to the Transition
3. Materials and Methods
3.1. Samples
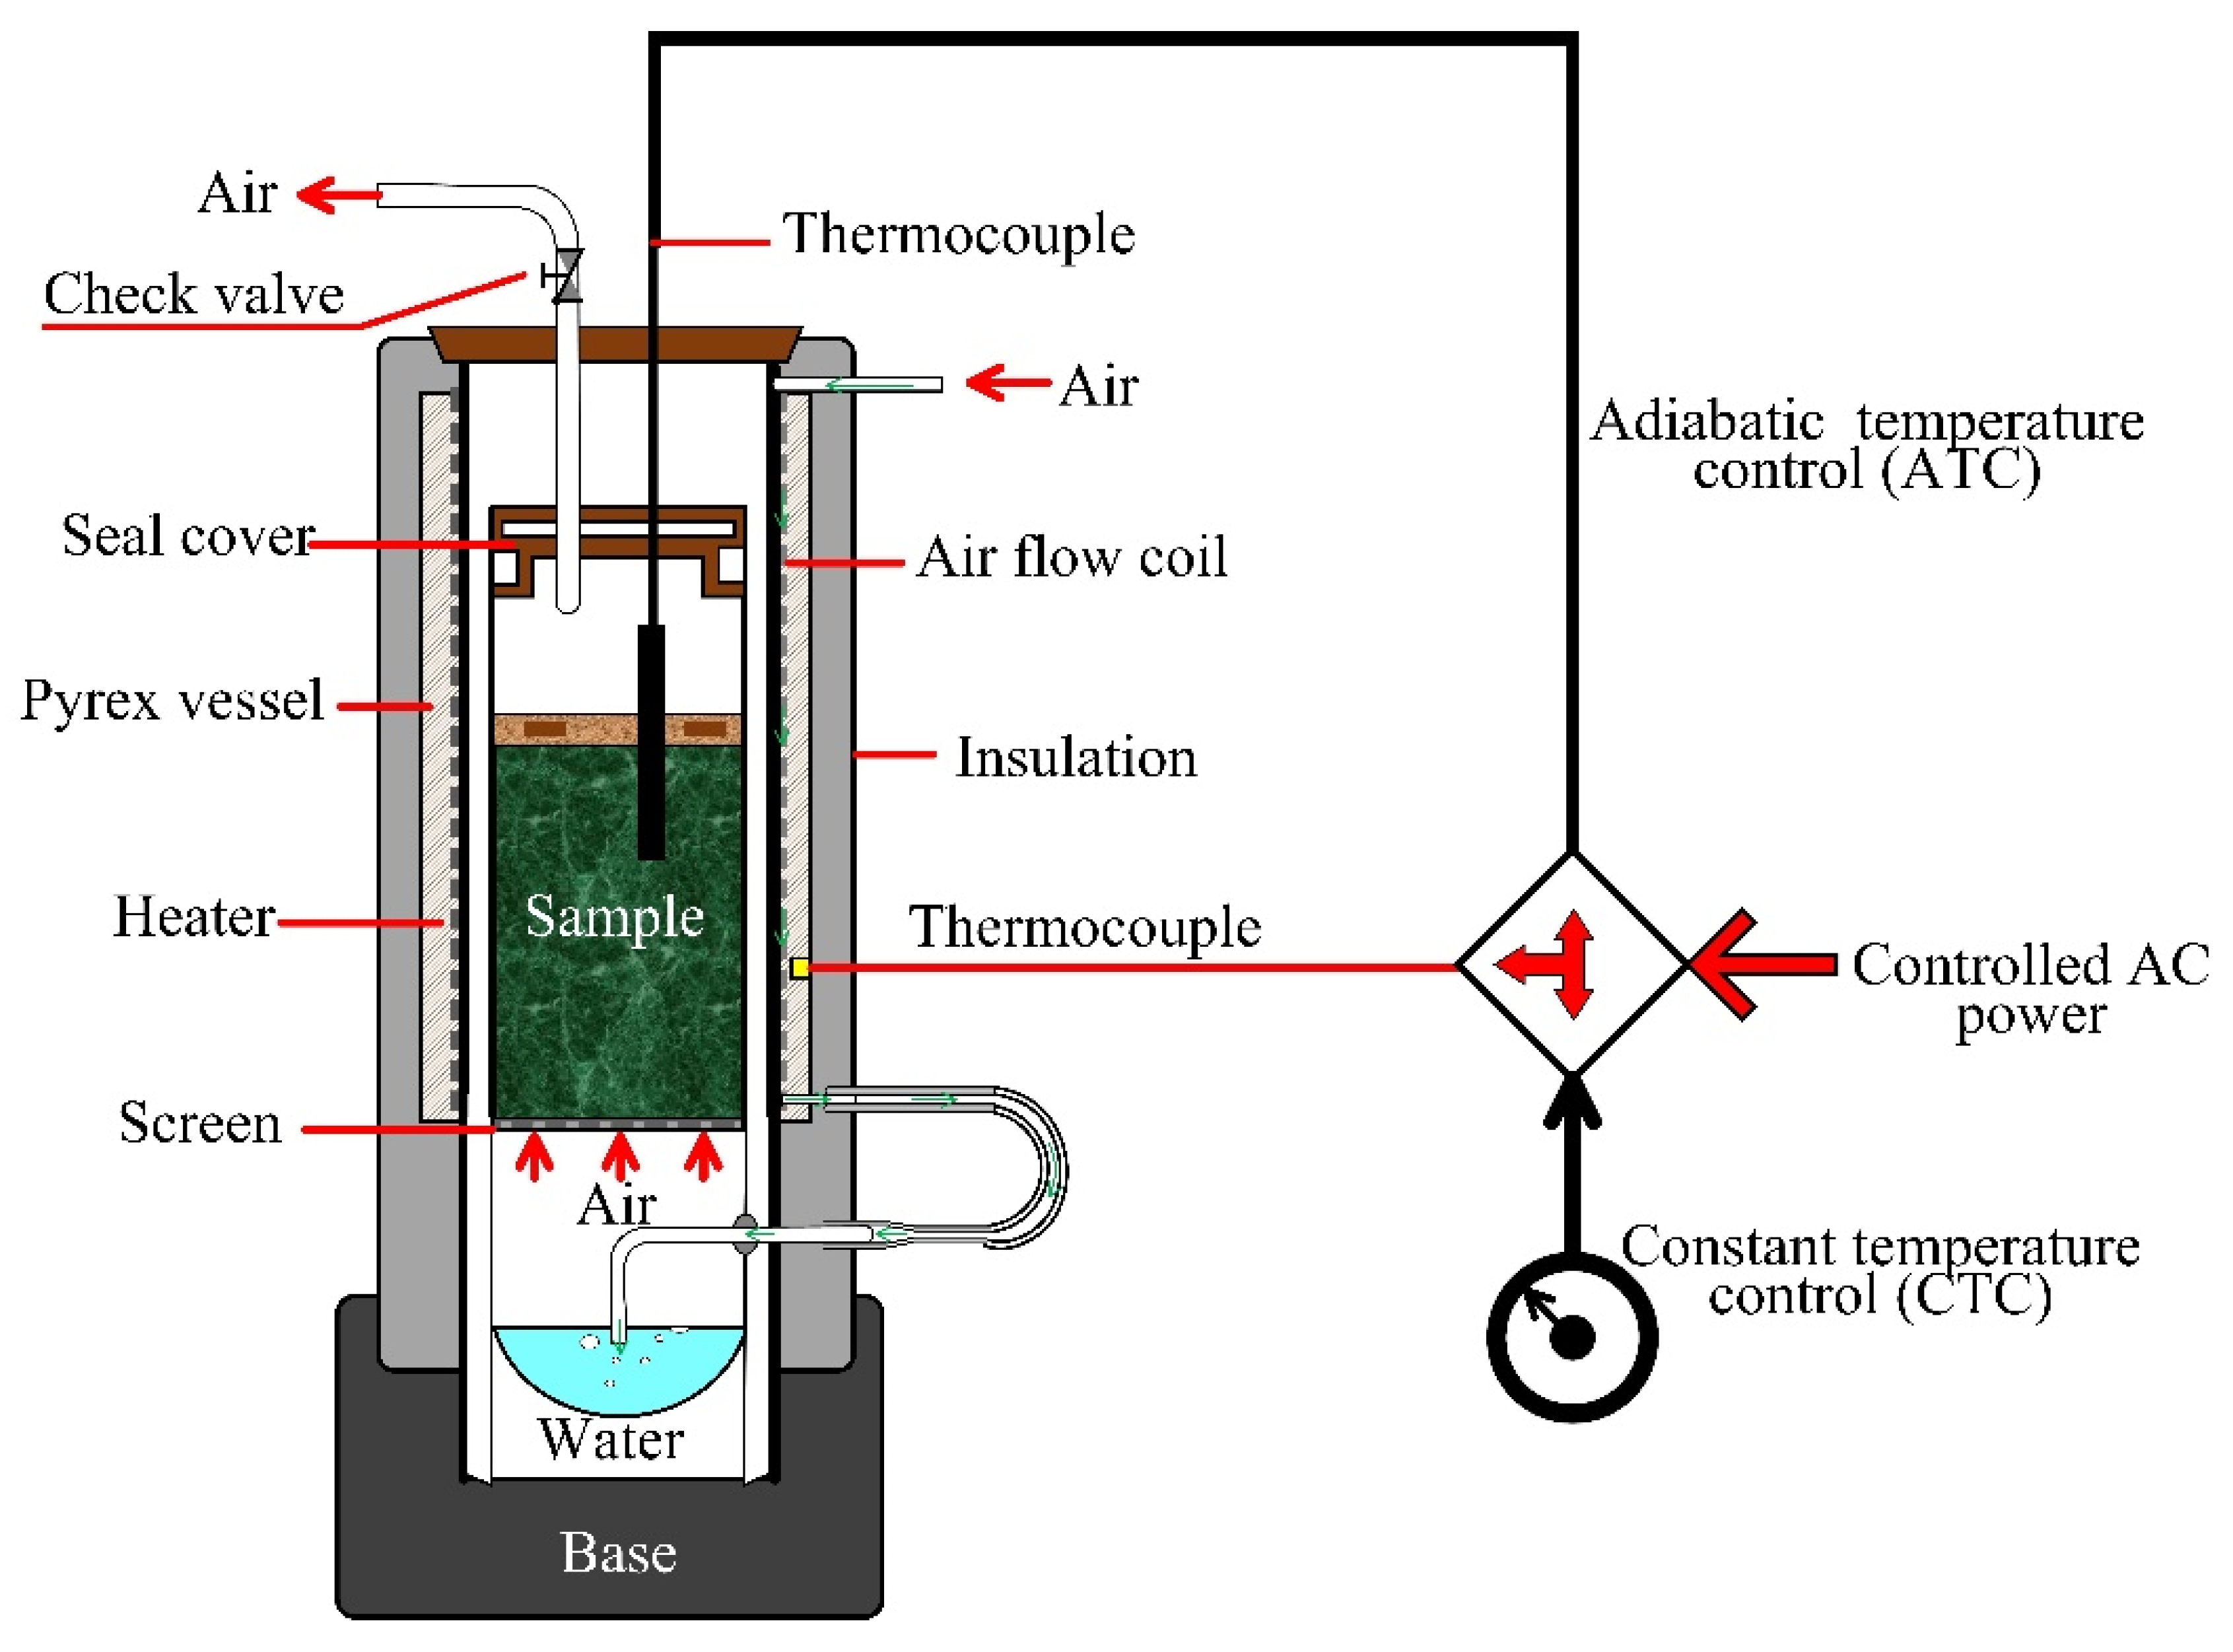
3.2. Self-Heating Test Apparatus
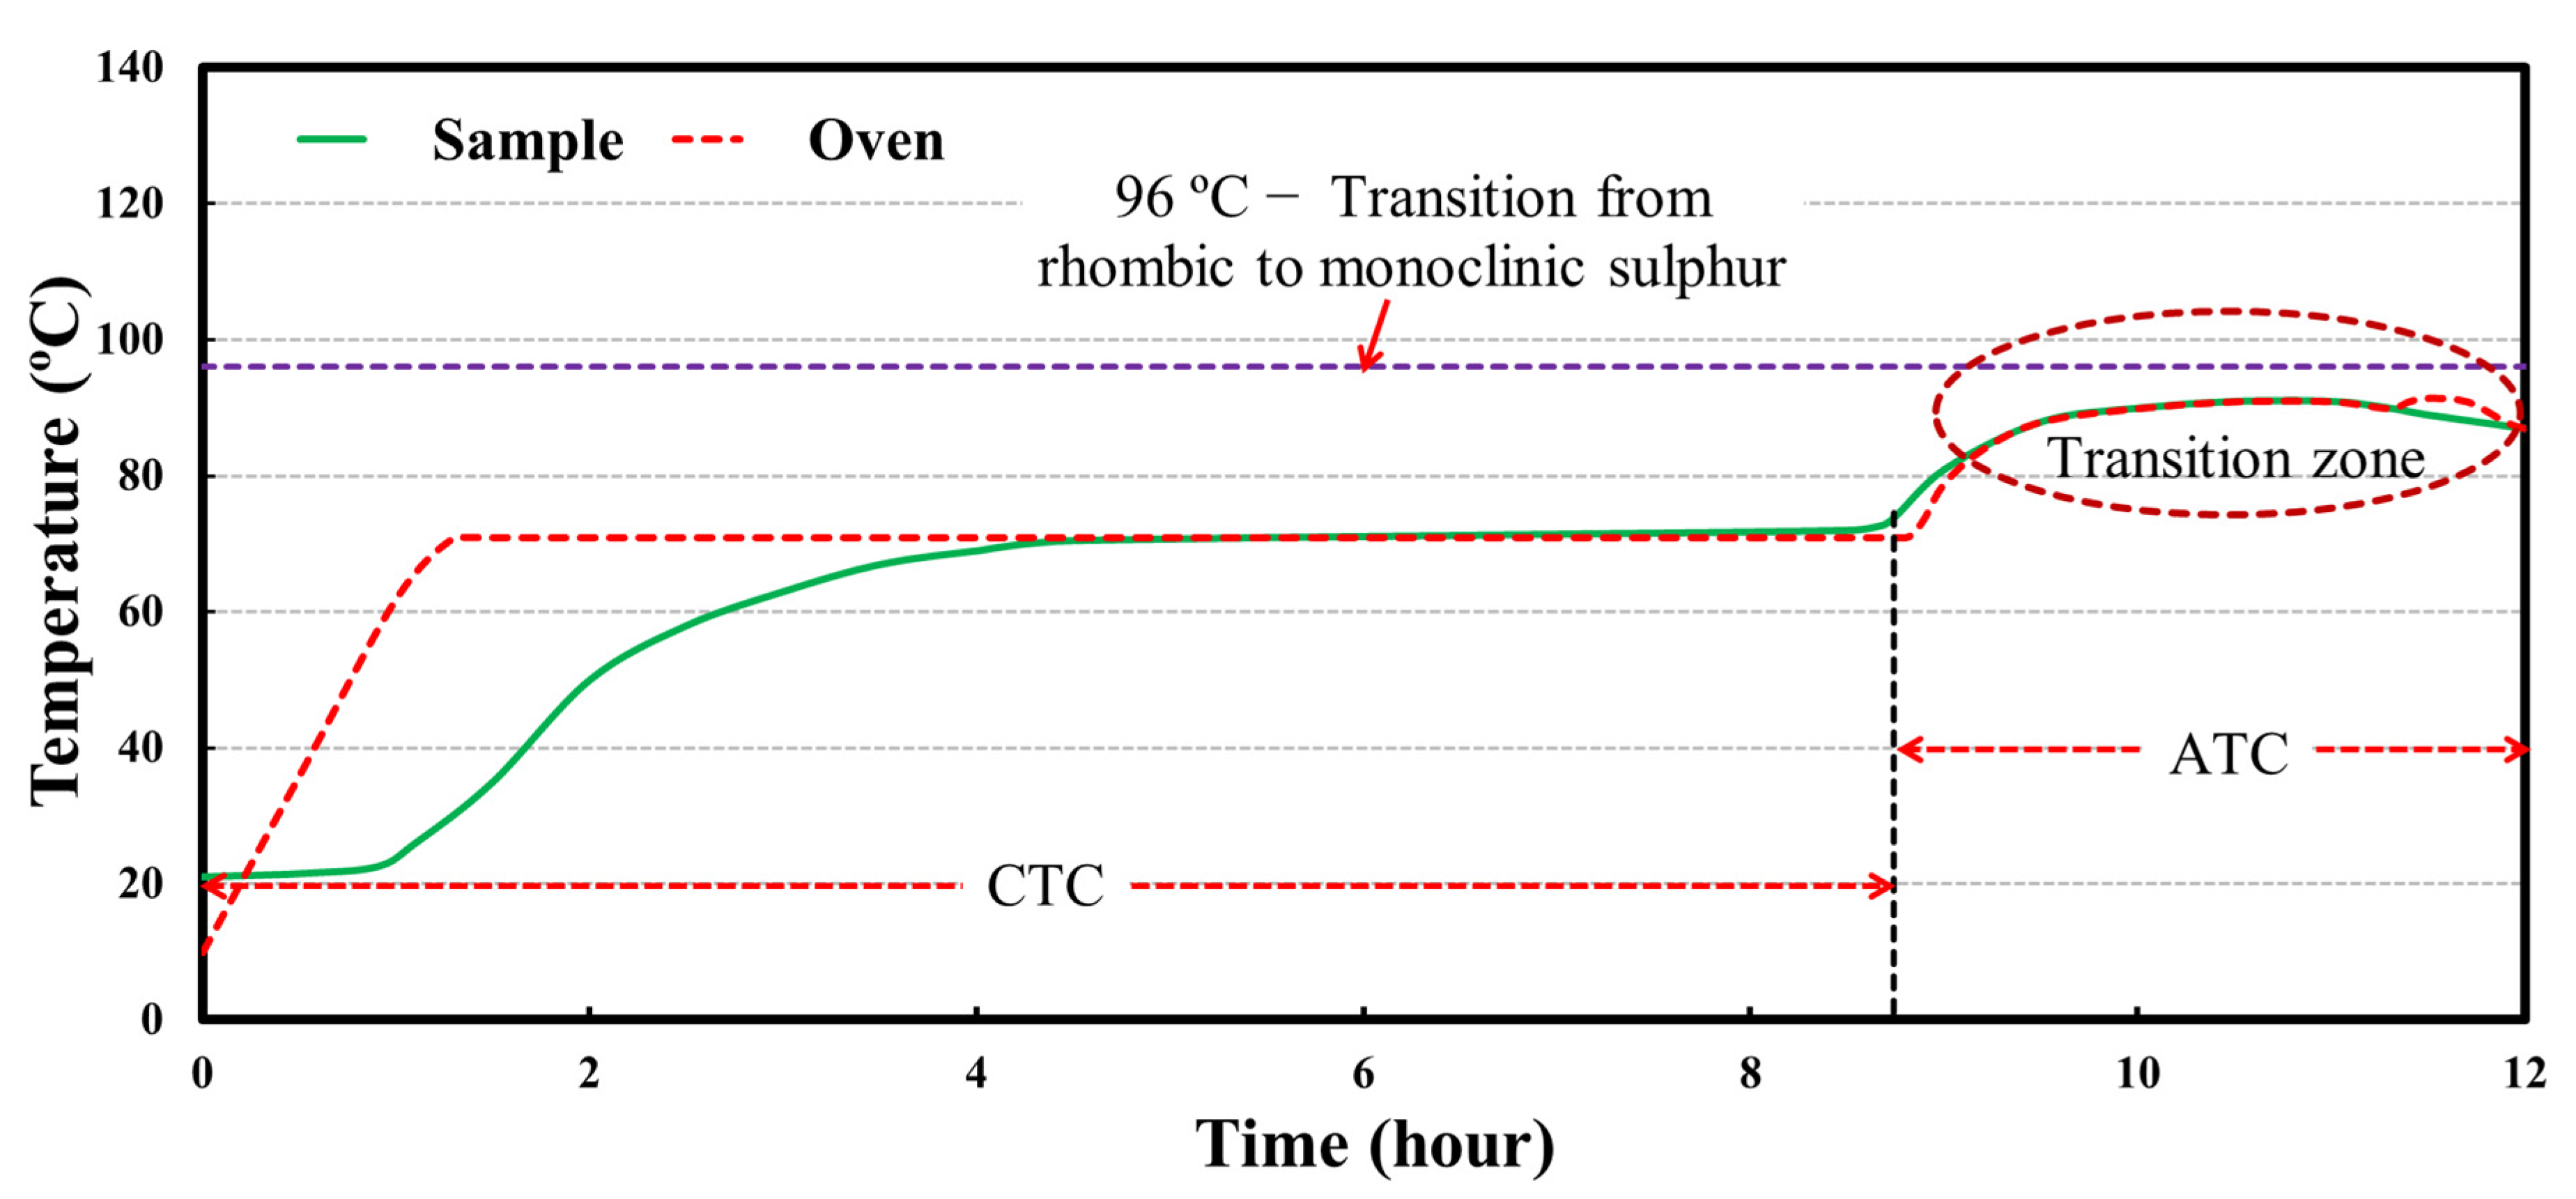
3.2.1. Constant Temperature Control (CTC)
3.2.2. Adiabatic Temperature Control (ATC)
3.2.3. Weathering
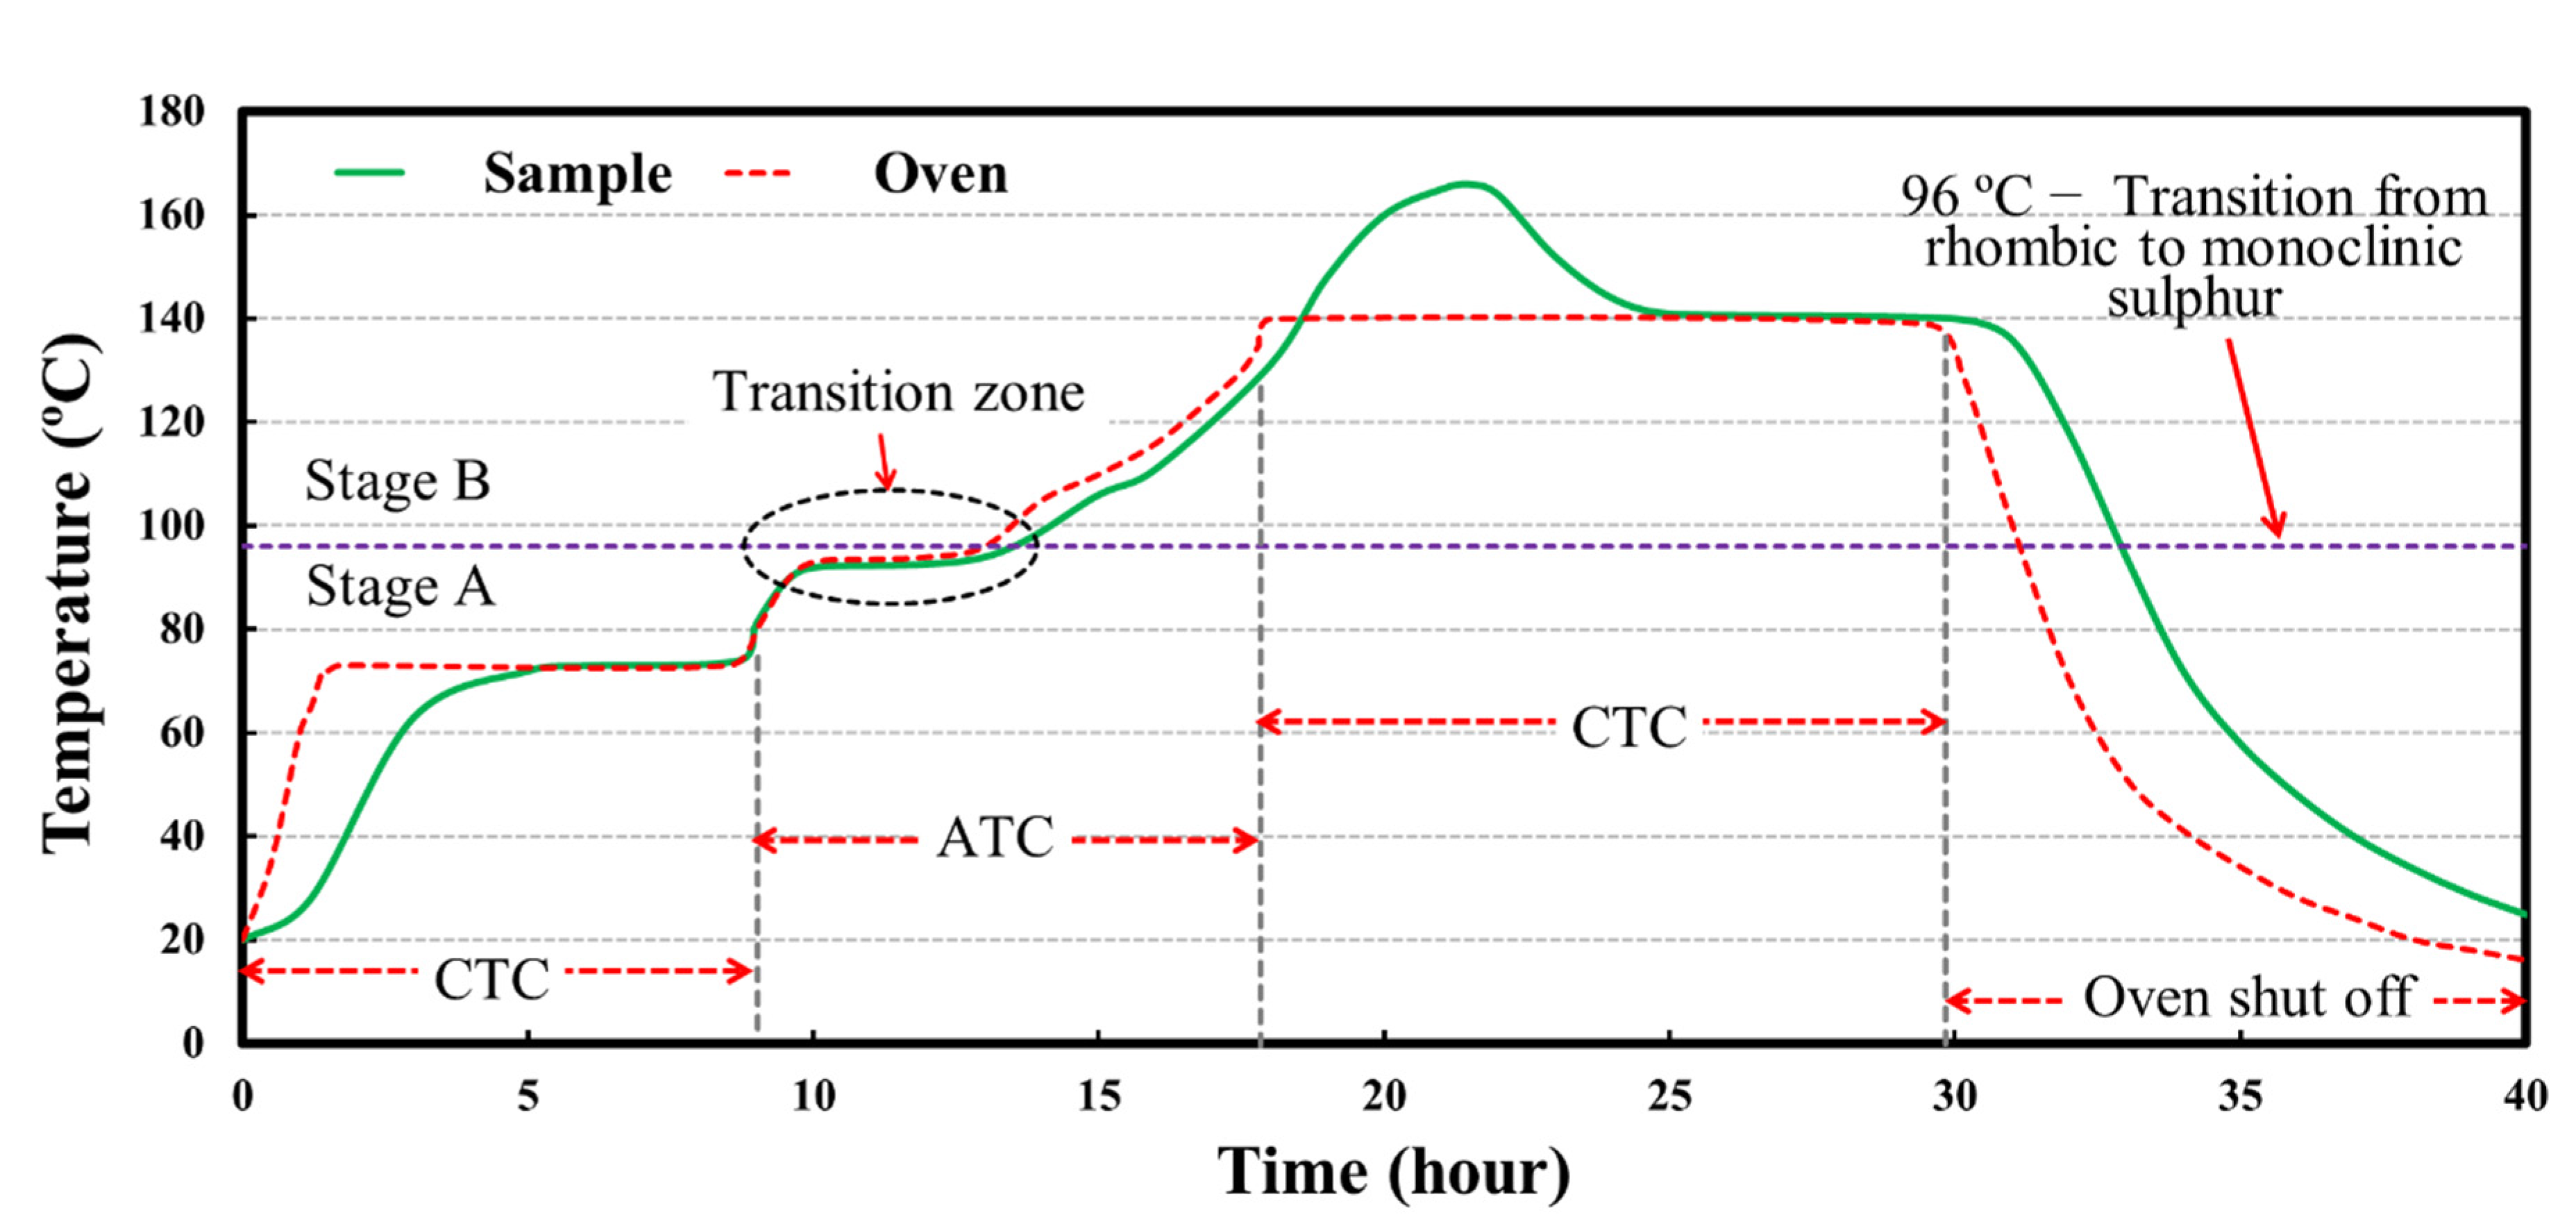
3.2.4. Transition Stage A to Stage B
3.2.5. Sulphur Determination
4. Results
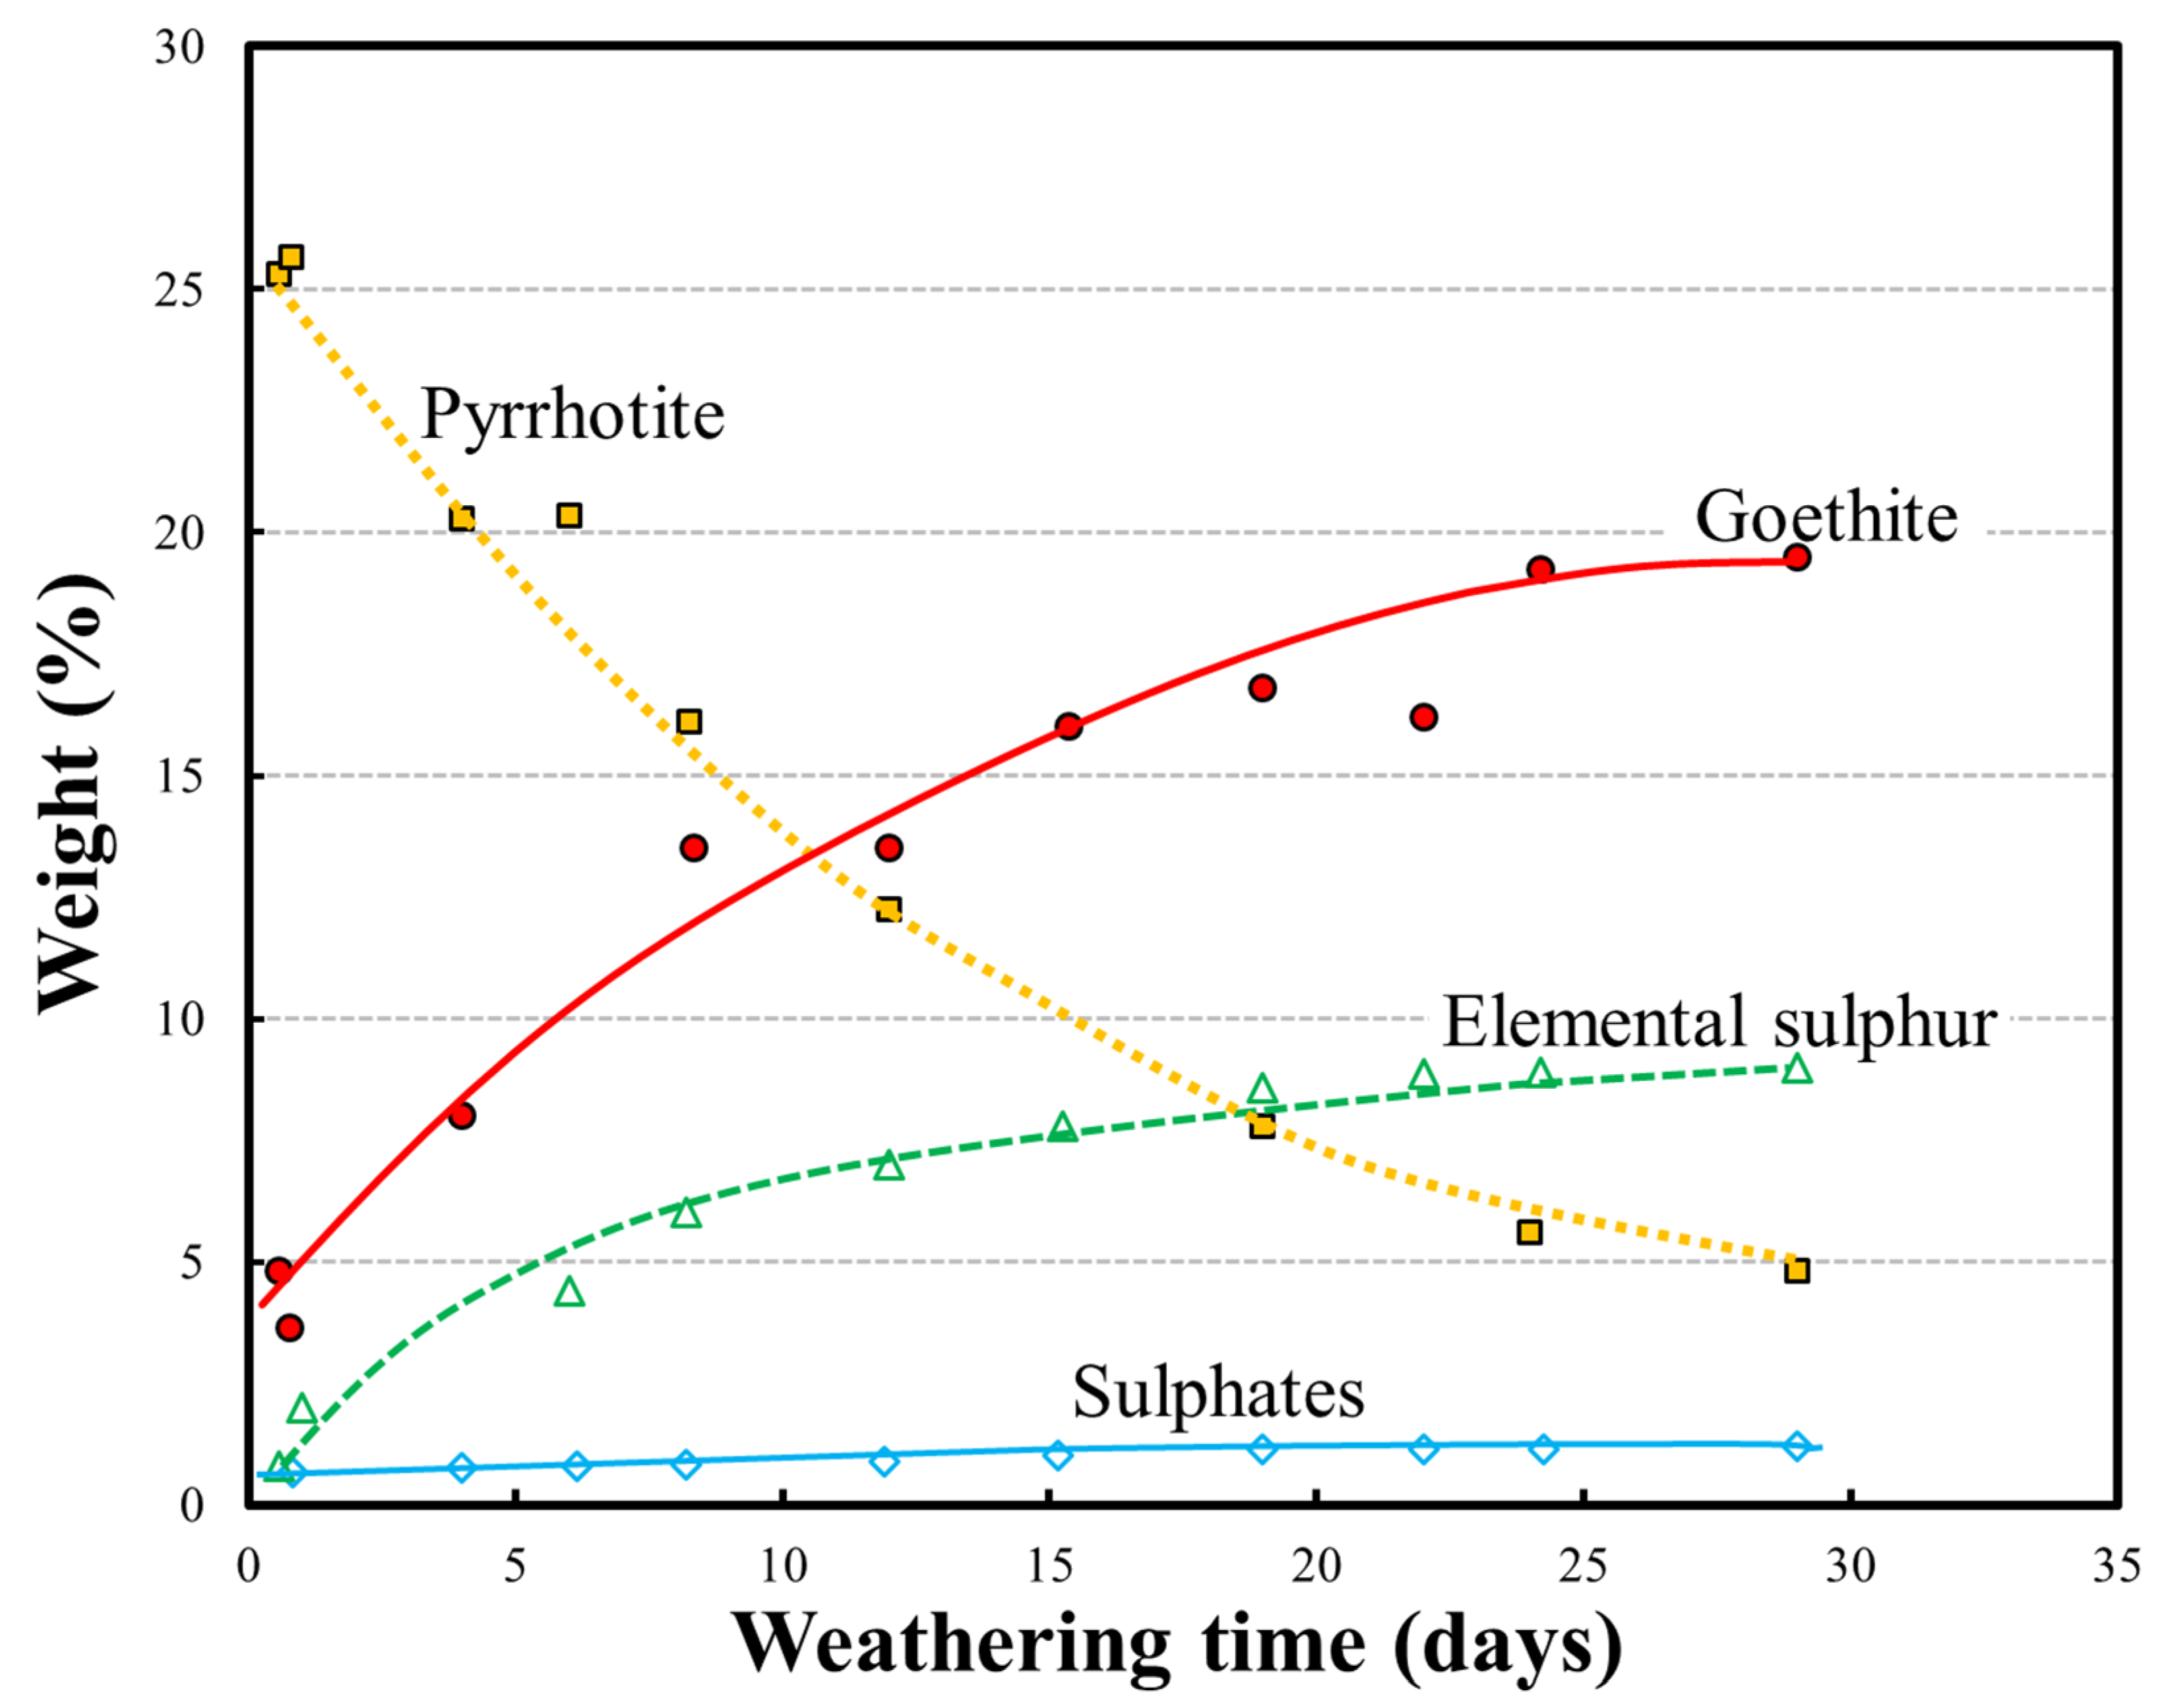
4.1. Weathering
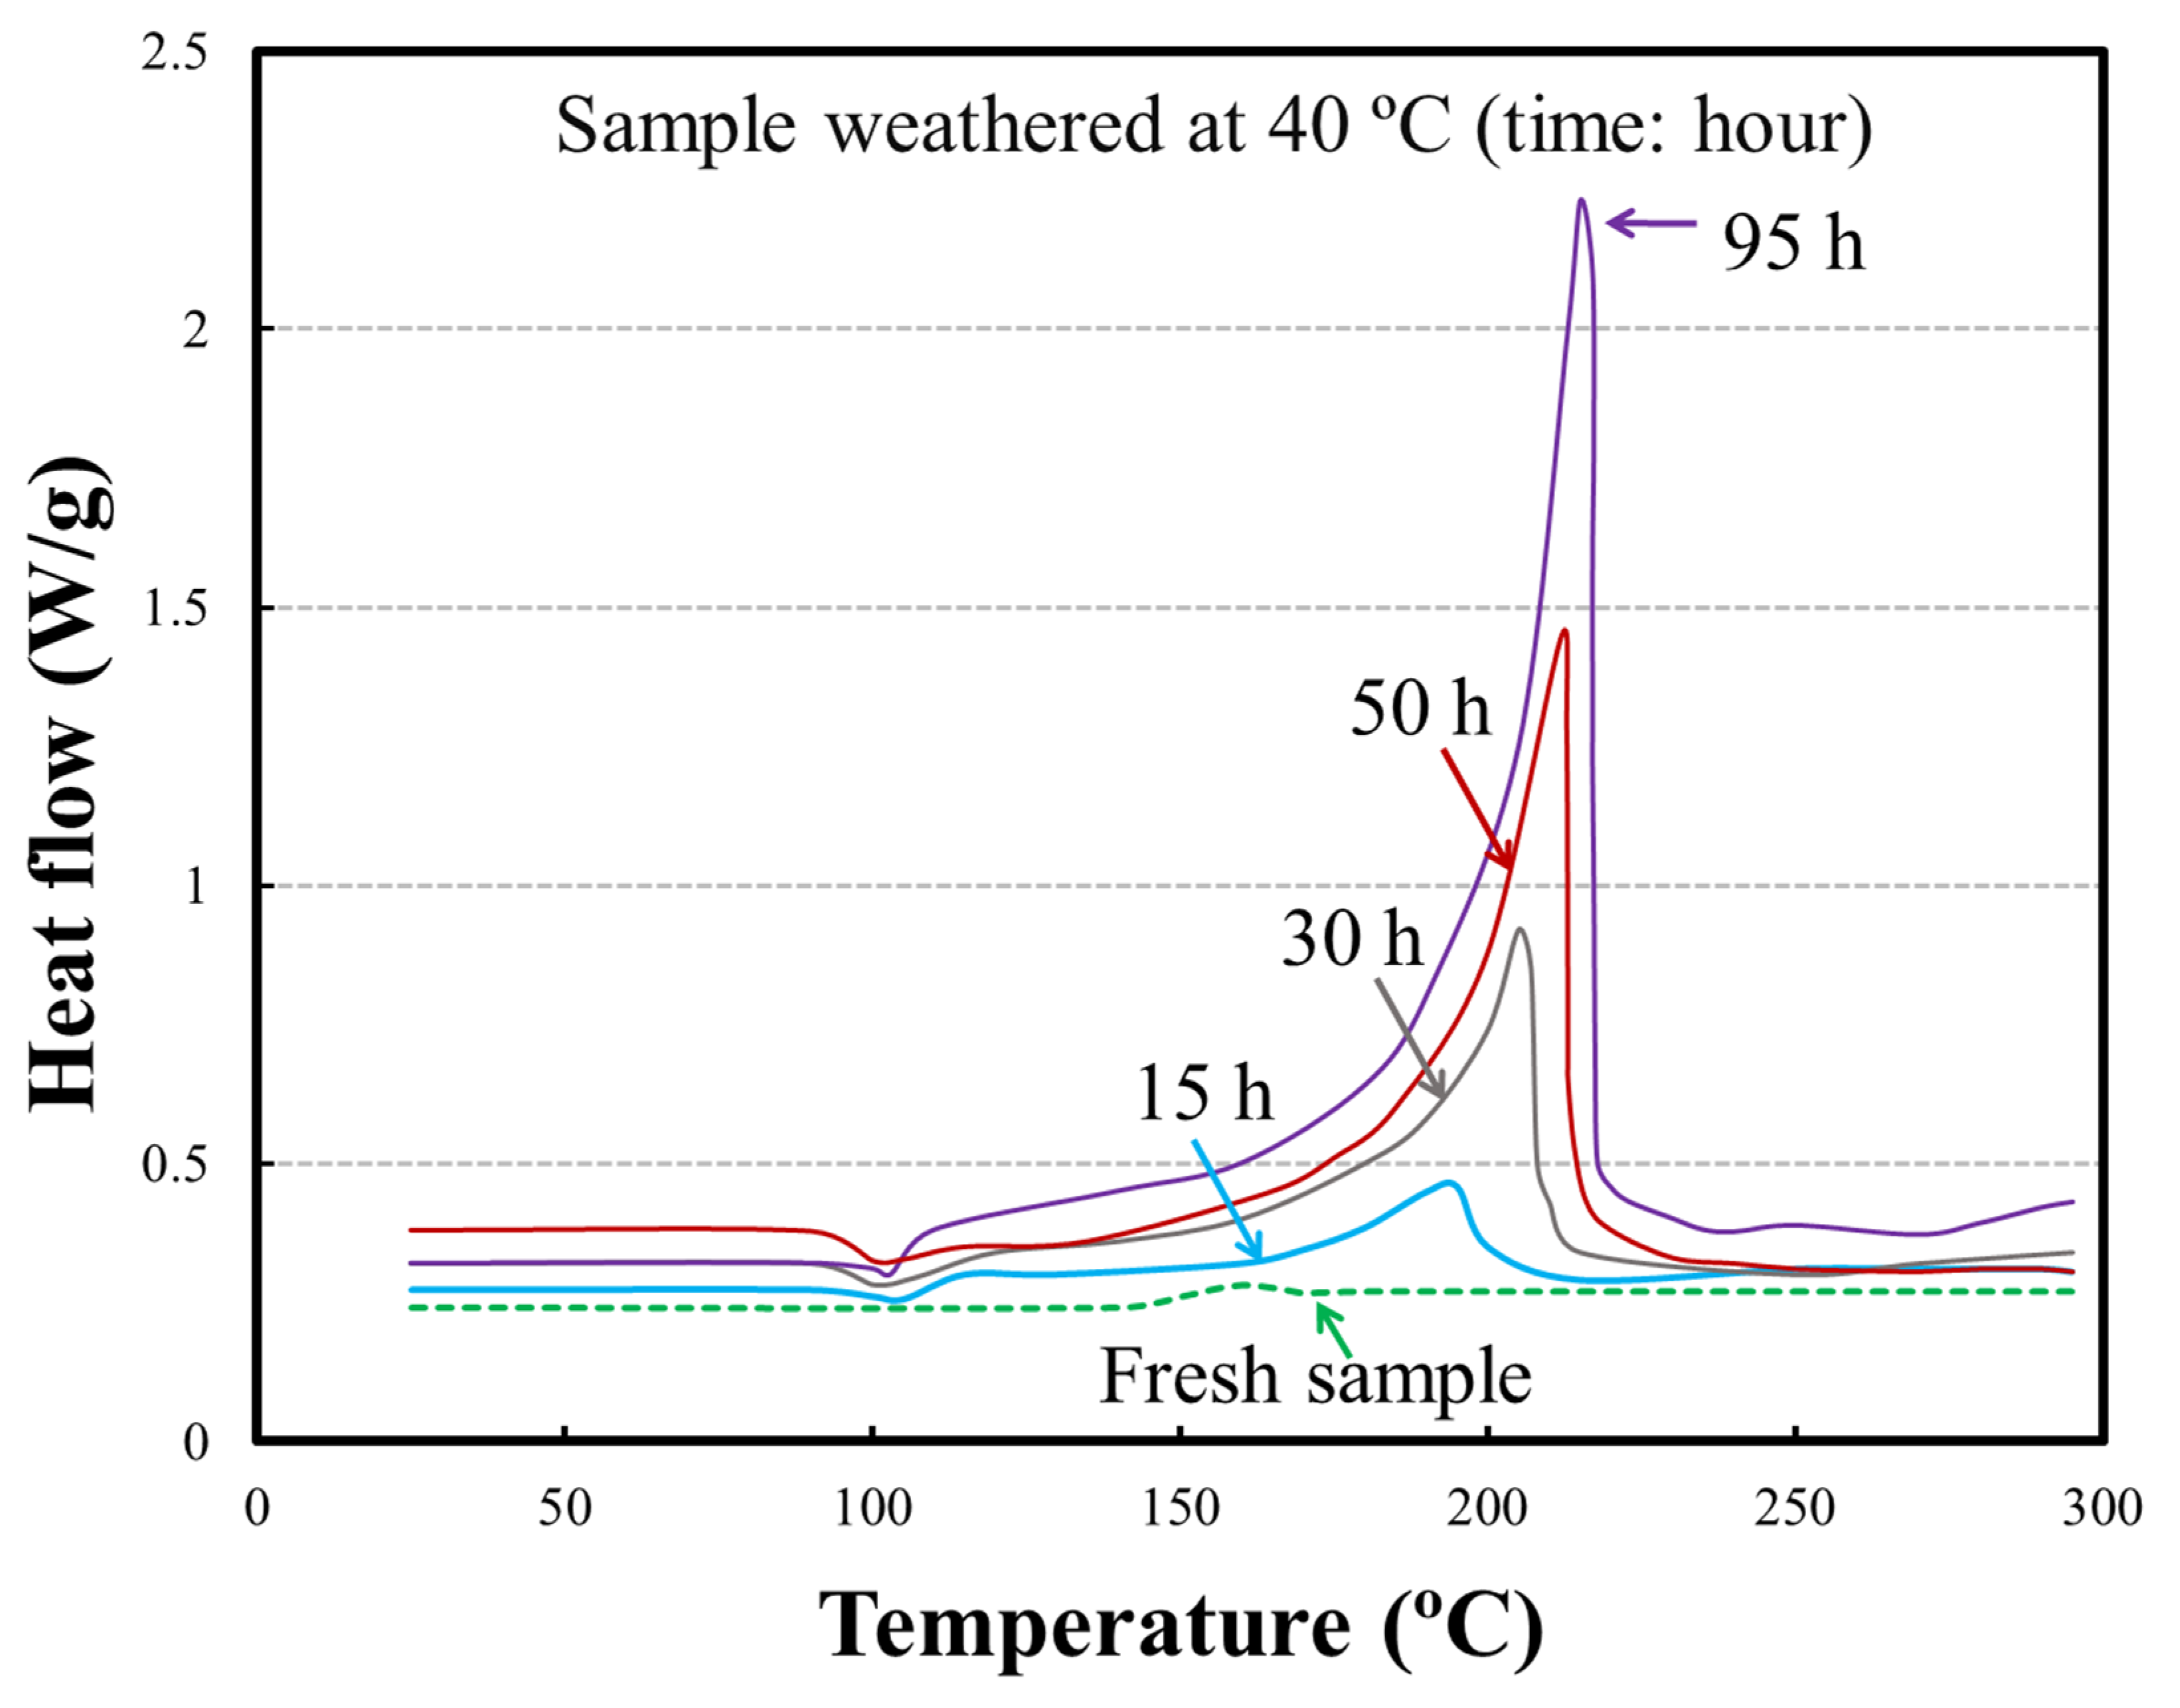
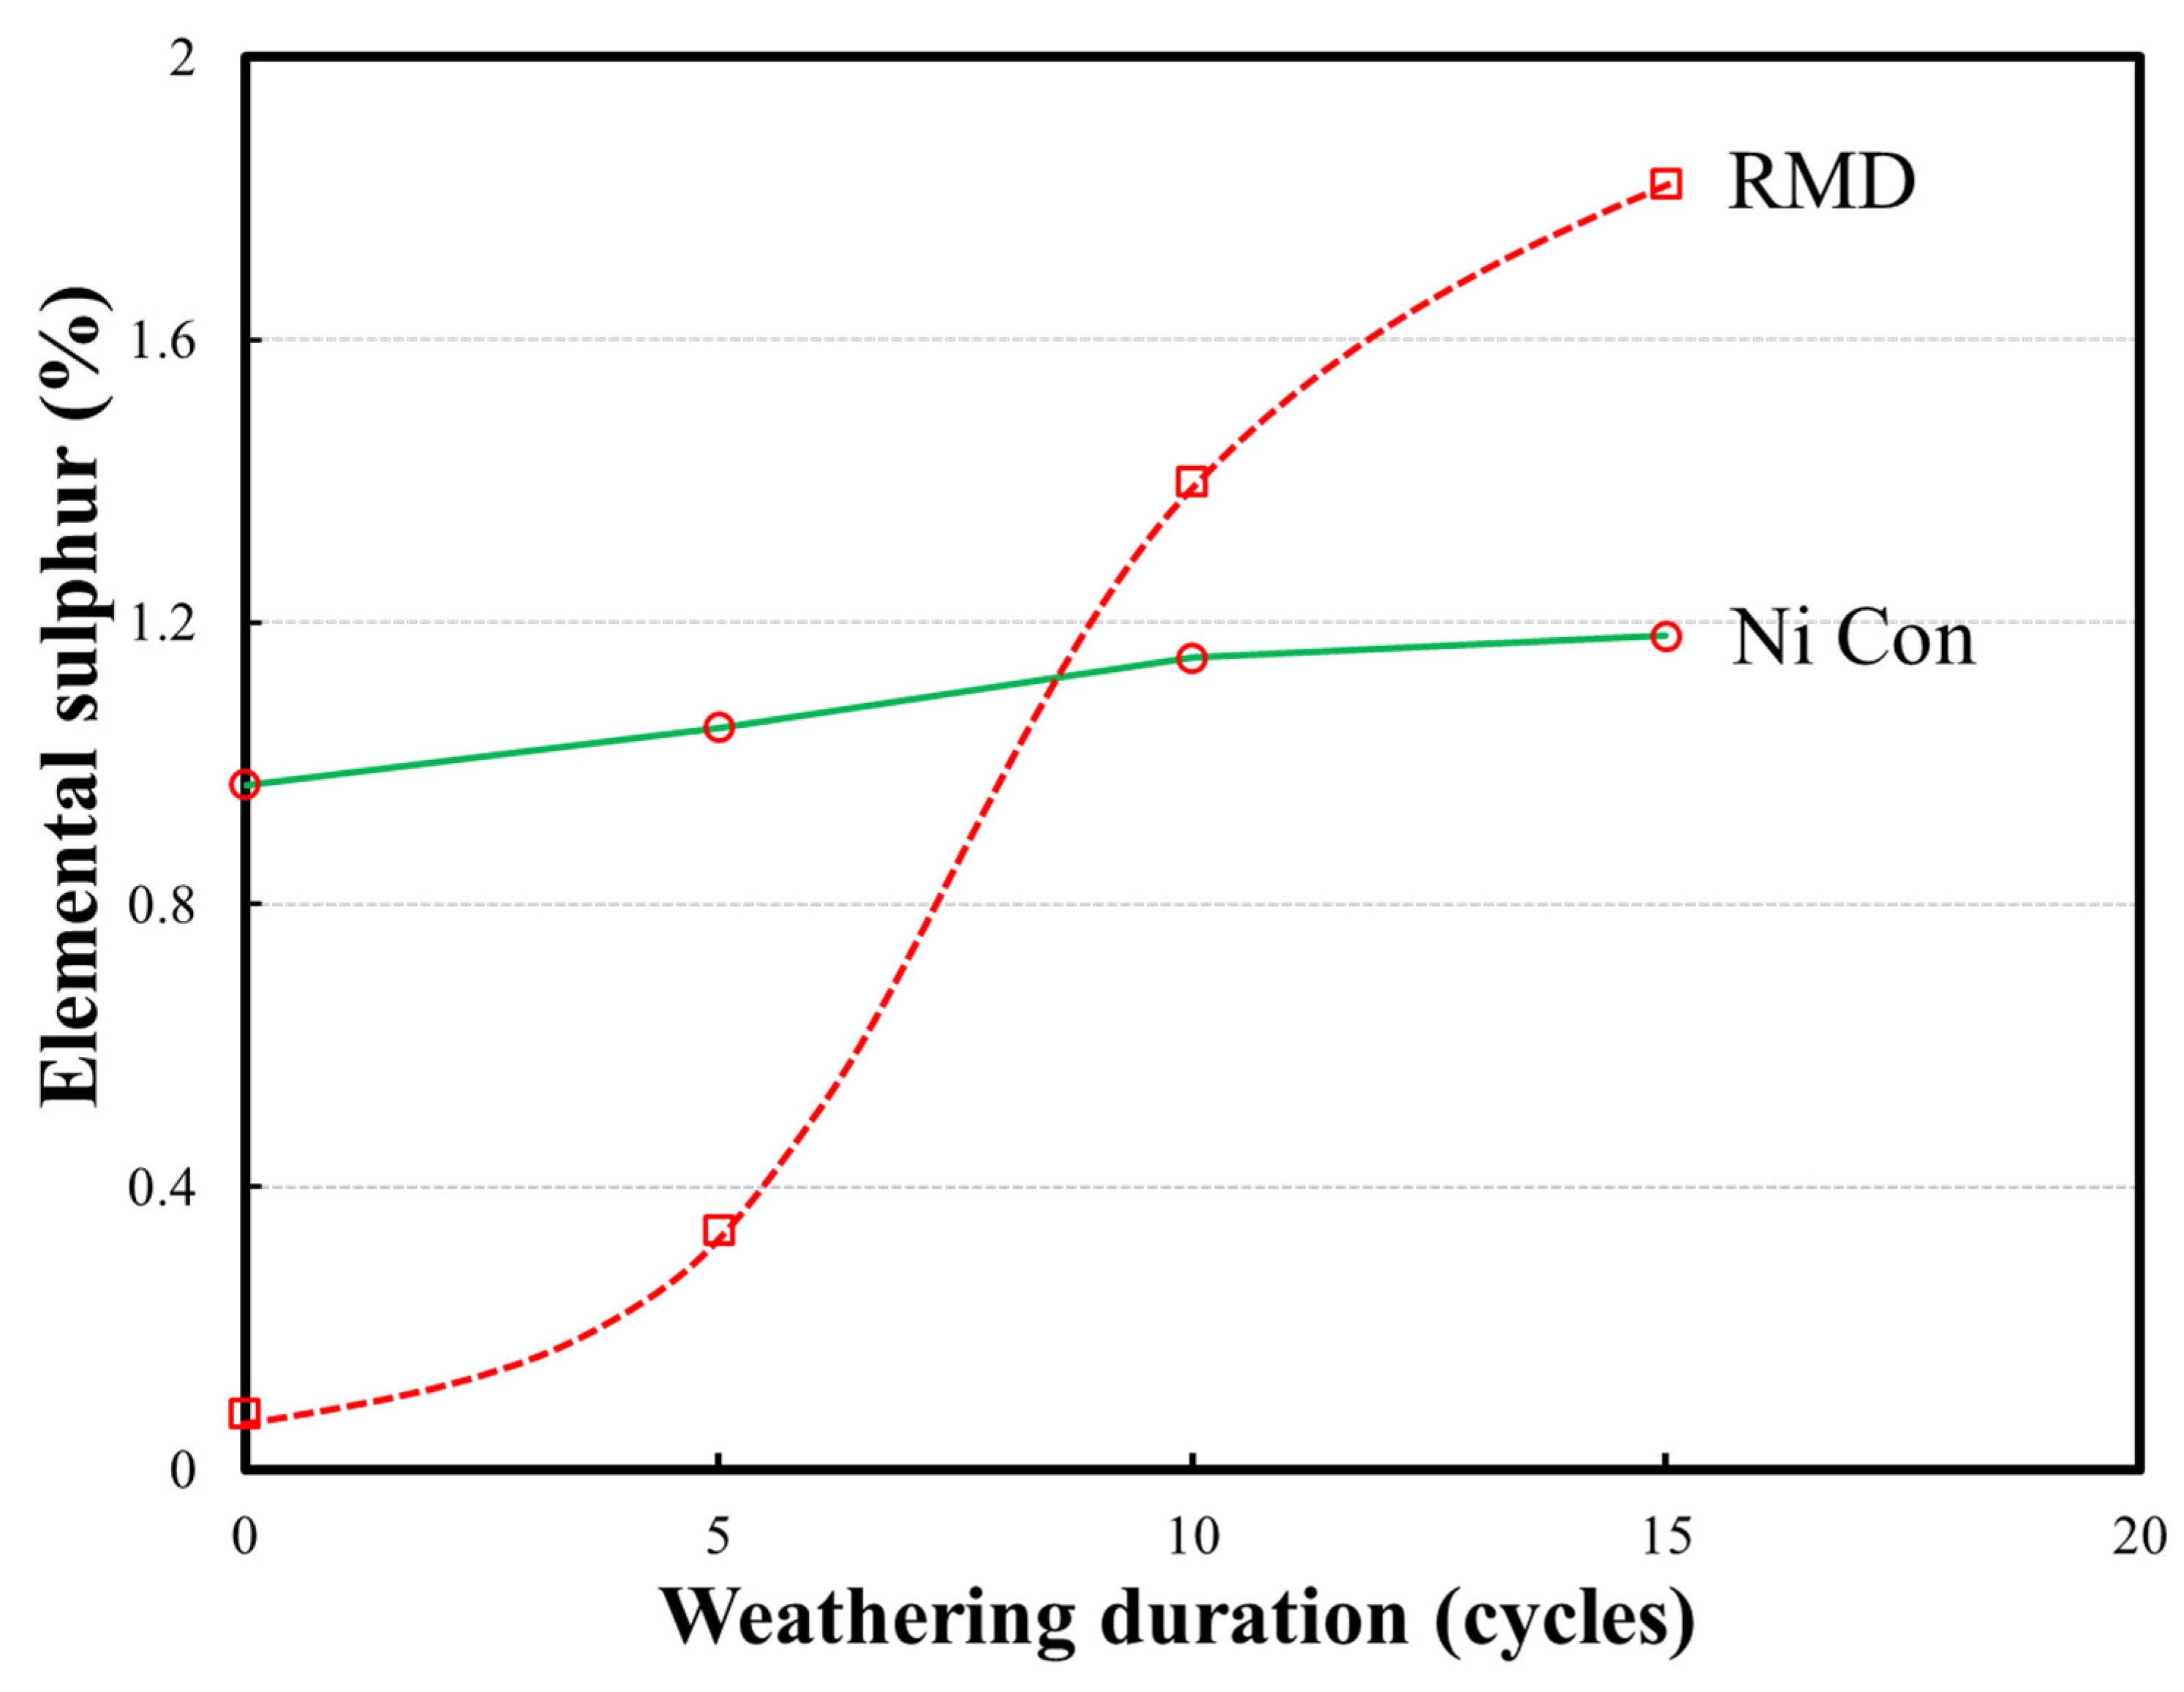
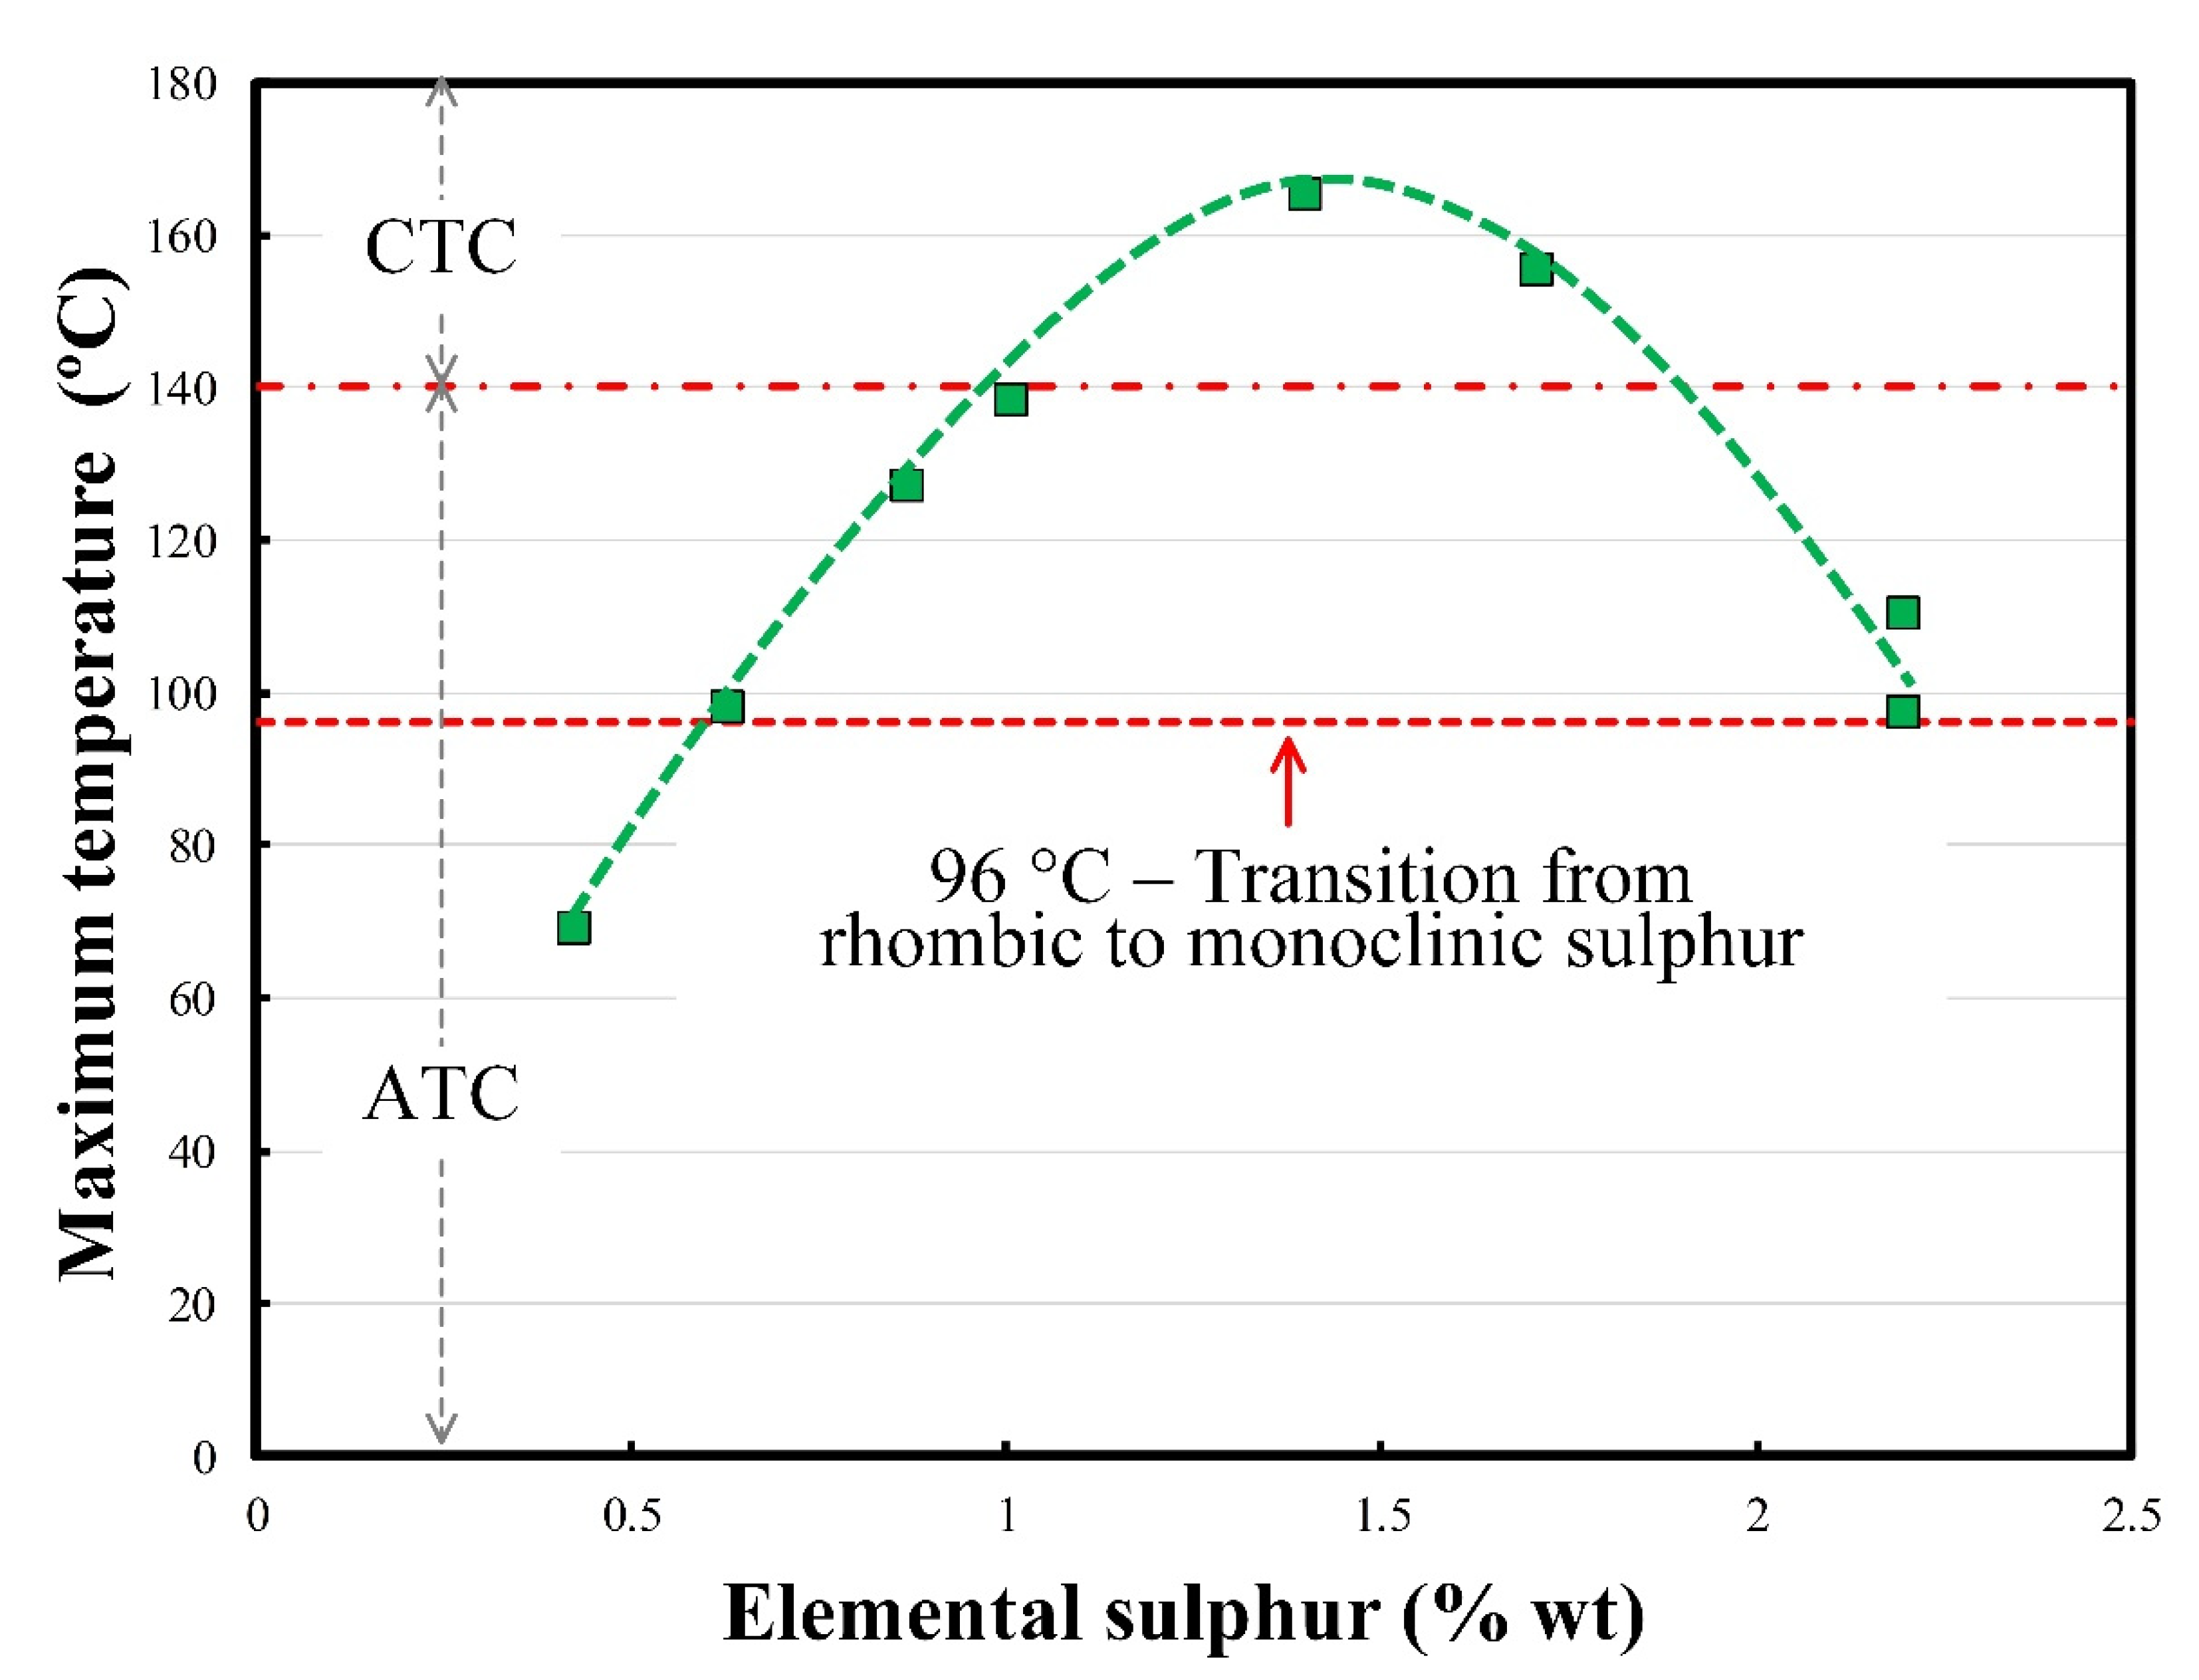
4.1.1. Effect on Elemental Sulphur Generation
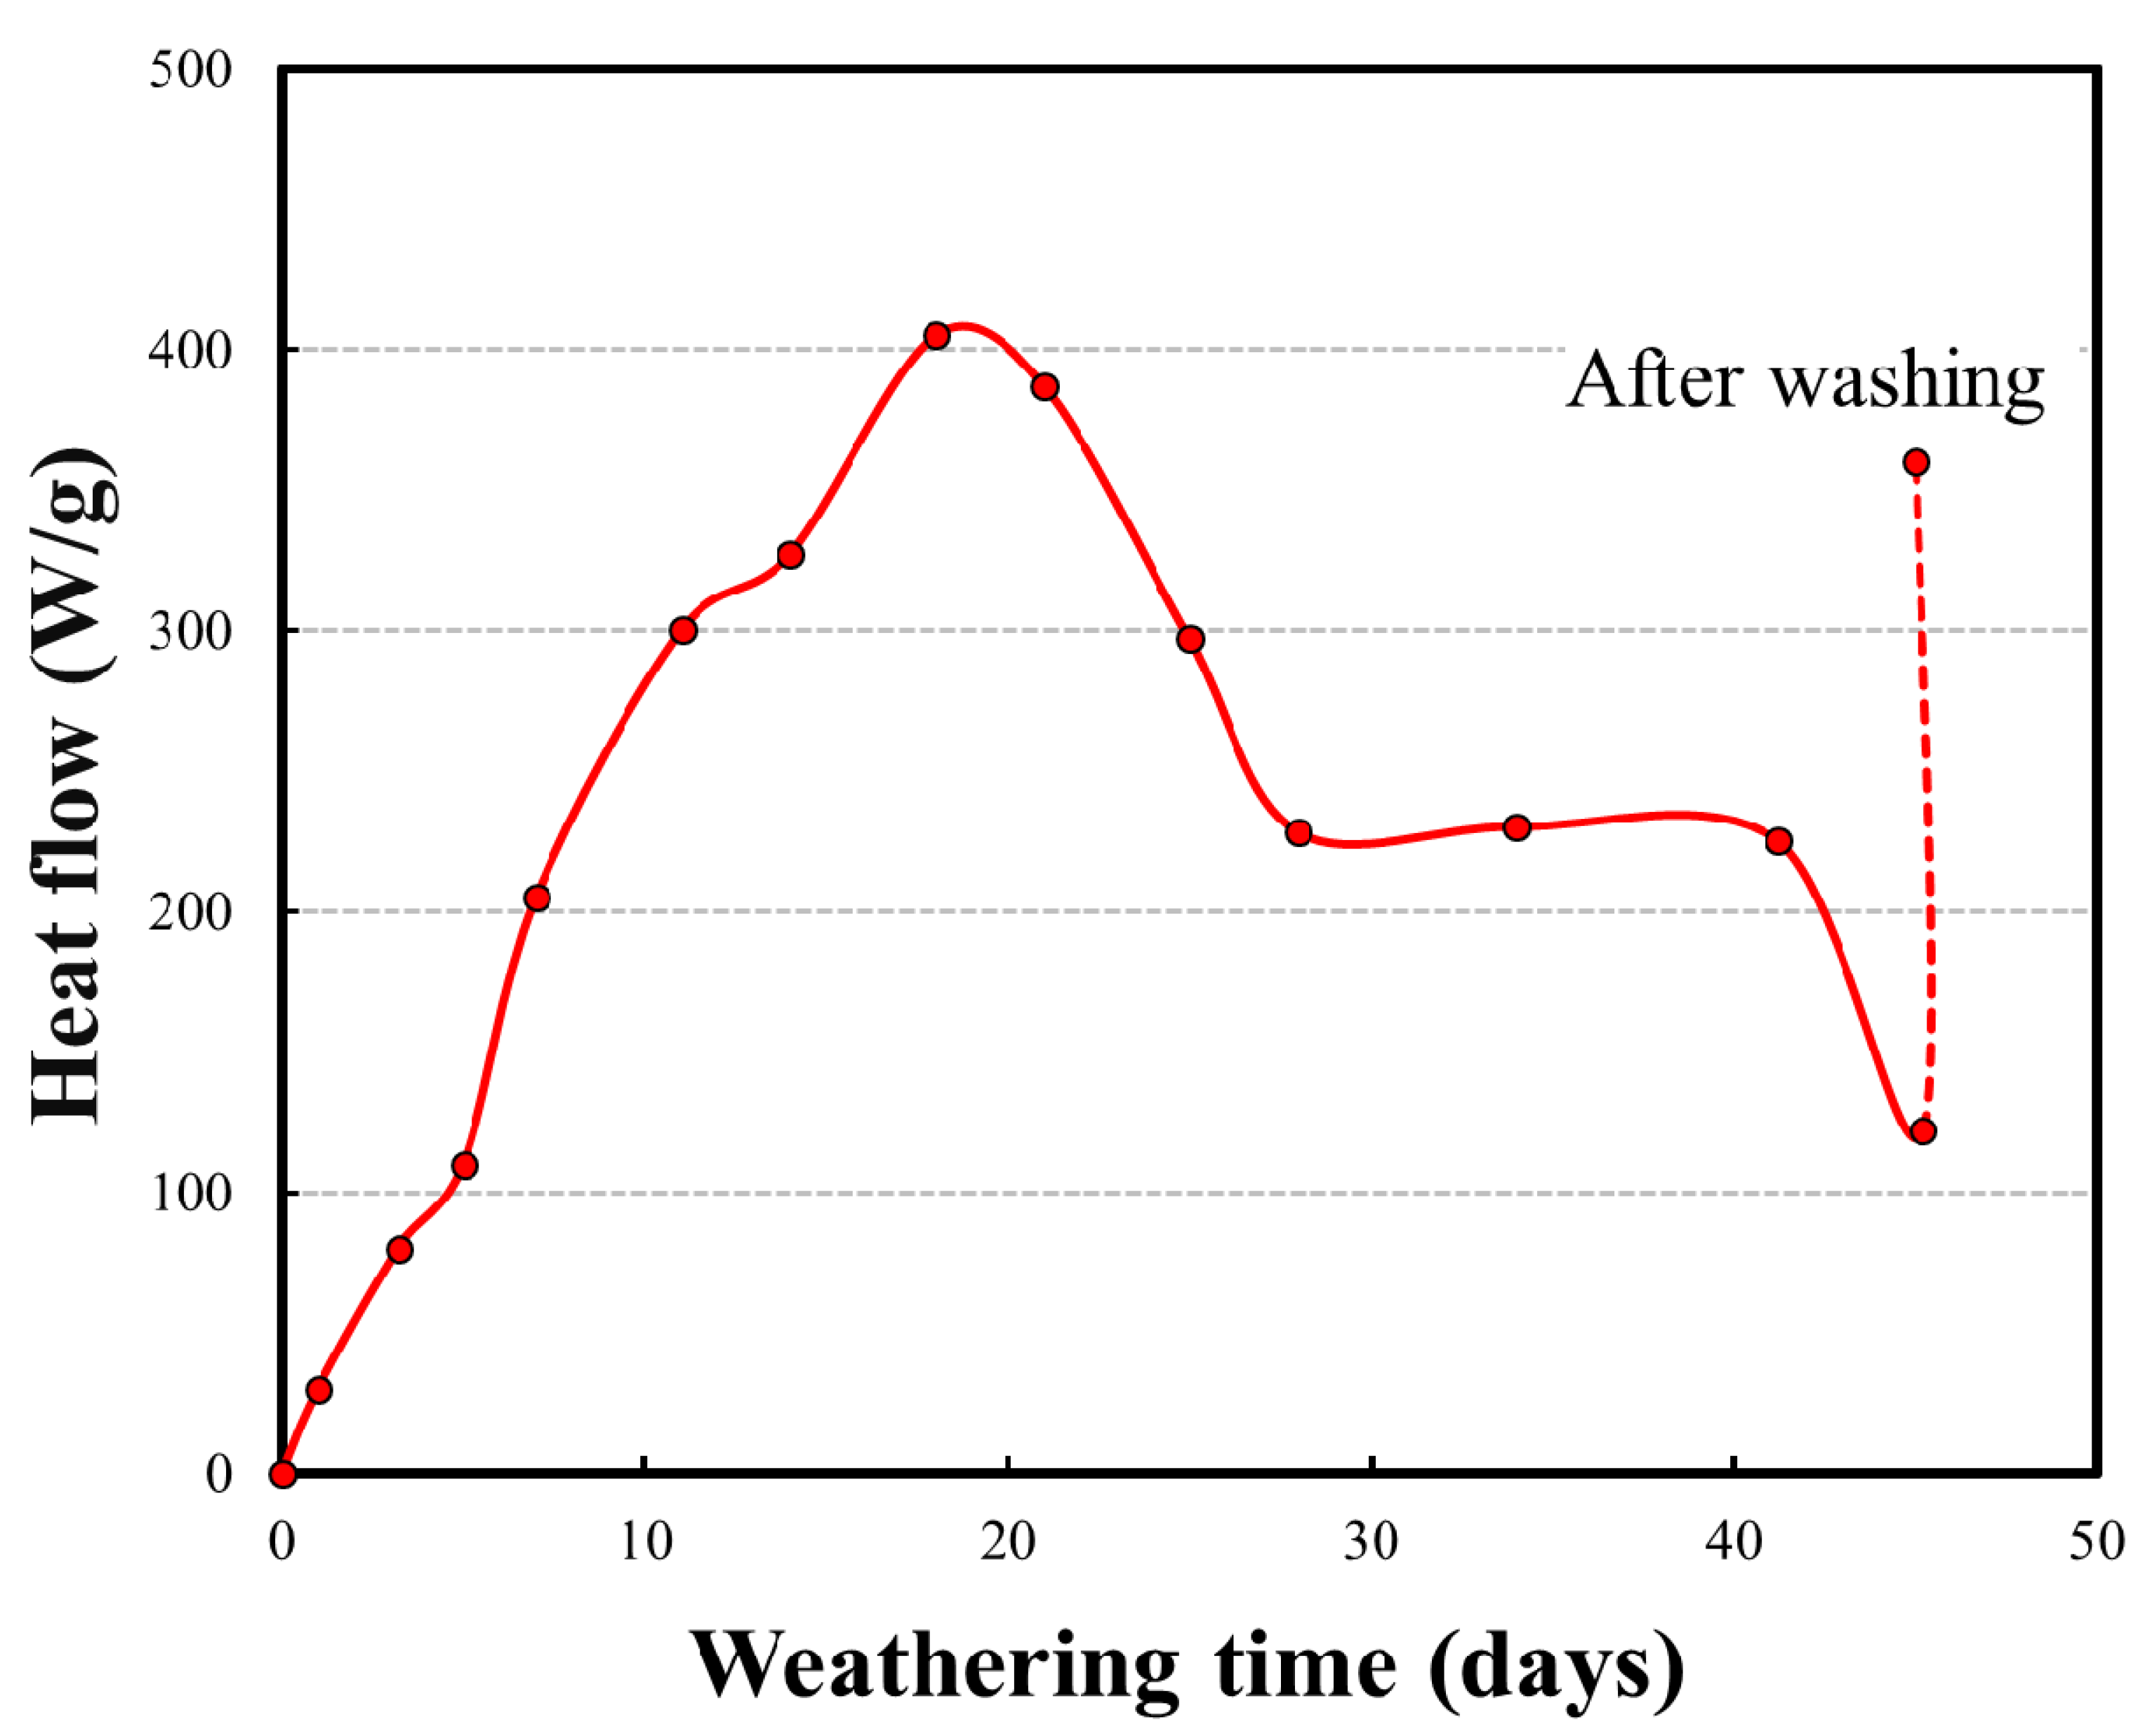
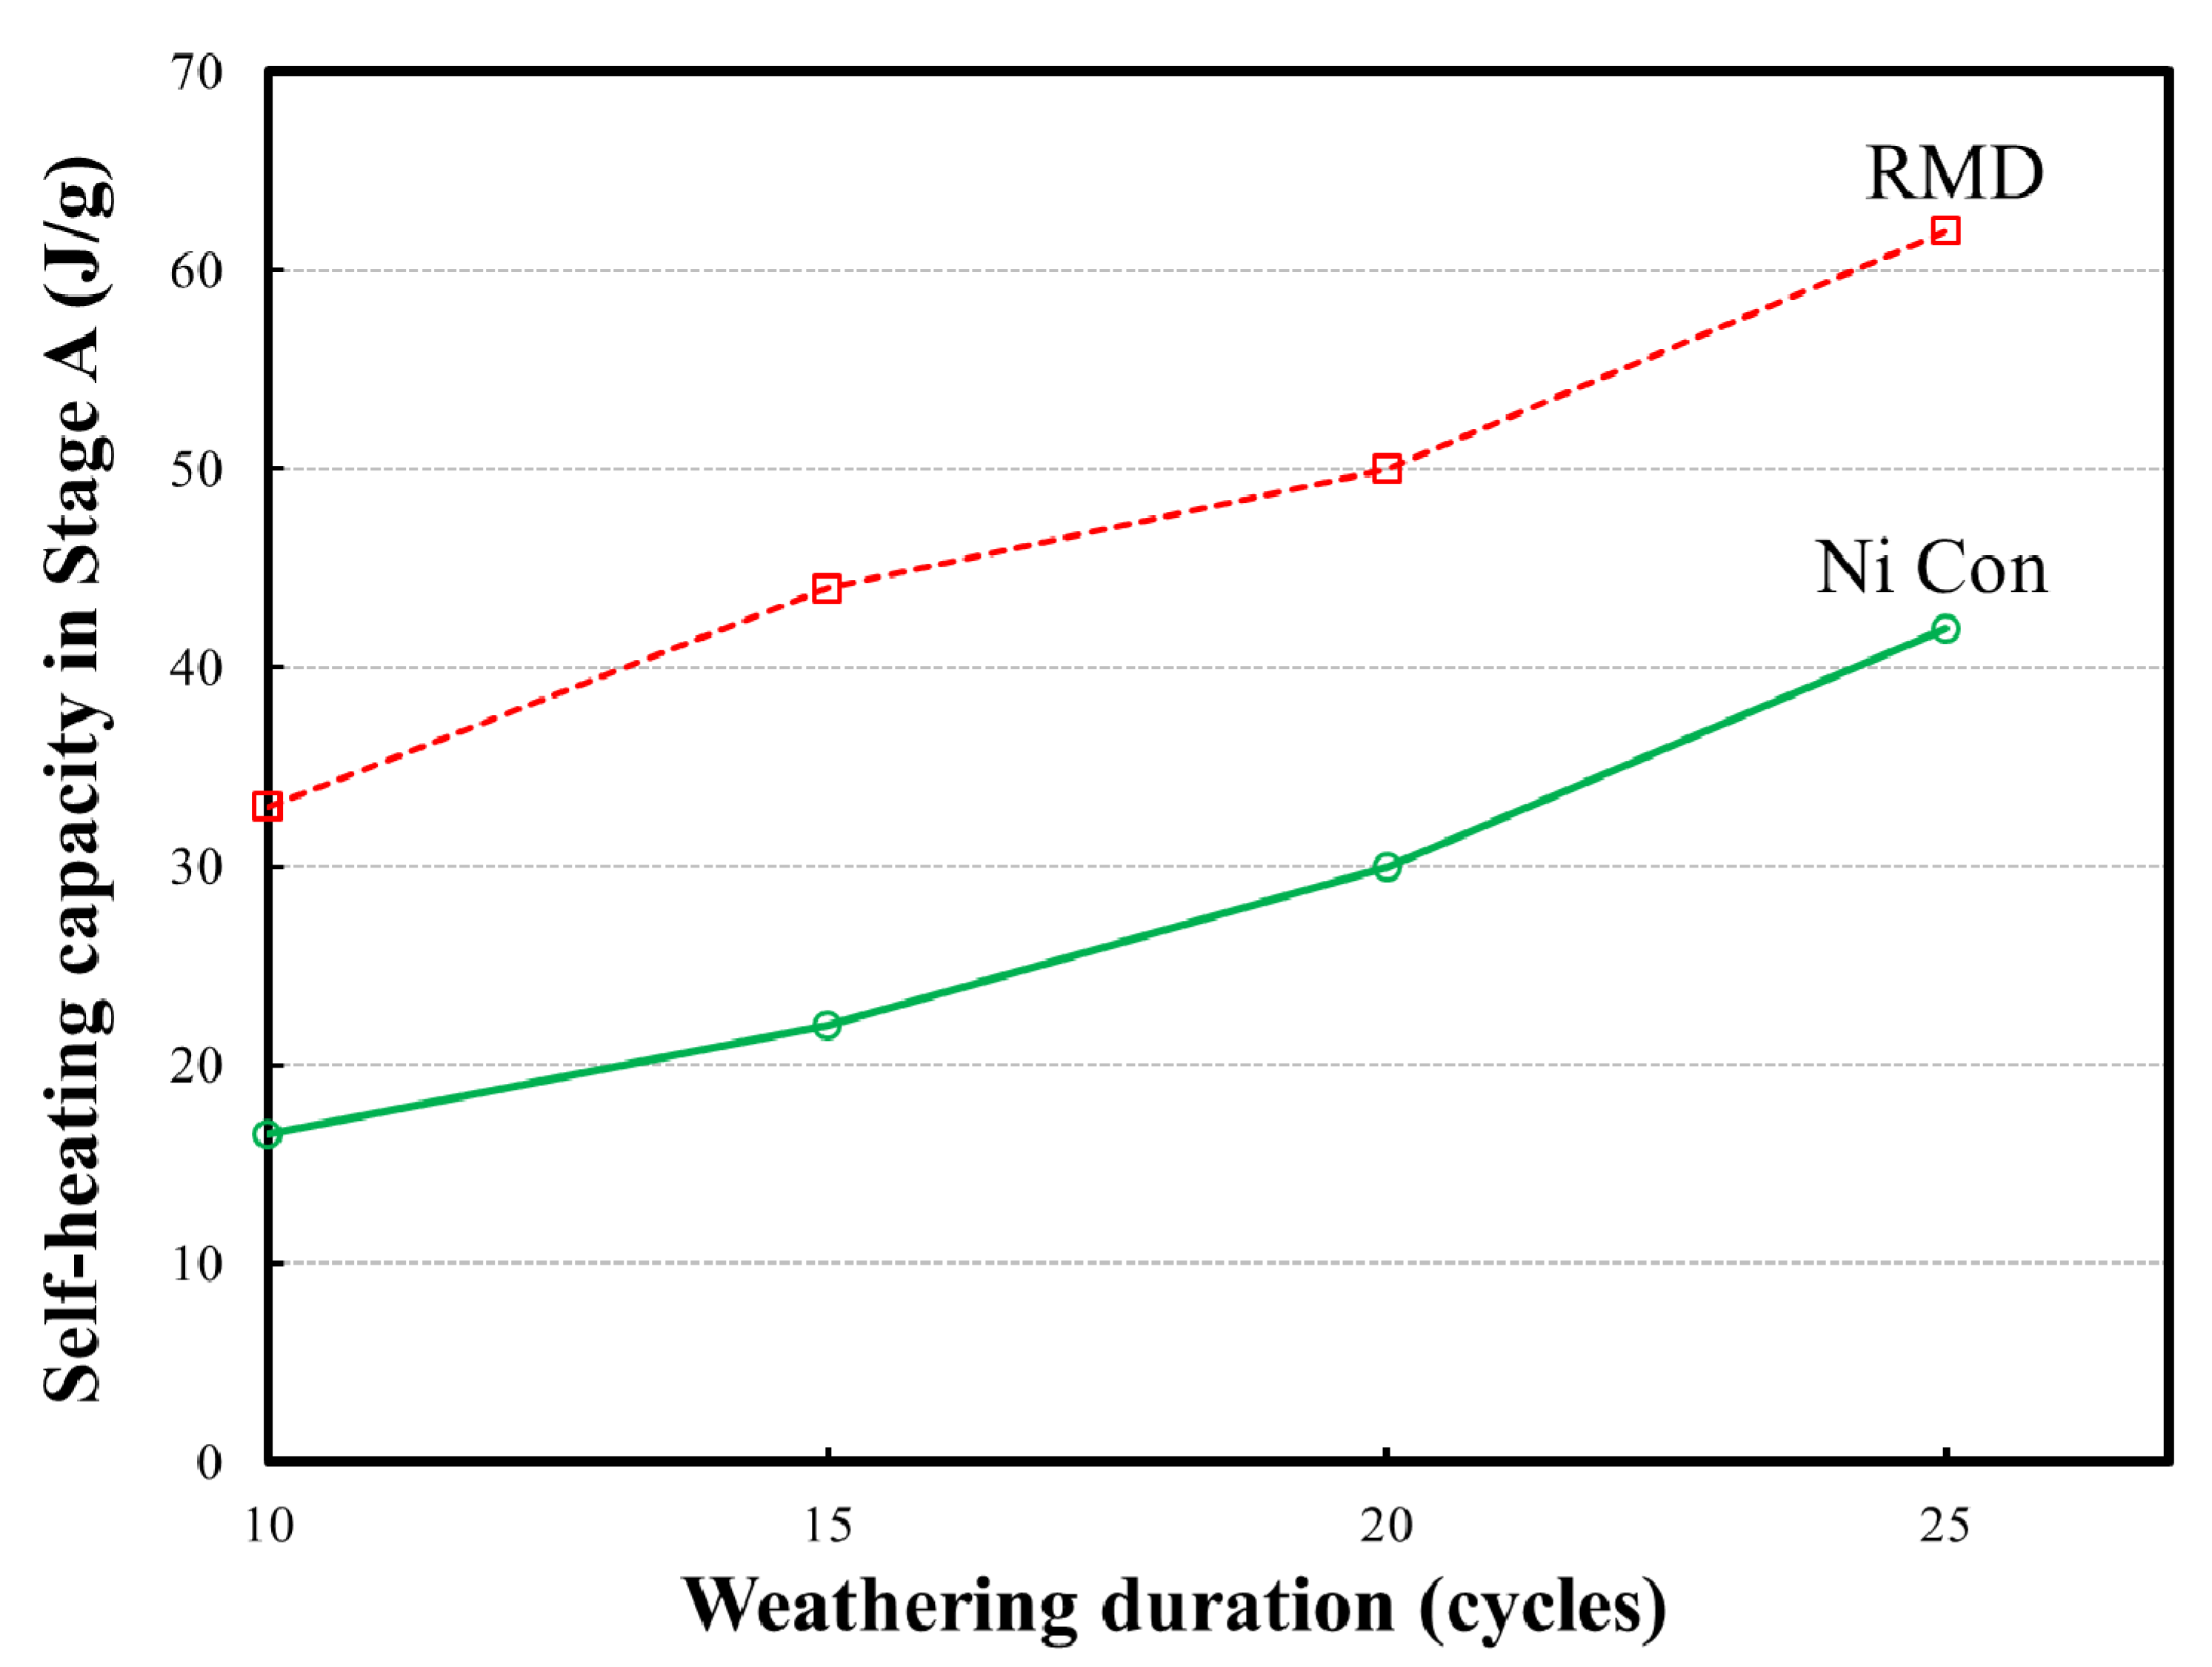
4.1.2. Effect on Self-Heating
4.2. Transition from Stage A to Stage B
4.2.1. Example of a Successful Transition
4.2.2. Example of Failure to Transition
4.2.3. Transition and Weathering
5. Discussion
6. Conclusions
Author Contributions
Funding
Conflicts of Interest
References
- Beever, P.F.; Crowhurst, D. Fire and explosion hazards associated with milk spray drying operations. Int. J. Dairy Technol. 1989, 42, 65–70. [Google Scholar] [CrossRef]
- Hudak, P.F. Spontaneous combustion of shale spoils at a sanitary landfill. Waste Manag. 2002, 22, 687–688. [Google Scholar] [CrossRef]
- Rosenblum, F.; Nesset, J.; Spira, P. Evaluation and control of self-heating in sulphide concentrates. CIM Bull. 2001, 94, 92–99. [Google Scholar]
- Payant, R.; Rosenblum, F.; Nesset, J.E.; Finch, J.A. The self-heating of sulfides: Galvanic effects. Miner. Eng. 2012, 26, 57–63. [Google Scholar] [CrossRef]
- Ninteman, D.J. Spontaneous Oxidation and Combustion of Sulfide Ores in Underground Mines: A Literature Survey; US Government Printing Office, Department of the Interior, Bureau of Mines: Washington, DC, USA, 1978; Volume 8775.
- Farnsworth, D.J.; Duties, S. Introduction to and background of sulphide fires in pillar mining at the Sullivan Mine. CIM Bull. 1977, 70, 65–71. [Google Scholar]
- Kirshenbaum, N.W. Transport and Handling of Sulphide Concentrates: Problems and Possible Improvements; Technomic Pub. Co.: Stanford, CA, USA, 1968. [Google Scholar]
- Anon. Amendments (05–19) to the International Maritime Solid Bulk Cargoes Code, Lloyd’s Register, Class News 21/2019. Available online: https://info.lr.org/l/12702/2019–11-18/86y6tv (accessed on 3 December 2020).
- Rosenblum, F.; Spira, P. Evaluation of hazard from self-heating of sulphide rock. CIM Bull. 1995, 88, 44–49. [Google Scholar]
- Wu, C.; Li, Z. A simple method for predicting the spontaneous combustion potential of sulphide ores at ambient temperature (Technical note). Min. Technol. Trans. Inst. Min. Metall. Sect. A 2005, 114, 125–128. [Google Scholar]
- Bouffard, S.C.; Senior, G.D. A new method for testing the self-heating character of sulphide concentrates. Miner. Eng. 2011, 24, 1517–1519. [Google Scholar] [CrossRef]
- Dai, Z. Development of an experimental methodology for sulphide self-heating studies and the self-heating tendency of Vale’s Voisey’s Bay Concentrator products. Miner. Eng. 2016, 92, 125–133. [Google Scholar] [CrossRef]
- Moon, S.; Frank, R.; Tan, Y.H.; Nesset, J.E.; Waters, K.E.; Finch, J.A. Examination of the United Nations self-heating test for sulphides. Can. Metall. Q. 2019, 58, 438–444. [Google Scholar] [CrossRef]
- Habashi, F. The mechanism of oxidation of sulfide ores in nature. Econ. Geol. 1966, 61, 587–591. [Google Scholar] [CrossRef]
- Tributsch, H.; Gerischer, H. The oxidation and self-heating of metal sulphides as an electrochemical corrosion phenomenon. J. Appl. Chem. Biotechnol. 1976, 26, 747–761. [Google Scholar] [CrossRef]
- Rosenblum, F.; Spira, P. Self-heating of sulphides. In Proceedings of the 13th Annual Meeting of the Canadian Minerals Processors, CIM, Ottawa, ON, Canada, 20–21 January 1981; Paper 3. pp. 34–51. [Google Scholar]
- Rosenblum, F.; Spira, P.; Konigsmann, K.V. Evaluation of hazard from backfill oxidation. CIM Bull. 1982, 75, 87–98. [Google Scholar]
- Rosenblum, F.; Spira, P. Evaluation of hazard from sulphide rock oxidation, In Proceedings of the 11th Underground Operators Conference, CIM, Saskatoon, SK, Canada, 21–24 February 1993.
- Payant, R.; Rosenblum, F.; Nesset, J.E.; Finch, J.A. Galvanic interaction and particle size effects in self-heating of sulphide mixtures. In Separation Technologies for Minerals, Coal, and Earth Resources; Young, C., Luttrell, G.H., Eds.; Society for Mining, Metallurgy, and Exploration (SME): Englewood, CO, USA, 2012; pp. 419–429. [Google Scholar]
- Rosenblum, F.; Finch, J.A.; Waters, K.E.; Nesset, J.E. A test apparatus for studying the effects weathering on self-heating of sulphides. In Proceedings of the Conference of Metallurgists (COM), Montreal, QC, Canada, 23–26 August 2015; pp. 1–12. [Google Scholar]
- Loomis, I.M.; Hughes, S.; Osborne, K.; Basyuni, J.; Samosir, E. Control of a sulfide ore thermal event in a drawpoint at PT Freeport Indonesia’s DOZ Mine, Papua, Indonesia. In Proceedings of the 12th U.S./North American Mine Ventilation Symposium, Reno, NV, USA, 9–11 June 2008; Wallace, K.G., Ed.; University of Nevada Press: Reno, NV, USA, 2008; pp. 533–538. [Google Scholar]
- Meyer, B. Elemental sulfur. Chem. Rev. 1976, 76, 367–388. [Google Scholar] [CrossRef]
- Bojes, J.; Lerbscher, J.; Wamburi, W.; Dilley, C. Elemental Sulphur in 3-phase sour gas systems—Is condensate really your ally? In Proceedings of the Norther Area Western Conference, Calgary, AB, Canada, 15–18 February 2010; pp. 1–22. [Google Scholar]
- Turova, N. Sulphur. In Inorganic Chemistry in Tables; Springer: New York, NY, USA; Berlin/Heidelberg, Germany, 2011. [Google Scholar]
- Griebel, J.J.; Glass, R.S.; Char, K.; Pyun, J. Polymerizations with elemental sulfur: A novel route to high sulfur content polymers for sustainability, energy and defense. Prog. Polym. Sci. 2016, 58, 90–125. [Google Scholar] [CrossRef] [Green Version]
- Davis, C.S.; Hyne, J.B. Thermomechanical analysis of elemental sulphur: The effects of thermal history and ageing. Thermochim. Acta 1976, 15, 375–385. [Google Scholar] [CrossRef]
- Rosenblum, F.; Finch, J.A.; Nesset, J. The key role of sample weathering in self-heating testing methodologies for sulphides. In Proceedings of the XXVII International Mineral Processing Congress (IMPC), Santiago, Chile, 20–24 October 2014; pp. 111–123. [Google Scholar]
- Steger, H.F. Determination of the elemental sulphur content of minerals and ores. Talanta 1976, 23, 395–397. [Google Scholar] [CrossRef]


Publisher’s Note: MDPI stays neutral with regard to jurisdictional claims in published maps and institutional affiliations. |
© 2020 by the authors. Licensee MDPI, Basel, Switzerland. This article is an open access article distributed under the terms and conditions of the Creative Commons Attribution (CC BY) license (http://creativecommons.org/licenses/by/4.0/).
Share and Cite
Moon, S.; Rosenblum, F.; Tan, Y.; Waters, K.E.; Finch, J.A. Transition of Sulphide Self-Heating from Stage A to Stage B. Minerals 2020, 10, 1133. https://doi.org/10.3390/min10121133
Moon S, Rosenblum F, Tan Y, Waters KE, Finch JA. Transition of Sulphide Self-Heating from Stage A to Stage B. Minerals. 2020; 10(12):1133. https://doi.org/10.3390/min10121133
Chicago/Turabian StyleMoon, Sungjae, Frank Rosenblum, Yuehua Tan, Kristian E. Waters, and James A. Finch. 2020. "Transition of Sulphide Self-Heating from Stage A to Stage B" Minerals 10, no. 12: 1133. https://doi.org/10.3390/min10121133