1. Introduction
Ion flotation involves the separation and concentration of ions from solution, through the promotion of surfactant adsorption onto rising air bubbles, forming a foam, and then capturing the foam via an overflow launder. Although this powerful technique has been used in laboratories for over half a century [
1,
2,
3], its effectiveness in industry has been far more limited due to the limited volumetric fluxes that can be applied.
The amphiphilic structure of surfactants and their adsorption at the surface of the air bubbles serve a dual purpose, firstly stabilizing the interface sufficiently to form a foam, and secondly in providing selective interactions and associations with valuable counter ions [
1,
4,
5]. While this work is concerned exclusively with soluble systems, in some instances the froth drainage yields a concentration increase sufficient for achieving precipitation. It is noted that the present work excludes particulate flotation, which involves very different mechanisms, including irreversible adhesion. Ion flotation by contrast involves reversible adsorption.
To date, ion flotation has been used in a variety of applications including assisting in wastewater treatment operations [
6,
7], metal recovery [
8,
9,
10], and the separation of radioactive elements from solutions [
11]. Ion flotation can be used for removing pollutants in water [
12] and replace slow coagulation, filtration, and sedimentation steps that are currently used due to charges on colloids which make up the pollutants [
13]. There is a need for new and effective technologies that can be applied to hydro-metallurgical solutions, especially within the new and emerging circular economy, and of course the mining industry. Complex solutions containing metal ions formed from the crushing and dissolution of circuit boards and other electronic components will need to be separated on an increasingly large scale. Ion flotation offers the potential for developing selective separations utilizing air bubbles as the hydrophobic substrate and suitable reagent, with the potential to recover down to exceedingly low concentrations, less than a ppm.
Previous studies on ion flotation lack information on optimum conditions as well as quantitative knowledge of the fundamental physical mechanisms involved [
3,
4,
14]. Some studies have also found deficiencies in utilizing chemical and physicochemical mechanisms to control the process [
15]. Continued research into improving the selectivity of surfactants used is required to better understand the factors that influence selectivity and to continue reducing the cost of the process [
16,
17,
18,
19]. It has been found that ions with higher valences have higher selectivity over lower valences [
1,
2,
20,
21,
22]. Studies have focused on the role of bubble size in minimizing liquid entrainment to less than 10% [
11,
23,
24,
25,
26]. Flotation columns with counter current flow are commonly used [
3,
27]. Models have been developed and investigated for ion flotation, aimed at establishing the relationship between the recovery and the volumetric feed to gas ratio,
[
8].
This research is concerned with addressing the major weakness of ion flotation, the highly constrained relationship between the liquid feed flux, surfactant recovery, and upgrade. The surfactant recovery provides the direct link to the metal ion recovery. As the feed flux increases, it is necessary to also increase the gas flux in order to preserve the opportunity for surfactant recovery. Physically, the liquid flux that reports with the foam to the overflow increases at an increasing rate as the gas flux increases, meaning that the entrainment of water and other ions increases, in turn reducing the product upgrade. In general, it can be stated that
where
U is the upgrade of the surfactant,
R the surfactant recovery, and
V the volume reduction, that is the ratio of feed to overflow fluxes. Similarly, for a fixed feed flux, it is possible to increase the recovery of the surfactant through an increase in the gas flux, but this again causes a reduction in the upgrade due to a decrease in volume reduction.
Recently, Ireland et al. [
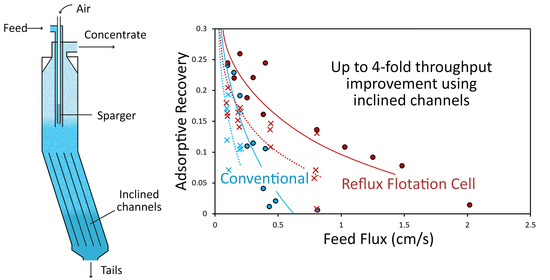
28] reported for the first time on the application of the reflux flotation cell (RFC) in ion flotation.
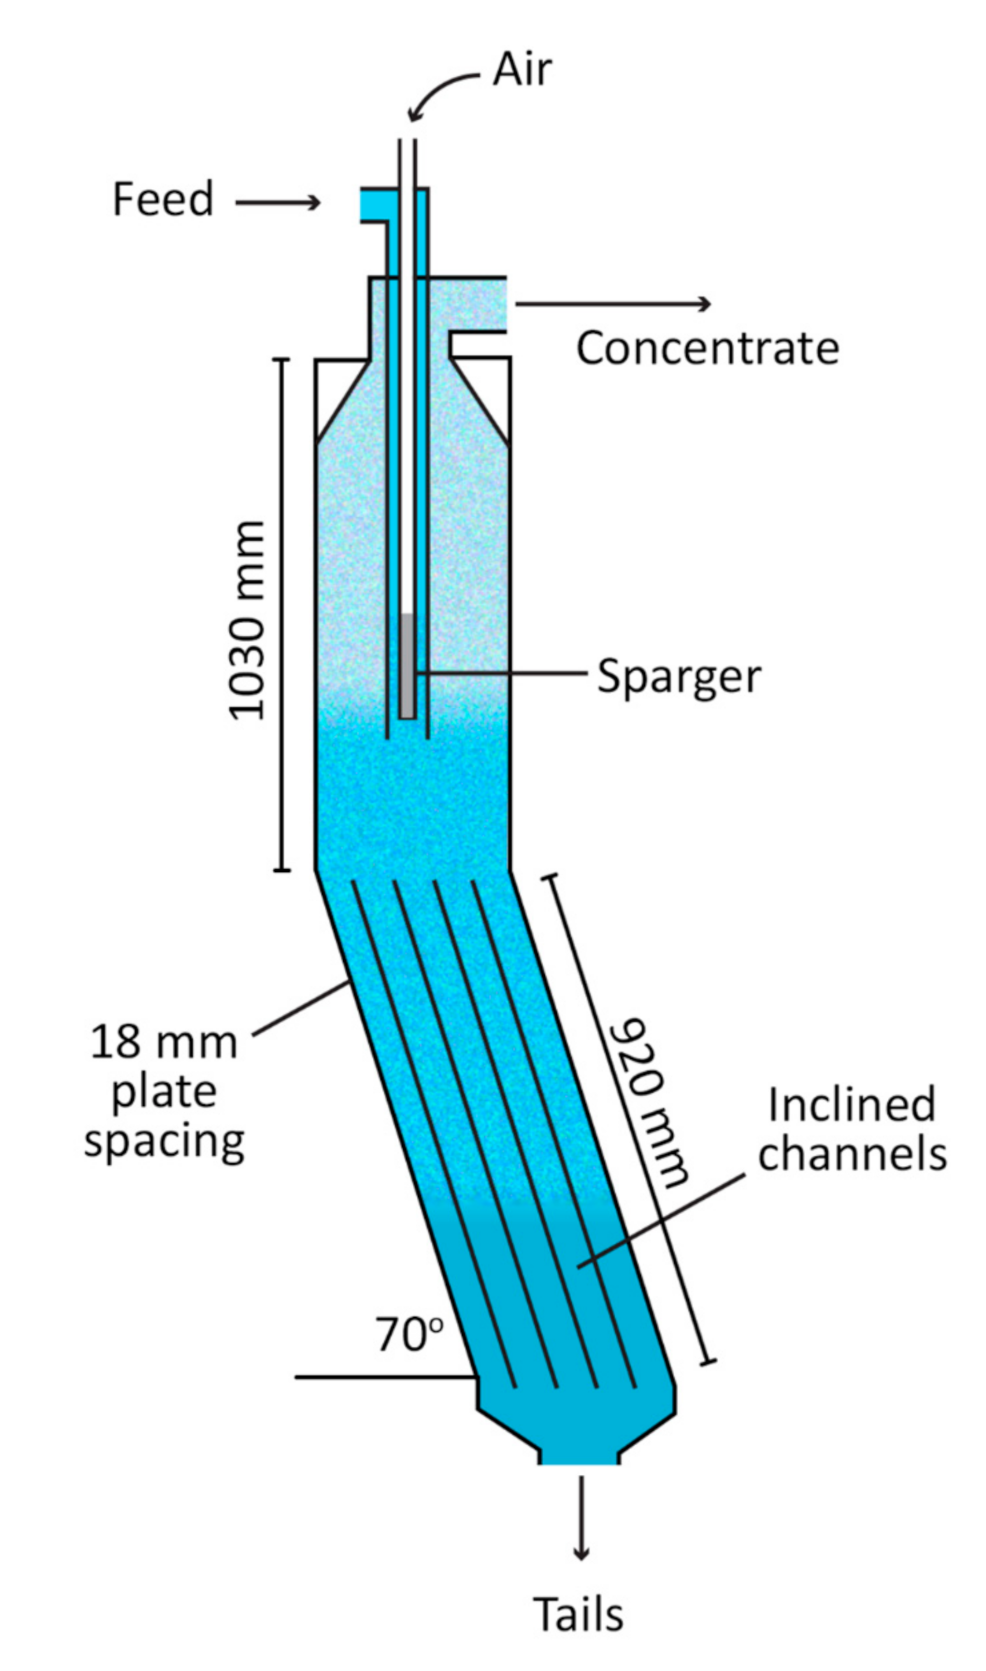
Figure 1 provides a schematic representation of the system showing the upper vertical section and lower system of inclined channels. The RFC achieved extraction rates three times higher than for a conventional system due to the system of inclined channels. The inclined channels promote the segregation between the bubbles and the liquid, via the so-called Boycott effect, even under flooding conditions [
29,
30,
31].
This RFC hydrodynamic system provides a means for decoupling the link between the input gas flux and the liquid flux that reports with the foam to the overflow product. The RFC can be run as a conventional steady state separator with the interface between the bubbly zone and upper foam, all contained within the upper vertical section, and no bubbles entering the inclined channels. This depends on the parameters chosen for the system; if bubbles enter the channels, the system is in a hydrodynamic state not achievable with a conventional cell.
The feed and tailings fluxes are fixed through the actions of peristaltic pumps, and thus the liquid split to the overflow, and volume reduction, are also fixed. This represents a critical state in which the position of the said interface can gradually develop either an upward or downward velocity. In conventional flotation that migration of the interface is overcome by replacing the lower underflow pump with a simple vented discharge, allowing a unique equilibrium separation to be achieved. In this mode, an increase in the gas flux automatically produces an increase in the liquid flux reporting to the overflow, and hence change in the liquid split between overflow and underflow, with little change in the position of the interface. However, in the RFC, operated using a fixed liquid split through the use of an underflow pump, the interface between the bubbly zone and the foam develops a downwards velocity, migrating into the lower system of inclined channels. Here the bubbles experience an increase in their segregation from the underflow liquid, hence the interface establishes a new equilibrium position at some distance down into the inclined channels. This means the RFC secures an increase in recovery due to the increase in the gas flux, but no decrease in volume reduction given the liquid split is fixed. Moreover, a further increase in the gas flux should lead to an even higher recovery, again with no change in the volume reduction.
Ireland et al. [
28] examined the application of the reflux flotation cell using a fixed volume reduction,
V, of 20. Their goal was to maximize the upgrade achievable, and to also maximize the feed flux. In this work they discovered a key limitation of the approach, the tendency for bubble coalescence, and hence loss of adsorbed product due to this high volume reduction. The ratio of the gas flux, relative to the sum of the gas and liquid fluxes, reporting to the overflow was quantified and shown to be a key factor in identifying this condition. While the work was successful in developing an understanding of the system in this context, the conditions were not conducive to supporting a more holistic understanding of the process, one where there is strong resilience to bubble coalescence, and hence bubble number conservation. This new study was therefore focused on more idealized conditions in which the tendency for bubble coalescence was reduced. In this work the volume reduction was set equal to
V = 5. Thus, the relationship between the liquid flux reporting to the overflow in a conventional system could be better-described through drift flux calculations, without the need to consider the possibility of coalescence. It was also possible to describe the operation of the RFC in the absence of coalescence. It is noted however that in extending the conditions to higher volume fractions in the overflow foam it was possible to induce coalescence and to then examine the consequences. Another refinement in this study is recognition of the importance of polydispersity in the initial bubble size distribution. The bubbles are segregated by size as soon as they enter the cell via the downcomer, often leading to significantly smaller bubbles entering the inclined channels than rise into the upper part of the cell. The effect of this segregation is captured for the first time by more extensive bubble size measurements.
The basic principle of ion flotation is to upgrade the concentration of a surface-active species by having it adsorb to bubbles. The bubble surface flux—i.e., the bubble surface area that passes through a unit area of the cell cross-section—is given by
where
is the gas flux and
D the Sauter mean diameter of the bubbles. The flux of the adsorbed species is the surface area flux multiplied by the amount adsorbed per unit bubble surface area at equilibrium,
. At surfactant concentrations well below the critical micelle concentration, the Langmuir adsorption isotherm for the surfactant may be approximated by
, where
s is the slope of the isotherm and
is the local bulk concentration of the surfactant. Thus, the adsorbed species flux in Mol·m
−2·s
−1 is
Application of an overall material balance to the system at steady state gives
where
,
, and
are the concentrations of surfactant in the feed, product, and tailings, and
,
, and
are the feed, product, and tailings liquid volumetric fluxes. This, and all subsequent analyses, assume that the cross-sectional area of the vessel is constant. The product flux is given by
Here, it is assumed that the liquid below the foam is well-mixed and hence all the liquid within the vessel is at the tailings concentration,
. The product flux includes the surfactant in the recovered bulk liquid, but also the surfactant adsorbed to the bubbles—thus resulting in a product with an upgraded overall concentration. This upgrade,
U, is defined as the ratio of product to feed concentration. The other critical parameter characterizing the process is the recovery,
R, which is defined as the fraction of surfactant entering the cell in the feed that is recovered in the product. The relationship between recovery and upgrade is determined by the volume reduction
V, the ratio of the feed to the product liquid flux (i.e., the inverse of the fraction of feed liquid reporting to the product), as indicated by Equation (1). While it seems at first from Equation (1) that a large volume reduction is automatically desirable, it should be noted that the greater the volume reduction, the smaller the fraction of unadsorbed surfactant reporting to the product in the bulk liquid. It is therefore often desirable to achieve the required upgrade with several stages at lower volume reduction, to avoid losing most of the valuable species. Since the recovery
, it can be written in terms of the operating parameters as
Note that the adsorption term is present in the denominator as well as the numerator—the adsorption process occurs primarily in the downcomer, and thus surfactant is introduced to the cell adsorbed to bubbles as well as in the bulk feed liquid. The above measure of recovery is not always the most useful, since even in the absence of gas, a surfactant flux
reports to the product by default. Since
, we can define the adsorptive recovery,
, as the total recovery minus this ‘default’ component:
It is often convenient to use this adsorptive recovery instead of the ‘full’ recovery, to make comparisons between operation at different values of the volume reduction.
In reality, the liquid and gas fluxes are not independent, but are coupled by hydrodynamics. In a vertical system like the RFC, at steady state, bubbles and liquid must be in mechanical equilibrium, implying that the drag force and buoyancy forces on both bubbles and liquid are in balance. Systems of this type are often modeled using drift flux analysis, introduced by Wallis [
32] and Rietema [
33]. The ‘drift flux’ in this case is the flux of the gas phase relative to the total volumetric flux (gas plus liquid) and is given by
where
is the gas holdup (the volumetric fraction of gas) and
the generic liquid flux. This in turn can be expressed in terms of the terminal rise velocity of an isolated bubble,
, by an ‘inverted hindered settling model’. The Richardson–Zaki equation [
34] fulfils this function:
While the Richardson–Zaki equation is of limited applicability for very high volume fractions of the dispersed phases (i.e., very high gas holdup values), this system is not operated in those regimes. Richardson and Zaki’s recommended value for
n as a function of bubble size for rigid spheres is used throughout [
35].
Figure 2 shows Equations (8) and (9) plotted on the same axes. Where the operating line (8) intersects with the drift-flux curve (9), the bubbly medium has a stable solution. Where several solutions exist (e.g., operating line
b), these tend to stratify into foam and bubbly liquid layers. This introduces a problem. From Equations (6) and (7), we see that in order to increase the throughput (i.e., the feed flux), the bubble surface flux must also be increased to maintain recovery of the surfactant. However, depending on the bubble size and other parameters, one of two things happens when a critical combination of gas and liquid velocity is reached. For a constant value of the volume reduction,
V, the product flux increases proportionally with the feed flux—and so does the tails flux. If the bubbles are relatively small, their terminal rise velocity may be small enough that they entrain downwards into the tails stream. If the bubbles are larger, the increase in the gas and liquid fluxes eventually results in a transition from operating line
b to operating line
c in
Figure 2. The result is ‘flooding’, where the distinct bubbly liquid and foam zones in the cell merge to form a single phase with a relatively high gas holdup, similarly resulting in the entrainment of bubbles into the tails. It is crucial to note the presence of the gas holdup in Equations (8) and (9). It is not just the tails liquid flux, relative to the bubble terminal velocity, that determines entrainment of bubbles into the IC and/or tails—the gas flux also increases the gas hold-up for a set liquid flux, and more dense bubbles are more easily entrained by the tails flux (“inverted hindered settling”). In either case, this represents a loss of bubble surface flux from the product, decreasing both recovery and upgrade. The threshold for these undesirable behaviors is dependent on the bubble terminal rise velocity, with their onset occurring at lower liquid and gas fluxes for smaller bubbles. The terminal velocity operates like a scalar in the problem. However, since the bubble surface flux is inversely proportional to the bubble diameter for a given gas flux, there is generally no real advantage to increasing the bubble size, and the maximum bubble surface flux does not vary substantially with bubble size. The hydrodynamics of the bubble-liquid coupling thus imposes a fundamental limitation on the process.
The RFC offers a solution to this problem by improving the segregation of bubbles and liquid in the tails stream, making it more difficult for bubbles to be entrained into the tails. As a result of the Boycott effect, the effective terminal bubble rise velocity
in the inclined channels (IC) is increased by a capacity advantage
F, given empirically by Laskovski et al. [
31] as
where
L,
Z, and
are, respectively, the utilised channel length, perpendicular channel spacing, and angle of inclination of the channels with the horizontal, and
is the bubble Reynolds number. The bubbles in these experiments (
D < 0.5 mm) are assumed to behave as hard spheres, and thus have the terminal velocity given by Zigrang and Sylvester [
36]:
where
with g,
, and
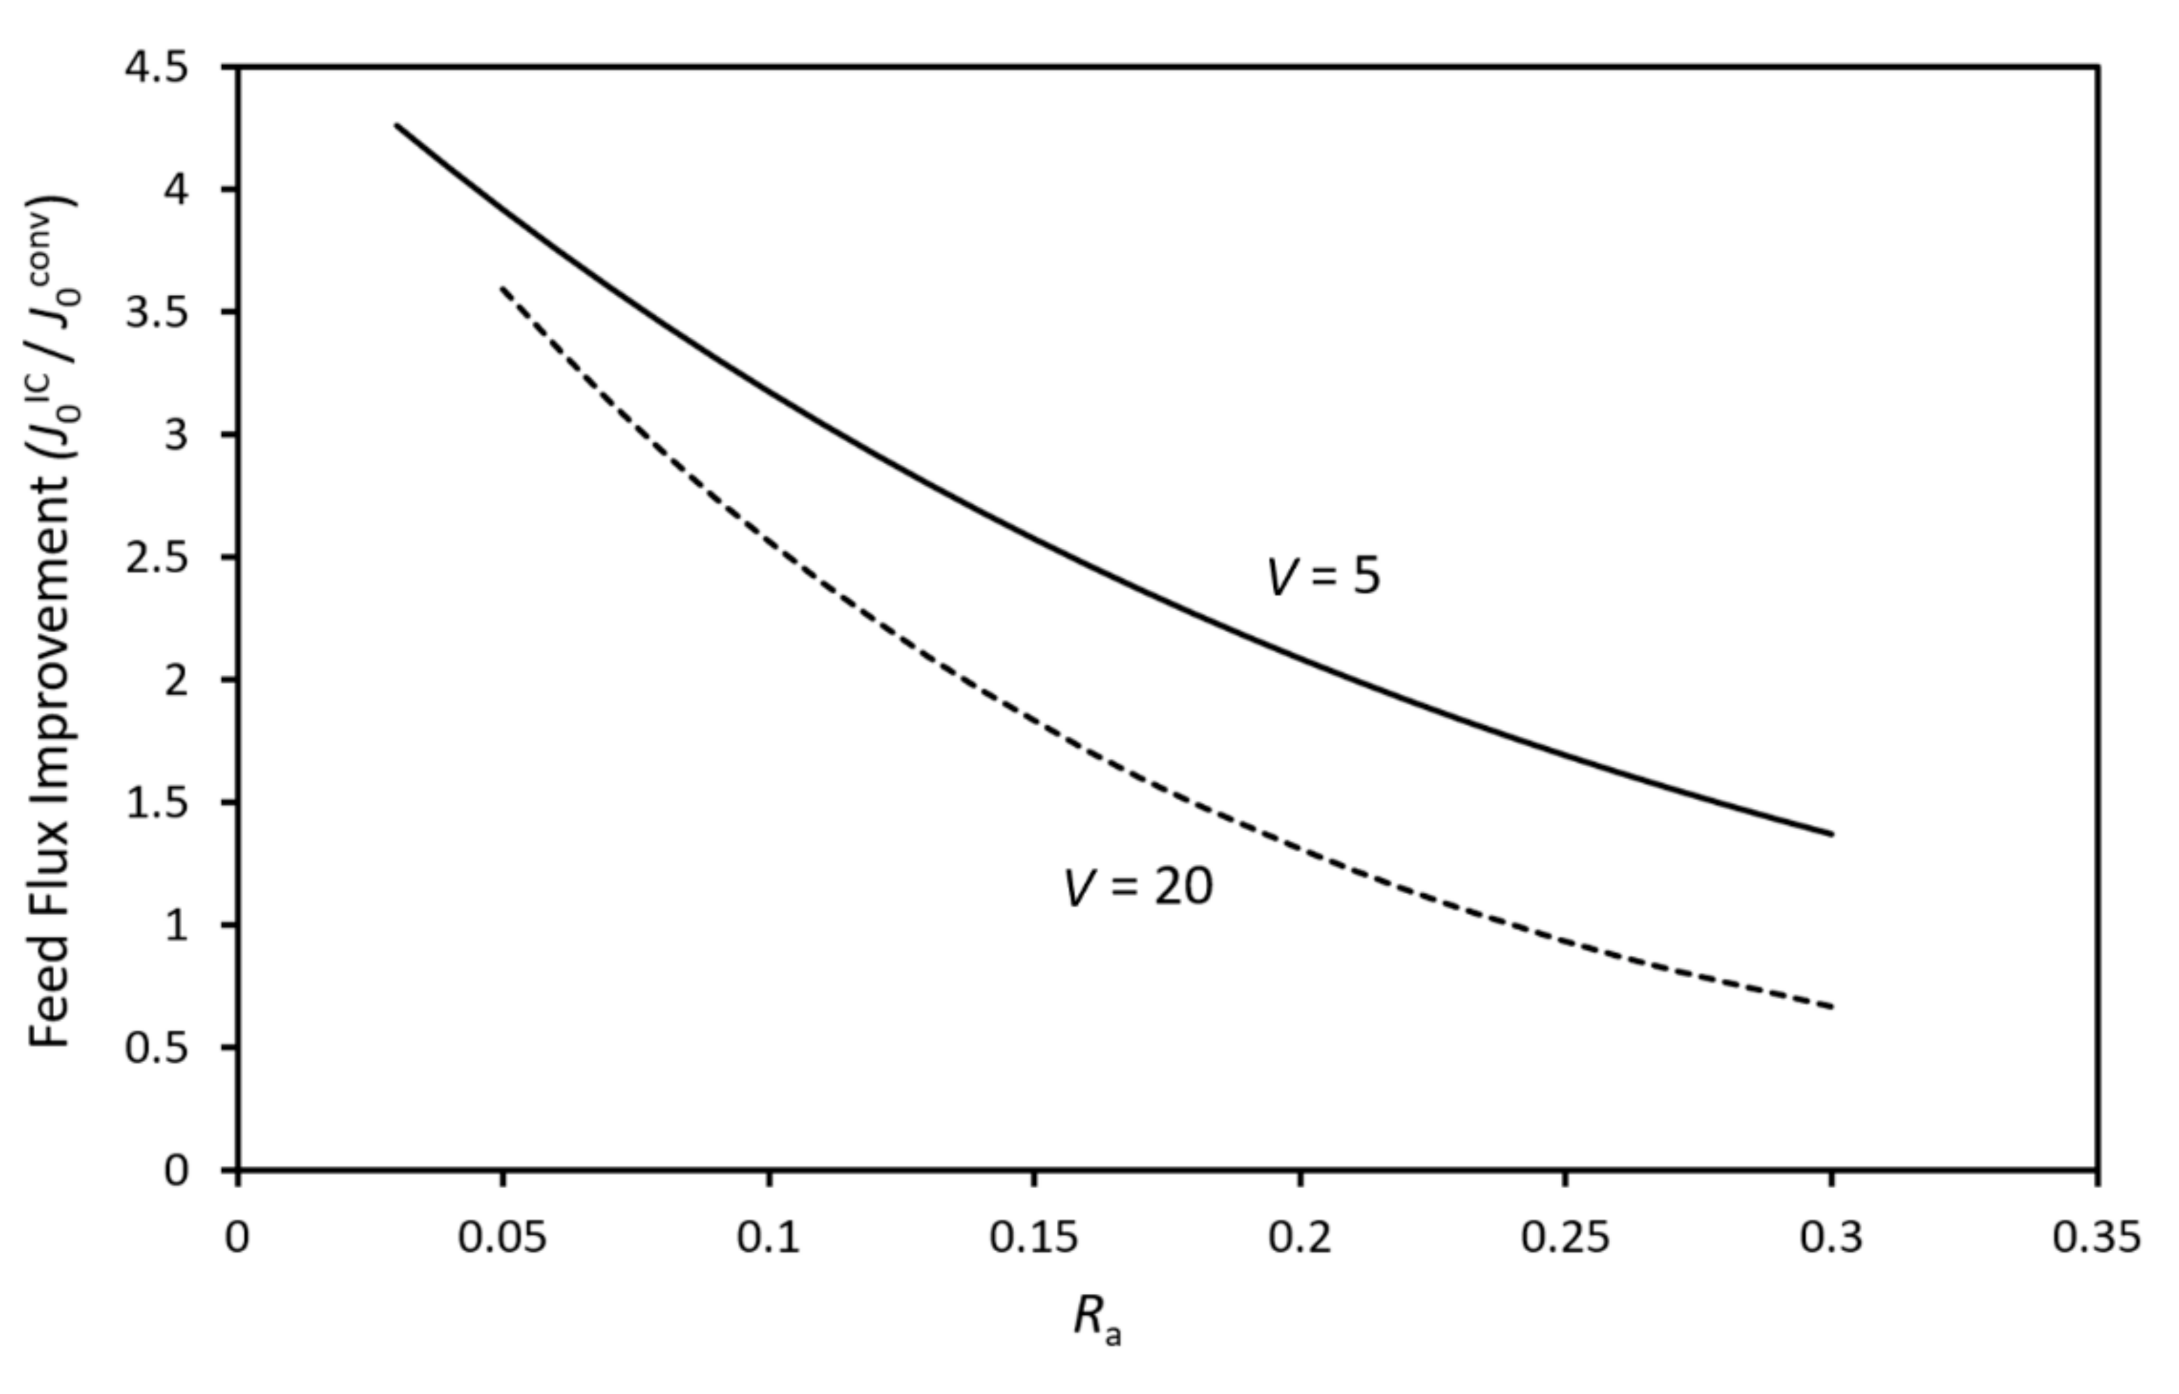
, respectively, the acceleration due to gravity, liquid density, and liquid dynamic viscosity. Interestingly, Equation (10) implies that the capacity advantage conferred by the channels approaches a limit of
as the aspect ratio of the channels becomes very large. It is noted the capacity advantage in the tangent direction of the inclined channels is simply
[
31].
The relationship between feed flux and maximum achievable recovery can now be predicted for both the conventional case (no bubbles in the IC) and for operation with bubbles in the IC. The detailed implementation of this model to determine stable solutions for the gas and liquid fluxes and gas holdup in various parts of the RFC was described in detail in [
28] and is in most respects identical here. Unlike in the previous study, where the feed and gas flow rates were both predetermined, the gas flux was gradually increased for a given feed flux until just before bubbles entered the IC section (the limit of the conventional case), and then further increased until just before bubbles were observed to leave the IC via the tails. It was hoped that this would produce a data set more focused on the critical issue here—the transition between conventional operation and operation using the IC, and then the limits of operation using the IC of a given length.
One factor that was not considered in that previous work was segregation of the initial polydisperse bubble size distribution between the product and tails streams. This occurs in the ‘split zone’ around the downcomer, where the liquid diverges and travels either upward or downward. Given that smaller bubbles have a lower terminal rise velocity, these tend to be entrained downwards, leading to a smaller mean bubble size below the downcomer than above it. Bubble diameters were measured in both regions in the current work. This difference is significant in many cases, in terms of the achievable range of operation of the system. The bubble diameter below the downcomer was used to calculate the capacity advantage of the system via Equations (10)–(12).
Another important factor, dealt with briefly in the previous work but investigated in much more detail here, is bubble coalescence. Coalescence tends to occur under conditions of high gas hold-up i.e., where the ratio of gas flux to feed flux is large—further decreasing the limiting recovery of the system. Coalescence reduces the bubble surface area flux and releases adsorbed surfactant to the bulk, thus altering the adsorbed surface concentration. Even assuming very rapid adsorption and desorption, this will result in a vertical variation in the bulk and surface concentration. Convective mixing in the foam layer, which occurs primarily under low gas hold-up conditions, will tend to reduce this vertical concentration gradient. The interplay of these mechanisms, and their effect on recovery, is complex. However, the effect of the loss of bubble surface flux in the product can be assessed to some extent by measuring both the initial bubble diameter
and that in the product at the top of the cell
(after coalescence). If the bulk concentrations of surfactant at the inlet and top outlet are, respectively,
and
, we would expect the recovery to be given by
A large part of the rationale for moving to a volume reduction of 5 in this work (from 20 in [
28]) was to work with a larger product liquid flux for an equivalent feed flux, thus greatly suppressing coalescence in order to align the research findings with the physical understanding of the system described in this paper.
4. Discussion
The system was modeled using the drift flux formulation described earlier, with the same system parameter values as determined in the previous work on the same system [
28]. For the new
V = 5 regime, we now have measurements of the bubble diameter both above and below the downcomer outlet, and are able to characterize the effect of bubble size segregation in the split zone (the region near the downcomer where the feed flux splits into product and tails streams).
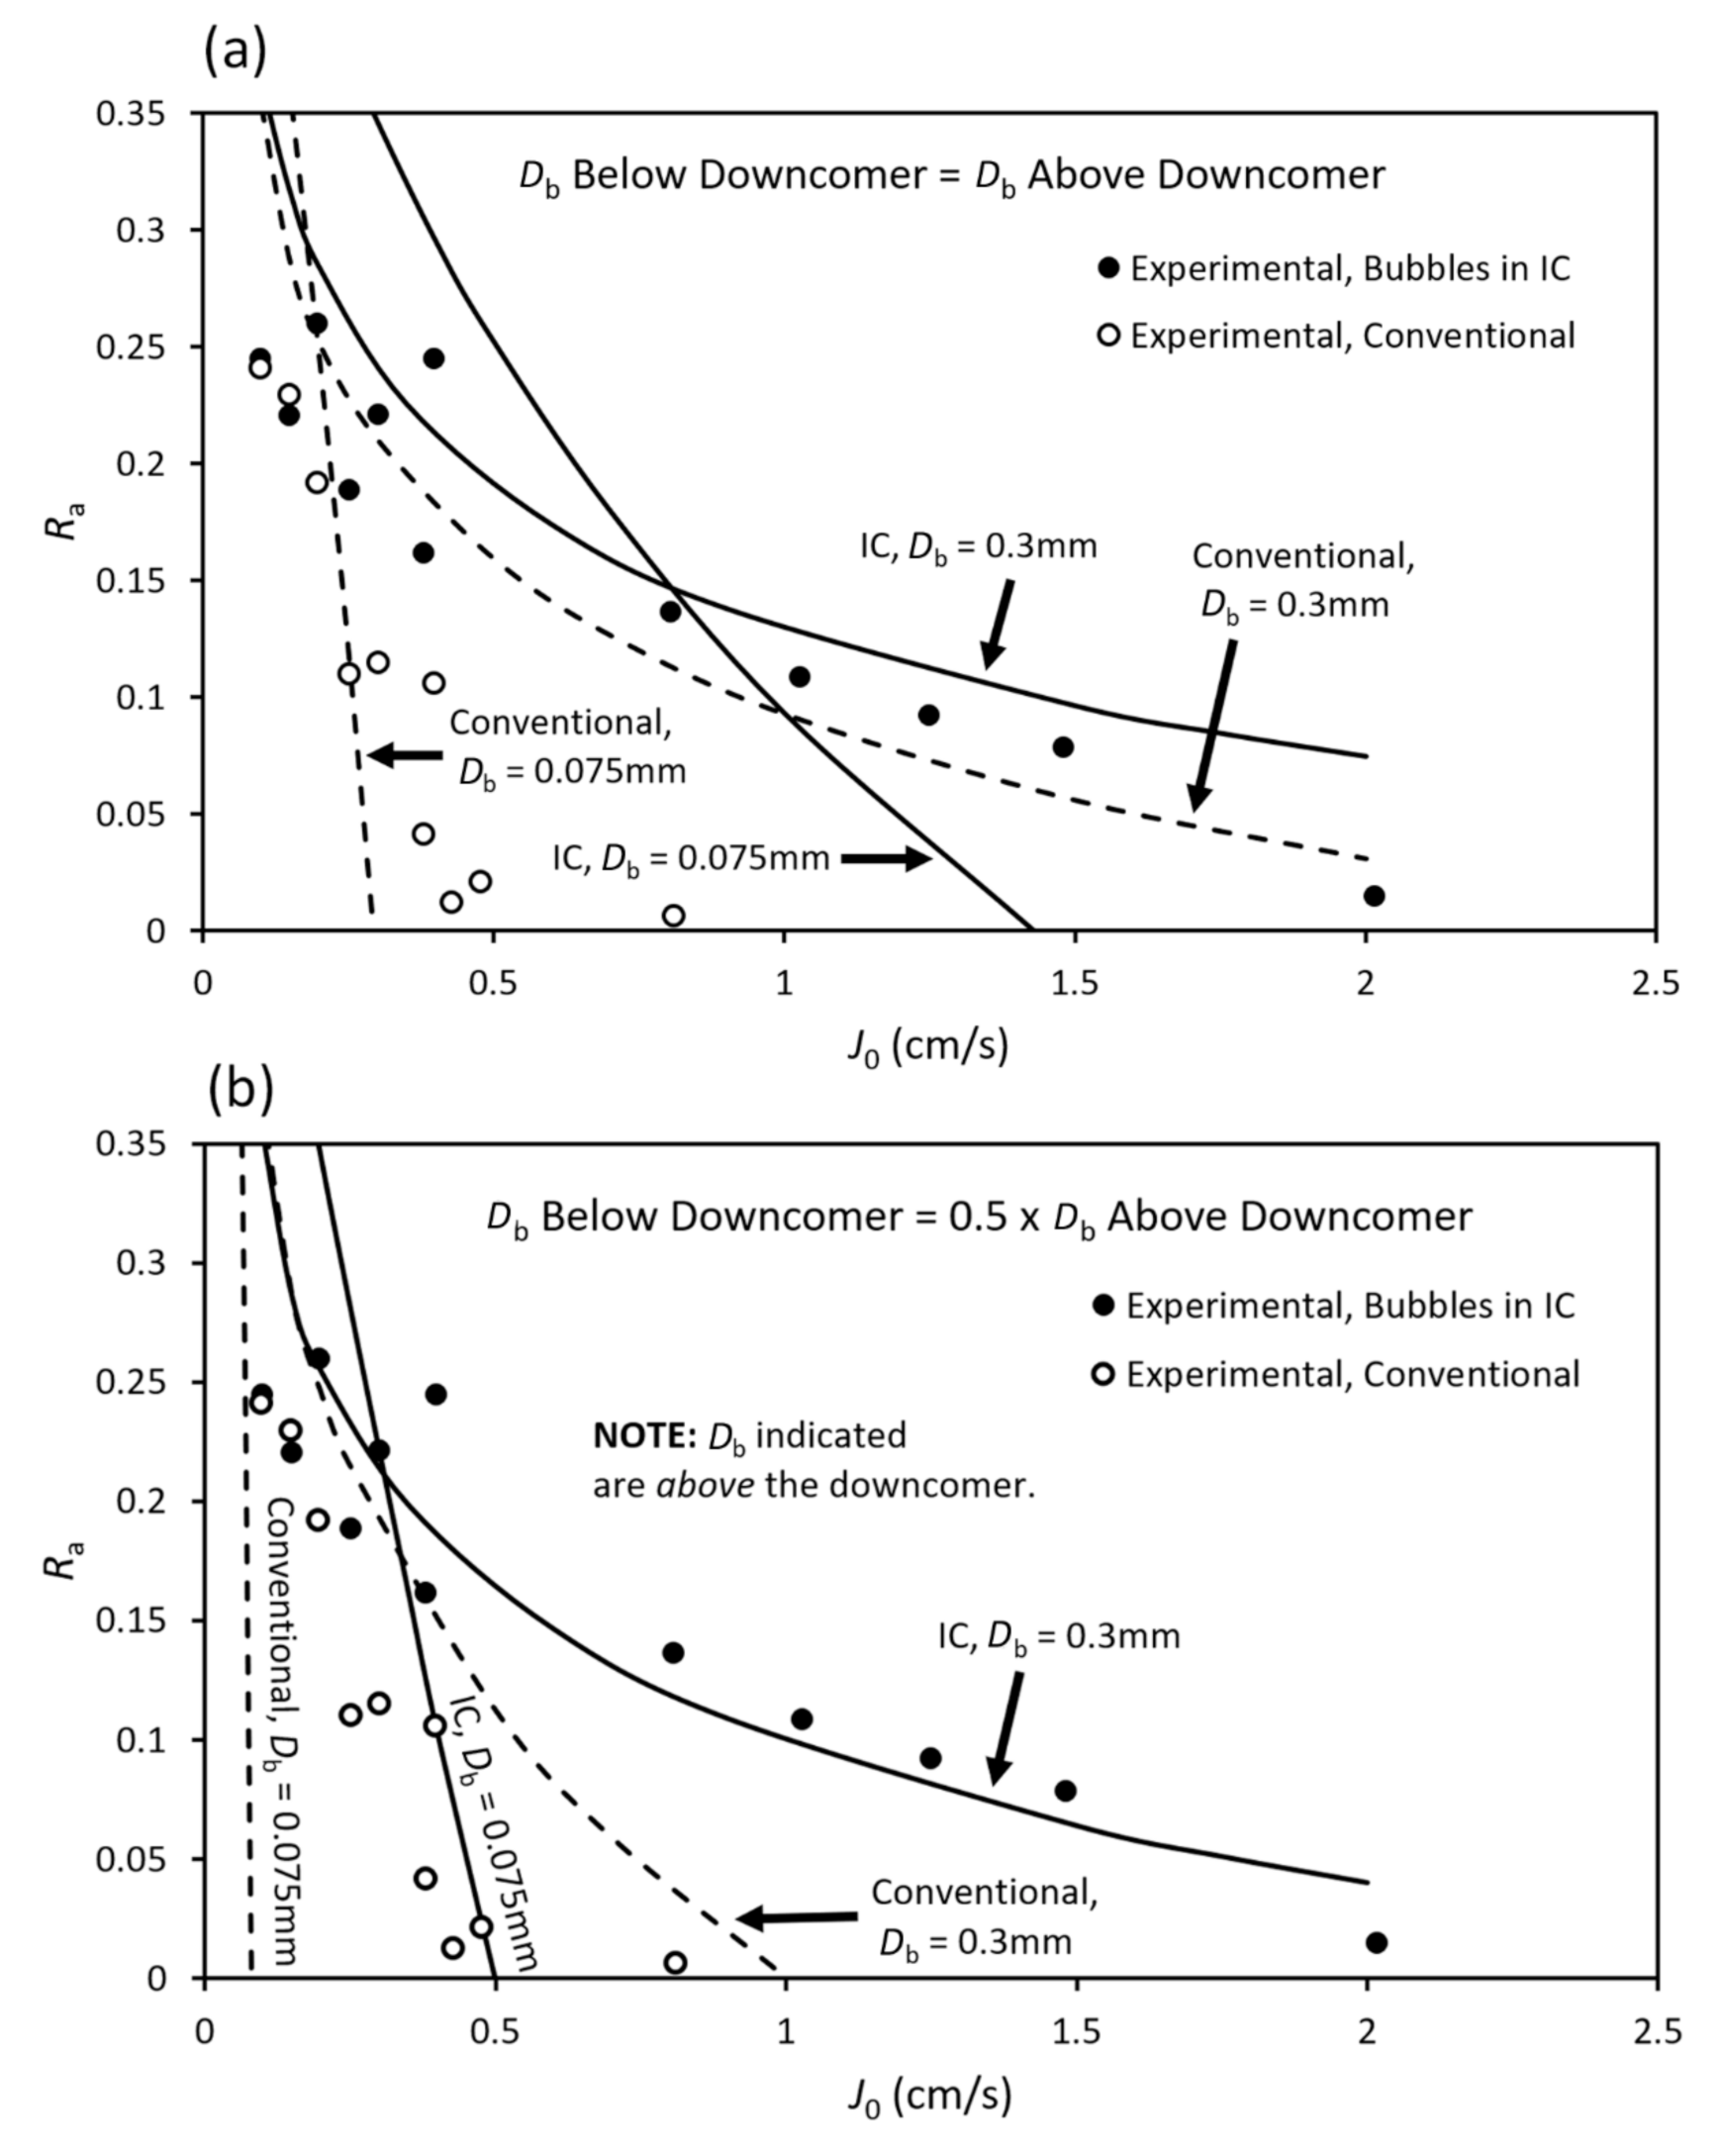
Figure 6a shows the
V = 5 data along with model curves that represent no split-zone segregation, for the largest and smallest recorded bubbles, at the limit of conventional operation and for bubbles in the lower half of the IC. For relatively small bubbles, the model predicts a significant increase in achievable adsorptive recovery, and the flow rate at which this can be achieved, as a result of the IC being used. The difference is not as pronounced for larger bubbles, although it is still significant.
Figure 6b shows the same conditions, but bubble size segregation in the split zone nominally resulting in bubble diameters below the downcomer half those above the downcomer. As expected, a decrease in the achievable adsorptive recovery is predicted for all conditions—smaller bubbles are entrained downward more easily than larger bubbles. More significant is the fact that split-zone segregation is predicted to reduce the achievable adsorptive recovery more for the limiting conventional case than when bubbles are in the lower half of the IC—further increasing the capacity advantage conferred by the IC.
A more direct comparison between the model predictions and the experimental adsorptive recovery data is provided in
Figure 7a. The shaded regions are generated by modeling the specific conditions under which each experimental run was conducted—this region is the envelope of the modeled curves for all of these conditions (except one each for the conventional regime and the bubbles in the lower half of the IC). These envelopes are generally in good agreement with the experimental data. The exceptions represent extreme cases; that for the conventional case was a run with the smallest achievable feed flux, resulting in the largest ratio of gas to feed flux and the largest bubble diameter for these runs. The exceptional case for the runs with bubbles in the IC was for the smallest ratio of gas to feed flux in the entire study, with uniformly very small bubbles. In terms of overall effect on absorptive recovery for
V = 5, it is clear that the IC allow equivalent recoveries to conventional operation at higher feed fluxes, as was the case with
V = 20. For an adsorptive recovery of 0.2, the achievable feed flux in this system using an IC length of 650 mm was approximately twice that for the conventional case; for an adsorptive recovery of 0.1 it was between three and four times.
Figure 7b compares the extraction rate under these same conditions. As in
Figure 7a, the shaded regions represent the envelopes of the model predictions for all of the experimental runs (with exceptions as described above). Again, the difference between the conventional regime and the system utilizing the IC is striking. Not only is the maximum measured extraction rate employing the IC three times that achievable for the conventional case, it is achieved at almost four times the feed flux. The model predicts that significant extraction can be achieved at feed fluxes many times those at the conventional limit. The single experimental run conducted at a feed flux of ≈2 cm/s seems not to bear out this prediction. It is not clear why the model overestimates the adsorptive recovery and extraction rate for this condition, as coalescence was not observed (nor under these conditions expected) in the top part of the cell, and neither was significant split-zone segregation. Qualitative observations suggest a more complicated segregation process beneath the downcomer and in the inclined channels associated with the relatively small bubbles in this run. These more complex segregation phenomena are likely to be poorly captured by the single-split approximation in the model, with a single mean bubble diameter above and below the downcomer.
It was previously concluded that bubble coalescence in the upper part of the cell played an important role in limiting recovery for the
V = 20 case [
28]. Part of the rationale for moving to
V = 5, and thus increasing the liquid flux in the upper section by a factor of four for a given feed flux, was to reduce the tendency for coalescence.
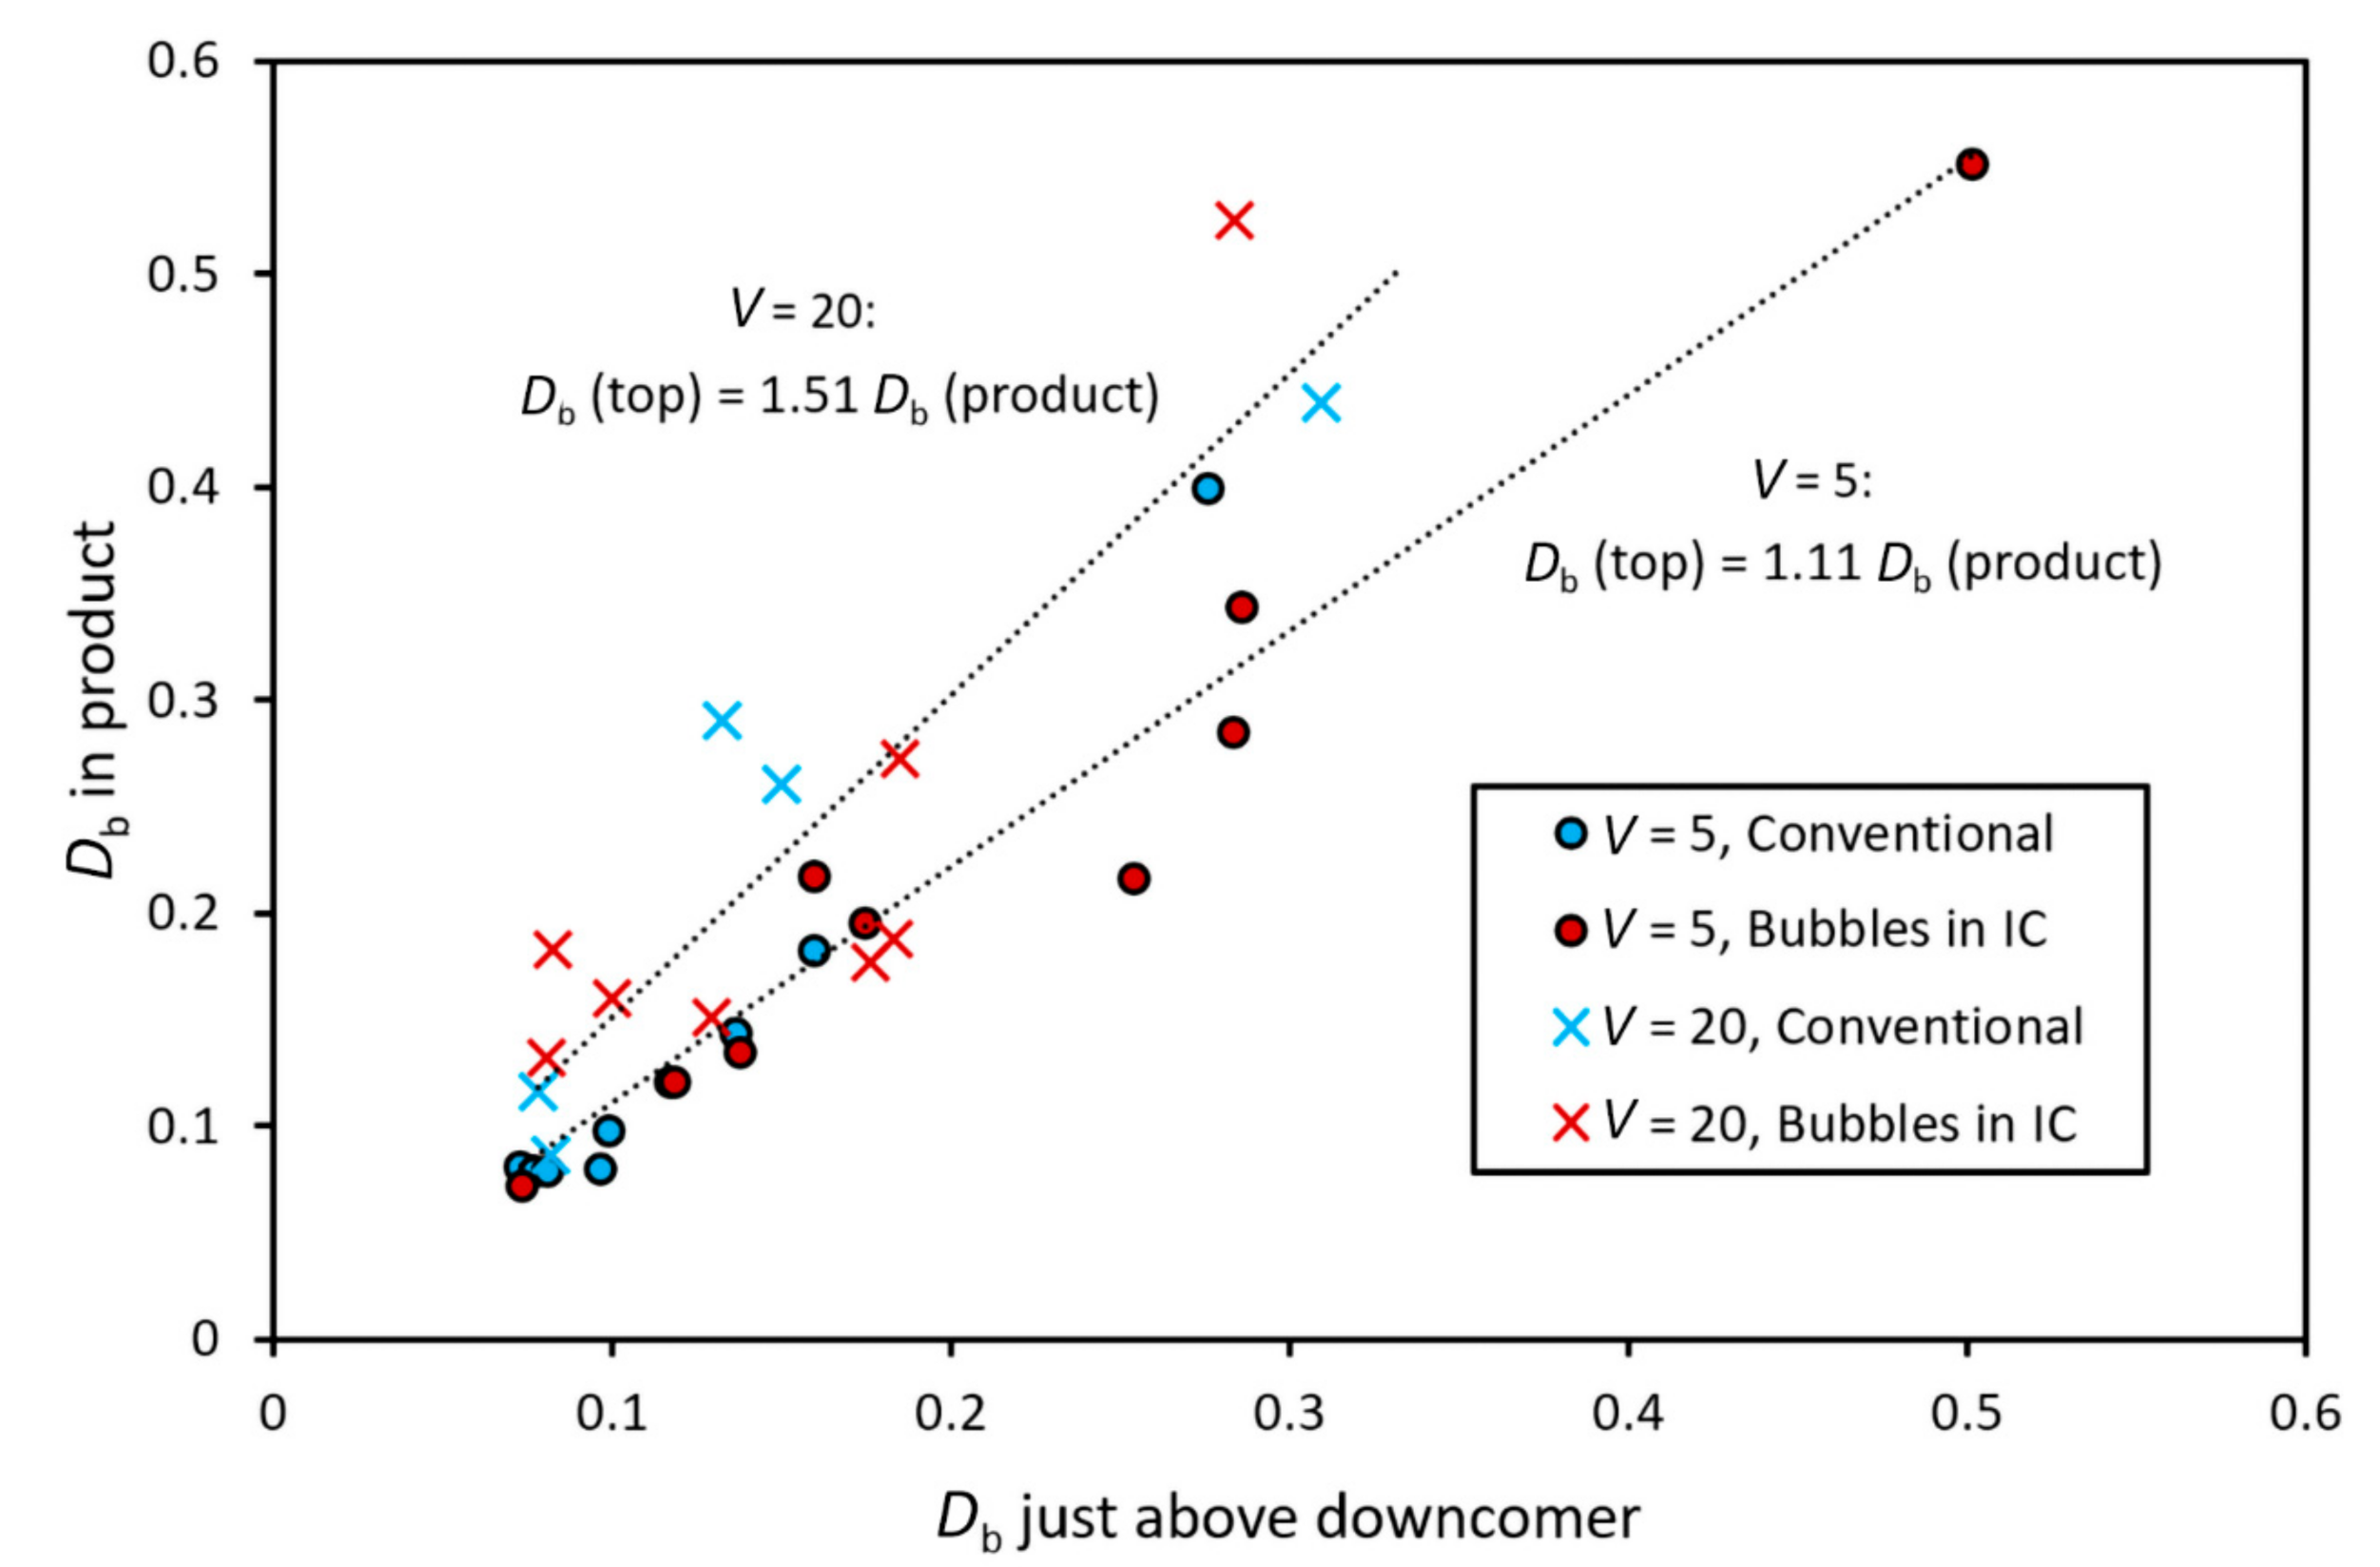
Figure 8 shows the bubble diameter in the product (i.e., measured near the top of the cell) as a function of the bubble diameter just above the downcomer. If there was little or no coalescence in the system, the gradient of the correlation would be expected to be one. For
V = 5 this is ≈ 10% greater, indicating a small degree of coalescence. For
V = 20 this is ≈50% greater, meaning a greater degree of coalescence.
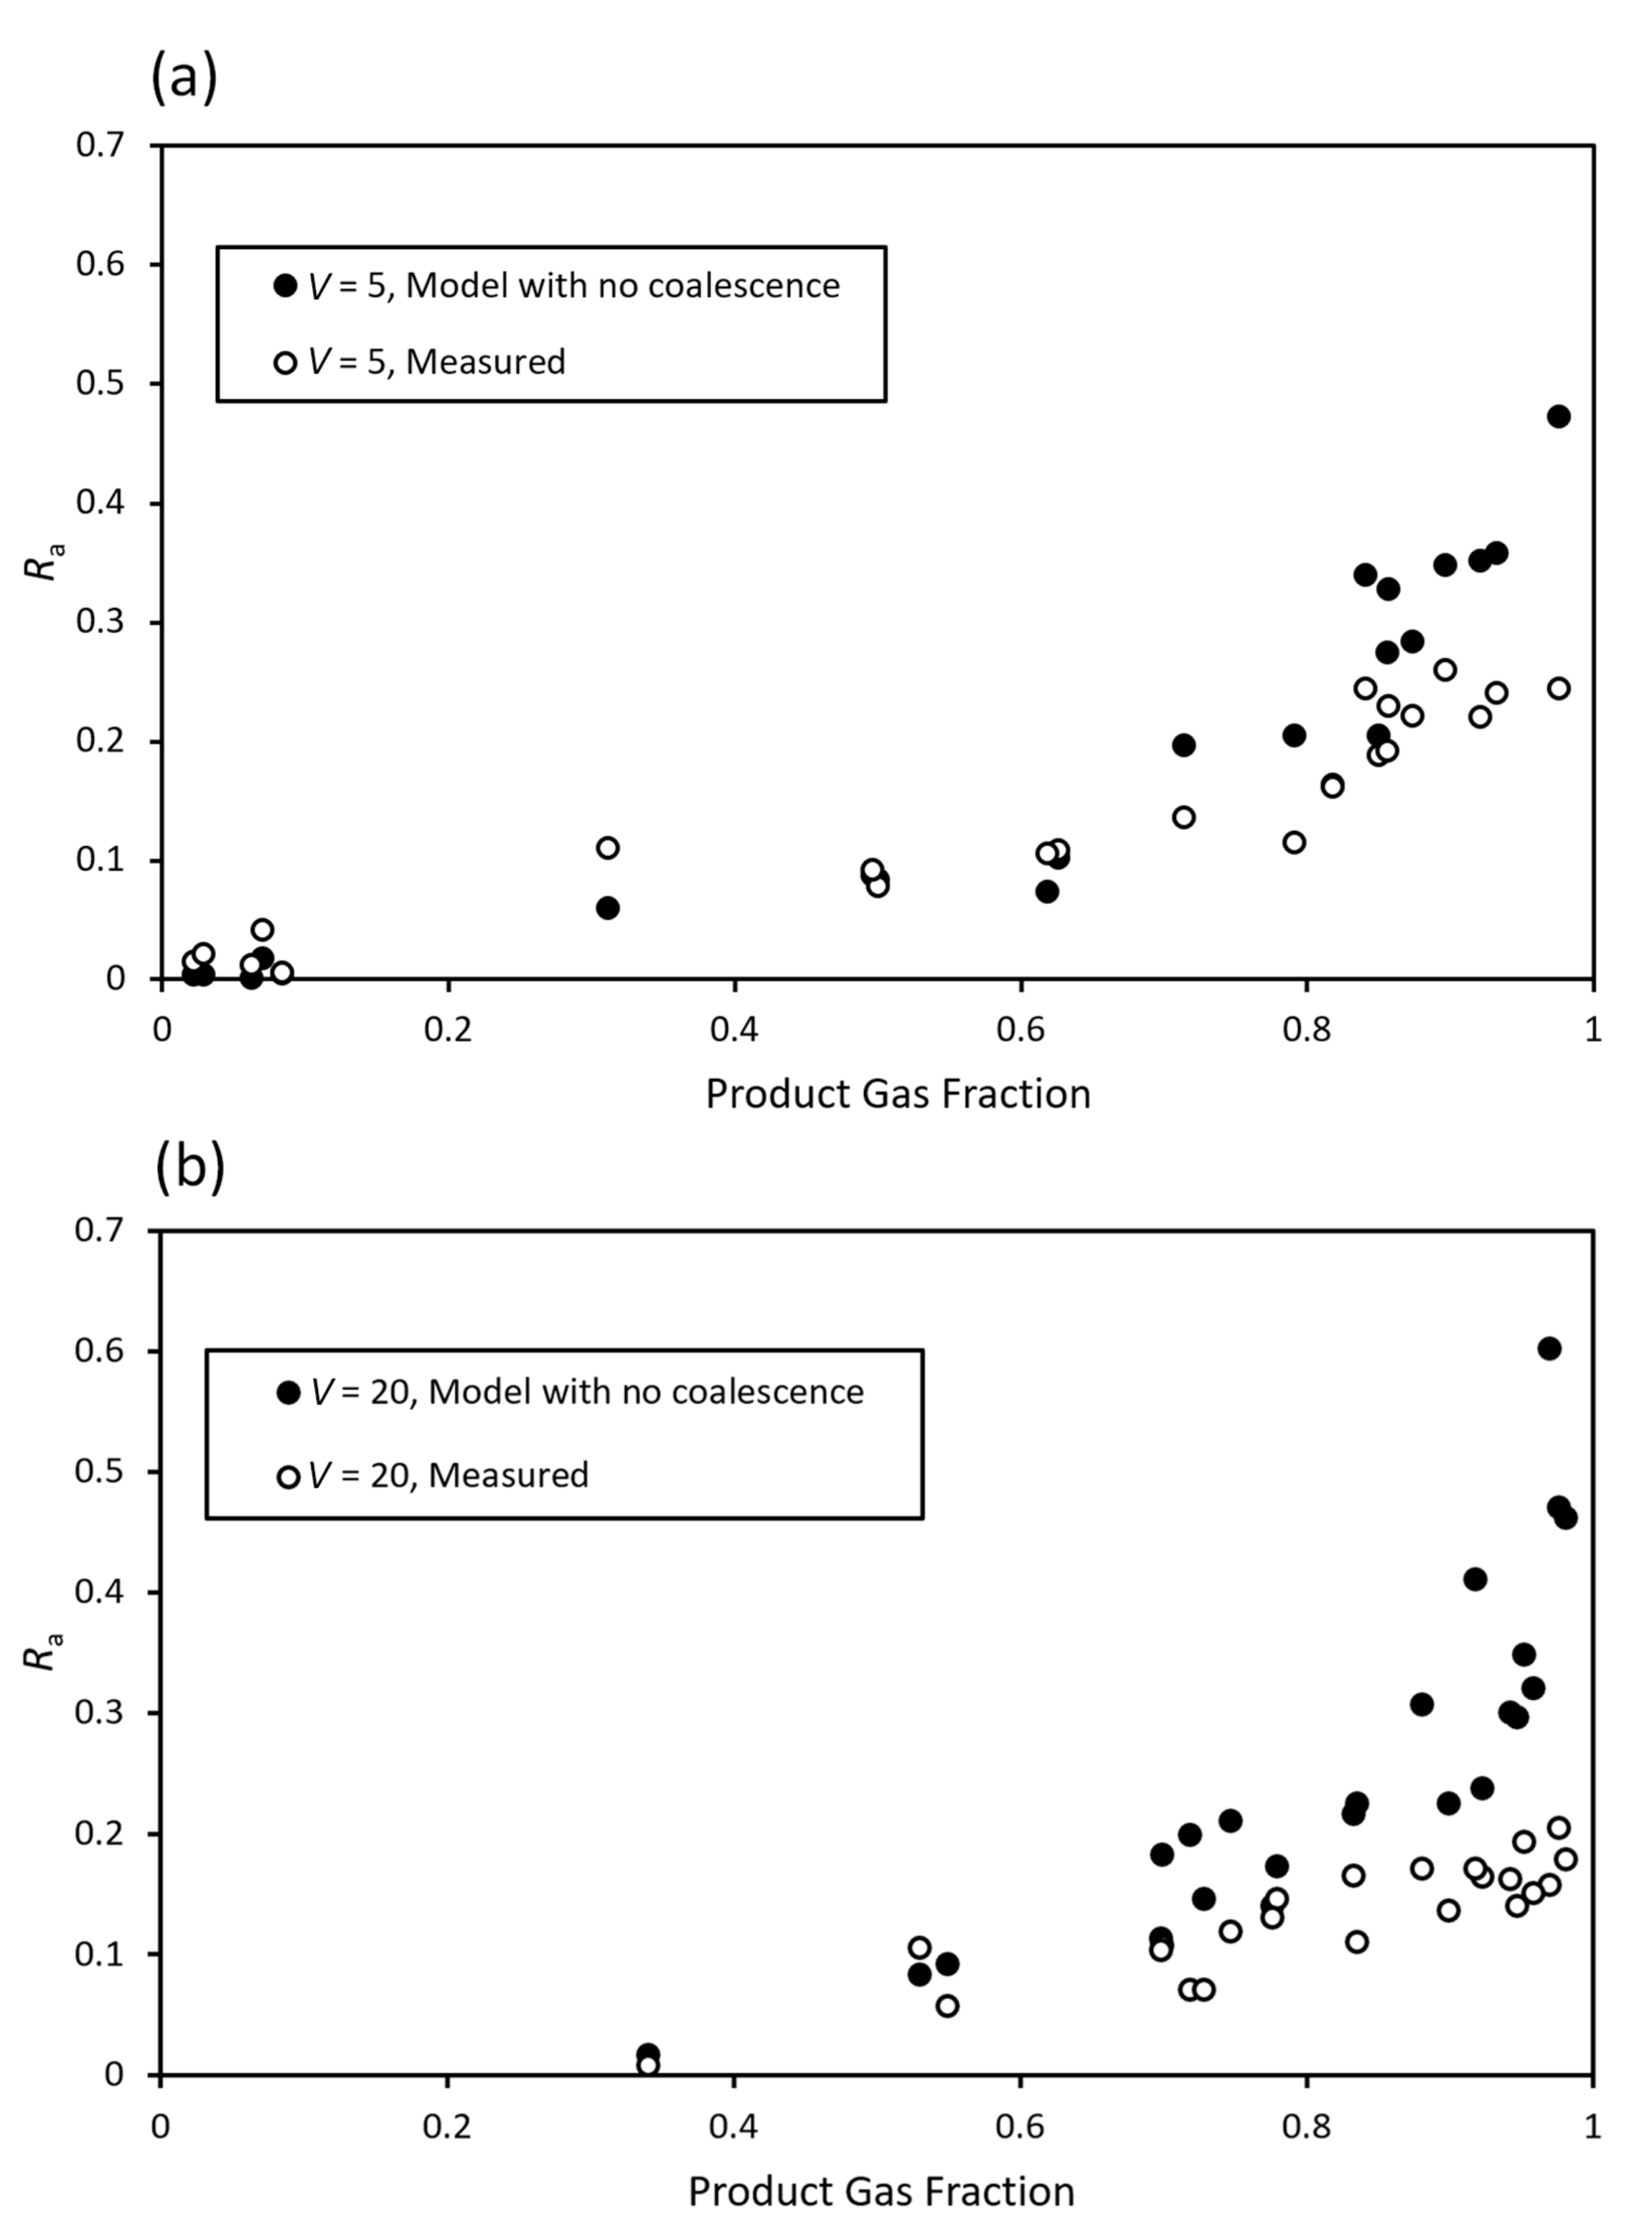
Figure 9 shows the comparative impact of this coalescence on adsorptive recovery. This is shown as a function of the product gas fraction (i.e., the gas flux as a fraction of the total product flux). While they are not synonymous and should not be confused, the product gas fraction is strongly related to the gas holdup. A high gas holdup is in turn strongly associated with coalescence. Since the product liquid flux is predetermined, the product gas fraction is determined by the gas flux. The bubble surface flux (which determines the adsorptive recovery) is proportional to the gas flux, but also inversely proportional to the bubble diameter (Equation (2))—it is thus not expected that the gas flux can be increased indefinitely without a reduction in benefit due to coalescence (quite apart from the effect of bubbles passing into the tails). In
Figure 9, the measured adsorptive recovery is compared to the modeled adsorptive recovery for each experimental run, assuming that the bubble diameter throughout the section between the downcomer and product outlet is the same as that just above the downcomer—i.e., no coalescence. The measured adsorptive recovery is less than the no-coalescence modeled value for both values of
V. However, given the measured increases in bubble diameter, the discrepancy is larger for
V = 20 than for
V = 5.
In another sense, this result may be unexpected. While a greater volume reduction does mean a smaller product gas fraction for an equivalent bubble surface flux in the product,
Figure 9 takes this into account by plotting the adsorptive recovery against the product gas fraction. This implies that the product gas fraction is not the only factor that determines the amount of coalescence in the system. It is well-known that the time allowed for coalescence determines the amount of capillary drainage of the liquid films between the bubbles [
39]. Given that the average total superficial velocity in the upper part of the cell (gas plus product liquid flux) was approximately three times that for the
V = 5 experiments than for the
V = 20 experiments, the time for coalescence to occur in the
V = 5 experiments was on average a third of that for the
V = 20 experiments. This alone may explain the difference in coalescence between the different volume reduction values.
To confirm the extent to which the loss of adsorptive recovery is the result of coalescence, the measured values are plotted against the modeled values for both
V, in
Figure 10. This time, the measured bubble diameters both just above the downcomer and in the product are included in the modeling (i.e., taking coalescence into account). The comparison is close to parity, with the measured adsorptive recoveries still slightly less than the predicted values. This remaining discrepancy may be because the product bubble size was measured ≈100 mm below the overflow, and thus did not capture the full extent of the coalescence process. Nonetheless, it can be concluded that coalescence is the dominant factor in adsorptive recovery loss, and that its impact increases with volume reduction. Upgrade depends fundamentally on the proportion of adsorptive recovery to bulk liquid recovery. The above results demonstrate that there is an additional mechanism by which recovery is in competition with upgrade, namely, coalescence.


