1. Introduction
Today, the necessity of battery materials has increased immensely due to the growing portable devices market and the energetic transition from fossil fuels to electric vehicles (EV) [
1,
2]. This exponential growth has pushed the scientific community to search for new materials with an acceptable cost/safety ratio in lithium-ion batteries (LIBs) to be part of this energetic change. One of the battery materials that has been studied is layered cathode materials (LiMO
2, M transition metal), such as NMC (LiNiMnCoO
2). NMC is based on an existing cathode material, LiCoO
2, in which Co is partially replaced by Ni and Mn, as a result obtaining LiNi
xMn
yCo
zO
2 (x + y + z = 1) [
3]. In the case of NMC 811, the predominant transition metal (TM) is Ni, with the final chemical composition being LiNi
0.8Mn
0.1Co
0.1O
2 (Ni-rich cathode material). NMC 811 is a layered material with a space group R-3m (lattice parameters a/b = 2.871 Å, c = 14.20 Å [
4]). Besides the energy density, the objective of this replacement is to reduce the quantity of Co because of its cost, safety, and difficulties to recycle [
5]. NMC 811 presents a high discharge capacity thanks to its Ni content, with theoretical values of ~200 mAh/g [
4,
6].
The NMC cathode is usually used at a high voltage window (over 4.2 V) and presents capacity fading at a low cycle number due to different degradation mechanisms [
4,
7,
8]. During the charge of batteries at high voltage, the phenomenon takes place at the interface of the liquid electrolyte and solid active material interface, leading to the CEI formation. At a high stage of Li removal, the chemical potential of the cathode material is shifted and approaches the HOMO energy of the electrolyte. This leads to its oxidation and the formation of a CEI layer, which has an impact on Li transport as well as the electronic configuration of TM sites in the cathode. The layer is composed of lithium carbonates, oxides, alkyl carbonates, as a result of solvent electrolyte oxidation parasitic reactions, and Li
XPO
YF
Z oxidation products coming from the electrolyte salt. It has been shown that for Ni-rich cathode materials, it is important to take care of the LUMO/HOMO energies of the electrode and the electrolyte, as well as the nucleophilic affinity of the components [
9,
10,
11,
12].
In the study led by Iban Azcarate et al. [
13], the reactivity of the LP30 electrolyte (LiPF
6 salt in a di-methyl carbonate/ethyl carbonate mixture), commonly utilized in LIBs, was explored. Using both simple- and double-cell configurations with glassy carbon cathodes and lithium metal anodes, the electrolyte’s behavior was scrutinized through NMR (nuclear magnetic resonance) and XPS (X-ray photoelectron spectroscopy). The research revealed that at 4.2 V, ethyl carbonate (EC) was the initial electrolyte component to undergo oxidation. When the voltage increased to 4.8 V, di-methyl carbonate (DMC) also began oxidizing, generating various derivative products. These products underwent further oxidation at 5.4 V. The study also observed depositions of inorganic species, such as LiF at 4.2 V, with the predominant deposition comprising mostly organic products, forming a non-passivating layer between 4.2 and 4.8 V. Above 4.8 V, the CEI layer predominantly consisted of inorganic compounds, enhancing passivation, although it remained unstable up to 5.4 V. Notably, the researchers achieved increased passivity and stability of the cell by maintaining it at a constant voltage for several hours.
In NMC cathode materials, capacity increases as a function of the amount of Ni. However, to reach the theoretical high capacity of Ni-rich cathode materials, it is necessary to charge the battery up to a voltage above 4.2 V, leading to degradations of the common LP30 electrolyte. In the work of Noh et al. [
8], a quasi-linear correlation between the Ni content increasing and a decrease in the safety and stability of the battery have been clearly demonstrated. This phenomenon can be attributed to changes in the microstructure and chemical properties that correspond to alterations in the nickel content. In cathode materials with a high nickel content, it has been observed that during cycling in the LP30 electrolyte, the instability of the CEI layer leads to a reaction between Ni
4+ and the electrolyte at an advanced de-lithiation stage. This reaction amplifies the Li
+/Ni
2+ cation mixing, thereby accelerating structural deterioration. Furthermore, structural decay is also exacerbated by changes in the lattice parameters, particularly along the c-axis. These changes induce strains that cause ruptures in secondary particles, which then come into contact with the electrolyte, further contributing to the material’s degradation [
14,
15,
16,
17].
The CEI presence over NMC 811 particles has been reported in the literature multiple times, as well as its importance for the correct performance of LIBs. Parasitic reactions and products reduce the available Li quantity in the cell, and due to the non-ionic conductivity of these products, impede the utilization of the remaining lithium, ultimately leading to a decreased battery capacity [
18,
19,
20,
21,
22]. One of the strategies for reducing these reactions is the formation of an ionic conductive layer, stable during cycling and resistant to mechanical deformation. Some works focused on the introduction of additives to the electrolyte for the formation of a stable CEI layer. In the work of Sen et al. [
20], triallylamine (TAA) was proposed as an additive to eliminate the presence of parasite compounds, such as HF, that cause cathode damage. In this work, the batteries with the TAA electrolyte additive presented better performances in capacity retention, the CEI layer was more uniform and compact, and there was no presence of cracks on the surface of NMC 811 particles.
Another strategy found in the literature is NMC 811 coating [
12,
23]. Looking deeply at the work of Bishnu P. et al. [
12], it was proposed to apply the electrochemical fluorination technique (ECF) to form a stable LiF layer at the surface of the particles. Pristine NMC 811 forms a non-stable CEI layer composed of inorganic compounds, such as LiOH, Li
2CO
3, and Li
2O. These compounds are electric and ionic insulators, which result in a decrease of battery capacity due to the inaccessibility to Li ions on the particles. The LiF layer is an ionic conductor as well as an electric insulator, avoiding the degradation of LP30 due to electrochemical reactions, but allowing the transportation of Li ions between the cathode and the electrolyte. The results showed that the formation of a stable CEI at low voltages increased the cycling stability of NMC 811.
TEM methodologies have been extensively employed to conduct in-depth investigations of battery materials at various scales [
24,
25,
26,
27]. Notably, the 4D-STEM ACOM technique has been instrumental in achieving precise phase characterization within batteries, both in situ and postmortem. This local analytical method offers a significant advantage in detecting compounds through electron diffraction patterns, as opposed to solely conducting elemental analysis (i.e., detecting individual species). Furthermore, 4D-STEM strikes an optimal balance between accessibility and resolution, especially when juxtaposed with other compound detection methods in battery research, such as neutron diffraction or XPS [
28,
29,
30,
31,
32].
In the study by Ankush et al. [
33], the researchers investigated LMNO (lithium–manganese–nickel–oxide) thin films in situ and postmortem, utilizing a specially adapted liquid TEM sample holder for electrochemical analysis. This investigation revealed insightful details about the electrochemical behavior of LMNO, including the characteristic oxidation peaks of nickel. Additionally, it highlighted the coexistence of amorphous and crystalline phases in LMNO and identified the formation of organic compounds resulting from electrolyte degradation. Despite the versatility of the 4D-STEM ACOM technique, it encounters limitations in liquid cell environments, primarily due to signal-to-noise reduction caused by multi-scattering effects from the liquid electrolyte’s thickness. However, these challenges can be mitigated through applications such as ePattern suite software (1.1 version), as demonstrated in the work of Folastre et al. [
34]. This algorithm employs registration and reconstruction methods to enhance the pattern identification and denoising of diffraction signals. Such advancements are pivotal in improving the image quality and signal-to-noise ratio, thereby enabling more reliable and accurate pattern analysis in TEM studies.
The objective of this research is to investigate the intrinsic characteristics and the genesis of the CEI in NMC 811coin cells through postmortem examination. This investigation employs an integrated approach utilizing SEM-EDX for the analysis of secondary particles, and STEM-EDX in conjunction with 4D-STEM ACOM for the examination of primary particles. This analysis is further correlated with the electrochemical performance observed during cycling.
2. Results and Discussion
In this study, NMC 811 coin cells were electrochemically cycled against lithium metal within a potential range of 2.7 to 4.5 V. To investigate the impact of upper potential limits on the formation and efficiency of the CEI layer, two distinct cutoff voltages were employed: a standard limit at 4.3 V (referred to as the 4.3 V-limit) and an extended limit at 4.5 V (referred to as the 4.5 V-limit). Over the course of 90 cycles, the development of the CEI layer was meticulously analyzed. This involved assessing its efficiency relative to the number of cycles and conducting a comparative analysis with the efficiencies of CEI layers documented in existing literature.
In
Figure 1a,g, we delineate the electrochemical characteristics of the sample. The cycling of the sample was conducted at a C-rate of C/20, interspersed with a 15 min rest period between each charging and discharging cycle.
Figure 1a depicts the potential versus capacity curve across various cycles. Up to the 20th cycle, minimal polarization was observed, indicative of the sample’s stability and negligible degradation. However, at the 50th cycle, a marked increase in polarization was evident relative to previous cycles. The initial cycle demonstrated a capacity of approximately 200 mAh/g, which diminished to around 143 mAh/g by the end of the battery’s life cycle, culminating in a capacity retention of 71.5%.
Figure 1g illustrates the progression of capacity loss and Coulombic efficiency (CE). A consistent pattern of degradation was observed. The absence of abrupt capacity loss at the graph’s conclusion can be attributed to the fact that the span from 1 to 50 cycles represents merely a segment of the battery’s potential state of life (SoL). This is corroborated by the CE data, which showed a modest decline of approximately 2% between the 1st and 50th cycles.
The polarization and the variations in charge/discharge efficiency (
Figure S1), along with the CE, can be primarily attributed to two distinct mechanisms leading to electrolyte degradation. These mechanisms include the formation of the CEI layer and the direct degradation of the electrolyte due to its interaction with lithium (Li) metal at the negative electrode. Li metal, especially, poses a significant risk due to its high reactivity when in direct contact with the LP30 electrolyte. This interaction results in the formation of various degradation products, such as 2,5-dioxahexanedioic acid dimethyl, CO
2, CO, and phosphates, as referenced in [
14,
35,
36].
The cathode material was examined using SEM, and the findings are exhibited in
Figure 1c–f. Images of individual secondary particles (agglomerate of primary particles) were acquired to obtain a first overview of primary particles’ behavior. Analysis of both the aggregated particles (
Figure 1b–f,h–l) and individual particles (
Figure 1d,j) revealed the presence of fluorine on the particle surfaces. Phosphorus was absent in the spectra, indicating that the detected fluorine originates from an electrochemical process rather than being a residual salt. This observation of fluorine suggests the formation of a CEI layer, which, according to the existing literature, is likely to be a LiF layer. In
Figure 1c,d,i,j, where both carbon and fluorine were observed, carbon distribution was non-uniform across the surface of the secondary particle. Conversely, fluorine exhibited a homogeneous distribution, implying the absence of carbonate compounds in the CEI layer and suggesting the presence of LiOH. However, the exact composition of the CEI layer remains undetermined due to analytical limitations. Additionally, in the
Supplementary Materials (Figure S2b), an elemental analysis including manganese is provided for comparison with fluorine, considering their similar edge energies. The distinct presence of fluorine and manganese confirms that they are separate elements.
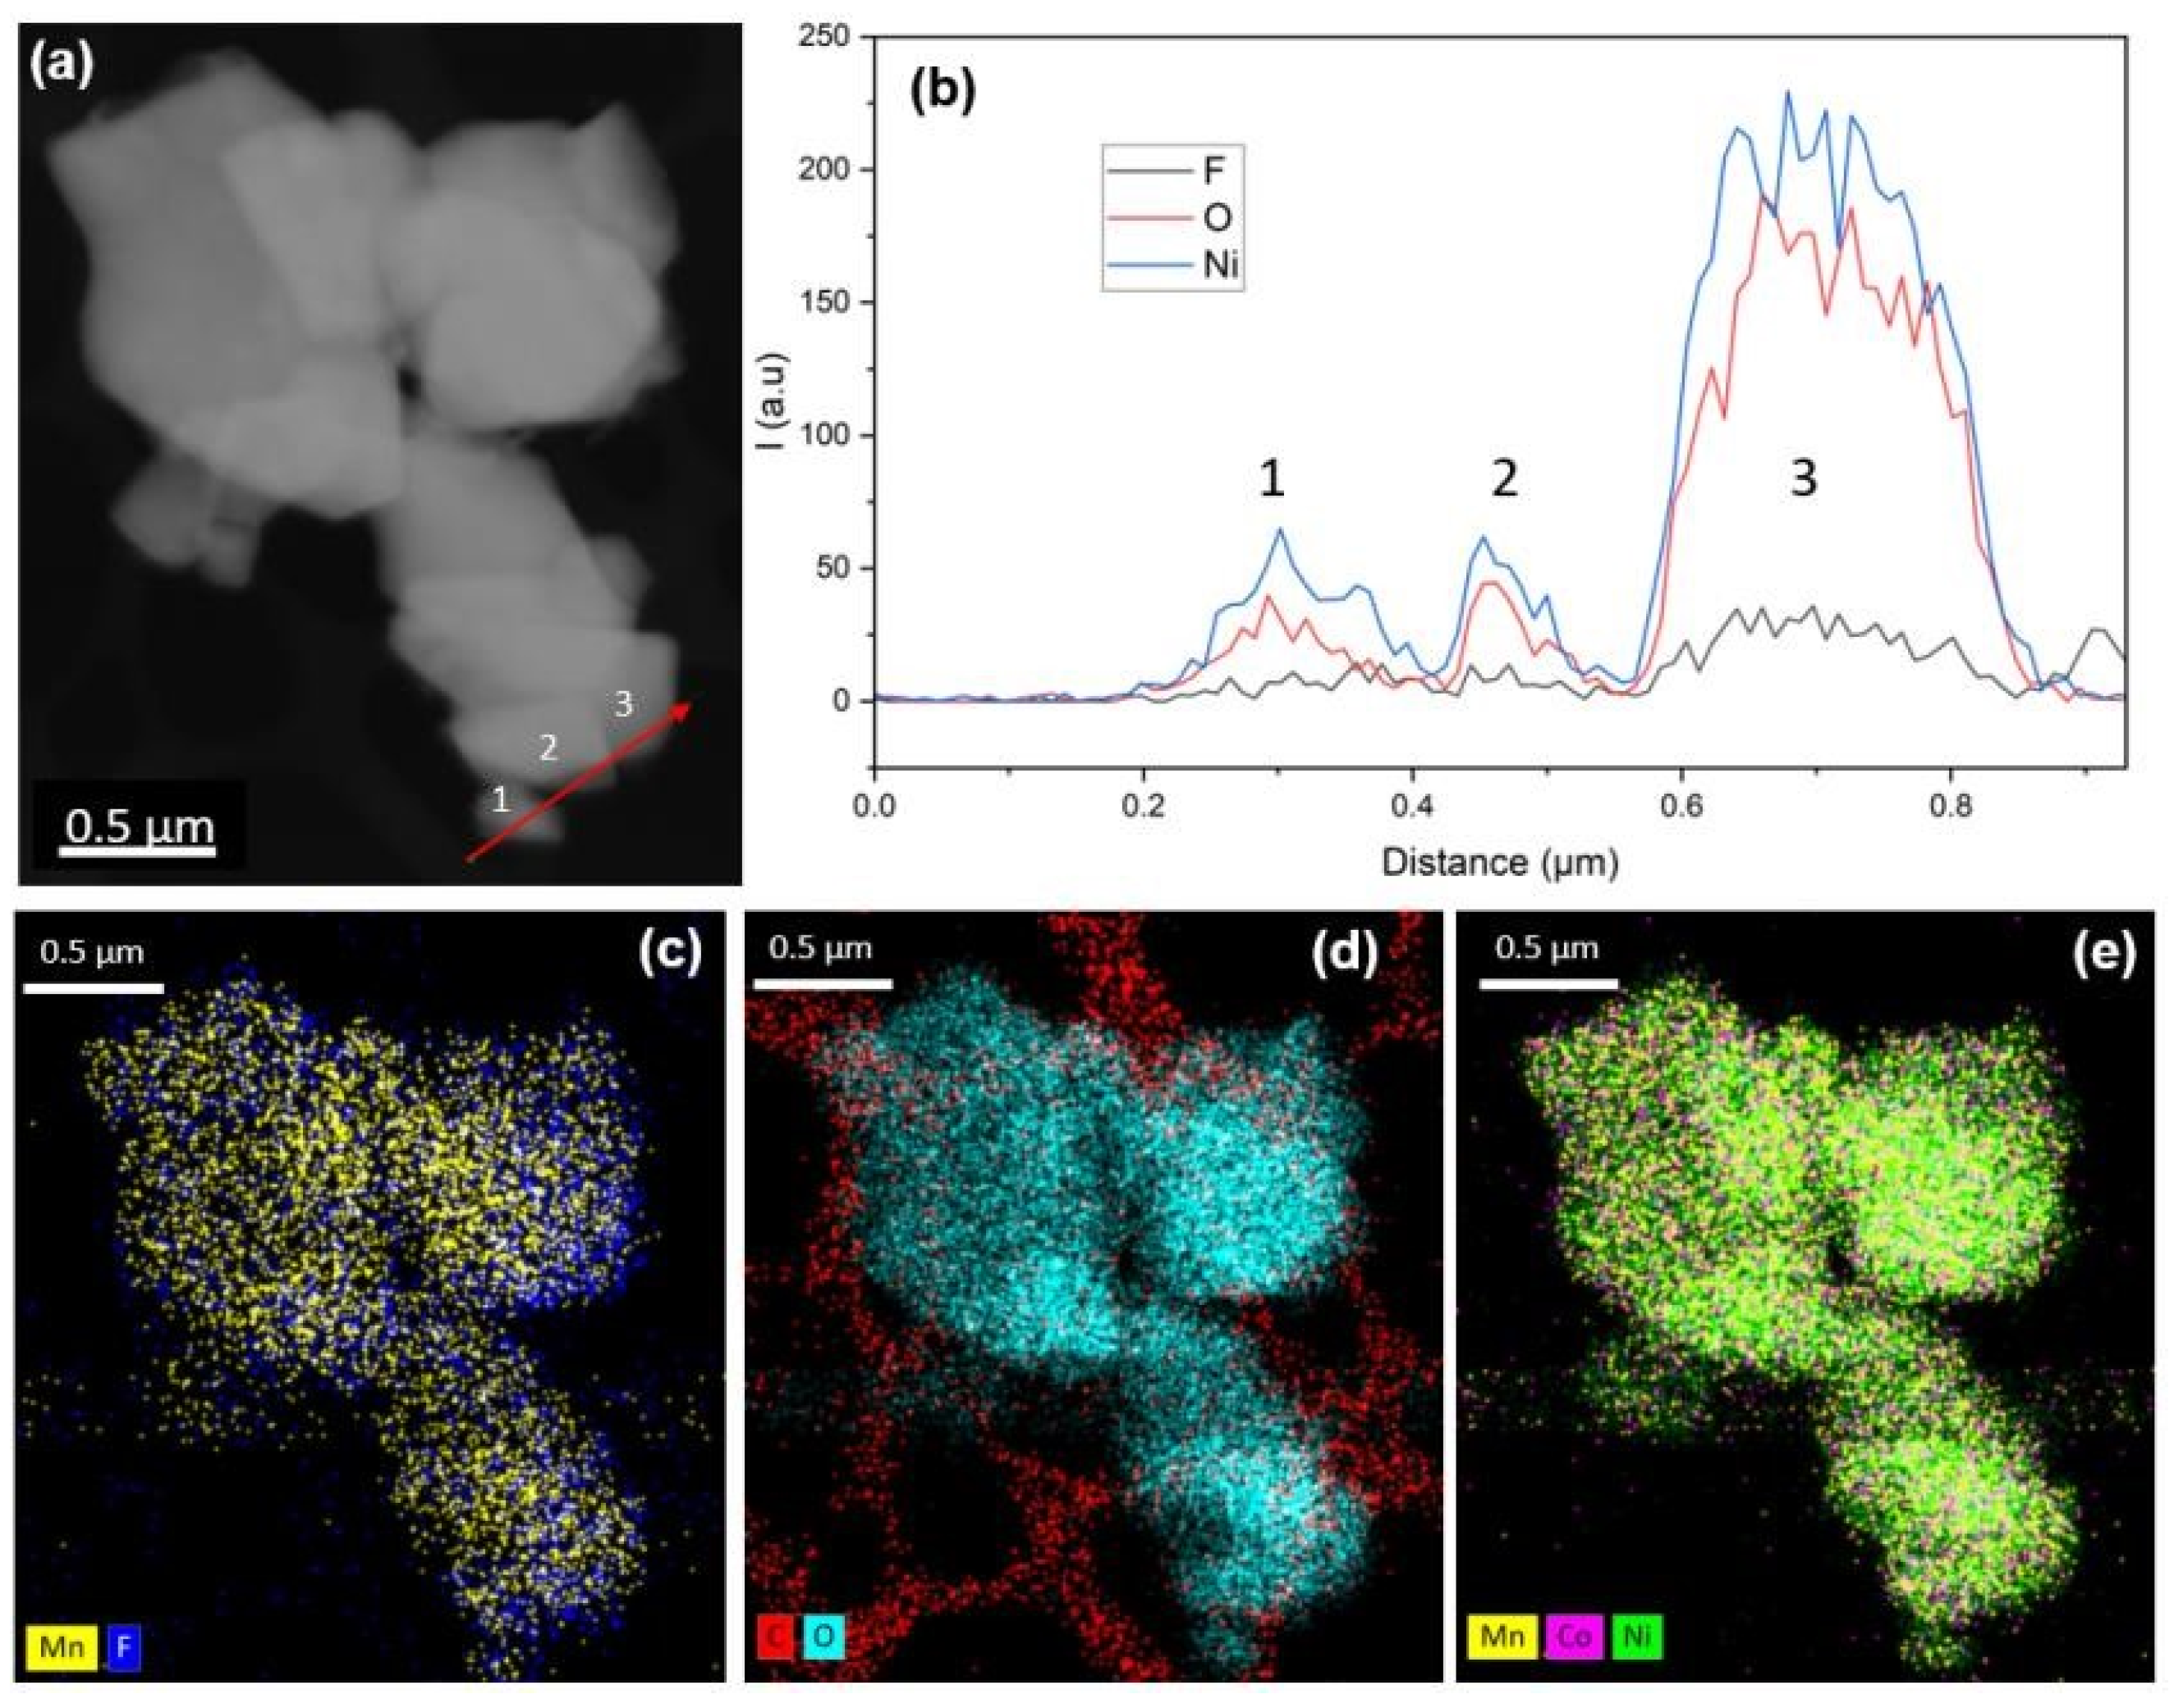
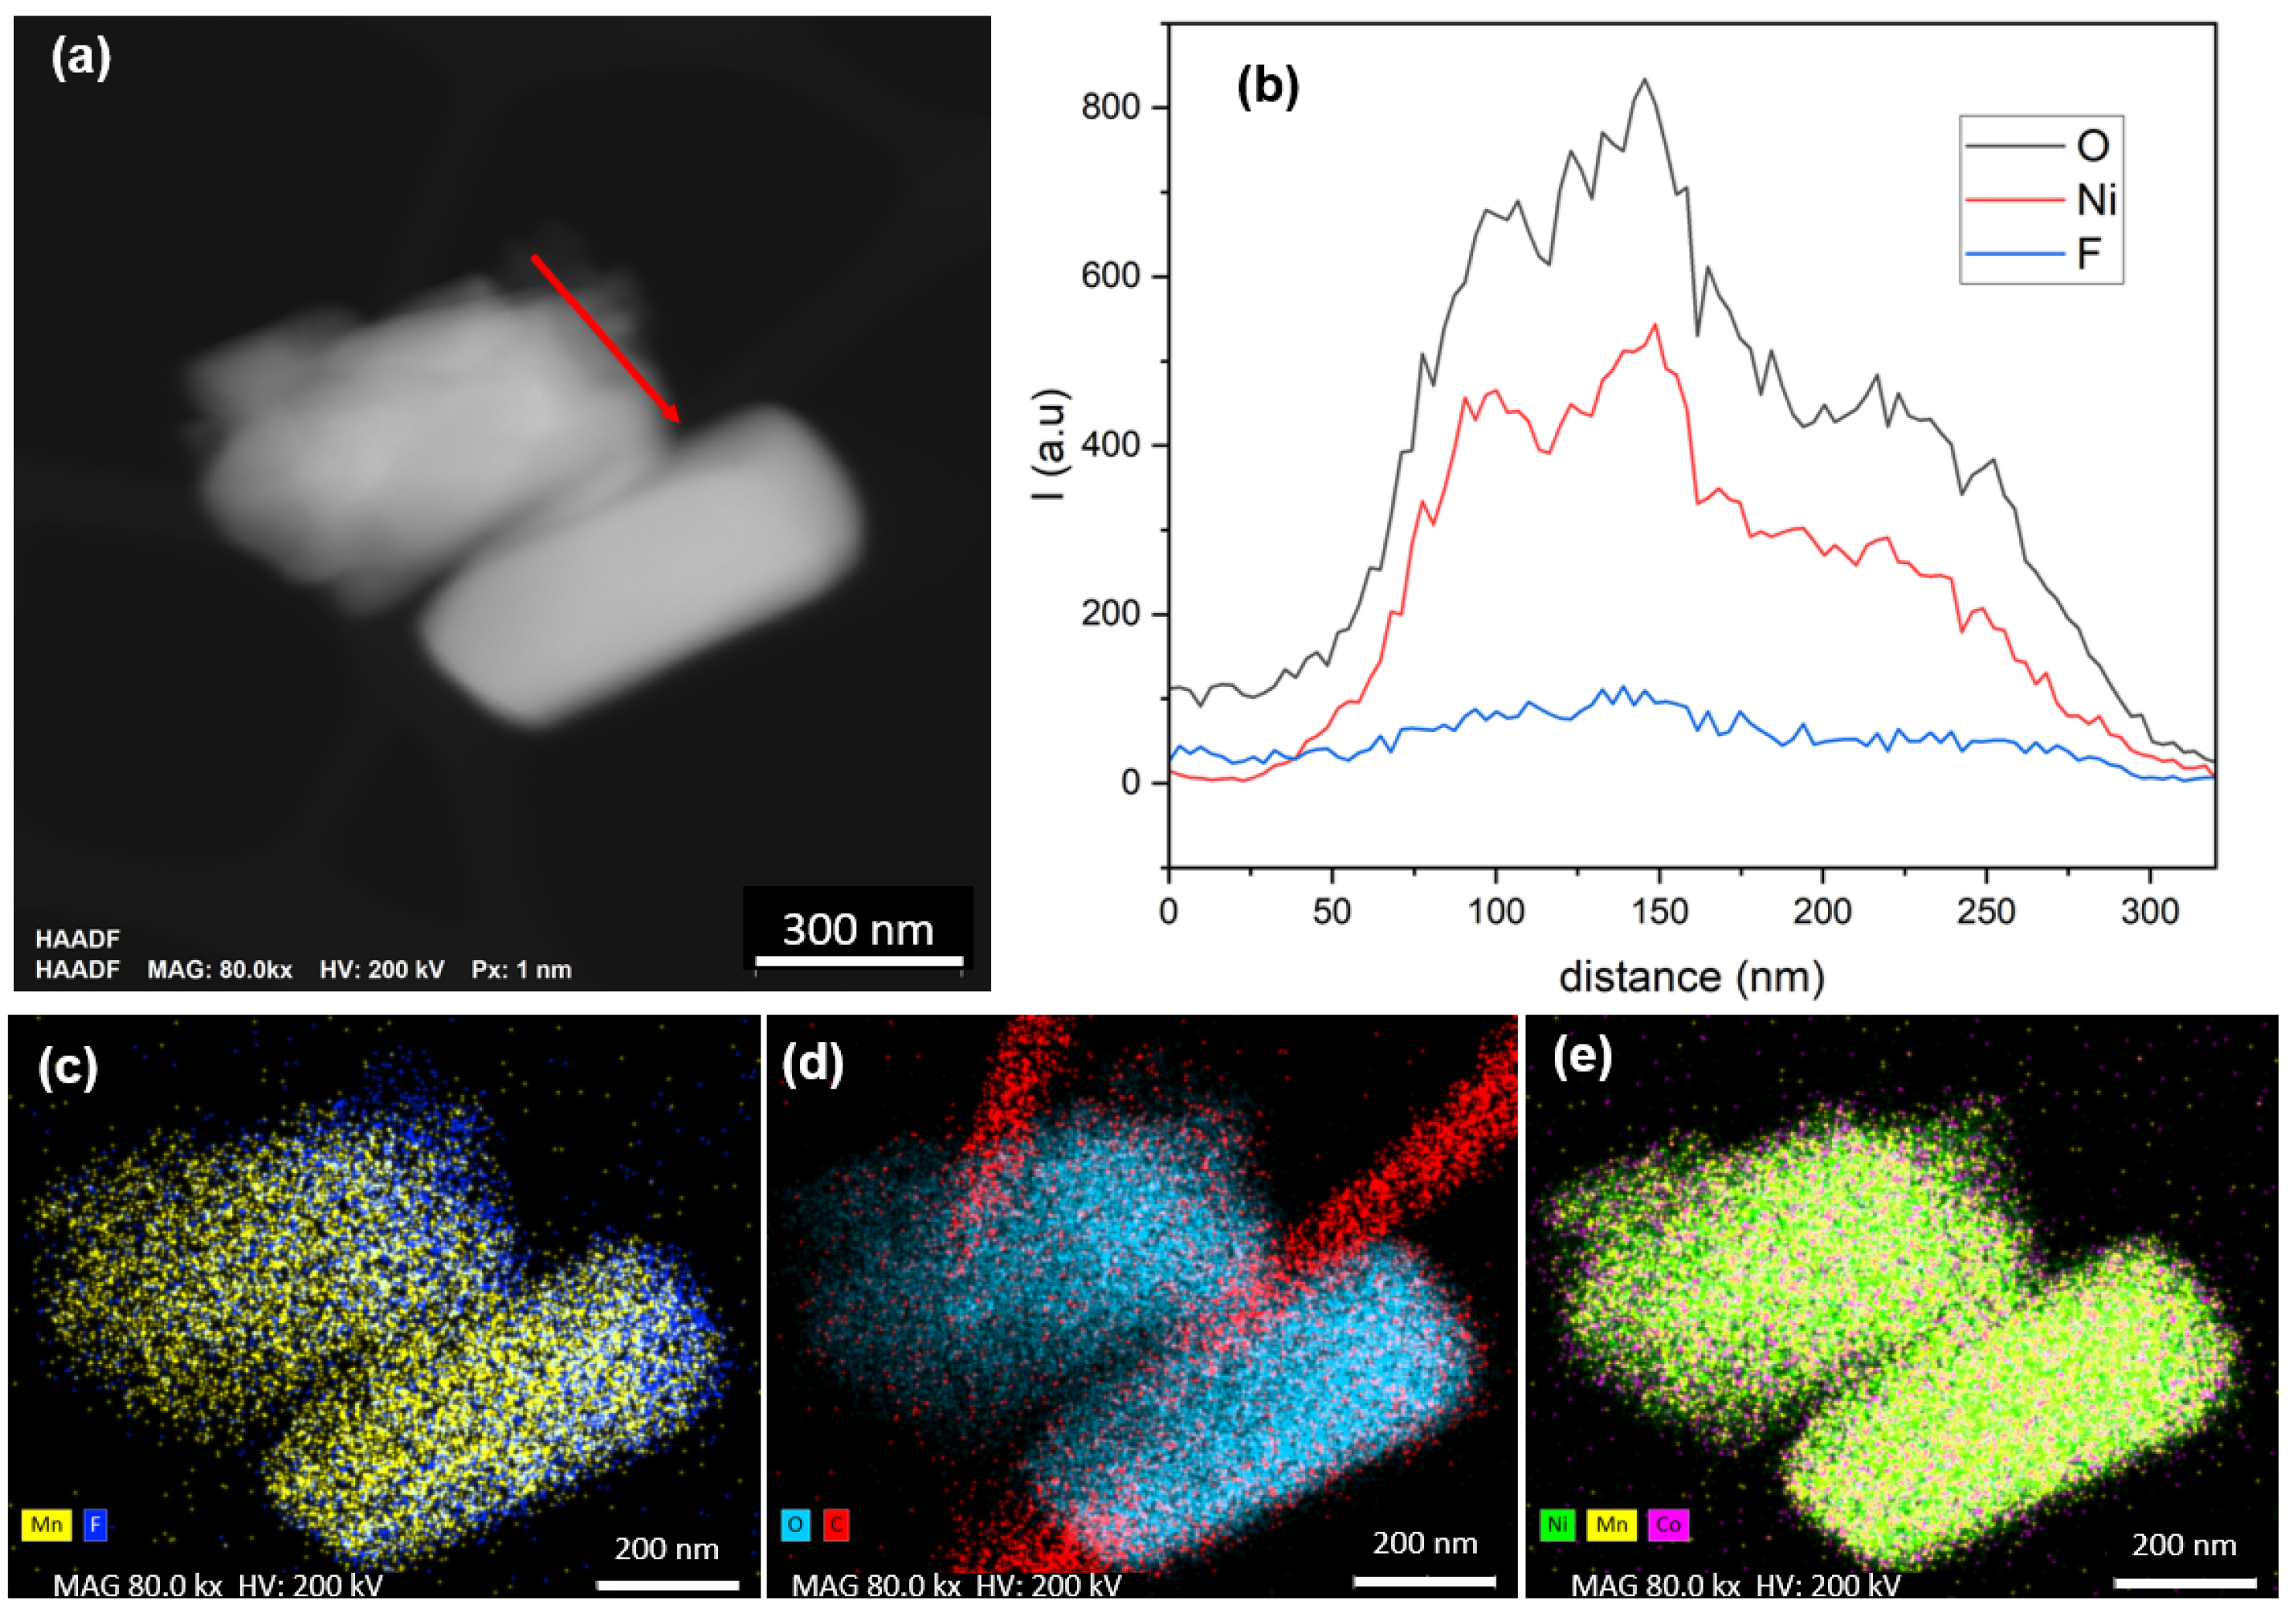
To gain deeper insight into the cell structure, analysis at the primary particle scale was conducted using STEM-EDX, with results presented in
Figure 2. The high-angle annular dark-field (HAADF) imaging in
Figure 2a reveals an agglomeration of primary particles, ranging in size from 0.5 to 1.5 µm.
Figure 2b displays the line profile across various particle edges (indicated by a red line in
Figure 2a), highlighting the presence of fluorine, particularly pronounced in the third particle examined.
Figure 2c compares the Mn (Mn-Kα 5.895 keV) and F (F-K 0.676 keV) signals, showing a predominant Mn signal, with fluorine primarily detected along the edges of some particles, aligning with previous SEM-EDX observations. The C-O mapping in
Figure 2d was conducted to assess the potential presence of carbonate compounds, but unlike the fluorine layer, no distinct carbon layer was observed. Finally,
Figure 2e illustrates the transition metals, providing insights into the high homogeneity in composition of NMC 811 particles with no segregation.
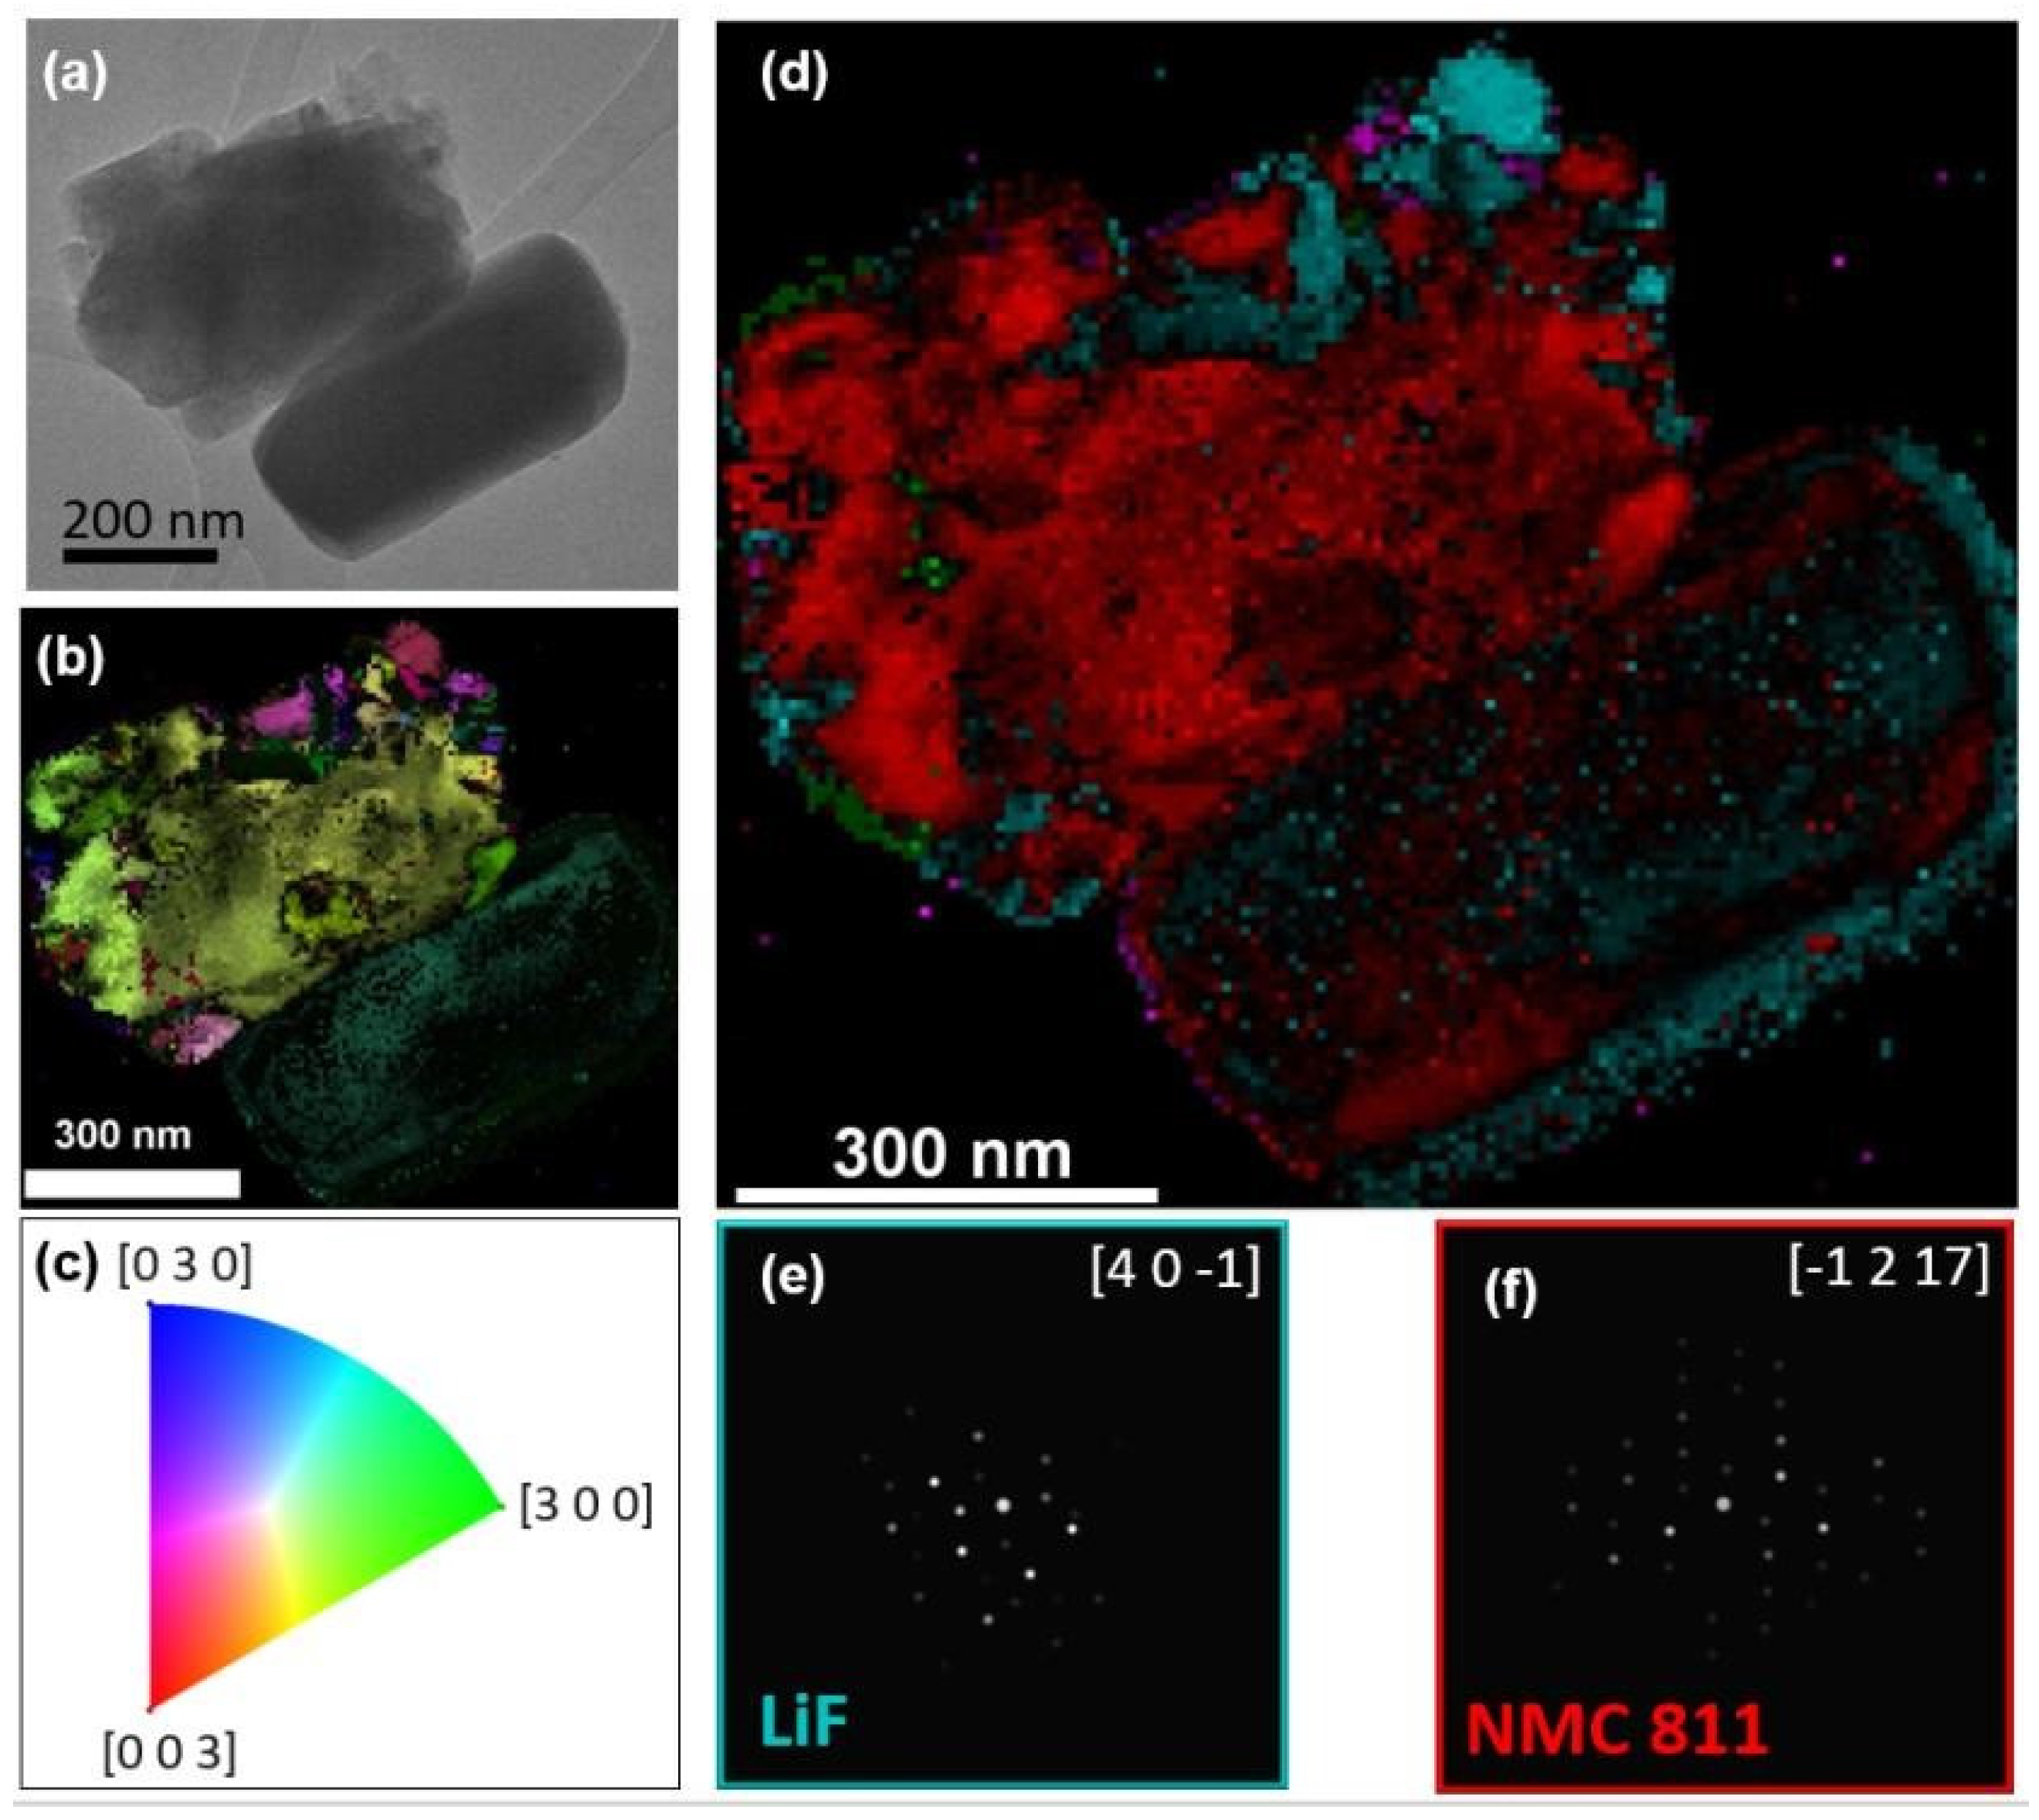
To enhance the comprehension of the results from the STEM-EDX analysis, a comprehensive 4D-STEM investigation was conducted on two selected areas within the particle agglomerate. Crystallographic orientation and phase mapping were derived through the application of ACOM data-processing methods [
37,
38], coupled with the use of the ePattern suite for data noise reduction [
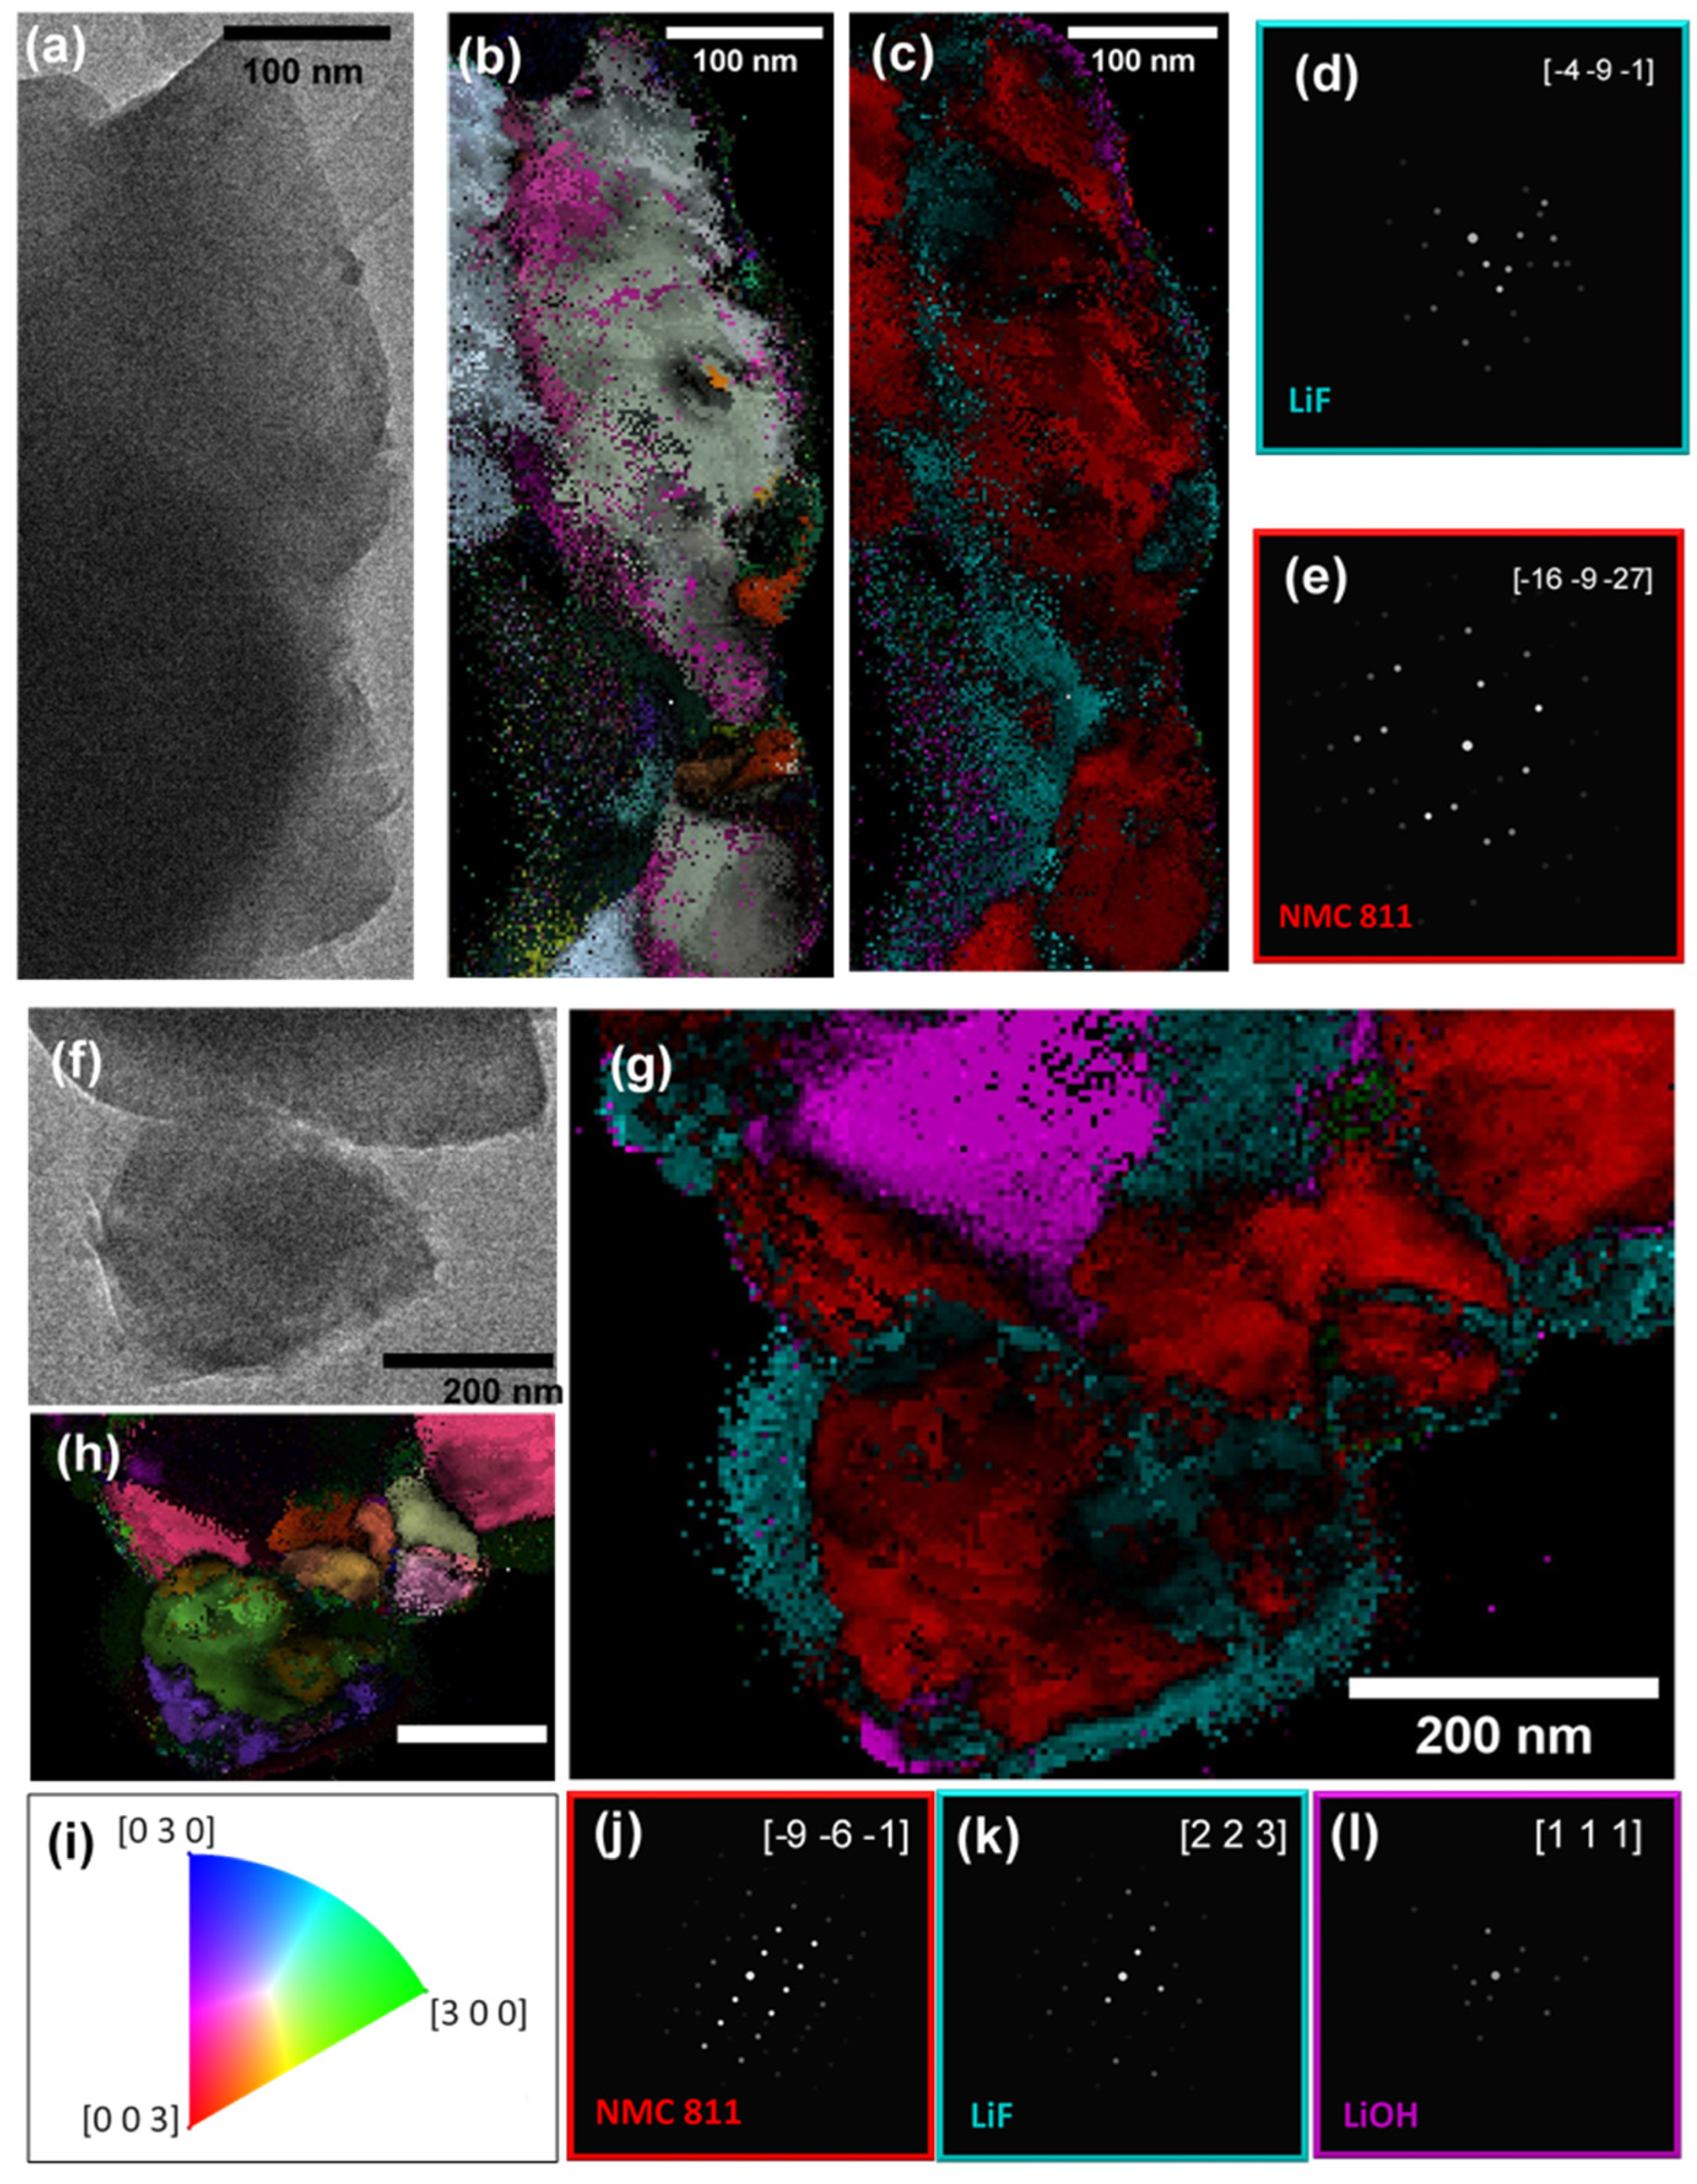
34]. Consistent with observations from the high-angle annular dark-field (HAADF) imaging, the agglomerate was identified as a conglomerate of primary particles. ACOM analysis was specifically applied to two zones, designated as zone 1 (illustrated in
Figure 3a) and zone 2 (shown in
Figure 3g), where STEM-EDX data indicated a high potential for CEI layer formation.
In zone 1, the crystal orientation and phase maps at a particle’s edge are displayed in
Figure 3b and
Figure 3c, respectively. Two primary components, NMC 811 and LiF, were identified, aligning with the STEM-EDX findings, as shown in
Figure 3d,e. The orientation fidelity was notably high for the NMC 811 phase, but substantially lower for LiF. Despite this, certain areas exhibited sufficient phase and orientation reliability, affirming the presence of LiF at the particle’s edge. The diminished orientation reliability in some regions could be attributed to particle thickness or overlapping particle layers.
Regarding zone 2, the orientation mapping revealed a polycrystalline structure (
Figure 3h). This finding was corroborated by TEM (
Figure 3g) and STEM-HAADF (
Figure 2a) imaging, which did not indicate particle superposition, thereby confirming the polycrystalline nature of the primary particles. This supports the theory of LiF layer instability due to mechanical disruption, as previously discussed.
Figure 3k illustrates the uneven spatial distribution of LiF around the particle edge, mirroring observations in zone 1. Additionally, LiOH was detected in this area with high phase and orientation reliability (
Figure 3l), yet it was notably absent from the particle edges.
An alternative hypothesis for the origin of the LiF component layer and LiOH involves the potential presence of water traces within the cathode material, which could facilitate the production of HF and LiF [
12,
39]. Despite the samples being synthesized under meticulously controlled conditions within a dry room, the likelihood of moisture contamination during the battery assembly process cannot be discounted as a contributing factor to this observed phenomenon. Furthermore, it is plausible that residual water traces are inherently present in the electrolyte’s solvents [
40], which may predispose the formation of a LiF layer within the CEI.
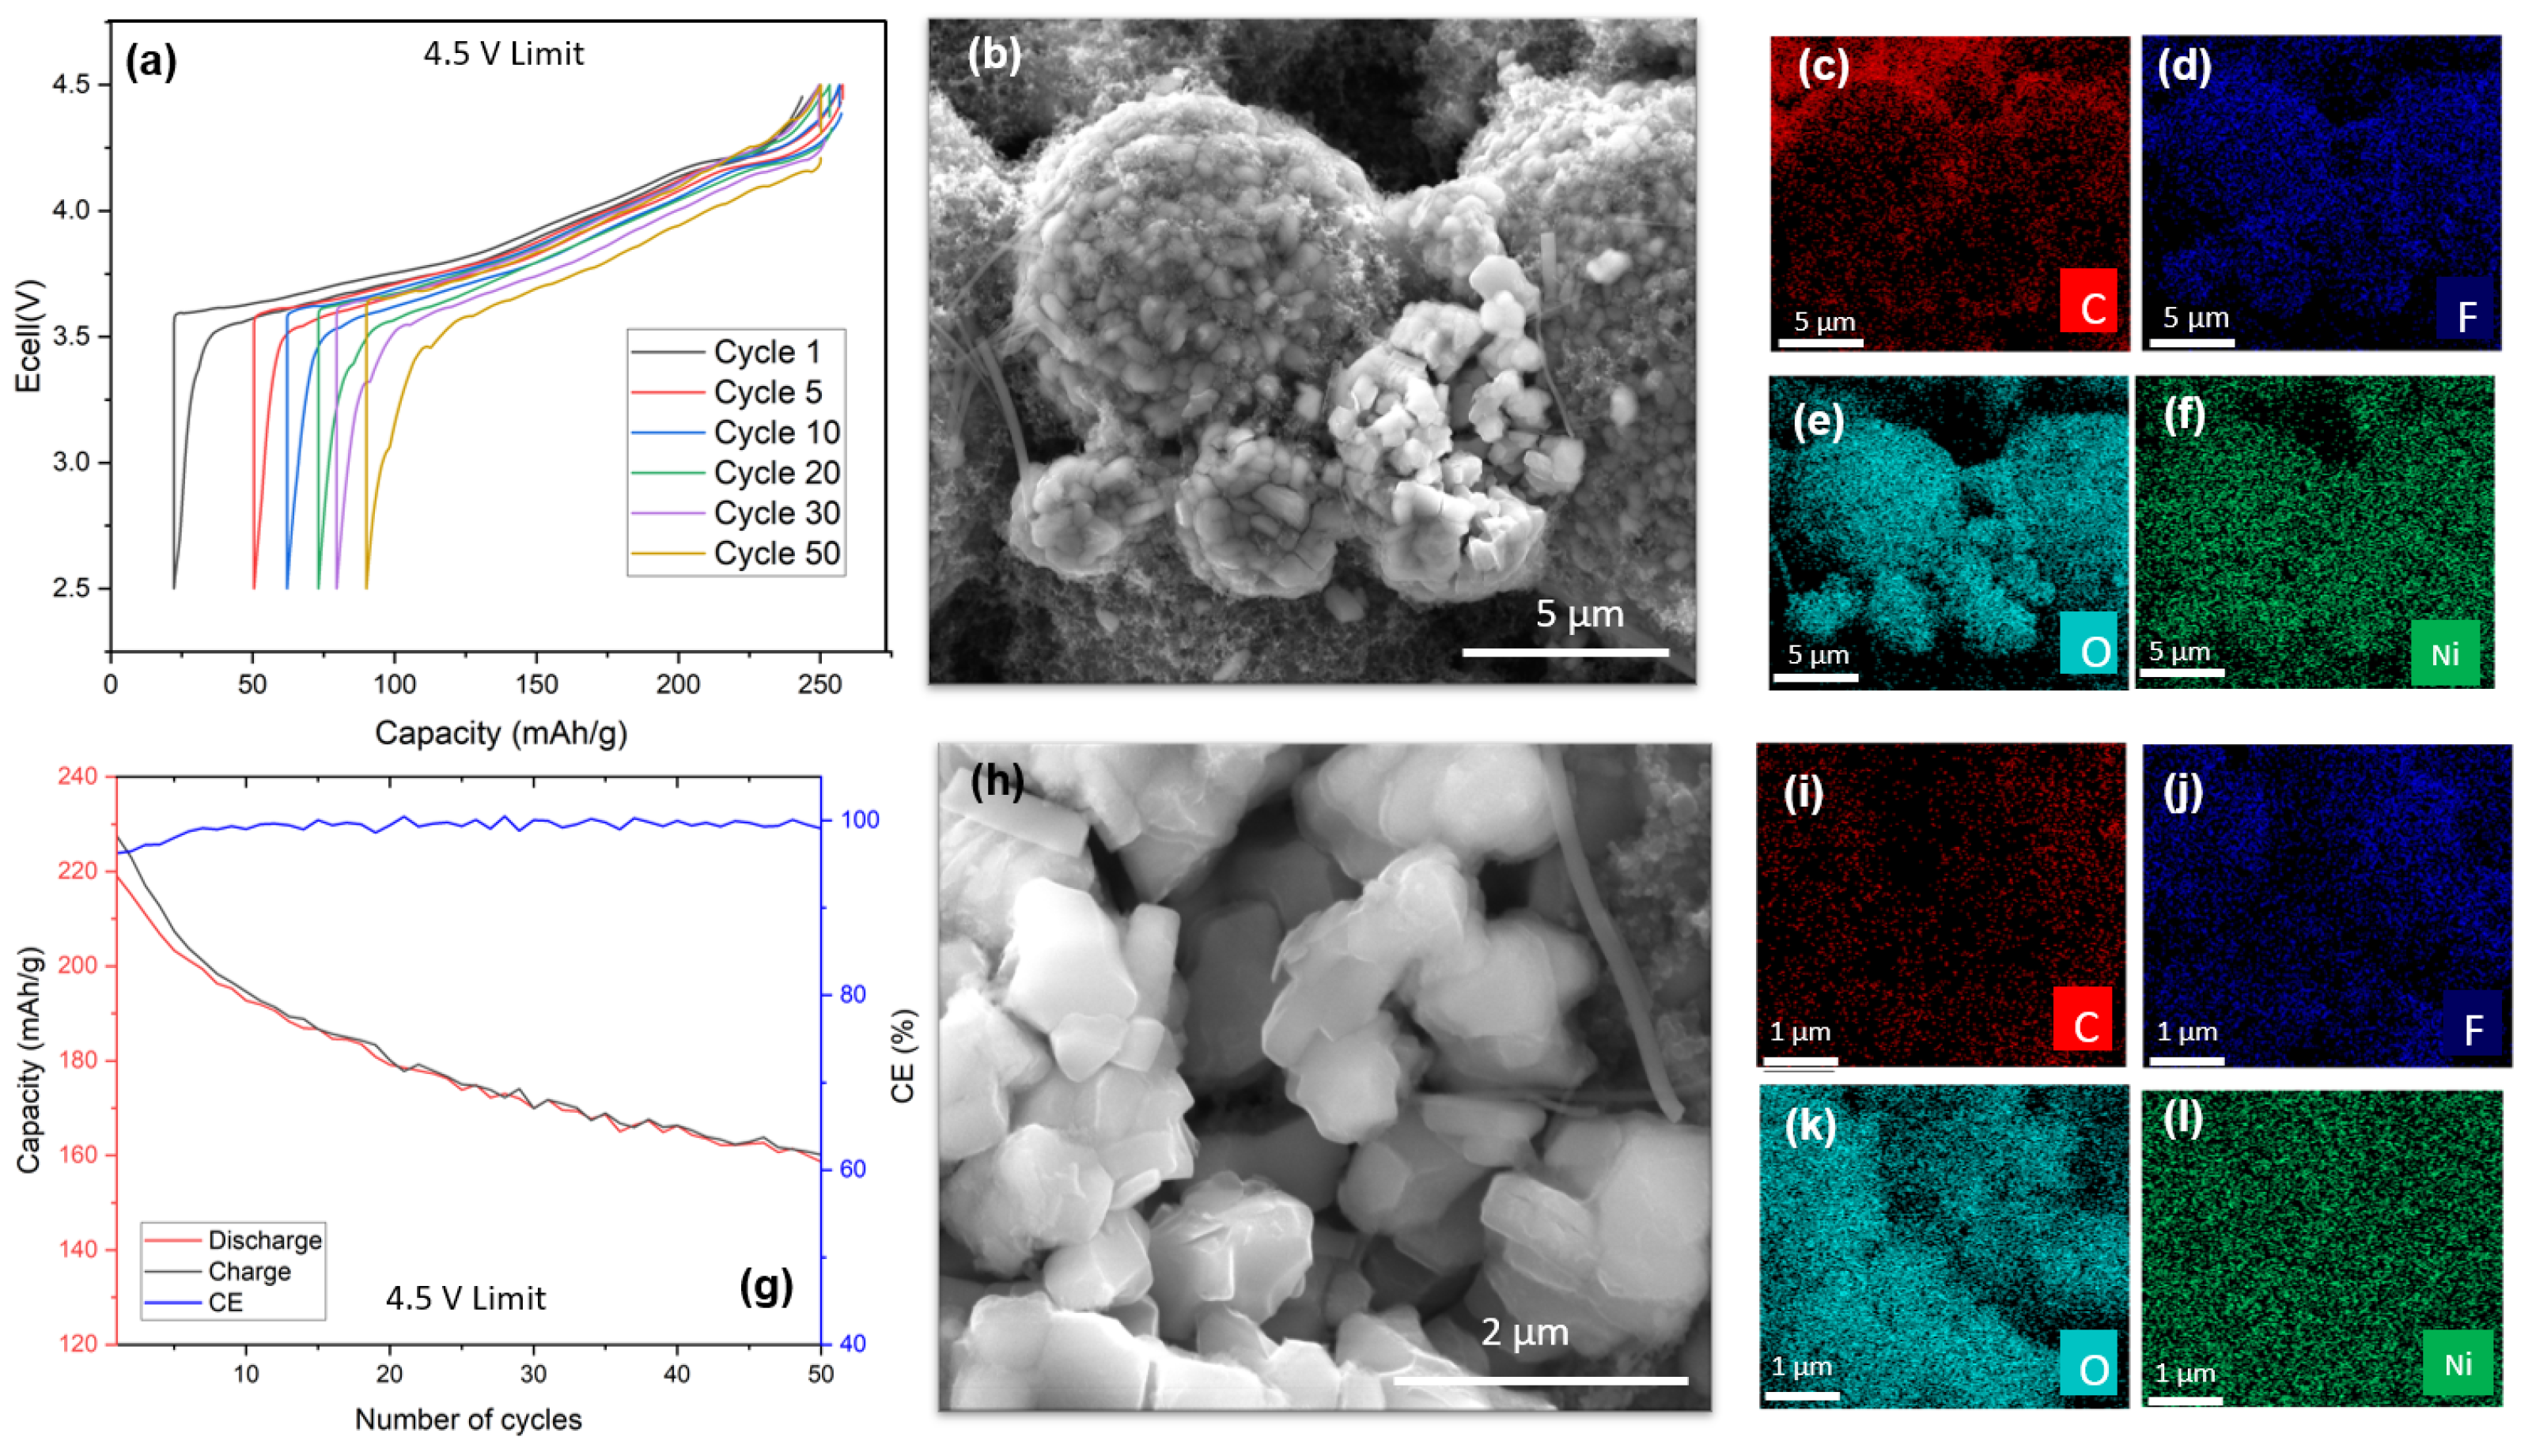
In the presented study, electrochemical characteristics of a coin cell with a 4.5 V voltage limit were elucidated, as depicted in
Figure 4. This cell underwent cycling at a C/20 rate, incorporating a 15 min interlude between successive charging and discharging phases. The polarization observed in the 4.5 V-limit cell (
Figure 4a) exhibited an enhanced magnitude compared to its 4.3 V-limit counterpart, yet it maintained stability throughout the initial 50 cycles.
A closer examination of
Figure 4b reveals a pronounced decline in capacity during the early stages of the cell’s operational lifespan, stabilizing after approximately 20 cycles, similar to the pattern observed in the 4.3 V-limit sample. This initial rapid degradation can likely be ascribed to the electrolyte’s accelerated deterioration under high-voltage conditions and the formation of a less stable solid electrolyte interphase (SEI) layer, which is susceptible to crystallographic and potential morphological alterations, in contrast to the 4.3 V-limit scenario [
41].
Furthermore, the CE of the cell is illustrated in the same figure. While it remained relatively stable, there was an approximate 4% reduction, which is more significant than that of the 4.3 V-limit sample. It is important to note that the thermal behavior of both cells was consistent, as they were subjected to identical cycling conditions in the same environment. For the 4.5 V-limit cell, the initial capacity was approximately 230 mAh/g, diminishing to around 130 mAh/g at the end of its life cycle. This translates to a capacity retention rate of 56.5%, indicating a 21% decrease in efficiency compared to the cell cycled at a 4.3 V cutoff voltage.
The primary aim of this study was to investigate the potential presence of CEI layer constituents, particularly carbonates, through SEM-EDX analysis. Multiscale images were acquired for the same reason presented in the case of the 4.3 V-limit sample.
Figure 4b illustrates a cluster of secondary particles, with at least one exhibiting fracturing. As previously noted, mechanical strain during cycling may induce deformation, potentially leading to the fracturing of secondary particles. The detection of fluorine within the interior of the particle, as shown in
Figure 4f, implies pre-cycling damage. This is consistent with observations from the 4.3 V-limit sample, where fluorine was present on the surface of all analyzed particles (
Figure 4e,f), indicating the formation of a reactive and potentially unstable CEI layer during cycling. In contrast, the absence of carbon on the surface of particles in the 4.5 V-limit sample suggests a lack of carbonate components.
Figure S3c,d present the manganese color overlay of the 4.5 V-limit sample, demonstrating a distribution pattern distinct from that of fluorine, thus confirming the presence of the latter element and eliminating any potential misinterpretation of spectral energies.
In the scientific analysis of the 4.5 V-limit sample, a thorough STEM-EDX examination of primary particles was conducted. The findings are presented in
Figure 5. This analysis entailed a meticulous study of two primary particles, each approximately 500 nm in size.
Figure 5c displays a detailed mapping of manganese and fluorine elements. The presence of fluorine is evident along the edge of these particles. Consequently, a more targeted STEM-EDX profiling was carried out on one of these particles (as depicted in
Figure 5a,b), revealing an inhomogeneous fluorine distribution along the edges (F-K 0.676 keV). This inhomogeneity is attributed to the varying thickness of the particles.
Parallel to the procedure executed for the 4.3 V-limit sample, a carbon-oxygen (C-O) mapping was performed. This step aimed to detect any potential carbonate layers. However, the carbon (C-K 0.278 keV) detected around the particle edges was insufficient to conclusively identify a CEI layer composed of carbonate.
Furthermore, the comparative analysis of
Figure 5e, showing NMC 811 mapping, and
Figure 5a, depicting STEM-HAADF imaging, provided a crucial insight. It confirmed the absence of overlap between the analyzed particles. This observation is significant, as it implies that 4D-STEM analysis could be effectively employed to ascertain the polycrystalline nature of these primary particles without any complications arising from particle superposition.
The 4D-STEM ACOM analysis was performed over the zone of interest, as shown in
Figure 6. First, the orientation map (
Figure 6b) showed a polycrystalline composition for the particle on the left of the scan. For the particle on the right, the thickness did not allow to have a high enough orientation/phase reliability to conclude on a polycrystalline or monocrystalline composition. This information allowed us to reaffirm the hypothesis of lower performance of the 4.5 V-limit sample in comparison to the 4.3 V-limit due to layer rupture contributing to the deformation at a higher voltage. In
Figure 6d, the phase map shows the presence of both NMC 811 (
Figure 6f) and LiF (
Figure 6e), and the orientation and phase maps (together with STEM-EDX analysis) confirm the presence of LiF on the particle edge, with higher confidence than the 4.3 V-limit sample. The higher confidence could be because at a higher voltage, the more aggressive degradation of the electrolyte leads to more LiF formation. However, this does not mean better protection from capacity loss, as we could expect from the reviewed literature. On the contrary, it rather represents a higher loss due to the non-stability of the CEI.
Considering the analysis of both samples, the LiF layer was not formed homogeneously over the entire particle edge. A possible explanation for this is the fact that the CEI formation occurs at the surface of secondary particles, meaning that during grinding, core particles do not present any CEI formation. Moreover, the CEI layer can be affected due to the mechanical energy induced by the grinding of the particles.
Li inorganic compounds were expected to be present in the CEI layer, as has already been reported in the literature. Carbonates and oxides were completely absent, LiOH was found in the sample cycled at 4.3 V in a small quantity, and LiF was present in both samples (4.3 V and 4.5 V) as the predominant component. Even though LiF has been reported to be used as a CEI protective layer against degradation in NMC 811, as we presented in the introduction of this paper, in our case, the samples still presented a retention capacity between 70% and 50%, and these values are close to those found in other works for NMC 811 samples with any treatment or additive against degradation.
3. Conclusions
Ni-rich cathode materials are known for the several degradation mechanisms present due to their high potential working conditions. Chemical and mechanical degradation have been reported in numerous works. In this research, we explored the complex degradation mechanisms in Ni-rich cathode materials, known for their susceptibility to chemical and mechanical degradation under high-potential conditions. Our primary focus was to investigate strategies for mitigating these degradation processes without compromising the capacity of Ni-rich materials. A pivotal aspect of this endeavor involved the formation of a stable CEI layer.
Utilizing advanced characterization techniques, such as 4D-STEM with automated crystal orientation mapping, along with electrochemical analysis, SEM-EDX, and STEM-EDX, we conducted an in-depth study of CEI layer formation in conventional NMC 811 coin cell configurations. These configurations included a lithium metal anode and an LP30 electrolyte, examined at both cutoff voltage limits and beyond.
Our findings revealed the formation of an LiF-based CEI layer in both samples, potentially resulting from water traces in the cathode during preparation. While LiF is frequently lauded for its potential in mitigating degradation phenomena in battery systems, our observations indicated that this layer does not form prior to cycling, and its protective efficacy is not consistent with results reported by other research groups. Our electrochemical data further highlighted a more pronounced degradation at higher cutoff voltages (4.5 V-limit), which could be attributed to the continuous formation and dissolution of the CEI layer. This process, coupled with particle deformation, exacerbates the degradation of the electrolyte at elevated voltages.
Our methodological approach and experimental setup proved effective in studying and understanding CEI formation. However, it is critical to note that CEI formation is predominantly a surface phenomenon at the secondary particle scale. This implies a reduced likelihood of observing primary particles with a CEI layer in TEM analysis, especially considering that sample preparation involves powder grinding, which may induce postmortem degradation of the existing CEI layer.
In perspective, for a better comprehensive analysis of CEI formation, liquid electrochemical in situ TEM cycling analysis techniques, including STEM-EDX and 4D-STEM, are indispensable. Our study also highlighted the inevitability of parasitic reactions, even in controlled environments, across both homemade and commercial batteries. These insights suggest that future advancements in battery performance may hinge on integrating electrolyte additives or adopting cathode material coatings, as explored in previous studies. This direction holds promise for enhancing the durability and efficiency of Ni-rich cathode materials in high-potential battery applications. Finally, it is imperative to conduct a more advanced examination of phase transformations occurring at the surface of Ni-rich NMC in relation to the applied electrochemical potential and the composition of the CEI layer. This investigation is crucial for advancing our understanding of the interplay between CEI layer formation and the alteration in crystallinity of NMC materials.
4. Materials and Methods
4.1. TEM/STEM Analysis
In the context of TEM analysis, the powder from the cathode sheet was detached from the current collector, manually pulverized, and subsequently stored in an aerated glass flask. HAADF-STEM imaging was conducted using a Tecnai G2 F20 S-Twin (Thermo Fisher Scientific, Waltham, MA, USA) system, operated at an accelerating voltage of 200 kV and equipped with a C2 aperture of 70 µm. Additionally, for the acquisition of elemental maps, an energy-dispersive X-ray spectroscope (EDX, Xflash, Bruker, Berlin, Germany) was employed in STEM mode. EDX-STEM analysis was performed in drifted corrected mode, with an EDS map interval of 10 s, dexell time of 8 µs, and a stop mode relative value of 50%. For Q-mapping, the TEM Cliff Lorimer B method was used, where the pixel size was 2 nm, time per pixel was 64 µs, and total scanning time was 532 s.
4.2. 4D-STEM ACOM Analysis
The TEM investigations were conducted using an accelerating voltage set to 200 kV. During the diffraction experiments, the camera length was meticulously maintained at 300 mm. A precesion angle of 0.7° was employed, aimed at minimizing dynamical scattering effects. The condenser aperture was precisely configured to 10 µm, resulting in a convergence semi-angle of 0.4 mrad. For electron beam control, Gun lens 3 was utilized, with the spot size adjusted to 5. The electron dosage for 4D-STEM analysis was established at 150 e/Ų/s. Data processing of the 4D-STEM dataset was executed utilizing the ePattern suite software, which facilitated denoising operations with a prominence value set at 5. Subsequently, the ASTAR software package (developed by Nanomegas, Brussels, Belgium) was applied for the reconstruction of phase and orientation maps. This was achieved through the Automated Crystal Orientation Mapping (ACOM) technique, which relies on a pattern-matching algorithm. The resolution of each diffraction pattern was configured to 512 × 512 pixels. Acquisition of these diffraction patterns was carried out using a OneView CMOS camera, manufactured by Gatan, Pleasanton, CA, USA.
4.3. SEM Analysis
An environmental SEM (ESEM), specifically the FEI Quanta 200 Field Emission Gun (FEG) model, augmented with an advanced energy-dispersive X-ray (EDX) microanalyzer (X-Max 80, Oxford Instruments Co., Abingdon, UK), was employed for detailed microstructural analysis. Imaging modalities, including secondary electron (SE) and backscattered electron (BSE) techniques, were utilized, conducted under a controlled high-vacuum environment at an electron acceleration voltage range of 10 to 15 keV. EDX spectroscopy was consistently executed at an acceleration voltage of 15 keV to ensure optimal elemental characterization. For SEM imaging, the cathode sheet was subjected to examination in its post-recovery state, following a meticulous cleaning process within a controlled atmosphere glovebox. The cathode sheet was carefully placed over the SEM sample holder using carbon tape, with no further manipulation.
4.4. Electrochemical Analysis
The positive electrode material, namely NMC 811, was procured from NEI Corporation (Piscataway, NJ, USA) in the form of cathode sheets, each measuring 127 mm by 254 mm, and adhered to an aluminum current collector with a thickness of 16 µm. The composition of the cathode involved a blend of NMC 811 (constituting 90% of the active material), polyvinylidene fluoride (PVDF) as a binder (5%), and Super P conductive carbon (5%), achieving a uniform thickness of approximately 60 µm ± 5%. For the electrolyte, 100 µL of LP30, a commonly utilized formulation comprising lithium hexafluorophosphate (LiPF6) in a binary solvent system of ethylene carbonate (EC) and dimethyl carbonate (DMC) in a 1:1 volumetric ratio, was employed. A 1 mm-thick fiberglass separator was integrated into the design. Lithium metal, serving as the negative electrode, was sourced from Sigma Aldrich (Saint Louis, MO, USA), preserved in a controlled dry environment, and prepared as a thin foil for subsequent processing.
The coin cell assembly was conducted within a dry room environment, utilizing a 13 mm punched cathode, a 15 mm punched separator, and an 8 mm punched lithium metal. Post-cycling, the coin cell was disassembled within a nitrogen-filled glovebox, and the cathode sheet was subjected to a thorough cleaning process using DMC. This cleaning involved a three-cycle spinning protocol, each at 3600 rpm for 3 min, followed by a drying phase at 80 °C for one hour in an air atmosphere. Electrochemical characterization was performed by cycling the coin cell using a BSC-COM Biologic Potentiostat, with the operational parameters and data acquisition managed by EC-Lab software, version 11.34.

 and
and 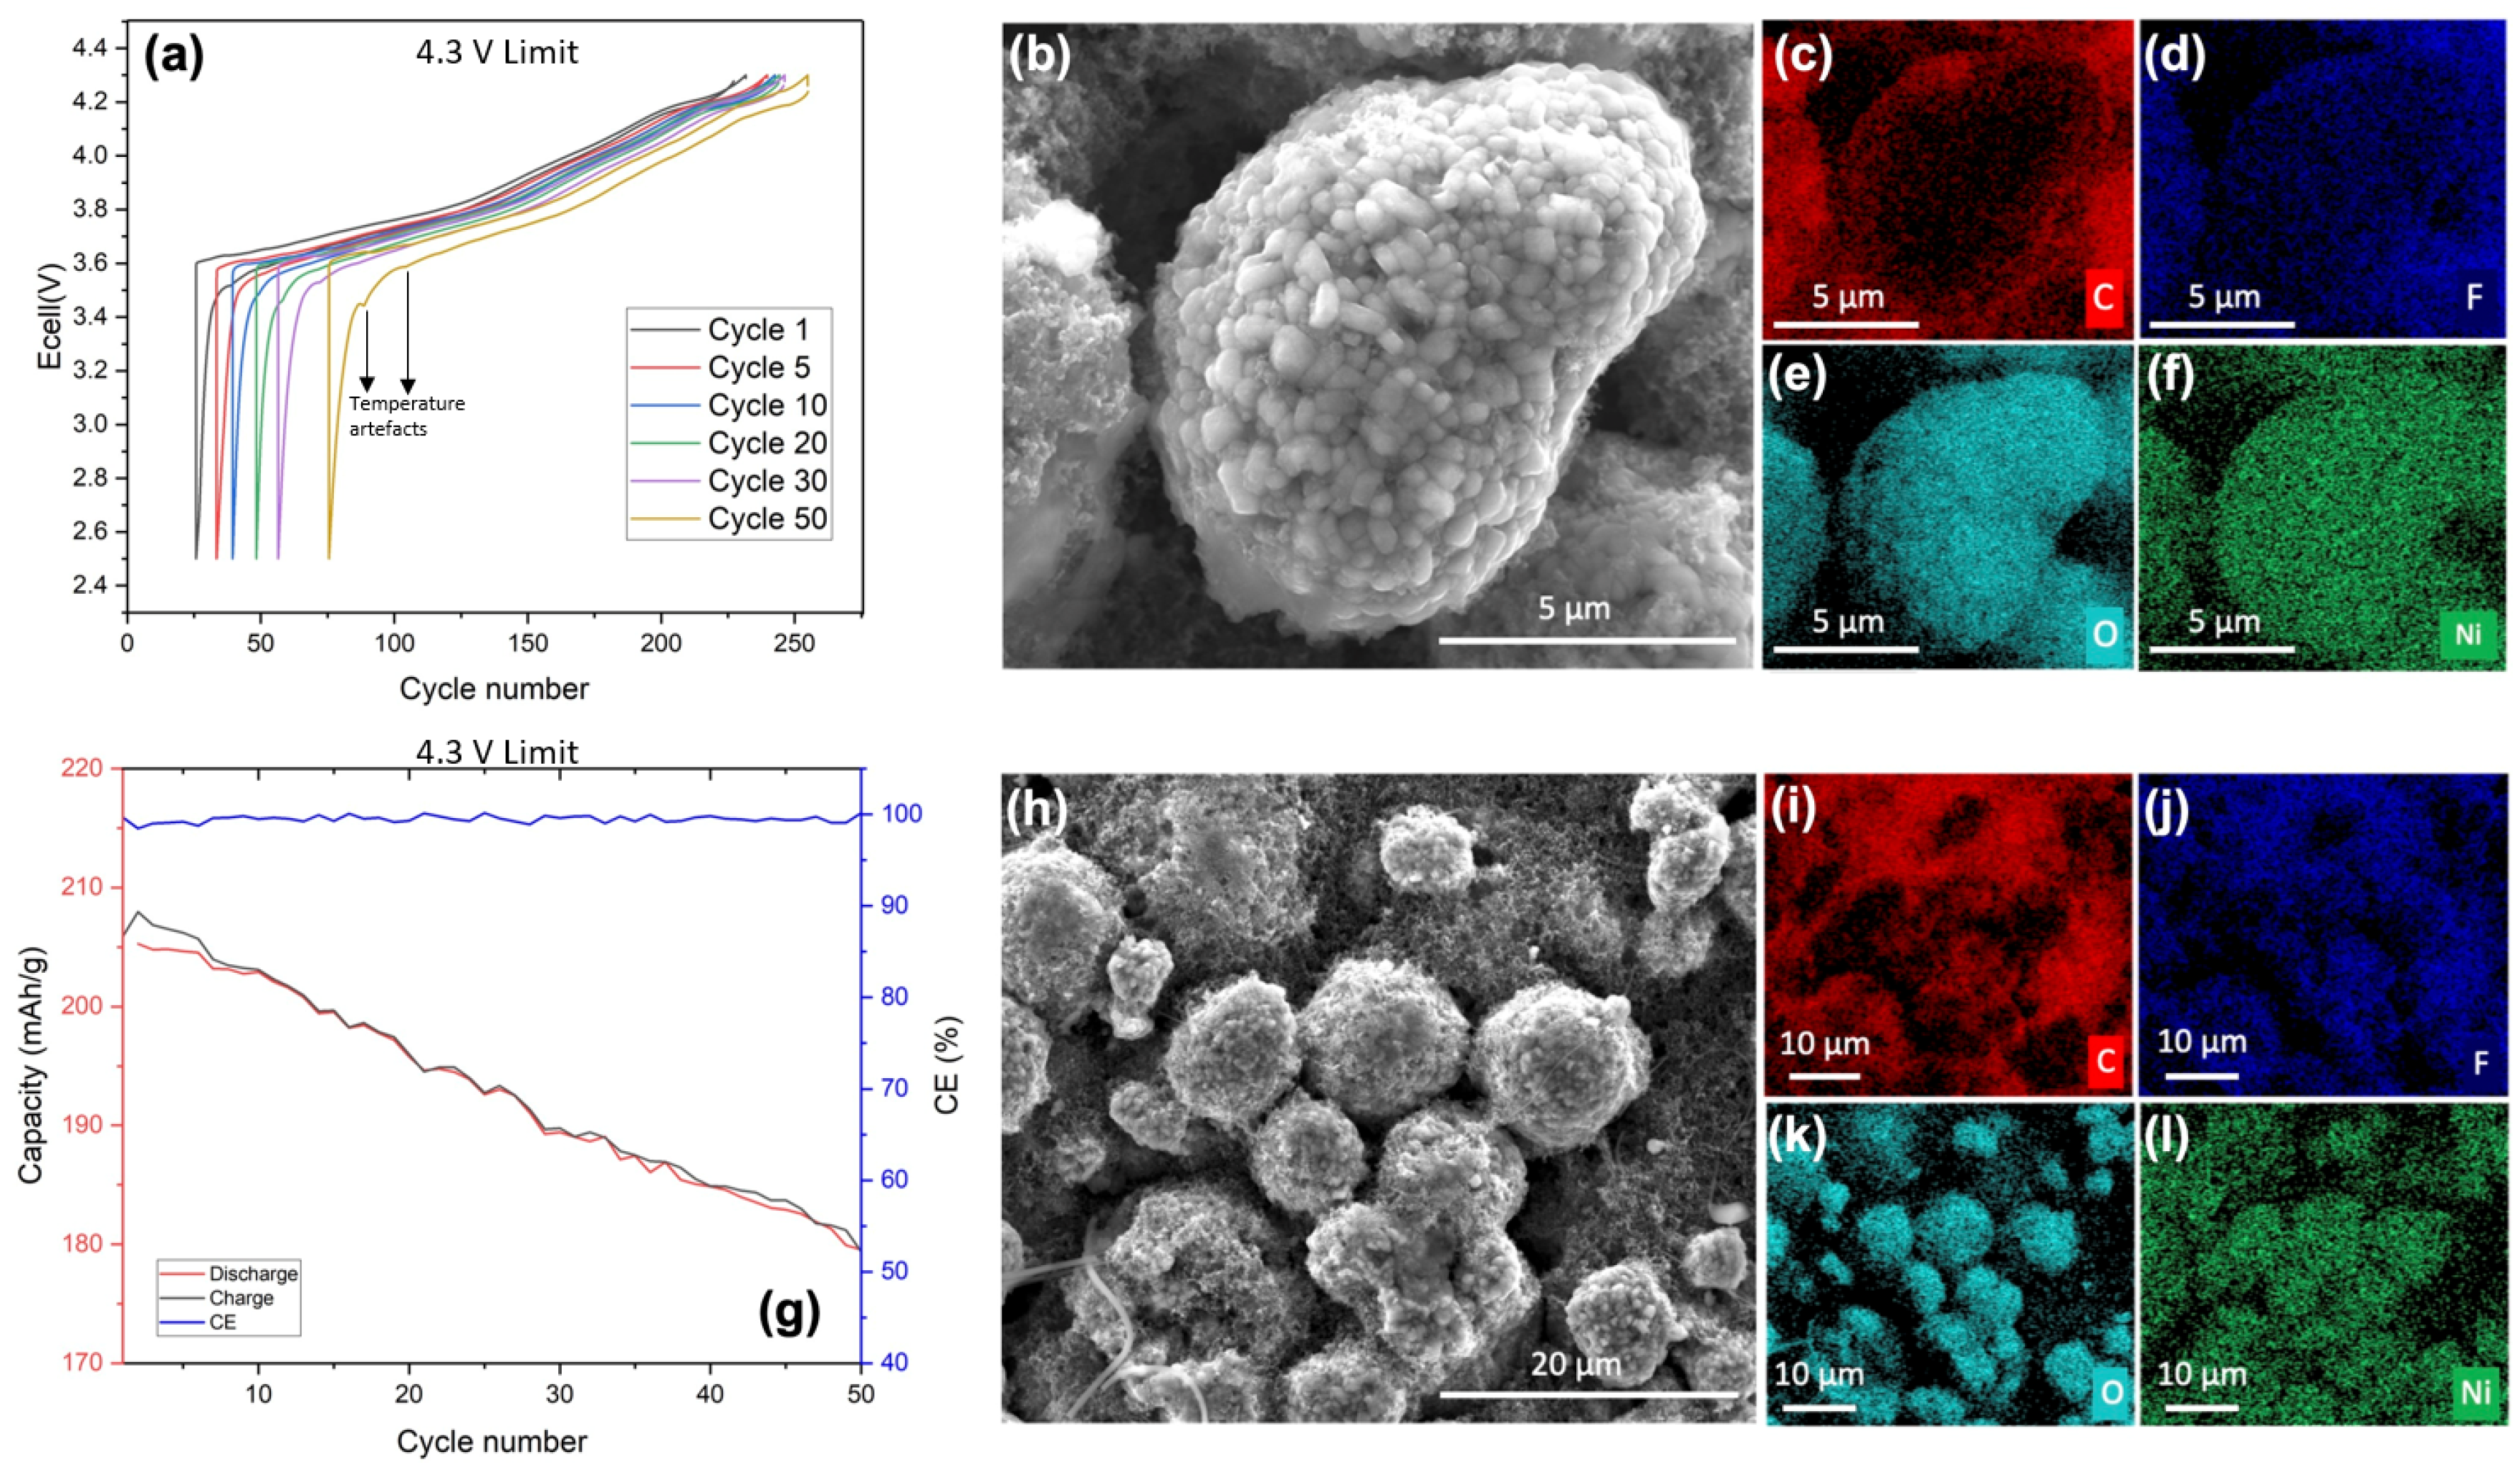


