Article

An Experimental Study of the Effects of Asymmetric Pitching Motion on the Hydrodynamic Propulsion of a Flapping Fin

School of Aerospace Engineering, Beijing Institute of Technology, Beijing 100081, China
*
Author to whom correspondence should be addressed.
Symmetry 2024, 16(3), 302; https://doi.org/10.3390/sym16030302
Submission received: 3 January 2024 / Revised: 20 February 2024 / Accepted: 28 February 2024 / Published: 4 March 2024
(This article belongs to the Special Issue Symmetry and Its Applications in Experimental Fluid Mechanics)

Abstract

:
Aquatic organisms have evolved exceptional propulsion and even transoceanic migrating capabilities, surpassing artificial vessels significantly in maneuverability and efficiency. Understanding the hydrodynamic mechanisms of aquatic organisms is crucial for developing advanced biomimetic underwater propulsion vehicles. Underwater tetrapods such as sea turtles use fins or flippers for propulsion, which exhibit three rotational degrees of freedom, including flapping, sweeping, and pitching motions. Unlike previous studies that often simplify motion kinematics, this study employs a specially designed experimental device to mimic sea turtle fins’ motion and explore the impact of pitching amplitude, asymmetric pitching kinematics, and pausing time on lift and thrust generation. Force transducers and particle image velocimetry techniques are used to examine the hydrodynamic forces and flow field, respectively. It is found that boosting the fin’s pitching amplitude enhances both its lift and thrust efficiency to a certain extent, with a more pronounced effect on thrust performance. Surprisingly, the asymmetrical nature of the pitching angle’s pausing time within one flapping cycle significantly influences the lift and thrust characteristics during sea turtle swimming; extending the pausing time during the forward and upward flapping process improves lift efficiency; and prolonging the pausing time during the downward flapping process enhances thrust efficiency. Furthermore, the mechanism for high lift and thrust efficiency is revealed by examining the vortices shed from the fin during different motion kinematics. This research contributes to a more comprehensive understanding of the fin’s hydrodynamic characteristic, providing insights that can guide the design of more efficient biomimetic underwater propulsion systems.

1. Introduction

Over hundreds of millions of years, biological organisms have undergone an extensive evolutionary process to adapt to their environments, resulting in exceptional locomotive capabilities in fluid mediums such as air or water, unparalleled by artificial flying or underwater vessels [1,2,3,4]. Consequently, unveiling the hydrodynamic mechanisms governing the exceptional swimming abilities of aquatic organisms has become crucial in underwater propulsion research, with a goal to develop corresponding biomimetic underwater propulsion systems.
In the realm of nature, biological prototypes employing wing-like appendages for propulsion generally exhibit two distinct movement patterns, namely symmetric and asymmetric modes [5]. In previous biomimetic propulsion studies focused on hydrofoils, the motion of hydrofoils was commonly modeled in a symmetric mode, involving motion perpendicular to the propulsion direction, known as heave motion, and rotation around a reference axis, termed pitch motion. A certain phase difference was introduced between heave and pitch motions, resulting in a symmetric trajectory perpendicular to the propulsion direction, as observed in the symmetric movement of fish tails in cruising or steady swimming mode.
Similarly, as aquatic organisms, the forelimbs of tetrapods such as sea turtles exhibit both heave and pitch motions while simultaneously undergoing reciprocating motion along the propulsion direction [6,7]. The resulting trajectory manifests an asymmetry perpendicular to the propulsion direction. The motion strategy of sea turtle flippers ensures significant lift or propulsion efficiency during various stages of swimming, endowing sea turtles with the extraordinary ability to traverse thousands of kilometers during transoceanic migrations.
Numerous studies have endeavored to replicate swimming patterns in sea turtles [8,9,10] and to investigate the impact of different swimming strategies on the lift and thrust performance. Anderson et al. [11] explored the variations in the flow field and propulsion efficiency of a two-dimensional flapping hydrofoil of a sea turtle by altering the Strouhal number (St) and maximum angle of attack (αmax). They utilized particle image velocimetry (PIV) to visualize and measure the flow field. Polidoro [12] employed a six-component force sensor to investigate the thrust generation characteristics of bio-inspired hydrofoils with different aspect ratios during coupled sweeping and pitching motions. The hydrofoil with an aspect ratio of four yielded optimal thrust performance and operational efficiency. Hover et al. [13] focused on the relationship between the variation in the angle of attack and the propulsion performance of flapping hydrofoils. They investigated the effects of pitching angle of attack modulation in the form of square waves, triangular waves, and cosine waves on the thrust coefficient and average propulsion efficiency, concluding that the triangular wave configuration resulted in the highest thrust coefficient.
Schouveiler et al. [14] conducted experimental studies on the thrust coefficient and propulsion efficiency of a two-dimensional hydrofoil with varied vortex control parameters (St and αmax), noting an increase in the thrust coefficient with the increase in St and a non-monotonic trend with the maximum angle of attack (αmax). Alexandra [15] conducted experiments on the propulsion characteristics of three-dimensional hydrofoils with coupled yaw and pitch motions at high Reynolds numbers (Re > 104). They found that increasing the St value, while keeping the αmax relatively small (less than 20°), led to an increase in the hydrofoil’s thrust coefficient without significant changes in propulsion efficiency. Additionally, Nick et al. [16] created a model based on the green sea turtle (Chelonia mydas) and developed a specialized testing rig to uncover the reason for the sea turtle’s upstroke strategy, revealing that the utilization of a passive upstroke substantially reduces the animal’s drag coefficient. Kumar et al. [17] demonstrated that flapping fins, when moving in a compound harmonic motion, can generate thrust, and the propulsive performance is correlated with the frequency. Li et al. [18] found an optimal pitch amplitude for flapping propulsion. Han et al. [19] concluded that non-sinusoidal flapping motion exhibits superior energy harvesting performance. Zhang et al. [20] compared the comprehensive performance of rectangular, trapezoidal, leading-edge-swept triangular, and trailing-edge-swept triangular hydrofoils, determining that rectangular hydrofoils exhibit optimal performance. Guo et al. [21] established that hydrofoils with a leading-edge wavy shape demonstrate superior hydrodynamic performance.
In recent work, an updated sea turtle locomotor description for the animal’s general swimming routine is provided by van der Geest et al. [22], which details the three-dimensional fin motion patterns, including the active pitching of the fin. Wild green sea turtles have a different swimming pattern to previous studies on juveniles in captivity. Additionally, they outlined that the flapping fin’s motion can be broken up into five stages consisting of downstroke (DS), sweep stroke (SS), recovery stroke one (RS1), upstroke (US), and recovery stroke two (RS2) as can be seen in Figure 1.
Aligning with the actual motion of sea turtles, van der Geest [22] proposed fitting equations for the motion of sea turtles’ fins with three degrees of freedom in rotation. Notably, the fitted expressions reveal sinusoidal variations in the angles of flapping and sweeping, while the pitching angle exhibits an asymmetric characteristic in terms of time and amplitude between the upstroke and downstroke within one cycle. The potential impact of such asymmetry on lift and thrust generation during sea turtle swimming still needs further examination.
While the actual motion of sea turtles is complex with three rotating degrees of freedom, most of the aforementioned studies use simplified motion kinematics by considering only one or two rotating degrees of freedom, or even adopt translation motion instead of rotation. These contribute to the general understanding of the propulsion mechanism for aquatic tetrapods. However, the simplified motion kinematics still lack important pieces in the full intricate motion and fall short of uncovering the mechanisms of high efficiency for specific complex motion kinematics. Furthermore, research on the asymmetry of fin motion strategies primarily focuses on the asymmetry of the two degrees of freedom in flapping or sweeping, leaving a relative vacancy in the study of the asymmetry of the pitching motion between the upstroke and downstroke within one cycle.
In the present study, we mimic the motion of the fin of a sea turtle using a specially designed test rig with three rotational degrees of freedom. We explore the influence of pitching angle amplitude and pitching asymmetry in pausing time on the lift and thrust acting on the fin. The formation and evolution of the vortices shed from the fin are examined in an attempt to reveal the mechanism of high propulsion forces or efficiency for complex motion kinematics involving asymmetric pitching. This study contributes to a more comprehensive understanding of hydrodynamic propulsion of fins for underwater swimming or transportation.

2. Experimental System and Methodology

2.1. Experimental Set-Up

The experimental investigation was conducted in an octagonal water tank. Replication of the sea turtle fin’s motion was achieved using a specially designed test rig with three rotational degrees of freedom. The motion-driven system is equipped with three servo motors (two above water and one underwater). The three servo motors are independently controlled by PLC signals from a JMC806 control card (Beijing, China), which allows for adjustable phase differences among the rotations. This apparatus can achieve various complex motion patterns and is suitable to mimic the complex motion kinematics of the sea turtle fin.The detailed experimental configuration has been illustrated in Figure 2.
This study primarily investigates the impact of a sea turtle fin’s motion strategies on its hydrodynamic performance. The fin’s geometry is simplified to a rigid flat-plate wing with a span of 180 mm, a chord length of 60 mm, and a thickness of 3 mm. The fin is connected to the underwater motor using an axis fixed at the mid-chord position. The fin is placed in a water tank which has a depth of 1 m and an octagonal cross-section with a circumcircle diameter of 1 m. As illustrated in Figure 3, the upward-and-downward motion of the axis in the vertical direction is defined as flapping motion. The forward-and-backward motion of the axis in the horizontal direction is defined as sweeping motion. The rotation of the fin around this holding axis is defined as the pitching motion. The motion-driven system comprises two motors positioned above the water surface and a third underwater motor. The two motors above the water are responsible for driving the flapping and sweeping motions of the hydrodynamic model, in this case, a rectangular fin. The flapping motion is achieved through the utilization of a long shaft and a series of underwater bevel and spur gears, which transmit the lateral torque from the upper motor downward to the underwater motor and the fin, inducing a flapping motion. The sweeping motion is facilitated by one set of spur gears above water, which actuates the entirety of the flapping module, enabling a sweeping motion to occur. The pitching motion is controlled directly by the underwater motor, whose output axis is connected to the fin pitching axis through a force transducer.
To minimize the impact of the force measurement device on the flow field around the fin and facilitate the acquisition of force data and power consumption, a GLH9200 six-axis force sensor (Beijing, China) was affixed to the root of the flat fin using a flange. This sensor, with a compact structure and a weight of approximately 200 g, is capable of measuring forces in the x (lift) and y (thrust) directions up to 100 N and in the z direction up to 200 N, with torque measurements in all three directions up to 8 N·m. Additionally, it exhibits high measurement accuracy (0.2%) and low coupling errors. The sensor is equipped with a built-in signal amplification circuit and the signal is recorded using a data acquisition card.
Two-dimensional particle image velocimetry (PIV) is used to measure the flow field near the mid-span of the fin (while the fin is at the origin location). The flow field is illuminated using a continuous laser with a 532 nm wavelength. The thickness of the laser sheet in the measurement region is less than 2.0 mm. A CCD (Charge-Coupled Device) camera was used for PIV image acquisition. The camera captured images at a resolution of 1920 × 1200 pixels, corresponding to field of view of 310 mm × 193 mm. The interrogation window for cross-correlation analysis was set at 32 × 32 pixels. The multigrid iterative correlation algorithm was applied to obtain velocity vectors. To minimize laser reflections, the flapping fin is constructed from highly transparent acrylic material, and both the apparatus and force sensor surfaces are coated with matte black paint. The uncertainty of the measured velocity is estimated to be less than 2%.

2.2. The Definition of Motion and Coefficients

As mentioned above, the locomotor pattern was minimized to three degrees of freedom, which was based on recent work by van der Geest et al. [16,22]. The fin equations of motion (plotted in Figure 4) in flapping and sweeping are expressed using a Fourier series, with n = 8 (Equations (1) and (2)), and the pitching motion is expressed as a linear piecewise function (Equation (3)) with (t = 0) set at the end of the sweep stroke (SS) and the beginning of recovery stroke one (RS1):
θ f l a p t = a f + i = 1 n a i f cos ( 2 π f t ) + b i f sin ( 2 π f t )
θ s w e e p t = a s + i = 1 n a i s cos ( 2 π f t ) + b i s sin ( 2 π f t )
θ p i t c h t = a p 1 t , 0 t < t 1 a p 2 , t 1 t < t 2 a p 3 t + b p 3 , t 2 t < t 3 a p 4 t + b p 4 , t 3 t < t 4 a p 5 , t 4 t < t 5 a p 6 t + b p 6 , t 5 t < T
In this study, the motion of fins in the flapping and sweeping degrees of freedom was appropriately simplified through sinusoidal fitting of the green and purple scatter from the image below.
To facilitate a direct comparison with the results of van der Geest et al., the flapping frequency (f) in this study is set at 0.23 Hz. In Equations (1) and (2), where θflap(t) and θsweep(t) represent the instantaneous flapping and sweeping angle of the pitching axis at time t, respectively, and θpitch(t) (Equation (3)) represents the instantaneous pitching angle at time t. The parameters af and as denote the initial attitude angles for the flapping and sweeping degrees of freedom, while ap1~ap6 represent the pitching angle slopes and amplitudes at different stages within one cycle. It is evident that the pitching angle exhibits distinct asymmetrical characteristics in terms of amplitude, rate, and the duration of pitching pauses during the forward–upward and downward–backward phases of motion.
Based on the equations governing the flapping and sweeping motions from the above motion model, we will explore the impact of asymmetry in the pitching movement during the upstroke and downstroke. To more accurately quantify this impact, this study introduces the mean force coefficients. These coefficients are defined by the following equations [23]:
C t , m e a n = 1 T 0 T F t h r u s t ( t ) d t 1 2 ρ U 0 2 S
C l , m e a n = 1 T 0 T F l i f t t d t 1 2 ρ U 0 2 S
p i n p u t = F l i f t ( t ) d θ f l a p ( t ) d t R + F t h r u s t ( t ) d θ s w e e p ( t ) d t R + M ( t ) d θ p i t c h ( t ) d t
C p , m e a n = 1 T 0 T p i n p u t t d t 1 2 ρ U 0 3 S
U 0 = [ d θ s w e e p d t ] max R
where Flift(t) and Fthrust(t) denote the instantaneous forces in the positive x and y directions at time t, respectively, and M(t) represents the generated torque about the pitching axis at time t, all of which are measured by the six-component force sensor. Other than the approach in van der Geest’s study where power is directly measured, this study defines Pinput as the instantaneous power, which is equivalent to the sum of the products of force and velocity and torque and angular velocity, with R being the distance from the center of mass to the rotational center of the flat-plate wing, T representing the period, U0 standing for the reference velocity defined as Equation (8), and S being the area of the fin. Furthermore, Cl,mean, Ct,mean, and Cp,mean are the corresponding non-dimensional thrust and power coefficients. The propulsive and lifting efficiency (η) can be defined as follows:
η t = C t , m e a n C p , m e a n
η l = C l , m e a n C p , m e a n

3. Results and Discussion

3.1. Validation of Force Measurements

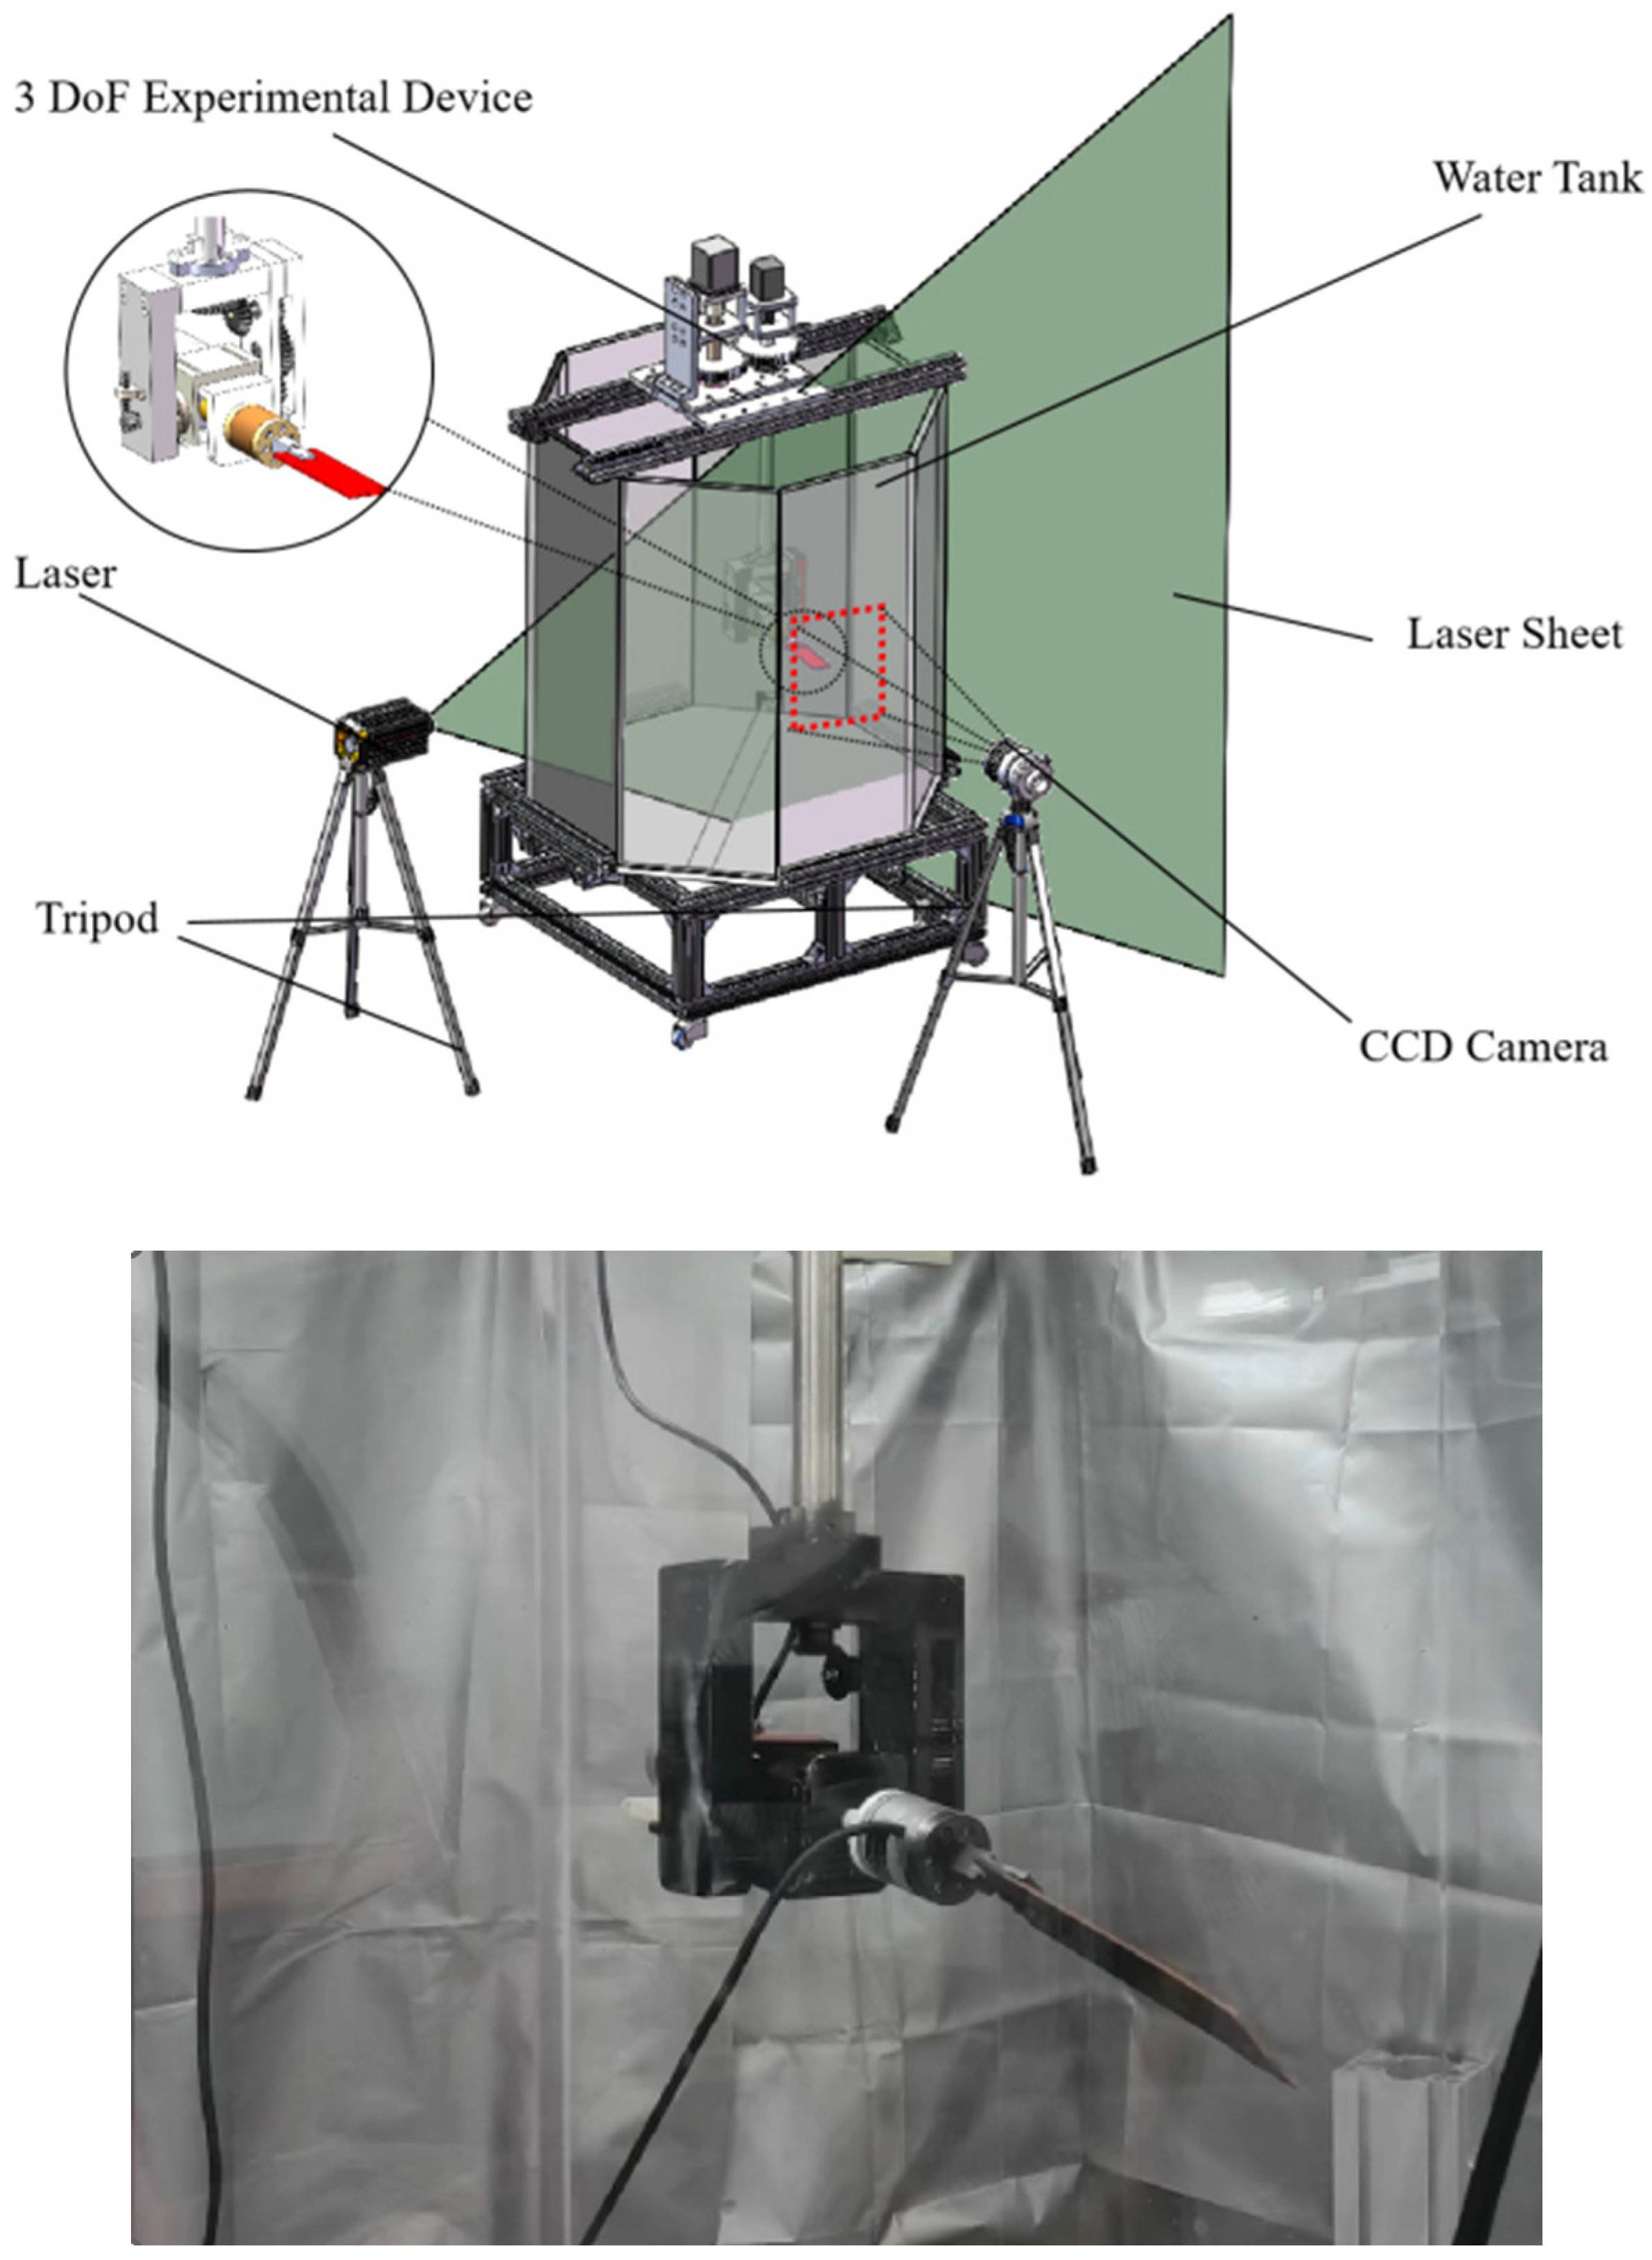
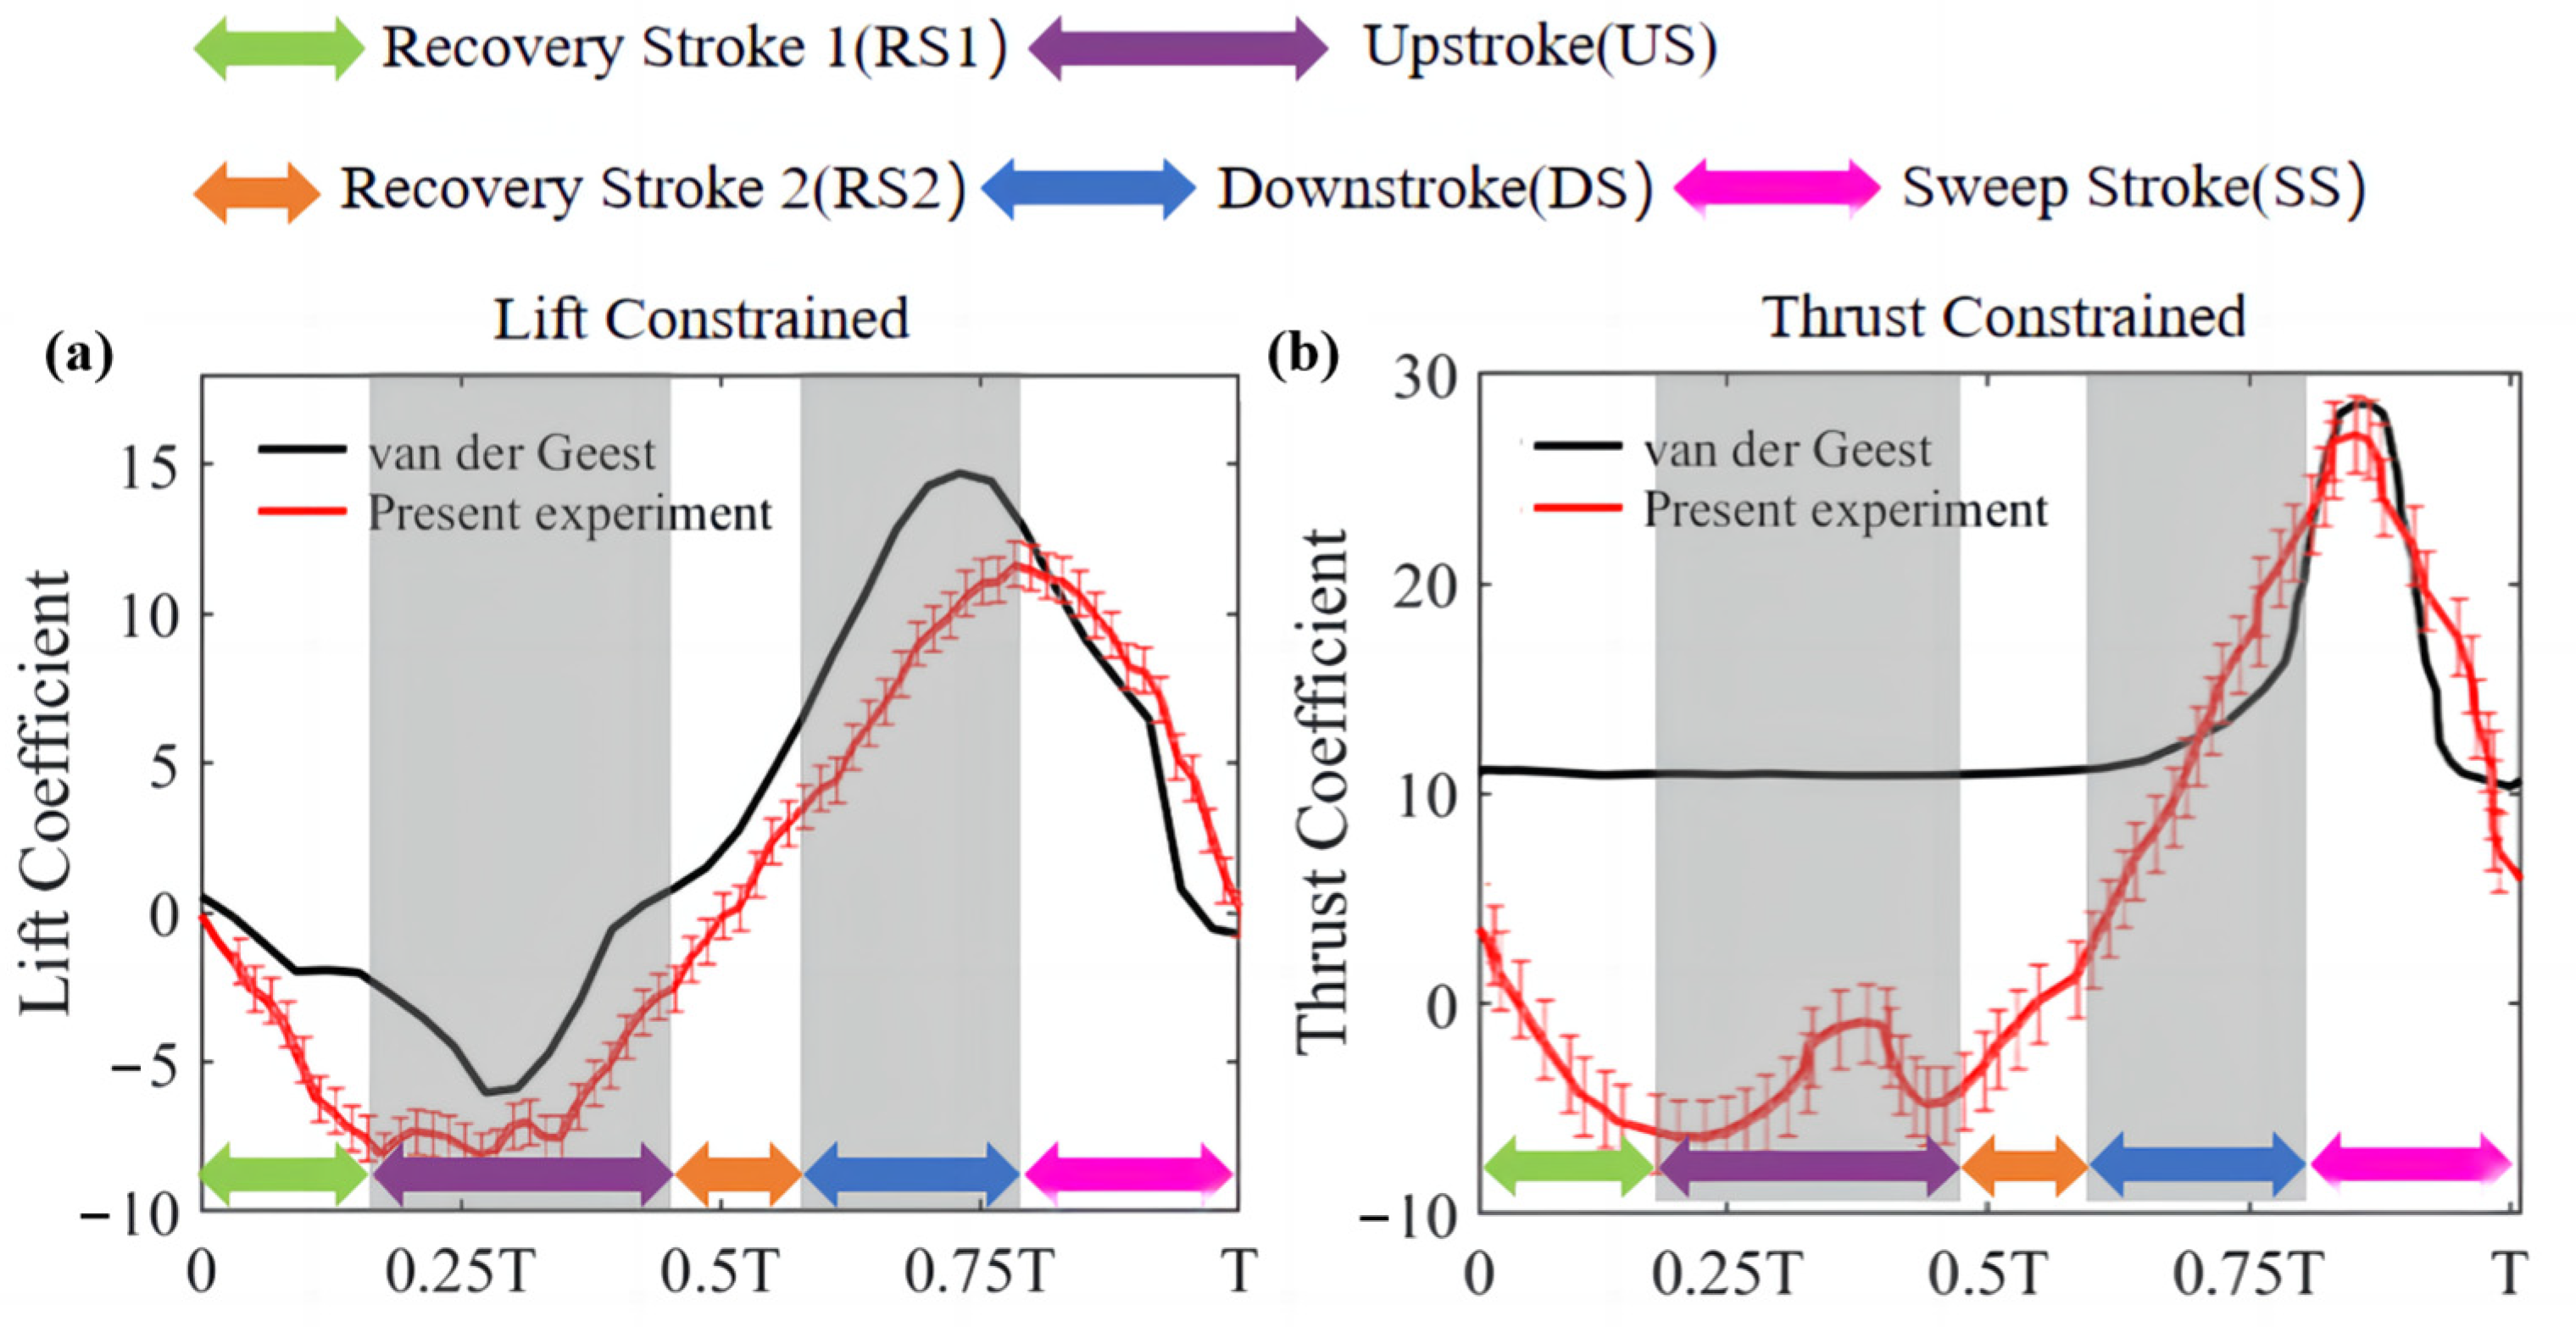
This study meticulously explores the influence of motion trajectory on the hydrodynamic performance of turtles’ fins. Prior to investigating key parameters such as asymmetry in pitching, we initially subjected the device to the exact same motion pattern as that employed by van der Geest, enabling a comparison of lift and thrust coefficient measured under constrained conditions. To put it more precisely, a turtle robot with flexible fins is fixed to a beam in Van der Geest’s experiment. A force balance was placed at the top of the beam to characterize the lift and thrust experienced by the turtle robot as a whole under constrained conditions. To simplify and focus on the force exerted on a single fin, our experiment employed a high-precision six-component force sensor positioned at the base of the fin for measurement. This setup allows us to precisely measure the lift and thrust acting on individual fins when subjected to asymmetric driving, thereby providing deeper insights into their motion characteristics and force-generating mechanisms. From Figure 5, it is evident that the experimental results in this study generally follow the same trend as that of van der Geest’s findings in terms of lift and thrust coefficient curves over one cycle.
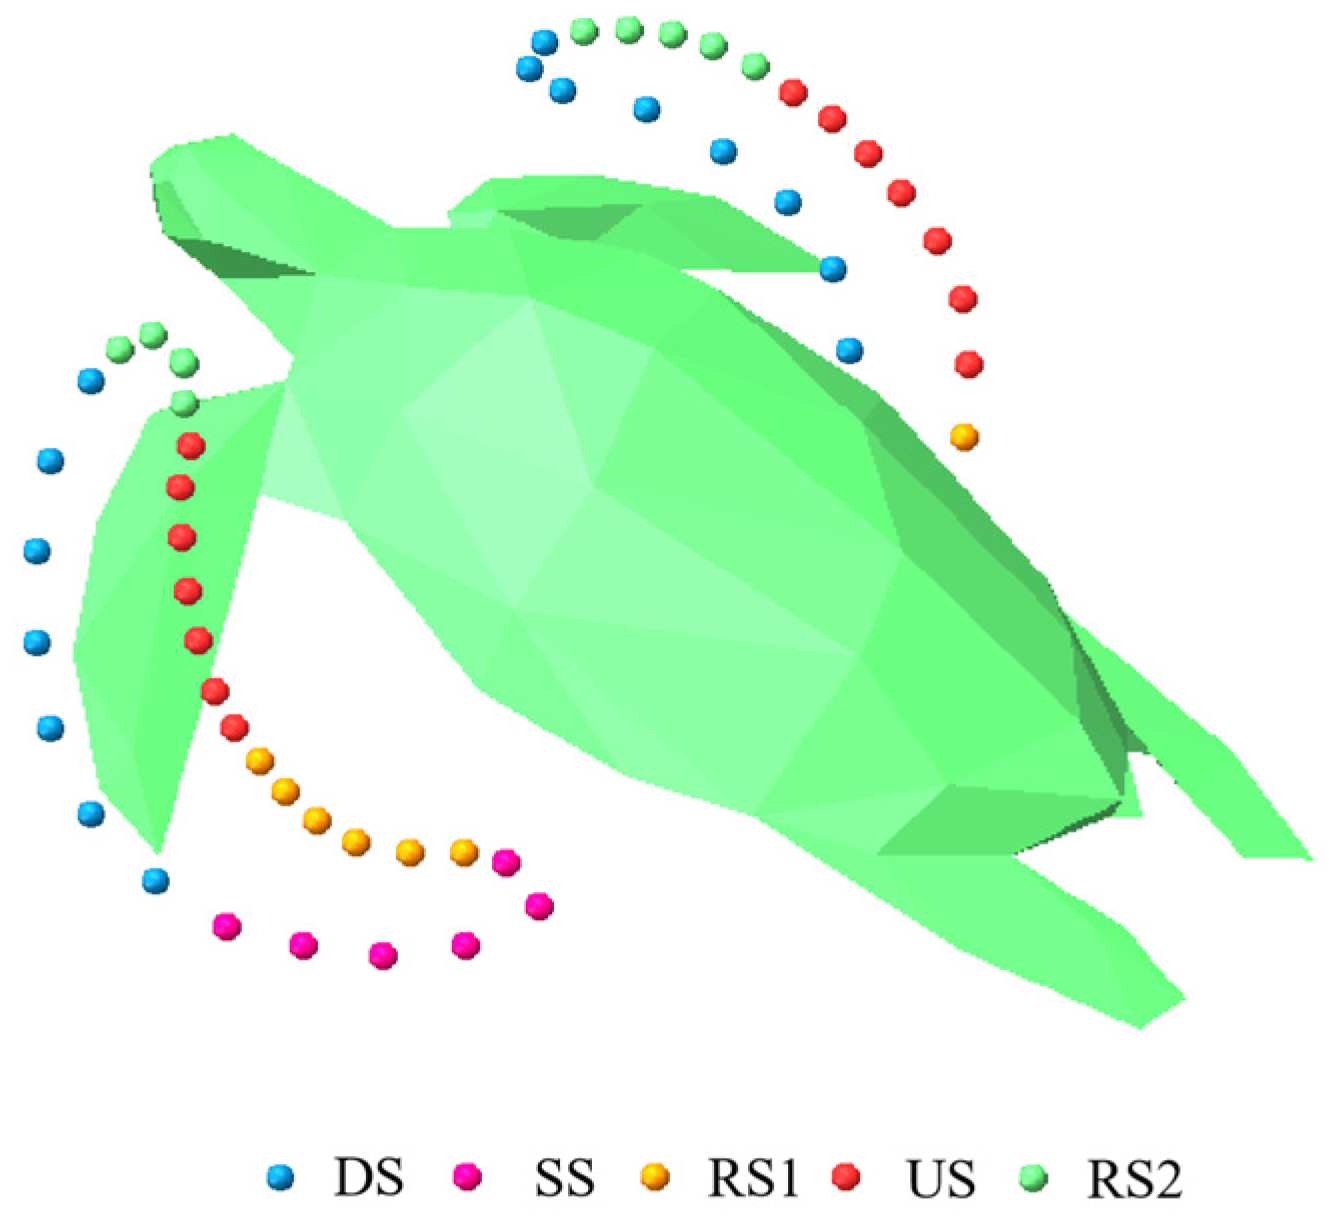
Following van der Geest’s research framework, a sea turtle fin’s flapping cycle is divided into five phases, as mentioned in the first part of this article, denoted by the colors green, purple, orange, blue, and magenta. The lift curve on the left column reveals that during the first phase (green arrow region), the sea turtle’s flapping fin moves forward and upward from the initial position, producing negative lift. Simultaneously, the fin keeps pitching, causing minor fluctuations in negative lift during the second phase. The third phase corresponds to a period of pitching angle inactivity, where, despite continuous flapping and sweeping coupled motions, the slope of the lift curve noticeably decreases. Towards the end of the third phase and into the mid-fourth phase, as the fin moves towards the end of the upstroke, it initiates a backswing motion accompanied by a substantial pitching angle change, resulting in a lift peak. In the final phase, lift gradually decreases as the pitching angle reverses. The thrust coefficient curve obtained in this study exhibits some deviations from van der Geest’s results, particularly during the upward–forward flapping phases, where the measured results show resistance and an anomalous fluctuation during the upstroke stage. The measurement uncertainty is much smaller than this disparity, indicating that the substantial difference in thrust between the present study and van der Geest is clearly not due to measurement error. The difference may well be attributed to the flexibility in the model of van der Geest. In fact, the result of van der Geest show positive thrust through the whole cycle, even in the retrieving stage, which is rather intriguing and very difficult, if not impossible, to achieve using rigid fins. This means that for rigid fins, although the major features can be captured by replicating the motions, further improvements could be achieved by introducing flexibility, which is not the focus of the present study. Nevertheless, despite these differences, it is evident that the peak thrust coefficient agrees much better.

3.2. Influence of Pitching Amplitude on Fin’s Hydrodynamic Performance

The pitching amplitude is first varied to see its effects on hydrodynamic forces. To more accurately replicate the motion pattern of real sea turtles, the expressions from the literature are retained for the flapping and sweeping degrees of freedom, while for the pitching angle, we eliminate pausing time and asymmetry, employing a triangular wave-like angular variation and adjusting the amplitude from 15°to 75°, which is illustrated in Figure 6a. Figure 6b presents the variation in the mean thrust coefficient (Ct,mean), mean lift coefficient (Cl,mean), the mean power coefficient consumed by pitching motion (Cp,mean), and thrust and lifting efficiency (ηt, ηl) with respect to the flapping amplitude.
It can be observed from Figure 6b that when the pitching amplitude is less than 45°, the variations in the mean lift and mean thrust coefficients are not pronounced. In the amplitude range from 30° to 45°, all three coefficients (depicted by the solid lines) even exhibit a slight downward trend. However, when the pitching angle amplitude exceeds 45°, there is a noticeable increase in both the mean lift and mean thrust coefficients, as well as the mean power coefficient. Moreover, overall, increasing the pitching amplitude increases the lift and thrust efficiency to a certain extent, with a more significant impact on thrust performance, increasing from 15% to 25%. Lift efficiency sees a moderate improvement from 5% to 11%. This explains why sea turtles adopt high-pitching-amplitude motion kinematics for transportation in the sea.

3.3. Effects of Asymmetric Pausing Time of Pitching Motion

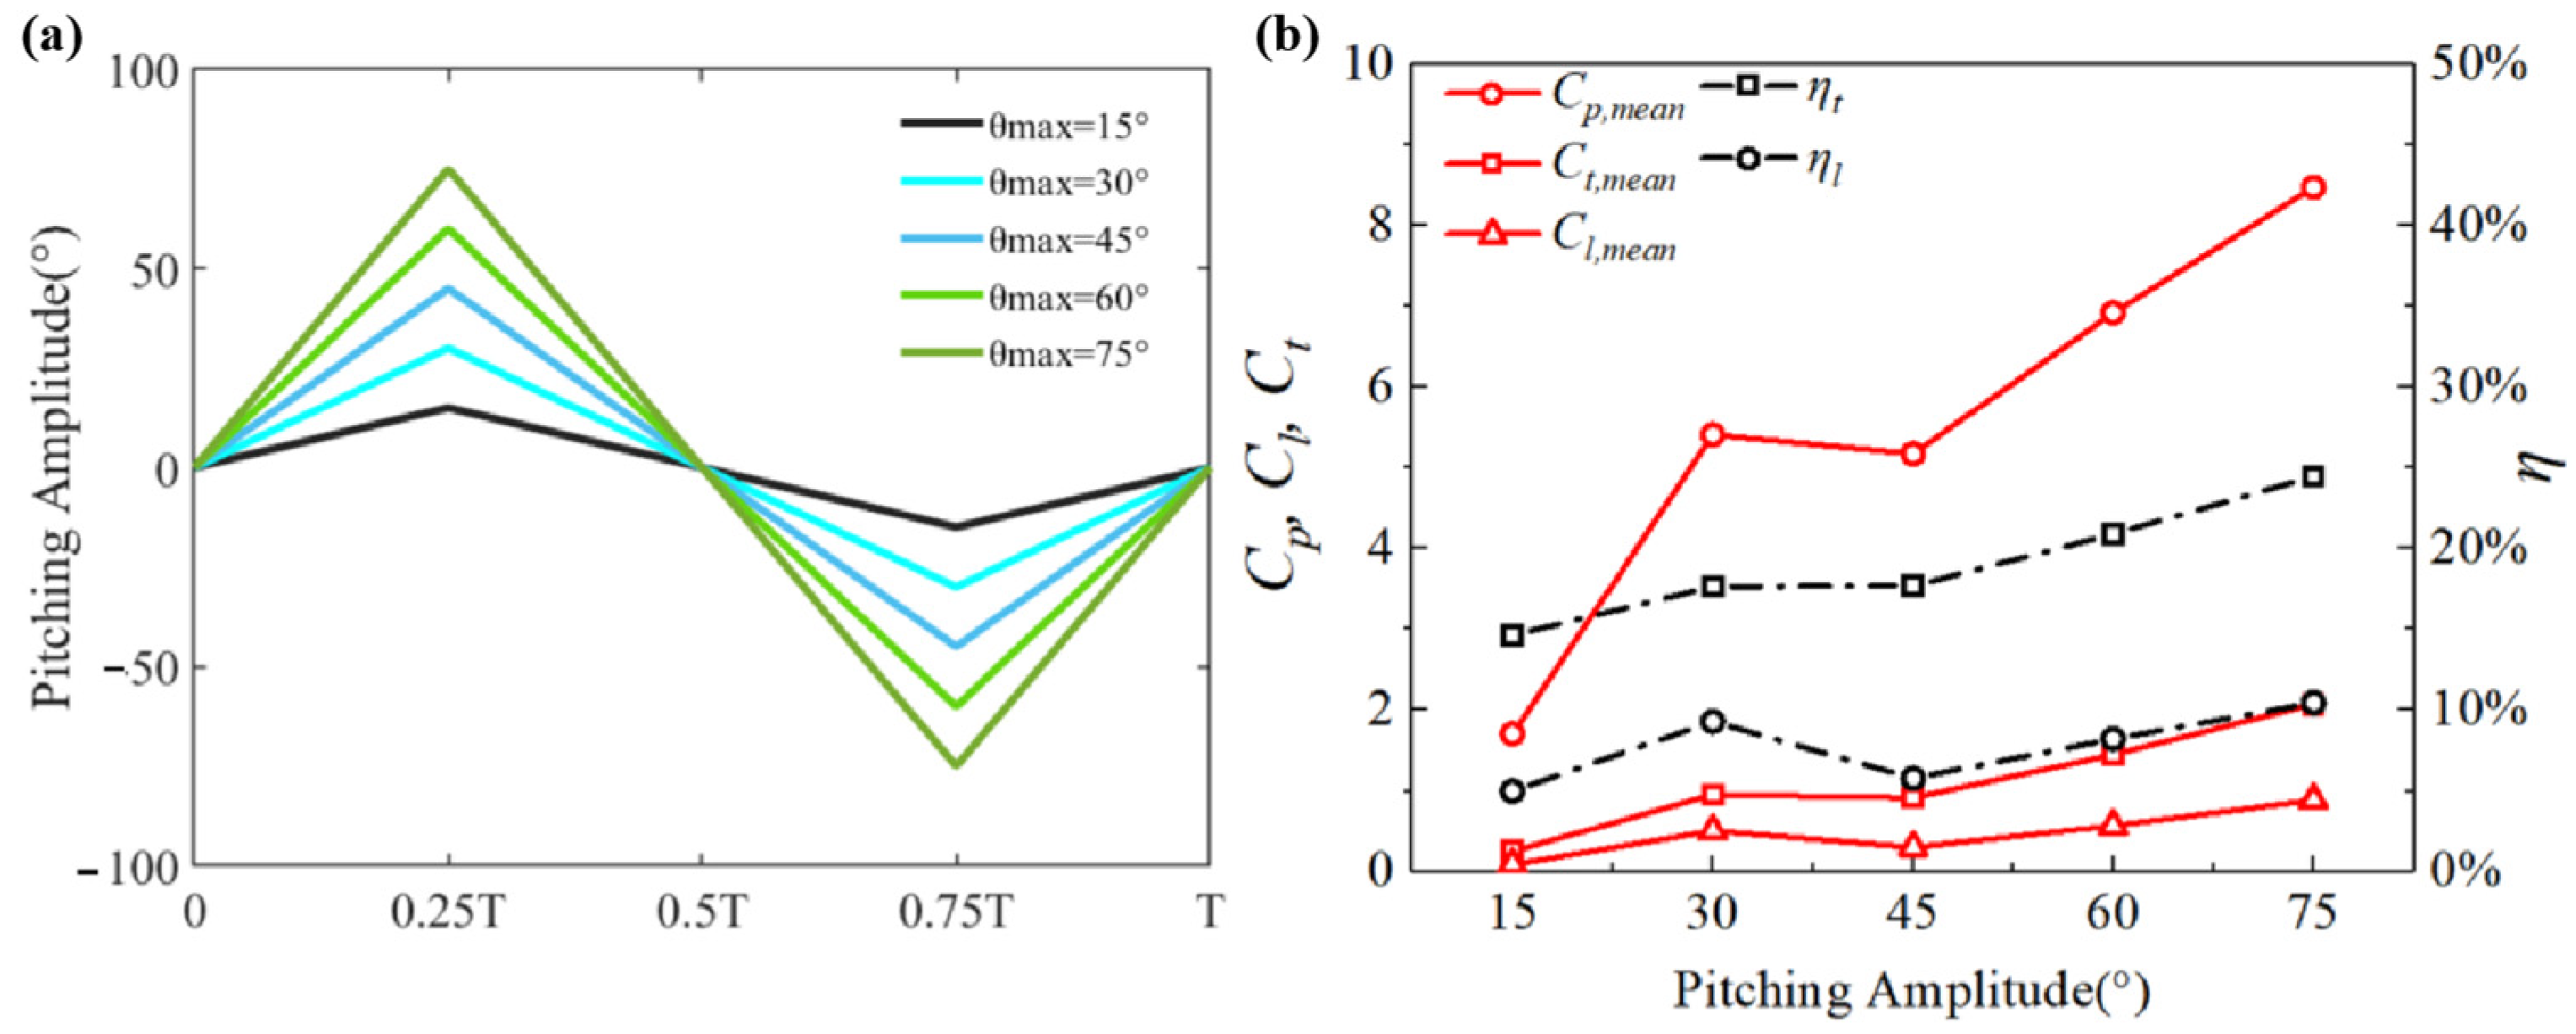
In the previous section, it is observed that a high mean thrust is achieved under the condition of high pitching amplitude in symmetric flapping motion without pitch pausing. To further explore the impact of asymmetric characteristics in the pitching angle, we selected an optimal parameter combination. Upon careful examination of the curve of the real turtle’s pitching angle in Figure 3, it is evident that there exists a “holding period” in both the upstroke and downstroke phases. The duration of this holding period seems to be related to the peaks of the flapping and sweeping angles.
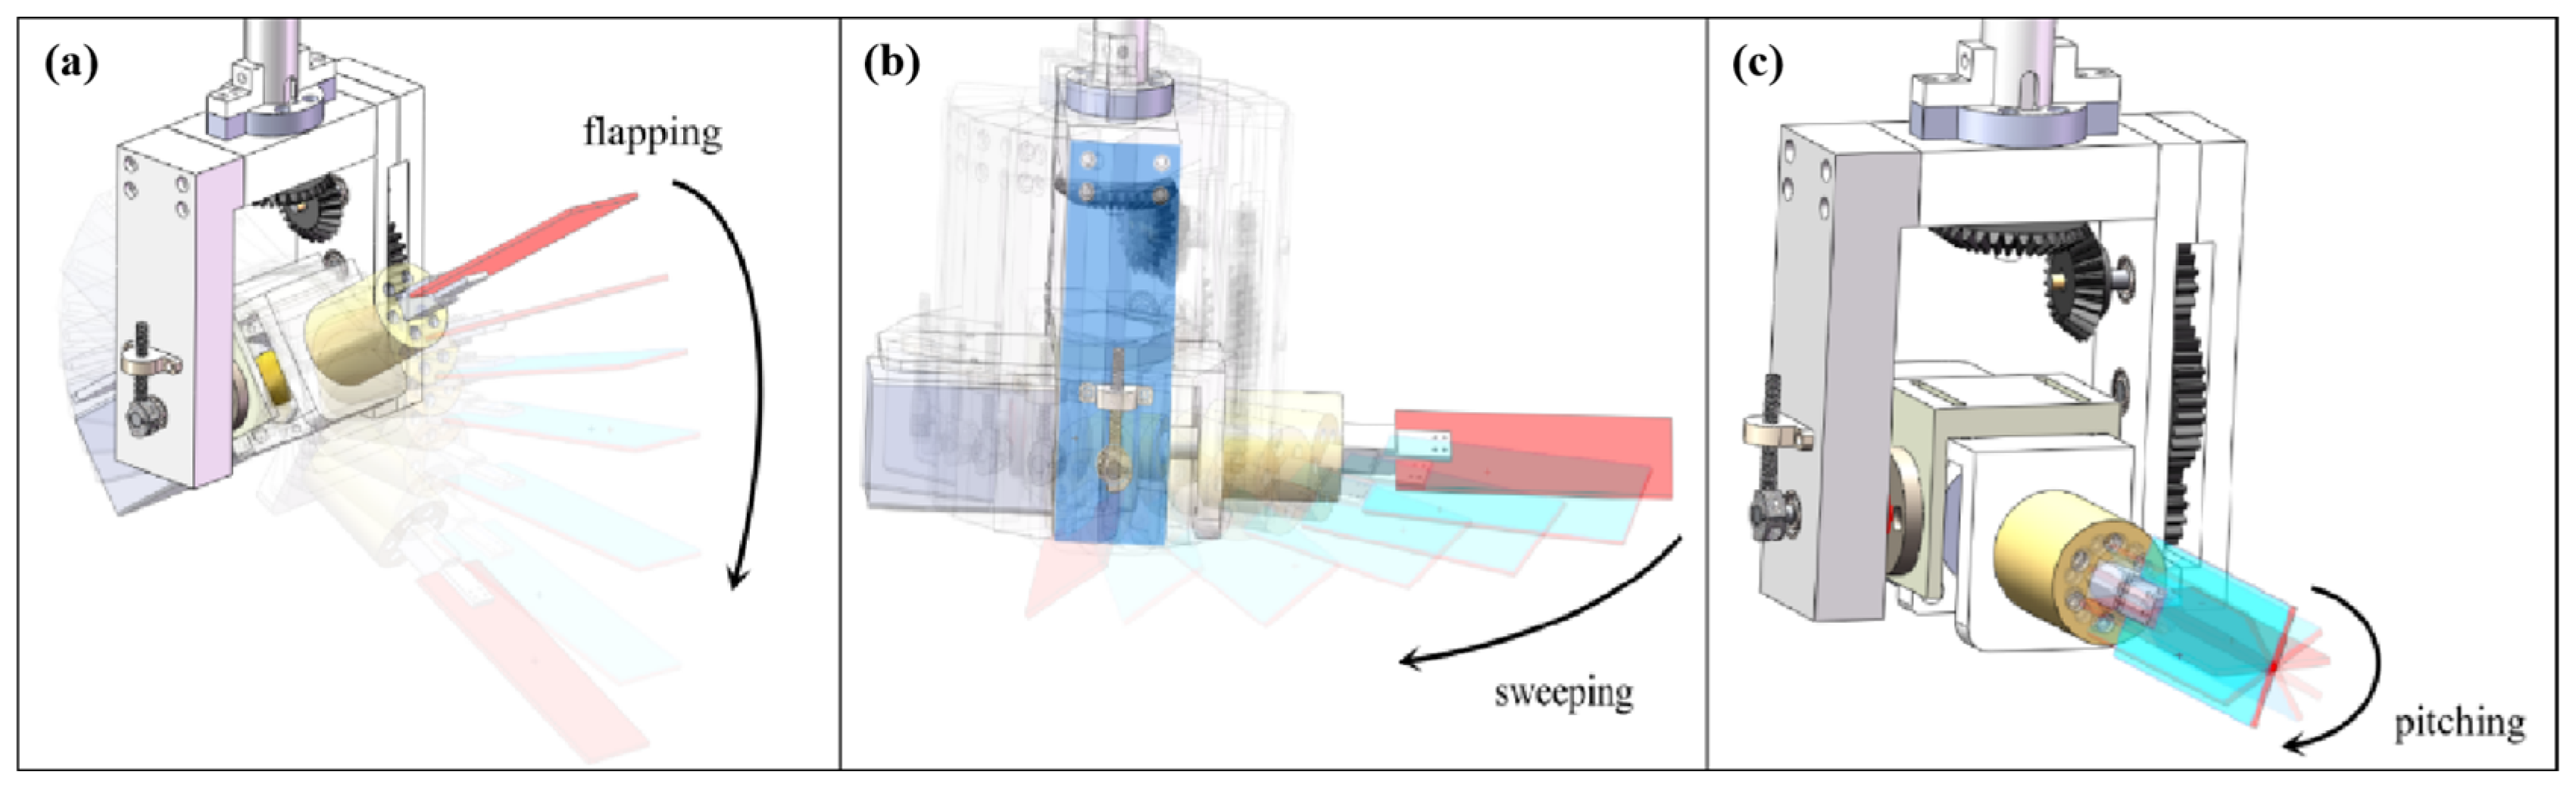
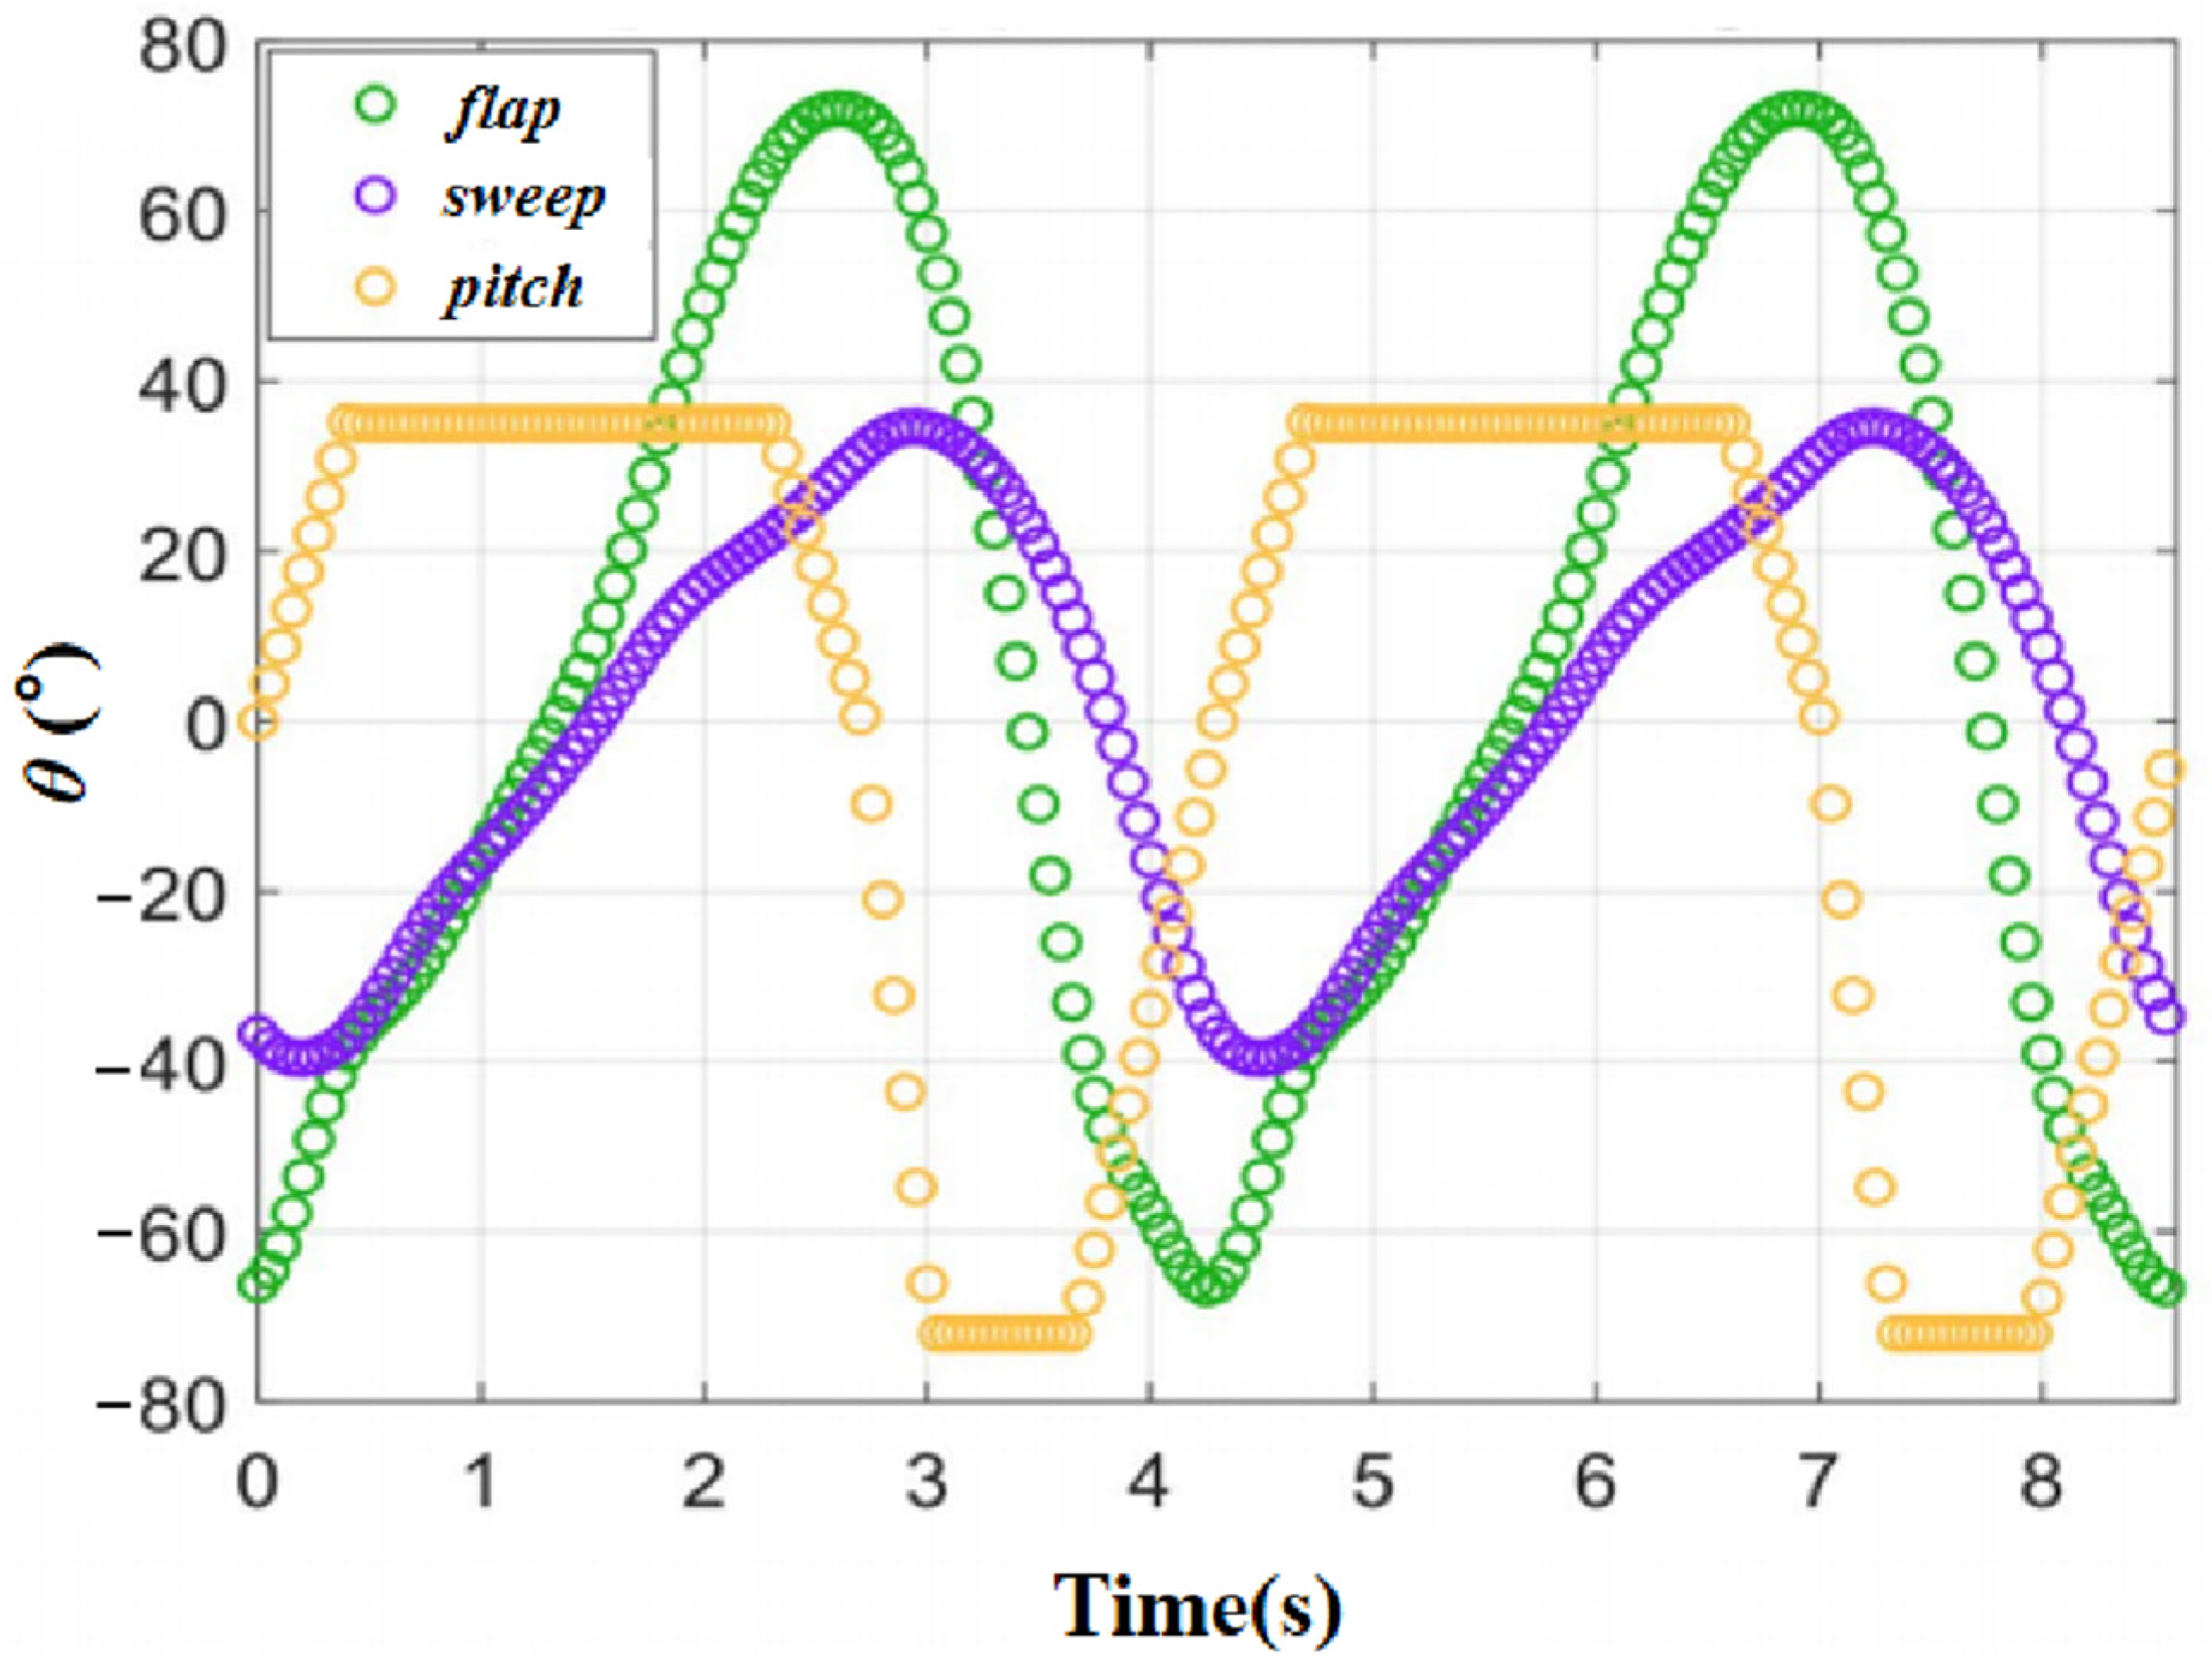
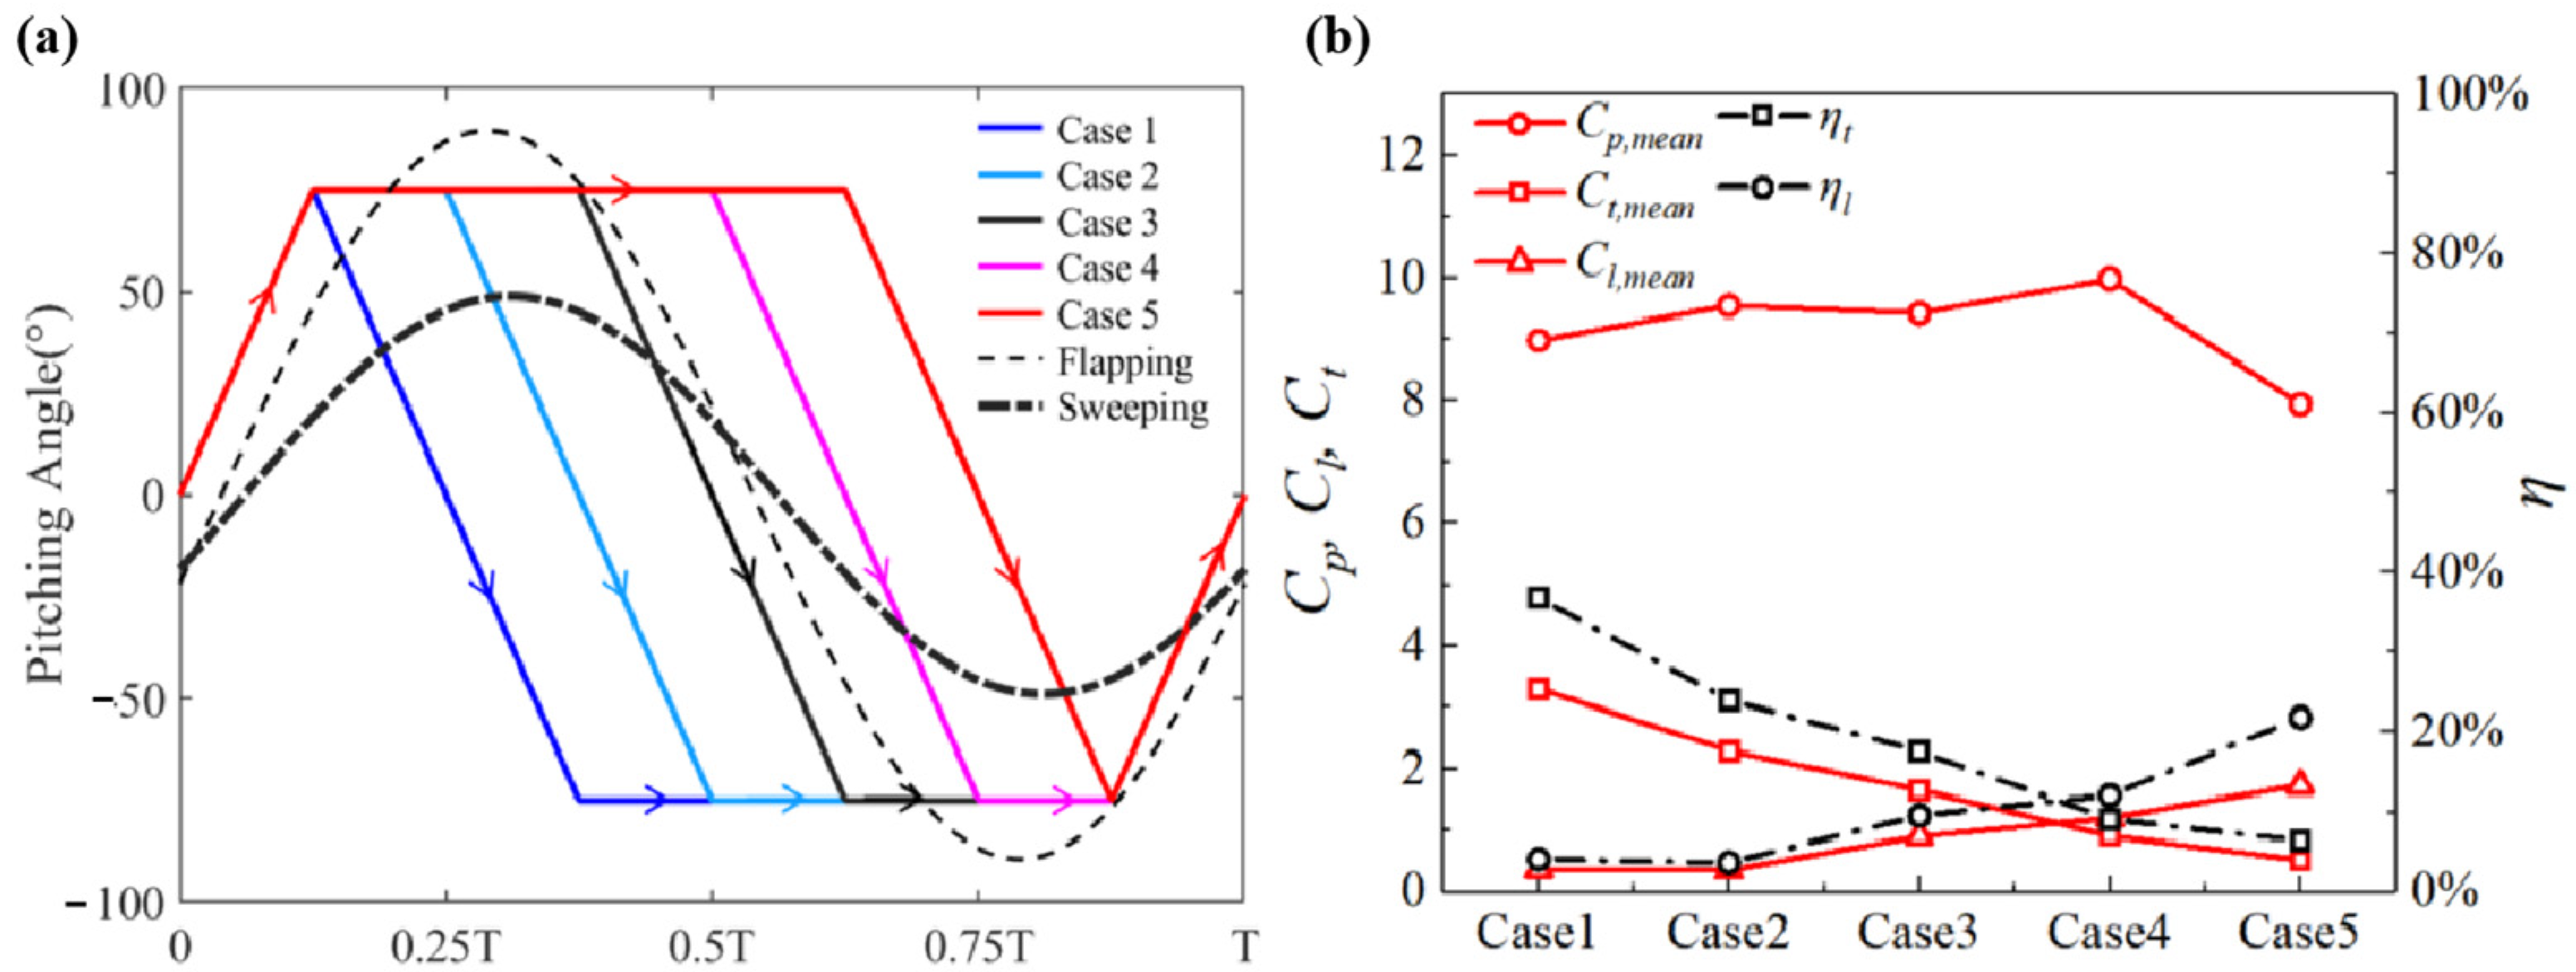
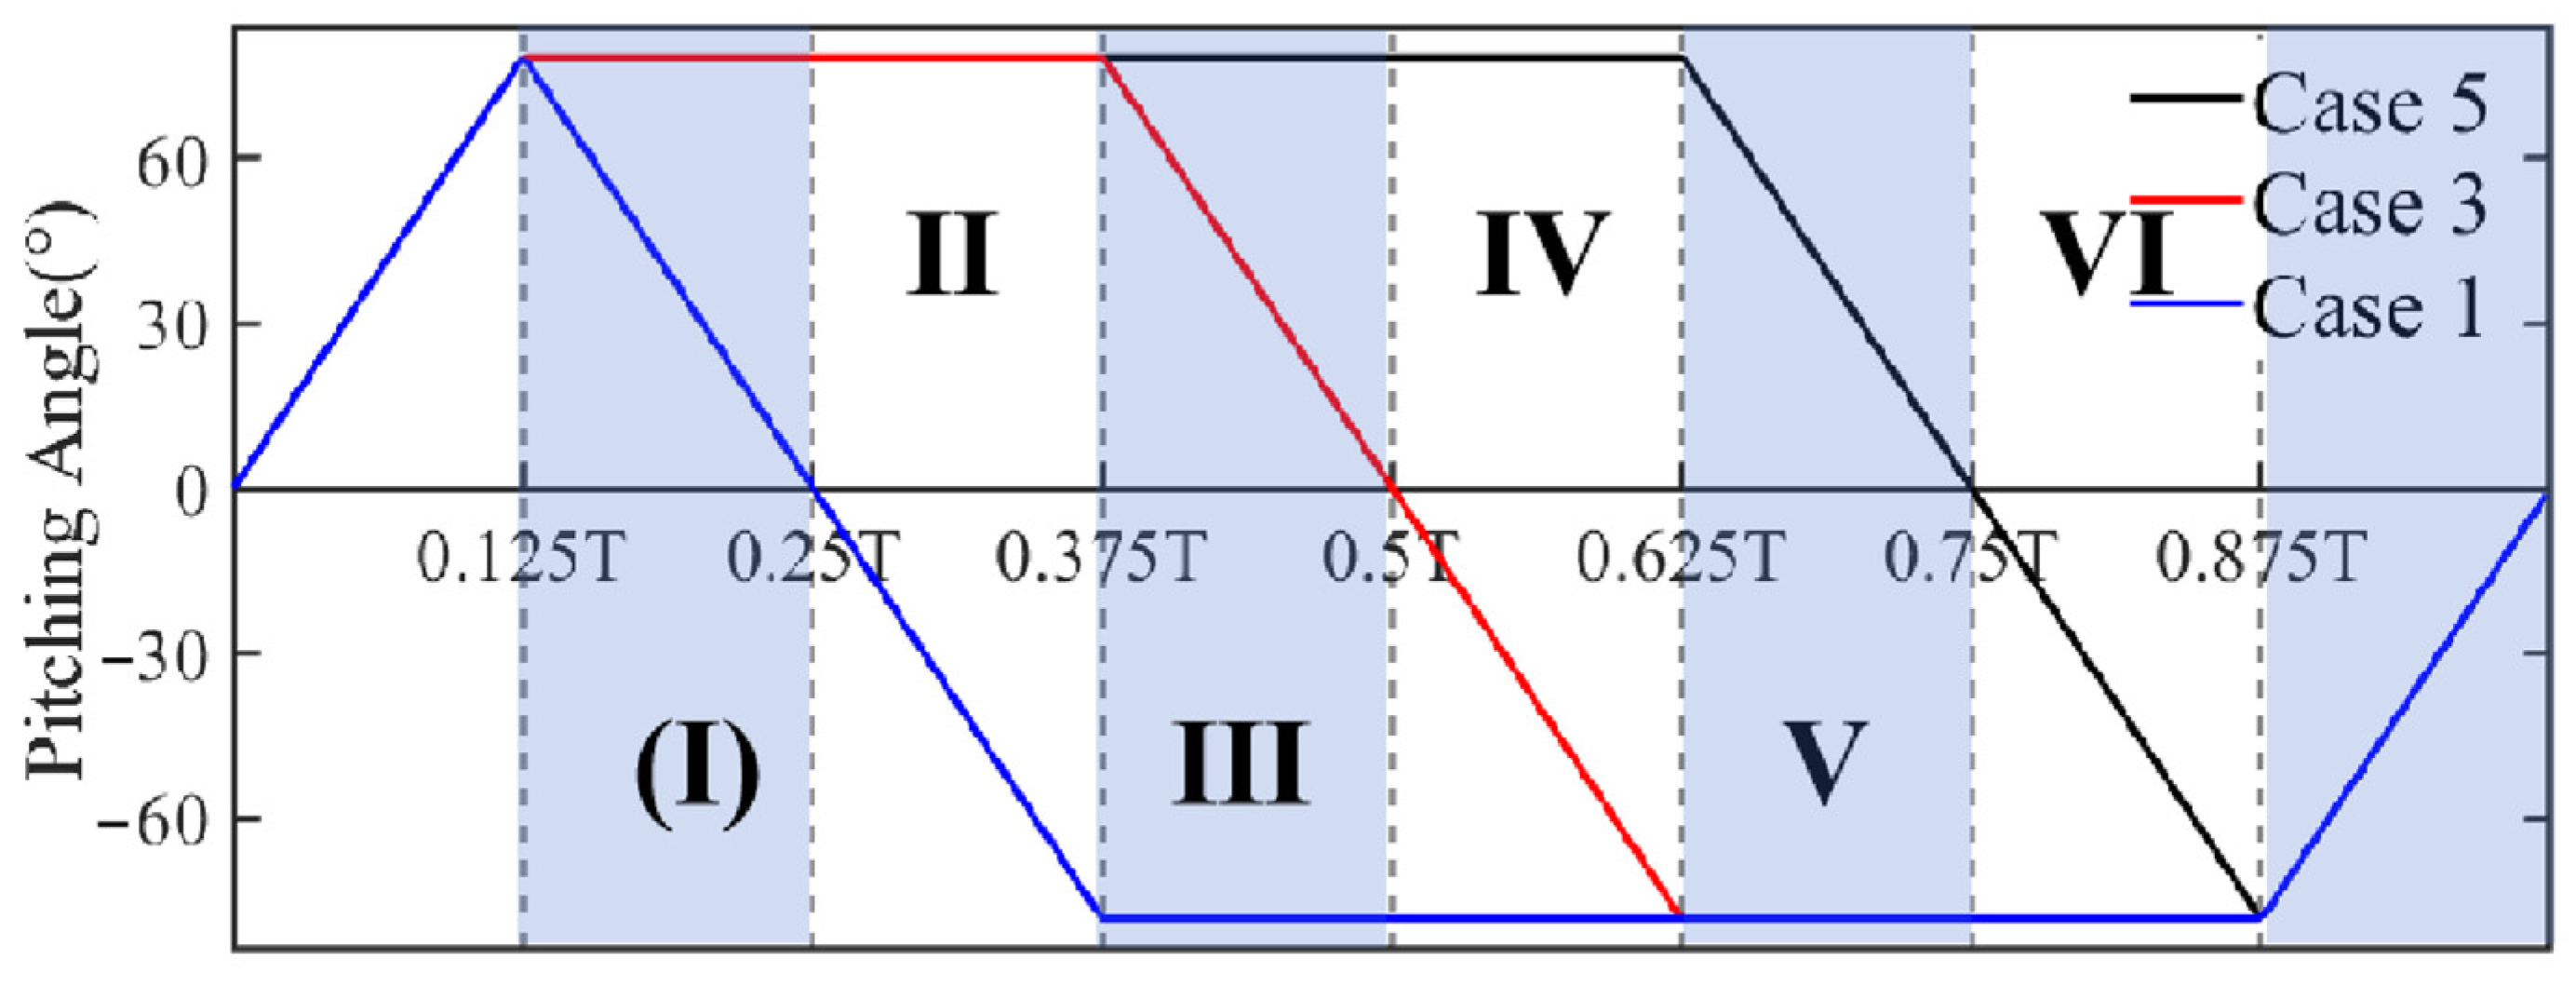
In this section, we maintain a constant slope in the pitching angle variation, altering the position and duration of the holding interval to investigate the influence of symmetric or asymmetric pitching motion conditions on the hydrodynamic characteristics. Specifically, we divide one flapping cycle into eight sub-cycles. For symmetric conditions, we halt the pitching motion of the flapping fin in the 1/8 T–3/8 T phase of the first half of the cycle and the corresponding 5/8 T–7/8 T phase of the second half of the cycle, while ensuring linear increases or decreases in pitching angle during the other phases. For asymmetric cases, we, respectively, decrease or increase the holding period in the first half of the cycle, accompanied by a corresponding increase or decrease in the “holding period” in the second half of the cycle, with each case differing by one-eighth of a cycle. The evolution of the pitching angle over time for the five cases is illustrated in Figure 7a. Particularly, through a comparison with van der Geest’s pitching kinematics in Figure 4, it becomes apparent that case 4 closely mimics the natural motion of turtles in the real world.
Figure 7b illustrates the variations in the mean thrust coefficient (Ct,mean), mean lift coefficient (Cl,mean), and mean power coefficient consumed by the fin’s motion (Cp,mean), as well as the propulsive and lifting efficiency under five different operating conditions. A noticeable decrease in the average thrust coefficient, represented by the red squares, is observed with the gradual increase in the duration of the upstroke holding phase. Conversely, the average lift coefficient exhibits an opposite increasing trend with the increase in the duration of the upstroke holding phase. Moreover, the average power coefficient, used to characterize energy utilization by the flapping fin under different motion strategies, shows no significant correlation with asymmetry. Case 4, which closely resembles real turtle motion, coincidently displays the highest average power coefficient.
To be more specific, thrust efficiency tends to reach its maximum (approximately 37%) during the forward pitching phase without any pause, and sharply decreases to 6% as the duration of forward pitching pause increases. In contrast, lift efficiency increases with the prolonged duration of the forward pitching phase, ranging from 4% to 22%. This suggests that sea turtles can achieve high lift efficiency or thrust efficiency by controlling the asymmetric characteristics of pitching angles based on different propulsion requirements. For instance, the turtle in the literature, due to being in a fixed state, is more inclined to improve lift efficiency, hence exhibiting a forward pitching pause longer than the pitching pause during the backward stroke.
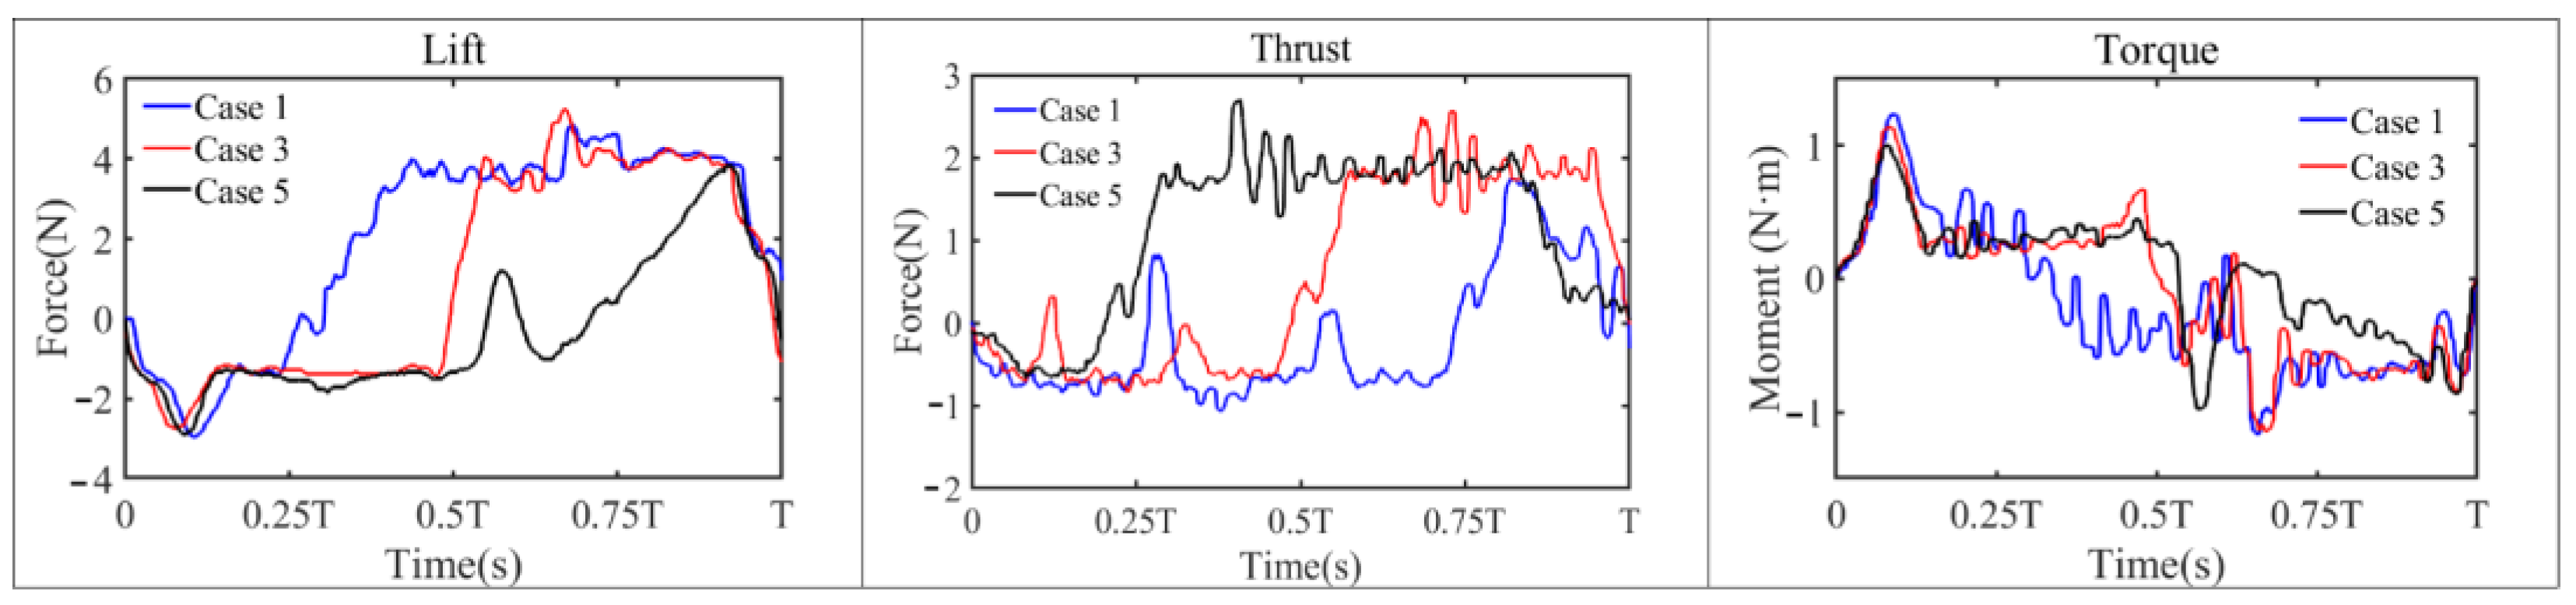
The evolution of the lift, thrust, and torque of the fin during one period (T) is depicted in Figure 8 (for the three cases illustrated in Figure 9). It is observed that, for both the lift and thrust profiles, all three cases exhibit a common trend of initial descent, subsequent ascent, minor oscillations during the plateau, and final descent. As the duration of pitching stagnation during the downstroke diminishes gradually from case 1 to case 5, it is notable that the duration of positive lift decreases accordingly, while the duration of positive thrust correspondingly increases. Moreover, concerning the thrust profiles, it is evident that with the elongation of pitching stagnation during the downstroke, the fluctuation amplitude of negative thrust significantly diminishes. Particularly in case 5, the negative thrust stage displays minimal oscillation. The variation in torque is deeply related to the pitching motion, where the most significant difference in torque among the cases occurs coincidently with the difference in the pitch pausing duration.
To uncover the mechanism behind the variation in Ct and Cl, it is imperative to examine the flow field near the flapping fin for different pitching angle cases. The vorticity contours in Figure 10, respectively, present the PIV experimental results for the case most conducive to lift efficiency (case 1, forward pitching with no pause), the symmetric case (case 3), and the case most beneficial to thrust efficiency (case 5, reverse pitching with no pause). The results clearly depict the movement of attached and detached vortices near the fin throughout one cycle.
For the motion pattern whose pitching angle performs a symmetric motion, the flow field is depicted in the left column of Figure 10, where the coupled motion of flapping, sweeping, and pitching results in the evolution of a pair of vortices, from attachment to detachment, culminating in elongation and fragmentation. In the initial phase, a pair of counter-rotating detached vortices forms at both edges of the fin. Unlike the orderly detachment of vortices in the flapping direction observed in a purely flapping motion, during the 0–1/8 T phase, these vortices quickly dissipate and disappear under the influence of the pitching motion of the fin.
Subsequently, during the 1/8–3/8 T pitching pause, there is no evident vortex generation. It is not until the commencement of the next reverse pitching (t = 3/8 T) that a pair of attached vortices reappear on both sides of the fin, gradually detaching as the pitching action unfolds. In the next pitching pause period (t = 5/8 T–7/8 T), a series of tiny-scale vortex structures can be witnessed detaching from the wing’s trailing edge accompanied by the flapping and sweeping processes. Some counterclockwise vortices collide and fragment with the clockwise vortices generated during the previous upstroke.
To conduct a more comprehensive analysis of how the two cases of asymmetric motions impact the shedding vortex evolution on the fin, this study specifically investigates the distinctions in shed vortices during the intermediate six one-eighth time steps across three distinct cases. Case 1 (corresponding to the blue line in Figure 9) initiates pitching movement during stage III, entering a pause period coinciding with the downward and backward flapping process. At this juncture, a pair of counter-rotating vortices forms along the thrust direction, contributing notably to thrust enhancement for this case. Conversely, case 5 (corresponding to the black line in Figure 9) initiates reverse pitching rotation during stage IV, instigating the development of shed vortices at the leading and trailing edges in the lift direction (as denoted by the arrow in Figure 10f, right column), thus elevating the lift efficiency for this condition.
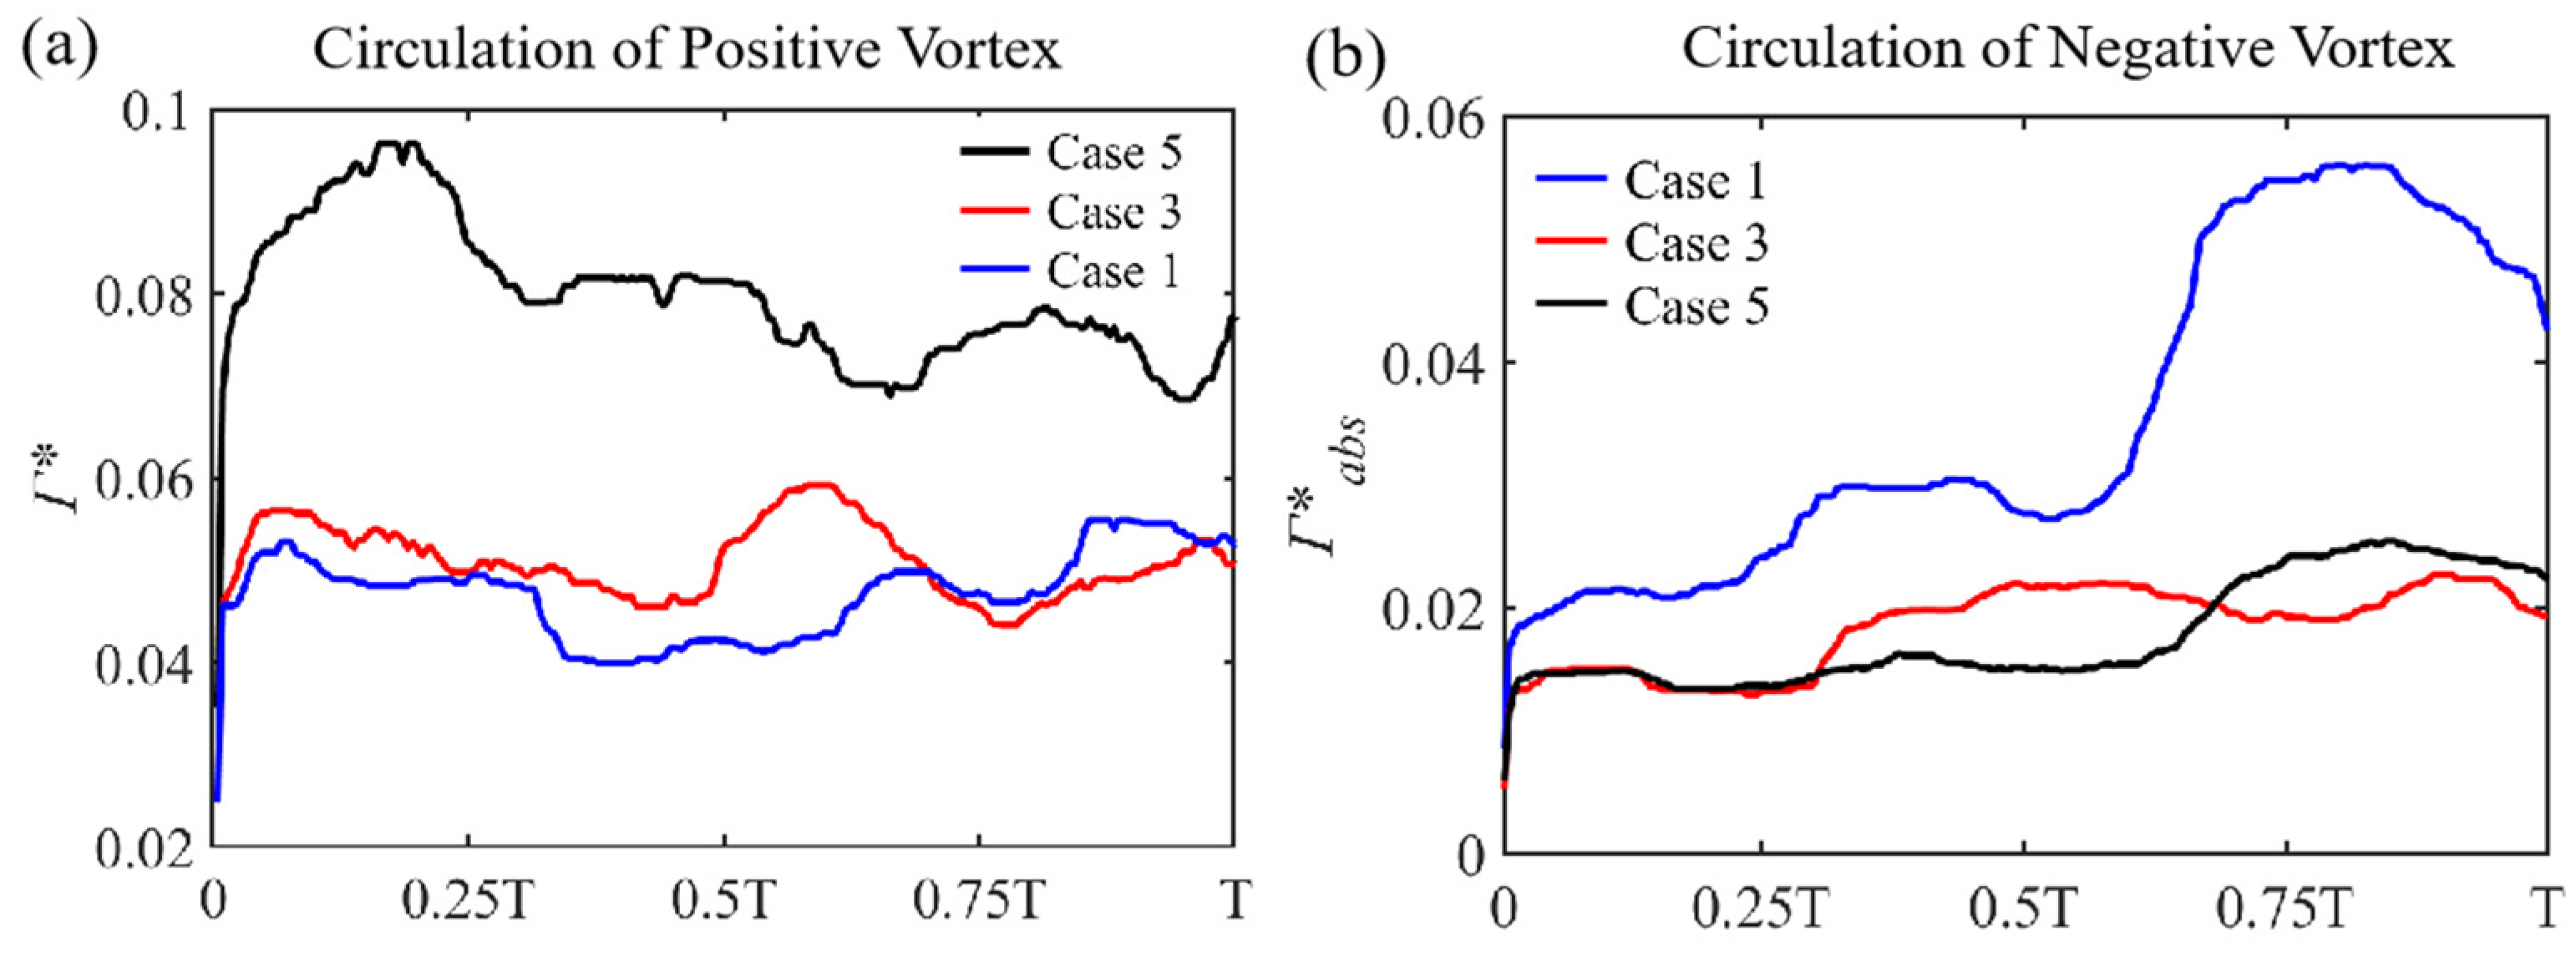
For a more rigorous quantitative investigation, Figure 11 presents a statistical analysis of the positive and negative shed vortex circulation for the three conditions over one motion cycle. Circulation is defined as the curvilinear integral of the velocity vector field along a closed curve and can also be converted to the surface integral of the vorticity field over a surface [24], as adopted in this study.
Γ = C V d s = Σ ω d S
Γ * = Γ U c
In accordance with Equations (11) and (12), this study performs integrated non-dimensional circulation on the vorticity field data obtained through the post-processing of particle image velocimetry (PIV). To streamline the workload, rectangular regions are selected for analysis, and the boundary conditions for these regions are set such that the vorticity scalar value is 0.5% of the maximum vorticity at the vortex center.
On the grounds of the variation in circulation for three cases, it is evident that, for the clockwise vortex circulation integral results (Figure 11a), the overall circulation value for the maximum lift efficiency condition is significantly higher than the other two scenarios. This, to some extent, corroborates that such an asymmetric pitching pattern is conducive to enhancing the lift of a single cycle for the flapping fins. Similarly, the circulation’s absolute value from the counterclockwise vortex integration (Figure 11b) indicates that the condition with the highest thrust efficiency, i.e., case 1, also has a higher circulation value compared to the other two cases. Furthermore, the circulation variation trends reveals that within one motion cycle, for both case 1 and case 5, time intervals with relatively large circulation values correspond to the moments when the pitching angle comes to a standstill. This indicates that the sea turtles intermittently halt the pitching motion around the fin base during the three-degrees-of-freedom motion to retain attached vortices along its leading and trailing edges, thereby increasing the lift or thrust required for the specific swimming process.

3.4. Effects of Pitching Rate

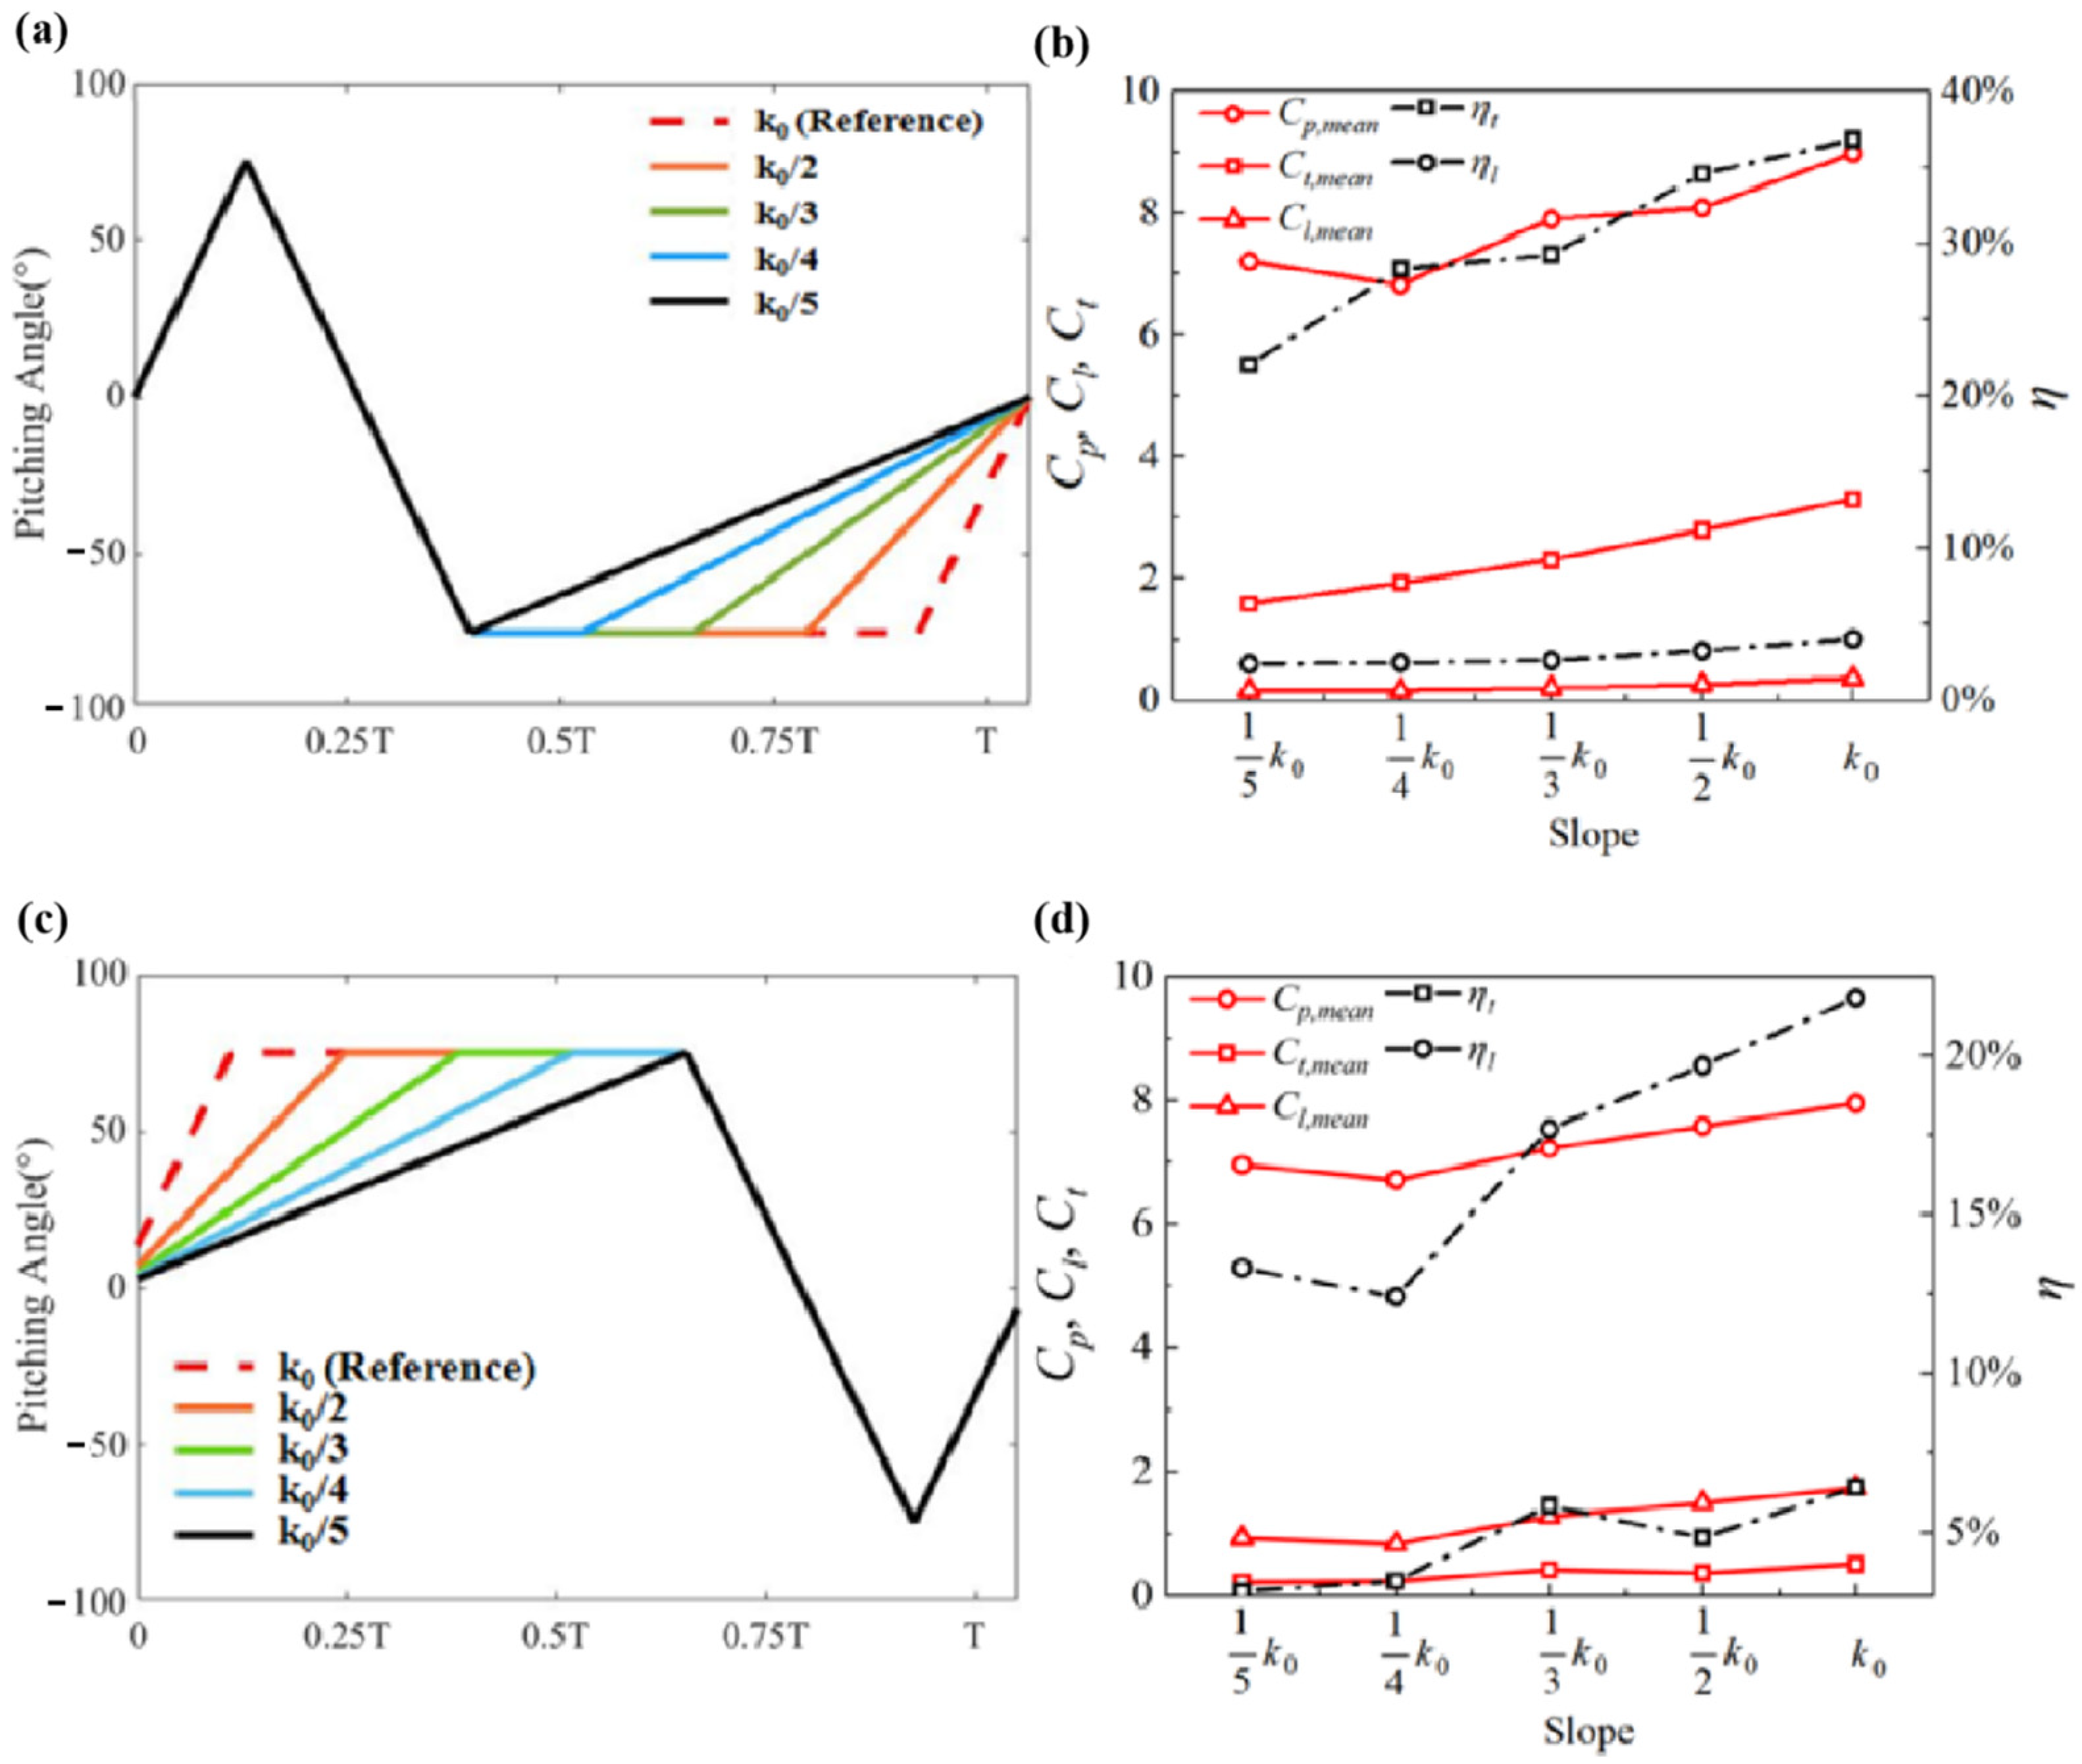
Based on the above analysis, it is evident that the asymmetric pitching angle variations can indeed enhance the lift or thrust efficiency of turtle swimming. It is noted that the slope of the pitching angle with respect to time, or the pitching rate, is also a crucial factor influencing the power input. Under the condition of maintaining a constant pitching amplitude, the variation in the slope also affects the duration of the pitching pause. To investigate the impact of such pitching rate variations on the hydrodynamic performance of the fin’s motion, two cases which exhibited the best lift and thrust efficiency, respectively, from Section 3.3 were selected. Accordingly, the slope of the pitching angle was varied to explore the changes in force coefficients and efficiency. The specific pitching angle variation curves are shown in Figure 12a,c. To measure the slope magnitude more straightforwardly, the case with the maximum slope was defined as the reference pitching rate, k0 (k0 = 2.167 rad/s), in accordance with Equation (13), where the pitching amplitude (θm) is 75° and the slopes of the other four cases are denoted as 1/2 k0, 1/3 k0, 1/4 k0, and 1/5 k0.
k 0 = 8 θ m T
Figure 12b,d present the variation in the mean thrust coefficient (Ct,mean), mean lift coefficient (Cl,mean), and mean power coefficient (Cp,mean) in relation to cases 1 and 5 from the previous section, respectively. In relation to the case with the maximum propulsion efficiency (case 1), it can be observed that with the increase in pitching rate, the average thrust coefficient of the fin significantly increases. Comparatively, the lift coefficient also shows an increasing trend, but the magnitude of the change is relatively small. As for the mean power coefficient, it exhibits a rising trend with the extension of the pitching pause, reaching its lowest point at a slope of 1/4 k0.
Additionally, it is evident that increasing the slope and extending the pitching pause contributes to enhancing the propulsion efficiency from 22% to 37%, while the impact on lift efficiency in this case is almost negligible. In contrast, for the condition with the maximum lift efficiency (case 5), it can be observed that with the increase in slope, the average lift coefficient of the fin significantly increases. Comparatively, the thrust coefficient also shows an increasing trend, but the magnitude of the change is relatively small. The lowest point of the mean power coefficient occurs at a slope of 1/4 k0.

4. Conclusions

In this study, an experiment was conducted on a rectangular fin moving according to the three-degrees-of-freedom swimming model of sea turtles, utilizing a self-developed three-rotational-degrees-of-freedom flapping fin experimental apparatus as well as force sensor and PIV techniques. The effects of the pitching angle amplitude, asymmetry in the pitching angle pausing time, and pitching rate on the lift and thrust generated during the sea turtle’s swimming process were thoroughly explored.
An increase in the pitching angle amplitude contributes to the enhancement of both lift and thrust efficiency to a certain extent, with a more pronounced impact on thrust performance. Further more, the asymmetrical nature of the pitching pause significantly influences the lift and thrust characteristics. Specifically, extending the pitching pause time during the forward–upward flapping process increases lift efficiency, while prolonging the pitching pause time during the backward–downward flapping process primarily improves thrust efficiency. This observation is further substantiated by the comprehensive explanation in terms of the evolution of the vortices, where it is clearly revealed that the pitching pause is beneficial to harness the separated vortices in the wake.
Regarding the variation in pitching rate, in the asymmetric case where lift efficiency is maximized, it is observed that lift is more sensitive to increasing the pitching rate than thrust, where lift efficiency significantly improves with increasing the pitching rate. As for the asymmetric case where thrust efficiency is maximized, the thrust force and efficiency generally increase with the pitching rate, and the impact of the pitching rate on the thrust efficiency is much more significant than its influence on lift efficiency.
This study investigates the effects of asymmetric pitching motion on the hydrodynamic propulsion of a flapping fin. The large forces and high-efficiency cases are characterized, with the underlying physical mechanism uncovered, which can provide important reference for the development of underwater propulsion systems. In future, the investigation will proceed to examine the asymmetries in pitching angle amplitudes between upstrokes and downstrokes, in addition to the asymmetric characteristics of flapping and sweeping motions. Moreover, experiments will be carried out to explore how the flexibility and geometrical shape of fins affect their fluid dynamics, with a specific emphasis on the influences of flexibility. By studying these aspects, we can advance the understanding of hydrodynamic propulsion and provide insights for the development of more efficient underwater propulsion systems.

Author Contributions

Conceptualization, S.W. and G.H.; methodology, S.W.; software, S.W.; validation, S.N., G.H. and X.L.; formal analysis, S.W.; investigation, S.W.; resources, G.H.; data curation, G.H.; writing—original draft preparation, S.W.; writing—review and editing, G.H.; visualization, S.W.; supervision, S.N.; project administration, G.H.; funding acquisition, G.H. All authors have read and agreed to the published version of the manuscript.

Funding

This research was funded by the National Natural Science Foundation, grant number No. 12372226.

Data Availability Statement

The data that support the findings of this study are available from the corresponding author upon reasonable request.

Conflicts of Interest

The authors have no conflicts to disclose.

Nomenclature

afInitial Flapping Amplitude Angle
asInitial Sweeping Amplitude Angle
aif, bifFlapping Amplitude Angle (Taylor’s series)
ais, bisSweeping Amplitude Angle (Taylor’s series)
ap1~ap6Pitching Amplitude Angle (in different stages)
θflapInstantaneous Flapping Angle
θsweepInstantaneous Sweeping Angle
θpitchInstantaneous Pitching Angle
fFrequency (0.23 Hz)
TPeriod
Ct,meanAverage Thrust Coefficient
Cl,meanAverage Lift Coefficient
Cp,meanAverage Power Coefficient
FthrustInstantaneous Thrust
FliftInstantaneous Lift
RSweeping and Rotating Radius
U0Reference Velocity
ρDensity
SFin’s Aera
cChord Length
PinputInput Power
ηt, ηlThrust Efficiency, Lift Efficiency
ΓCirculation
Γ*Dimensionless Circulation
k0Reference Pitching Rate

References

  1. Brunton, S.L.; Noack, B.R.; Koumoutsakos, P. Machine Learning for Fluid Mechanics. Annu. Rev. Fluid Mech. 2019, 52, 477–508. [Google Scholar] [CrossRef]
  2. Lauder, G.V.; Drucker, E.G. Forces, Fishes, and Fluids: Hydrodynamic Mechanisms of Aquatic Locomotion. News Physiol. Sci. Int. J. Physiol. Prod. Jointly Int. Union Physiol. Sci. Am. Physiol. Soc. 2002, 17, 235–240. [Google Scholar] [CrossRef] [PubMed]
  3. Gray, J. Studies in Animal Locomotion: VI. The Propulsive Powers of the Dolphin. J. Exp. Biol. 1936, 13, 192–199. [Google Scholar] [CrossRef]
  4. Gray, J. Studies in Animal Locomotion: II. The Relationship between Waves of Muscular Contraction and the Propulsive Mechanism of the Eel. J. Exp. Biol. 1933, 10, 386–390. [Google Scholar] [CrossRef]
  5. Izraelevitz, J.S.; Triantafyllou, M.S. Adding In-Line Motion and Model-Based Optimization Offers Exceptional Force Control Authority in Flapping Foils. J. Fluid Mech. 2014, 742, 5–34. [Google Scholar] [CrossRef]
  6. Zhao, W.; Hu, Y.; Wang, L. Construction and Central Pattern Generator-Based Control of a Flipper-Actuated Turtle-Like Underwater Robot. Adv. Robot. 2009, 23, 19–43. [Google Scholar] [CrossRef]
  7. Chiu, F.-C.; Chen, C.-K.; Guo, J. A Practical Method for Simulating Pectoral Fin Locomotion of a Biomimetic Autonomous Underwater Vehicle. In Proceedings of the 2004 International Symposium on Underwater Technology (IEEE Cat. No.04EX869), Taipei, Taiwan, 20–23 April 2004; IEEE: Taipei, Taiwan, 2004; pp. 323–329. [Google Scholar]
  8. Low, K.H.; Zhou, C.; Ong, T.W.; Yu, J. Modular Design and Initial Gait Study of an Amphibian Robotic Turtle. In Proceedings of the 2007 IEEE International Conference on Robotics and Biomimetics (ROBIO), Sanya, China, 15–18 December 2007; IEEE: Sanya, China, 2007; pp. 535–540. [Google Scholar]
  9. Licht, S.C.; Wibawa, M.S.; Hover, F.S.; Triantafyllou, M.S. In-Line Motion Causes High Thrust and Efficiency in Flapping Foils That Use Power Downstroke. J. Exp. Biol. 2010, 213, 63–71. [Google Scholar] [CrossRef]
  10. Booth, D.T. Kinematics of Swimming and Thrust Production during Powerstroking Bouts of the Swim Frenzy in Green Turtle Hatchlings. Biol. Open 2014, 3, 887–894. [Google Scholar] [CrossRef]
  11. Anderson, J.M.; Streitlien, K.; Barrett, D.S.; Triantafyllou, M.S. Oscillating Foils of High Propulsive Efficiency. J. Fluid Mech. 1998, 360, 41–72. [Google Scholar] [CrossRef]
  12. Hover, F.S.; Haugsdal, Ø.; Triantafyllou, M.S. Effect of Angle of Attack Profiles in Flapping Foil Propulsion. J. Fluids Struct. 2004, 19, 37–47. [Google Scholar] [CrossRef]
  13. Schouveiler, L.; Hover, F.S.; Triantafyllou, M.S. Performance of Flapping Foil Propulsion. J. Fluids Struct. 2005, 20, 949–959. [Google Scholar] [CrossRef]
  14. Techet, A.H. Propulsive Performance of Biologically Inspired Flapping Foils at High Reynolds Numbers. J. Exp. Biol. 2008, 211, 274–279. [Google Scholar] [CrossRef] [PubMed]
  15. Polidoro, V. Flapping Foil Propulsion for Cruising and Hovering Autonomous Underwater Vehicles. Master’s Thesis, Massachusetts Institute of Technology, Cambridge, MA, USA, May 2003. [Google Scholar]
  16. Van Der Geest, N.; Garcia, L.; Borret, F.; Nates, R.; Gonzalez, A. Soft-Robotic Green Sea Turtle (Chelonia Mydas) Developed to Replace Animal Experimentation Provides New Insight into Their Propulsive Strategies. Sci. Rep. 2023, 13, 11983. [Google Scholar] [CrossRef] [PubMed]
  17. Kumar, R.; Shin, H. Thrust Prediction of an Active Flapping Foil in Waves Using CFD. J. Mar. Sci. Eng. 2019, 7, 396. [Google Scholar] [CrossRef]
  18. Lu, J.; Lu, Y.; Zhang, R.; Wang, J.; Tang, Z. Numerical Study on Hydrodynamic Performance of an Underwater Propulsive Wing Propulsor. Ocean Eng. 2023, 285, 115293. [Google Scholar] [CrossRef]
  19. Han, W.; Sun, X. Numerical simulation on energy acquisition of flapping airfoil with different forms of movement. J. Shanghai Univ. (Nat. Sci. Ed.) 2015, 21, 432–443. [Google Scholar]
  20. Shenghao, Z.; Lei, M.E.I.; Junwei, Z. Numerical Prediction of Hydrodynamic Performance of Differently Shaped Flapping Foil Propulsors. Chin. J. Ship Res. 2021, 16, 50–59+66. [Google Scholar]
  21. Mo, W.; He, G.; Wang, J.; Zhang, Z.; Gao, Y.; Zhang, W.; Sun, L.; Ghassemi, H. Hydrodynamic Analysis of Three Oscillating Hydrofoils with Wing-in-Ground Effect on Power Extraction Performance. Ocean Eng. 2022, 246, 110642. [Google Scholar] [CrossRef]
  22. Van Der Geest, N.; Garcia, L.; Nates, R.; Godoy, D.A. New Insight into the Swimming Kinematics of Wild Green Sea Turtles (Chelonia Mydas). Sci. Rep. 2022, 12, 18151. [Google Scholar] [CrossRef]
  23. Yang, S.; Liu, C.; Wu, J. Effect of Motion Trajectory on the Aerodynamic Performance of a Flapping Airfoil. J. Fluids Struct. 2017, 75, 213–232. [Google Scholar] [CrossRef]
  24. Bao, F.; Yang, J.W.; Yang, Q.; Fu, X.X. Experimental Investigation on Shedding Vortex and Lift Mechanism of Flapping Wing Model with Single Degree of Freedom. J. Aerosp. Power 2014, 971, 1091–1098. [Google Scholar]
Figure 1. Five stages of the green sea turtle’s swimming pattern as illustrated with colored dots revealing the fin tip trajectory.
Symmetry 16 00302 g001
Figure 2. Experimental set-up. (Up): Schematic of the whole system; (down): a real photo of the close-up view of the fin (this photo is for visualization purpose only; when conducting measurements, a transparent fin is used instead).
Symmetry 16 00302 g002
Figure 3. Three-degrees-of-freedom motion conducted through the experimental device. (a) Flapping motion; (b) sweeping motion; (c) pitching motion.
Symmetry 16 00302 g003
Figure 4. Equations of motion in flapping, sweeping, and pitching plotted against time for 2 complete cycles at a flapping frequency of 0.23 Hz.
Symmetry 16 00302 g004
Figure 5. Comparison of experimental results for the constrained operation. (a) Lift generation against time; (b) thrust generation against time. The green, purple, orange, blue, and magenta arrows show the time interval for the RS1, US, RS2, DS, and SS stages, respectively.
Symmetry 16 00302 g005
Figure 6. (a) Variation of 5 different pitching amplitudes plotted against time as triangular wave in one complete cycle. (b) Variation in mean thrust, lift, and power coefficients (solid line) and efficiency (dash-dotted line) of a flapping fin with the increase in pitching amplitude.
Symmetry 16 00302 g006
Figure 7. (a) Symmetry (case 3) and asymmetry (case 1, 2, 4, 5) cases of pitching angle against time in one complete cycle accompanied with flapping and sweeping angles. (b) Variation in mean thrust, lift, and power coefficients (solid line) and efficiency (dash-dotted line) of a flapping fin in accordance with cases in (a).
Symmetry 16 00302 g007
Figure 8. Evolution of instantaneous lift (left), thrust (middle), and torque (right) of the fin during one period (T).
Symmetry 16 00302 g008
Figure 9. Three selected cases of pitching angle against time in one complete cycle with 6 highlighted stages (I–VI).
Symmetry 16 00302 g009
Figure 10. (ai) Vorticity contours during a flapping period for flow over a flapping fin based on case 1, case 3, and case 5.
Symmetry 16 00302 g010
Figure 11. Variation in (a) positive and (b) negative vortex circulation during one complete cycle.
Symmetry 16 00302 g011
Figure 12. (a) Variation of 5 different pitching rates plotted against time in one complete cycle based on case 1. (b) Variation in mean thrust, lift, and power coefficients (solid lines) and efficiency (dash-dotted lines) of a fin with the increase in k0 based on case 1. (c) Variation of 5 different pitching angle slopes plotted against time in one complete cycle based on case 5. (d) Variation in mean thrust, lift, and power coefficients (solid lines) and efficiency (dash-dotted lines) of a fin with the increase in k0 based on case 5.
Symmetry 16 00302 g012
Disclaimer/Publisher’s Note: The statements, opinions and data contained in all publications are solely those of the individual author(s) and contributor(s) and not of MDPI and/or the editor(s). MDPI and/or the editor(s) disclaim responsibility for any injury to people or property resulting from any ideas, methods, instructions or products referred to in the content.

