1. Introduction
SCM is a process that helps determine the flow of goods and services among locations and businesses. SCM also manages the storage space and the sizes of the services available in an application [
1]. SCM mainly handles the entire service or production flow of goods and services provided to users. The Internet of Things (IoT) is an emerging techniques that is widely used in real-time applications to improve the overall communication and service process for users without any failure rate [
2].
As the IoT and Artificial Intelligence advance rapidly, new retail has emerged as a viable alternative to the conventional shopping experience. Powered by Artificial Intelligence, big data, and other technologies, businesses can use Artificial Intelligence to learn about their customers’ interests and hobbies and then apply that information to supply-chain demand forecasting, ad targeting, and product recommendations. However, data security and user privacy protection are incompatible with any organization’s simple data integration. The practice of keeping private information safe often goes head-to-head with running an effective advertising campaign.
IoT-based SCM services are primarily used nowadays to provide uninterrupted services and features to users. IoT-based technologies are used in SCM to process various processes and services for users [
3]. Radio Frequency Identification (RFID) is one of the IoT technologies used in SCM to improve the efficiency and reliability of applications by providing a better service flow for users. RFID is used in SCM to obtain accurate information and details about the flow of goods and services based on specific features. RFID senses goods and services via fixed sensors on the products, helping to provide a better communication process for both the organization and consumers [
4,
5].
SCM plays a vital role in every company, application, and industry in obtaining accurate information about goods and services, which helps to provide better services and communication processes for users [
6]. SCM manages a more significant amount of data, which helps to prevent unwanted problems and failures while providing services to users. Big data analytics is an essential technique for managing big data in various fields [
7]. Big data analytics is mainly used to collect, maintain, and analyze a large amount of data, which helps to enhance the efficiency and effectiveness of the data management process. The extensive process of data analytics maintains vast data in a real-time application, helping to ensure the size and availability of storage space for further operations [
8]. Big data analytics provides an exceptional, disciplined approach to managing data that helps to reduce problems and errors. Technologies for big data analytics are used in SCM to provide better accuracy rates in the service flow detection process [
9]. Both methodology and strategies are improved in SCM with the help of the big data analytics process, which provides an accurate data set for the management process. The big data technique enhances the storage space, availability, processing, and management process of SCM, which helps improve the efficiency level of an application and organization [
10].
Machine learning (ML) techniques are widely used in various applications and systems, helping to improve an application’s overall performance and efficiency. ML techniques provide better services and experiences to users in various fields [
11]. ML techniques are also used in the supply chain management (SCM) process, which is used here to avoid unwanted problems and failures while providing goods for users. Reinforcement learning algorithms are mostly used in SCM and help to improve the reliability and performance of the SCM process [
12,
13]. Reinforcement learning algorithms are based on specific patterns, parameters, and values, helping to reduce the failure rate in the detection process. Reinforcement learning algorithms in particular are used for SCM, which helps to improve the accuracy rate in detecting the rate of flow of goods in an application [
14]. The clustering method is also used in SCM to group a particular data set for the analysis process and to produce a proper set of data for the SCM process. The clustering process uses the segmentation method, which helps classify data based on specific patterns and features. ML also provides a proper decision-making process for SCM which helps to reduce cost and time while the analysis process is performed [
11,
15].
With respect to Big Data, Artificial Intelligence plays a significant role in processing intelligent data that are classified based on specific features. Improving the rate of accuracy in detecting the rate of flow of goods is less of a focus. IDP is implemented to handle the harmonized data on both ends to reduce conclusive inaccuracies. The main contributions of IDP are listed below.
The IDP processing approach recognizes changes in the data stream to produce an accurate forecast for demand suppression.
The learning model is educated to foretell further supply chain activities based on peaks and valleys in demand. Internet of Things calculations and collected data simulate the whole procedure.
The IDP evaluation is based on prediction accuracy, analysis time, data error, and alterations.
The rest of the paper is described as follows: in
Section 2, a brief study regarding the related works is outlined,
Section 3 describes the complete process of the proposed method,
Section 4 provides a discussion of the evaluated parameters, and
Section 5 presents the conclusion.
2. Related Works
Yang et al. [
16] introduced a significant data-driven edge–cloud collaboration architecture for cloud manufacturing systems. Both edge and cloud computing systems are used in the proposed method to provide a better data management process for the analysis process. The proposed method increases the optimization and accuracy rate in the analysis process. Experimental results show that the proposed method increases the efficiency and effectiveness of the system by providing better services to the users.
Jiang et al. [
17] proposed a smart-contract-based data transaction method for the Industrial Internet of Things (IIoT). The proposed method is used for data packet transactions, and the data analytics service is a transaction process in IIoT. The smart-contract-based data transaction method improves the efficiency and security of the system. Compared with other methods, the proposed method increases the overall performance and feasibility of the system by providing an accurate analysis process.
Kazancoglu et al. [
18] proposed a fuzzy-based hybrid decision framework for dairy supply chains using big data solutions. The proposed method determines the classification among the data based on certain ranking and matching features. The fuzzy technique is used here to improve the accuracy rate in the classification process. The supply chain management system plays a vital role in the proposed method in obtaining appropriate information about every service. Experimental results show that the proposed method increases the overall performance and efficiency of the system.
Wang et al. [
19] introduced a hybrid big data analytical approach using an integrated supply chain for the customer pattern analysis process. The k-means clustering approach is used here to fetch and divide data based on certain features and patterns. The proposed method provides better strategies for users to obtain appropriate services from the organization. Experimental results show that the proposed method increases the efficiency and reliability of the system by providing better services to its users.
Zhan et al. [
20] proposed an analytic infrastructure for supply chain management (SCM) systems using big data. The big data analytics process is used here to obtain related data, which helps enhance SCM’s performance. Supply chain strategies are used in the proposed method to obtain roadmaps and firms’ information for the analysis process. The big data analysis process provides various ideas and approaches for the system, which helps to improve the system’s overall performance rate and effectiveness.
Nawaz et al. [
21] introduced a predictive complex event processing (CEP) and reasoning method for Internet of Things (IoT)-based supply chain management (SCM). The proposed method uses the CEP approach to provide an accurate data set for a different management system, which helps to increase the system’s efficiency. Probabilistic and logical reasoning methods are implemented in the proposed approach to obtain feasible solutions. Experimental results show that the proposed method improves the overall performance and reliability of SCM.
Sathyan et al. [
22] proposed an analysis method combining fuzzy and big data analytics approaches for the automotive supply chain. A fuzzy decision-making trial and evaluation laboratory (DEMATEL) approach is used in the proposed method to obtain reliable information for the analysis process. The proposed method increases the accuracy rate in the detection process, which helps improve users’ safety. Compared with other methods, the proposed analysis process enhances the efficiency and effectiveness of the supply chain system by providing accurate services to the users.
Wang et al. [
23] introduced a new Internet of Things (IoT)-based supply-chain financial-risk-management model for supply chain management (SCM). The proposed method is mainly used for financial risk management processes which help to enhance the security and privacy of users from attackers. The proposed is also used to reduce data loss and storage space, helping to enhance the system’s overall efficiency. Experimental results show that the proposed method increases the system’s overall performance by providing a better analysis process.
Tamym et al. [
24] proposed a big-data-based architecture method for supply chain networks. The big data analysis process increases the accuracy rate in the detection and analysis process, which provides uninterrupted services to its users. The proposed method provides better supply chain networks for the organization and application. Experimental results show that the proposed method increases the system’s security, feasibility, and efficiency, which helps enhance the network’s overall performance.
Kousiouris et al. [
25] introduced a microservice-based framework for Internet of Things (IoT)-based supply chain management (SCM). The proposed method is primarily used in online and real-time applications that provide users with better services and communication processes. The proposed framework increases the system’s overall performance and efficiency compared with other methods.
Bag et al. [
26] proposed a new big data analytics (BDA) process for supply chain management (SCM). The proposed BDA method improves the overall management process of the system by providing more efficient and effective services to the users. The proposed method offers sustainable outcomes for the supply chain management process, which helps to enhance the capabilities of SCM. Experimental results show that the proposed method increases the overall performance and reliability of SCM by reducing the computation cost and energy consumption rate.
Choi et al. [
27] introduced a circular supply chain management (CSCM) method for supply chain management (SCM). The proposed CSCM uses a macro–micro model in SCM to provide better communication and data management processes based on an extensive data analysis. The proposed method uses a large-scale group decision-making process to obtain appropriate services for users. The proposed method increases the overall performance and feasibility of SCM compared with other methods.
Munuzuri et al. [
28] introduced a new Internet of Things (IoT) approach for port-based intermodal supply chain systems. The proposed method is used to manage a large amount of data with the help of an extensive data analysis process which helps to enhance the efficiency of the supply chain management system. The proposed method also tracks and detects information about the flow of goods and services provided to users.
Zhang et al. [
29] have proposed a new data analytics process to enhance forest and biomass in biomass SCM. The enhancement of a forest is analyzed based on specific frameworks and tools, helping to provide a proper data set for the analysis process. Experimental results show that the proposed method increases the overall performance and efficiency of the system compared to other traditional methods.
M.M. Mansour et al. [
30] introduced two-parameter Burr XII allocation. The new density distribution might be symmetric, right-skewed, left-skewed, or unimodal. The new failure rate has three possible trends: declining, uniform, and rising. We derive the properties of the revised model.
Narjes Mohammadi et al. [
31] employed a range directional model (RDM) for optimal computation while dealing with negative data and a special instance of the directional distance function. A Malmquist-type index is derived using RDM efficiency measurements that can capture productivity shifts.
Alessia Munnia et al. [
32] demonstrated how deploying blockchain technology improves trust and stability among logistic and supply chain operators and enterprises through creating and distributing shared value.
Smail Benzidia et al. [
33] showed that environmental efficiency improved when businesses worked together on green supply chains and integrated ecological processes. A significant finding that has not been addressed in existing research is that sustainable digital learning moderates the connections between Big Data, Artificial Intelligence, and green supply chain interactions.
Efpraxia D. Zamani et al. [
34] performed a comprehensive literature evaluation, examining Big Data Analytics–Artificial Intelligence research studies on supply chain robustness that were published in Chartered Association of Business Schools (CABS)-listed journals over 2011 and 2021; we aggregated and synthesized this scattered information. Thanks to the search method, 522 studies were found; however, only 23 were considered primary publications for this study.
Veronica Scuotto et al. [
35,
36] offered suggestions for improving chief information officers (CIOs), focusing on the impact of the micro-level in preventing disruptive technologies and maximizing expenditures in technological development and research at small- and medium-sized enterprises (SMEs).
Fetching data employing K-means clustering provides fewer services to the efficiently engaging users. The major drawback in the architecture of Big Data is its overall security, feasibility, and efficiency for detecting and analyzing big data from supply chain networks to enhance the services provided to users. The efficiency of maintaining the management process needs to be more effective to provide services to users. The overall problems need to be managed well via the implementation of IDP.
3. The Proposed Incessant Data Processing Method
SCM is all about expanding, designing, implementing, and keeping track of supply chain activities with the help of information and technology. If SCM is to succeed, it is necessary to ensure that information is symmetrical at every stage of the supply chain, from the procurement of raw materials to the transportation of finished products. Machine learning (ML) systems and neural networks can also significantly benefit supply chain management. The bullwhip effect can be anticipated with the help of methods like linear regression. Lead scoring using decision trees or a random forest can help supply chain managers prioritize their efforts. SCM uses Big Data and AI for lead-time planning and analyses of audio and video conversations between buyers and sellers. Machine learning and SCM go hand in hand in optimizing the distribution of goods and services. Time and materials can be spared if these techniques are used effectively. In particular, the scheduling process can profit from the widespread usage and extension of established statistical approaches via ML. AI has a significant benefit over conventional methods, especially for nonlinear issues. Despite the apparent advantages, according to a recent survey, only 15% of businesses used ML for at least one supply chain activity. This could be due to a lack of information or general unfamiliarity with the topic. These advancements in technology have an impact on human deployment, as well as the management of supplies and purchases [
37].
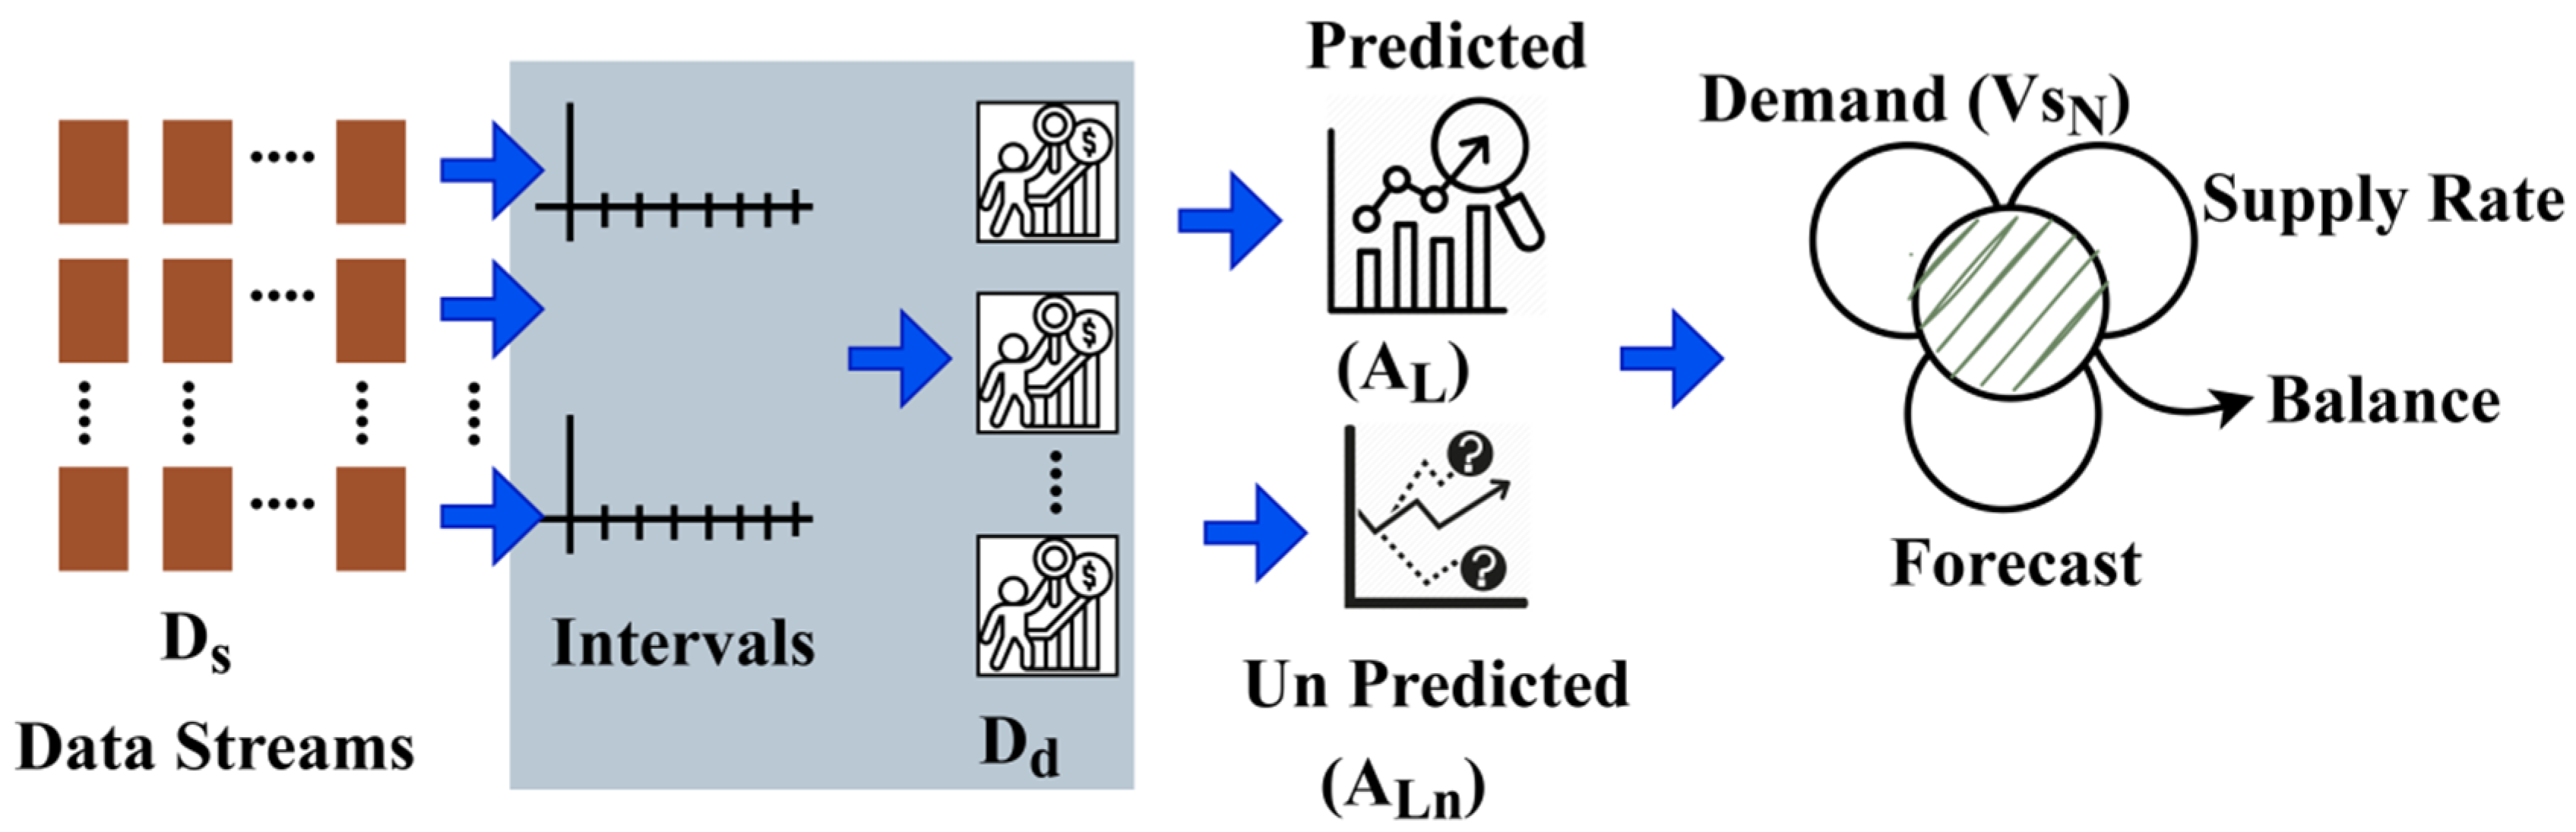
The proposed IDP method is designed to improve the production, supply chain management, and the accuracy of predicting the production of surplus for any smart product factory. In the smart industry, the data processing model provides control by assimilating hardware and software and then provides computational abilities based on the circulation of products and the demand for any product and its operations. The proposed method of IDP, which is based on an IoT platform, intelligent data management processing, is designed to regulate the functions of the production management system employed in the smart industry. The proposed IDP method is illustrated in
Figure 1.
The proposed IDP method defines any product’s production and supply chain to ensure better prediction accuracy in the smart industry. The influencing consecutive supply chain factors, such as increases and decreases in product demand falls, are supported by the product circulation process in a balanced manner. This ensures a harmonized stream of data and a solution for verifying the supply rate for IoT-based smart supply chain management. The demand and supply process differs from cumulative production and discrete supply-chain-based solutions. On an IoT platform, Big Data and smart industry data streams with respect to production and demand communicate through the IoT environment. Therefore, these data streams are responsible for balancing the production of and demand for products with the analysis of time and an errorless data process. This balance is modeled for the accumulated data prediction of the smart industry. The analysis of the increases and decreases in a product’s demand and supply rate is reliable for other products within different supply chain intervals (
Figure 1). Based on these alternations, in an intelligent industry environment, demand and production consist of
and
. Product circulations meet the delivery demands of suppliers (vendors) and customers through the production of surplus in the supply chain, with the aid of product demands. Let
represent the products consisting of
supply chains that are to be distributed for the available data streams
performing computations. Initially, the supply chain
generates data streams as shown in Equation (1a–c).
For the consecutive supply chain,
In Equation (1a,b),
is the supply chain,
denotes the production of products, and
is the demand in the smart industry.
represent the data streams,
denotes the supply chain,
represent the number of products with the number N of supply chains, and
represent several demands in the smart industry.
represents the number N of data streams.
represent the number of computations. Where the variable
is the supply chain interval for filling
with
,
is the random number generating the data stream, and
is the total time interval for filling
. In Equation (1c) above, the constraint of
is to be achieved for all
that are analyzed in the time interval
, i.e., the analysis time provided time intervals
. The smart factory vendor and customer use their production and demand data streams to meet the delivery demand [
38]. These production circulations and demand are imposed to reduce the conclusive inaccuracies performed over the IoT during harmonized stream transmission. in the analysis, the increase and decrease in production and fall analysis are identified using federated learning prediction balances. The data streams are able to handle the harmonized data on both ends with the additional
depending on the alternations
in the data streams, which are denoted as
The production harmonized stream analysis
is prominent in handling the identification of spikes and decreases in production with the help of alternations in data streams. As per Equation (2), eligible data stream products are assigned for the harmonized streams to forecast alternating data streams. In this demand and supply rate-assigning process, if
, then
. Therefore, the remaining
is used for the successive harmonized streams requesting production and demand identification. The assignment of
follows an altered federated learning process. This process uses cumulative (production) and discrete (supply chain) data based on customer delivery demands. These processes meet the conditions
and
. The case
is designed as a consecutive chained operation for predicting the harmonized stream
based on
. The construction of IoT and data streams is altered for all the cases and follows cumulative productions and discrete supply-chain-assignment processes. The prediction process is the same for all the various streams’ assignments of
and
. The prediction-balancing process is illustrated in
Figure 2.
The input
is classified based on different
values for
identifications from which the forecast is detected. In the forecast classification,
and
are identified
and
such that
is satisfied. Therefore, the demand, supply, and forecast are balanced for two conditions:, i.e.,
and
. This is analyzed based on the
and
for retaining the balance
that generates
(
Figure 2). The prediction-balancing process for the above cases is discussed in the following sessions.
Case 1: The count of is less than the generated data streams, i.e., .
Solution 1: The roles of product production and vendor demand makes them reliable for reducing the chances of deficiency problems without increasing errors and alternations in the data. The streams stored in this process are reused for the supply chain interval assignment and the consecutive prediction of the harmonized stream data, where the assignment, is identified in less analysis time. Let such that for which the data stream assignment is illustrated. Even odd cases are mentioned in this process, with the analysis of spikes and decreases during the demand for and production of products. The spike is denoted by an even number, and a decrease is denoted by an odd number. The demand and production ranges vary based on the harmonized data streams in the smart industry. Alternations in the data streams are identified using federated learning. The trained supply chain is processed sequentially with different time intervals from these spikes and decreases in demand.
The following levels forecast sustainable production in the successive prediction process. In both cases of
, the consequence of
depends on the forecasting
and the sequential supply chain of
. This consecutive process is estimated as
, where
is the discrete supply chain value of the root data stream
, i.e., the prediction identification. Now, when
the demand
can be computed as follows:
Here, the count of
is reduced to
, where
hence,
From the computation of the demand and supply rate prediction in Equation (4),
and
are are random integers, and
represents the supply rate employed by the data streams that serve as the root of. The output of
,
is assigned for the productions
. The alternations in
are transmitted. The above computation assists in predicting the sequence of data stream distributions without assigning all the generated
values to the available
. Hence, an additional evaluation on
is not required, whereas the balanced sequence is to be required in the case of
. The resulting output of the prediction instance must be followed from
such that there is no entry of the supply rate
. On the other side, the prediction is different for the case in which
. Therefore,
is considered for predictions of spikes and decreases in demand. This prediction sequence is provided in Equation (5).
Is the least possible estimation obtained for data streams assigned in the above sequence? Therefore, the estimations do not need be complete for both and . The condition is considered for increasing the forecasting rate with fewer data errors.
Case 2: The supply chain is insufficient for meeting the available customers’ delivery demand, i.e., N < SN.
Solution 2: In this analysis process, the preference for the supply chain is initiated from
or from
. The condition of
is the same as that of an idle case, whereas the initial data streams from
or from
to the successive production of
data streams and the demand from the vendor. The representation of
obtains two types of forecasting. This consecutive process is obtained to proceed with the sequential prediction without needing more complex estimations. Hence, a complete set of data stream predictions is provided for the different vendors. Here,
and
are the metrics considered. If
is estimated in different supply chain intervals for the first instance of
, then the interval
is aided to serve input as
or
. The sequential prediction is initiated from the interval
therefore, the prediction is presented from
, and
is given as
In this consecutive manner of prediction in a supply chain interval, as differentiated by the above-mentioned instances of and , the alternations between the cases are maintained and controlled by assigning consecutive values such that reducing the additional computations in the process.
After the smart industry’s hike and fall analysis of data streams, forecasting for inaccuracies is performed at the customer (receiver) end. The IoT cloud is a large data center that serves as a platform for various IoT services. Symmetry is very important. The servers and storage media that are essential for ongoing operations and real-time data processing fall under this category [
39]. It ensures alternating streams and product supply between the vendor and customer without excess demand. The learning process for the joint solutions 1 and 2 is illustrated in
Figure 3.
Forecasting
As per the two cases discussed, the instances of forecasting are performed unanimously. In this analysis, the metrics
and
instances are predicted other than the product demand
and supply rate
on the customer side. Let
and
be the two cumulative and distinct functions designed based on supply chain intervals that are computed as
In Equation (8), the precise forecast for demand suppression based on the supply chain interval
and the
value for the customer data stream instance is determined such that if
is the customer instance; thus, the forecasting is performed as follows:
The model for forecasting the demand and supply rate of products is designed as in Equation (10) for the above instance and is given as
The above forecasting is computed following the function of
provided, which is the consequence of
. If this forecasting exceeds the analysis time, then
is employed such that
From the above estimation, the forecasting process is illustrated in
Figure 4.
The classified
and
are distinguished from the learning outputs. The process further includes
and
estimations and verifications of the supply distribution and forecast. The forecast information is required for
to improve the production and supply chain requirements. From the precise forecasting of the case
, the prediction is performed as follows:
where the RHS of the above computations is predicted with either
Because this forecasting process serves as the midpoint of the consequence dividend, i.e.,
and
, the
demand is given as
or
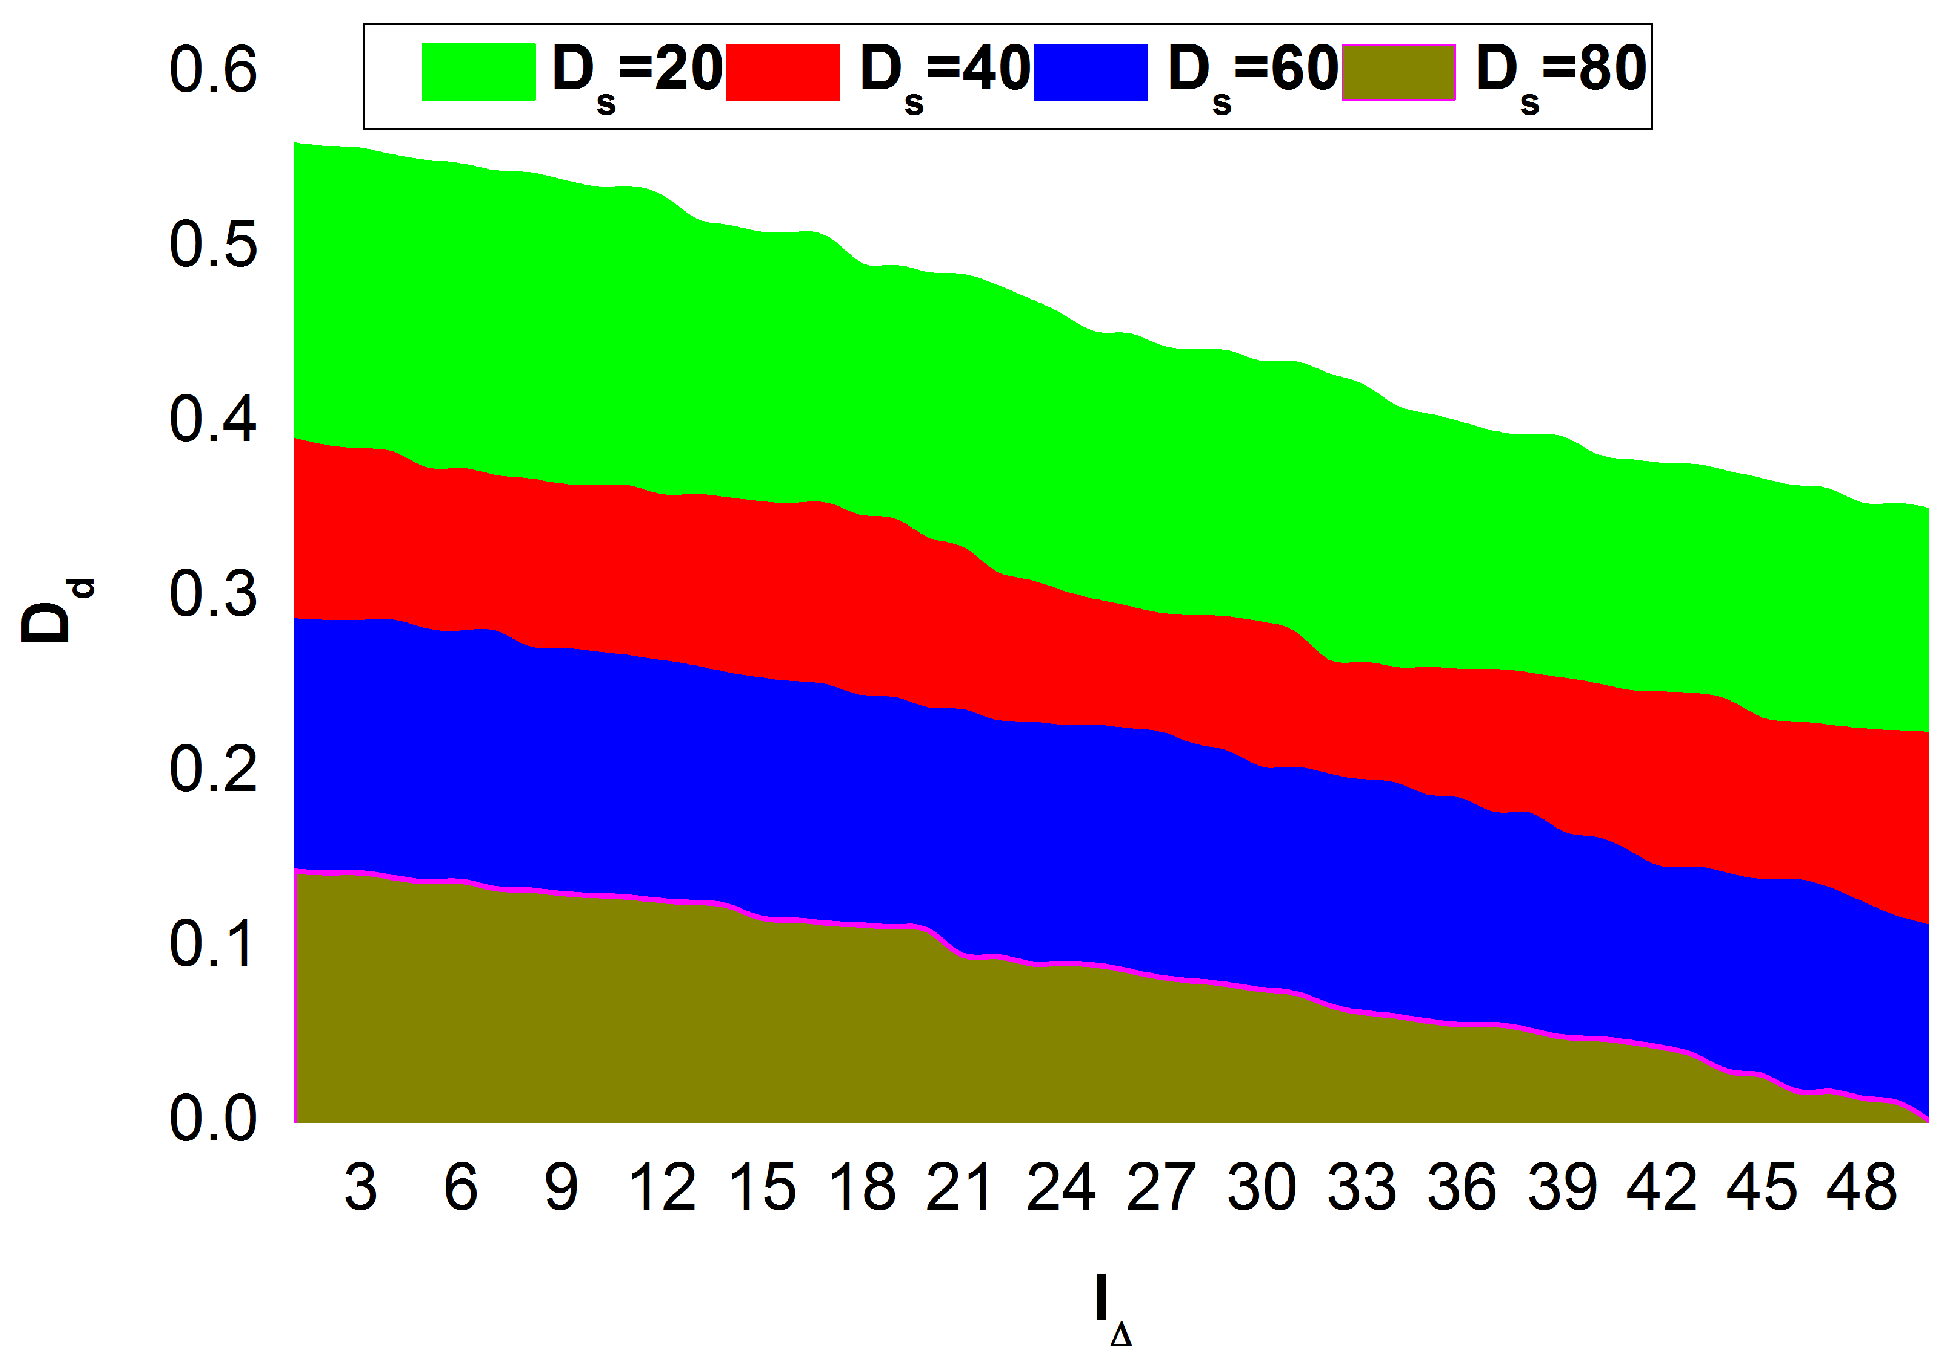
, which is the predicting instance. The prediction is performed for a specific concern for any product receiving the data streams, obtaining no additional data errors and analysis time. This sequential smart supply chain management process increases prediction accuracy and demand suppression. In
Figure 5, the
-indifferent
and
values are analyzed.
Figure 5 presents the
values observed for different
and
. In the proposed method,
is reduced for increasing intervals through learning identifiers in
and
. This is performed for different
for identifying
and
. Based on the prediction sequences of
and
functions, the demand requirements are satisfied. Here, the conditions are forecasted through
, as in the
condition for Equation (12). This improves data utilization in
management with fewer alterations.
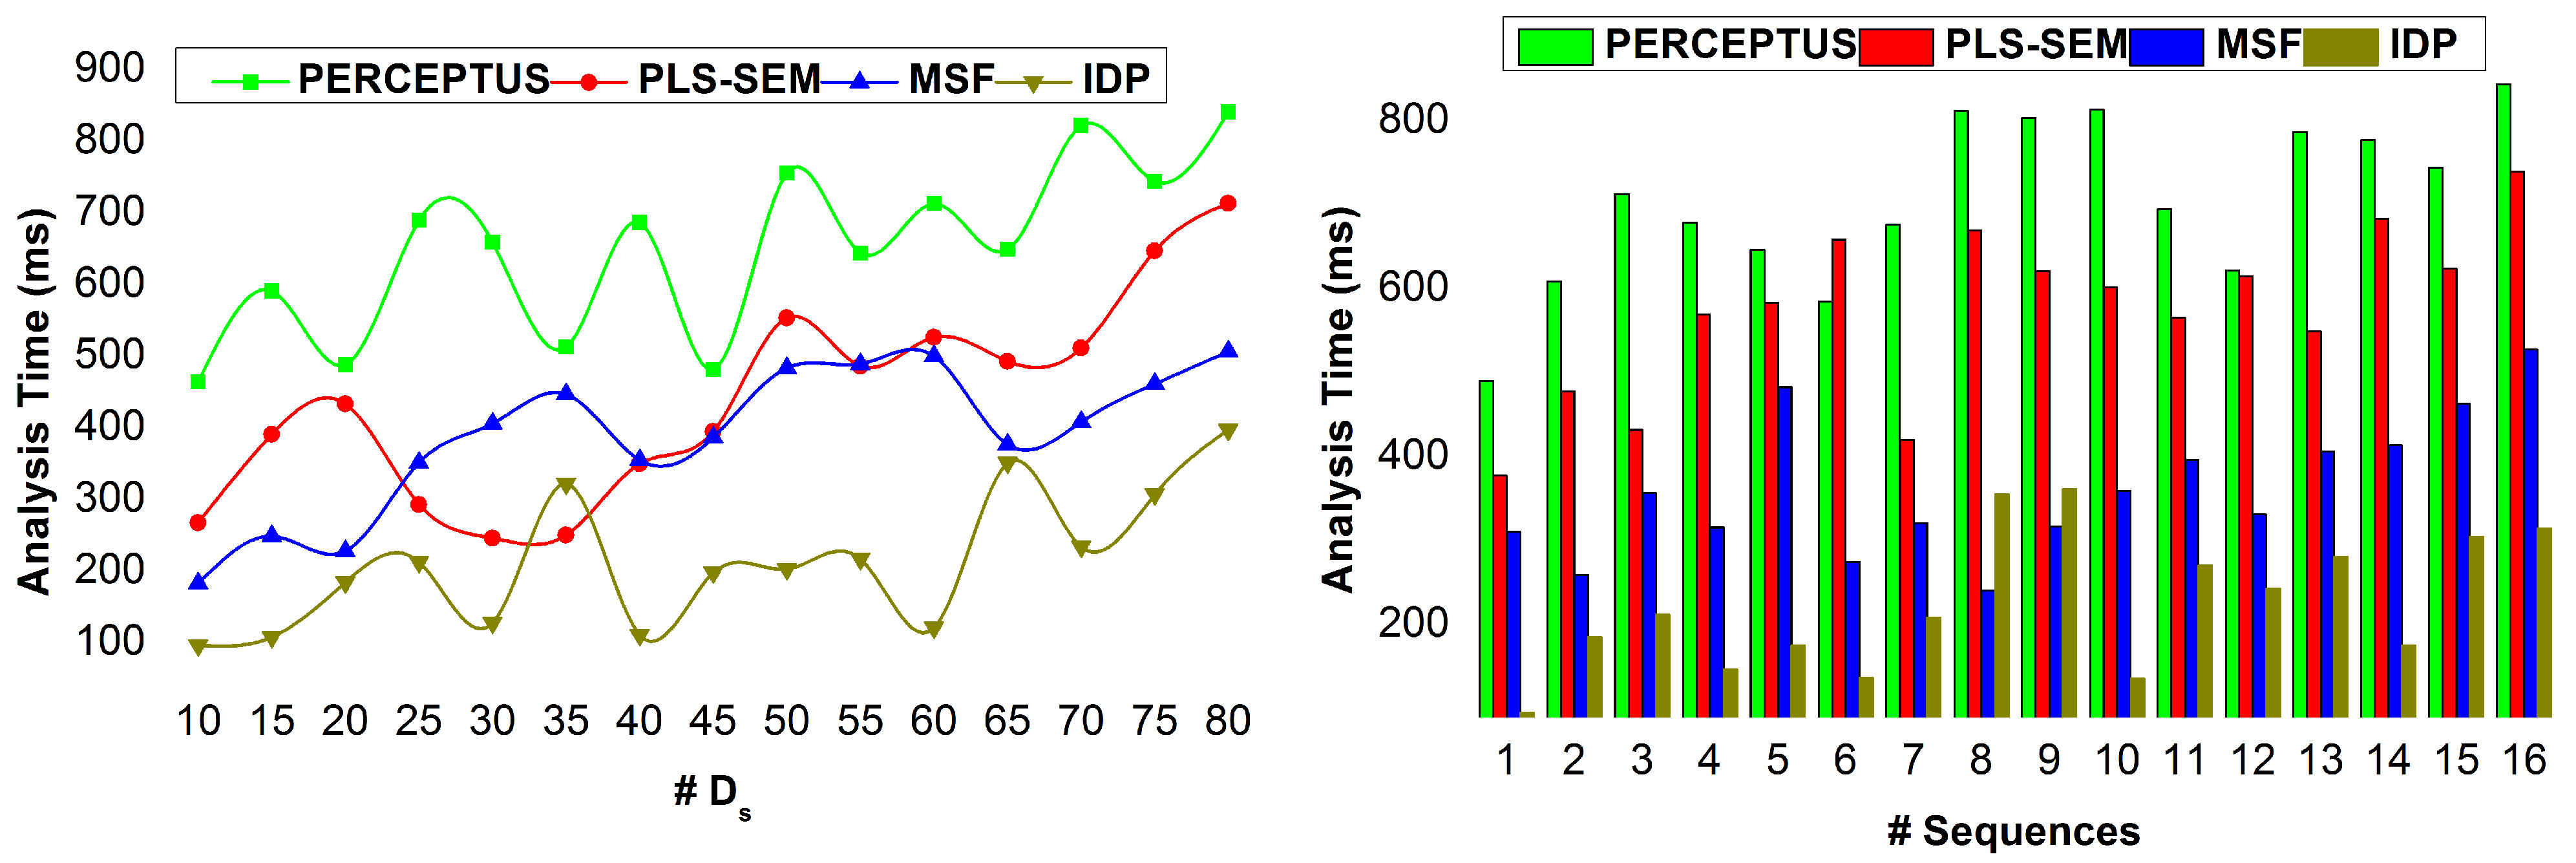
Figure 6 presents the sequences observed under different
values and conditions.
An analysis of the different sequences under varying
and two different conditions are presented in
Figure 6. In the above Figure, the conditions
and
are considered. Based on the assessment, the proposed method identifies the increases and decreases in
such that
is required post
and
. Depending on the learning process, supply rate, and sequences, the second is due to
. The analyses for
and
for different predictions and factors are presented in
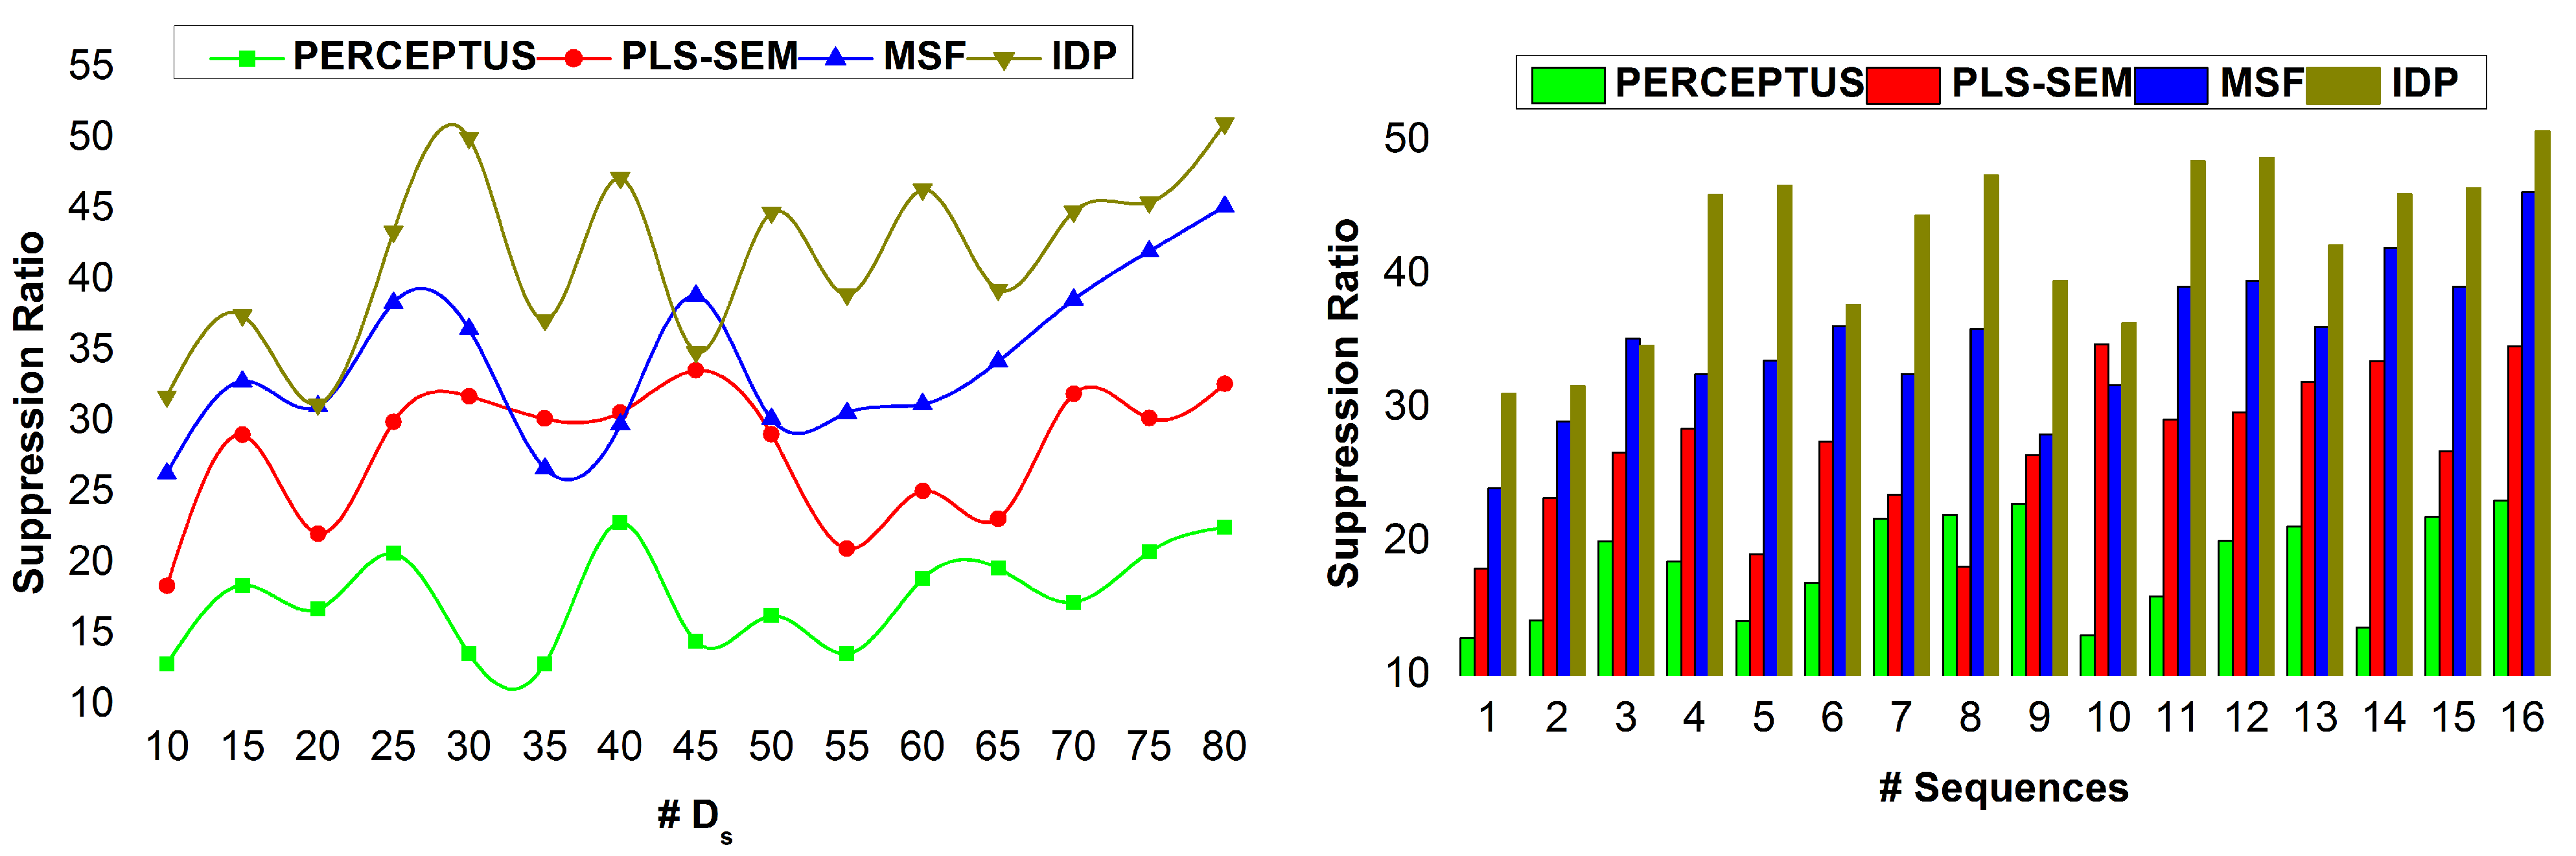
Figure 7.
Figure 7 presents the analysis of the
and
required for varying prediction factors under
and
. This is performed if the values from
and
to
vary due to
and
. In this process, instead of
reductions from
to
are performed. This has been accomplished in past differentiations of
and
. Contrarily,
is required if
to
and
is not satisfied from
. In this case, the consecutive alteration requires
and
. The processes are distinct for meeting the demands; hence, the
is retained with better accuracy. The errors observed for different
values due to
and
are shown in
Table 1.
For different
values, the prediction errors due to
and
are presented in
Table 1. The
and
information is fetched from the data source for which the forecast of
is estimated using
. Based on the analysis, using
and
, the predictions
and
are estimated. The prediction outputs are handled under
such that
in
or
is detected. In this detection,
; the
is less, and hence the error is less (negative). Contrarily, if
is classified under
, then
requirements are high, and the error of
is therefore high. This is suppressed through consecutive sequence predictions such that
is completely utilized for further
.


