Article

Influence of Box Height on Inter-Limb Asymmetry and Box Jump Performance

1
Biomechanics Laboratory, School of Kinesiology and Recreation, Illinois State University, Normal, IL 61761, USA
2
School of Kinesiology, Applied Health and Recreation, Oklahoma State University, Stillwater, OK 74074, USA
3
School of Physical Education and Sport, University of São Paulo, São Paulo 05508-090, Brazil
4
Department of Health Sciences, Stetson University, DeLand, FL 32723, USA
5
London Sport Institute, Middlesex University, StoneX Stadium, Greenlands Lane, London NW4 1RL, UK
*
Author to whom correspondence should be addressed.
Symmetry 2023, 15(7), 1359; https://doi.org/10.3390/sym15071359
Submission received: 26 May 2023 / Revised: 22 June 2023 / Accepted: 29 June 2023 / Published: 4 July 2023
(This article belongs to the Special Issue Biology and Symmetry/Asymmetry:Feature Papers 2022)

Abstract

:
Box jumps are often included in training programs as an introductory exercise to novice athletes and untrained individuals and are an efficient option of lower-body explosiveness training. However, it is unclear whether the use of boxes of differing heights affect the inter-limb asymmetry during this exercise. The purpose of this study is to investigate the effect of box height in inter-limb asymmetry during box jumps. Recreationally active young males (n = 14) and females (n = 16) performed three jumps at boxes that corresponded to approximately 0, 20, 40, 60, and 80% of their individual countermovement jumps. The selected performance variables were peak force (PF), peak power (PP), rate of force development (RFD), and time to take-off (TToff). The intraclass correlation coefficients ranged from 0.76 to 0.99, and the coefficient of variation ranged from 4.03 to 16.52%. A series of one-way repeated measures ANOVA tests were used to test for significant differences of the performance variables and inter-limb asymmetries. The females’ PF at 80% was significantly higher from 0% (p < 0.05). No significant differences were observed for inter-limb asymmetry across box heights (p ≥ 0.25). This study shows that the box height does not affect the overall intra-session inter-limb asymmetries in recreationally active individuals.

1. Introduction

Inter-limb asymmetry refers to differences in the performance of one limb compared to the contralateral limb [1]. Previous research has indicated that inter-limb asymmetries in strength and power-related measures may have a disadvantageous impact on athletic performance [2]. In general, it was proposed that inter-limb asymmetry values higher than 10% are associated with a decreased countermovement jump (CMJ) height in athletes [3], and jump height asymmetry values as low as 5% were shown to have a detrimental effect on athletic performance [4]. Negative relationships between jumping asymmetry and physical performance tests were observed in the literature [5,6,7]. For instance, single-leg asymmetries are correlated with poor sprint, vertical jump [5,6], and change in direction speed performance [6]. Additionally, the magnitude of the asymmetries and their effect on performance may be affected by the training status of the athletes [2,8]. In fact, it was suggested that athletes may develop greater inter-limb asymmetries as a response to the prolonged exposure to specific sports-related motions [9]. Since untrained individuals can benefit the most from training and potentially reduce initial asymmetry values [10], and inter-limb asymmetries in jumping may affect performance in several other capacities [2,5,6,7], the early identification of these side-to-side differences during a training program is paramount.
Inter-limb asymmetry was extensively investigated during CMJ standardized tests [1,2,11]. Although these investigations are relevant, there is limited evidence about inter-limb asymmetry behavior during CMJ variations that are commonly used in training programs [11]. Box jumps are often included in training programs as an introductory exercise to untrained individuals and are an efficient option for lower-body explosiveness training. When executing a box jump, athletes must perform a movement similar to a CMJ [12] and land onto a box. Traditionally, the intensity of box jumps was thought to increase with the height of the box. However, from a biomechanical standpoint, the actions that precede the jump until the moment of take-off are not affected by the height of the box. For this reason, the difference in the center of mass (COM) displacement from CMJ to box jumps is often negligible [13]. When jumping to higher box heights, a coordinated extensive flexion of the knees and hips occur to execute the movement pattern. It is known that factors such as limb dominance, muscle activation, and technical proficiency play a role in jumping performance [2,14]. In light of these facts, the preparation for the jump onto higher boxes may result in a premature flexion of the knees and hips preceding the triple extension of the lower body. However, it is unclear whether the lower-body coordination required for jumping onto boxes of different heights may affect the magnitude and direction of inter-limb asymmetries.
Reliability analysis is a critical aspect of performance assessment during jumps, as it ensures that the results are consistent and provides practitioners with accurate information that can be used for progress monitoring. To this point, the reliability of numerous CMJ performance variables was established for both within and between training sessions [15]. Although box jumps have been extensively used in training settings, from a performance assessment standpoint, it is unclear whether the reliability of this assessment is acceptable in a cohort of recreationally active individuals. Since inter-limb asymmetry is dependent on the comparison of performance variables between the left and right legs, it is essential to establish the reliability of these variables to produce valid results.
The assessment of the contribution of each limb during box jumps performed at various heights allows for an analysis of the strength and power output contribution between the legs during the movement. This information may provide coaches and trainers with tools to manipulate specific aspects of training that may help to mitigate certain types of injuries and decrease inter-limb asymmetries, especially in cohorts of novice athletes or untrained individuals. Therefore, this study aims to investigate potential changes in inter-limb asymmetry during box jumps performed by recreationally active individuals at various heights. Based on the assumption that the height of the box does not affect the take-off mechanics, it is hypothesized that existing inter-limb asymmetries will remain stable regardless of the box height in jumps performed at maximal intensity.

2. Materials and Methods

2.1. Experimental Design

A repeated-measures design was used to compare the intra-session reliability of box jump performance and inter-limb asymmetry variables with boxes of different heights. Following signed consent to participate in the study, subjects visited the laboratory on two separate occasions. In the first visit, the height, weight, body composition, and CMJ performance were assessed. After a minimum and maximal rest period of 48 and 72 h, respectively, subjects returned to the lab for the second testing session. During the second visit, subjects performed box jumps from five different heights based on CMJ performance measured on the first visit (0, 20, 40, 60, and 80% of CMJ). Kinetic and kinematic data for all conditions were collected and analyzed.

2.2. Subjects

A convenience sample of recreationally active individuals participated in the study. The sample comprised 14 males (age = 20.8 ± 4.1 years, height = 178.3 ± 6.3 cm, weight = 82.3 ± 13.0 kg, BF% = 16.3 ± 7.4%, CMJ = 42.1 ± 12.7 cm) and 16 females (age = 21 ± 1.9 years, height = 167.3 ± 5.3 cm, weight = 64.3 ± 7.1 kg, BF% = 27.6 ± 4.3%, CMJ = 26.8 ± 4.5 cm). A minimum of 13 subjects was deemed appropriate based on an a priori power analysis using G*Power 3.1.9.7 (University of Düsseldorf, Düsseldorf, Germany) with a large effect size (F = 0.4), statistical power of 0.95, and a type 1 alpha level of 0.05. Subjects were required to have been physically active (i.e., have been engaged in physical activities for a minimum of 2–3 times/week for approximately 150 min of moderate-intensity activities or 75 min of vigorous intensity) and with no history of lower-body injuries for the 6 months preceding their participation in the study. Written consent was collected prior to participation. All subjects participated in this study voluntarily and were allowed to withdraw at any time. This study was approved by the University Institutional Review Board for use of human subjects (IRB 21-343-STW) in conformity with the Declaration of Helsinki [16].

2.3. Procedures

The study was completed in two testing sessions. In the first session, upon arrival in the lab, subjects had their height, body mass, and body composition recorded. Then, they performed a standard dynamic warm-up and had their CMJ height assessed. Following a short rest, subjects finalized the first session by being familiarized with the box jump heights that would be used in the second part of the study. With a minimum rest period of 48 h after the first session, subjects returned to the lab for the second testing session. During the second testing session, subjects executed an incremental box jump test at relative intensities of 0, 20, 40, 60, and 80% of their CMJ.
Age, Height, Leg Dominance, Body Mass, and Body Composition. Age was self-reported by the subjects. The subjects’ heights (cm) were assessed using a portable stadiometer (Seca, Hamburg, Germany). Leg dominance was determined based on the subjects’ self-reported preferred limb (3 males and 1 female indicated left-leg dominance). Body mass and body composition assessments were performed via InBody270 (InBodyUSA, Cerritos, CA, USA).
Countermovement Jump (CMJ). The CMJ protocol took place after the completion of a standard dynamic warm-up and a specific warm-up. The subjects began the standard warm-up on a Monark 828E cycle ergometer (Monark, Vansbro, Sweden) for 5 min. They then completed two sets of five submaximal CMJs onto 6″ (15.24 cm) and 12″ (30.48 cm) boxes. An interval of 30 s was provided between sets. At this moment, they were ready to begin the maximal test. The subjects performed the CMJ on a Just Jump (ProBotics Inc., Huntsville, AL, USA) electrical-contact-operated system. All subjects were instructed to step on the mat and, when ready, to perform a CMJ as high as possible. They were given three trials with a 30 s rest interval between trials. The highest CMJ was used as a reference for the box heights in the second part of the study. Only CMJs with the correct execution were considered. In summary, a proper CMJ began with the subjects standing still with feet hip-width apart and toes pointed forward. Then, they initiated the jump by swinging their arms backwards while flexing their hips, knees, and ankles to a self-selected depth, followed by a rapid triple extension of the lower body while driving their arms upward. Upon landing, the subjects slightly flexed their hips and knees while maintaining proper body alignment (i.e., hips, knees, and ankles) [12]. The arm swing was allowed during the CMJ test because the subjects needed to use an arm swing to more safely coordinate jumping onto boxes in session 2.
Box Jump Test. The incremental box jump test took place in the second testing session. Upon arrival to the lab, the subjects performed the same standard and dynamic warm-ups from the CMJ test. A combination of plyometric boxes (Rogue Fitness, Columbus, OH, USA) were used and corresponded to approximately 0, 20, 40, 60, and 80% of subjects’ individual CMJ height. Order of relative heights was randomized to prevent bias. For each height, the subjects executed three jumps. Each trial started with the subject standing still in front of the boxes with arms resting on the sides of the body. Boxes were placed 5 cm from the force plates and all jumps were executed upon the investigator’s command. In addition, the subjects were constantly reminded to jump as high as possible during all jumps regardless of box height. Training at maximal intensity closely replicates the neuromuscular demands of sport-related actions, making the training more specific and transferable to sports performance. Only trials with the correct CMJ technique (i.e., subjects were not allowed to tuck their knees during the upward portion of the jumps) were considered for further analysis. Rest intervals of 30 s between jumps and 1 min after each box jump height were provided.
Kinetic and Kinematics Data Collection and Processing. The subjects’ force–time data were collected via 2 portable PASCO force platforms with PS 2142 sampling at 1000 Hz and connected to a UI-5000 interface (PASCO scientific, Roseville, CA, USA). Vertical ground reaction force (vGRF) from each force platform was initially analyzed through the PASCO Capstone v2.4.1.8 software (PASCO scientific, Roseville, CA, USA). From the vGRF data, the subjects’ impulse, acceleration, velocity, displacement, and power were calculated through a forward dynamics approach [17,18]. Impulse was calculated by integrating the force–time data, and acceleration was calculated by dividing the net force–time data by the subject’s body mass. The trapezoid rule was employed to calculate COM velocity by numerically integrating the acceleration–time data, COM displacement was calculated by numerically integrating the velocity–time data, and power was calculated by numerically integrating the force–velocity data. After the initial calculations, the variables of interest were calculated. These included peak force (PF), peak power (PP), rate of force development (RFD), and time to take-off (TToff). The PF and PP were calculated using the force and power data, respectively. The RFD was calculated by dividing the change in force by the change in time during the jump braking phase [19,20,21]. The TToff was calculated from the point at which vGRF fell below a value equal to 5 times the standard deviation of body weight (i.e., onset of movement) [17,22] to the point at which vGRF reached a threshold of 5 times the standard deviation of the vGRF of the unloaded force plates taken over 300 ms (i.e., take-off) [17,22,23]. All calculations were analyzed using a customized Microsoft Excel spreadsheet (Microsoft Corporation, Redmond, VA, USA).

3. Statistical Analyses
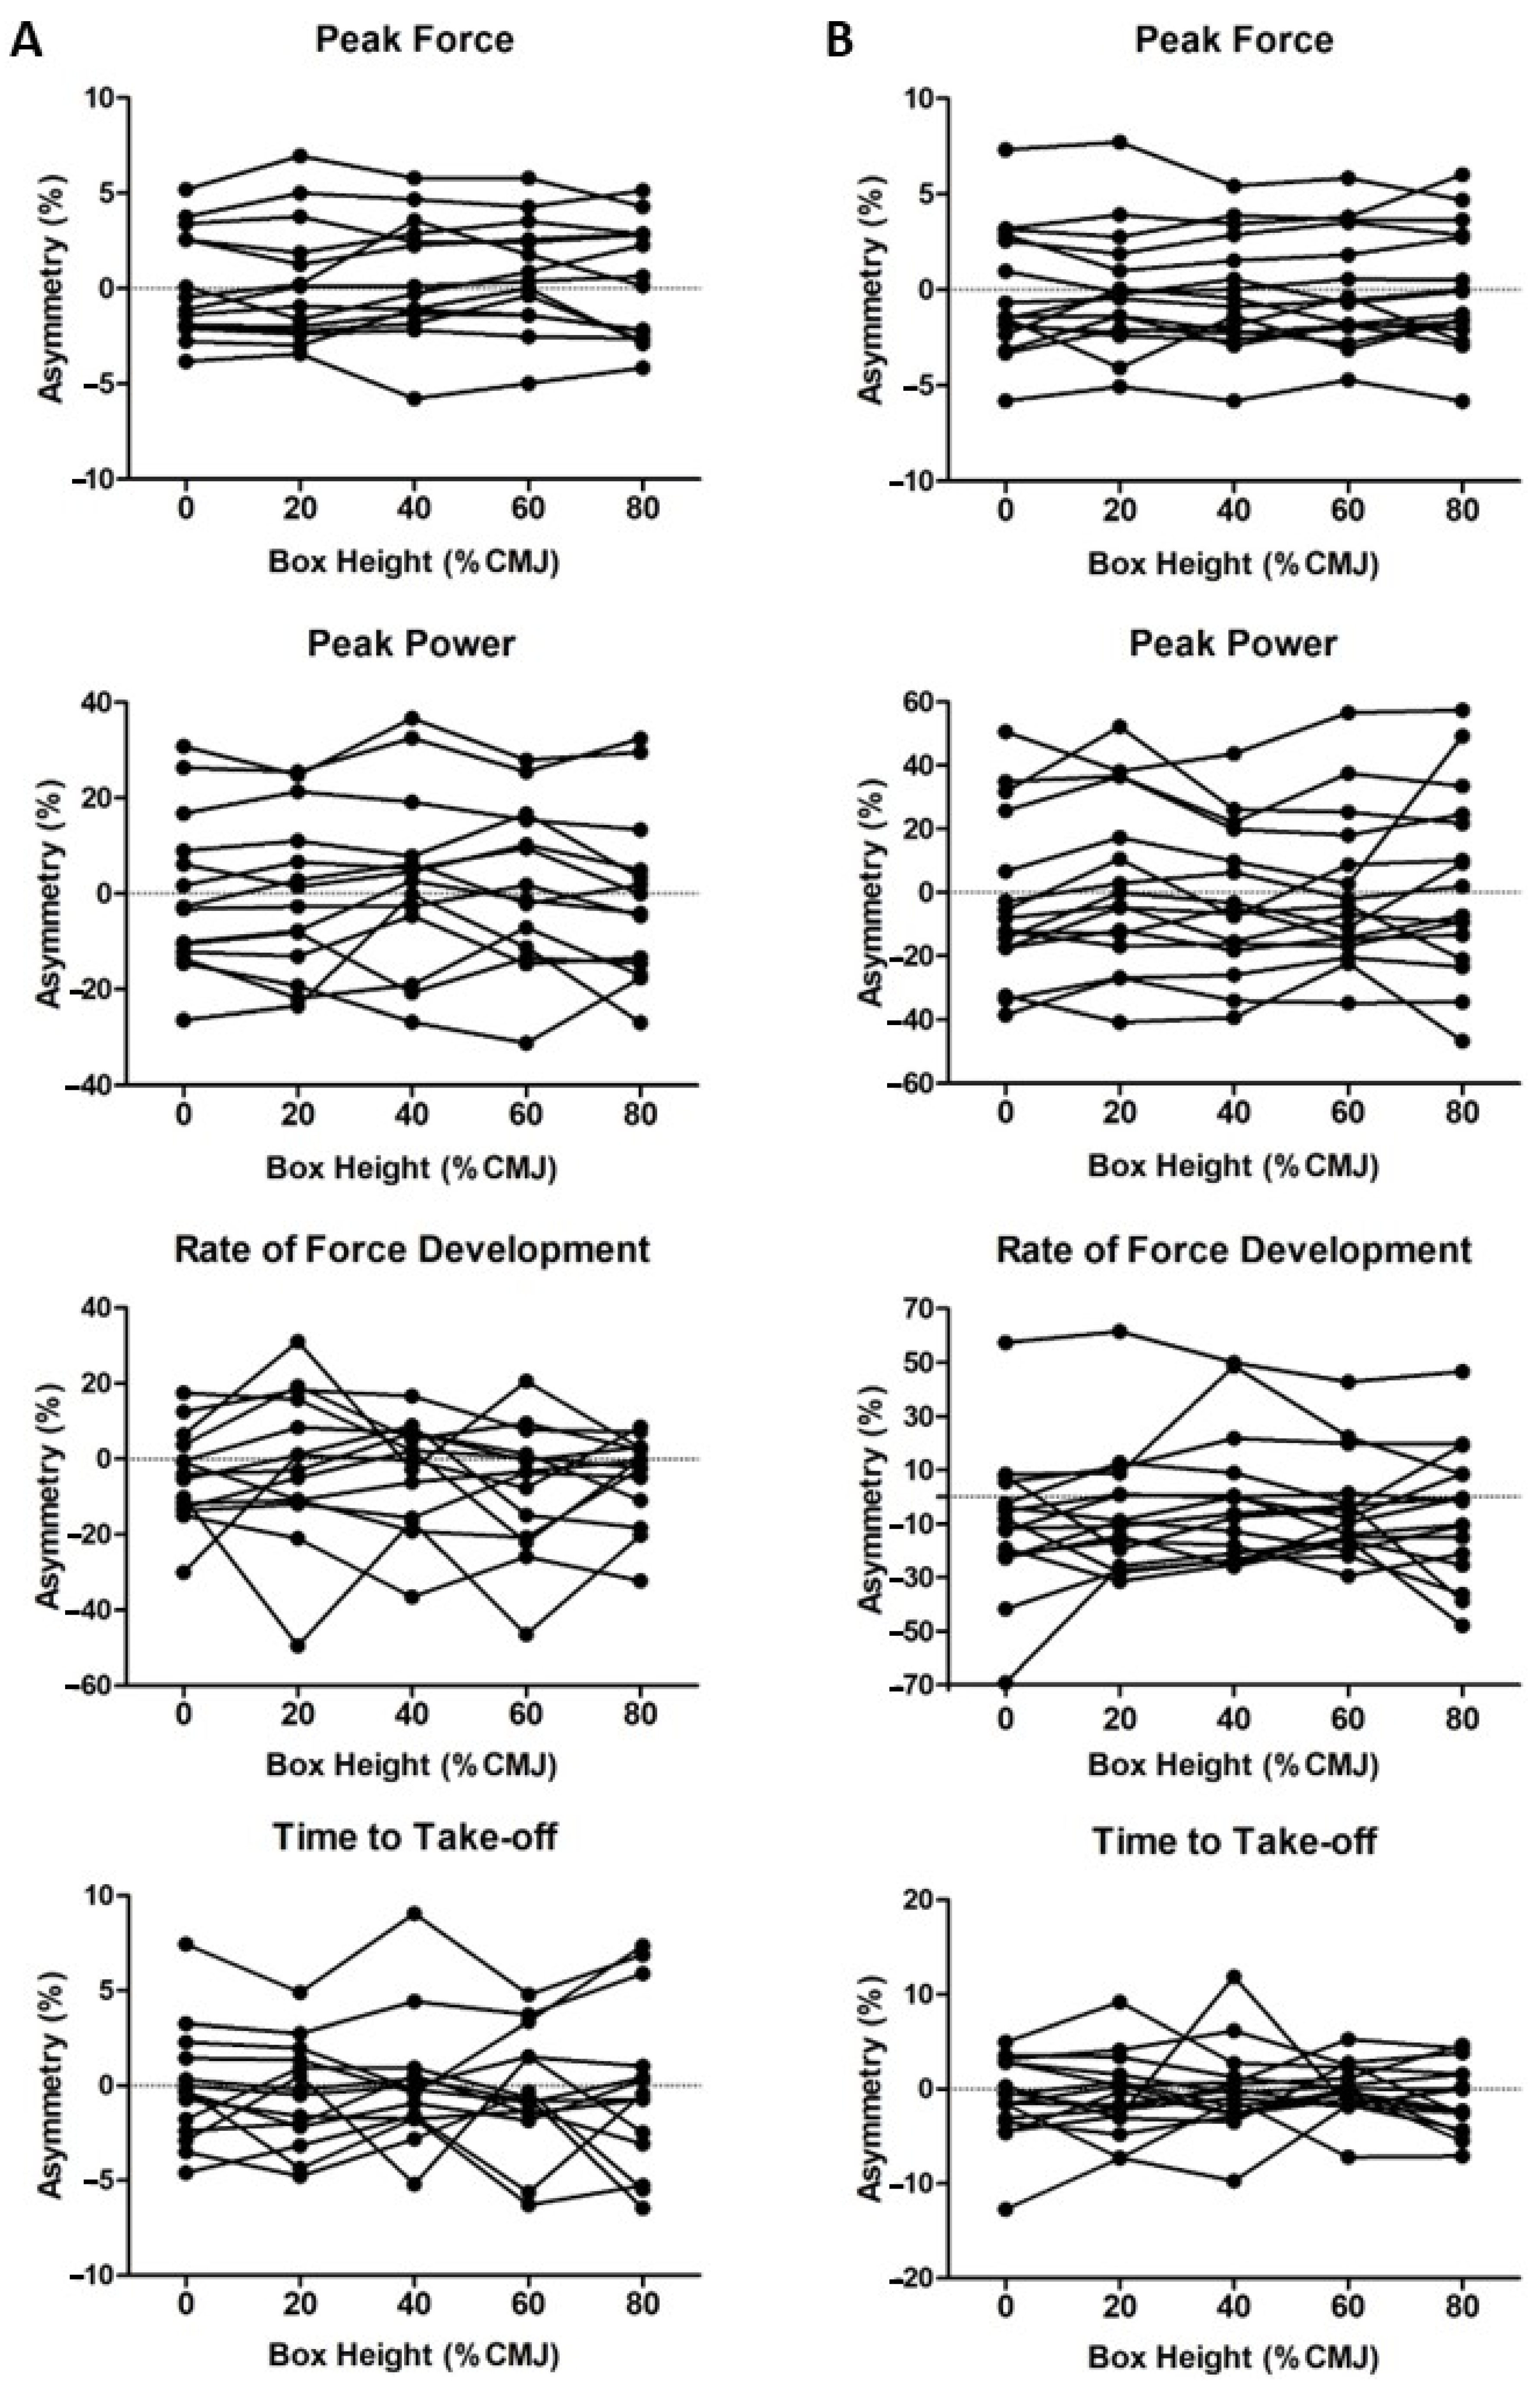
An initial visual inspection of the data (boxplot) was conducted, and the z-scores distribution was analyzed to detect the presence of outliers. The data normality was assessed via Shapiro–Wilk’s test, and Levene’s test was conducted to assess the homogeneity of the variances. The reliability between repetitions was determined using two-way mixed-effects model intraclass correlation coefficients (ICCs) with an absolute agreement of 95% confidence intervals (95%CI), coefficients of variation (CV) [24], and standard error of measurement (SEM). The ICC reliability values were considered poor (≤0.50), moderate (0.51–0.74), good (0.75–0.89), and excellent (≥0.90) [25]. The SEM was performed in conjunction with the ICC, as it accounts for the between-subjects variability, and was calculated using the following formula: SD × (√(1 − ICC)) [25]. The following formula was used to calculate the CV for each variable of each leg in the five relative box heights: (SD(box jumps 1–3)/average(box jumps 1–3) × 100). The CV values were considered good (≤5%), moderate (5.1–10%), and poor/unacceptable (>10%) [26]. Inter-limb asymmetries for each box jump height were calculated based on the dominant limb (DL) and non-dominant limb (NDL) average values through the following bilateral asymmetry index-1 formula: (DL − NDL)/(DL + NDL) × 100 [27,28]. The negative and positive values indicated greater raw values and direction of asymmetry on the NDL and DL, respectively. Then, a series of one-way repeated measures ANOVA tests were used to test for significant differences in the mean scores of the performance variables for each limb across the five relative box heights. The follow-up analysis included Bonferroni post hoc comparisons. The Greenhouse–Geisser adjusted values were reported if the assumption of the sphericity was violated. The partial eta squared (ηp2) values were reported for the inter-asymmetry across the intensities of each performance variable. The effect sizes were considered small (0.01), medium (0.06), and large (0.14) [29]. Finally, the Kappa coefficients were calculated to determine the level of agreement between the asymmetries for each variable across the five relative intensities. The Kappa values were considered slight (0.00–0.20), fair (0.21–0.40), moderate (0.41–0.60), substantial (0.61–0.80), near perfect (0.81–0.99), and perfect (1.00) [30]. The data were reported as mean and standard deviation, and the alpha was set at p ≤ 0.05. All analyses were performed using IBM SPSS v.24 (IBM, New York, NY, USA).

4. Results

Excellent reliability was observed for the PF of both limbs and all box heights for the males and females, with ICC and CV values ranging from 0.96 to 0.99 and from 1.69 to 2.79%, respectively. Good to excellent reliability was observed for the PP, with ICC values ranging from 0.87 to 0.97 for the males and females. The males portrayed good to moderate CV values for all box heights of both limbs, with values ranging from 5.86 to 8.4%. The CV values for the females were moderate to poor, ranging from 6.09 to 11.70% with unacceptable CV values for the right leg at 0% (CV = 10.03%), left leg at 40% (CV = 10.09%), right leg at 60% (CV = 11.70%), and left leg at 80% (CV = 10.55%). Good to excellent reliability was observed in both groups for the RFD, with ICC values ranging from 0.76 to 0.97. However, the males and females portrayed poor RFD and CV values for both limbs at all box heights, with values ranging from 10.80 to 16.52%. Good to excellent reliability was observed for the ICC, and good to moderate values were observed for the CV for the TToff of both limbs and all box heights for the males and females, with ICC and CV values ranging from 0.77 to 0.95 and from 4.03 to 8.85%, respectively. All values are depicted in Table 1.
The descriptive data of the box jump performance and inter-limb asymmetry are depicted in Table 2 for the males and females. The results of the repeated measures one-way ANOVA tests indicate that there are no significant differences in the mean scores of any performance variable for the males across the intensities for each leg and inter-limb asymmetries. For the females, the repeated measures one-way ANOVA demonstrates a difference across the box heights in the PF for the left leg (F(4, 60) = 2.841, p = 0.032, ηp2 = 0.159) and right leg (F(4, 60 = 6.131, p < 0.001, ηp2 = 0.290). However, the post hoc analyses with Bonferroni adjustments revealed no statistically significant differences across the heights in the left leg (p > 0.05). In the right leg, the PF at 80% was significantly greater than the PF at 0% (31.30 N, 95% CI = 1.59–61.01, p = 0.035). The results of the repeated measures one-way ANOVA tests indicate that there were no other significant differences in the mean scores of the PP, RFD, and TToff for the females across the box heights by the leg and inter-limb asymmetries (p > 0.05).
The levels of agreement for the inter-limb asymmetry scores were calculated using the Kappa coefficient and are depicted in Table 3. Moderate to perfect levels of agreement (range of 0.57 to 1.00) were observed for the inter-limb asymmetries across the five box heights for the PF and PP for both groups. For the RFD inter-limb asymmetry, moderate to near perfect levels of agreement were observed for the females (range of 0.43 to 0.85), and slight to moderate levels of agreement (range 0.14 to 0.57) for the males. For the TToff inter-limb asymmetry, slight to substantial levels of agreement were observed (range of 0.13 to 0.75) across all heights for both groups.
Regarding the inter-limb asymmetry performance variables, no significant differences were observed across the box heights (p ≥ 0.25) (Table 4). For the males, a medium effect in the PF and PP and a small effect in the RFD and TToff were observed. For the females, a medium effect in the RFD and PP and a small effect in the PF and TToff were discovered. The effect sizes ranged from 0.01 to 0.09. Good to excellent reliability was observed in both groups for all performance variables, with the ICC values ranging from 0.83 to 0.99. The inter-limb asymmetry reliability and effect sizes for the males and females are depicted in Table 4. The individual inter-limb asymmetry values across the five relative box heights are depicted in Figure 1.

5. Discussion

The purpose of this study is to investigate the influence of the box height on inter-limb asymmetry for recreationally active individuals while performing box jumps. The main finding of the study is that the box height did not reveal inter-limb asymmetry as no significant differences were observed for the performance variables assessed. Additionally, all performance variables portrayed good to excellent relative reliability (i.e., ICC) for the males and females, whereas absolute reliability (i.e., %CV) was acceptable for the PF, PP (with a few exceptions for the female cohort), and TToff, but was unacceptable for the RFD in all relative heights for both the males and females.
Regarding the absolute reliability of the performance variables, the PF was the variable with the greatest reliability that resulted in little relative and absolute variability. This is primarily due to the fact that this metric is less affected by the technique variability or small adjustments in movement coordination during a sequence of jumps [15]. These results corroborate other studies that investigated the PF in bilateral jumps. For instance, Pérez-Castilla et al. [31] reported ICCs and CVs ranging from 0.64 to 0.73 and from 6.2 to 7.4% for the left and right leg, respectively, during bilateral standing broad jumps. Similarly, Janicijevic et al. [32] reported ICCs of 0.99 and CVs of 4.3–4.4% during bilateral CMJs. Interestingly, the relative reliability for the PP was acceptable across all heights for both the males and females; however, absolute reliability was acceptable among the males, but unacceptable for some relative heights in the female cohort. Although the comparison between the sexes was not made in the present study, the sex differences in the CMJ force–time characteristics may partially account for this discrepancy between the groups [23].
The absolute reliability for the RFD was unacceptable in both of the sexes for all of the box heights. This may be explained by the fact that the RFD is susceptible to variability in the jumping strategy [20,33], which may affect the force–time curve of the jumps. These findings indicate that when individuals adjust their bodies for jumping, there is some movement variability even when jumping at the same relative box height level. The findings of the current study are in line with those of other studies in the literature that include similar samples (i.e., physically active individuals) [20,34,35]. A factor that may explain this occurrence is the training status of the subjects. Since the subjects in the current study and from the previously mentioned studies are not experienced athletes, it can be assumed that the force–time curve of their jumps will portray more variability. However, this assumption may be flawed, since an unacceptable absolute reliability for the RFD was also observed during bilateral jumps in cohorts of experienced athletes [36,37]. In general, it seems that the variation between the trials may be more reflective of the sensitivity of the RFD measurement to the slight adjustments in joint angles to maintain movement coordination, which is unrelated to the training status of the individuals [20,33]. The unacceptable variability observed in the RFD measurements makes it impossible to differentiate between signal and noise and establish a meaningful or true change between the test sessions. Interestingly, the TToff portrayed acceptable relative and absolute reliability, which suggests that the variations observed in the previous variables (i.e., PP and RFD) may not significantly affect the overall duration of the jump. Given the supporting evidence [38], the RFD is not a suitable metric to use during dynamic jumping action assessment based on the variability of this measure. Consequently, the authors do not recommend the RFD to be used for assessing jump performance, as it may be difficult to determine if meaningful or true change occurs.
This is the first study investigating the effect of box height on box jump inter-limb asymmetry. When assessing inter-limb asymmetries, it is crucial to consider their magnitude and consistency of direction [14]. While there was some variation in the magnitude, most of the subjects portrayed a stable direction of asymmetries for all variables, suggesting that the inter-limb asymmetry remained consistent regardless of the box height (i.e., subjects kept favoring the same limb during all jumps). This assumption is confirmed by the fact that no significant inter-limb asymmetry differences across heights were observed for any of the variables. Furthermore, the Kappa coefficients pointed out high levels of agreement, including some perfect associations, across heights for both of the sexes, especially for the PF and PP. It is important to acknowledge that the Kappa coefficient eliminates the possibility that this agreement may have occurred by chance [11]. These substantial levels of agreement suggest consistency in the jumping strategy regardless of the box height. This lack of change in the existent inter-limb asymmetries due to the use of boxes of varied heights allows for strength and conditioning coaches to modify box heights in training programs with no additional risks that may arise with the augmentation of asymmetries. Furthermore, focusing on maximal effort jumps, regardless of the box height, appears to alleviate the need for taller boxes that may increase the risk of injury if an athlete is unable to successfully jump and land on top of the box. This is particularly important for practitioners working with novice athletes, as they can safely focus on jumping mechanics and proper technique in using various box heights.
Interestingly, a significant increase in force production with the highest box (80% of CMJ) was observed in the female cohort. Although not statistically significant, the females also achieved greater values for the PP and RFD during the highest box jump, but not the TToff, indicating that the overall jump duration was not modified. The same pattern was not seen in the male cohort. A plausible explanation for this phenomenon could be attributed to a “placebo effect”, resulting from the subjects’ awareness of jumping onto higher boxes. This may be due to the inexperience or lack of history of performing box jumps during fitness training. As aforementioned, all the subjects were reminded to jump as high as possible prior to all jumps, regardless of the box height. Also, the jump execution was qualitatively assessed by the testers and were deemed appropriate. This highlights the value of the utilization of force plates for jumping analyses, as minor body adjustments that may influence the overall performance may be imperceptible to the naked eye.
Although this was the first study to investigate the effect of the box height on inter-limb asymmetry, some limitations should be acknowledged. First, the current sample comprised recreationally active individuals with different sport and training backgrounds. Cohorts of trained individuals who perform the same primary activity/sport (i.e., more homogeneous) may reveal specific differences in how the box height affects the inter-limb asymmetries for that group. The squat depth during the countermovement portion of the box jump was not controlled. It was suggested that a higher reliability across trials may be achieved when the squat depth is controlled [32]. By changing the CMJ depth, the individuals’ natural movement may be affected and, as consequence, impact the overall performance [23]. Even though this can be seen as a limitation, it should be noted that when comparing the same variable (i.e., PF) the single-leg and inter-limb asymmetry reliability across jumps in the current study were very similar to the ones presented by Janicijevic et al., in which the squat depth was controlled [32]. The arm swing executed by the subjects prior to each jump may have influenced the variance seen in some of the trials. However, as mentioned before, the arm swing is a fundamental part of performing a box jump as it allows the subject to coordinate the landing portion of the jump. Since this study employed a within-session design, it is unclear whether the asymmetries would remain stable between sessions. The inclusion of a between-session analysis may confirm the stability of the asymmetries [2]. Lastly, the boxes used in this study were set at a height of no greater than 80% of the subjects’ maximal vertical jump height. It is uncertain as to whether boxes of greater heights would affect the jump strategy utilized to perform this exercise. Future studies should be conducted to determine if box jump heights measuring greater than 80% of the maximal vertical jump height influence the jump strategy and inter-limb asymmetries.

6. Conclusions

This study shows that the height of the box during box jumps does not affect the overall inter-limb asymmetries in recreationally active males and females performing jumps at maximal effort. When including box jumps in a training program for less-experienced individuals, it is recommended to use box heights that are relative to their CMJ maximal height, as the reliability of power and strength performance variables remain unaffected at heights of up to at least 80% of their maximal CMJ height. As seen in the present study, boxes set to greater heights may induce a psychological effect, prompting the subjects to perform jumps at maximal effort, while maintaining proper form. In addition, higher box heights contribute to less eccentric stress upon landing. This can be used to teach novice athletes how to absorb and control the impact of landing, while improving their balance and reducing the risk of injury. However, future research should aim to determine the maximal box height one can use without sacrificing safety or significantly altering the jump strategy to achieve the task.

Author Contributions

Conceptualization, M.L.d.S. and J.D.; methodology, M.L.d.S. and J.D.; software, M.L.d.S.; validation, M.L.d.S.; formal analysis, M.L.d.S. and J.D.; investigation, M.L.d.S. and J.D.; resources, M.L.d.S., J.S., O.A. and J.D.; data curation, M.L.d.S.; writing—original draft preparation, M.L.d.S. and J.D.; writing—review and editing, M.L.d.S., R.B., J.S., C.B., T.D.-M., O.A. and J.D.; visualization, M.L.d.S. and J.D.; supervision, J.D.; project administration, J.D.; funding acquisition, not applicable. All authors have read and agreed to the published version of the manuscript.

Funding

This research received no external funding.

Institutional Review Board Statement

The study was conducted in accordance with the Declaration of Helsinki, and approved by the Institutional Review Board of Oklahoma State University (IRB-21-343).

Informed Consent Statement

Informed consent was obtained from all subjects involved in the study.

Data Availability Statement

The data presented in this study are available upon request from the corresponding author. The data are not publicly available due to ethical and privacy issues.

Conflicts of Interest

The authors declare no conflict of interest.

References

  1. Bishop, C.; Read, P.; Chavda, S.; Turner, A. Asymmetries of the lower limb: The calculation conundrum in strength training and conditioning. Strength Cond. J. 2016, 38, 27–32. [Google Scholar] [CrossRef] [Green Version]
  2. Bishop, C.; Turner, A.; Read, P. Effects of inter-limb asymmetries on physical and sports performance: A systematic review. J. Sport. Sci. 2018, 36, 1135–1144. [Google Scholar] [CrossRef] [PubMed] [Green Version]
  3. Bell, D.R.; Sanfilippo, J.L.; Binkley, N.; Heiderscheit, B.C. Lean mass asymmetry influences force and power asymmetry during jumping in collegiate athletes. J. Strength Cond. Res. 2014, 28, 884–891. [Google Scholar] [CrossRef] [PubMed] [Green Version]
  4. Bishop, C.; Brashill, C.; Abbott, W.; Read, P.; Lake, J.; Turner, A. Jumping asymmetries are associated with speed, change of direction speed, and jump performance in elite academy soccer players. J. Strength Cond. Res. 2021, 35, 1841–1847. [Google Scholar] [CrossRef] [PubMed]
  5. Bishop, C.; Read, P.; McCubbine, J.; Turner, A. Vertical and horizontal asymmetries are related to slower sprinting and jump performance in elite youth female soccer players. J. Strength Cond. Res. 2021, 35, 56–63. [Google Scholar] [CrossRef] [Green Version]
  6. Madruga-Parera, M.; Bishop, C.; Read, P.; Lake, J.; Brazier, J.; Romero-Rodriguez, D. Jumping-based asymmetries are negatively associated with jump, change of direction, and repeated sprint performance, but not linear speed, in adolescent handball athletes. J. Hum. Kinet. 2020, 71, 47–58. [Google Scholar] [CrossRef] [PubMed] [Green Version]
  7. Maloney, S.J.; Richards, J.; Nixon, D.G.; Harvey, L.J.; Fletcher, I.M. Do stiffness and asymmetries predict change of direction performance? J. Sport. Sci. 2017, 35, 547–556. [Google Scholar] [CrossRef] [Green Version]
  8. Lockie, R.G.; Callaghan, S.J.; Berry, S.P.; Cooke, E.R.; Jordan, C.A.; Luczo, T.M.; Jeffriess, M.D. Relationship between unilateral jumping ability and asymmetry on multidirectional speed in team-sport athletes. J. Strength Cond. Res. 2014, 28, 3557–3566. [Google Scholar] [CrossRef] [Green Version]
  9. Hart, N.H.; Nimphius, S.; Weber, J.; Spiteri, T.; Rantalainen, T.; Dobbin, M.; Newton, R. Musculoskeletal asymmetry in football athletes: A product of limb function over time. Med. Sci. Sport. Exerc. 2016, 48, 1379–1387. [Google Scholar] [CrossRef]
  10. Bazyler, C.; Bailey, C.; Chiang, C.; Sato, K.; Stone, M. The effects of strength training on isometric force production symmetry in recreationally trained males. J. Trainol. 2014, 3, 6–10. [Google Scholar] [CrossRef] [Green Version]
  11. Bishop, C.; Lake, J.; Loturco, I.; Papadopoulos, K.; Turner, A.; Read, P. Interlimb asymmetries: The need for an individual approach to data analysis. J. Strength Cond. Res. 2021, 35, 695–701. [Google Scholar] [CrossRef] [PubMed]
  12. Sands, W.A.; Wurth, J.J.; Hewit, J.K. Basics of Strength and Conditioning Manual; National Strength and Conditioning Association: Colorado Springs, CO, USA, 2012. [Google Scholar]
  13. Koefoed, N.; Dam, S.; Kersting, U.G. Effect of box height on box jump performance in elite female handball players. J. Strength Cond. Res. 2022, 36, 508–512. [Google Scholar] [CrossRef] [PubMed]
  14. Virgile, A.; Bishop, C. A narrative review of limb dominance: Task specificity and the importance of fitness testing. J. Strength Cond. Res. 2021, 35, 846–858. [Google Scholar] [CrossRef]
  15. Cormack, S.J.; Newton, R.U.; McGuigan, M.R.; Doyle, T.L. Reliability of measures obtained during single and repeated countermovement jumps. Int. J. Sport. Physiol. Perform. 2008, 3, 131–144. [Google Scholar] [CrossRef] [PubMed] [Green Version]
  16. World Medical Association. World Medical Association Declaration of Helsinki: Ethical principles for medical research involving human subjects. JAMA 2013, 310, 2191–2194. [Google Scholar] [CrossRef] [Green Version]
  17. McMahon, J.; Suchomel, T.; Lake, J.; Comfort, P. Understanding the key phases of the countermovement jump force-time curve. Strength Cond. J. 2018, 40, 96–106. [Google Scholar] [CrossRef] [Green Version]
  18. Chavda, S.; Bromley, T.; Jarvis, P.; Williams, S.; Bishop, C.; Turner, A.; Lake, J.P.; Mundy, P.D. Force-time characteristics of the countermovement jump: Analyzing the curve in excel. Strength Cond. J. 2018, 40, 67–77. [Google Scholar] [CrossRef] [Green Version]
  19. Kibele, A. Possibilities and limitations in the biomechanical analysis of countermovement Jumps: A methodological study. J. Appl. Biomech. 1998, 14, 105–117. [Google Scholar] [CrossRef] [Green Version]
  20. Mizuguchi, S.; Sands, W.A.; Wassinger, C.A.; Lamont, H.S.; Stone, M.H. A new approach to determining net impulse and identification of its characteristics in countermovement jumping: Reliability and validity. Sport. Biomech. 2015, 14, 258–272. [Google Scholar] [CrossRef]
  21. Suchomel, T.J.; Bailey, C.A.; Sole, C.J.; Grazer, J.L.; Beckham, G.K. Using reactive strength index-modified as an explosive performance measurement tool in Division I athletes. J. Strength Cond. Res. 2015, 29, 899–904. [Google Scholar] [CrossRef] [Green Version]
  22. Owen, N.J.; Watkins, J.; Kilduff, L.P.; Bevan, H.R.; Bennett, M.A. Development of a criterion method to determine peak mechanical power output in a countermovement jump. J. Strength Cond. Res. 2014, 28, 1552–1558. [Google Scholar] [CrossRef] [PubMed] [Green Version]
  23. McMahon, J.; Rej, S.J.E.; Comfort, P. Sex differences in countermovement jump phase characteristics. Sports 2017, 5, 8. [Google Scholar] [CrossRef] [Green Version]
  24. Hopkins, W.G. Measures of reliability in sports medicine and science. Sport. Med. 2000, 30, 1–15. [Google Scholar] [CrossRef] [PubMed] [Green Version]
  25. Koo, T.K.; Li, M.Y. A guideline of selecting and reporting intraclass correlation coefficients for reliability research. J. Chiropr. Med. 2016, 15, 155–163. [Google Scholar] [CrossRef] [PubMed] [Green Version]
  26. Banyard, H.G.; Nosaka, K.; Haff, G.G. Reliability and validity of the load-velocity relationship to predict the 1RM back squat. J. Strength Cond. Res. 2017, 31, 1897–1904. [Google Scholar] [CrossRef]
  27. Kobayashi, Y.; Kubo, J.; Matsubayashi, T.; Matsuo, A.; Kobayashi, K.; Ishii, N. Relationship between bilateral differences in single-leg jumps and asymmetry in isokinetic knee strength. J. Appl. Biomech. 2013, 29, 61–67. [Google Scholar] [CrossRef] [PubMed] [Green Version]
  28. Bishop, C.; Read, P.; Lake, J.; Chavda, S.; Turner, A. Interlimb asymmetries: Understanding how to calculate differences from bilateral and unilateral tests. Strength Cond. J. 2018, 40, 1–6. [Google Scholar] [CrossRef] [Green Version]
  29. Cohen, J. Statistical Power Analysis for the Behavioral Sciences; Academic Press: Cambridge, MA, USA, 2013. [Google Scholar]
  30. Viera, A.J.; Garrett, J.M. Understanding interobserver agreement: The kappa statistic. Fam. Med. 2005, 37, 360–363. [Google Scholar]
  31. Perez-Castilla, A.; Garcia-Ramos, A.; Janicijevic, D.; Miras-Moreno, S.; De la Cruz, J.C.; Rojas, F.J.; Cepero, M. Unilateral or bilateral standing broad jumps: Which jump type provides inter-limb asymmetries with a higher reliability? J. Sport. Sci. Med. 2021, 20, 317–327. [Google Scholar] [CrossRef]
  32. Janicijevic, D.; Sarabon, N.; Perez-Castilla, A.; Smajla, D.; Fernandez-Revelles, A.; Garcia-Ramos, A. Single-leg mechanical performance and inter-leg asymmetries during bilateral countermovement jumps: A comparison of different calculation methods. Gait Posture 2022, 96, 47–52. [Google Scholar] [CrossRef]
  33. Bradshaw, E.J.; Maulder, P.S.; Keogh, J.W. Biological movement variability during the sprint start: Performance enhancement or hindrance? Sport. Biomech. 2007, 6, 246–260. [Google Scholar] [CrossRef] [PubMed]
  34. Moir, G.L.; Garcia, A.; Dwyer, G.B. Intersession reliability of kinematic and kinetic variables during vertical jumps in men and women. Int. J. Sport. Physiol. Perform. 2009, 4, 317–330. [Google Scholar] [CrossRef] [PubMed] [Green Version]
  35. McLellan, C.P.; Lovell, D.I.; Gass, G.C. The role of rate of force development on vertical jump performance. J. Strength Cond. Res. 2011, 25, 379–385. [Google Scholar] [CrossRef] [PubMed]
  36. Taylor, K.L.; Cronin, J.; Gill, N.D.; Chapman, D.W.; Sheppard, J. Sources of variability in iso-inertial jump assessments. Int. J. Sport. Physiol. Perform. 2010, 5, 546–558. [Google Scholar] [CrossRef] [PubMed] [Green Version]
  37. Marques, M.C.; Izquierdo, M.; Marinho, D.A.; Barbosa, T.M.; Ferraz, R.; Gonzalez-Badillo, J.J. Association between force-time curve characteristics and vertical jump performance in trained athletes. J. Strength Cond. Res. 2015, 29, 2045–2049. [Google Scholar] [CrossRef]
  38. Merrigan, J.J.; Stone, J.D.; Hornsby, W.G.; Hagen, J.A. Identifying reliable and relatable force-time metrics in athletes-considerations for the isometric mid-thigh pull and countermovement jump. Sports 2020, 9, 4. [Google Scholar] [CrossRef]
Figure 1. Individual inter-limb asymmetry values across the five heights for males (A) and females (B). Positive and negative values denote dominant and non-dominant limbs, respectively.
Symmetry 15 01359 g001
Table 1. Box jump reliability of performance variables of male and female subjects.
VariablesMales (n = 14) Females (n = 16)
NDLDL NDLDL
% of CMJICC
(95% CI)
%CVSEMICC
(95% IC)
%CVSEM % of CMJICC
(95% CI)
%CVSEMICC
(95% IC)
%CVSEM
Peak force (N)0%0.99
(0.98–0.99)
2.2219.50.99
(0.98–0.99)
2.0419.2 0%0.98
(0.96–0.99)
2.4617.60.98
(0.95–0.99)
2.7216.3
20%0.99
(0.96–0.99)
2.5718.10.99
(0.97–0.99)
2.2818.1 20%0.98
(0.96–0.99)
2.4817.90.97
(0.94–0.99)
2.2218.2
40%0.98
(0.96–0.99)
2.5825.20.99
(0.97–0.99)
2.5418.3 40%0.97
(0.93–0.99)
3.2920.00.98
(0.95–0.99)
2.5714.3
60%0.98
(0.96–0.99)
2.5423.30.99
(0.96–0.99)
2.3716.8 60%0.99
(0.98–0.99)
1.6912.60.96
(0.92–0.99)
2.7921.3
80%0.98
(0.96–0.99)
2.3724.00.99
(0.98–0.99)
1.8817.6 80%0.98
(0.96–0.99)
2.5417.20.98
(0.95–0.99)
2.4716.1
Peak power (W)0%0.95
(0.88–0.98)
7.30175.50.97
(0.92–0.99)
6.15128.5 0%0.96
(0.91–0.99)
6.0992.10.95
(0.86–0.98)
10.03111.5
20%0.95
(0.88–0.98)
8.41168.20.93
(0.82–0.97)
8.14180.1 20%0.95
(0.88–0.98)
9.18106.80.95
(0.87–0.98)
9.60107.1
40%0.95
(0.88–0.98)
7.76168.20.96
(0.89–0.98)
6.89148.1 40%0.87
(0.69–0.95)
10.09150.10.92
(0.81–0.97)
9.22124.9
60%0.97
(0.93–0.99)
6.29122.60.96
(0.91–0.99)
5.86130.6 60%0.93
(0.83–0.97)
9.01114.30.91
(0.80–0.97)
11.70147.7
80%0.96
(0.89–0.98)
7.19141.50.97
(0.92–0.99)
5.94123.7 80%0.93
(0.83–0.97)
10.55126.90.92
(0.83–0.97)
10.00153.5
RFD (N·s–1)0%0.97
(0.92–0.99)
12.76244.20.93
(0.82–0.98)
14.89323.5 0%0.79
(0.52–0.92)
13.76432.10.77
(0.47–0.91)
12.48271.8
20%0.93
(0.83–0.98)
10.99251.70.90
(0.76–0.97)
14.77304.5 20%0.76
(0.44–0.91)
14.65530.90.85
(0.60–0.95)
14.98175.4
40%0.87
(0.69–0.96)
11.95313.90.85
(0.63–0.95)
12.75380.8 40%0.92
(0.82–0.97)
13.26263.10.87
(0.63–0.96)
16.52142.6
60%0.93
(0.82–0.98)
12.33279.70.91
(0.78–0.97)
10.80343.1 60%0.93
(0.84–0.97)
16.43258.50.89
(0.74–0.96)
14.47214.3
80%0.90
(0.77–0.97)
11.55290.00.94
(0.86–0.98)
11.28256.4 80%0.91
(0.76–0.97)
15.11284.60.75
(0.43–0.90)
15.03341.7
TToff (s)0%0.90
(0.77–0.97)
4.390.030.83
(0.60–0.94)
6.440.05 0%0.89
(0.75–0.96)
6.860.050.92
(0.82–0.97)
6.890.05
20%0.92
(0.81–0.97)
4.790.030.94
(0.85–0.98)
4.050.03 20%0.89
(0.74–0.96)
6.290.050.85
(0.64–0.94)
6.690.07
40%0.91
(0.79–0.97)
4.030.030.91
(0.79–0.97)
4.440.04 40%0.77
(0.45–0.92)
6.560.050.88
(0.73–0.95)
5.550.04
60%0.88
(0.70–0.96)
4.830.050.94
(0.84–0.98)
5.350.04 60%0.94
(0.86–0.98)
4.930.030.91
(0.79–0.97)
6.390.05
80%0.92
(0.81–0.97)
4.270.030.95
(0.87–0.98)
3.840.03 80%0.89
(0.75–0.96)
6.430.050.84
(0.64–0.94)
8.850.07
NDL: non-dominant limb; DL: dominant limb; CMJ: countermovement jump; ICC: intraclass correlation coefficient; CV: coefficient of variation; SEM: standard error of measurement; RFD: rate of force development; TToff: time to take-off; CI: confidence interval. Bold numbers denote unacceptable reliability (CV > 10%).
Table 2. Box jump performance variables and inter-limb asymmetries of male and female subjects.
VariableMales (n = 14) Females (n = 16)
% of CMJNDLDLIA (%) % of CMJNDLDLIA (%)
PF (N)0%1055.9 ± 195.31057.1 ± 192.30.15 ± 2.81 0%747.3 ± 124.2729.6 ± 115.2−0.37 ± 3.44
20%1033.0 ± 181.41039.7 ± 181.40.26 ± 3.16 20%742.2 ± 126.3724.7 ± 104.8−0.20 ± 3.34
40%1063.9 ± 178.11074.4 ± 182.50.59 ± 3.14 40%739.8 ± 115.6728.5 ± 100.9−0.22 ± 3.02
60%1059.9 ± 164.91067.6 ± 167.80.78 ± 2.87 60%755.6 ± 125.6743.2 ± 106.6−0.26 ± 3.17
80%1053.9 ± 169.61061.1 ± 175.80.31 ± 3.08 80%766.9 ± 121.8760.9 ± 113.5 *0.08 ± 3.30
PP (W)0%2553.8 ± 784.82653.9 ± 742.0−0.18 ± 16.7 0%1532.5 ± 460.51419.5 ± 498.6−2.02 ± 27.9
20%2520.1 ± 752.32576.4 ± 680.6−0.19 ± 16.7 20%1465.5 ± 477.61440.5 ± 478.82.28 ± 29.7
40%2529.2 ± 752.32667.9 ± 740.52.93 ± 18.3 40%1517.8 ± 416.21405.6 ± 441.7−3.62 ± 25.5
60%2444.0 ± 708.12646.8 ± 653.11.86 ± 16.7 60%1533.3 ± 431.91466.3 ± 492.40.14 ± 26.5
80%2527.3 ± 707.42574.2 ± 714.2−0.90 ± 17.3 80%1548.4 ± 479.61509.1 ± 542.71.59 ± 31.0
RFD (N·s−1)0%2333.4 ± 1409.92215.5 ± 1222.6−4.60 ± 12.4 0%1840.2 ± 943.01314.1 ± 566.7−8.70 ± 27.2
20%2088.8 ± 951.32082.6 ± 962.9−1.28 ± 20.1 20%1849.6 ± 1083.71261.4 ± 453.0−5.21 ± 24.2
40%2108.1 ± 870.62028.2 ± 983.1−3.46 ± 14.1 40%1629.2 ± 930.21255.0 ± 395.4−1.96 ± 24.2
60%2310.8 ± 1057.22139.6 ± 1143.5−7.57 ± 17.2 60%1737.1 ± 977.11452.2 ± 646.2−2.32 ± 19.7
80%2388.9 ± 917.22191.2 ± 1046.6−4.88 ± 11.6 80%2072.8 ± 948.71535.2 ± 683.3−9.02 ± 24.5
TToff (s)0%0.93 ± 0.110.94 ± 0.13−0.12 ± 3.09 0%0.86 ± 0.150.85 ± 0.16−0.85 ± 4.63
20%0.93 ± 0.120.94 ± 0.13−0.45 ± 2.76 20%0.88 ± 0.160.87 ± 0.17−0.27 ± 4.31
40%0.89 ± 0.100.91 ± 0.120.06 ± 3.37 40%0.88 ± 0.110.90 ± 0.110.07 ± 5.10
60%0.91 ± 0.130.92 ± 0.15−0.31 ± 3.18 60%0.86 ± 0.130.86 ± 0.15−0.34 ± 4.07
80%0.90 ± 0.110.92 ± 0.13−0.19 ± 4.41 80%0.88 ± 0.150.88 ± 0.18−0.29 ± 3.78
NDL: non-dominant limb; DL: dominant limb; CMJ: countermovement jump; RFD: rate of force development; TToff: time to take-off; IA: inter-limb asymmetry. * Significantly different from 0%.
Table 3. Kappa coefficient values for performance variables in males (bottom left) and females (top right).
0% CMJ20% CMJ40% CMJ60% CMJ80% CMJ
Peak Force0% CMJ10.730.8710.87
20% CMJ0.5710.610.730.61
40% CMJ0.57110.870.75
60% CMJ0.720.860.8610.87
80% CMJ0.720.860.8611
Peak Power0% CMJ10.8710.870.75
20% CMJ0.8610.8710.88
40% CMJ0.720.8610.870.75
60% CMJ0.860.710.5710.88
80% CMJ0.710.860.720.571
RFD0% CMJ10.590.590.590.85
20% CMJ0.57110.470.43
40% CMJ0.290.4310.470.43
60% CMJ0.510.430.4310.43
80% CMJ0.510.430.140.381
TToff0% CMJ10.630.240.750.24
20% CMJ0.5510.380.630.13
40% CMJ0.380.2610.510.49
60% CMJ0.380.550.1010.51
80% CMJ0.550.710.100.551
CMJ: countermovement jump; RFD: rate of force development; TToff: time to take-off.
Table 4. Reliability (ICC (95% CI) and effect sizes of inter-limb asymmetry of performance variables during box jumps performed at 0, 20, 40, 60, and 80% of CMJ.
VariableMales (n = 14) Females (n = 16)
ICCpηp2 ICCpηp2
Peak force (N)0.98
(0.96–0.99)
0.330.08 0.99
(0.97–0.99)
0.600.04
Peak power (W)0.98
(0.96–0.99)
0.280.09 0.98
(0.96–0.99)
0.250.09
RFD (N·s−1)0.86
(0.70–0.95)
0.600.05 0.94
(0.88–0.98)
0.290.08
TToff (s)0.91
(0.80–0.97)
0.970.01 0.83
(0.65–0.93)
0.950.01
ICC: intraclass correlation coefficient; CI: confidence interval; ηp2 = partial eta squared; RFD: rate of force development; TToff: time to take-off; CMJ: countermovement jump.
Disclaimer/Publisher’s Note: The statements, opinions and data contained in all publications are solely those of the individual author(s) and contributor(s) and not of MDPI and/or the editor(s). MDPI and/or the editor(s) disclaim responsibility for any injury to people or property resulting from any ideas, methods, instructions or products referred to in the content.

