Article

Mechanical Asymmetries during Treadmill Running: Effects of Running Velocity and Hypoxic Exposure

1
Division of Research and Innovation, National Sports Institute of Malaysia, Kuala Lumpur 57000, Malaysia
2
Sport and Exercise Medicine Group, Swinburne University of Technology, Melbourne 3122, Australia
3
Division of Sports Performance, National Sports Institute of Malaysia, Kuala Lumpur 57000, Malaysia
4
Department of Physical Education and Sports Science, Visva-Bharati University, Santiniketan 731235, India
5
School of Human Sciences (Exercise and Sport Science), The University of Western Australia, Perth 6009, Australia
*
Author to whom correspondence should be addressed.
Symmetry 2023, 15(7), 1303; https://doi.org/10.3390/sym15071303
Submission received: 23 May 2023 / Revised: 14 June 2023 / Accepted: 20 June 2023 / Published: 23 June 2023
(This article belongs to the Special Issue Biology and Symmetry/Asymmetry:Feature Papers 2022)

Abstract

:
Studies evaluating mechanical asymmetry across a range of running velocities during treadmill runs have yielded inconsistent findings, while the impact of additional hypoxic exposure has never been investigated. The aim of this study was to characterize the effects of manipulating running velocity and hypoxic exposure on gait asymmetry during treadmill running. Eleven trained individuals performed seven runs at different velocities (8, 10, 12, 14, 16, 18, and 20 km·h−1) in a randomized order, each lasting 45 s. The running took place on an instrumented treadmill for normoxia (FiO2 = 20.9%), moderate hypoxia (FiO2 = 16.1%), high hypoxia (FiO2 = 14.1%), and severe hypoxia (FiO2 = 13.0%). Vertical and antero-posterior ground reaction force recordings over 20 consecutive steps (i.e., after running ∼25 s) allowed the measurement of running mechanics. Lower-limb asymmetry was assessed from the ‘symmetry angle’ (SA) score. Two-way repeated-measures ANOVA (seven velocities × four conditions) was used. There was no significant difference in SA scores for any of the biomechanical variables for velocity (except contact time and braking phase duration; p = 0.003 and p = 0.002, respectively), condition, or interaction. Mean SA scores varied between ∼1% and 2% for contact time (1.5 ± 0.8%), flight time (1.6 ± 0.6%), step length (0.8 ± 0.2%), peak vertical force (1.2 ± 0.5%), and mean vertical loading rate (2.1 ± 1.0%). Mean SA scores ranged from ∼2% to 5% for duration of braking (1.6 ± 0.7%) and push-off phases (1.9 ± 0.6%), as well as peak braking (5.0 ± 1.9%) and push-off forces (4.8 ± 1.7%). In conclusion, the trained runners exhibited relatively even strides, with mechanical asymmetries remaining low-to-moderate across a range of submaximal, constant running velocities (ranging from 8 to 20 km·h−1) and varying levels of hypoxia severity (between normoxia and severe hypoxia).

1. Introduction

Humans may not achieve a perfectly symmetrical gait due to leg dominance, resulting in asymmetry owing to various factors, including strength imbalances, leg-length discrepancies, and previous injuries or surgeries [1]. External factors, such as custom foot orthotics, can minimize imbalances in the frontal-plane hip-joint moment when worn bilaterally [2]. Conversely, unilateral muscle biopsy can increase bilateral leg differences for selected stride kinematics and spring–mass characteristics [3]. Varying running velocity can also affect gait asymmetry, as it may require alterations in gait patterns for balance and stability, leading to differences between the left and right sides of the body.
Numerous researchers have examined how manipulating running velocity affects lower-limb biomechanical asymmetry. However, it is worth noting that the majority of this knowledge is derived from clinical populations with unilateral muscle weaknesses. Mixed findings have been reported, with evidence of increased (e.g., ACL reconstruction [4]), unchanged (i.e., children with cerebral palsy [5] and adults with osteoarthritis [6]), and even decreased (i.e., older adults with unilateral stroke [7] and prosthetic walkers [8]) outcomes. In apparently uninjured athletes, ground reaction force (GRF) symmetries are generally maintained across a range of running velocities [9,10]. However, some evidence shows that competitive runners exhibit more symmetrical running at fast velocities for certain mechanical parameters (e.g., flight time and mean vertical loading rate) but not for most of them [11]. A limitation of these studies is that they typically consider a narrow range of running velocities (e.g., 8–12 km·h−1 [12], 10–14 km·h−1 [13], or 11–14 km·h−1 [10]). By evaluating mechanical asymmetry across a wide spectrum of running velocities, we can gain further insight into how manipulating belt speed influences GRF asymmetry during treadmill runs.
Acute hypoxic exposure during exercise can increase physiological stress, particularly when running at faster velocities as compared with exercising in normal oxygen conditions [14]. However, there is little research on the impact of hypoxia on GRF patterns and gait asymmetries. In one study, the effects of hypoxia exposure (inspired oxygen fraction (FiO2) = 0.15) on biomechanical asymmetry in 19 trained runners who completed perceptually regulated exercise bouts (4 × 4 min treadmill runs; rest = 3 min) at a perceived rating of exertion of 16 on the 6–20 Borg scale were examined [15]. The study found that hypoxic exposure did not affect biomechanical asymmetry, which remained consistent both between and within intervals at an averaged controlled velocity of ~15 km·h−1. Nonetheless, when combined with faster running velocities (i.e., up to 20 km·h−1) and more severe levels of hypoxia (i.e., those typically used in simulated altitude training (FiO2 = 0.13)), there may be more noticeable asymmetry adjustments. It is important to measure GRF directly to confirm that running mechanics adjustments during treadmill runs with graded hypoxia are not different between the body sides.
The majority of asymmetry studies on athletes have focused on vertical GRF data [1], and little attention has been given to antero-posterior GRF assessment in the literature [16]. This is unexpected, since a more pronounced forward-oriented asymmetrical response is typically considered a biomechanical characteristic of fast running (i.e., single sprints [17] or repeated running sprints [18]). In well-trained runners, for instance, during repeated treadmill sprints (8 × 5 s sprints with 25 s of rest), braking GRF asymmetries for phase duration and peak force values were twice as large as push-off GRFs [19]. Therefore, it is necessary to conduct a more comprehensive investigation of the antero-posterior GRF during running with varying degrees of hypoxic exposure to determine how running velocity affects braking and push-off phase asymmetries.
The aim of this study was to investigate the impact of varying running velocity and hypoxic exposure on stride mechanical asymmetries (i.e., phase duration and peak forces) during treadmill running. We hypothesized that there would be greater asymmetries in horizontally derived variables compared with vertically derived ones and that there would be minimal changes in asymmetries across different running velocities, with no additional effect of hypoxic exposure.

2. Materials and Methods

2.1. Participants

Eleven male distance runners (means ± SDs: age, 25.4 ± 6.2 years; body height, 168.3 ± 5.0 cm; and body mass, 58.5 ± 3.6 kg), who were categorized as ‘Trained/Developmental’ (Tier 1) based on established criteria [20], were recruited. They were born and raised near sea level (<1000 m) and had not travelled to altitude (>1000 m) in the 3 months prior to the study. The study was approved by the Human Research Ethics Committee of the National Sports Institute of Malaysia (ISNRE/A/006/2020-001/2020) and conducted in accordance with the Declaration of Helsinki, with written informed consent obtained from the participants.

2.2. Procedures

The experimental design and the main exercise (i.e., arterial oxygen saturation and exercise-related sensations) and running mechanical responses to the study have been previously reported [21]. On separate days, the participants visited the laboratory five times, all at the same time of day. The first session involved familiarizing the participants with the study procedures. The participants then completed four experimental trials, with each separated by at least 72 h. During each visit, the participants executed a standardized warm-up protocol. This warm-up included 5 min of running at 8 km·h−1, followed by 1 min at 12 and 15 km·h−1, and two habituation runs of ∼20 s at 20 km·h−1 in normoxia. Afterward, the participants performed seven runs at different velocities (8, 10, 12, 14, 16, 18, and 20 km·h−1) in a randomized order, with each run lasting 45 s. Before each run, there was a 120 s period of breathing the gas mixture at rest, and each run was separated by 135 s of passive recovery in normoxia [21]. The participants performed the runs in four different conditions: (i) normoxia near sea level (FiO2 = 20.9%), (ii) moderate hypoxia (FiO2 = 16.1%, corresponding to a simulated altitude of ∼2000 m), (iii) high hypoxia (FiO2 = 14.1%, ∼3000 m), and (iv) severe hypoxia (FiO2 = 13.0%, ∼3500 m). The order of the interventions was also randomized.
The participants were equipped with a facemask that was connected to a hypoxic generator (HYP 123, Hypoxico Altitude Training Systems, Gardiner, NY, USA) via corrugated plastic tubing. The hypoxic generator was set to a simulated altitude of approximately 100 m to enhance the blinding effect during the normoxic condition. The participants were instructed to maintain their normal diets and daily routines throughout the experimental period, avoid high-intensity training for 48 h, and abstain from alcohol and caffeine for 24 h prior to all the trials. To maintain euhydration, the participants were advised to drink 4–6 mL of water per kilogram of body weight every 2.5 h on the day before each experimental session, although this was not quantified. Only the participants were blinded to the hypoxic generator’s readings, not the investigators.

2.3. Running Mechanics

The participants ran on a dual-belt instrumented treadmill (Bertec, Columbus, OH, USA), set at 0° incline, located in an indoor facility (∼24 °C and 67 ± 3% relative humidity). Vertical and anterior–posterior GRFs were recorded at a sampling rate of 500 Hz. The force-plate data were filtered using a fourth-order, zero-phase, low-pass Butterworth filter with a cut-off frequency of 20 Hz. A total of twenty consecutive steps, consisting of ten right- and ten left-leg foot contacts, were recorded, starting from the 25th second of each 45 s running bout. Spatio-temporal variables, including contact time, flight time, and step length, were calculated. Peak braking and push-off forces, expressed as a fraction of body weight, were determined along with the duration of braking and push-off phases (in seconds). Finally, the vertical mean loading rate was calculated by taking the mean value of the time derivative of the vertical force signal within the first 50 ms of the support phase.

2.4. Symmetry Angle

For each participant, inter-leg symmetry was measured using the symmetry angle (SA) equation [22]:
Symmetry angle (SA) =
45 ° t a n 1 l e f t r i g h t 90 ° × 100
but   if
45 ° t a n 1 l e f t r i g h t > 90 °
then
45 ° t a n 1 l e f t r i g h t 180 ° 90 ° × 100
The SA is an arctan function of the ratio of two bilateral values, where an SA score of 0% indicates perfect symmetry and 100% indicates perfect asymmetry.

2.5. Statistical Analysis
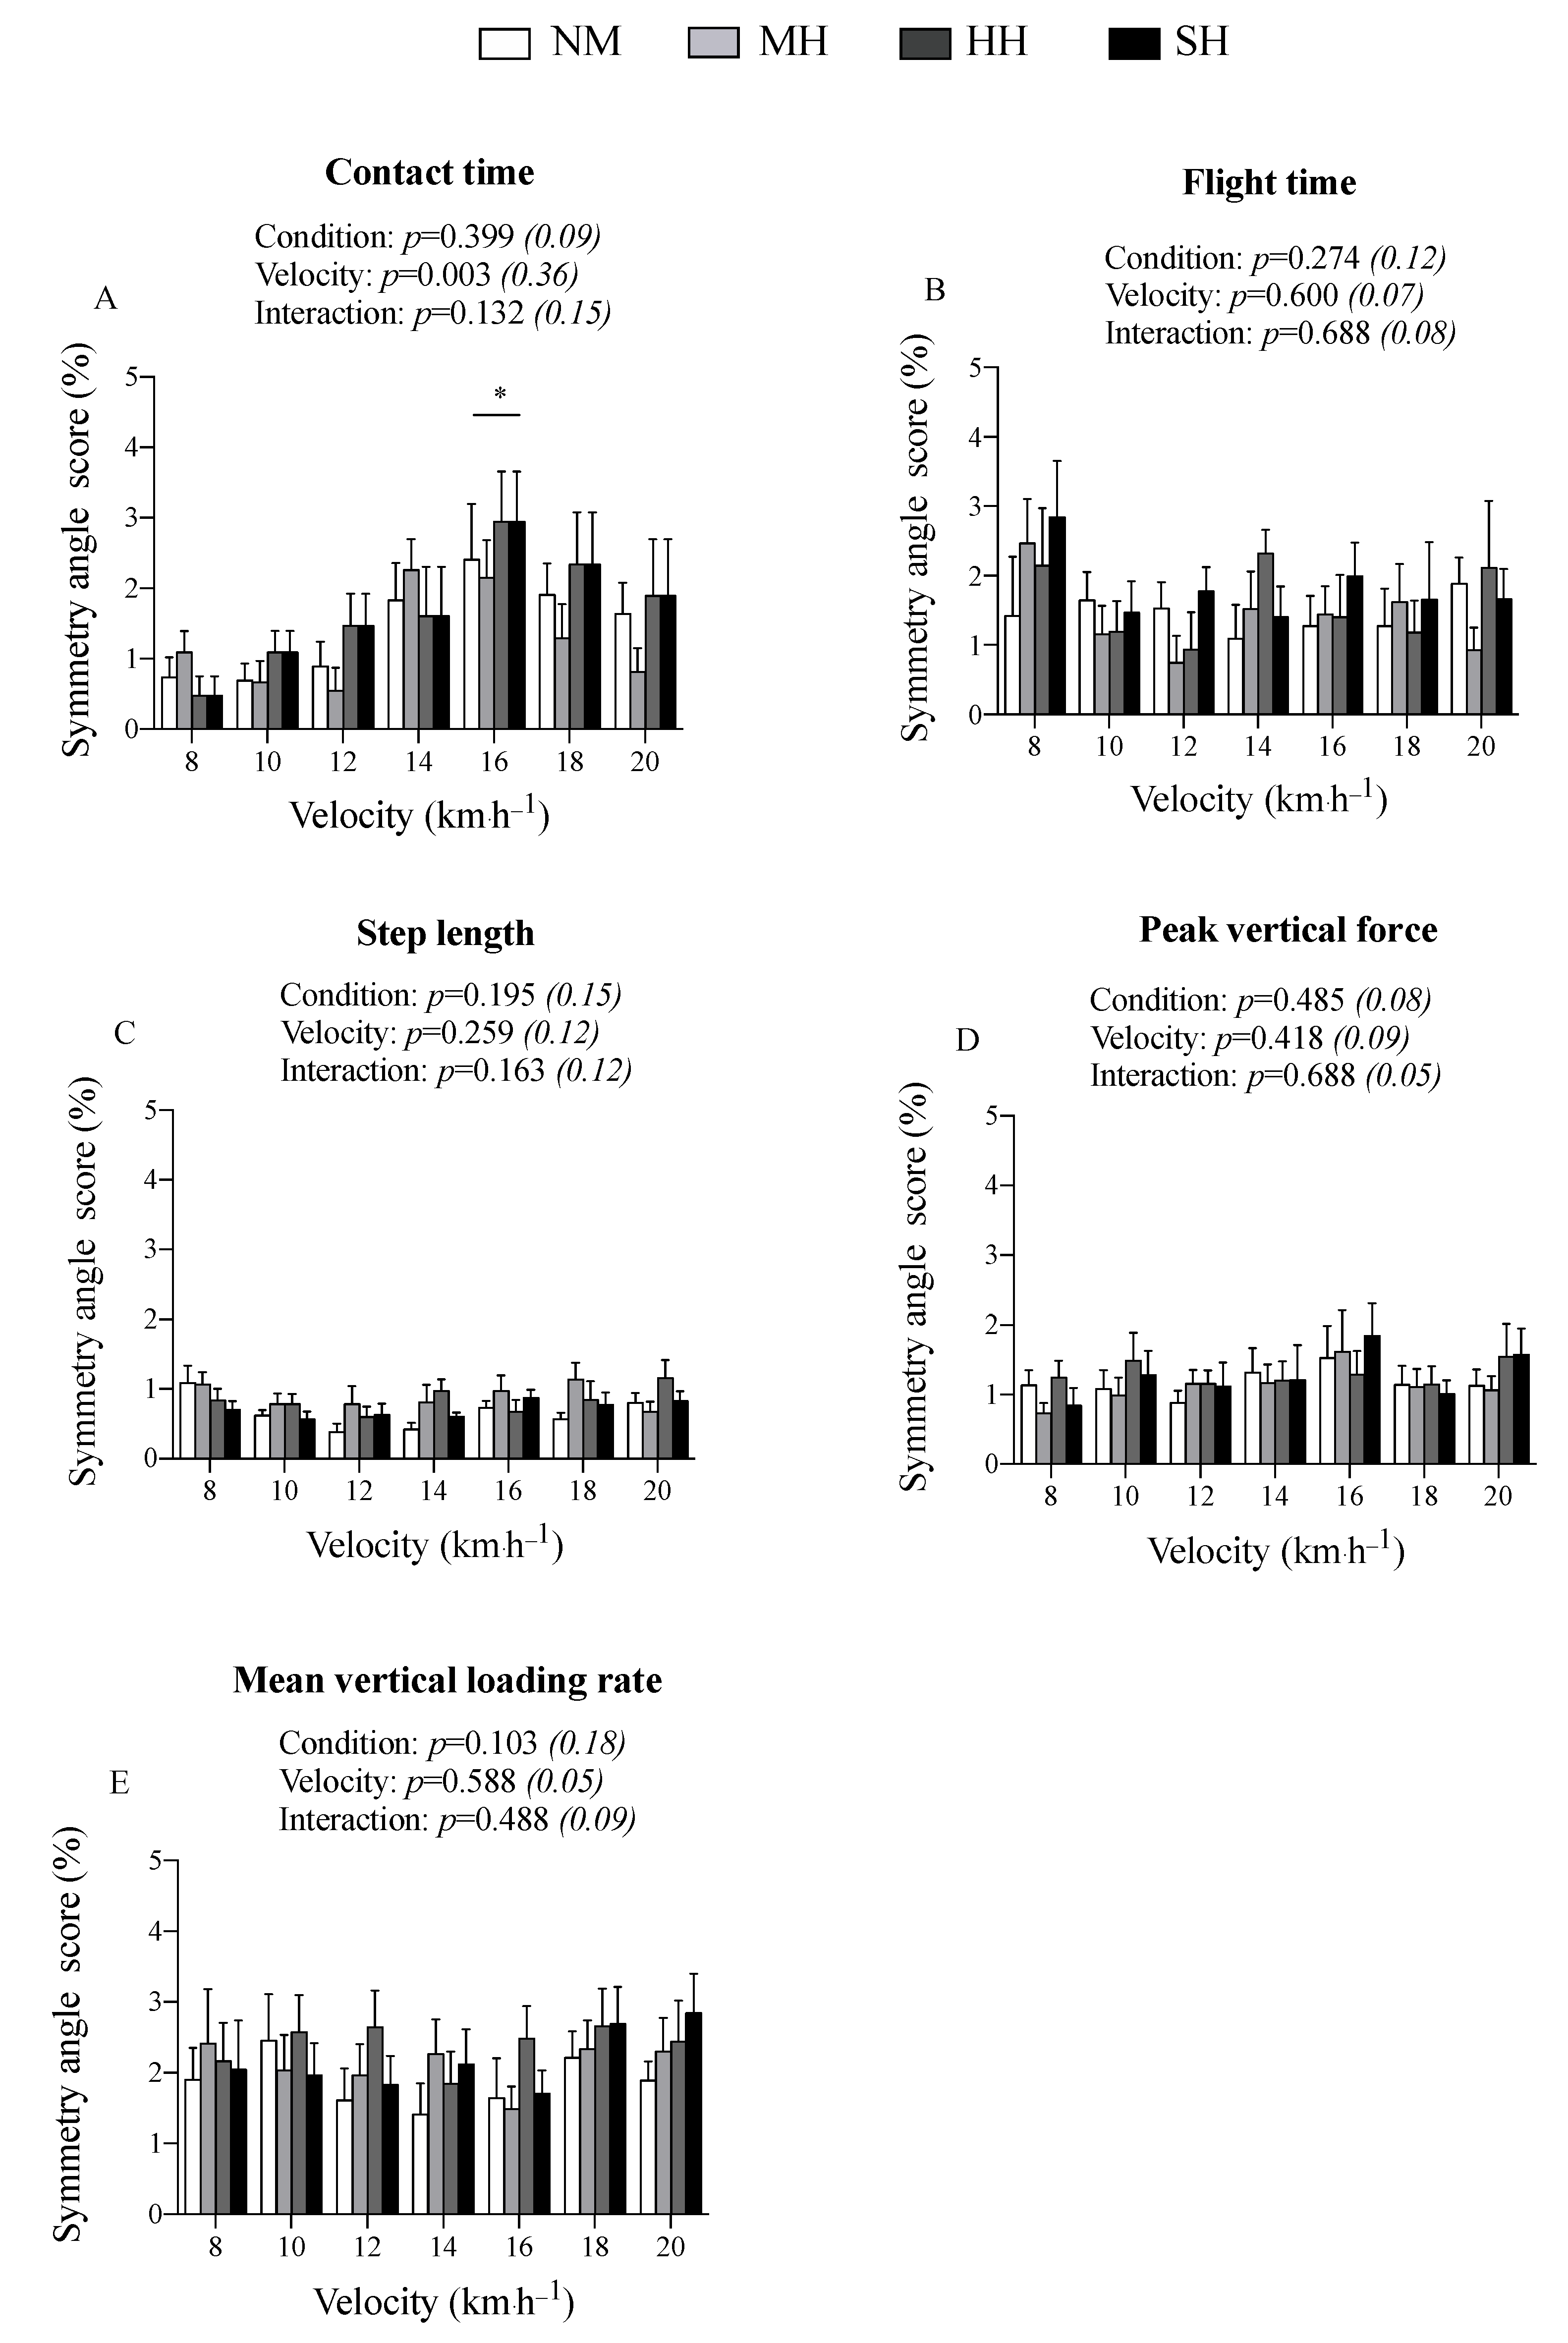
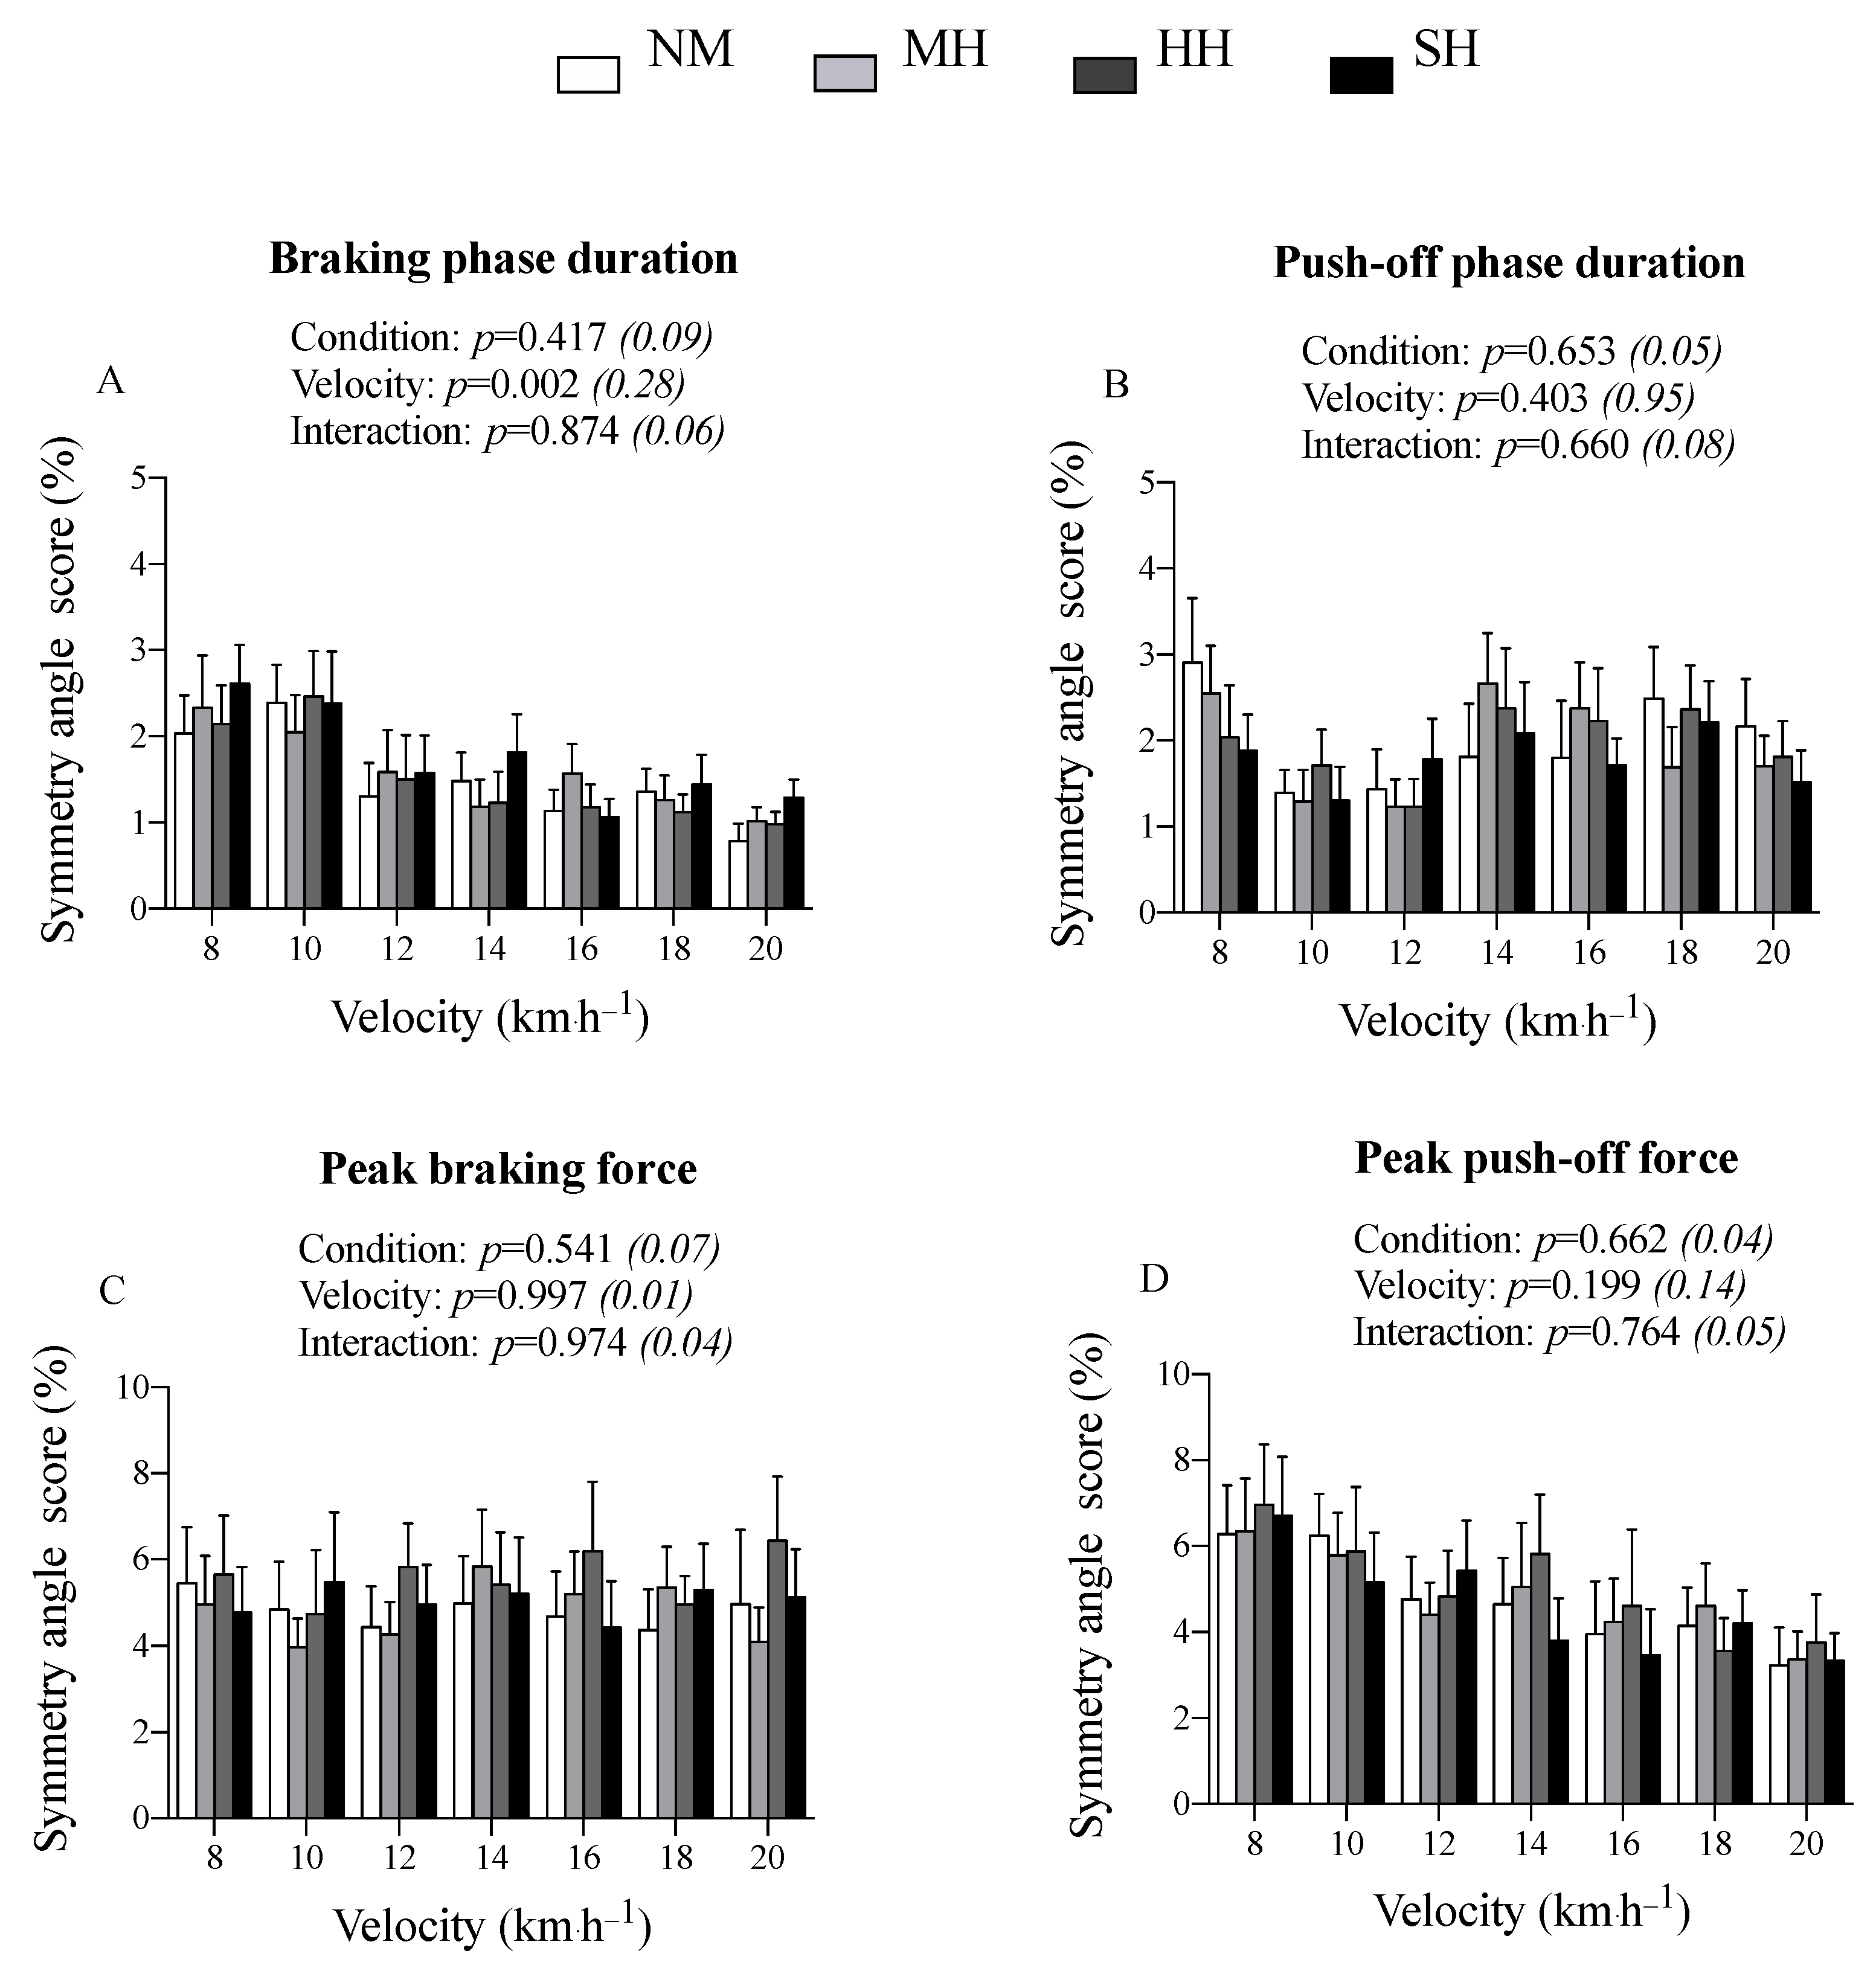
Values are presented as means ± SDs. Two-way repeated-measures analysis of variance (condition (normoxia, moderate hypoxia, high hypoxia, and severe hypoxia) and velocity (8, 10, 12, 14, 16, 18, and 20 km·h−1)) was used, after verification for normally distributed data (Shapiro–Wilk test). The assumption of variance was assessed using Mauchly’s test of sphericity for all ANOVA results. In cases where the assumption was violated, a Greenhouse–Geisser correction was applied to adjust the degrees of freedom. Post hoc pairwise comparisons with Bonferroni-adjusted p-values were conducted when a significant main effect was observed. The effect sizes were reported as partial eta-squared values (η2, with η2 ≥ 0.06 representing a moderate effect and η2 ≥ 0.14 a large effect). Statistical analysis was performed using SPSS (v28; CED, Cambridge, UK), and the significance level was set at p < 0.05.

3. Results

There were no significant differences in SA scores for any of the biomechanical variables for velocity (p ≥ 0.199 (except contact time and braking phase duration; p = 0.003 and p = 0.002, respectively)), condition (p ≥ 0.103), or interaction (p ≥ 0.132).
Mean SA scores varied between ∼1% and 2% for contact time (1.5 ± 0.8% [CI95% 1.0–2.0]), flight time (1.6 ± 0.6% [CI95% 1.2–2.0]), step length (0.8 ± 0.2% [CI95% 0.6–0.9]), peak vertical force (1.2 ± 0.5% [CI95% 0.8–1.6]), and mean vertical loading rate (2.1 ± 1.0% [CI95% 1.5–2.8]) (Figure 1).
Mean SA scores ranged from ∼2% to 5% for duration of braking (1.6 ± 0.7% [CI95% 1.1–2.0]) and push-off phases (1.9 ± 0.6% [CI95% 1.5–2.3]), as well as peak braking (5.0 ± 1.9% [CI95% 3.8–6.4]) and push-off forces (4.8 ± 1.7% [CI95% 3.6–6.0]) (Figure 2).

4. Discussion

4.1. Summary of Main Findings

In line with our hypothesis, SA scores were generally consistent (except for contact time) across a range of slow-to-fast treadmill running velocities, and the hypoxic exposure did not exert any additional influence. The asymmetries observed in the stride mechanical variables were consistently low-to-moderate across the range of velocities tested. This occurred despite the presence of obvious velocity-related spatio-temporal (i.e., increases in step length and frequency and shorter contact times) and kinetic alterations (i.e., increases in peak vertical forces and mean loading rates) with increasing belt speed between 8 and 20 km·h−1, as described elsewhere [21]. Overall, manipulating exercise intensity and hypoxic severity during submaximal, constant-velocity treadmill running did not subject one side of the body to greater mechanical constraints than the other.

4.2. Constant Asymmetry with Varying Running Velocity

We observed that SA scores for both vertical and posterior–anterior GRF variables remained largely consistent as running velocity increased on the treadmill. Although we did observe statistically significant differences in the magnitude of asymmetry for contact time (between 8 and 16 km·h−1 only) and duration of braking forces at different velocities, these differences were small and unlikely to be practically relevant. Regardless of running velocity, SA scores for braking and push-off phases were relatively similar. This indicates that changes in foot-strike pattern across a range of low-to-moderate velocities were not specifically amplified on one leg side by braking more in the early stance phase and pushing less forcefully forward. Our findings align with previous studies that investigated various athletic populations, including female collegiate cross-country runners [23], novice [12] and trained male runners [9], and a mix sample of international race walkers [10], as well as collegiate athletes [24], which also reported that running at faster velocities has a minimal influence on gait asymmetries. Notably, our participants ran in fresh conditions for short periods at each velocity, with adequate rest between running bouts to prevent fatigue development. Although pre-existing fatigue has been reported to accentuate asymmetry in some studies [25,26] when participants ran at constant low-to-moderate treadmill velocities (10–14 km·h−1), it is uncertain whether asymmetries may be magnified by increasing running velocity and/or run time in fatigued runners. Our results, supported by growing evidence [9], suggest that analyzing bilateral leg differences for selected gait parameters at just one running velocity may be sufficient, even during high-velocity treadmill runs, to assess asymmetry in healthy runners.

4.3. No Influence of Hypoxia Exposure on Asymmetry

A novel observation was that SA scores for all biomechanical variables and running velocities remained consistent between normoxia and moderate-to-severe hypoxia. However, the comparison of these findings with those of previous studies was limited due to the restricted number of studies that have assessed the effects of additional hypoxia exposure on bilateral leg differences. One of the few available studies was conducted on trained runners who completed perceptually regulated interval treadmill runs (4 × 4 min treadmill running bouts interspersed with 3 min passive recoveries) with hypoxic exposure (FiO2 = 0.15), which caused slower running velocity than in normoxia [15]. Consistent with our findings, these authors found that inhaling an oxygen-deprived gas mixture did not accentuate natural low-to-moderate biomechanical asymmetry, both between and within intervals, when assessed at constant velocity. Thus, our results suggest that gait variables exhibit a high degree of symmetry and remain insensitive to hypoxic exposure, including severe levels, at least in the current circumstances and within this athletic cohort. Practitioners can confidently incorporate hypoxic exposure into their running exercise sessions across various treadmill velocities, as it is unlikely to result in significant changes in bilateral leg differences.

4.4. Asymmetry Is Metric-Dependent

The mean SA scores for time-based gait parameters (i.e., contact and flight times and braking and push-off phase durations) and peak vertical force were relatively low, ranging from 1 to 2%. However, the peak forces for the antero-posterior signal showed the highest asymmetries, with values exceeding 4%. This finding aligns with previous studies in the literature, which have shown a wide variation in the magnitude of SA scores across different biomechanical variables of interest among participants running at a constant submaximal pace [24,27]. Similar to recent investigations on perceptually regulated interval running [15], adjustments made during the braking and push-off phases resulted in comparable SA scores. However, other studies demonstrated two-to-three times larger deviations from symmetry (i.e., for peak force) during braking as opposed to push-off phases during the completion of repeated treadmill sprints [18,19] and for a range of low-to-high constant velocities [9]. The present study did not measure compensatory strategies at increasing belt speeds, which may have magnified some lower-limb kinematic variables while reducing others [13], potentially resulting in preserved SA scores for the analyzed gait variables. To further support our findings, additional studies examining joint kinematics and incorporating specific gait metrics, such as moments, angles, and velocities, are warranted. Our results suggest that the magnitude of side-to-side differences is ultimately metric-dependent, with variables derived from the antero-posterior GRF signal being the most asymmetrical, regardless of running velocity or hypoxic exposure.

4.5. Limitations and Additional Considerations

This study has several limitations. Firstly, the participants were healthy individuals, and it is uncertain whether the findings can be generalized to individuals with compromised loading, such as those who have recently experienced injuries or surgeries or those with chronic musculoskeletal conditions affecting one leg. Secondly, we did not evaluate laterality or leg preference to determine whether limb dominance influenced mechanical side-to-side differences during treadmill runs. Previous research has found that at faster running velocities (24 km·h−1) the dominant leg produced higher leg stiffness than the non-dominant leg, while vertical stiffnesses did not differ [28]. Future studies could benefit from assessing the direction of asymmetry, as previous research has shown the occasional switching of limbs to produce the greatest values for the gait parameters assessed here [29]. In doing so, these studies could consider incorporating running bouts longer than 45 s to ensure that stable running mechanics are assessed. Thirdly, new statistical methods are necessary to quantify fatigue-induced changes in mechanical asymmetry. These approaches include statistical parametric mapping, which represents GRF data as functions of the normalized stance phase durations, rather than as discrete values, such as peak braking or push-off forces (as shown in previous studies [30]). Fourthly, although motorized treadmill running has been demonstrated to possess biomechanical similarities to overground running [31], it has been observed that treadmill running tends to result in smaller asymmetries [32]. This may have led to an underestimation of the magnitude of asymmetry in our study. Nonetheless, future studies should investigate how mechanical asymmetry is affected by various terrains and air resistance levels that characterize running at terrestrial altitudes. Lastly, it is important to note that this study only assessed the acute effects of hypoxia exposure. Therefore, we could not determine whether training in oxygen-deprived conditions, which is known to improve exercise tolerance through hematological and peripheral adaptations [33], also modifies gait patterns. Interestingly, a separate study involving three weeks of ‘live high—train high’ altitude training did not result in significant changes in the running mechanics of middle-distance runners [34]. Nonetheless, minimal asymmetry between legs was assumed by pooling the data from both limbs. Further research is needed, specifically comparing different forms of chronic altitude exposure [33], to determine the effects of altitude training on gait asymmetries assessed at known physiological landmarks, such as the ventilatory threshold and respiratory compensation points [35].

5. Conclusions

The trained runners who participated in this study did not exhibit any noticeable differences in asymmetries for parameters derived from vertical and antero-posterior GRFs when treadmill running velocities were varied between 8 and 20 km·h−1, both in normoxia and different normobaric hypoxia conditions. Generally, bilateral leg differences during the braking and push-off phases, particularly peak forces, were larger than the vertical GRF asymmetries. It can be concluded that faster running velocity and normobaric hypoxia exposure do not have any additional influence on mechanical asymmetries. Practically, manipulating exercise intensity and hypoxic severity during submaximal treadmill running did not impose greater mechanical constraints on one side of the body compared to the other. Sport practitioners can therefore incorporate hypoxic exposure into their running routines without significantly affecting the sensitivity of detecting gait asymmetries. Non-injured, trained runners who engage in treadmill runs across a wide range of velocities, with or without hypoxia, can expect to maintain consistent stride patterns.

Author Contributions

C.C.L.T., W.K.Y. and O.G. conceived and designed the research. C.C.L.T., M.C.C., V.S., C.L.C. and W.K.Y. conducted experiments. C.C.L.T., M.C.C., W.K.Y. and O.G. analyzed data and interpreted the results of experiments. C.C.L.T., W.K.Y. and O.G. drafted the manuscript and prepared the figures and tables. All authors edited and revised the manuscript. All authors have read and agreed to the published version of the manuscript.

Funding

This work is based on research funded by a National Sports Institute of Malaysia research grant (ISNRG 001/2020).

Informed Consent Statement

Informed consent was obtained from all participants involved in the study.

Data Availability Statement

Not applicable.

Acknowledgments

The authors thank Tze Chien Loh from the Exercise Physiology Centre, the National Sports Institute of Malaysia, and Bee Khee Ng and Han Xiang Lim for their excellent assistance in the process of data collection. Most of all, we are grateful to the participants who dedicated their effort and time to this research project.

Conflicts of Interest

The authors declare no conflict of interest.

References

  1. Bishop, C.; Turner, A.; Read, P. Effects of inter-limb asymmetries on physical and sports performance: A systematic review. J. Sports Sci. 2018, 36, 1135–1144. [Google Scholar] [CrossRef] [PubMed]
  2. Jafarnezhadgero, A.; Madadi, M.; Ferber, R. The effect of foot orthoses on joint moment asymmetry in male children with flexible flat feet. J. Bodyw. Mov. Ther. 2018, 22, 83–89. [Google Scholar] [CrossRef] [PubMed]
  3. Morin, J.-B.; Samozino, P.; Féasson, L.; Geyssant, A.; Millet, G.Y. Effects of muscular biopsy on the mechanics of running. Eur. J. Appl. Physiol. 2009, 105, 185–190. [Google Scholar] [CrossRef] [PubMed]
  4. Thomson, A.; Einarsson, E.; Hansen, C.; Bleakley, C.; Whiteley, R. Marked asymmetry in vertical force (but not contact times) during running in ACL reconstructed athletes <9 months post-surgery despite meeting functional criteria for return to sport. J. Sci. Med. Sport 2018, 21, 890–893. [Google Scholar]
  5. Brændvik, S.M.; Goihl, T.; Braaten, R.S.; Vereijken, B. The effect of increased gait speed on asymmetry and variability in children with cerebral palsy. Front. Neurol. 2020, 10, 1399. [Google Scholar] [CrossRef] [PubMed]
  6. Bejek, Z.; Paróczai, R.; Illyés, A.; Kiss, R.M. The influence of walking speed on gait parameters in healthy people and in patients with osteoarthritis. Knee Surg. Sports Traumatol. Arthrosc. 2006, 14, 612–622. [Google Scholar] [CrossRef]
  7. Lamontagne, A.; Fung, J. Faster is better–Implications for speed-intensive gait training after stroke. Stroke 2004, 35, 2543–2548. [Google Scholar] [CrossRef]
  8. Donker, S.F.; Beek, P.J. Interlimb coordination in prosthetic walking: Effects of asymmetry and walking velocity. Acta Psychol. 2002, 110, 265–288. [Google Scholar] [CrossRef] [PubMed]
  9. Girard, O.; Morin, J.-B.; Ryu, J.; Read, P.; Townsend, N. Running velocity does not influence lower limb mechanical asymmetry. Front. Sports Act. Living 2019, 1, 36. [Google Scholar] [CrossRef]
  10. Tucker, C.B.; Hanley, B. Increases in speed do not change gait symmetry or variability in world-class race walkers. J. Sports Sci. 2020, 38, 2758–2764. [Google Scholar] [CrossRef]
  11. Mo, S.; Lau, F.; Lok, A.; Chan, Z.; Zhang, J.; Shum, G.; Cheung, R. Bilateral asymmetry of running gait in competitive, recreational and novice runners at different speeds. Hum. Mov. Sci. 2020, 71, 102600. [Google Scholar] [CrossRef] [PubMed]
  12. Jiang, X.; Chen, H.; Sun, D.; Baker, J.S.; Gu, Y. Running speed does not influence the asymmetry of kinematic variables of the lower limb joints in novice runners. Acta Bioeng. Biomech. 2021, 13, 69–81. [Google Scholar]
  13. Liu, Q.; Chen, H.; Song, Y.; Alla, N.; Fekete, G.; Li, J.; Gu, Y. Running velocity and longitudinal bending stiffness influence the asymmetry of kinematic variables of the lower limb joints. Bioengineering 2022, 9, 607. [Google Scholar] [CrossRef] [PubMed]
  14. Buchheit, M.; Kuitunen, S.; Voss, S.; William, B.K.; Mendez-Villanueva, A.; Bourdon, P.C. Physiological strain associated with high- intensity hypoxic intervals in highly trained young runners. J. Strength Cond. Res. 2012, 26, 94–105. [Google Scholar] [CrossRef] [PubMed]
  15. Girard, O.; Li, S.N.; Hobbins, L.; Ryu, J.H.; Peeling, P. Gait asymmetries during perceptually-regulated interval running in hypoxia and normoxia. Sports Biomech. 2021. published ahead of print. [Google Scholar]
  16. Heil, J.; Loffing, F.; Büsch, D. The influence of exercise-induced fatigue on inter-limb asymmetries: A systematic review. Sports Med.—Open 2020, 6, 39. [Google Scholar] [CrossRef] [PubMed]
  17. Bissas, A.; Walker, J.; Paradisis, G.P.; Hanley, B.; Tucker, C.B.; Jongerius, N.; Thomas, A.; Merlino, S.; Vazel, P.; Girard, O. Asymmetry in sprinting: An insight into sub-10 and sub-11 s men and women sprinters. Scand. J. Med. Sci. Sports 2022, 32, 69–82. [Google Scholar] [CrossRef] [PubMed]
  18. Girard, O.; Racinais, S.; Couderc, A.; Morin, J.-B.; Ryu, J.H.; Piscione, J.; Brocherie, F. Asymmetries during repeated treadmill sprints in elite female Rugby Sevens players. Sports Biomech. 2023, 22, 863–873. [Google Scholar] [CrossRef]
  19. Van Alsenoy, K.; Ryu, J.H.; Girard, O. No effect of EVA and TPU custom foot orthoses on mechanical asymmetries during acute intense fatigue. Symmetry 2023, 15, 705. [Google Scholar] [CrossRef]
  20. McKay, A.K.A.; Stellingwerff, T.; Smith, E.S.; Martin, D.T.; Mujika, I.; Goosey-Tolfrey, V.L.; Sheppard, J.; Burke, L.M. Defining training and performance caliber: A participant classification framework. Int. J. Sports Physiol. Perform. 2022, 17, 317–331. [Google Scholar] [CrossRef]
  21. Tee, C.; Chong, M.C.; Sundar, V.; Chok, C.L.; Razali, M.R.M.; Yeo, W.K.; Girard, O. Influence of exercise intensity and hypoxic exposure on physiological, perceptual and biomechanical responses to treadmill running. Eur. J. Sport Sci. 2022, in press. [Google Scholar]
  22. Zifchock, R.A.; Davis, I.; Higginson, J.; Royer, T. The symmetry angle: A novel, robust method of quantifying asymmetry. Gait Posture 2008, 27, 622–627. [Google Scholar] [CrossRef]
  23. Wayner, R.S.; Robinson, R.; Simon, J.E. Gait asymmetry and running-related injury in female collegiate cross-country runners. Phys. Ther. Sport 2023, 59, 1–6. [Google Scholar] [CrossRef] [PubMed]
  24. Stiffler-Joachim, M.R.; Lukes, D.H.; Kliethermes, S.A.; Heiderscheit, B.C. Lower extremity kinematic and kinetic asymmetries during running. Med. Sci. Sports Exerc. 2021, 53, 945–950. [Google Scholar] [CrossRef] [PubMed]
  25. Melo, C.C.; Carpes, F.P.; Monteiro Vieira, T.; Teixeira Mendes, T.; Vinhas de Paula, L.; Heleno Chagas, M.; Peixoto, G.H.C.; Pereira de Andrade, A.G. Correlation between running asymmetry, mechanical efficiency, and performance during a 10 km run. J. Biomech. 2020, 109, 109913. [Google Scholar] [CrossRef] [PubMed]
  26. Radzak, K.N.; Putnam, A.M.; Tamura, K.; Hetzler, R.K.; Stickley, C.D. Asymmetry between lower limbs during rested and fatigued state running gait in healthy individuals. Gait Posture 2017, 51, 268–274. [Google Scholar] [CrossRef] [PubMed]
  27. Furlong, L.-A.M.; Egginton, N.L. Kinetic asymmetry during running at preferred and nonpreferred speeds. Med. Sci. Sports Exerc. 2018, 50, 1241–1248. [Google Scholar] [CrossRef]
  28. Pappas, P.; Paradisis, G.P.; Girard, O. Influence of lower limb dominance on mechanical asymmetries during high-speed treadmill running. Sports Biomech. 2021. published ahead of print. [Google Scholar]
  29. Afonso, J.; Peña, J.; Sá, M.; Virgile, A.; García-de-Alcaraz, A.; Bishop, C. Why sports should embrace bilateral asymmetry: A narrative review. Symmetry 2022, 14, 1993. [Google Scholar] [CrossRef]
  30. Garcia, S.A.; Brown, S.R.; Koje, M.; Krishnan, C.; Palmieri-Smith, R.M. Gait asymmetries are exacerbated at faster walking speeds in individuals with acute anterior cruciate ligament reconstruction. J. Orthop. Res. 2022, 40, 219–230. [Google Scholar] [CrossRef]
  31. Van Hooren, B.; Fuller, J.T.; Buckley, J.D.; Miller, J.R.; Sewell, K.; Rao, G.; Barton, C.; Bishop, C.; Willy, R.W. Is motorized treadmill running biomechanically comparable to overground running? A systematic review and meta-analysis of cross-over studies. Sports Med. 2020, 50, 785–813. [Google Scholar] [CrossRef]
  32. Robadey, J.; Staudenmann, D.; Schween, R.; Gehring, D.; Gollhofer, A.; Taube, W. Lower between-limb asymmetry during running on treadmill compared to overground in subjects with laterally pronounced knee osteoarthritis. PLoS ONE 2018, 13, e0205191. [Google Scholar] [CrossRef]
  33. Millet, G.P.; Roels, B.; Schmitt, L.; Woorons, X.; Richalet, J.P. Combining hypoxic methods for peak performance. Sports Med. 2010, 40, 1–25. [Google Scholar] [CrossRef]
  34. Millet, G.P.; Trigueira, R.; Meyer, F.; Lemire, M. Is altitude training bad for the running mechanics of middle-distance runners? Int. J. Sports Physiol. Perf. 2021, 16, 1359–1362. [Google Scholar] [CrossRef] [PubMed]
  35. Girard, O.; Van Alsenoy, K.; Li, S.N.; Ryu, J.H.; Peeling, P. Constant low-to-moderate mechanical asymmetries during a treadmill graded exercise test. Eur. J. Sport Sci. 2022, 22, 530–538. [Google Scholar] [CrossRef] [PubMed]
Figure 1. Symmetry angle scores (%) for (A) contact time, (B) flight time, (C) step length, (D) peak vertical force, and (E) mean vertical loading rate at seven running velocities and four altitude conditions. Values are means ± SDs (n = 11). White bars = normoxia (NM); light grey bars = moderate hypoxia (MH); dark grey bars = high hypoxia (HH); black bars = severe hypoxia. ANOVA main effects of condition, velocity, and interaction are stated along with partial eta-squared values for effect sizes in brackets with significant effects (p < 0.05). * denotes a statistically significant difference (p < 0.05) compared to 8 km·h−1.
Symmetry 15 01303 g001
Figure 2. Symmetry angle scores (%) for (A) braking phase duration, (B) push-off phase duration, (C) peak braking force, and (D) peak push-off force at seven running velocities and four altitude conditions. Values are means ± SDs (n = 11). White bars = normoxia (NM); light grey bars = moderate hypoxia (MH); dark grey bars = high hypoxia (HH); black bars = severe hypoxia. ANOVA main effects of condition, velocity and interaction are stated along with partial eta-squared values for effect sizes in brackets with significant effects (p < 0.05).
Symmetry 15 01303 g002
Disclaimer/Publisher’s Note: The statements, opinions and data contained in all publications are solely those of the individual author(s) and contributor(s) and not of MDPI and/or the editor(s). MDPI and/or the editor(s) disclaim responsibility for any injury to people or property resulting from any ideas, methods, instructions or products referred to in the content.

