
Influence of Precession Electron Diffraction Parameters and Energy Filtering on Reduced Density Function Analysis of Thin Amorphous Silica Films—Implications for Structural Studies
 , and
, and
Abstract
:1. Introduction
Electron Reduced Density Function (eRDF)
2. Materials and Methods
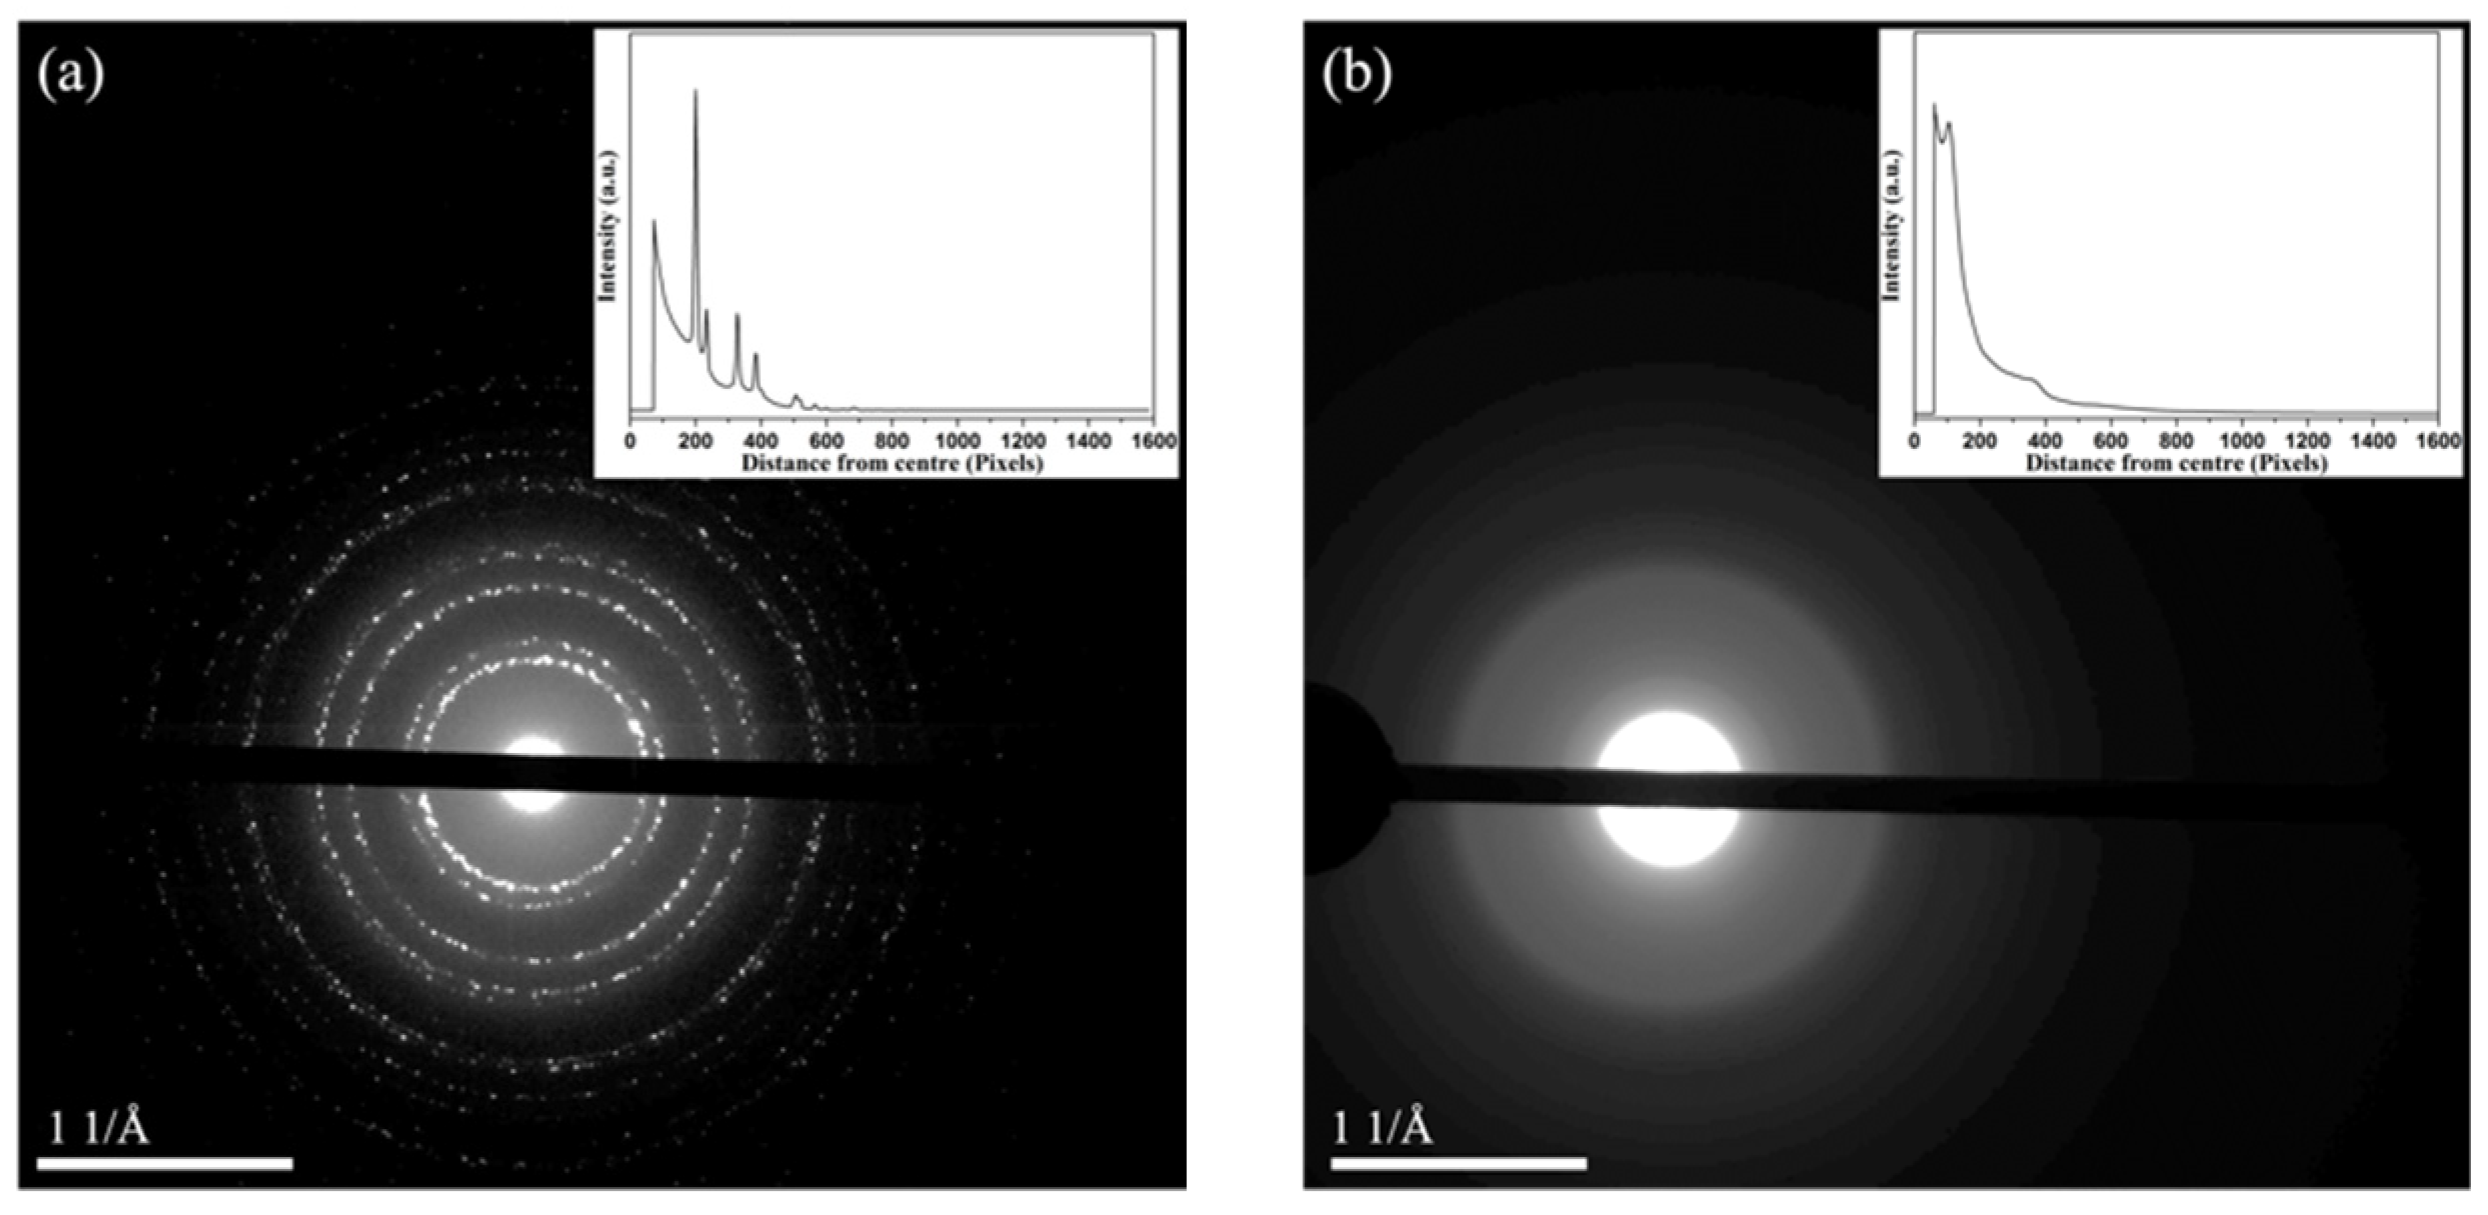
2.1. Experimental
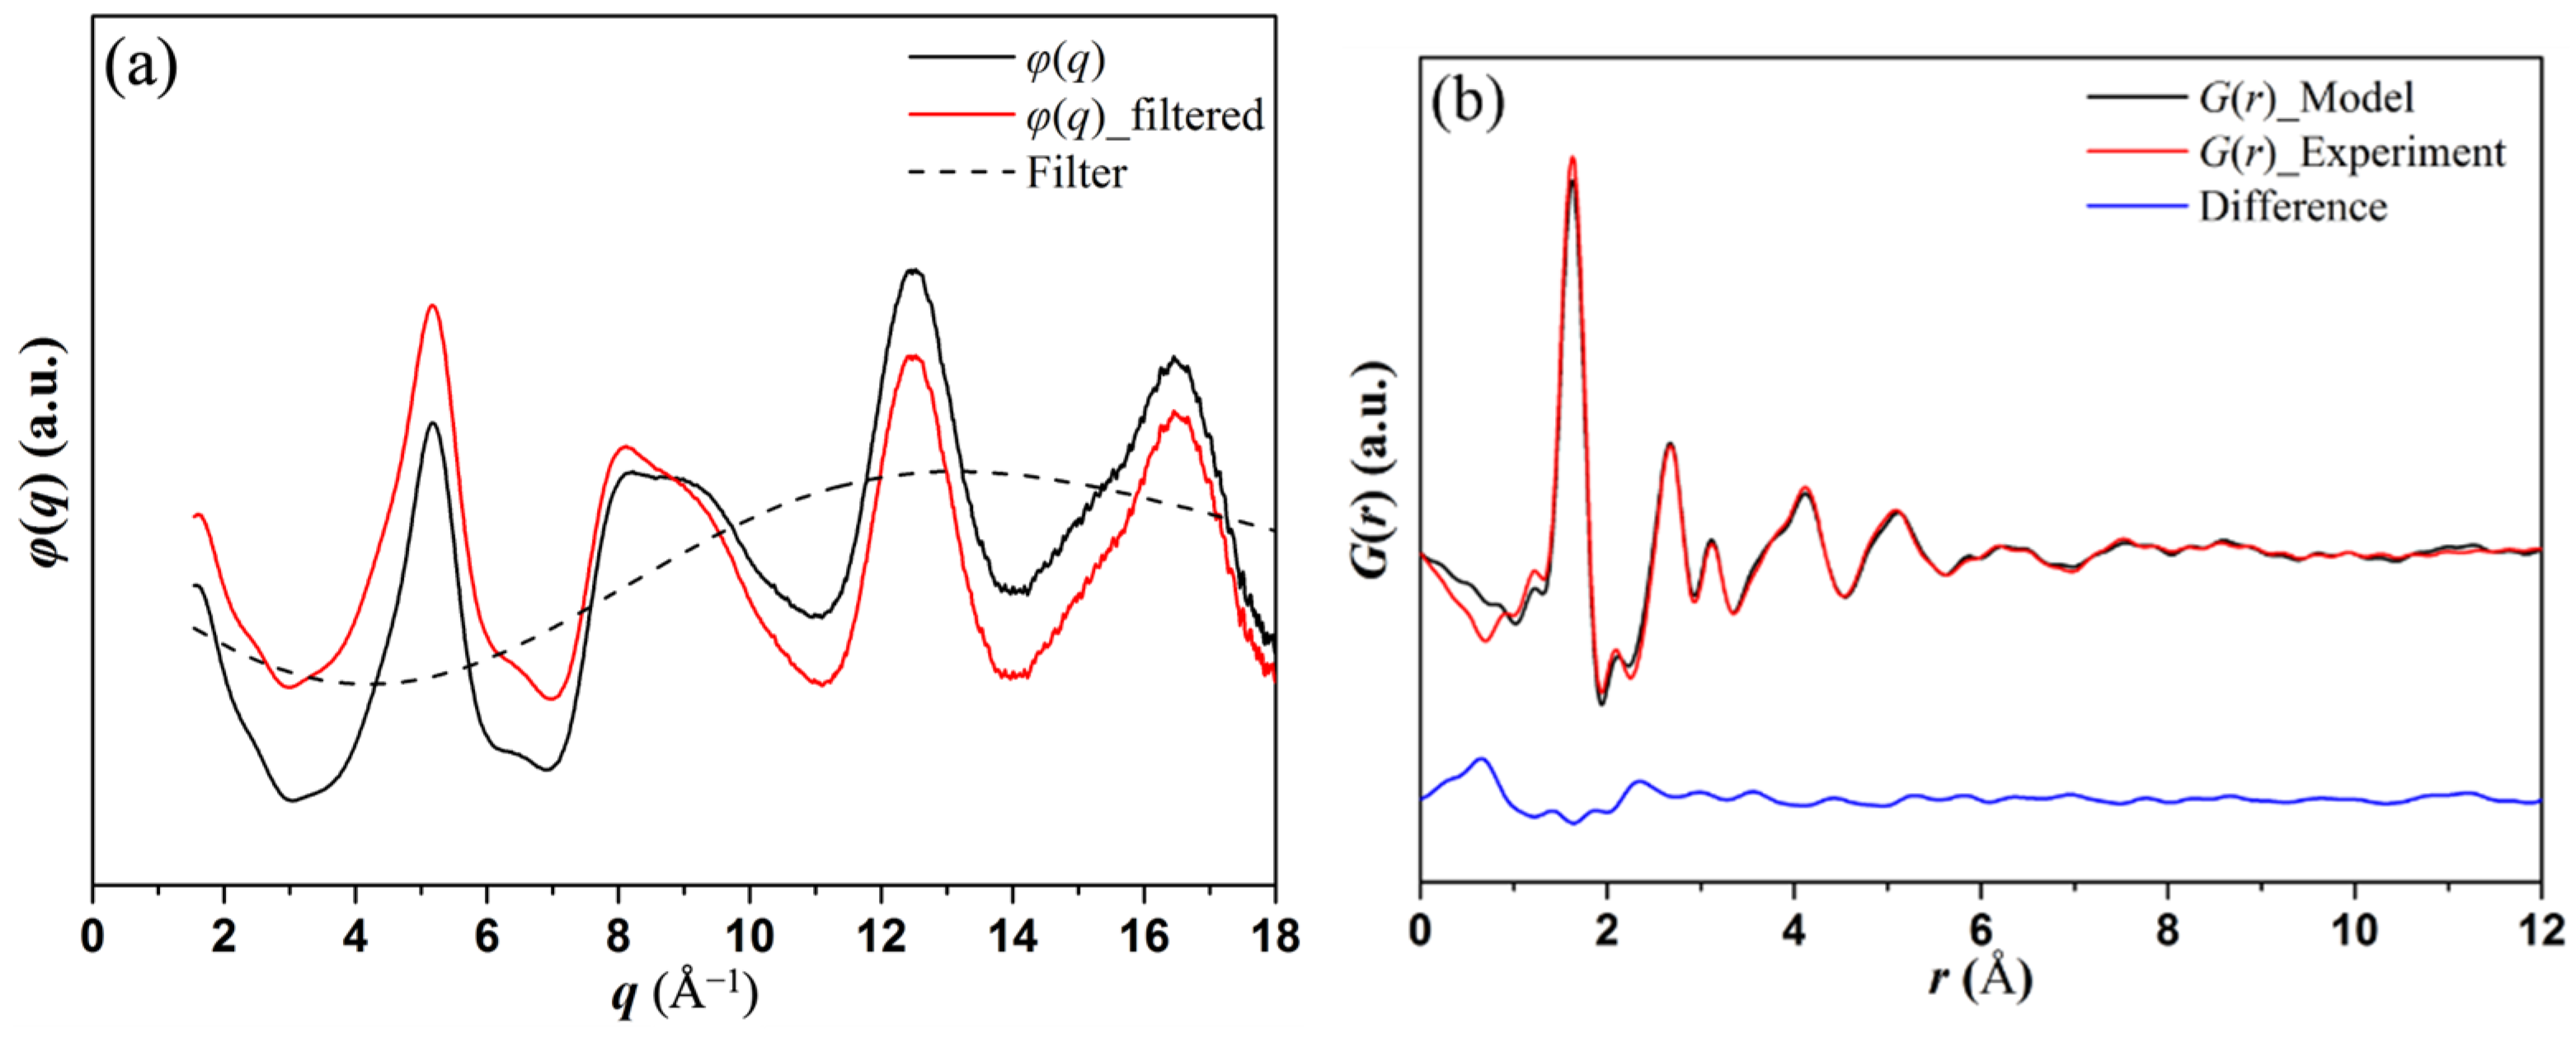
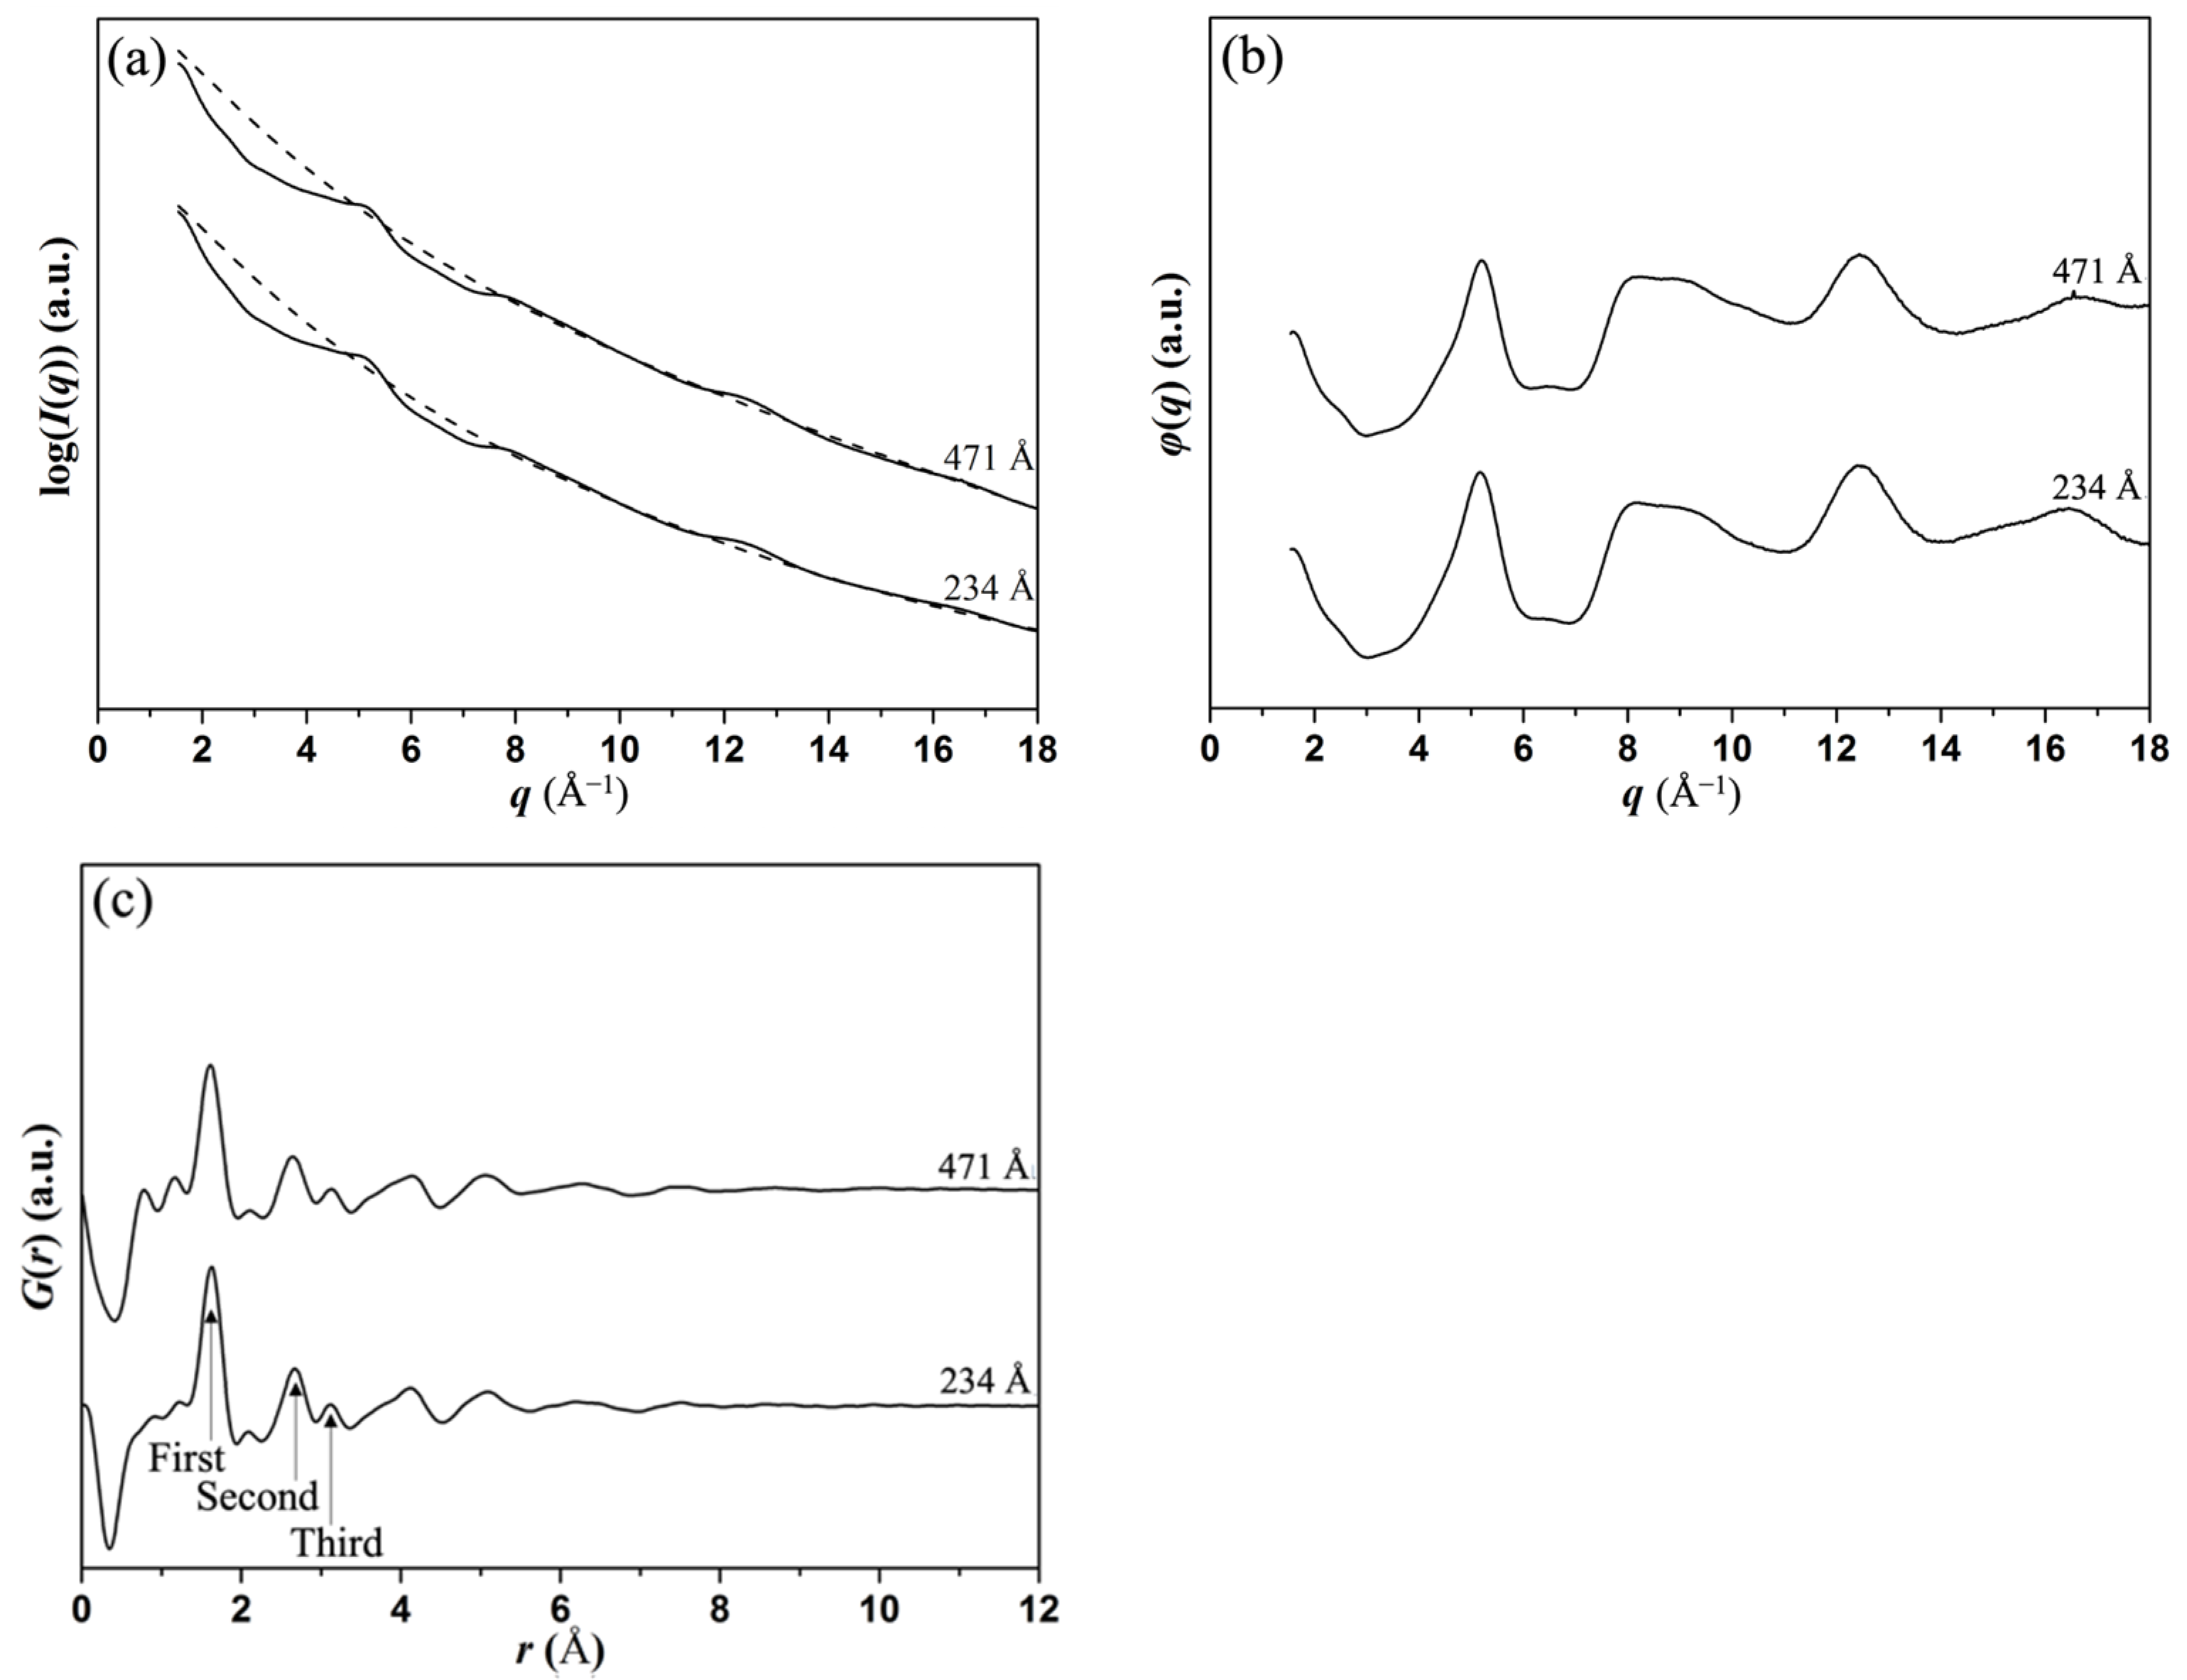
2.2. eRDF Analysis
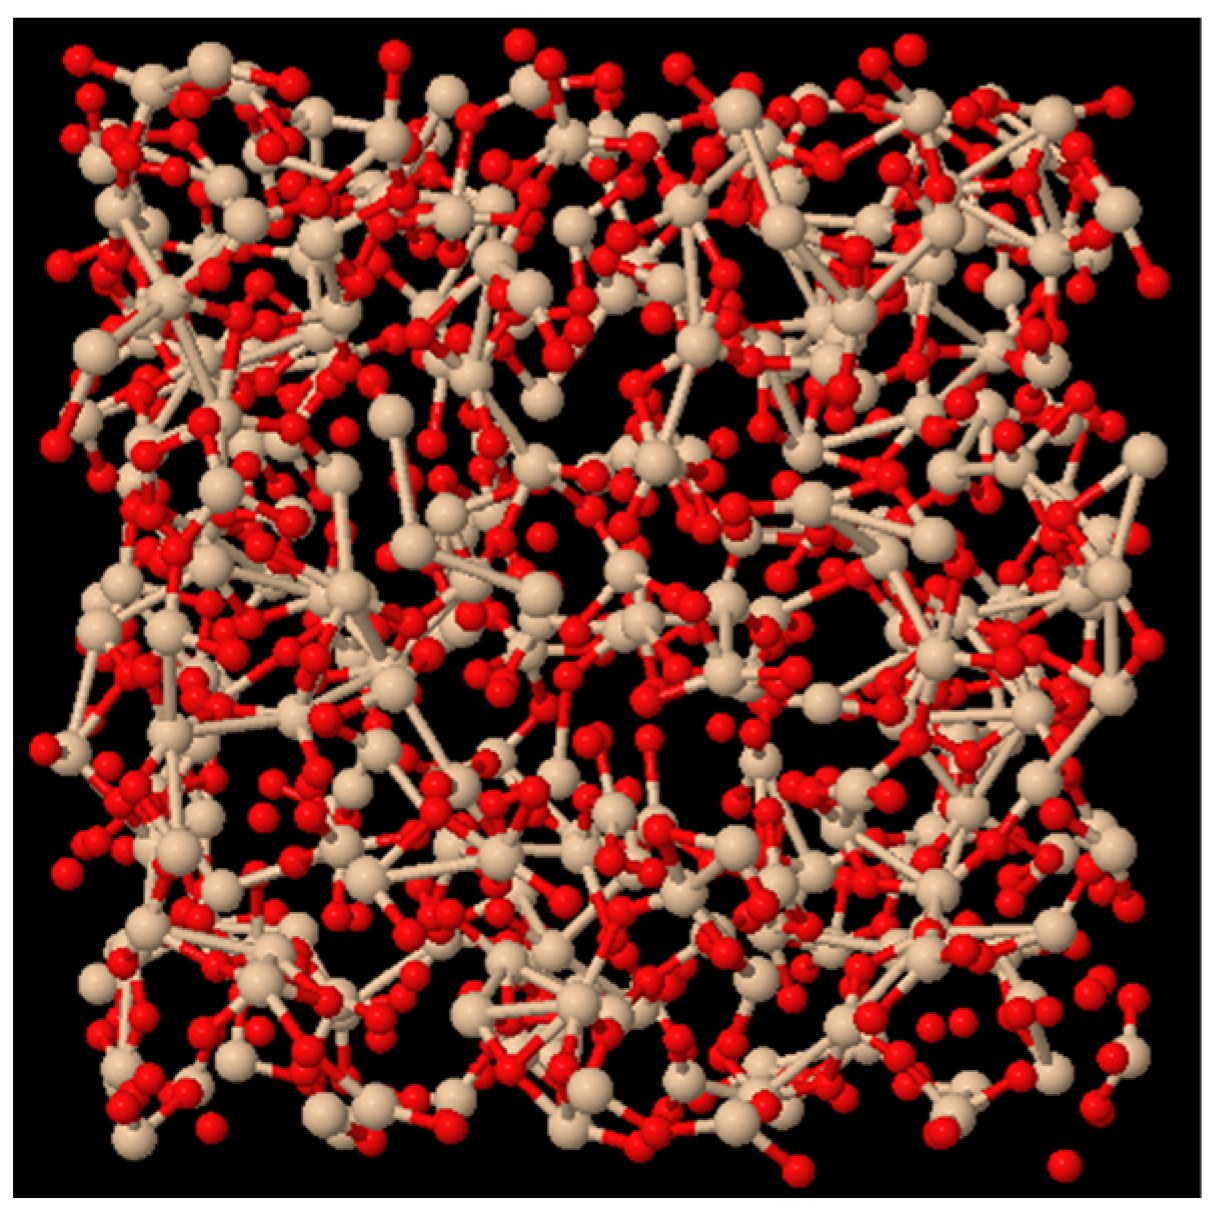
2.3. Structure Refinement
3. Results
3.1. Influence of Specimen Thickness
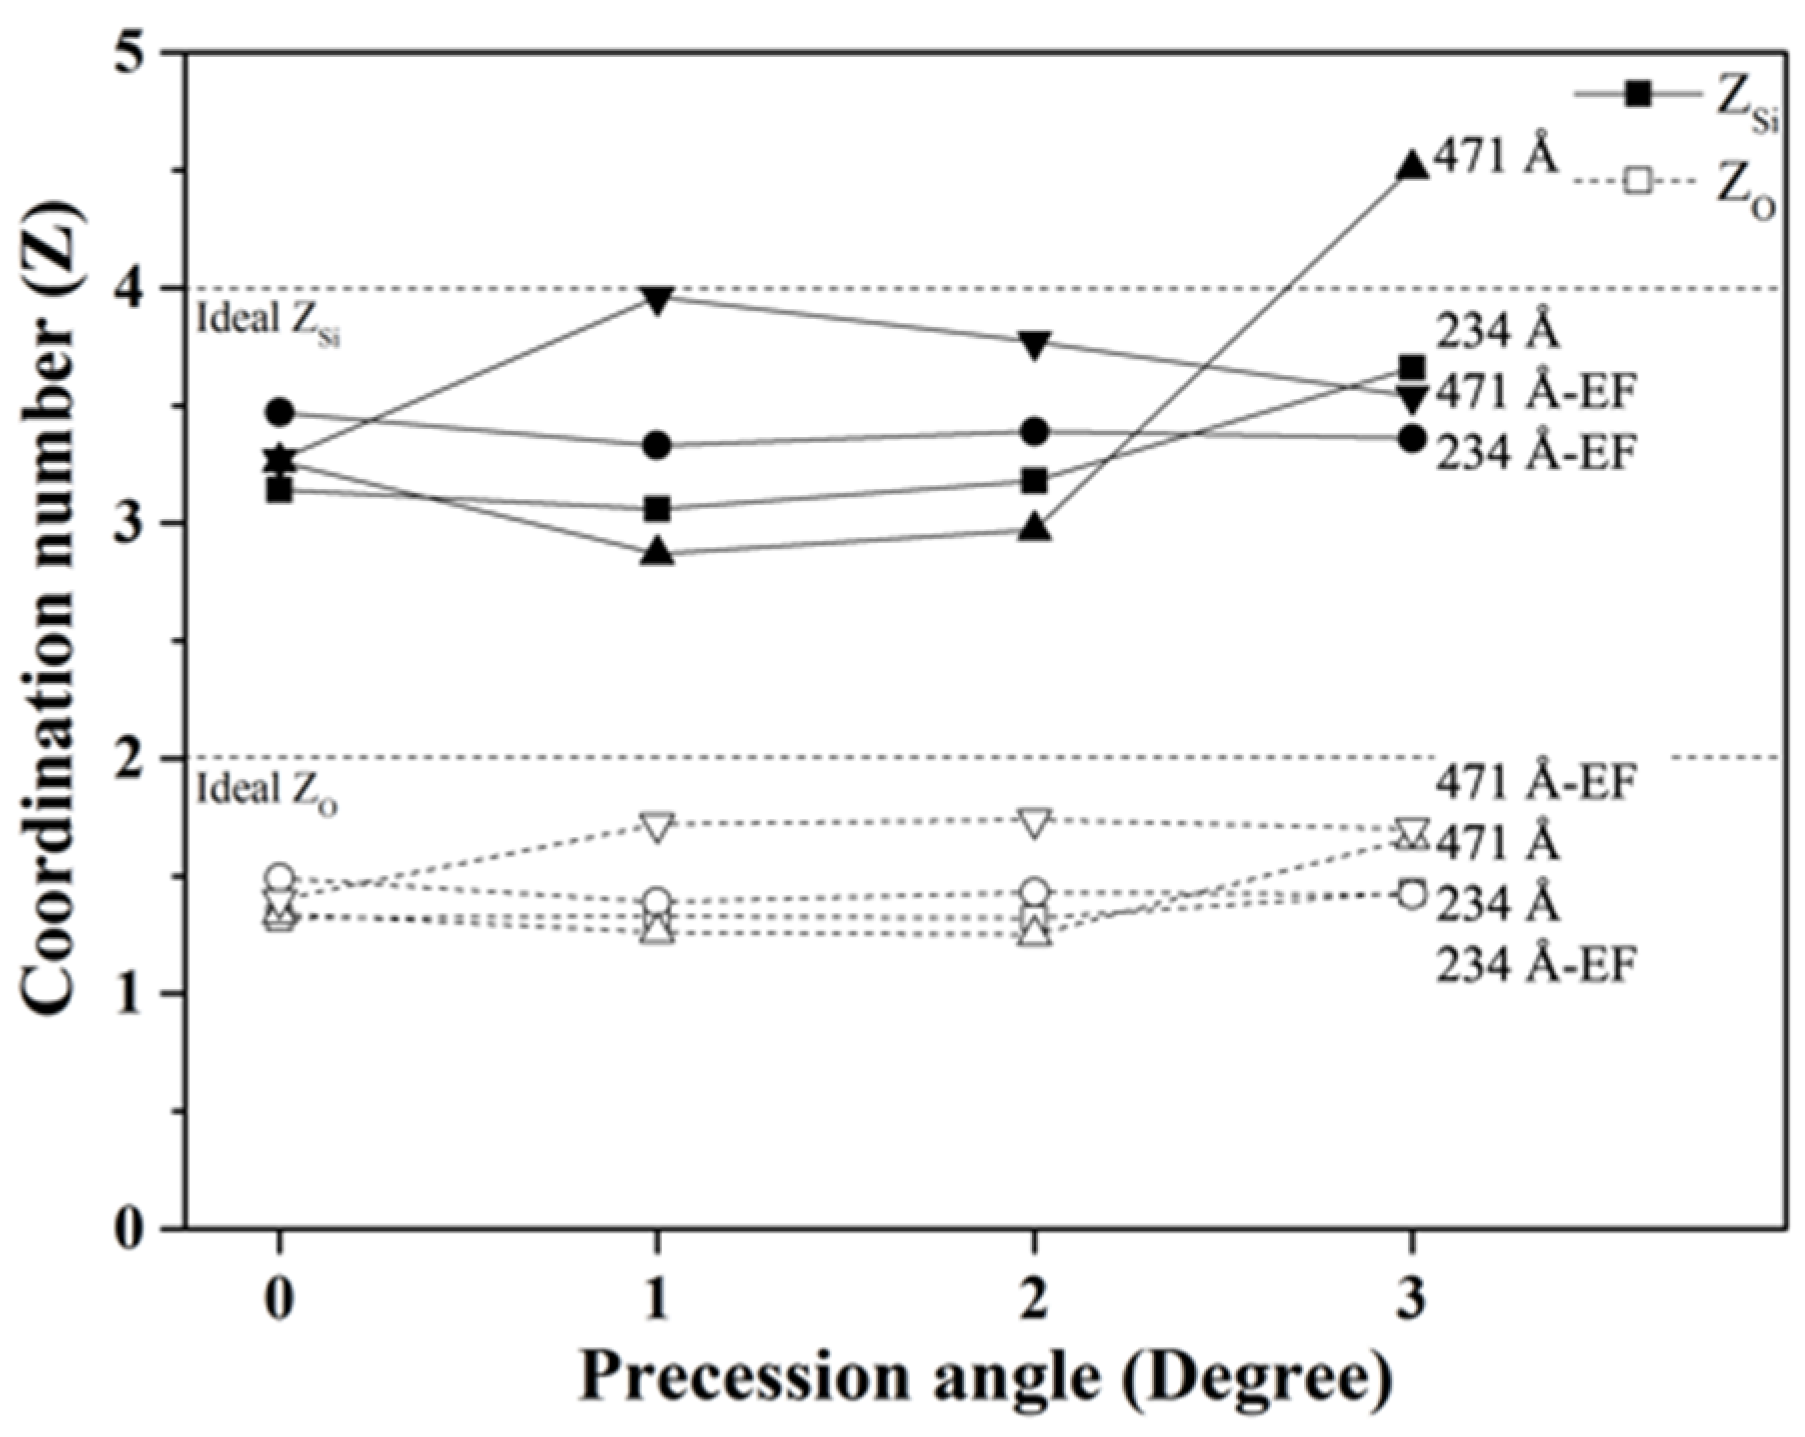
3.2. Influence of Precession Angle
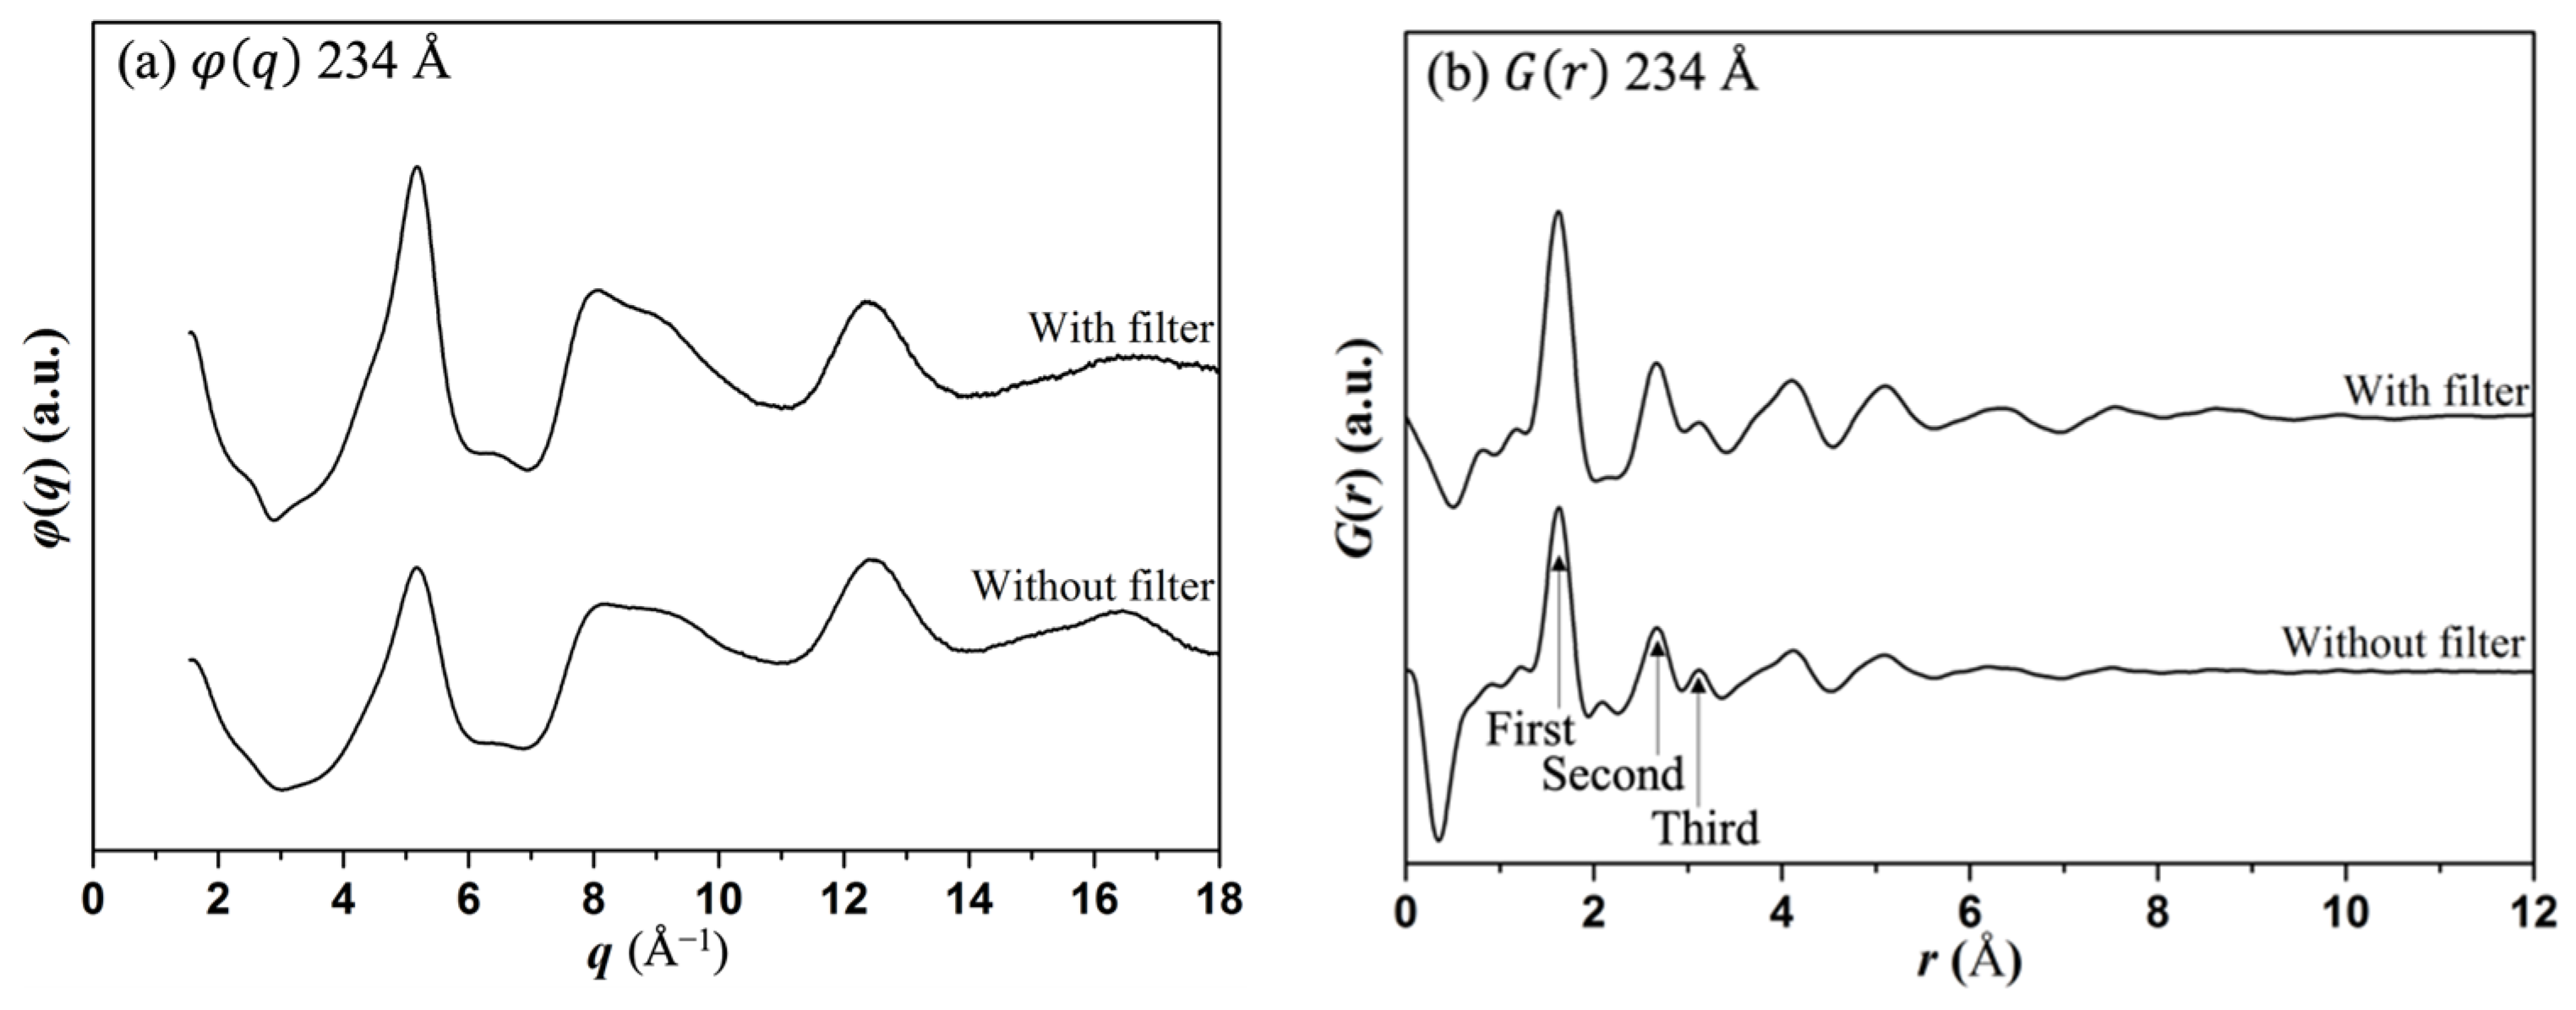
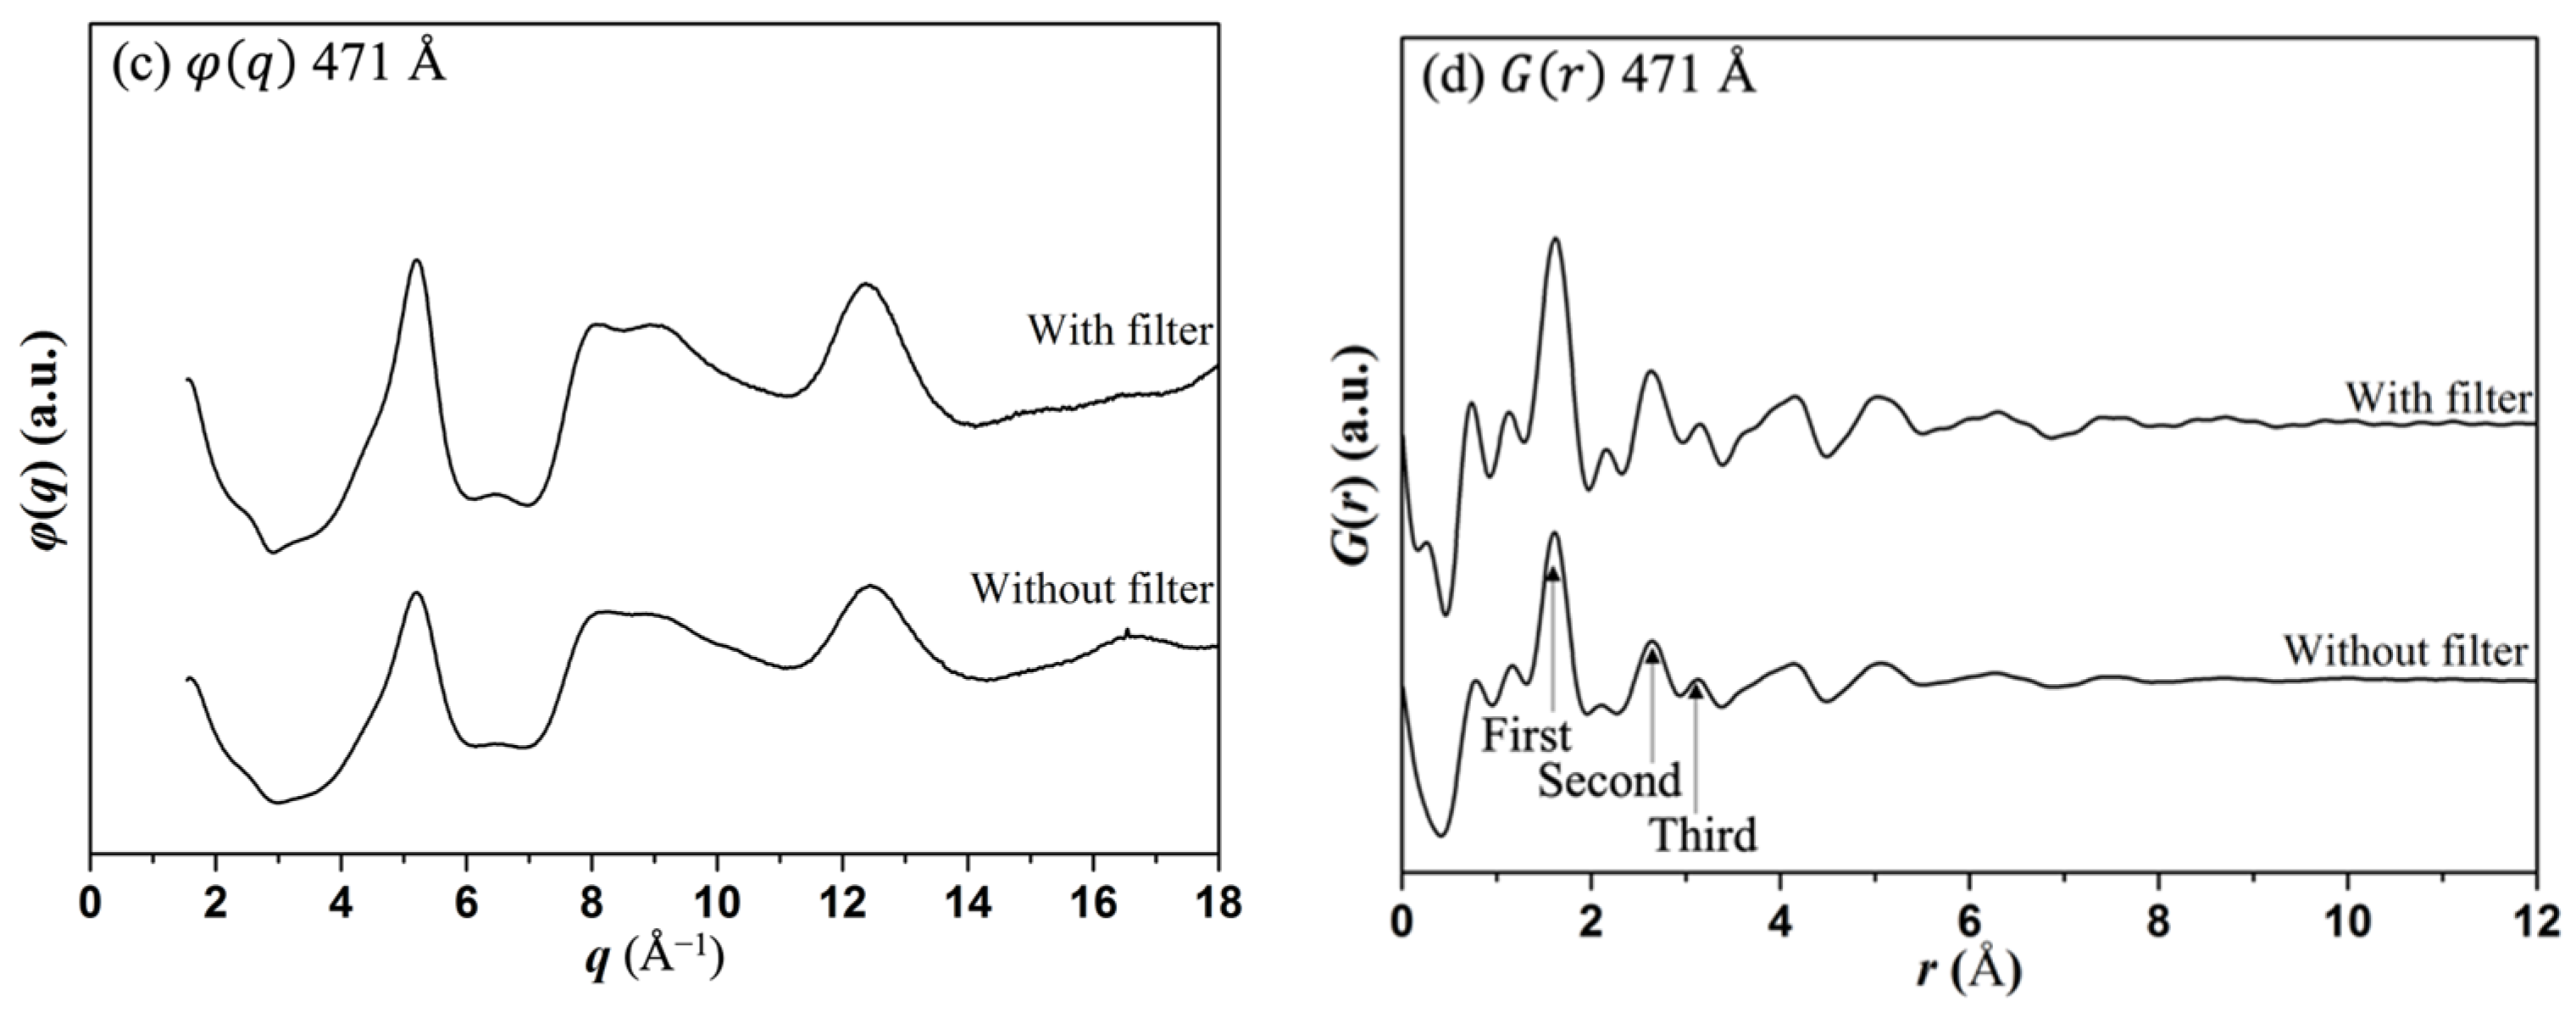
3.3. Influence of Energy Filtering on the RDF
3.4. Influence of Experimental Parameters on the Refined Structure
4. Discussion
4.1. Influence of Sample Thickness
4.2. Influence of Precession
4.3. Influence of Energy Filtering
5. Conclusions
Author Contributions
Funding
Data Availability Statement
Acknowledgments
Conflicts of Interest
References
- Lee, B. Review of the present status of optical fiber sensors. Opt. Fiber Technol. 2003, 9, 57–79. [Google Scholar] [CrossRef]
- Kuo, C.-K.; Huang, H.-W.; Chen, L.-G.; Chou, Y.-J. Fabrication and characterization of freeze dried strontium-doped bioactive glasses/chitosan composite scaffolds for biomedical engineering. J. Asian Ceram. Soc. 2021, 9, 1173–1182. [Google Scholar] [CrossRef]
- Zachariasen, W.H. The atomic arrangement in glass. J. Am. Chem. Soc. 1932, 54, 3841–3851. [Google Scholar] [CrossRef]
- Ferrari, A.C.; Robertson, J. Raman spectroscopy of amorphous, nanostructured, diamond–like carbon, and nanodiamond. Philos. Trans. R. Soc. London. Ser. A Math. Phys. Eng. Sci. 2004, 362, 2477–2512. [Google Scholar] [CrossRef]
- Malfait, W.J.; Halter, W.E.; Morizet, Y.; Meier, B.H.; Verel, R. Structural control on bulk melt properties: Single and double quantum 29Si NMR spectroscopy on alkali-silicate glasses. Geochim. Cosmochim. Acta 2007, 71, 6002–6018. [Google Scholar] [CrossRef]
- Cockayne, D.J.H.; McKenzie, D.R. Electron diffraction analysis of polycrystalline and amorphous thin films. Acta Crystallogr. A 1988, 44, 870–878. [Google Scholar] [CrossRef] [Green Version]
- Cockayne, D.J.H. The Study of Nanovolumes of Amorphous Materials Using Electron Scattering. Annu. Rev. Mater. Res. 2007, 37, 159–187. [Google Scholar] [CrossRef]
- Sproul, A.; McKenzie, D.R.; Cockayne, D.J.H. Structural study of hydrogenated amorphous silicon–carbon alloys. Philos. Mag. B 1986, 54, 113–131. [Google Scholar] [CrossRef] [Green Version]
- Eggeman, A.S.; Barnard, J.S.; Midgley, P.A. Aberration-Corrected and Energy-Filtered Precession Electron Diffraction. Z. Kristallogr. 2013, 228, 43–50. [Google Scholar] [CrossRef]
- Vincent, R.; Midgley, P.A. Double conical beam-rocking system for measurement of integrated electron diffraction intensities. Ultramicroscopy 1994, 53, 271–282. [Google Scholar] [CrossRef]
- Gjønnes, K. On the integration of electron diffraction intensities in the Vincent-Midgley precession technique. Ultramicroscopy 1997, 69, 1–11. [Google Scholar] [CrossRef]
- Gemmi, M.; Righi, L.; Calestani, G.; Migliori, A.; Speghini, A.; Santarosa, M.; Bettinelli, M. Structure determination of φ-Bi8Pb5O17 by electron and powder X-ray diffraction. Ultramicroscopy 2000, 84, 133–142. [Google Scholar] [CrossRef]
- Abeykoon, A.M.; Hu, H.; Wu, L.; Zhu, Y.; Billinge, S.J. Calibration and data collection protocols for reliable lattice parameter values in electron pair distribution function studies. J. Appl. Crystallogr. 2015, 48, 244–251. [Google Scholar] [CrossRef] [Green Version]
- Abeykoon, A.M.M.; Malliakas, C.D.; Juhás, P.; Bozin, E.S.; Kanatzidis, M.G.; Billinge, S.J.L. Quantitative Nanostructure Characterization Using Atomic Pair Distribution Functions Obtained From Laboratory Electron Microscopes. Z. Kristallogr. 2012, 227, 248–256. [Google Scholar] [CrossRef] [Green Version]
- Kis, V.R.C.K.; Dódony, I.N.; Lábár, J.N.L. Amorphous and partly ordered structures in SiO2 rich volcanic glasses. An ED study. Eur. J. Mineral. 2006, 18, 745–752. [Google Scholar] [CrossRef]
- Petersen, T.C.; McBride, W.; McCulloch, D.G.; Snook, I.K.; Yarovsky, I. Refinements in the collection of energy filtered diffraction patterns from disordered materials. Ultramicroscopy 2005, 103, 275–283. [Google Scholar] [CrossRef]
- Ankele, J.; Mayer, J.; Lamparter, P.; Steeb, S. Quantitative Electron Diffraction Data of Amorphous Materials. Z. Für Nat. A 2005, 60, 459–468. [Google Scholar] [CrossRef] [Green Version]
- Warren, B.E. X-ray Diffraction; Courier Dover Publications: New York, NY, USA, 1969. [Google Scholar]
- Malis, T.; Cheng, S.C.; Egerton, R.F. EELS log-ratio technique for specimen-thickness measurement in the TEM. J. Electron Microsc. Tech. 1988, 8, 193–200. [Google Scholar] [CrossRef]
- Shanmugam, J.; Borisenko, K.B.; Chou, Y.-J.; Kirkland, A.I. eRDF Analyser: An interactive GUI for electron reduced density function analysis. SoftwareX 2017, 6, 185–192. [Google Scholar] [CrossRef]
- Lábár, J.L.; Das, P.P. Pattern Center and Distortion Determined from Faint, Diffuse Electron Diffraction Rings from Amorphous Materials. Microsc. Micoanal. 2017, 23, 647–660. [Google Scholar] [CrossRef]
- Tran, D.T.; Svensson, G.; Tai, C.-W. SUePDF: A program to obtain quantitative pair distribution functions from electron diffraction data. J. Appl. Crystallogr. 2017, 50, 304–312. [Google Scholar] [CrossRef] [Green Version]
- Shi, H.; Luo, M.; Wang, W. ePDF tools, a processing and analysis package of the atomic pair distribution function for electron diffraction. Comput. Phys. Commun. 2019, 238, 295–301. [Google Scholar] [CrossRef]
- Mitchell, D.R.G.; Petersen, T.C. RDFTools: A software tool for quantifying short-range ordering in amorphous materials. Microsc. Res. Tech. 2012, 75, 153–163. [Google Scholar] [CrossRef]
- McGreevy, R.L. Reverse Monte Carlo modelling. J. Phys. Condens. Mat. 2001, 13, R877–R913. [Google Scholar] [CrossRef]
- Borisenko, K.B.; Chen, Y.; Cockayne, D.J.H.; Song, S.A.; Jeong, H.S. Understanding atomic structures of amorphous C-doped Ge2Sb2Te5 phase-change memory materials. Acta Mater. 2011, 59, 4335–4342. [Google Scholar] [CrossRef]
- Clark, S.J.; Segall, M.D.; Pickard, C.J.; Hasnip, P.J.; Probert, M.I.J.; Refson, K.; Payne, M.C. First principles methods using CASTEP. Z. Für Krist.-Cryst. Mater. 2005, 220, 567–570. [Google Scholar] [CrossRef] [Green Version]
- Perdew, J.P.; Burke, K.; Ernzerhof, M. Generalized Gradient Approximation Made Simple. Phys. Rev. Lett. 1996, 77, 3865–3868. [Google Scholar] [CrossRef] [Green Version]
- Martyna, G.J.; Klein, M.L.; Tuckerman, M. Nosé–Hoover chains: The canonical ensemble via continuous dynamics. J. Chem. Phys. 1992, 97, 2635–2643. [Google Scholar] [CrossRef]
- Poulsen, H.F.; Neuefeind, J.; Neumann, H.B.; Schneider, J.R.; Zeidler, M.D. Amorphous silica studied by high energy X-ray diffraction. J. Non-Cryst. Solids 1995, 188, 63–74. [Google Scholar] [CrossRef]
- Anstis, G.R.; Liu, Z.; Lake, M. Investigation of amorphous materials by electron diffraction—The effects of multiple scattering. Ultramicroscopy 1988, 26, 65–69. [Google Scholar] [CrossRef]
- Hoque, M.M.; Vergara, S.; Das, P.P.; Ugarte, D.; Santiago, U.; Kumara, C.; Whetten, R.L.; Dass, A.; Ponce, A. Structural Analysis of Ligand-Protected Smaller Metallic Nanocrystals by Atomic Pair Distribution Function under Precession Electron Diffraction. J. Phys. Chem. C 2019, 123, 19894–19902. [Google Scholar] [CrossRef]


| {hkl} | Pixel Number n (Pixel) | Lattice Spacing d (Å) | Calibration Factor (1/(n·d)) |
|---|---|---|---|
| {111} | 382 | 2.34 | 0.00224 |
| {200} | 445 | 2.02 | 0.00222 |
| {220} | 628 | 1.43 | 0.00223 |
| {311} | 734 | 1.22 | 0.00223 |
| Average = 0.00223 |
| (a) Peak Position/(Å) | First | Second | Third |
| 234 Å | 1.63 | 2.67 | 3.12 |
| 471 Å | 1.61 | 2.64 | 3.13 |
| (b) Peak Amplitude/(a.u.) | First | Second | Third |
| 234 Å | 2.70 | 1.10 | 0.32 |
| 471 Å | 2.36 | 1.03 | 0.25 |
| (a) Peak Position/Å | First | Second | Third | |
| 234 Å | P = 0° | 1.63 | 2.67 | 3.12 |
| P = 1° | 1.62 | 2.67 | 3.12 | |
| P = 2° | 1.63 | 2.67 | 3.14 | |
| P = 3° | 1.61 | 2.66 | 3.04 | |
| 471 Å | P = 0° | 1.61 | 2.64 | 3.13 |
| P = 1° | 1.61 | 2.65 | 3.14 | |
| P = 2° | 1.62 | 2.66 | 3.13 | |
| P = 3° | 1.64 | 2.69 | 3.13 | |
| (b) Peak Amplitude/(a.u.) | First | Second | Third | |
| 234 Å | P = 0° | 2.70 | 1.10 | 0.32 |
| P = 1° | 2.66 | 1.11 | 0.34 | |
| P = 2° | 2.59 | 1.06 | 0.30 | |
| P = 3° | 3.06 | 1.25 | 0.11 | |
| 471 Å | P = 0° | 2.36 | 1.03 | 0.25 |
| P = 1° | 2.31 | 1.03 | 0.27 | |
| P = 2° | 2.39 | 1.02 | 0.28 | |
| P = 3° | 2.65 | 0.87 | 0.17 | |
| (a) Peak Position/(Å) | First | Second | Third | |
| 234 Å | Without energy filter | 1.63 | 2.67 | 3.12 |
| With energy filter | 1.62 | 2.67 | 3.12 | |
| 471 Å | Without energy filter | 1.61 | 2.64 | 3.13 |
| With energy filter | 1.62 | 2.63 | 3.15 | |
| (b) Peak Amplitude/(a.u.) | First | Second | Third | |
| 234 Å | Without energy filter | 2.70 | 1.10 | 0.32 |
| With energy filter | 3.51 | 1.40 | 0.14 | |
| 471 Å | Without energy filter | 2.36 | 1.03 | 0.25 |
| With energy filter | 3.18 | 1.46 | 0.29 | |
| Thickness/Å | Energy Filtering | Precession Angle/Deg | ZSi (Ideal 4) | ZO (Ideal 2) | Si-O/Å | R-Factor/% |
|---|---|---|---|---|---|---|
| 234 | No | 0 | 3.14 | 1.32 | 1.67(19) | 12.5 |
| 1 | 3.06 | 1.33 | 1.68(20) | 11.9 | ||
| 2 | 3.18 | 1.32 | 1.67(19) | 12.4 | ||
| 3 | 3.66 | 1.43 | 1.63(19) | 15.3 | ||
| Yes | 0 | 3.47 | 1.49 | 1.64(18) | 14.7 | |
| 1 | 3.33 | 1.39 | 1.64(15) | 15.0 | ||
| 2 | 3.39 | 1.43 | 1.64(14) | 19.1 | ||
| 3 | 3.36 | 1.42 | 1.64(12) | 14.0 | ||
| 471 | No | 0 | 3.26 | 1.34 | 1.67(20) | 12.8 |
| 1 | 2.87 | 1.26 | 1.69(22) | 12.5 | ||
| 2 | 2.97 | 1.25 | 1.67(21) | 15.7 | ||
| 3 | 4.51 | 1.66 | 1.53(25) | 19.7 | ||
| Yes | 0 | 3.27 | 1.4 | 1.67(19) | 16.8 | |
| 1 | 3.96 | 1.72 | 1.61(19) | 16.9 | ||
| 2 | 3.77 | 1.74 | 1.61(18) | 17.6 | ||
| 3 | 3.54 | 1.7 | 1.63(13) | 16.1 |
Disclaimer/Publisher’s Note: The statements, opinions and data contained in all publications are solely those of the individual author(s) and contributor(s) and not of MDPI and/or the editor(s). MDPI and/or the editor(s) disclaim responsibility for any injury to people or property resulting from any ideas, methods, instructions or products referred to in the content. |
© 2023 by the authors. Licensee MDPI, Basel, Switzerland. This article is an open access article distributed under the terms and conditions of the Creative Commons Attribution (CC BY) license (https://creativecommons.org/licenses/by/4.0/).
Share and Cite
Chou, Y.-J.; Borisenko, K.B.; Das, P.P.; Nicolopoulos, S.; Gemmi, M.; Kirkland, A.I. Influence of Precession Electron Diffraction Parameters and Energy Filtering on Reduced Density Function Analysis of Thin Amorphous Silica Films—Implications for Structural Studies. Symmetry 2023, 15, 1291. https://doi.org/10.3390/sym15071291
Chou Y-J, Borisenko KB, Das PP, Nicolopoulos S, Gemmi M, Kirkland AI. Influence of Precession Electron Diffraction Parameters and Energy Filtering on Reduced Density Function Analysis of Thin Amorphous Silica Films—Implications for Structural Studies. Symmetry. 2023; 15(7):1291. https://doi.org/10.3390/sym15071291
Chicago/Turabian StyleChou, Yu-Jen, Konstantin B. Borisenko, Partha Pratim Das, Stavros Nicolopoulos, Mauro Gemmi, and Angus I. Kirkland. 2023. "Influence of Precession Electron Diffraction Parameters and Energy Filtering on Reduced Density Function Analysis of Thin Amorphous Silica Films—Implications for Structural Studies" Symmetry 15, no. 7: 1291. https://doi.org/10.3390/sym15071291