
Effects of Support Friction on Mixed-Mode I/II Fracture Behavior of Compacted Clay Using Notched Deep Beam Specimens under Symmetric Fixed Support

Abstract
:1. Introduction
2. Numerical Model for NDB Specimens
2.1. Loading Principle of NDB Specimens
2.2. Finite Element Model of NDB Specimens
2.3. Calculation Scheme
3. Effect of Support Friction on the Stress Field at the Crack Tip of NDB Specimens
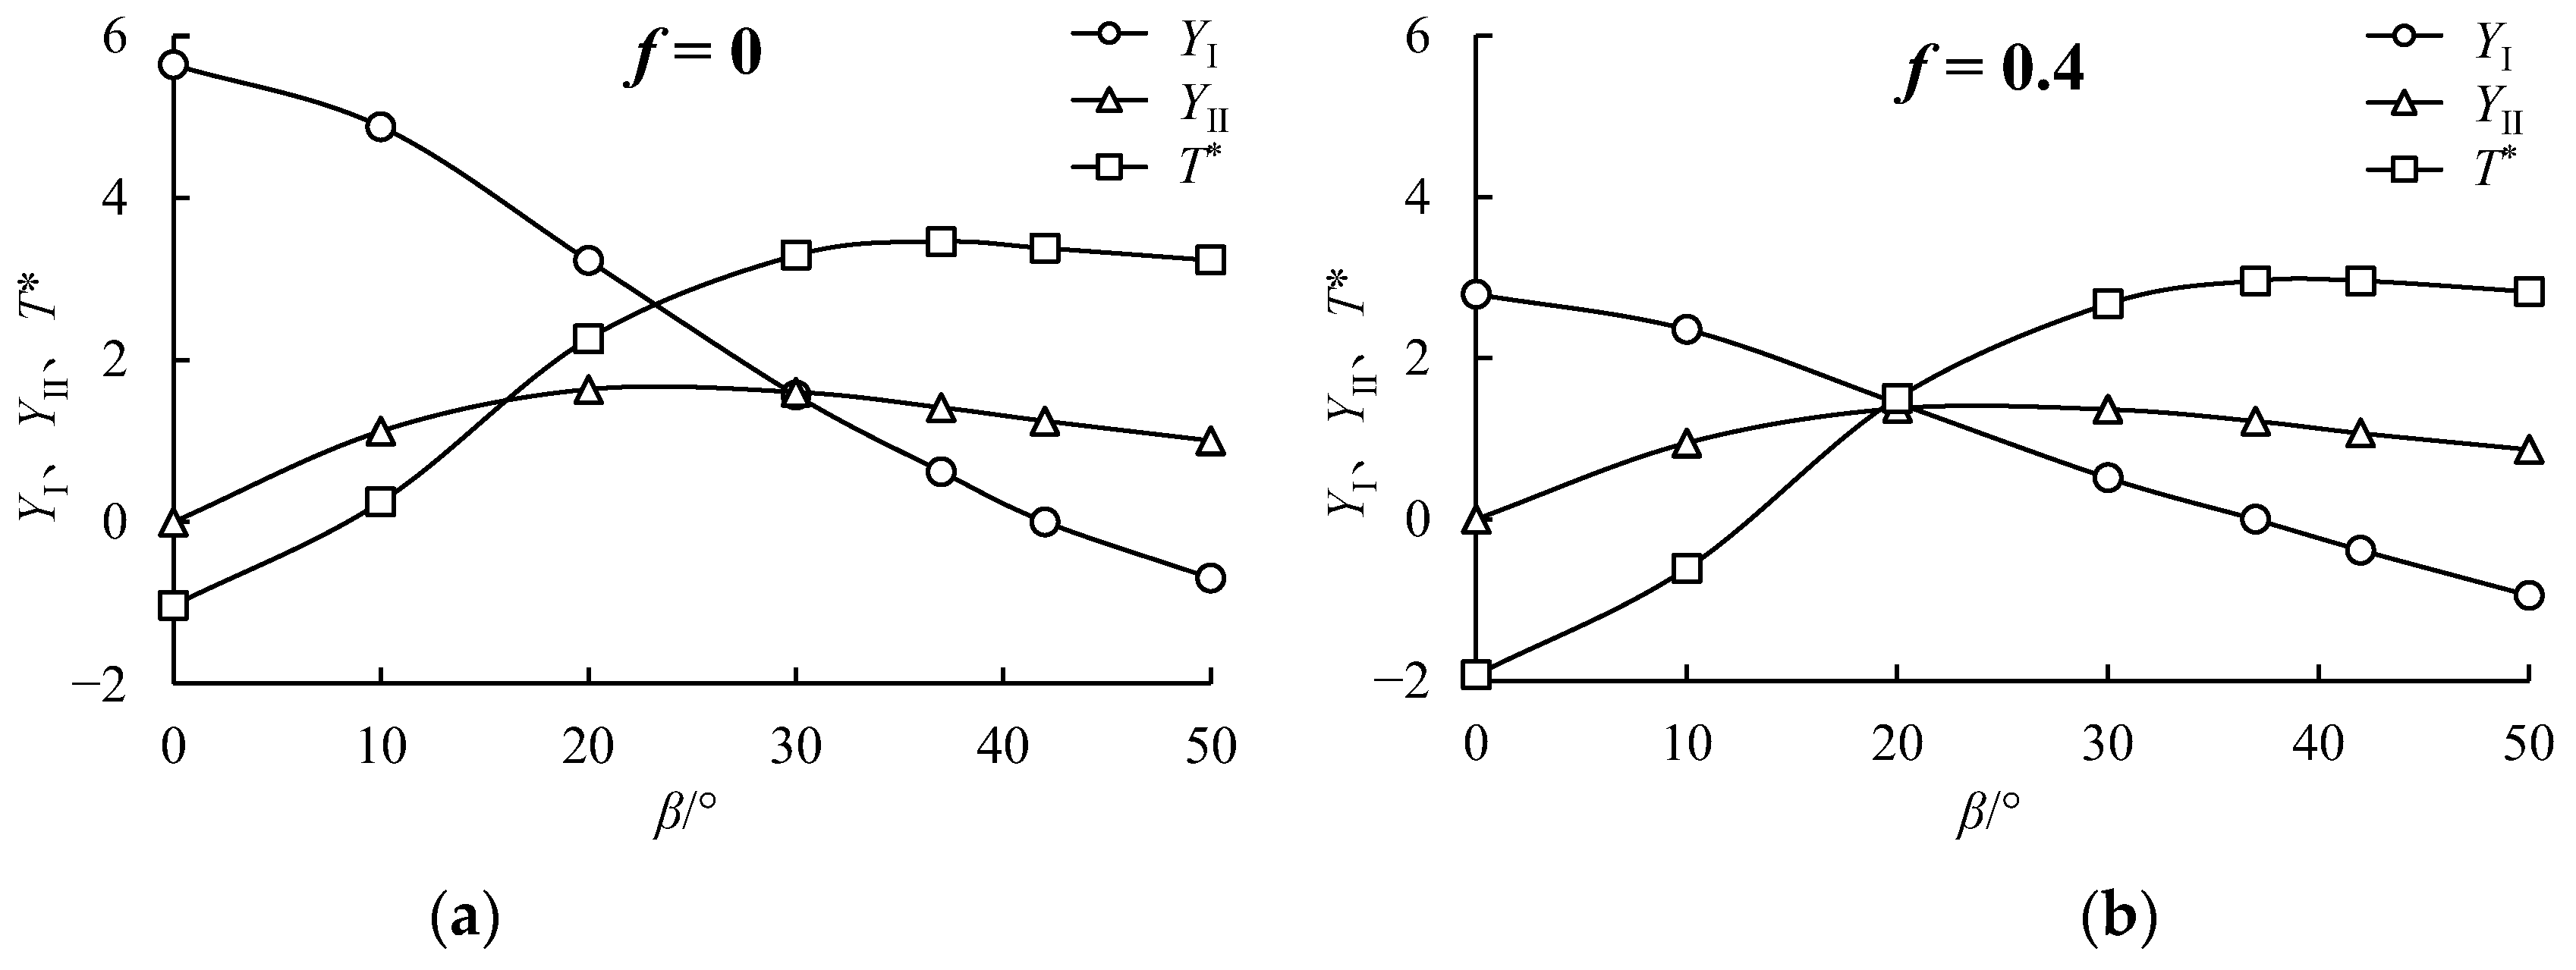
3.1. Variation Curve of YI with β under Different Support Friction Conditions
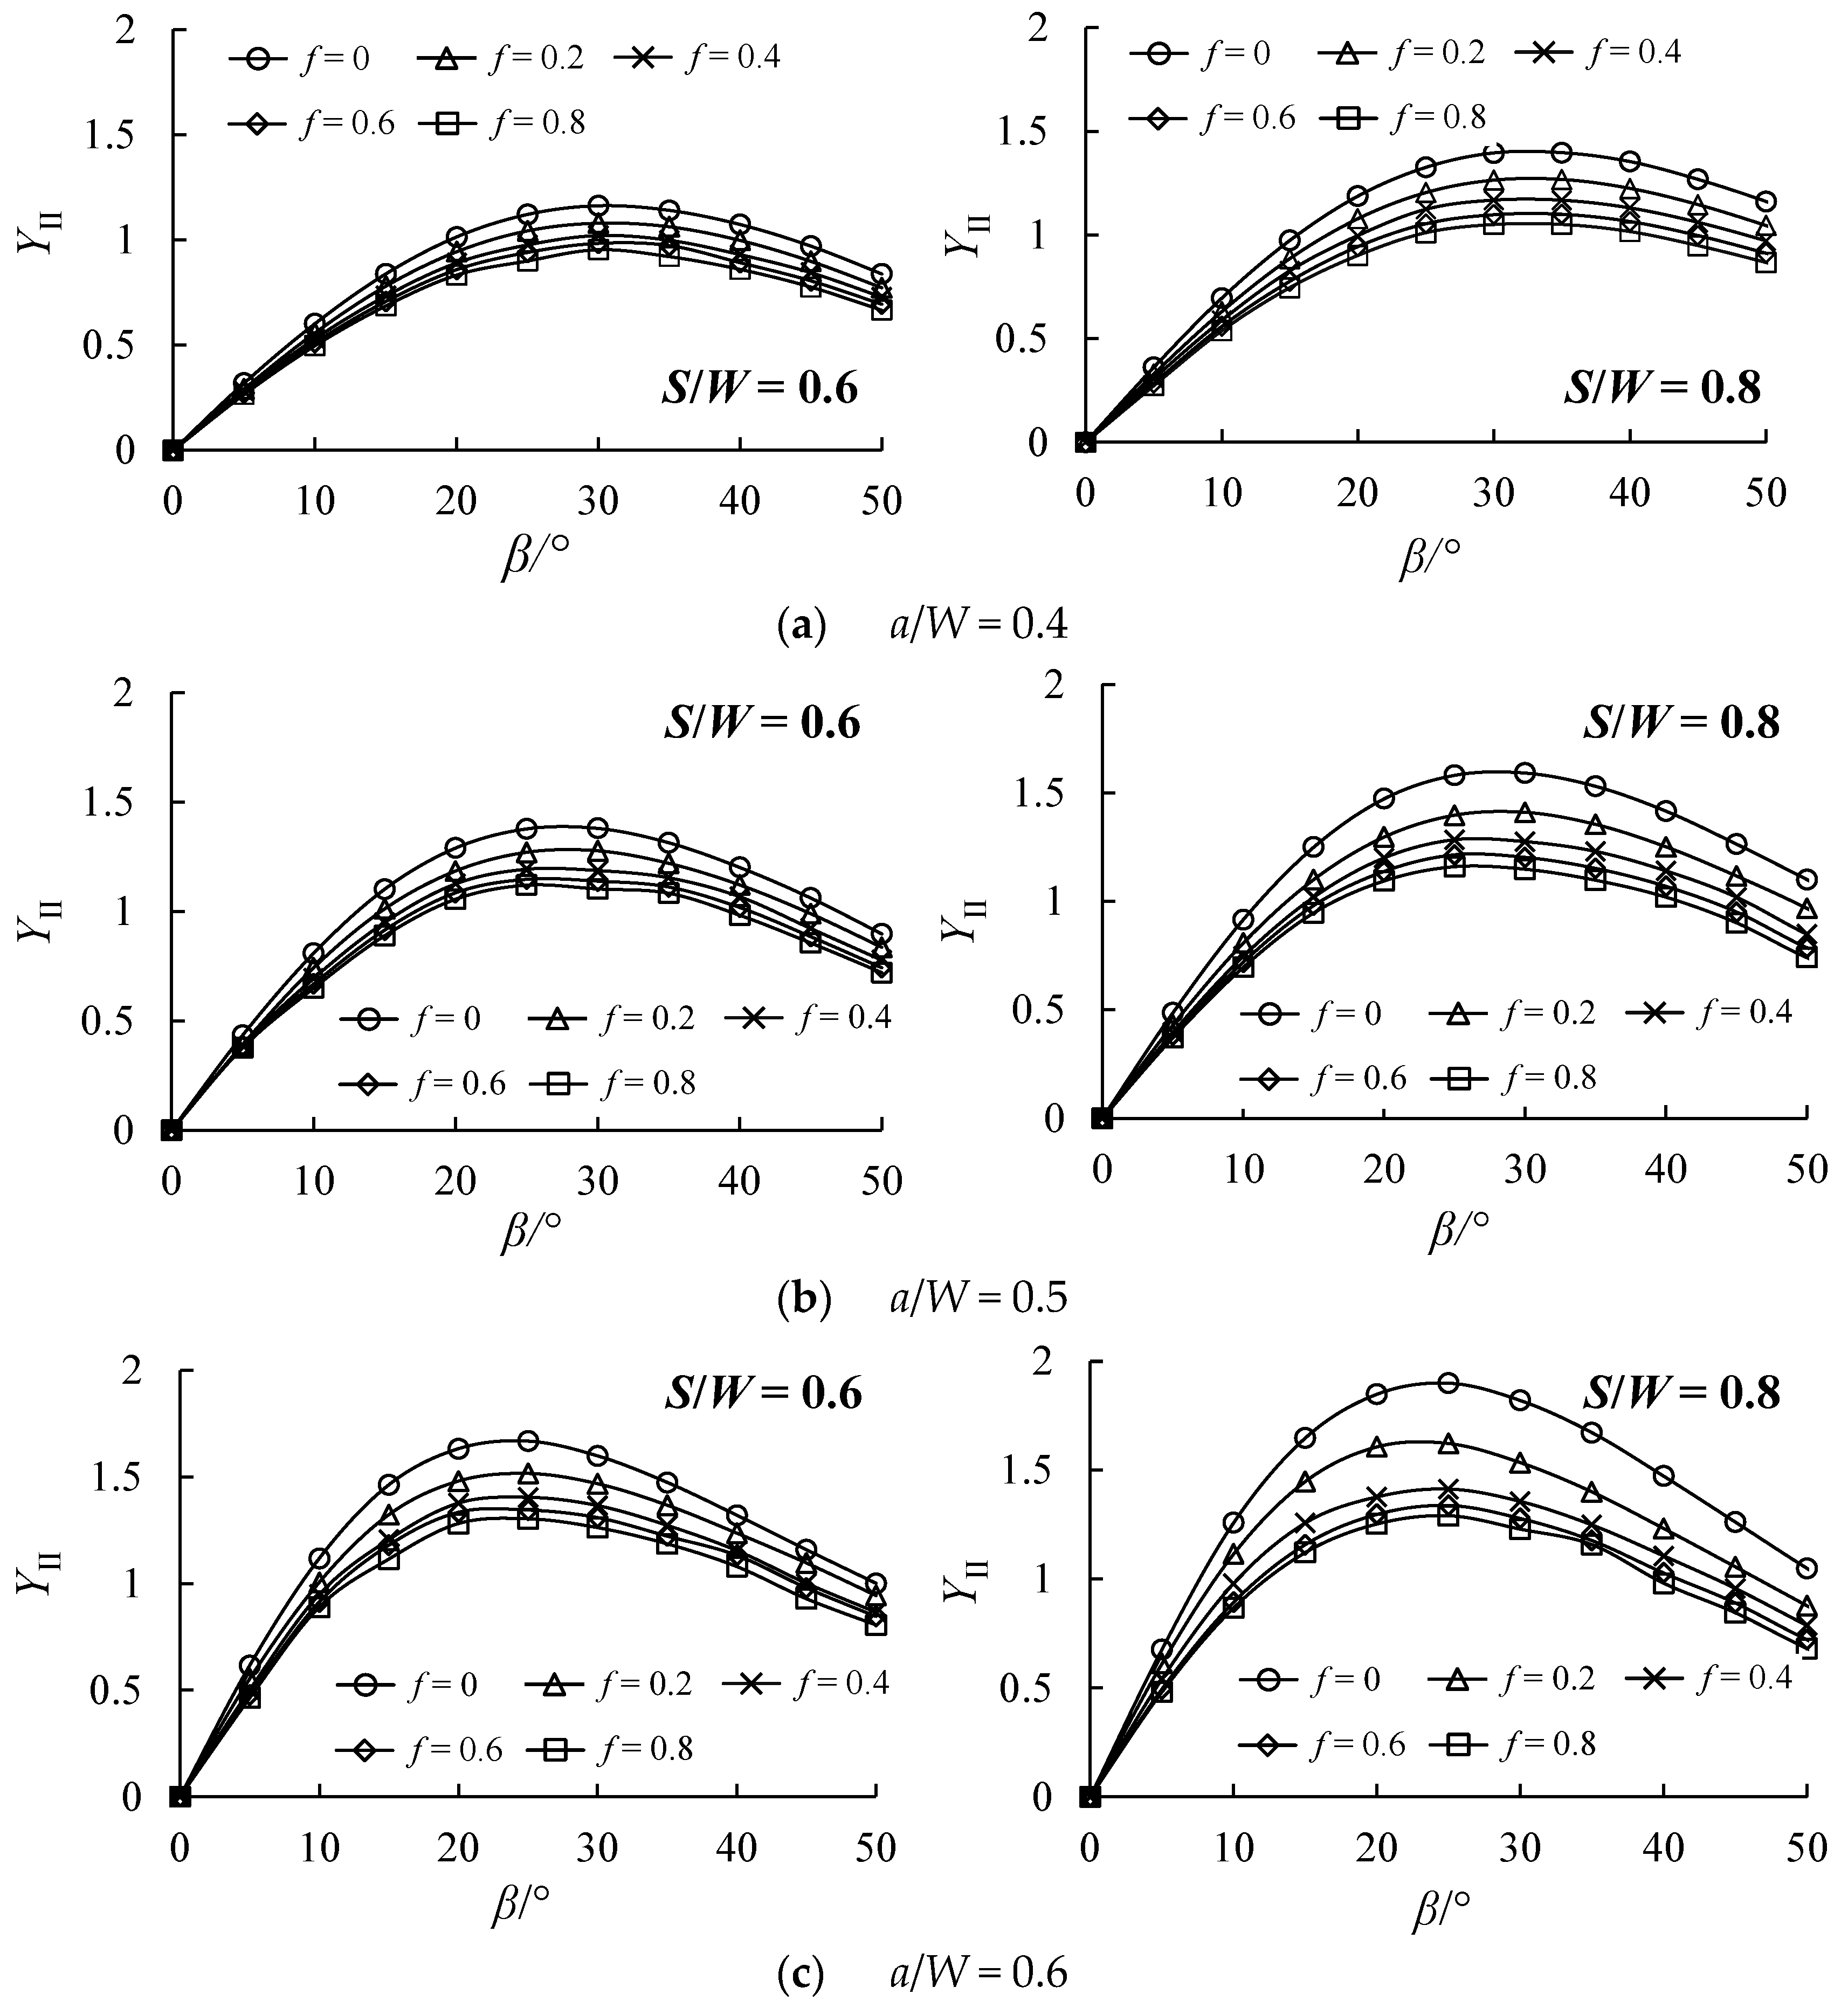
3.2. Variation Curve of YII with β under Different Support Friction Conditions
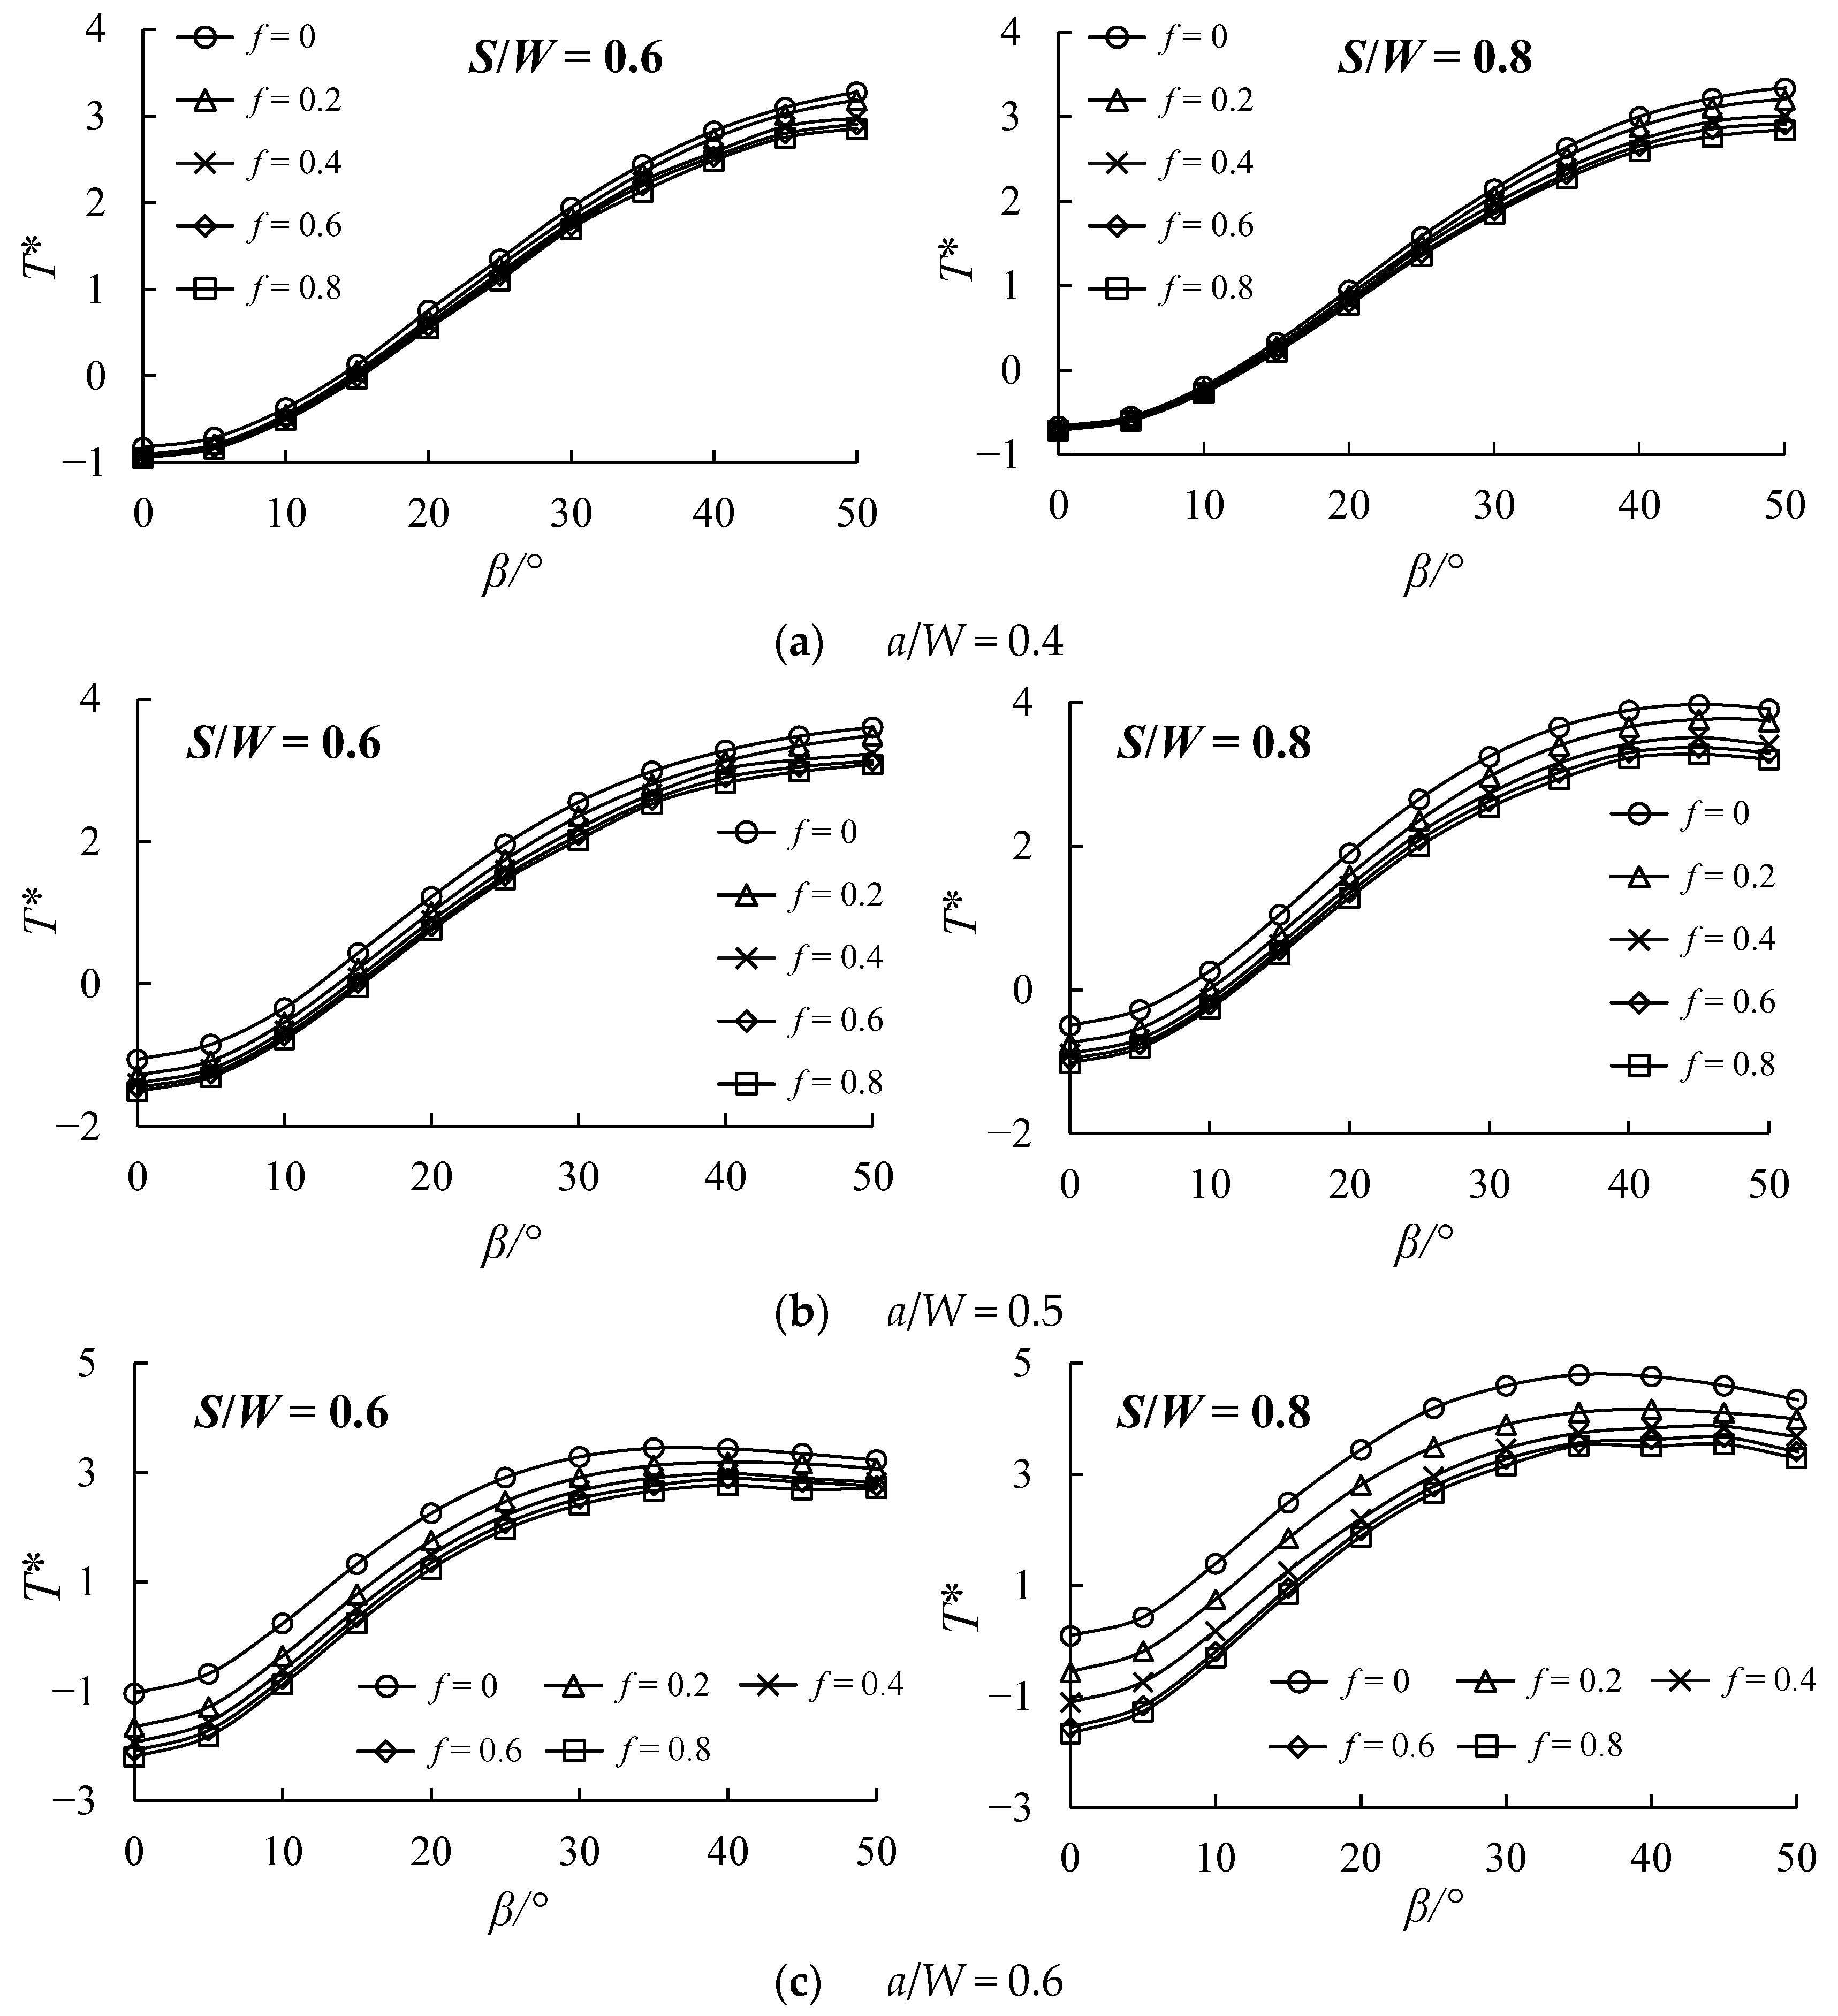
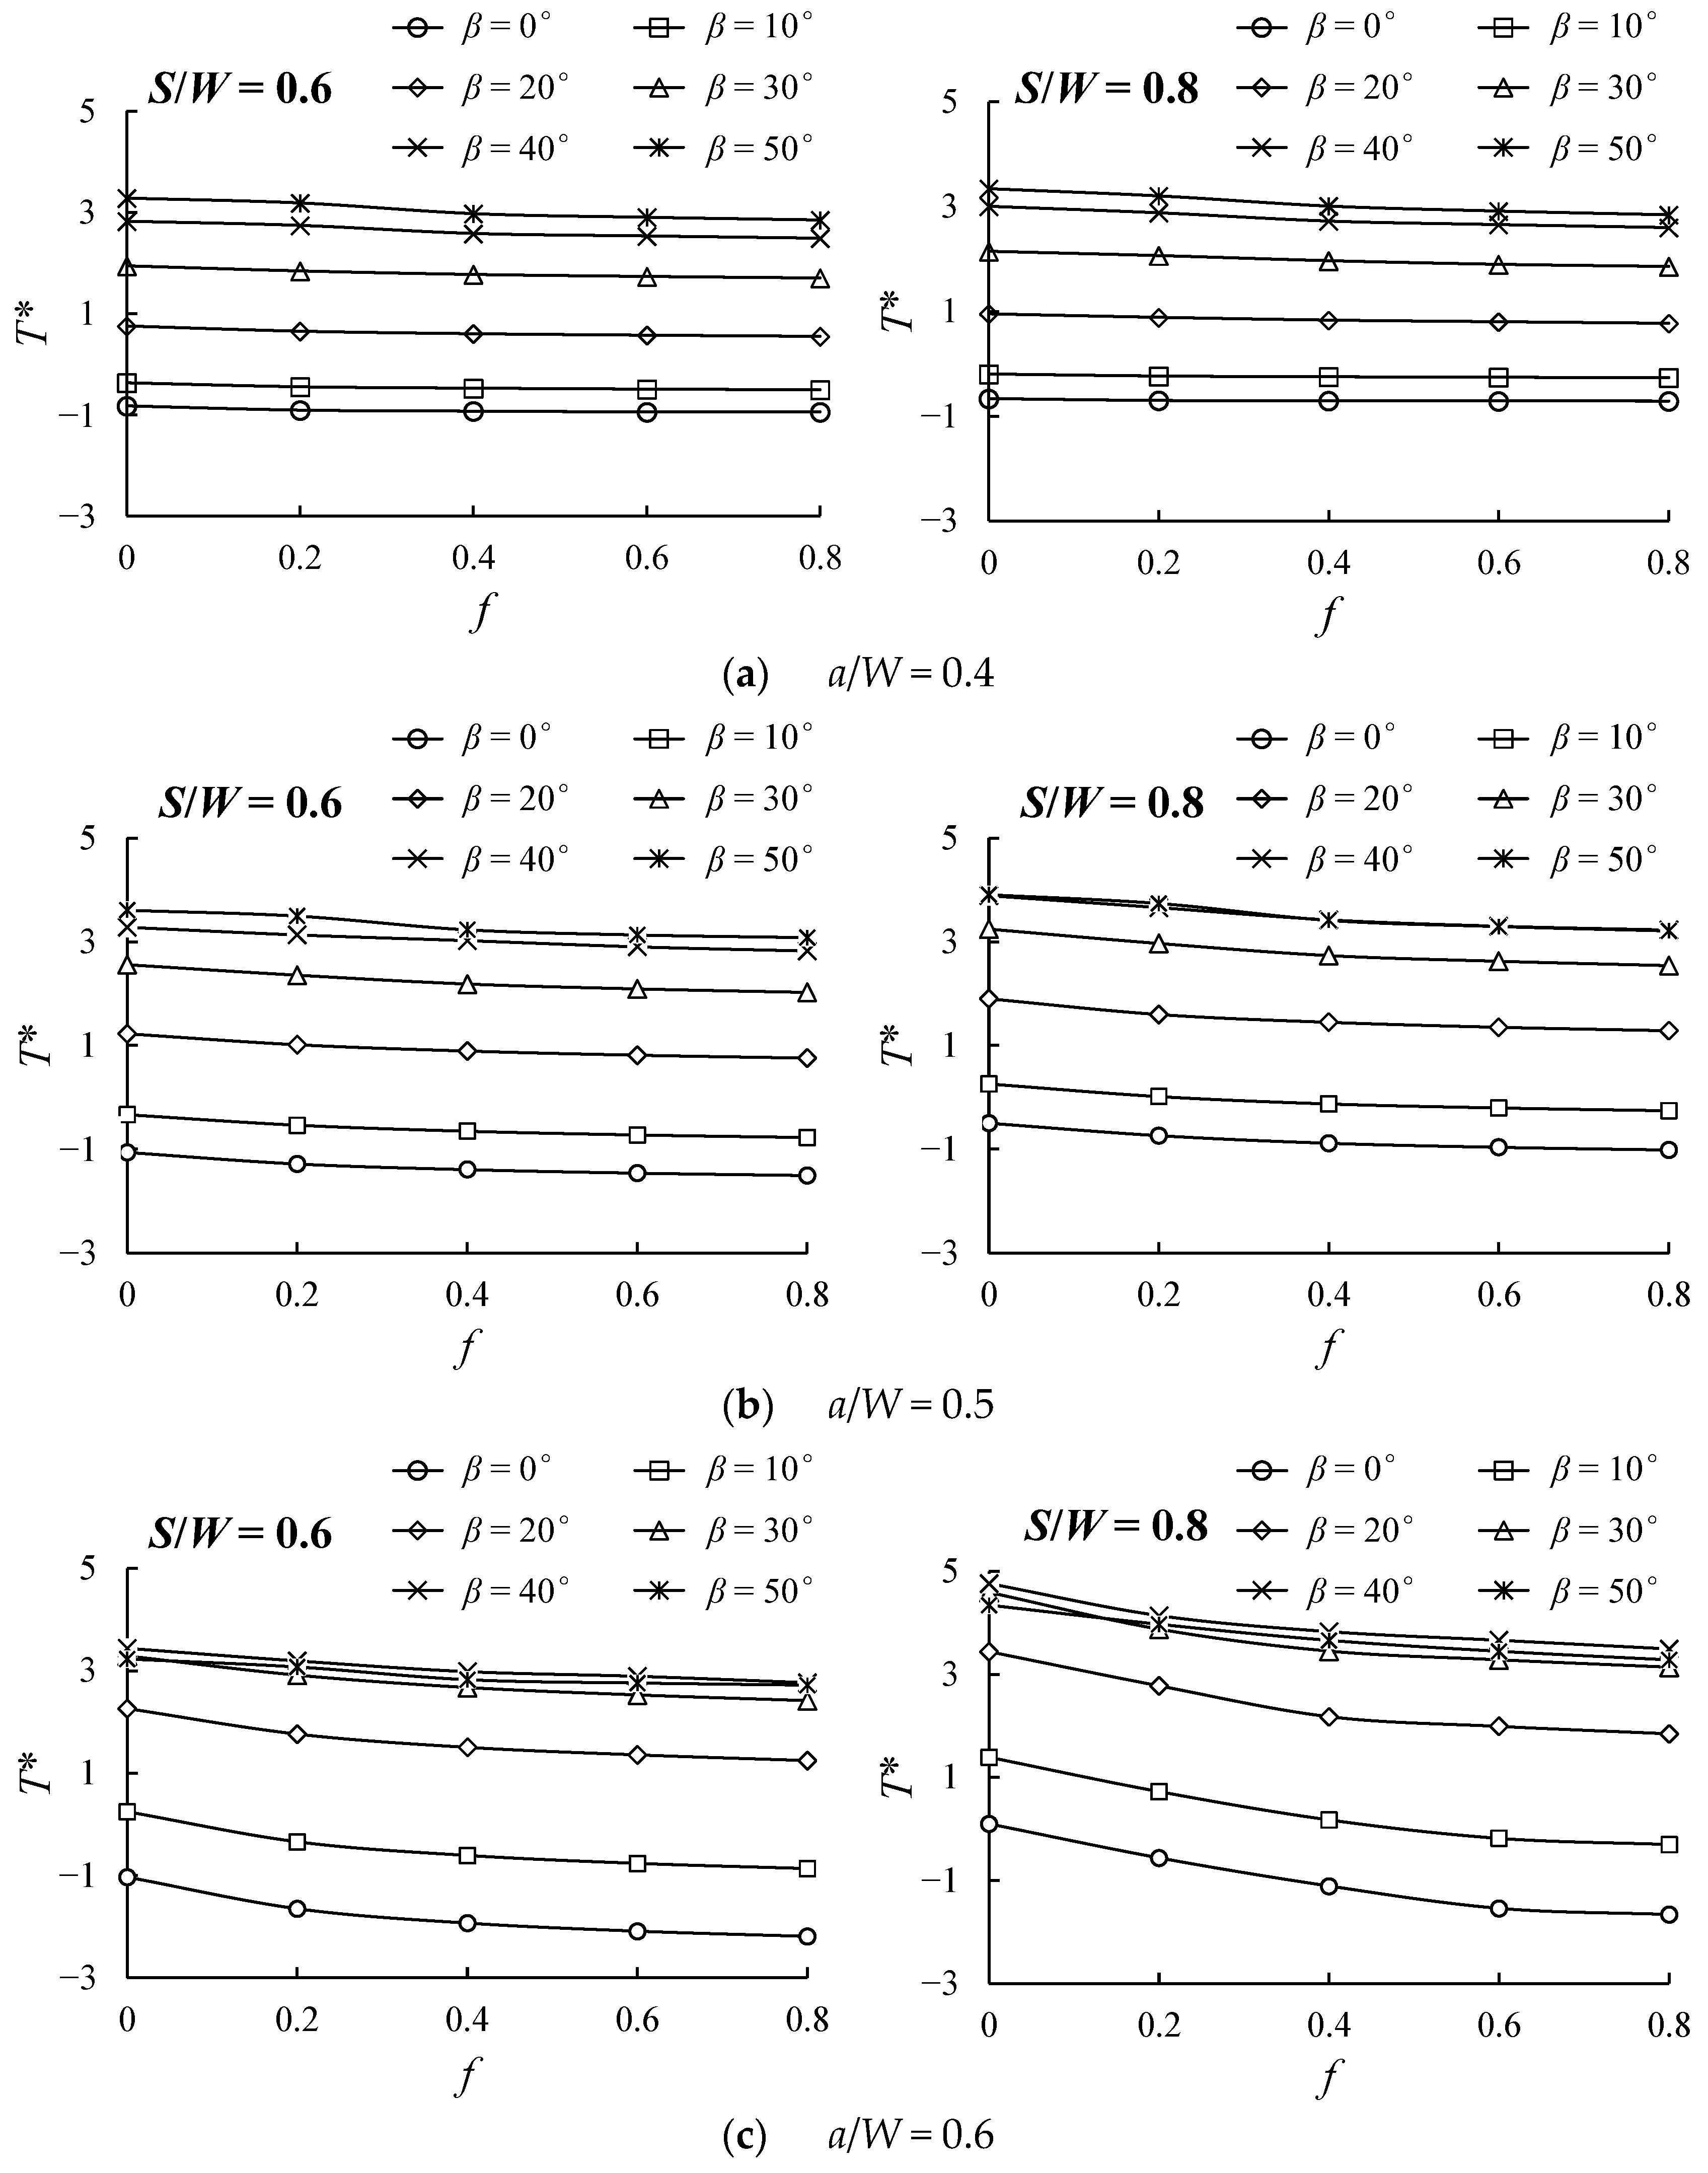
3.3. Variation Curve of T* with β under Different Support Friction Conditions
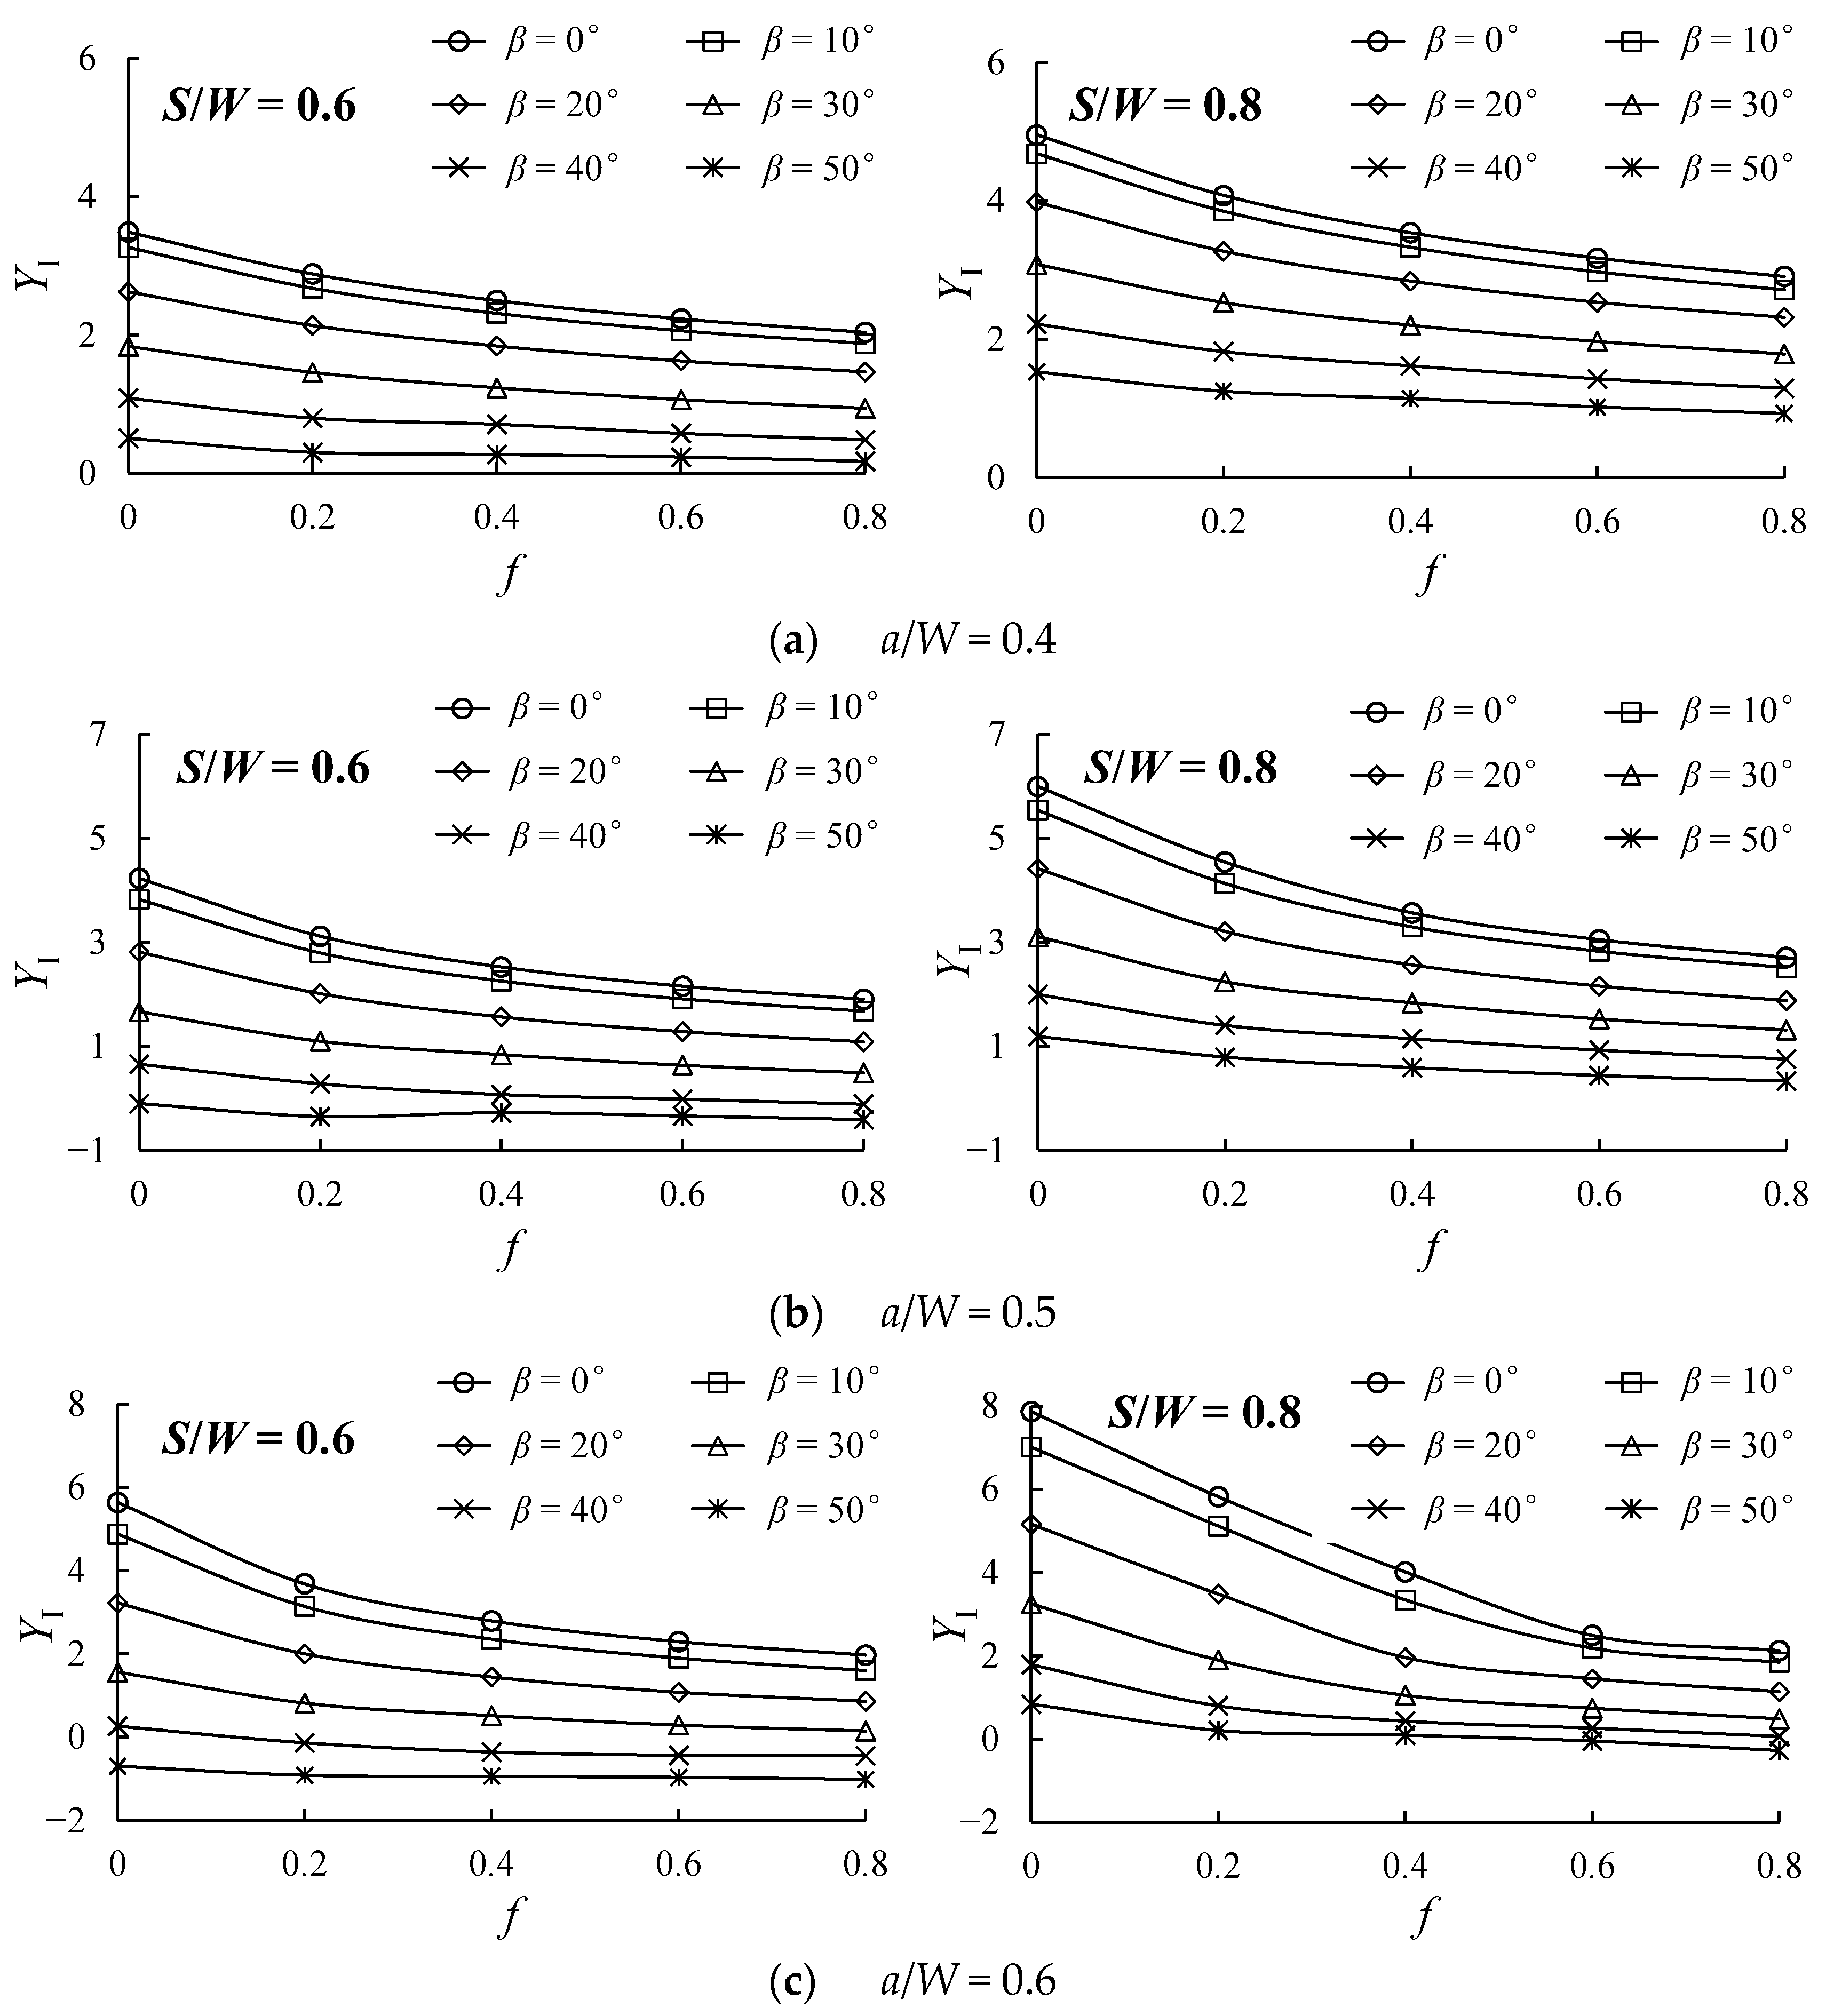
3.4. Effect of Support Friction on YI
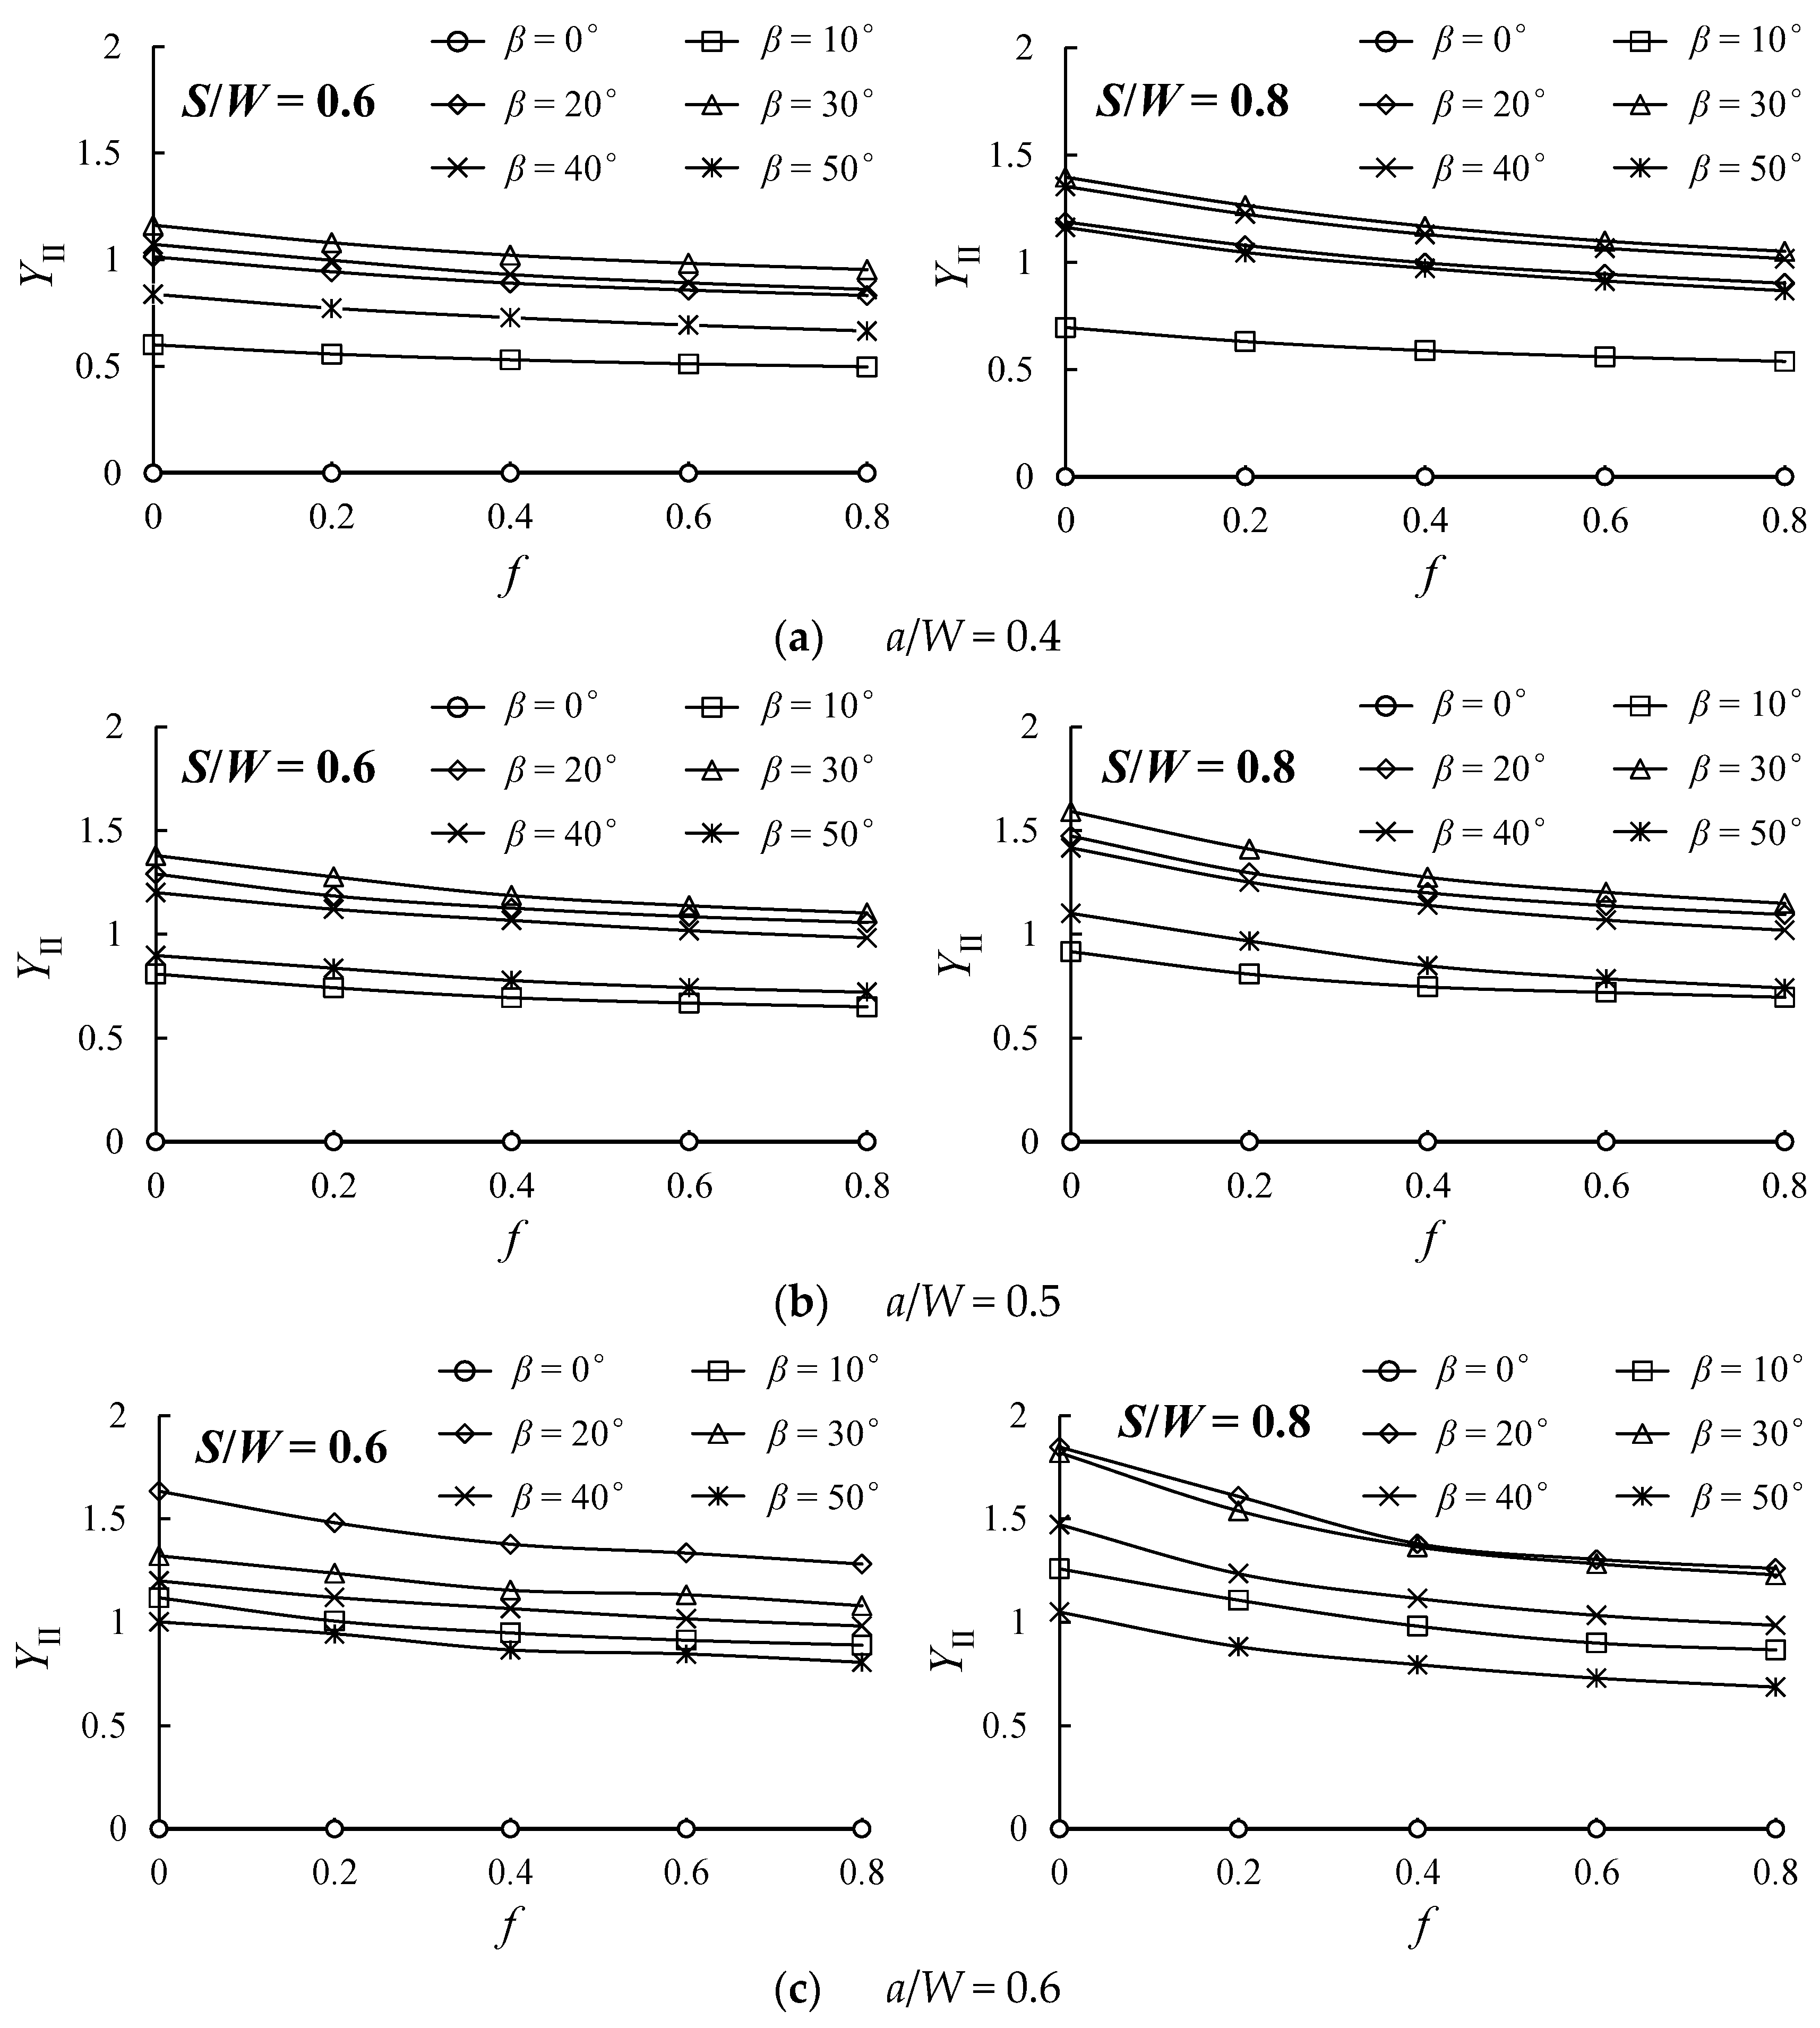
3.5. Effect of Support Friction on YII
3.6. Effect of Support Friction on T*
3.7. Effect of Support Friction on the Pure Mode II Crack Inclination Angle
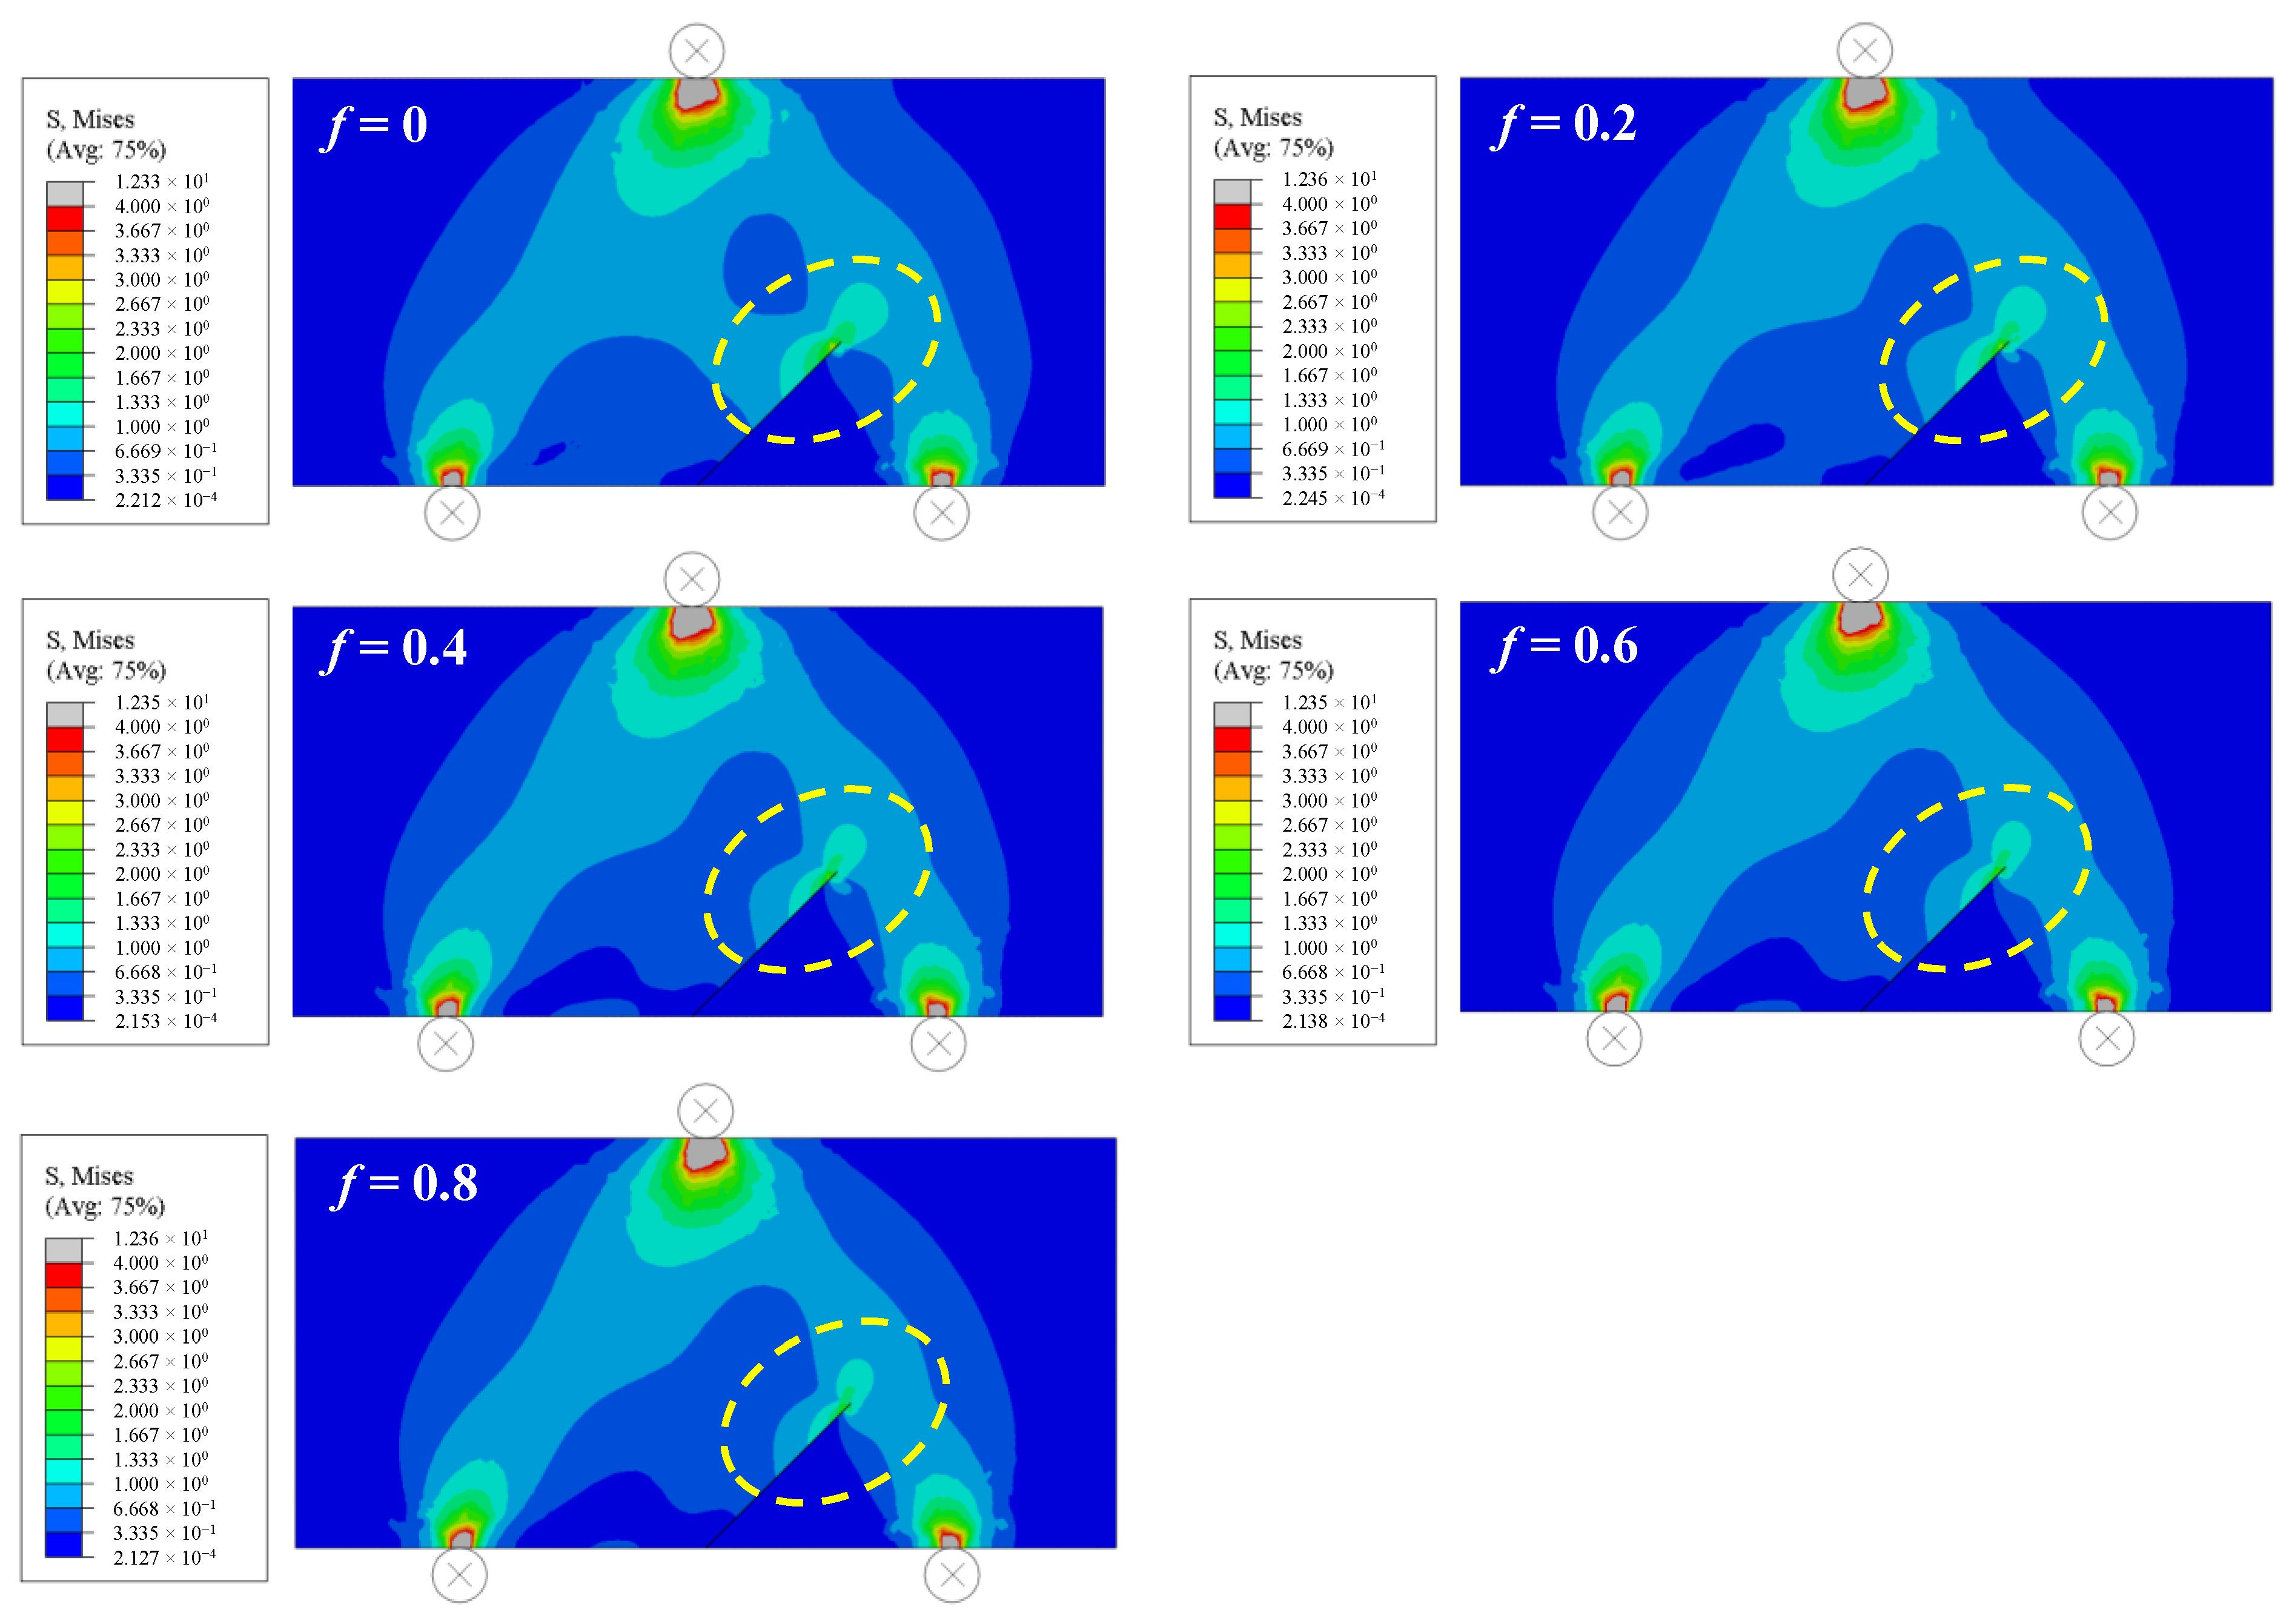
3.8. Effect of Support Friction on Mises Stress at the Crack Tip
4. Mixed-Mode I/II Fracture Test of Compacted Clay Using NDB Specimens
4.1. Test Purpose
4.2. Soil Parameters
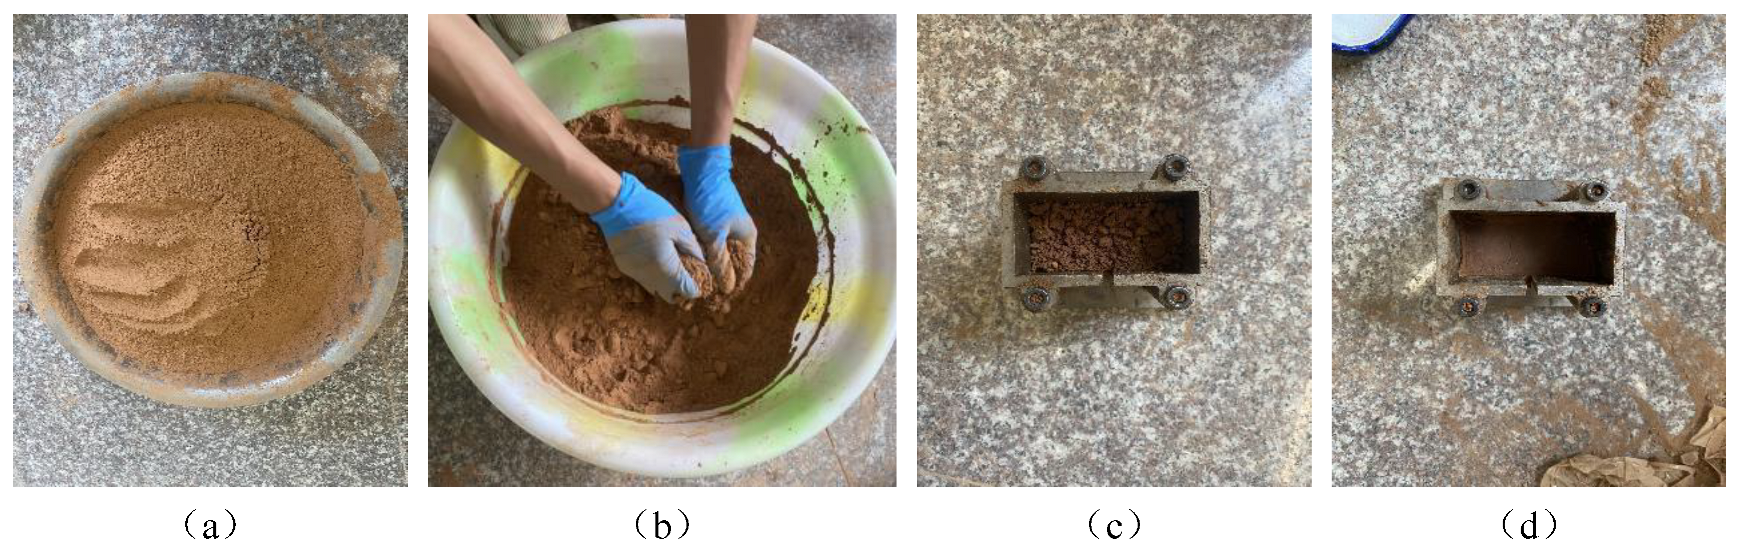
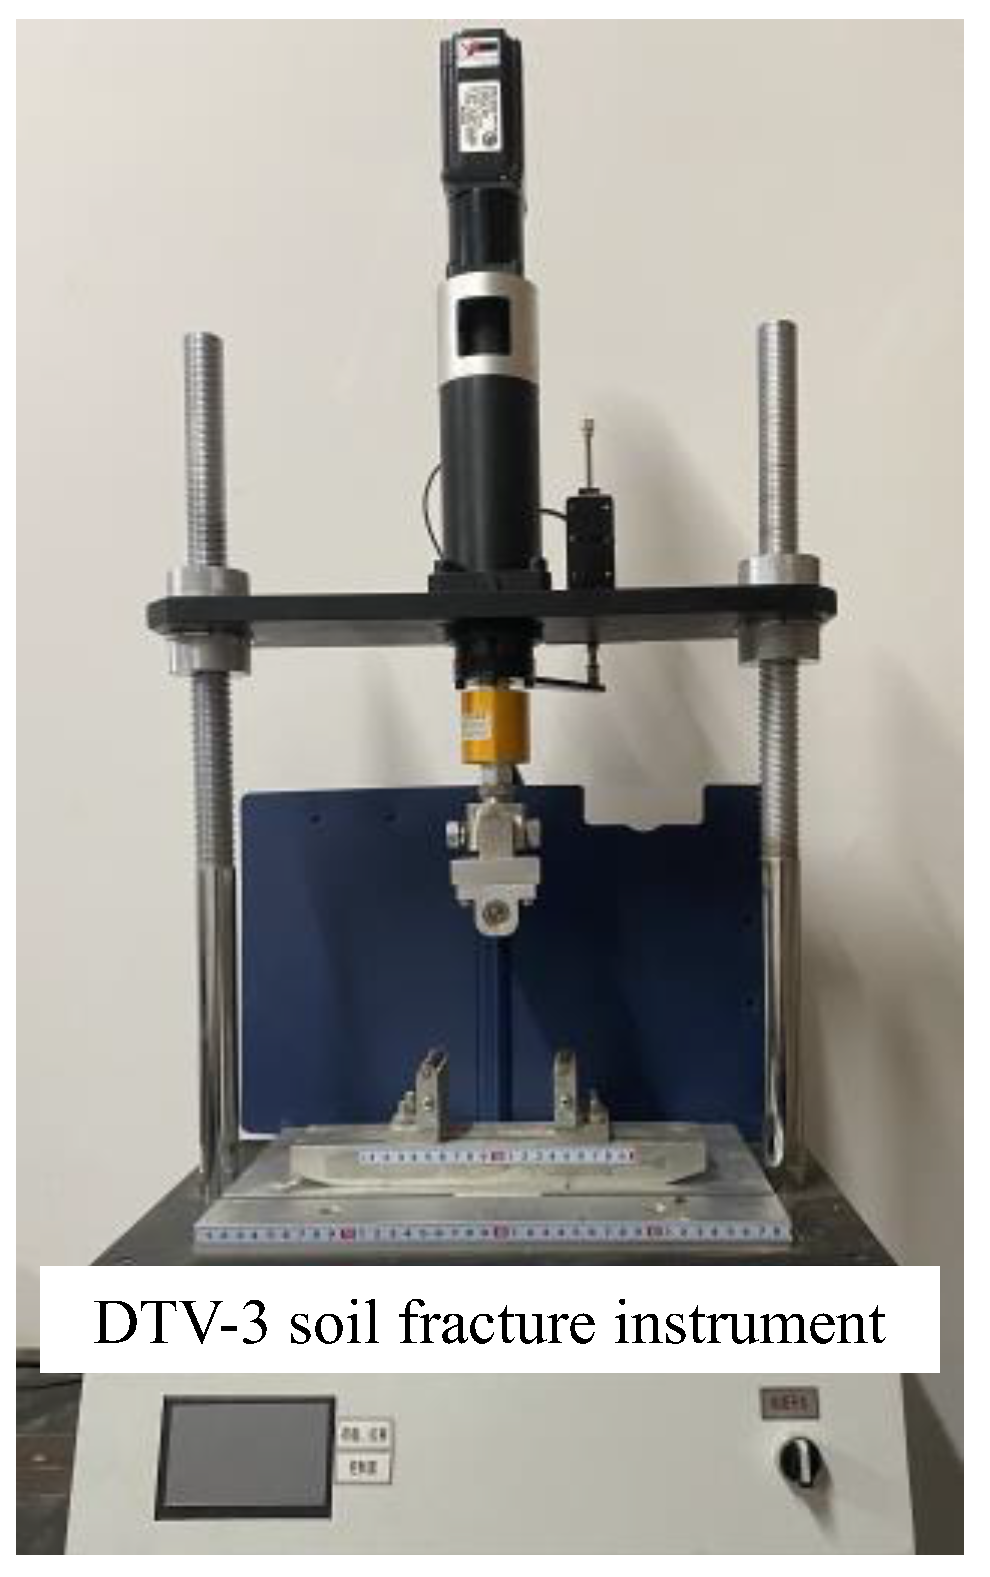
4.3. Specimen Preparation Method and Loading Instrument
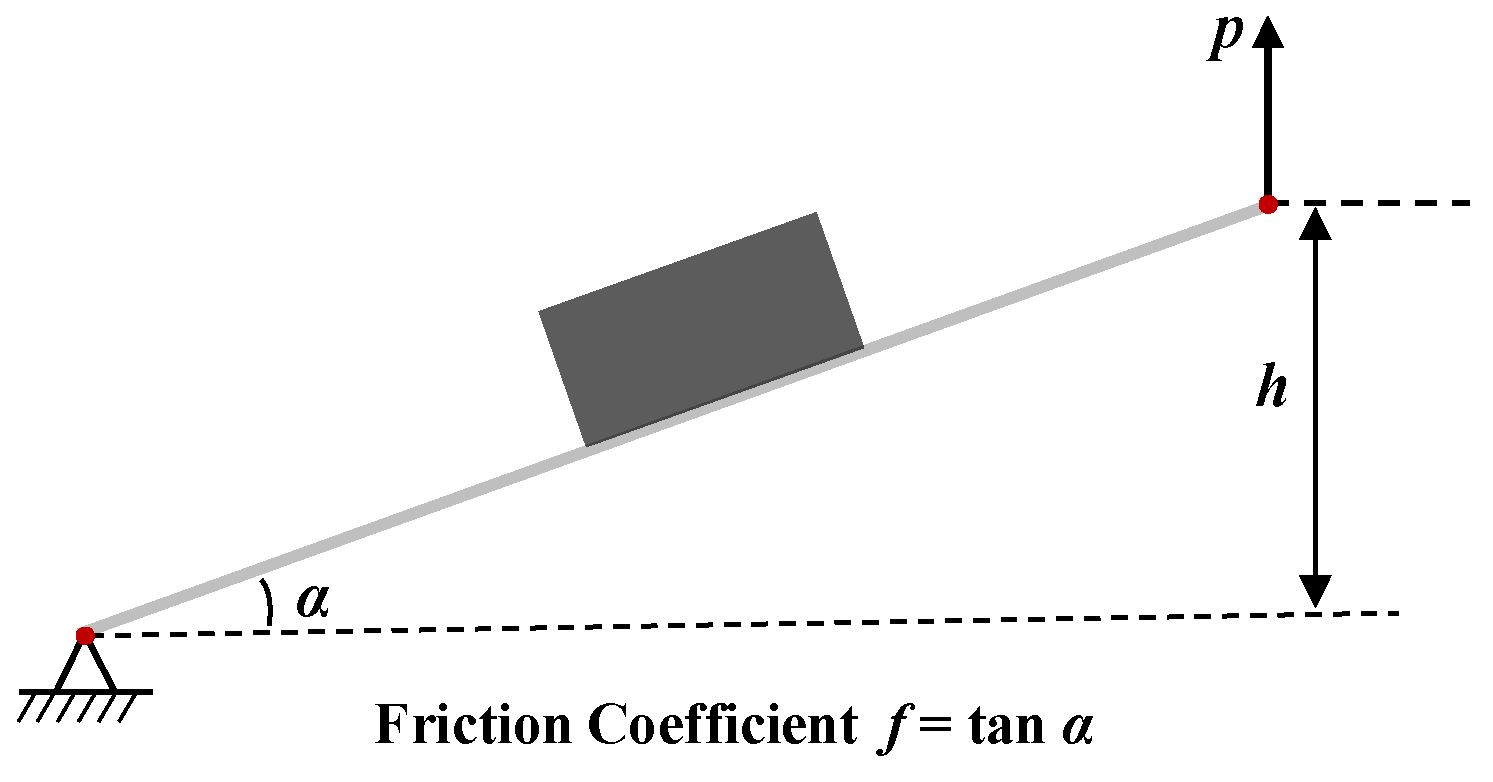
4.4. Friction Coefficient of the Compacted Clay–Steel Interface
4.5. Test Scheme
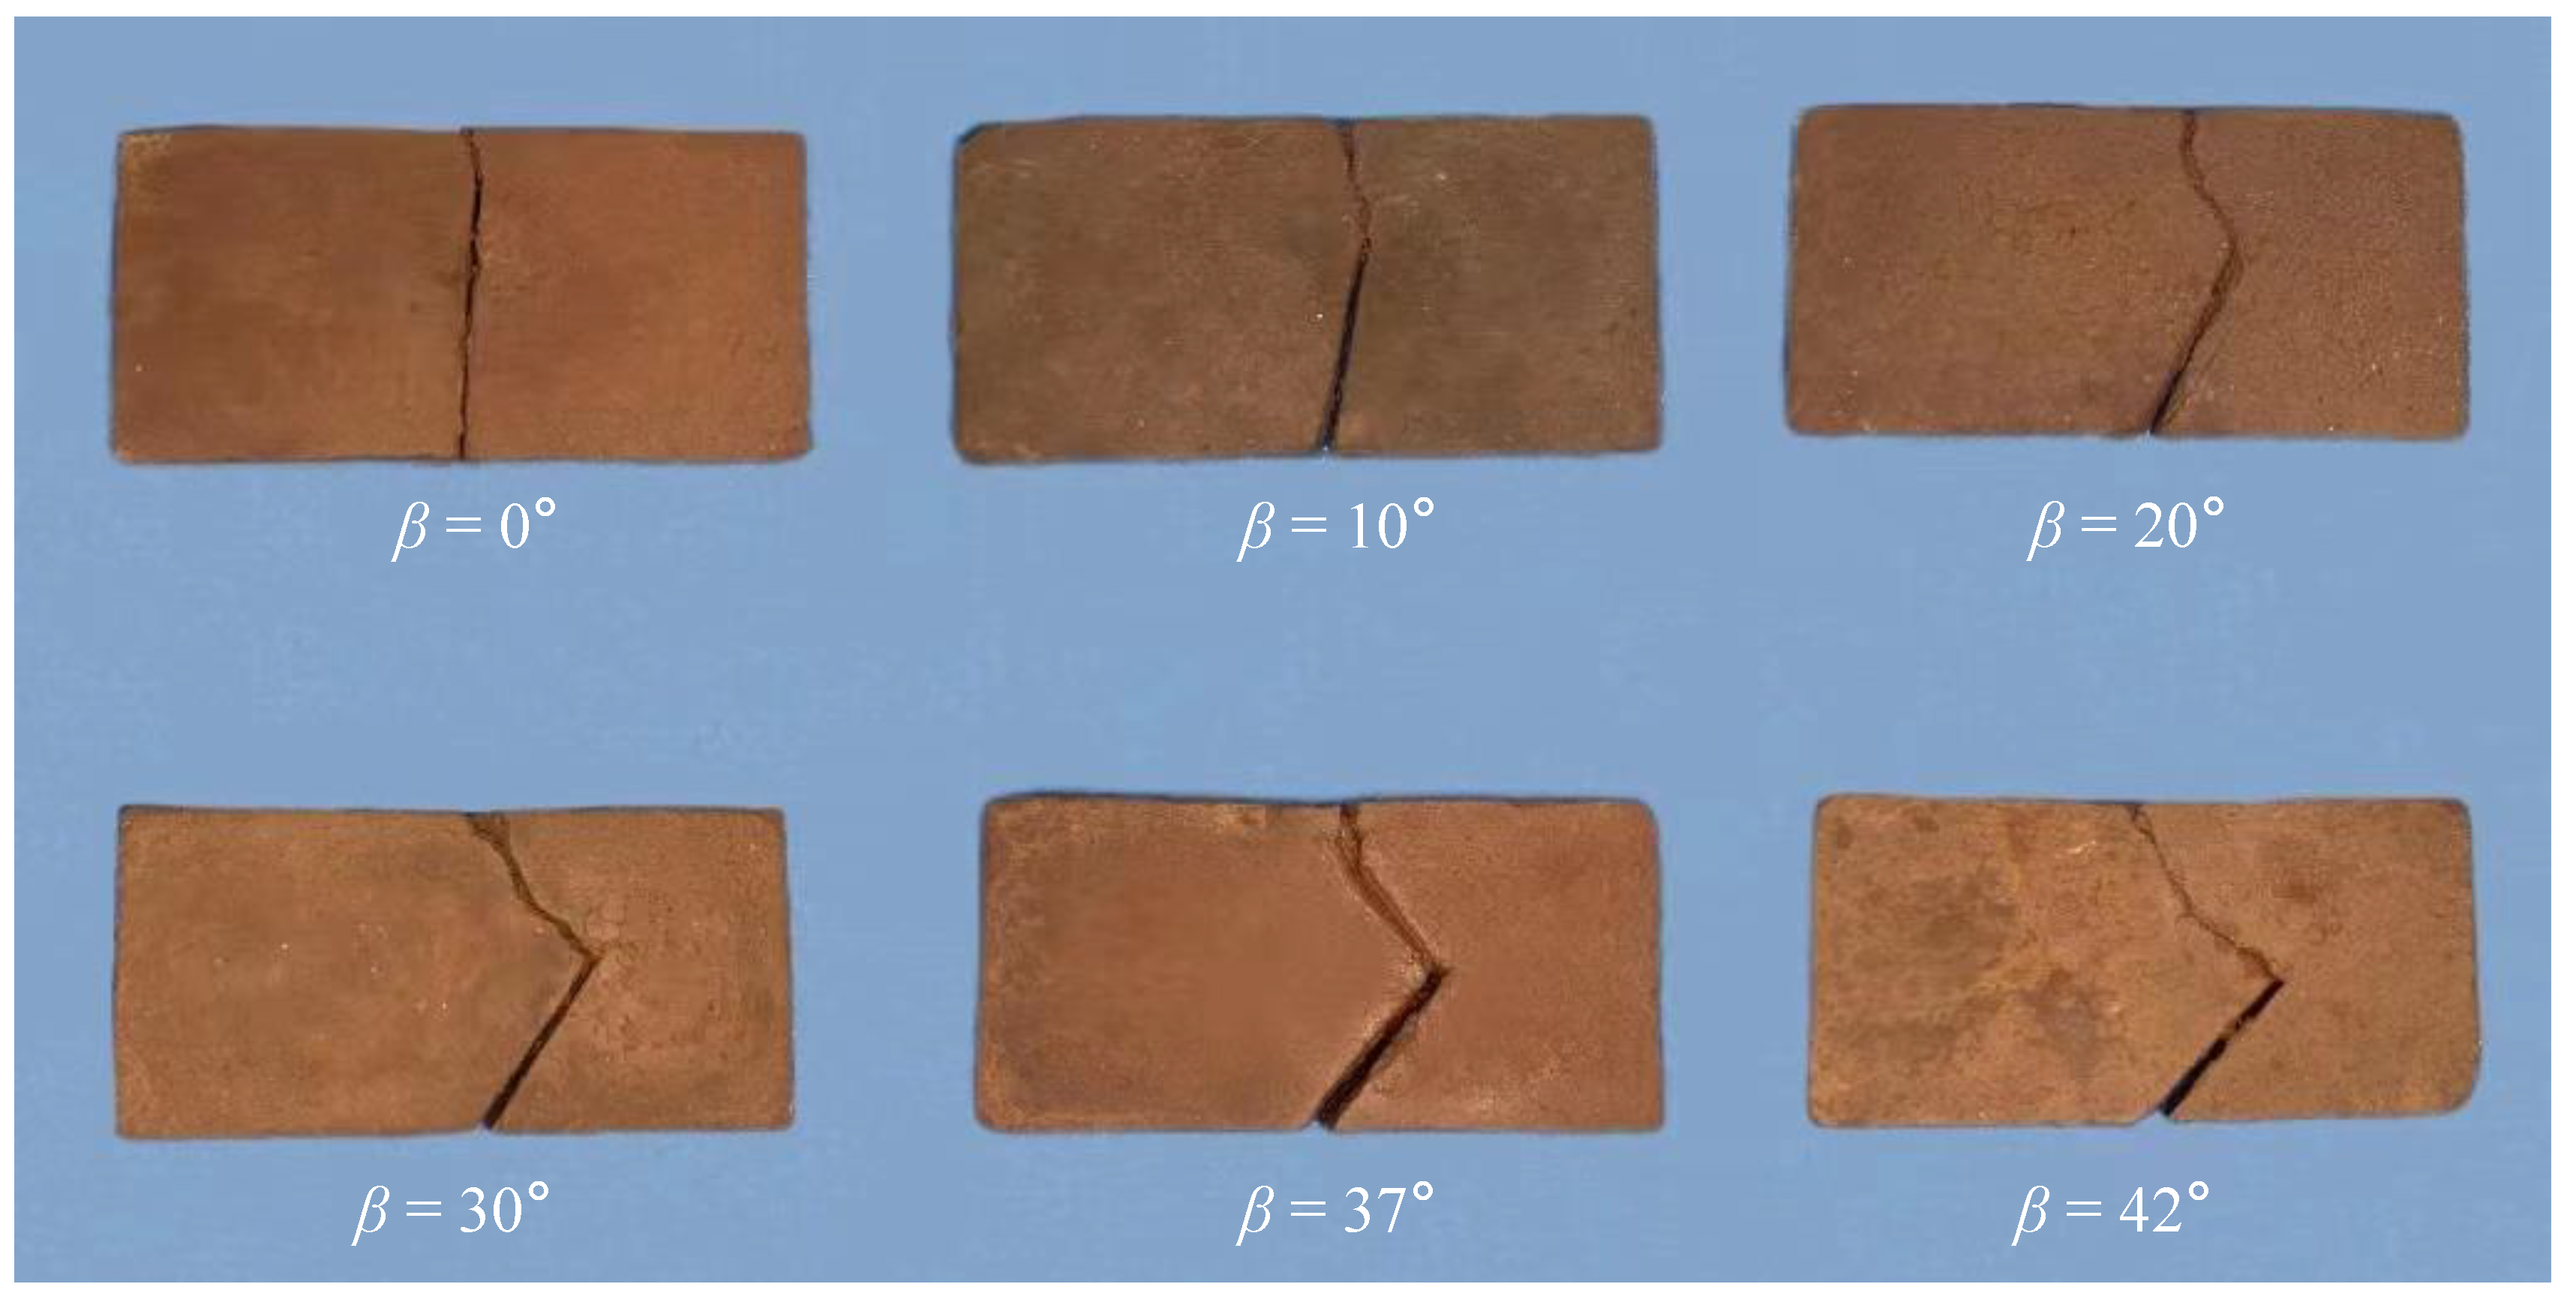
5. Test Results and Analysis
6. Discussion
7. Conclusions
- When the support friction is not considered, as β increases, YI decreases gradually, YII increases first and then decreases, and T* increases gradually. After considering the support friction, YI, YII, and T* all tend to decrease, but the trends of YI–β, YII–β, and T*–β curves are not affected. When the a/W or S/W is large, the stress concentration at the crack tip of the specimen is greater, resulting in a more significant effect of the support friction coefficient f on YI, YII, and T*.
- For the case where pure mode II loading can be achieved originally, increasing the friction coefficient f can effectively reduce the critical inclination angle βII for pure mode II loading of crack initiation, which is beneficial for the crack prefabrication in the test. For some cases where pure mode II loading cannot occur originally, pure mode II loading can be achieved by increasing the friction coefficient f.
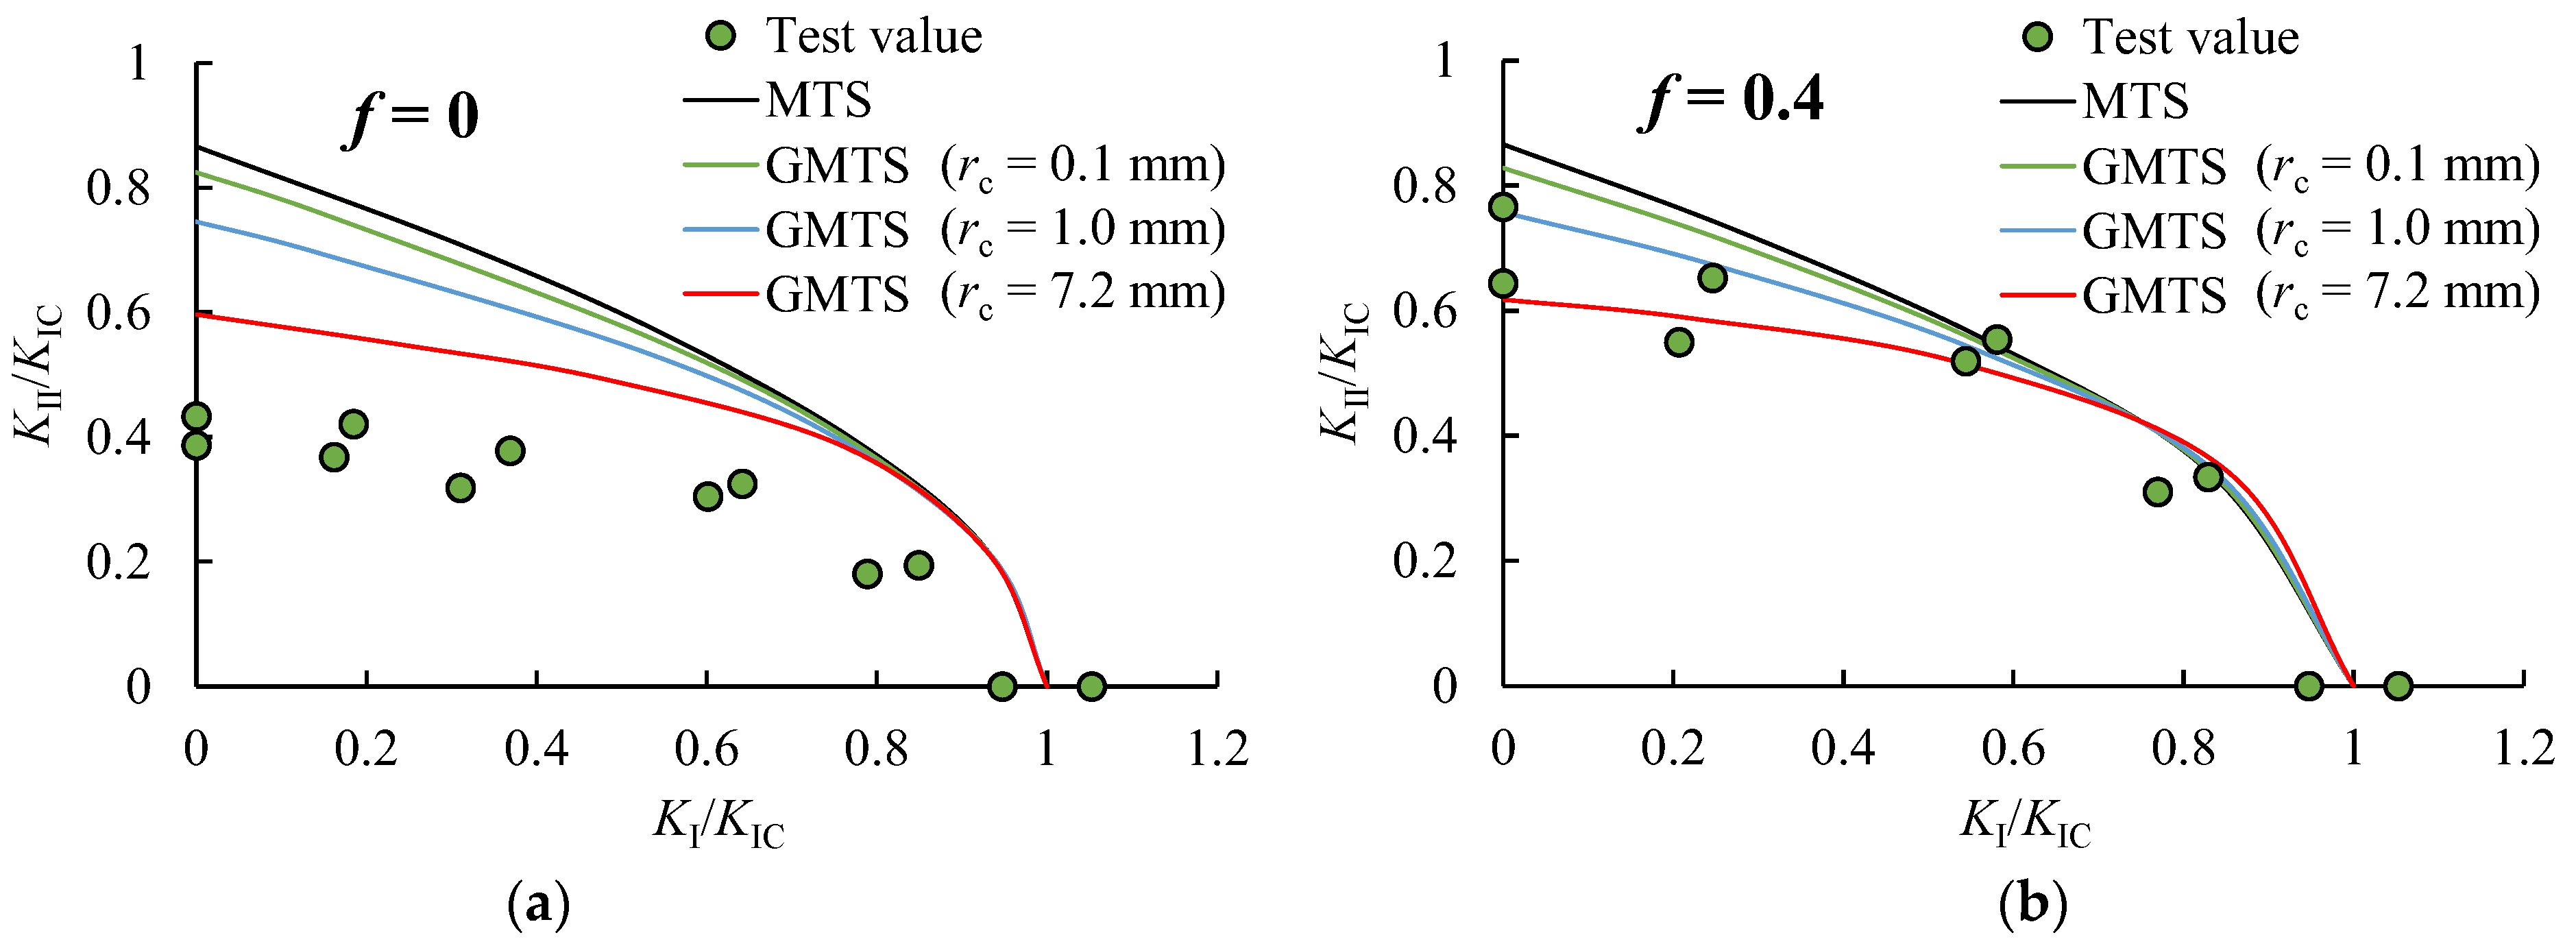
- The test data were processed and analyzed using YI, YII, and T* considering and not considering the support friction. After considering the support friction, the measured fracture parameters all decreased at different degrees, such as KIC decreased by 51%, KIIC decreased by 15%, and the fracture toughness ratio KIIC/KIC increased by 72%, indicating that the support friction increases the proportion of mode II loading at the crack tip.
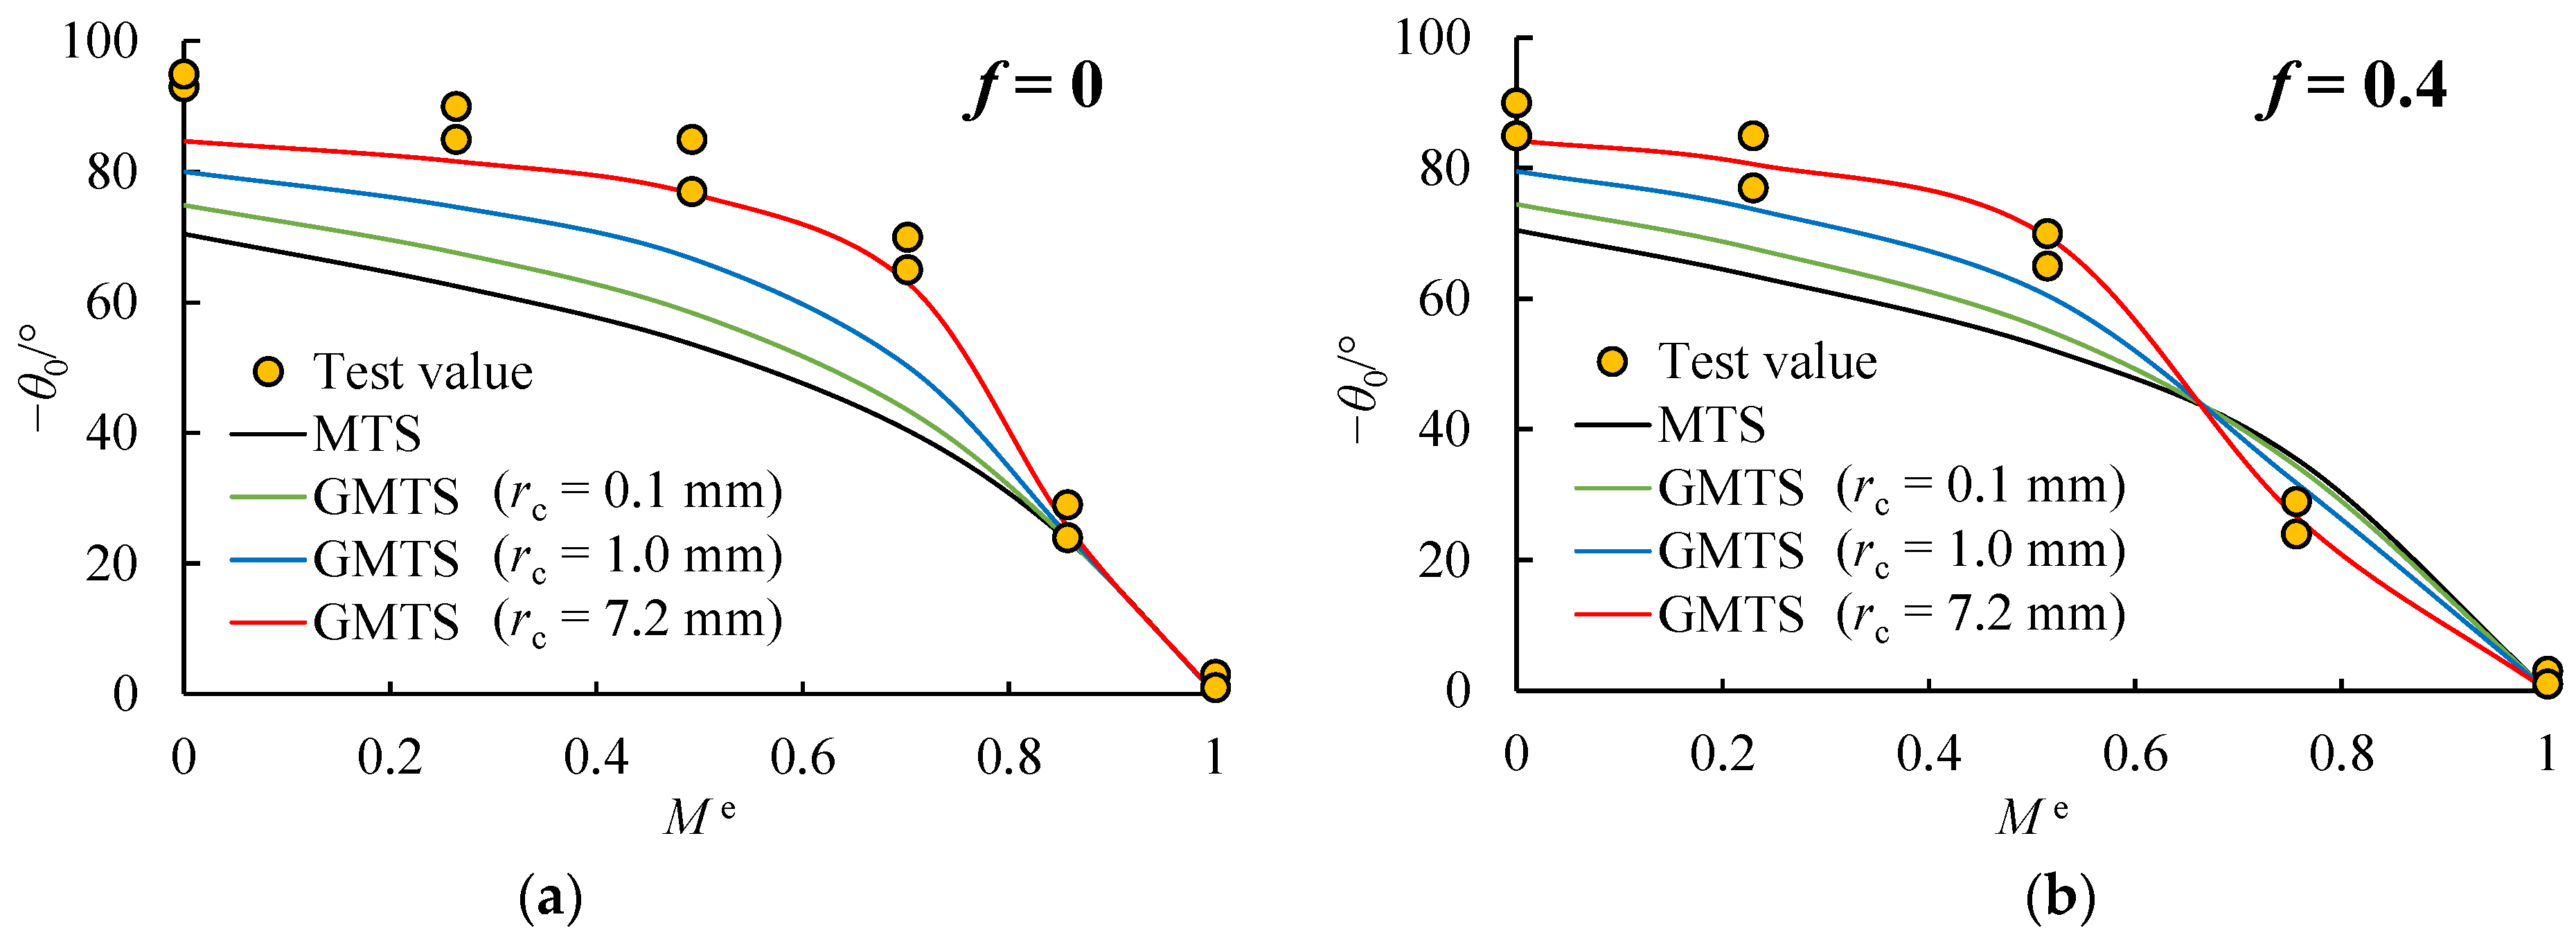
- After considering the support friction, the degree of agreement between the theoretical curves based on the GMTS criterion and the experimental results is significantly improved, which indicates that the effect of support friction on the mixed-mode I/II fracture of compacted clay cannot be ignored.
- When the NDB specimen is used to conduct the mixed-mode fracture test of compacted clay, the normalized parameters (YI, YII, and T*) considering the support friction should be used to deduce the fracture parameter of the compacted clay NDB specimen in the case of fixed support.
Author Contributions
Funding
Data Availability Statement
Conflicts of Interest
Nomenclature
| NDB | Notched deep beam |
| CT | Compact tension |
| SENB | Single-edge notched beam |
| SCB | Semi-circular bend |
| ASCB | Asymmetric semi-circular bend |
| β | Crack inclination angle |
| a | Crack length |
| W | Width of specimen |
| 2W | Length of specimen |
| B | Specimen thickness |
| 2S | Support span |
| f | The friction coefficient between the supports and the specimen |
| KI | Normalized mode I stress intensity factor |
| KII | Normalized mode II stress intensity factor |
| T | T-stress |
| YI | Normalized mode I stress intensity factor |
| YII | Normalized mode II stress intensity factor |
| T* | Normalized T-stress |
| βII | Crack inclination angle corresponding to pure mode II loading |
| Me | A parameter to describe the relative portions of mode I and mode II loadings at the crack tip |
| σθ | Circumferential stress of crack tip |
| θ0 | Direction of fracture initiation |
Appendix A
References
- Ji, E.; Fu, Z.; Chen, S.; Zhu, J.; Geng, Z. Numerical Simulation of Hydraulic Fracturing in Earth and Rockfill Dam Using Extended Finite Element Method. Adv. Civ. Eng. 2018, 2018, 1782686. [Google Scholar] [CrossRef]
- Zhang, H.; Jing, Y.; Chen, J.; Gao, Z.; Xu, Y. Characteristics and causes of crest cracking on a high core-wall rockfill dam: A case study. Eng. Geol. 2022, 297, 106488. [Google Scholar] [CrossRef]
- Liu, Y.; Zheng, D.; Cao, E.; Wu, X.; Chen, Z. Cracking risk analysis of face slabs in concrete face rockfill dams during the operation period. Structures 2022, 40, 621–632. [Google Scholar] [CrossRef]
- Qu, Y.; Zou, D.; Kong, X.; Yu, X.; Chen, K. Seismic cracking evolution for anti-seepage face slabs in concrete faced rockfill dams based on cohesive zone model in explicit SBFEM-FEM frame. Soil Dyn. Earthq. Eng. 2020, 133, 106106. [Google Scholar] [CrossRef]
- Skempton, A.W.; Schuster, R.L.; Petley, D.J. Joints and Fissures in The London Clay at Wraysbury and Edgware. Géotechnique 1970, 20, 208–209. [Google Scholar] [CrossRef]
- Lakshmikantha, M.R.; Prat, P.C.; Ledesma, A. Experimental evidence of size effect in soil cracking. Can. Geotech. J. 2012, 49, 264–284. [Google Scholar] [CrossRef]
- Lee, F.H.; Lo, K.W.; Lee, S.L. Tension Crack Development in Soils. J. Geotech. Eng. 1988, 114, 915–929. [Google Scholar] [CrossRef]
- ASTM Standard E399-12; Standard Test Method for Linear-Elastic Plane-Strain Fracture Toughness KIC of Metallic Materials. Annual Book of ASTM Standards. ASTM International: West Conshohocken, PA, USA, 2013.
- Zhang, Z.G.; Ding, J.S. Studies on the fracture toughness KIC of cohesive soil. Rock Soil Mech. 1993, 14, 47–52. (In Chinese) [Google Scholar] [CrossRef]
- Wang, J.; Huang, S.; Hu, J. Limit of crack depth in KIC testing for a clay. Eng. Fract. Mech. 2016, 164, 19–23. [Google Scholar] [CrossRef]
- Lenci, S.; Clementi, F.; Sadowski, T. Experimental determination of the fracture properties of unfired dry earth. Eng. Fract. Mech. 2012, 87, 62–72. [Google Scholar] [CrossRef]
- Amarasiri, A.L.; Costa, S.; Kodikara, J.K. Determination of cohesive properties for mode I fracture from compacted clay beams. Can. Geotech. J. 2011, 48, 1163–1173. [Google Scholar] [CrossRef]
- Wang, J.; Zhu, J.; Chiu, C.F.; Zhang, H. Experimental study on fracture toughness and tensile strength of a clay. Eng. Geol. 2007, 94, 65–75. [Google Scholar] [CrossRef]
- Aluko, O.B.; Chandler, H.W. A Fracture Strength Parameter for Brittle Agricultural Soils. Biosyst. Eng. 2006, 93, 245–252. [Google Scholar] [CrossRef]
- Qiao, L.; Liu, J.; Li, X.; Li, Q.; Xie, J. Experimental study on mode I fracture characteristics of compacted bentonite clay. Eng. Fract. Mech. 2023, 285, 109294. [Google Scholar] [CrossRef]
- Wang, J.; Huang, S.; Guo, W.; Qiu, Z.; Kang, K. Experimental study on fracture toughness of a compacted clay using semi-circular bend specimen. Eng. Fract. Mech. 2020, 224, 106814. [Google Scholar] [CrossRef]
- Kuruppu, M.D.; Obara, Y.; Ayatollahi, M.R.; Chong, K.P.; Funatsu, T. ISRM-Suggested Method for Determining the Mode I Static Fracture Toughness Using Semi-Circular Bend Specimen. Rock Mech. Rock Eng. 2014, 47, 267–274. [Google Scholar] [CrossRef] [Green Version]
- Wang, J.; Zhu, J.; Chiu, C.F.; Chai, H. Experimental Study on Fracture Behavior of a Silty Clay. Geotech. Test. J. 2007, 30, 100715. [Google Scholar] [CrossRef]
- Aliha, M.R.M.; Jafari Haghighatpour, P.; Tavana, A. Application of asymmetric semi-circular bend test for determining mixed mode I + II fracture toughness of compacted soil material. Eng. Fract. Mech. 2022, 262, 108268. [Google Scholar] [CrossRef]
- Negru, R.; Marsavina, L.; Filipescu, H.; Pasca, N. Investigation of Mixed Mode I/II Brittle Fracture Using ASCB Specimen. Int. J. Fract. 2013, 181, 155–161. [Google Scholar] [CrossRef]
- Vesga, L.F.; Vallejo, L.E.; Lobo-Guerrero, S. DEM analysis of the crack propagation in brittle clays under uniaxial compression tests. Int. J. Numer. Anal. Met. 2008, 32, 1405–1415. [Google Scholar] [CrossRef]
- Vallejo, L.E. The brittle and ductile behavior of clay samples containing a crack under mixed mode loading. Appl. Fract. Mec. 1988, 10, 73–78. [Google Scholar] [CrossRef]
- Luo, Y.; Ren, L.; Xie, L.Z.; Ai, T.; He, B. Fracture Behavior Investigation of a Typical Sandstone Under Mixed-Mode I/II Loading Using the Notched Deep Beam Bending Method. Rock Mech. Rock Eng. 2017, 50, 1987–2005. [Google Scholar] [CrossRef]
- Mousavi, S.S.; Aliha, M.R.M.; Imani, D.M. On the use of edge cracked short bend beam specimen for PMMA fracture toughness testing under mixed-mode I/II. Polym. Test. 2020, 81, 106199. [Google Scholar] [CrossRef]
- Bahrami, B.; Ayatollahi, M.R.; Mirzaei, A.M.; Yahya, M.Y. Support Type Influence on Rock Fracture Toughness Measurement Using Semi-circular Bending Specimen. Rock Mech. Rock Eng. 2020, 53, 2175–2183. [Google Scholar] [CrossRef]
- Bahrami, B.; Ayatollahi, M.R.; Sedighi, I.; Yazid Yahya, M. An insight into mode II fracture toughness testing using SCB specimen. Fatigue Fract. Eng. Mater. Struct. 2019, 42, 1991–1999. [Google Scholar] [CrossRef]
- Xie, Q.; Zeng, Y.; Li, S.; Liu, X.; Du, K. The influence of friction on the determination of rock fracture toughness. Sci. Rep. 2022, 12, 7332. [Google Scholar] [CrossRef]
- Pirmohammad, S.; Abdi, M.; Ayatollahi, M.R. Effect of support type on the fracture toughness and energy of asphalt concrete at different temperature conditions. Eng. Fract. Mech. 2021, 254, 107921. [Google Scholar] [CrossRef]
- Pirmohammad, S.; Abdi, M.; Ayatollahi, M.R. Mode II fracture tests on asphalt concrete at different temperatures using semi-circular bend specimen loaded by various types of supports. Appl. Fract. Mec. 2021, 116, 103089. [Google Scholar] [CrossRef]
- Bakhshizadeh, M.; Pirmohammad, S.; Ayatollahi, M.R. Effect of friction at the supports of semi-circular bending tests on fracture mode of loading. Appl. Fract. Mec. 2022, 118, 103265. [Google Scholar] [CrossRef]
- Ayatollahi, M.R.; Bahrami, B.; Mirzaei, A.M.; Yazid Yahya, M. Effects of support friction on mode I stress intensity factor and fracture toughness in SENB testing. Appl. Fract. Mec. 2019, 103, 102288. [Google Scholar] [CrossRef]
- Sedighi, I.; Ayatollahi, M.R.; Bahrami, B. A statistical approach on the support type effect on mode I fracture toughness determined using semi-circular bend (SCB) specimen. Eng. Fract. Mech. 2020, 226, 106891. [Google Scholar] [CrossRef]
- Smith, D.J.; Ayatollahi, M.R.; Pavier, M.J. The role of T-stress in brittle fracture for linear elastic materials under mixed-mode loading. Fatigue Fract. Eng. Mater. Struct. 2001, 24, 137–150. [Google Scholar] [CrossRef]
- Irwin, G. Analysis of Stresses and Strains Near End of a Crack Traversing a Plate. J. Appl. Mech. 1957, 24, 361–364. [Google Scholar] [CrossRef]
- Wei, M.; Dai, F.; Xu, N.; Liu, Y.; Zhao, T. Fracture prediction of rocks under mode I and mode II loading using the generalized maximum tangential strain criterion. Eng. Fract. Mech. 2017, 186, 21–38. [Google Scholar] [CrossRef]
- Aliha, M.R.M.; Saghafi, H. The effects of thickness and Poisson’s ratio on 3D mixed-mode fracture. Eng. Fract. Mech. 2013, 98, 15–28. [Google Scholar] [CrossRef]
- Huang, X.; Liu, Y.; Dai, Y. Characteristics and effects of T-stresses in central-cracked unstiffened and stiffened plates under mode I loading. Eng. Fract. Mech. 2018, 188, 393–415. [Google Scholar] [CrossRef]
- Ayatollahi, M.R.; Rashidi Moghaddam, M.; Berto, F. T-stress effects on fatigue crack growth—Theory and experiment. Eng. Fract. Mech. 2018, 187, 103–114. [Google Scholar] [CrossRef] [Green Version]
- Saghafi, H.; Monemian, S. A New Fracture Toughness Test Covering Mixed-Mode Conditions and Positive and Negative T-Stresses. Int. J. Fract. 2010, 165, 135–138. [Google Scholar] [CrossRef]
- Smith, D.J.; Ayatollahi, M.R.; Pavier, M.J. On the consequences of T-stress in elastic brittle fracture. Proc. R. Soc. A Math. Phys. Eng. Sci. 2006, 462, 2415–2437. [Google Scholar] [CrossRef]
- Wang, J.; Lv, C.; Huang, S.; Qiu, Z. Size effect on fracture behavior of quasi-brittle materials during uniaxial compression tests. Arch. Appl. Mech. 2023, 93, 3171–3188. [Google Scholar] [CrossRef]
- Fan, Y.; Zhu, Z.; Zhao, Y.; Zhou, L.; Qiu, H.; Niu, C. Analytical solution of T-stresses for an inclined crack in compression. Int. J. Rock Mech. Min. 2021, 138, 104433. [Google Scholar] [CrossRef]
- Erdogan, F.; Sih, G.C. On the Crack Extension in Plates Under Plane Loading and Transverse Shear. J. Basic Eng. 1963, 85, 519–525. [Google Scholar] [CrossRef]
- Sih, G.C. Strain-energy-density factor applied to mixed mode crack problems. Int. J. Fract. 1974, 10, 305–321. [Google Scholar] [CrossRef]
- Nuismer, R.J. An energy release rate criterion for mixed mode fracture. Int. J. Fract. 1975, 11, 245–250. [Google Scholar] [CrossRef]
- Chen, H.; Xing, H.; Imtiaz, H.; Liu, B. How to obtain a more accurate maximum energy release rate for mixed mode fracture. Forces Mech. 2022, 7, 100077. [Google Scholar] [CrossRef]
- Hou, C.; Jin, X.; Fan, X.; Xu, R.; Wang, Z. A generalized maximum energy release rate criterion for mixed mode fracture analysis of brittle and quasi-brittle materials. Appl. Fract. Mec. 2019, 100, 78–85. [Google Scholar] [CrossRef]
- Williams, J.G.; Ewing, P.D. Fracture under complex stress—The angled crack problem. Int. J. Fract. Mech. 1972, 8, 441–446. [Google Scholar] [CrossRef]
- Schmidt, R. A microcrack model and its significance to hydraulic fracturing and fracture toughness testing. In Proceedings of the 21st U.S. Symposium on Rock Mechanics (USRMS), Rolla, MI, USA, 27–30 May 1980; pp. 581–590. [Google Scholar] [CrossRef]


| S/W | a/W | f | β/° |
|---|---|---|---|
| 0.6 | 0.4, 0.5, 0.6 | 0, 0.2, 0.4, 0.6, 0.8 | 0, 5, 10, 15, 20, 25, 30, 35, 40, 45, 50 |
| 0.8 | 0.4, 0.5, 0.6 | 0, 0.2, 0.4, 0.6, 0.8 | 0, 5, 10, 15, 20, 25, 30, 35, 40, 45, 50 |
| a/W | βII/(°) | ||||
|---|---|---|---|---|---|
| f = 0 | f = 0.2 | f = 0.4 | f = 0.6 | f = 0.8 | |
| 0.4 | - | - | - | - | |
| 0.5 | 49 | 44 | 42 | 40 | 38 |
| 0.6 | 42 | 39 | 37 | 34 | 32 |
| a/W | βII/(°) | ||||
|---|---|---|---|---|---|
| f = 0 | f = 0.2 | f = 0.4 | f = 0.6 | f = 0.8 | |
| 0.4 | - | - | - | - | |
| 0.5 | - | - | - | - | |
| 0.6 | - | 57 | 51 | 45 | 42 |
| β (°) | Me | KI (kPa·m0.5) | KII (kPa·m0.5) | KI/KIC | KII/KIC | T (kPa) |
|---|---|---|---|---|---|---|
| 0 | 1.00 | 19.01 | 0.00 | 1.00 | 0.00 | −13.08 |
| 10 | 0.86 | 15.57 | 3.57 | 0.82 | 0.19 | 2.96 |
| 20 | 0.70 | 11.82 | 5.98 | 0.62 | 0.31 | 31.12 |
| 30 | 0.49 | 6.46 | 6.62 | 0.34 | 0.35 | 51.21 |
| 37 | 0.26 | 3.30 | 7.50 | 0.17 | 0.39 | 69.20 |
| 42 | 0.00 | 0.00 | 7.79 | 0.00 | 0.41 | 79.62 |
| β (°) | Me | KI (kPa·m0.5) | KII (kPa·m0.5) | KI/KIC | KII/KIC | T (kPa) |
|---|---|---|---|---|---|---|
| 0 | 1.00 | 9.41 | 0.00 | 1.00 | 0.00 | −24.45 |
| 10 | 0.76 | 7.52 | 3.03 | 0.80 | 0.32 | −7.32 |
| 20 | 0.51 | 5.29 | 5.05 | 0.56 | 0.54 | 20.71 |
| 30 | 0.23 | 2.13 | 5.65 | 0.23 | 0.60 | 41.57 |
| 37 | ≈0.00 | ≈0.00 | 6.63 | ≈0.00 | 0.71 | 60.52 |
| 42 | −0.22 | −2.31 | 6.51 | −0.25 | 0.69 | 64.78 |
Disclaimer/Publisher’s Note: The statements, opinions and data contained in all publications are solely those of the individual author(s) and contributor(s) and not of MDPI and/or the editor(s). MDPI and/or the editor(s) disclaim responsibility for any injury to people or property resulting from any ideas, methods, instructions or products referred to in the content. |
© 2023 by the authors. Licensee MDPI, Basel, Switzerland. This article is an open access article distributed under the terms and conditions of the Creative Commons Attribution (CC BY) license (https://creativecommons.org/licenses/by/4.0/).
Share and Cite
Huang, S.; Li, X.; Yu, W.; Zhang, X.; Du, H. Effects of Support Friction on Mixed-Mode I/II Fracture Behavior of Compacted Clay Using Notched Deep Beam Specimens under Symmetric Fixed Support. Symmetry 2023, 15, 1290. https://doi.org/10.3390/sym15061290
Huang S, Li X, Yu W, Zhang X, Du H. Effects of Support Friction on Mixed-Mode I/II Fracture Behavior of Compacted Clay Using Notched Deep Beam Specimens under Symmetric Fixed Support. Symmetry. 2023; 15(6):1290. https://doi.org/10.3390/sym15061290
Chicago/Turabian StyleHuang, Shiyuan, Xudong Li, Wenbing Yu, Xiaofeng Zhang, and Hongbo Du. 2023. "Effects of Support Friction on Mixed-Mode I/II Fracture Behavior of Compacted Clay Using Notched Deep Beam Specimens under Symmetric Fixed Support" Symmetry 15, no. 6: 1290. https://doi.org/10.3390/sym15061290