Article

Absolute Structure Determination of Chiral Zinc Tartrate MOFs by 3D Electron Diffraction

1
Eldico Scientific AG, 5234 Villigen, Switzerland
2
Department of Chemistry, Hong Kong University of Science and Technology, Clear Water Bay, Kowloon, Hong Kong
*
Authors to whom correspondence should be addressed.
Symmetry 2023, 15(5), 983; https://doi.org/10.3390/sym15050983
Submission received: 23 February 2023 / Revised: 19 April 2023 / Accepted: 20 April 2023 / Published: 26 April 2023
(This article belongs to the Special Issue Electron Diffraction and Structural Imaging II)

Abstract

:
The absolute structure of the 3D MOF anhydrous zinc (II) tartrate with space group I222 has been determined for both [Zn(L-TAR)] and [Zn(D-TAR)] by electron diffraction using crystals of sub-micron dimensions. Dynamical refinement gives a strong difference in R factors for the correct and inverted structures. These anhydrous MOFs may be prepared phase pure from mild hydrothermal conditions. Powder X-ray diffraction indicates that isostructural or pseudo-isostructural phases can be similarly prepared for several other M2+ = Mg, Mn, Co, Ni and Cu. I222 is a relatively uncommon space group since it involves intersecting two-fold axes that place constraints on molecular crystals. However, in the case of MOFs the packing is dominated by satisfying the octahedral coordination centers. These MOFs are dense 3D networks with chiral octahedral metal centers that may be classed as Δ (for L-TAR) or Λ (for D-TAR).

1. Introduction

The development of electron diffraction (ED, also termed 3D-ED or micro-ED) as a technique for structure determination applicable to organic molecular compounds, inorganics, and metal–organic frameworks (MOFs) has emerged in the last 10 years [1,2,3,4,5,6,7]. The advent of commercial electron diffractometers promises to usher in a new age of structural determination for crystalline materials that, either due to lack of material or inherent problems of crystal growth, cannot produce single specimens of suitable size for in-house X-ray diffractometers (typically around 50 µm, in certain cases even down to ca. 10 µm) [8].
In researching metal tartrates [9,10], which are of potential interest as fundamental chiral metal–organic frameworks that might have chiral separation [11], chiral catalytic [12], or chiro-optic applications [13] we found that simply formulated anhydrous materials such as [Zn(L-TAR)] could be prepared straightforwardly under mild hydrothermal conditions (Figure 1). At ambient conditions several metal tartrate phases had been crystallized and X-ray structures previously reported, with both coordinated aqua ligands and pore-included water molecules. These include [Zn(L-TAR)(H2O)]·1.5H2O (CSD codename CUJBAK) [14], [Zn(D-TAR)(H2O)]·1.5H2O (CUJBAK01) [15], a diastereomeric framework [Zn(L-TAR)(H2O)]·2H2O (KURNOB) [16], and a meso compound [Zn(m-TAR)(H2O)2] (MUYPUU) [17]. The structure of an anhydrous phase has not been reported in the Cambridge Structural Database (CSD) so far. This is likely due to the fact that whilst hydrothermal preparation of [Zn(L-TAR)] was possible, the resulting micro-crystalline powders precluded X-ray structure determination due to small particle size <10 microns.
The application of 3D-ED to the structure determination of MOFs with small particle size has been well established [5,6,7,18,19]. We were curious to see whether the as grown micro-crystals of [Zn(L-TAR)] could be amenable to structure determination using 3D-ED. Furthermore, since the crystals should be homochiral, the determination of their absolute structure is also of interest. Recently it has been shown that by taking the effects of dynamical diffraction into account during refinement one can perform reliable absolute structure determinations from 3D-ED data of nanocrystalline samples [20,21].
Figure 1. Synthesis and Structure of Molecular dimer SBU of product [Zn(L-TAR)] 1-L. Structure diagram by Olex2 [22].
Symmetry 15 00983 g001

2. Materials and Methods

Metal acetates, tartaric acid and solvents used were of reagent grade supplied by Meryer Chemicals (Shanghai).

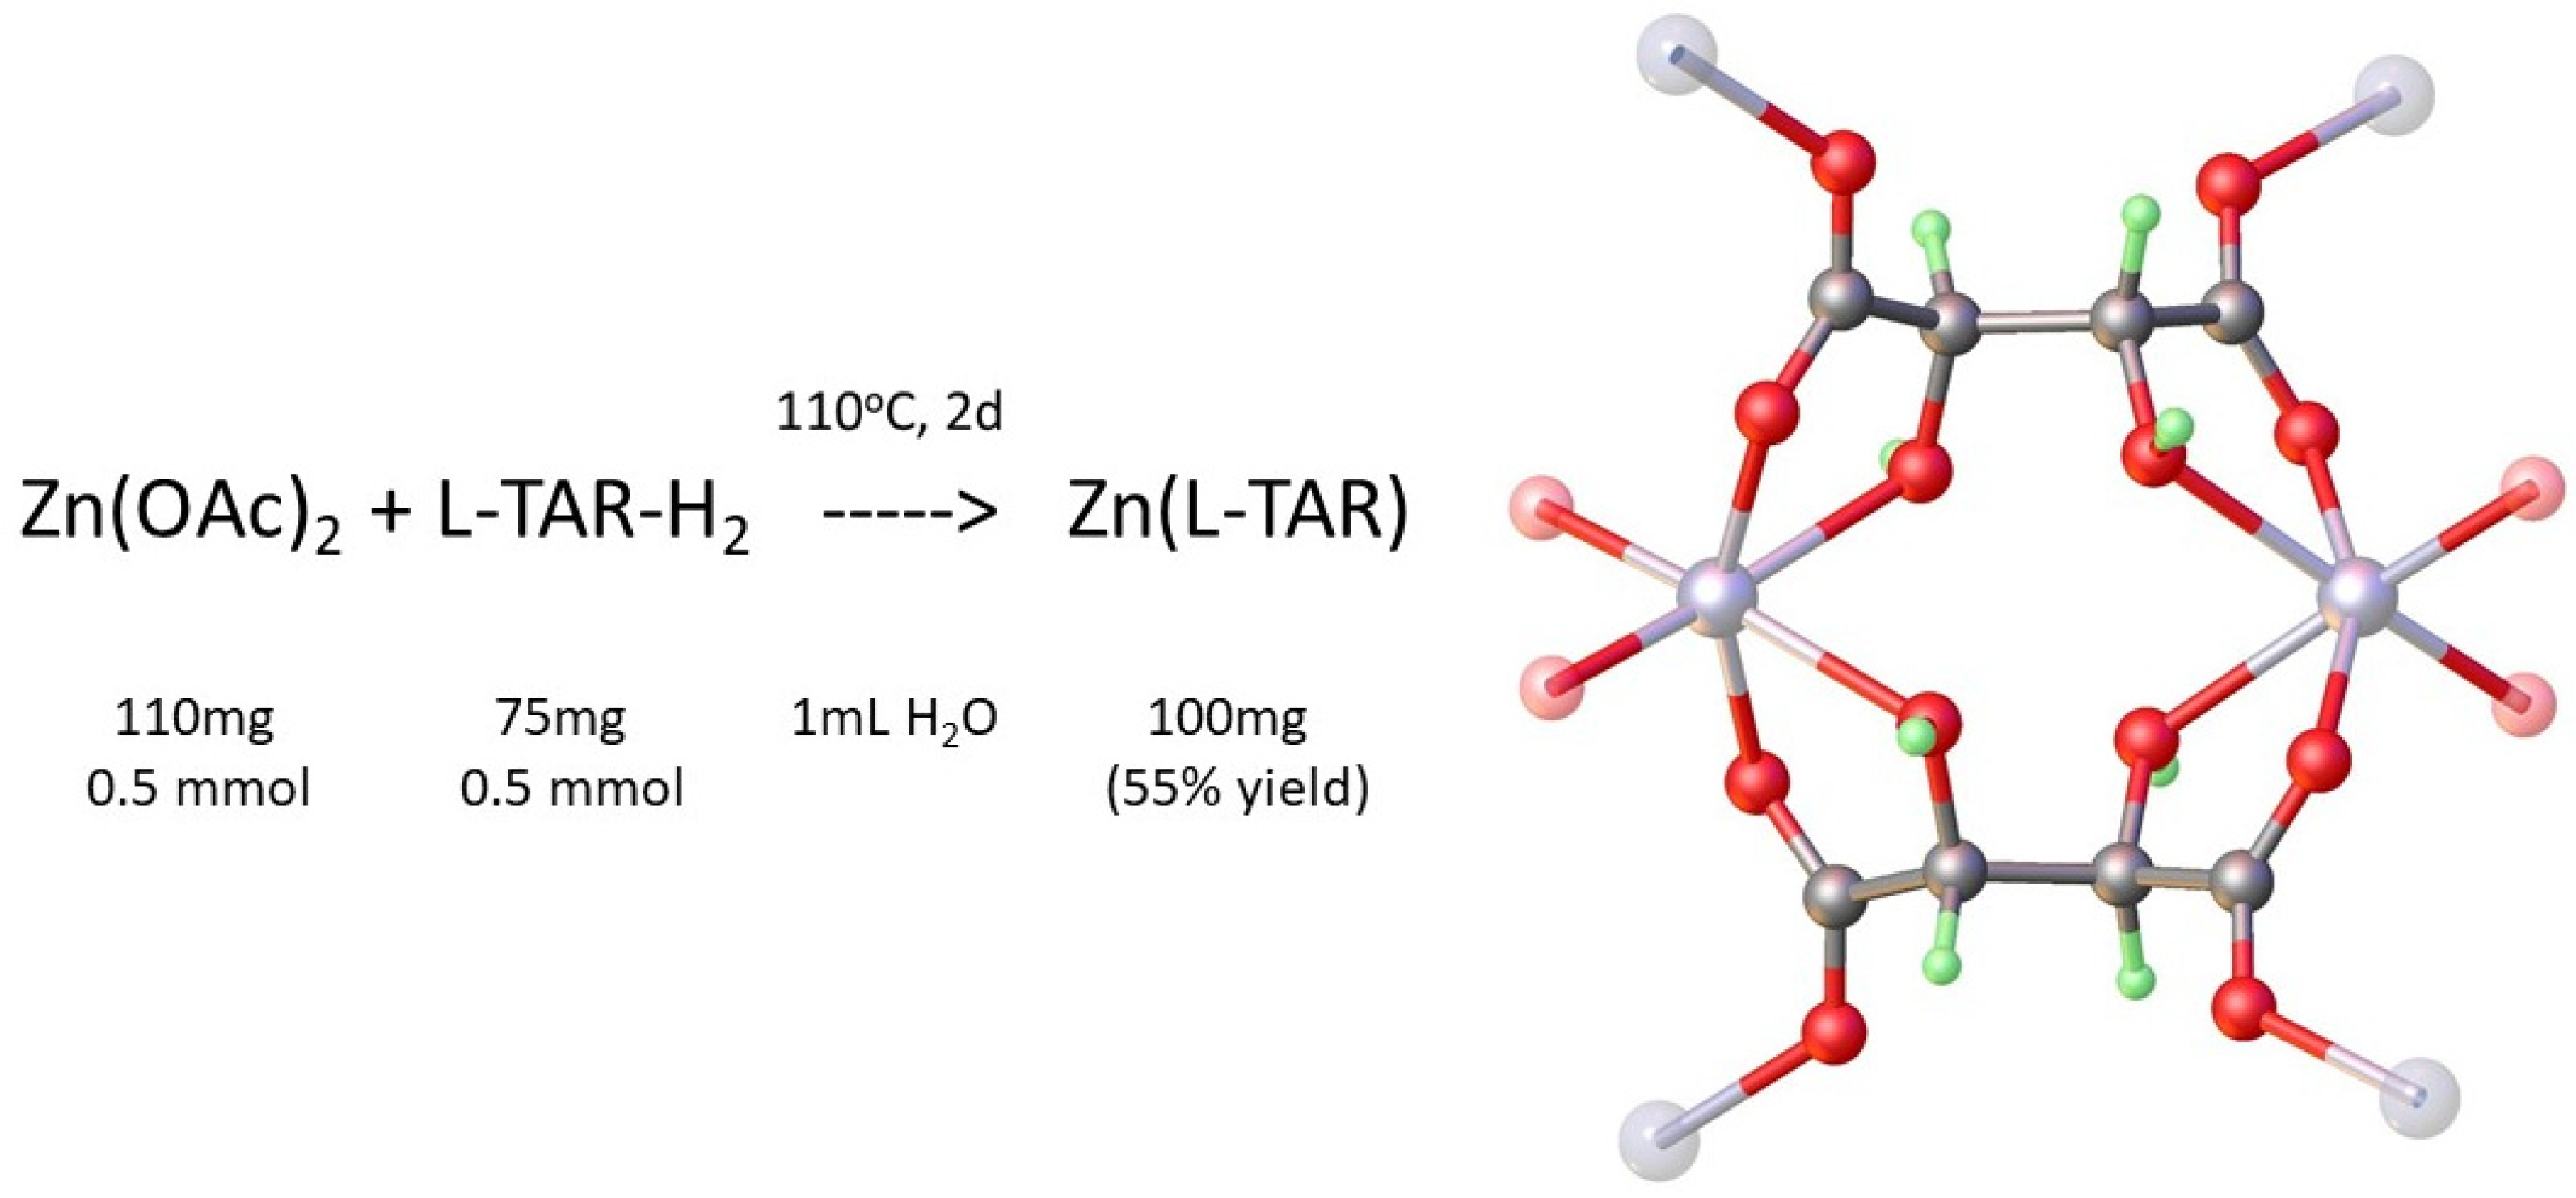
2.1. Preparation of Metal Tartrate Phases

[Zn(L-TAR)] 1-L
This was prepared (Figure 1) by a one-pot hydrothermal reaction of zinc acetate hydrate, (0.5 mmol) and L-tartaric acid (0.5 mmol) in 1 mL water. Reagents were heated in a Teflon lined Parr pressure vessel (23 mL) for 2 d at 110 °C. Slow cooling afforded fine white microcrystalline powder. (Yield 55%)
[Zn(D-TAR)] 1-D and other Zinc tartrates
The D-analogue was prepared in similar manner and yielded substituting D-tartaric acid. Use of racemic D/L-tartaric acid afforded a conglomerate of 1-L and 1-D based on the similar powder X-ray pattern obtained. Meso-tartaric acid afforded the known hydrated phase (coden MUYPUU [17]) up to 140 °C.
Other [M(L-TAR)] Phases
Other anhydrous divalent [M(L-TAR)] phases were prepared for M2+ = Mg, Mn, Co, Ni, and Cu in a similar manner to 1-L at 110 °C/2d. These were shown to be isostructural, or pseudo-isostructural for Cu, by powder X-ray diffraction. The product phase for Ca2+ was different, identified as a higher coordinated hydrated phase. For Fe2+ an inhomogeneous mixture was obtained.

2.2. X-ray Crystallography

Powder X-ray diffraction data were obtained at room temperature using Cu-Kα radiation by a PanAlytical X’Pert PRO diffractometer with 1D X’celerator detector or on a PanAlytical Aeris benchtop powder X-ray diffractometer and measured in 2θ range 5 to 40° with step size of 0.02°.

2.3. Electron Crystallography

Samples were finely dispersed on standard TEM grids (amorphous carbon on Cu) and measured on an ELDICO ED-1 electron diffractometer at room temperature using the software ELDIX [23]. The device is equipped with a LaB6 source operating at an acceleration voltage of 160 kV (λ = 0.02851 Å) and a hybrid-pixel detector (Dectris QUADRO). Suitable crystals were identified in STEM imaging mode and diffraction was recorded in continuous rotation mode with a beam diameter of ca. 750 nm. The later parts of measurements showing significant beam damage were omitted. Further details can be found in Table 1.
Data for kinematical refinement were processed and evaluated using the APEX4 software package [24]. After unit cell determination the frames were integrated and corrected for Lorentz effects, scan speed, background, and absorption using SAINT and SADABS [25,26]. Space group determination was based on systematic absences, E statistics, and successful refinement of the structure. The structure was solved using ShelXD and refined with ShelXL in conjunction with ShelXle [27,28,29]. Least squares refinements were carried out within the kinematic approximation by minimizing Σw(Fobs2 − Fcalc2)2 with the ShelXL weighting scheme and using neutral electron scattering factors [28,30]. Due to the low amount of data, all atoms were refined with isotropic displacement parameters. H atoms were placed in calculated positions based on typical distances for neutron diffraction and refined with a riding model and Uiso(H) = 1.2·Ueq(C), for hydroxy H atoms Uiso(H) = 1.5·Ueq(O) was used and angles were refined freely.
Data for dynamical refinement were processed using the PETS2 software package [31]. After unit cell determination the frames were integrated, corrected for pattern orientation and beam position, and merged into overlapping virtual frames with a tilt range of 3° and an offset between frames of 2° [21]. Dynamical refinement was performed using JANA2020 starting with the structure from kinematical refinement as initial model [32]. Least squares refinements were carried out by minimizing Σw(Iobs − Icalc)2 based on dynamical diffraction intensities and assuming uniform thickness of the crystals. All atoms were refined with isotropic displacement parameters. Hydrogen atoms were treated in the same way as for kinematical refinement as a free refinement of bond lengths led to very long C-H bonds of ca. 1.3 Å, which seems excessive even though a certain elongation as compared to neutron diffraction data is expected [21].

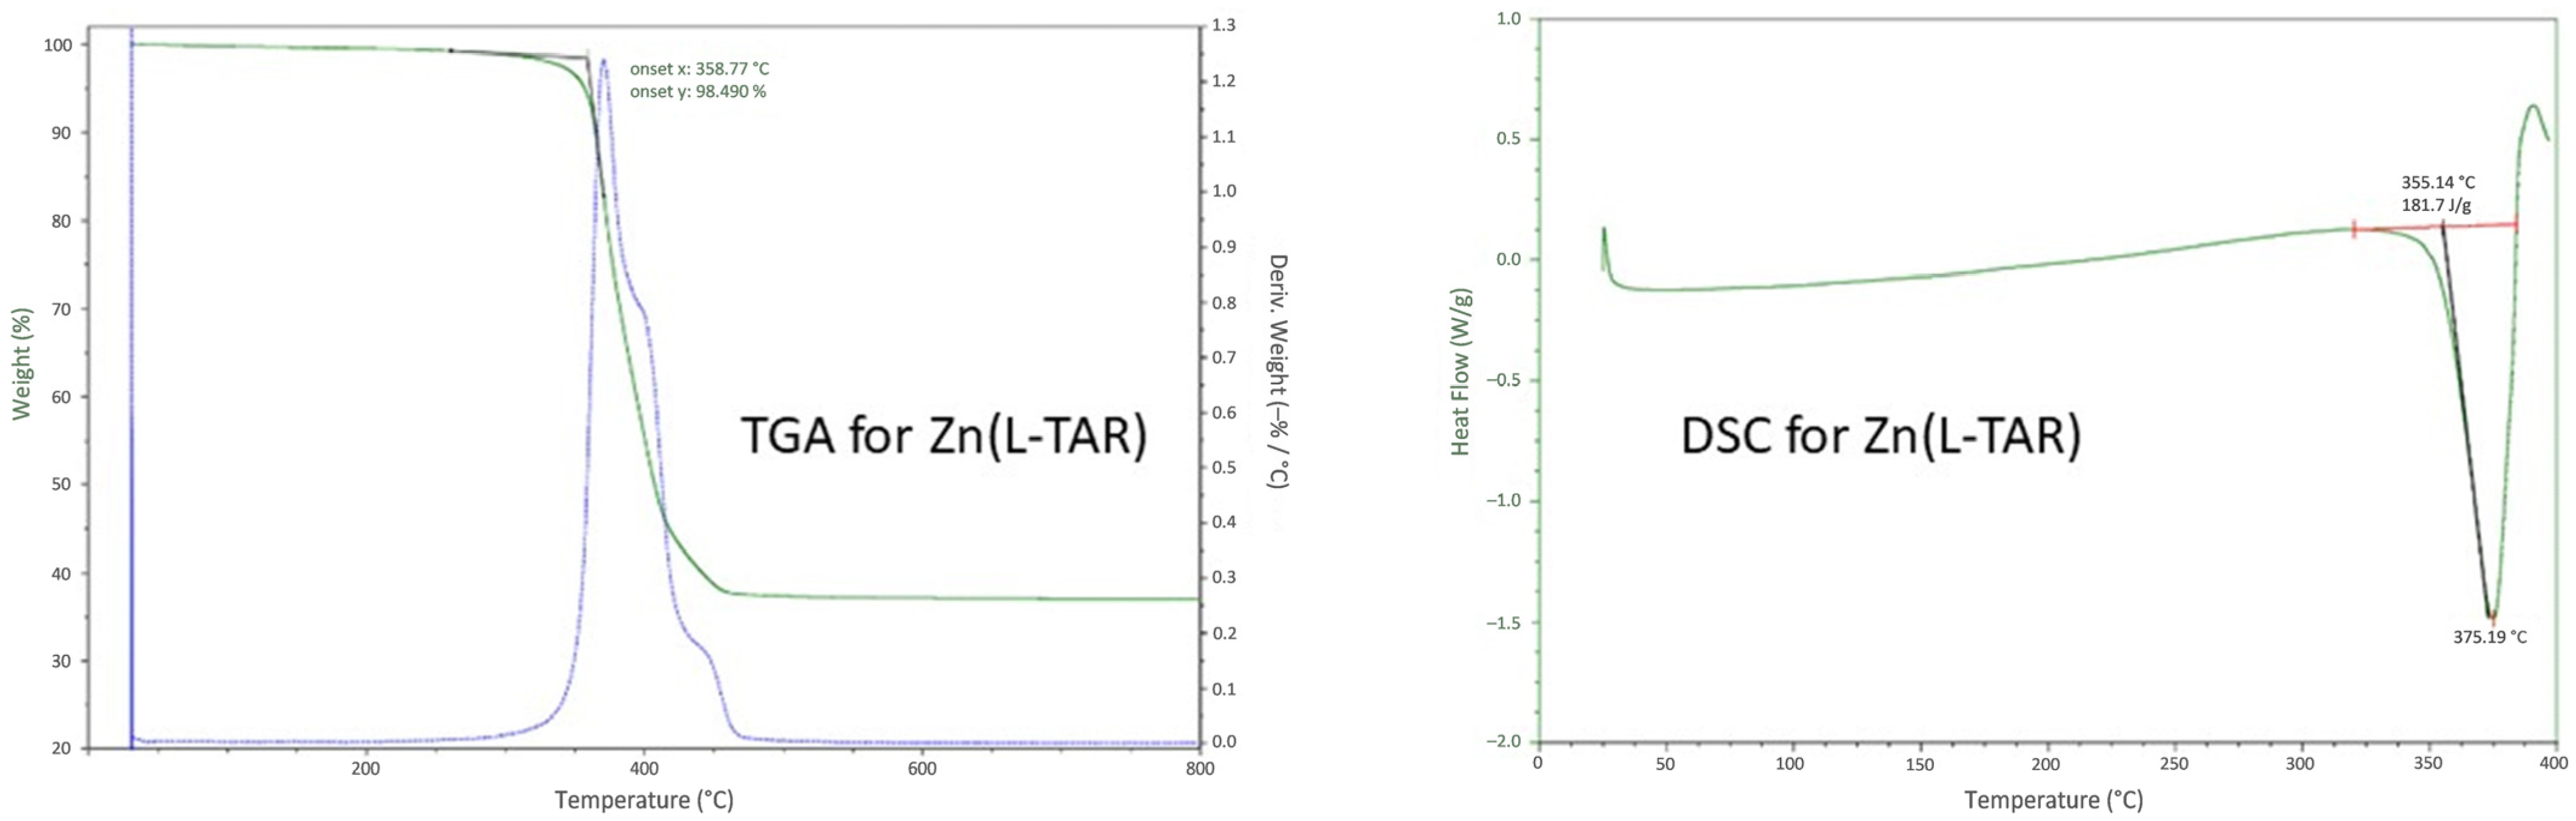
2.4. Differential Scanning Calorimetry/Thermal Gravimetric Analysis

Thermal gravimetric analysis was conducted on TA instruments TGA analyzer under N2 up to 800 °C. The plot (Figure 2, left) showed a single weight loss from [Zn(L-TAR)] (formula weight 213.5 g/mol) in the region 350–450 °C (−62%). Residual mass of 38% fits for ZnO (formula weight 81.4 g/mol). DSC measurements were made from ambient to 400 °C under a nitrogen atmosphere on a Universal V4.5A TA Instrument (Waters). A heating rate of 10 °C per minute was employed, a single endotherm was found with onset at 355 °C and with minimum heat flow at 375 °C, corresponding to the decomposition found in the TGA analysis.

3. Results

3.1. Hydrothermal Preparation of Zinc L-Tartrate and Related Phases

The structural data in the literature for zinc tartrates are dominated by hydrated phases that represent kinetic products of the system. In order to obtain the fundamental anhydrous zinc(II) tartrates, we employed mild hydrothermal synthesis. We found that conditions of 110 °C and 2 d were sufficient to eliminate crystallization of the hydrated phases. Notably, use of D/L-tartaric acid appeared to form a conglomerate with similar powder XRD to the [Zn(L-TAR)] and [Zn(D-TAR)] phases, albeit the pattern was a little broader (see Figure 3).

3.2. Structural Analysis of Zinc Tartrate by Electron Diffraction

From the hydrothermal syntheses no crystals suitable for single crystal X-ray diffraction could be obtained as 1-L and 1-D only form very small needles which are also heavily intergrown. To circumvent these difficulties, we turned to 3D-ED, which allowed the structure determination directly from the as synthesized nanocrystalline samples.
1-L and 1-D crystallize in the orthorhombic space group I222 with half a formula unit in the asymmetric unit (Table 2 and Table 3 and Figure 1 and Figure 4). They are isostructural to the reported Mn(II), Fe(II), Co(II), and Ni(II) tartrate coordination polymers, which are all based on naturally occurring L-tartrate [33]. Zn is coordinated by six O atoms in a distorted octahedral fashion with Zn-O distances between 2.00(2) Å and 2.36(4) Å. The longer Zn-O distances occur for the “backward” coordinating O of the carboxylate (see O1 in Figure 4) that chelates together with the hydroxy O forming a bite angle of 74.4(11)° to 75.8(7)° at the metal. The coordination sphere is completed by the same chelate motif of another tartrate molecule and two more carboxylate O atoms of different tartrates which coordinate in the common “forward” mode (see O2 in Figure 4). Thus, each Zn(II) ion is coordinated by four different tartrates and each tartrate is connected to four different Zn(II) ions forming a three-dimensional coordination polymer. The structure features no pores that could accommodate water or other solvent molecules and is essentially a ‘condensed’ phase.

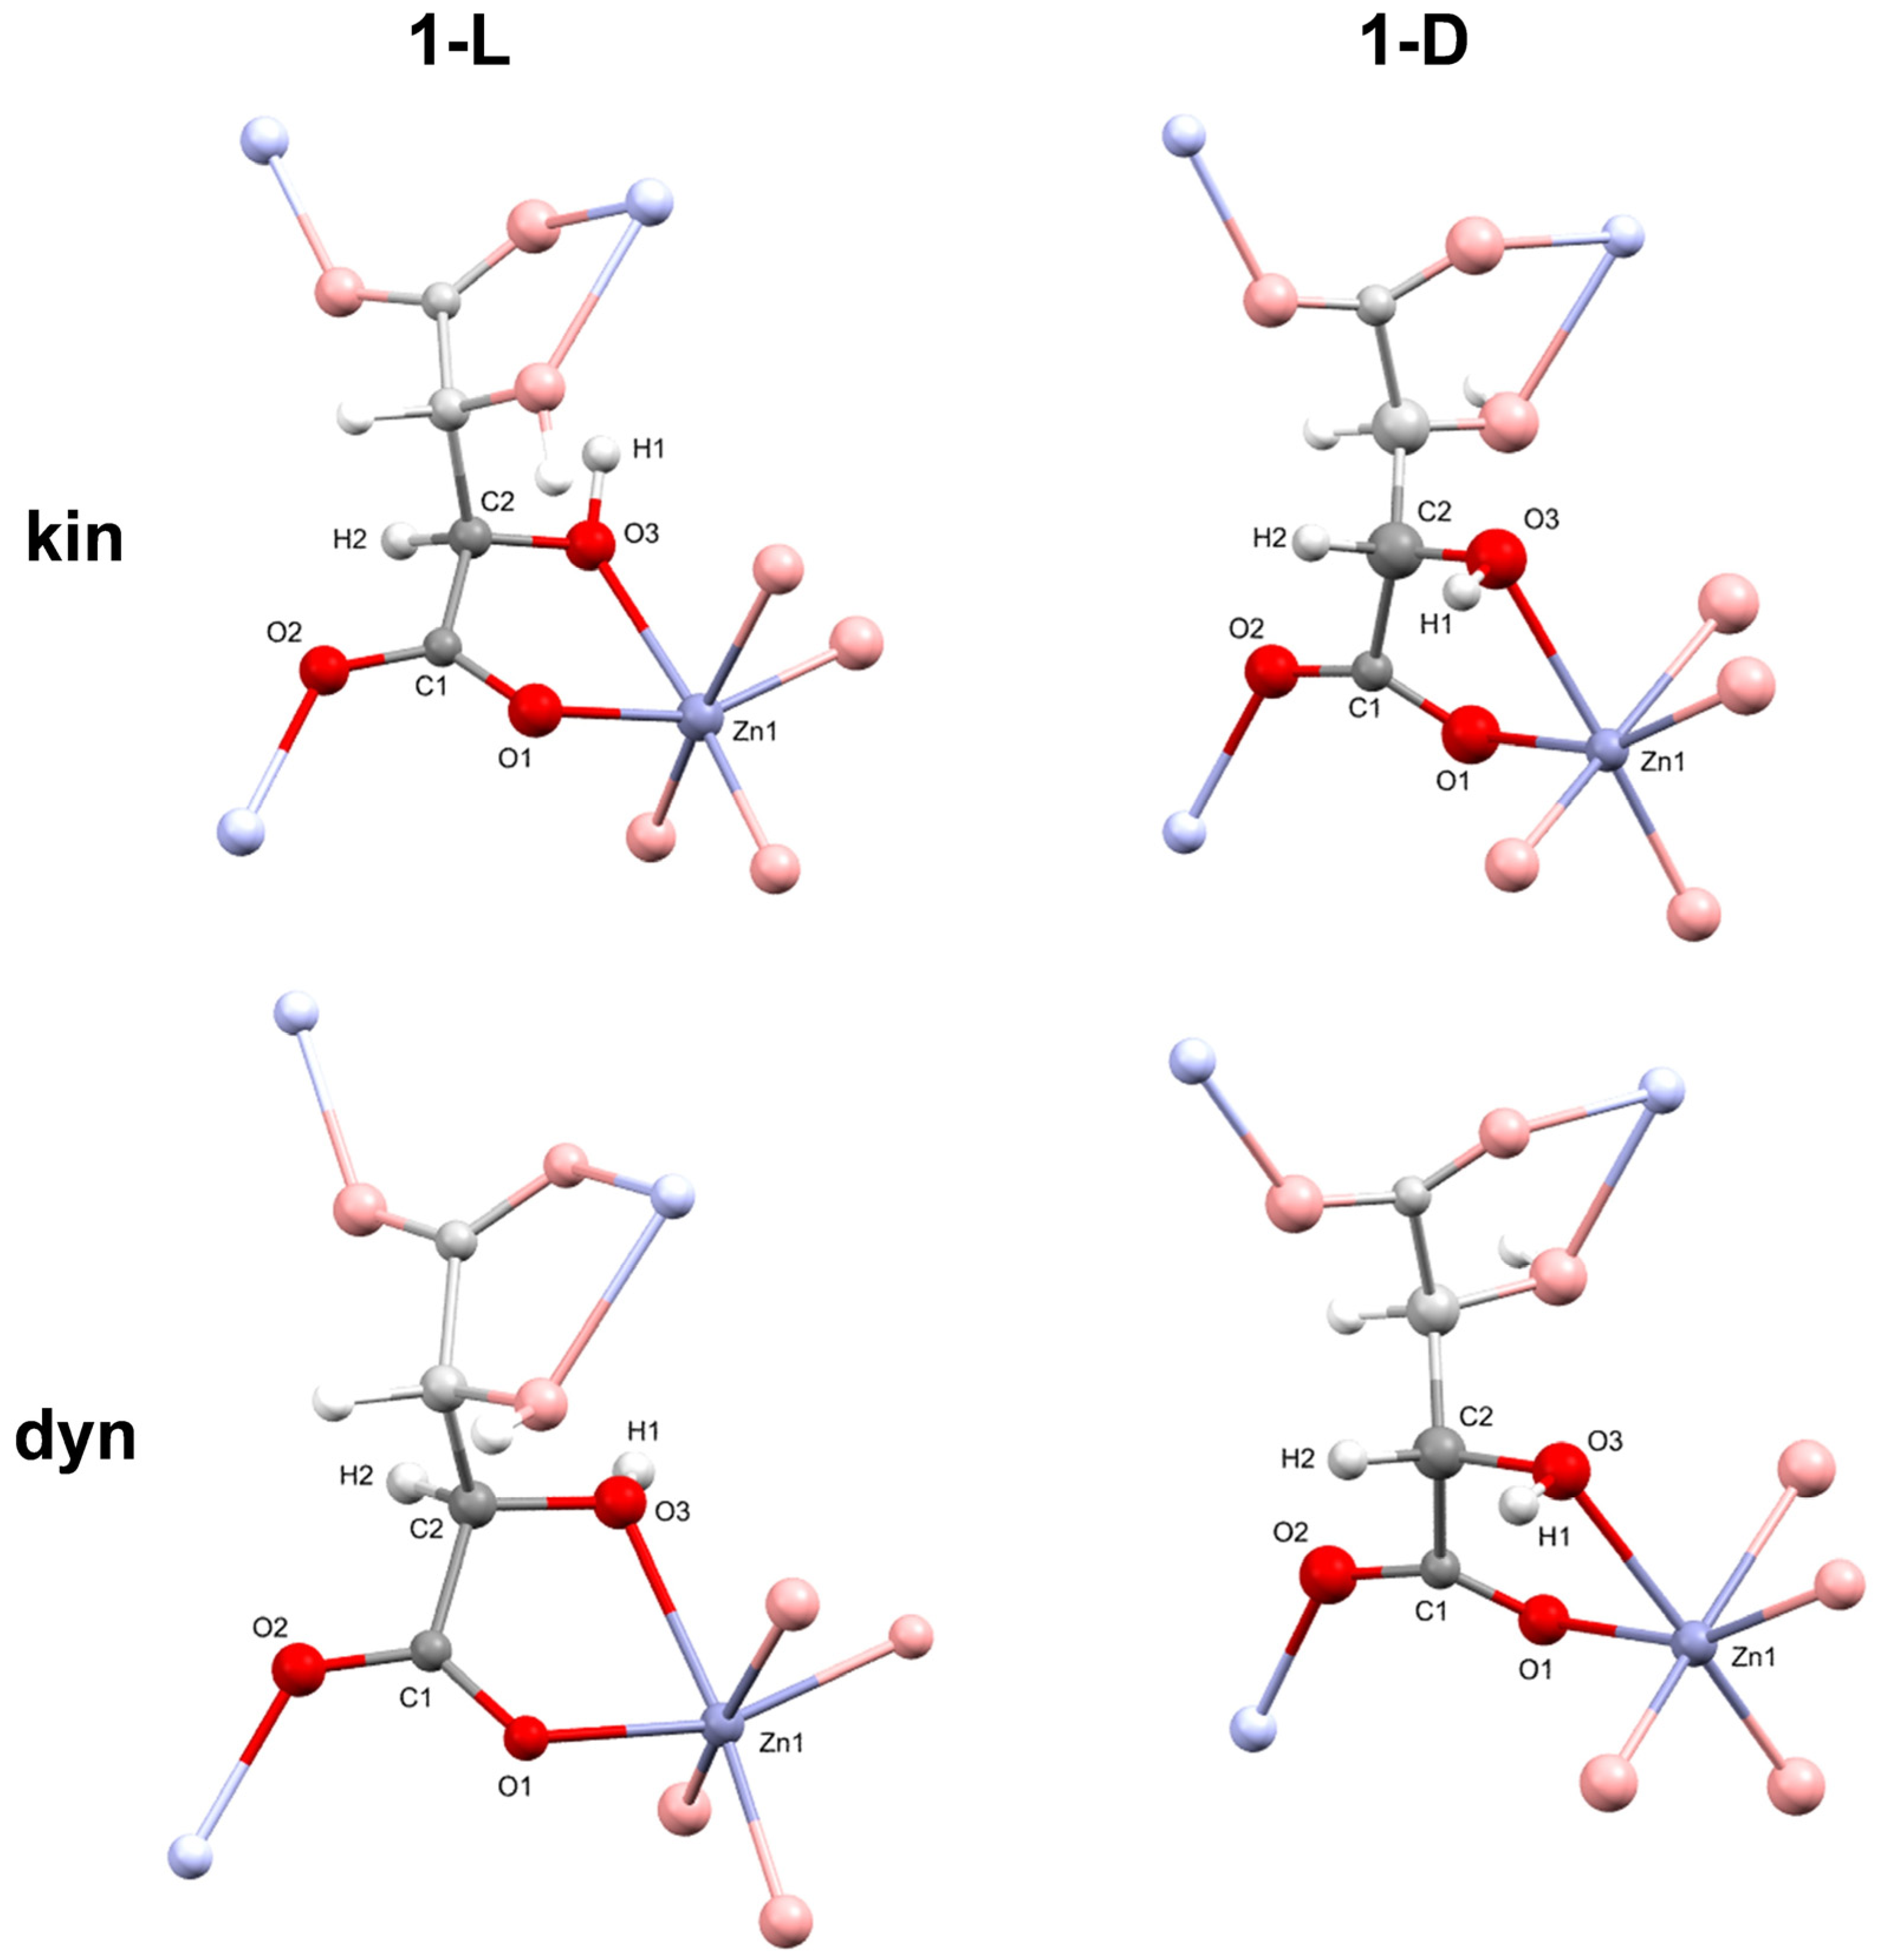
3.3. Absolute Structure Determination of Zinc Tartrates by Dynamical Refinement

As the title compound was synthesized with both enantiomers of tartaric acid, dynamical refinement of both enantiomorphs was performed for each sample to confirm the correct form. In both [Zn(L-TAR)] and [Zn(D-TAR)] the correct enantiomorph gives clearly better R/MR factors (MR1 by 3.4% for 1-L and 1.9% for 1-D) than the inverted form (see Table 4). For further validation z-scores were calculated yielding values of 4.29σ for 1-L and 3.50σ for 1-D which corresponds to probabilities of >99,9% that the absolute structures are determined correctly (see Table 4) [21]. In addition, of course, the R factors also improve in comparison to the kinematical refinement results (see Table 2).
Notably the H position on the hydroxy group differs between the dynamically (dyn) and kinematically (kin) refined structures of 1-L while it is similar for 1-D. The H position of 1-L-dyn corresponds to a hydrogen bond with a carboxylate O atom from an adjacent ZO6 octahedron at a O-O distance of 3.21(3) Å. It also agrees with the literature reported structure of the Co(II) analogue [33]. The H position of 1-L-kin seems rather unusual, it features an unnatural C-O-H angle of 98(6)° and leads to a contact of 2.1(2) Å with its symmetry equivalent. Although its position would at least correspond to a potential hydrogen bond to a carboxylate O of the same tartarte molecule at a distance of 3.39(5) Å, one cannot rely on the H position from kinematical refinement in this case. Starting the refinement from the correct position obtained from 1-L-dyn still produces the same result.

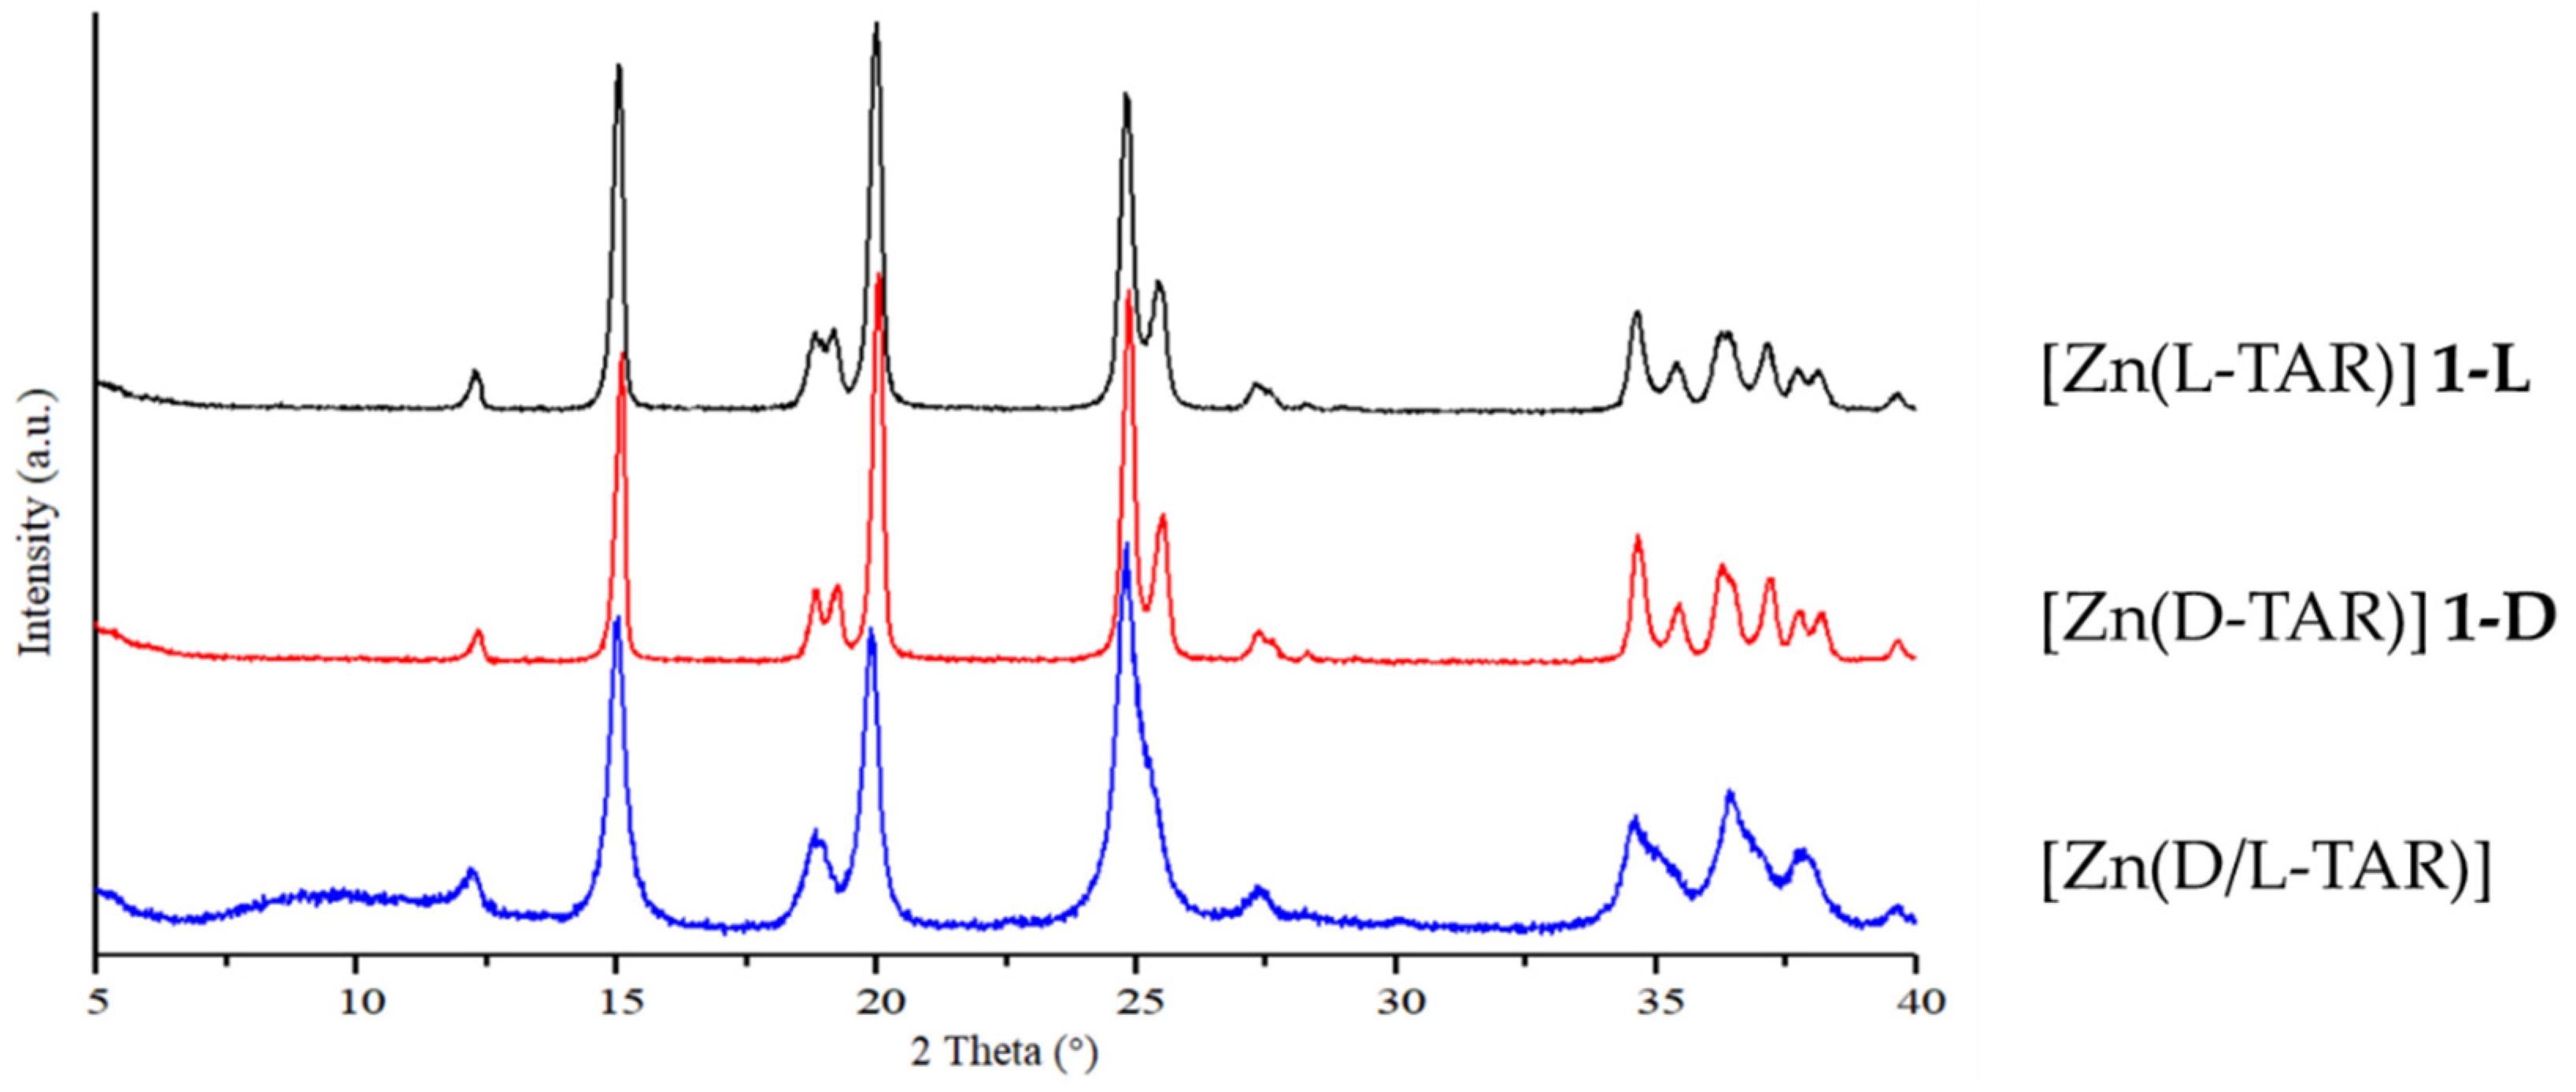
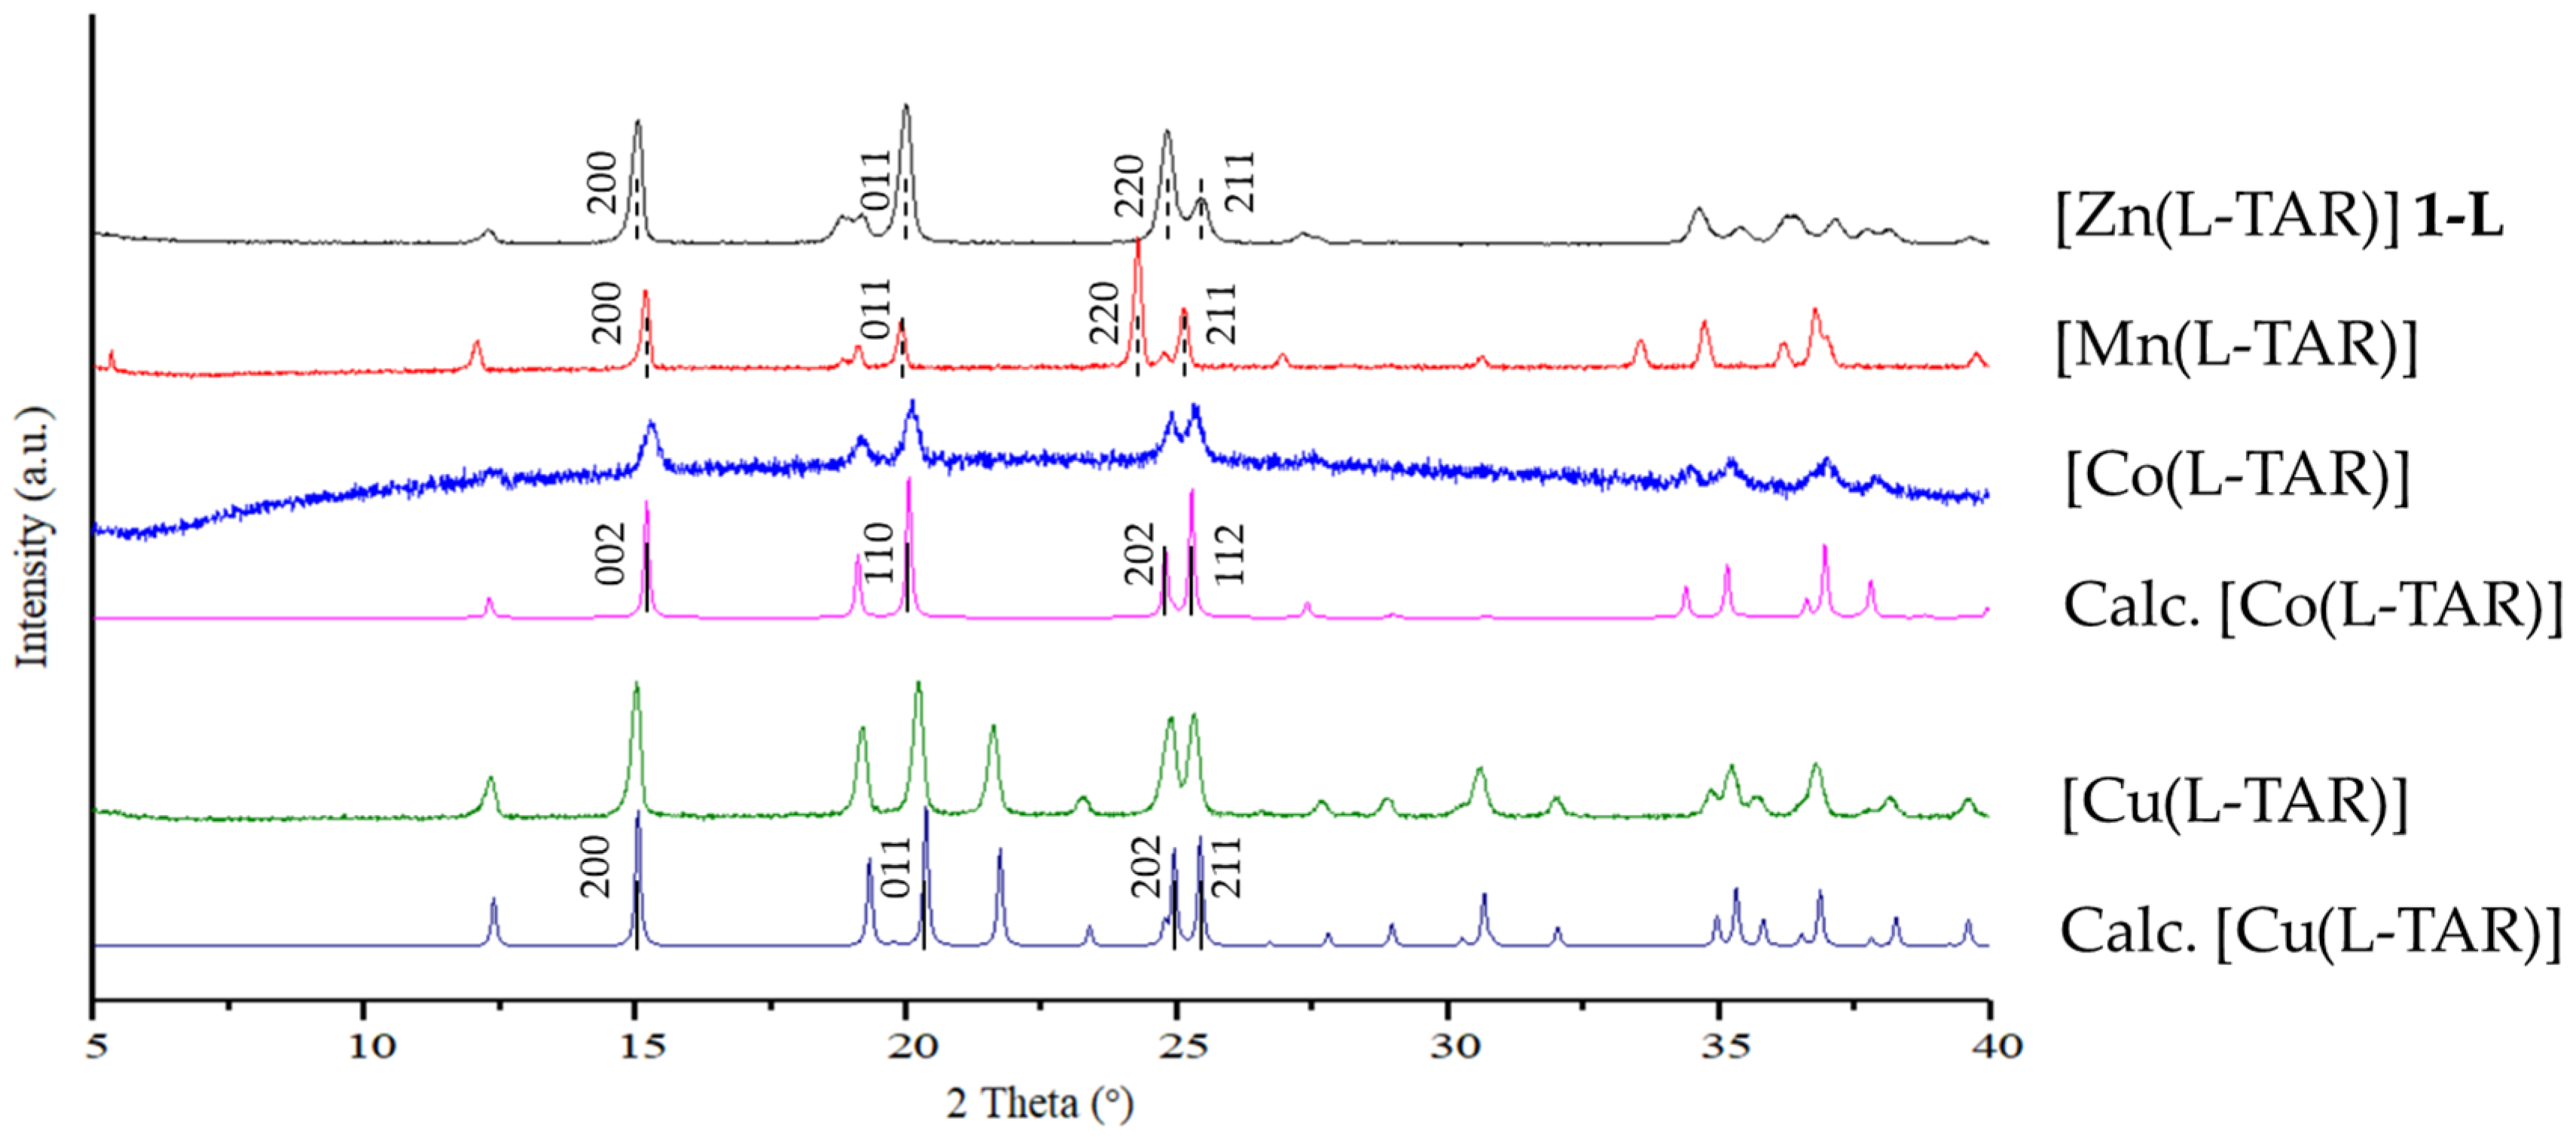
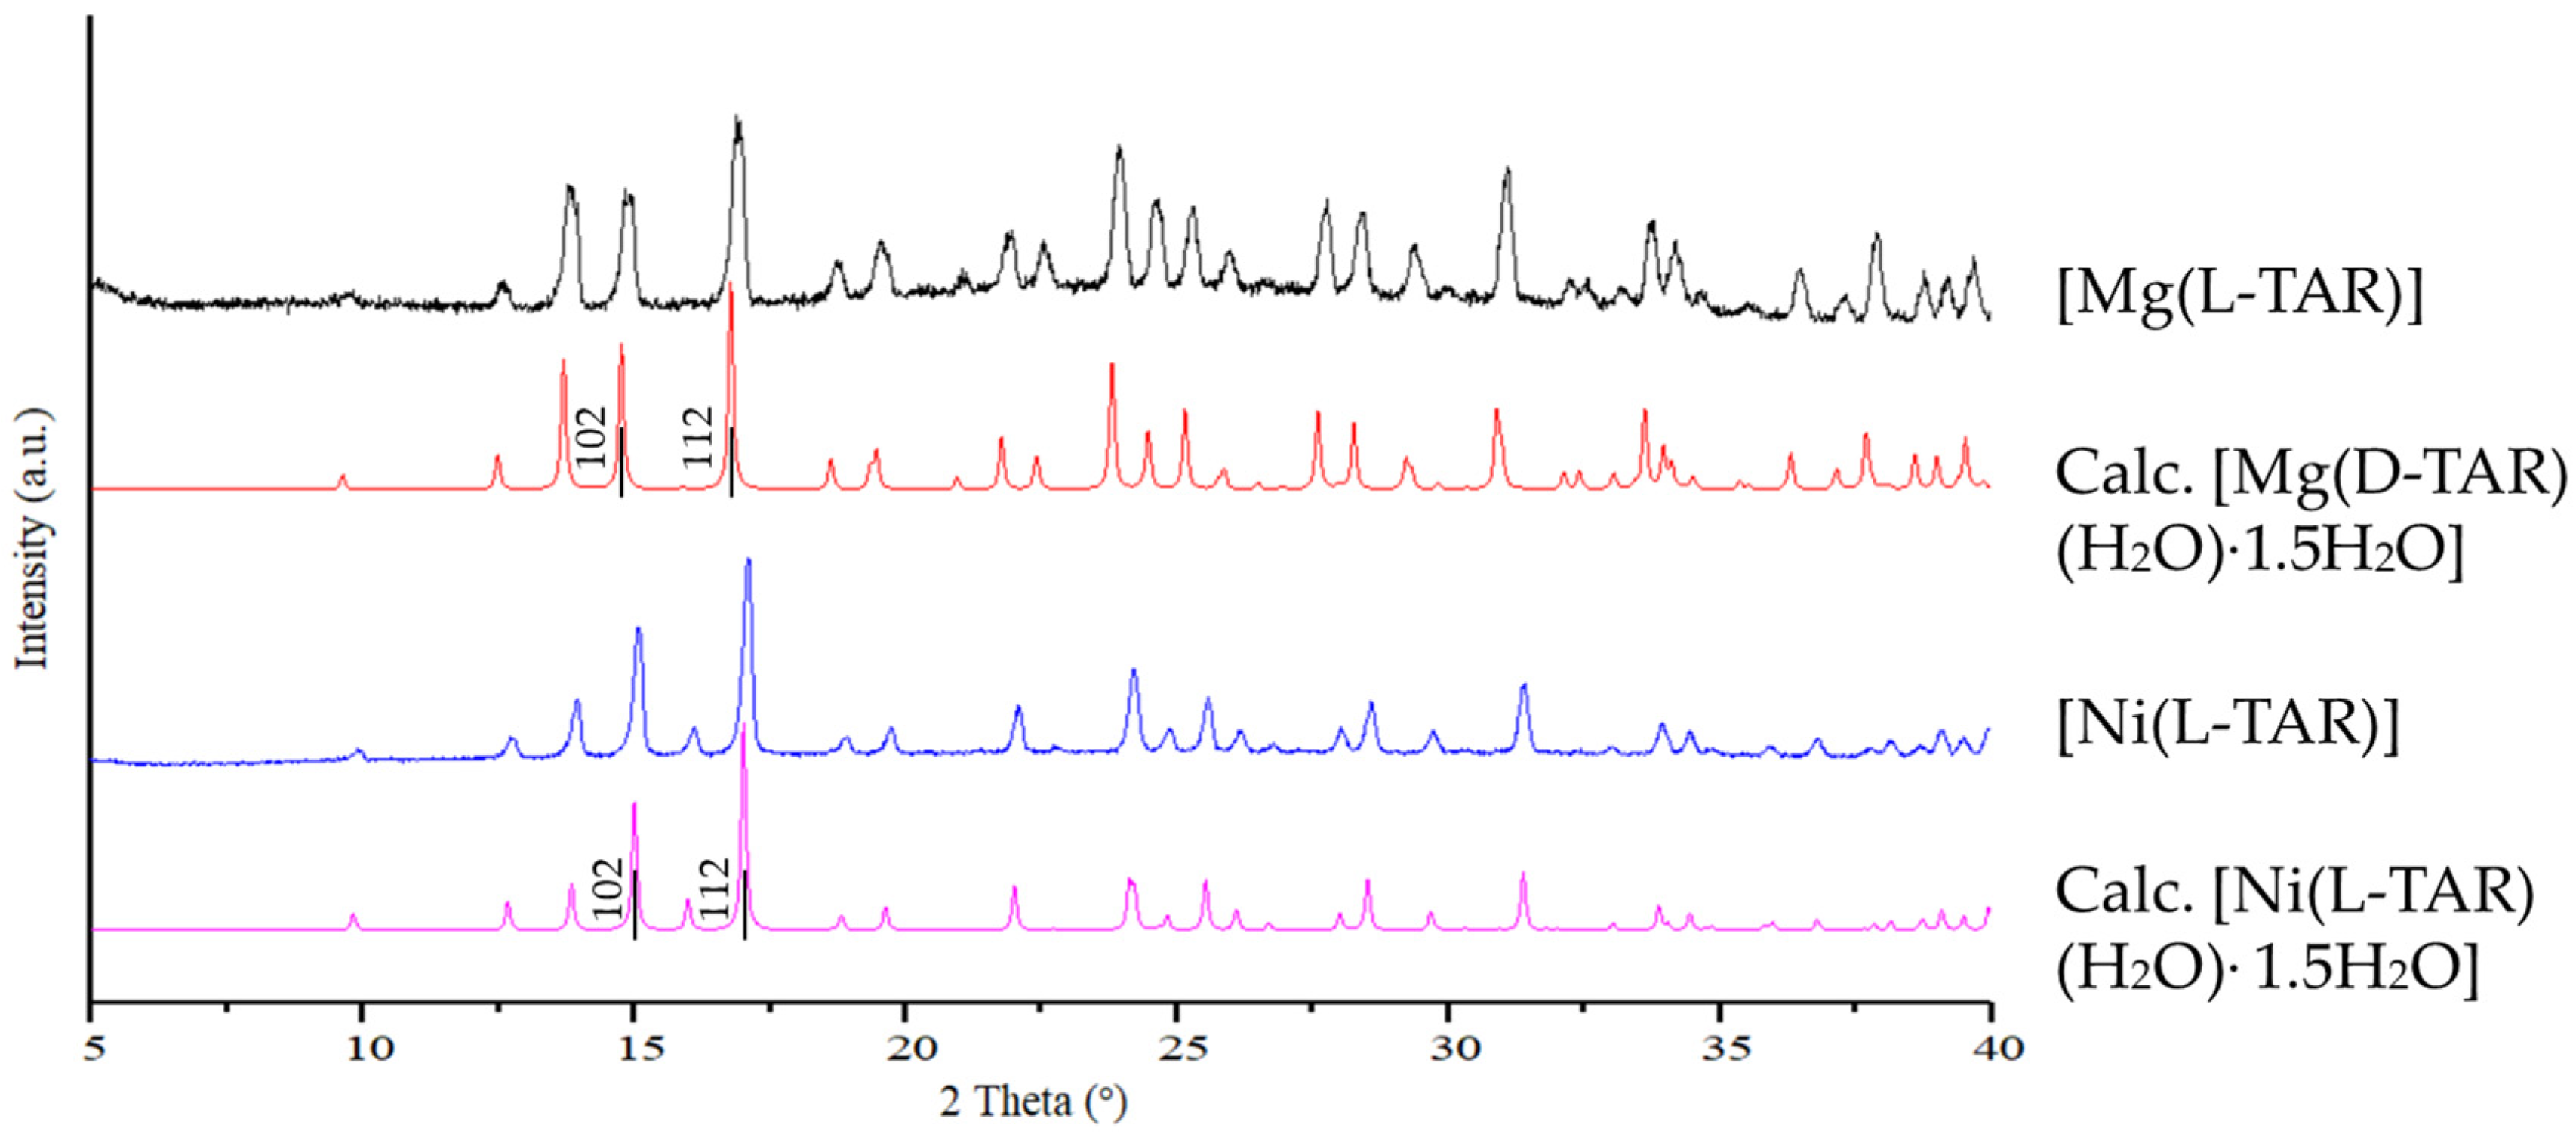
3.4. Preparation and Characterization of Related Metal Tartrate Phases

As mentioned the structure of 1-L and 1-D was found analogous to several other anhydrous M(II) tartrates, which were able to be characterized by single crystal X-ray diffraction [33,34,35]. Similar hydrothermal syntheses (110 °C, 2 d, 0.5 mmol scale in 1 mL water) using various divalent metals M2+ = Mg, Mn, Co, Ni, and Cu were carried out and the micro-crystalline powders analyzed by powder X-ray diffraction. The results are shown in Figure 5 and Figure 6.
The powder X-ray diffractograms of anhydrous [Co(L-TAR)] and [Cu(L-TAR)] are calculated from the single crystal structures of ACOVEU [33] and VIJGUS [36], respectively. The solid lines represent the actual crystal planes from the single crystal structures, while the dashed lines show the hkl indexed by DICVOL06 [37]. The indexed planes of the main peaks all fit with the equivalent planes of the actual cells, showing Zn, Mn, Co, and Cu formed anhydrous metal tartrates using these hydrothermal conditions.
The powder X-ray diffractograms of [Mg(D-TAR)(H2O)·1.5H2O] and [Ni(L-TAR)(H2O)·1.5H2O] hydrates are calculated from the single crystal structures of JIFXIG [34] and CIXKEZ02 [35], respectively. The two Mg and Ni metal tartrate products match well with their corresponding calculated patterns, indicating that these two metals tend to form hydrates under 110 °C hydrothermal conditions.

4. Discussion

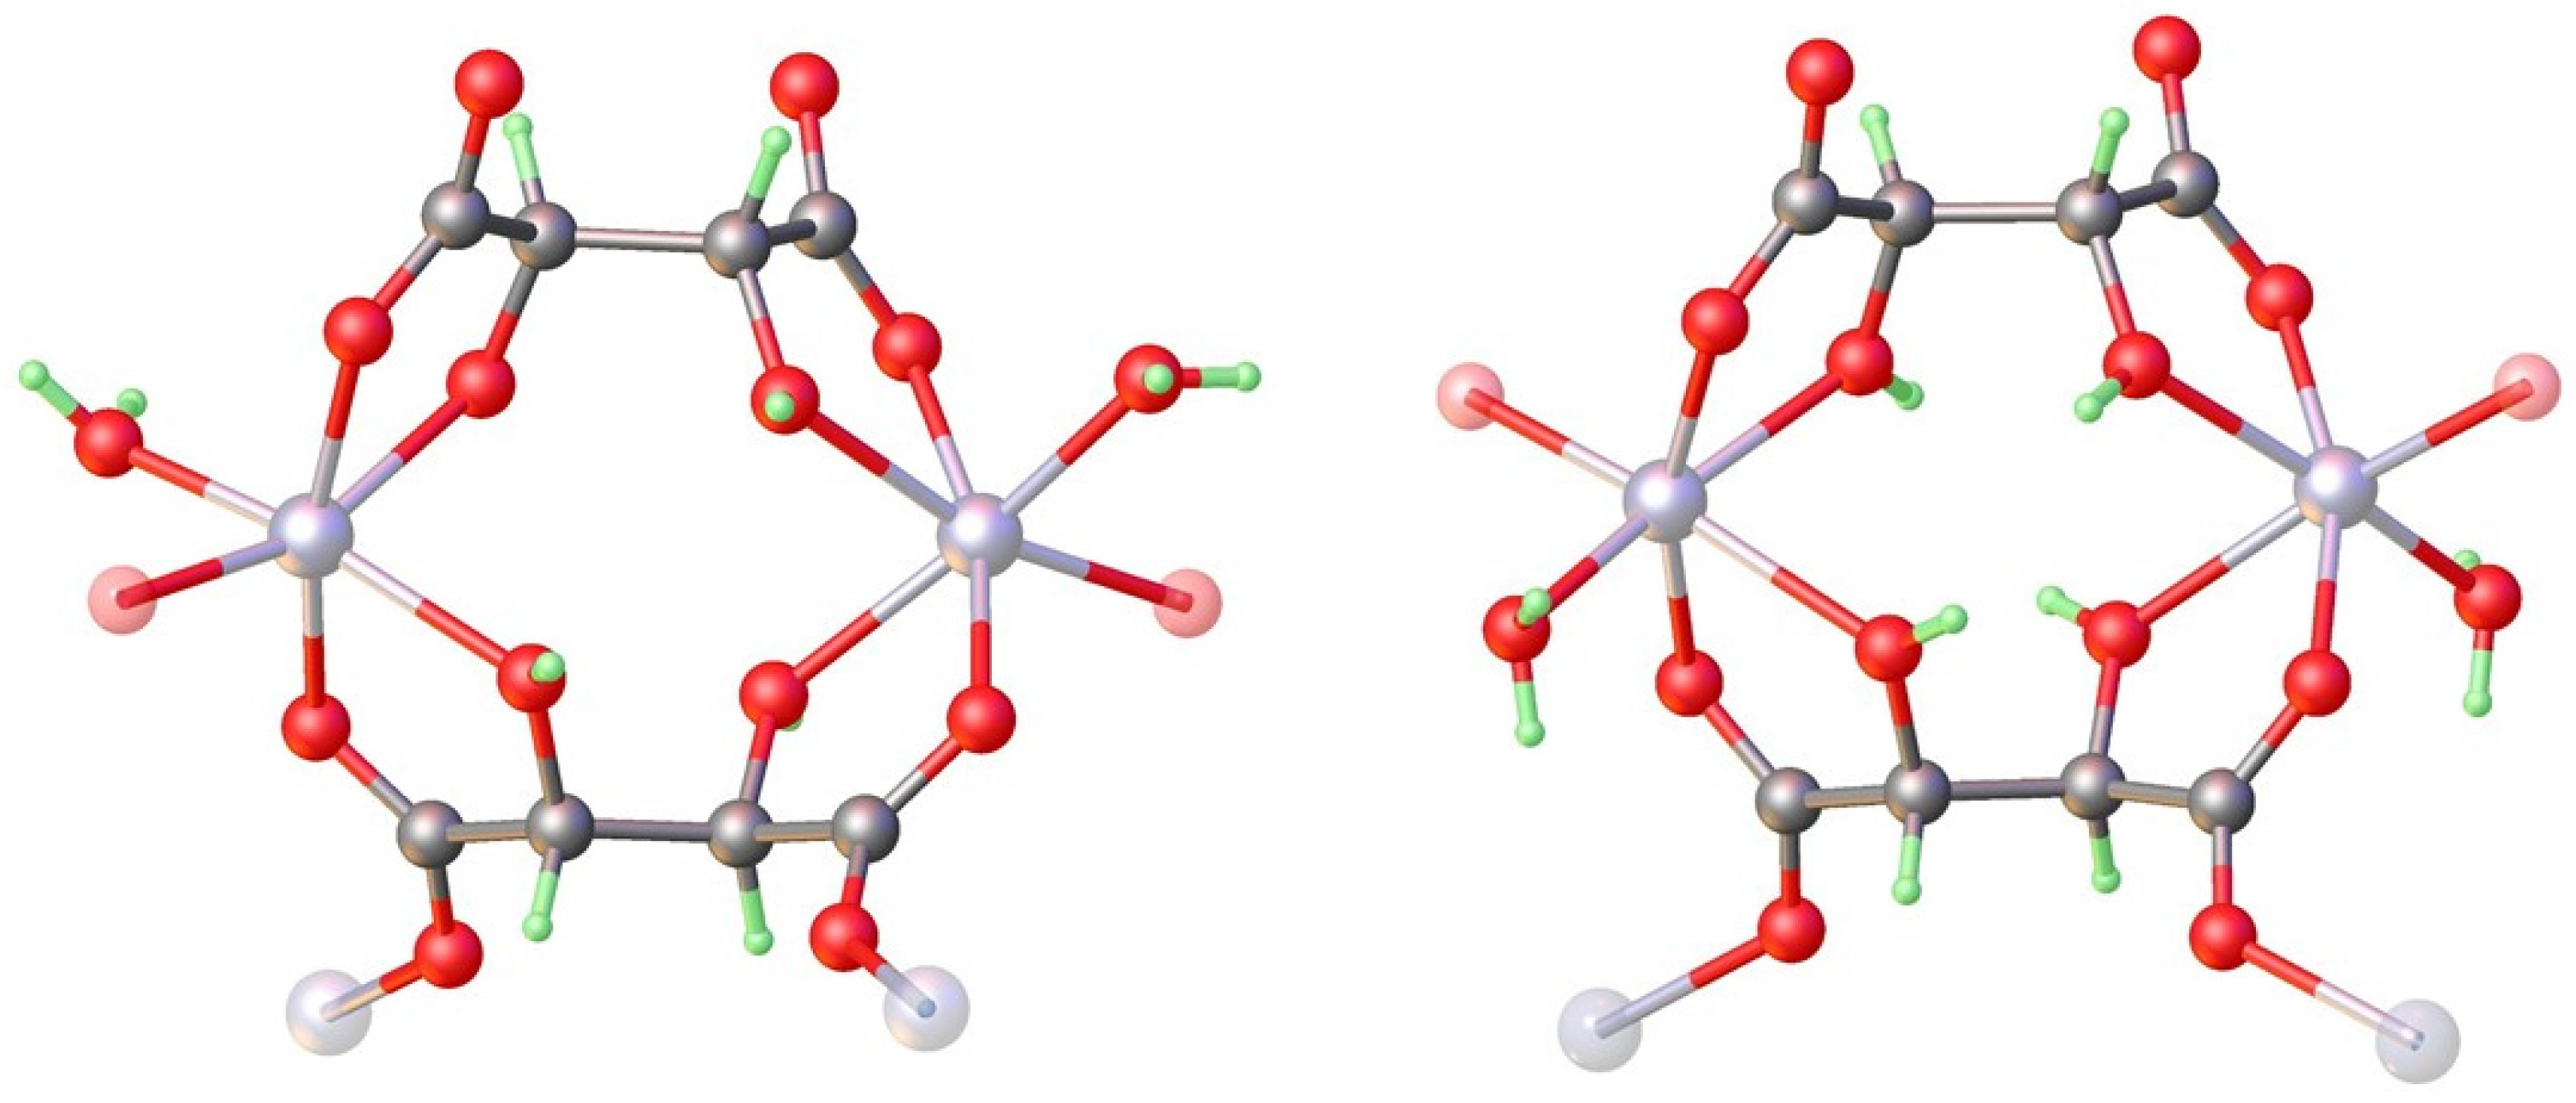
4.1. Structure and Absolute Structure Determination

The zinc tartrate phases represent a typical application example for the 3D-ED technique when X-ray crystallography fails due to small particle size < 1 µm. The diffraction patterns from numerous specimens were scanned but the majority showed twinning or intergrowth problems. One benefit of electron diffraction is that in imaging mode individual crystals can quickly be identified and then studied for diffraction. After a suitable crystal was identified by its pattern, the intensity data were collected in continuous rotation mode. Due to beam damage the maximum exposure for crystals is limited before structural degradation occurs, so a rapid intensity data collection was necessitated. The orthorhombic symmetry of the pattern meant that hkl coverage was acceptable just from one crystallite.
The successful solution and reasonable quality of the refined structural model using the kinematic approximation gave R1 = 16.7% for [Zn(L-TAR)]. This then led us to attempt a dynamical refinement in order to determine the absolute structure. This was carried out using JANA2020 [32] which is so far the only publicly available program with this ability and has been used to establish absolute structures in various cases, most of them organic molecules related to pharma [20,21]. The application of this approach gave R1 = 11.8% (MR1 = 11.6%) for the correct hand (2R, 3R) and R1 = 14.5% (MR1 = 15.0%) for the inverted (2S, 3S) structure, whereas there is no difference in R1 at all for the inversion of the kinematically refined structure. The difference of approximately 3 percentage points along with a z-score of ca. 4.3σ allows for unequivocal absolute structure identification. As a confirming experiment, a fresh sample of [Zn(D-TAR)] was prepared and analyzed in the same way. The results on the 1-D specimen are in good agreement with the data for 1-L except that the dynamical diffraction models indicate the inverse absolute stereochemistry. The data are summarized in the above tables.
So dynamical refinement indeed proved to be a reliable method for the identification of the stereochemistry in these nanocrystalline samples. Dynamical refinement also proved to be superior in the location of H atoms as the kinematical refinement of 1-L yielded a wrong H position on the hydroxy group. Even though there have been reports of H atom locations based on just kinematical refinement results, care has to be taken in the evaluation of such results and often dynamical refinement will be necessary for the accurate identification of all H sites [21]. As nanocrystalline samples such as in our case are a common challenge encountered in MOF chemistry, 3D-ED has already gained considerable attention in this field [2,4,5,6,7]. The ability to determine crystal structures from just a single crystallite and even identify the absolute structure in the cases of chiral compounds will likely let the use of 3D-ED grow rapidly in the future.

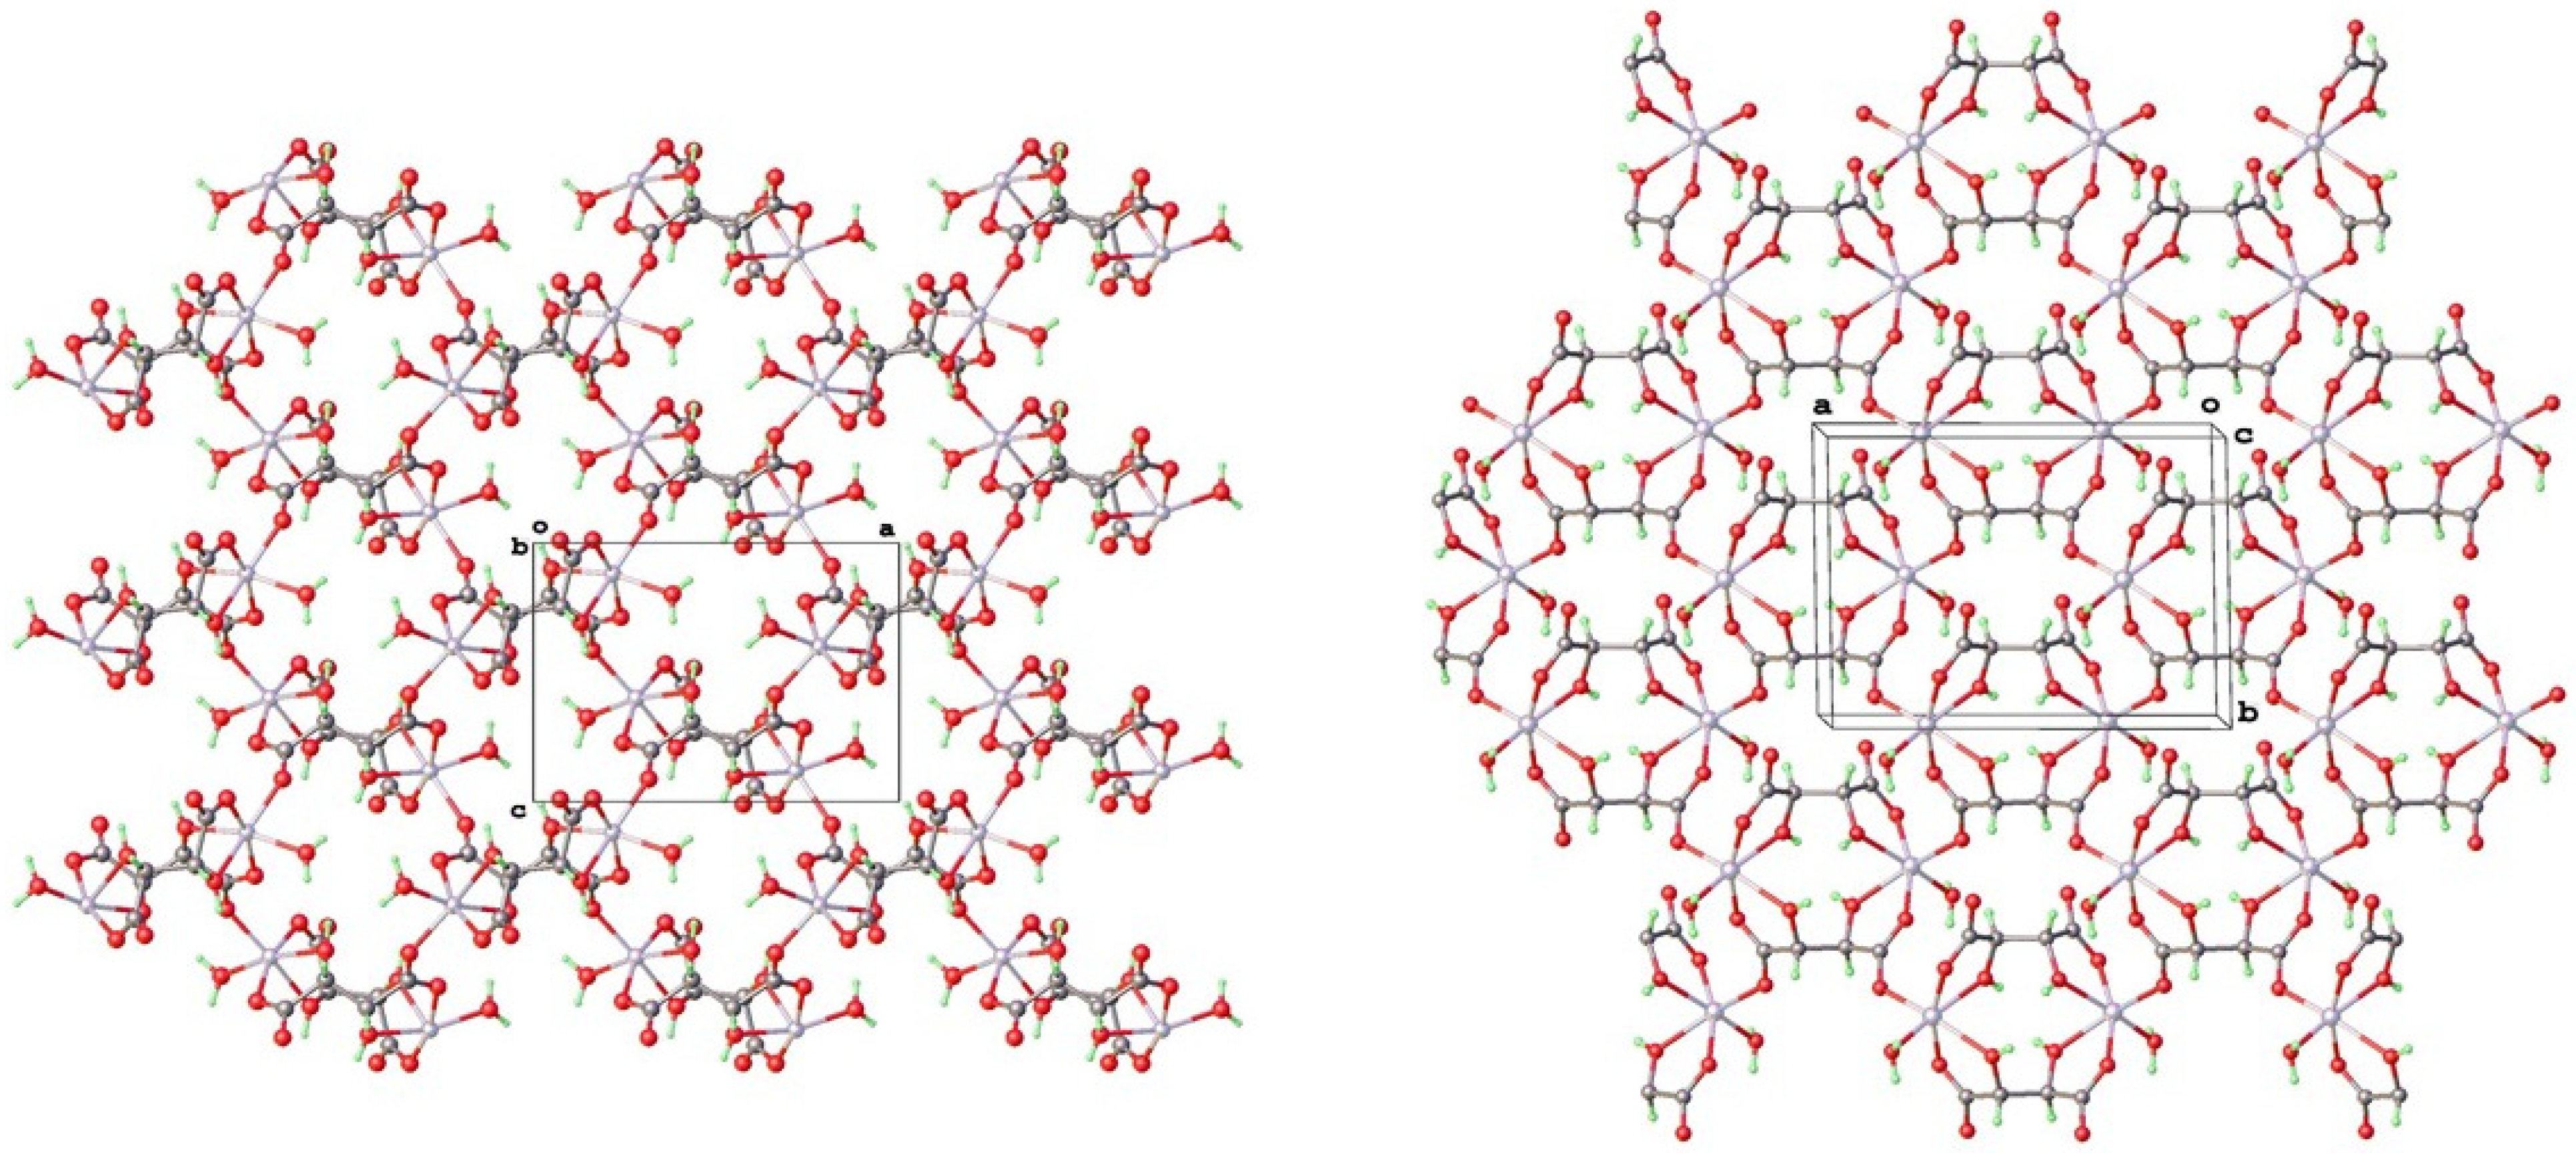
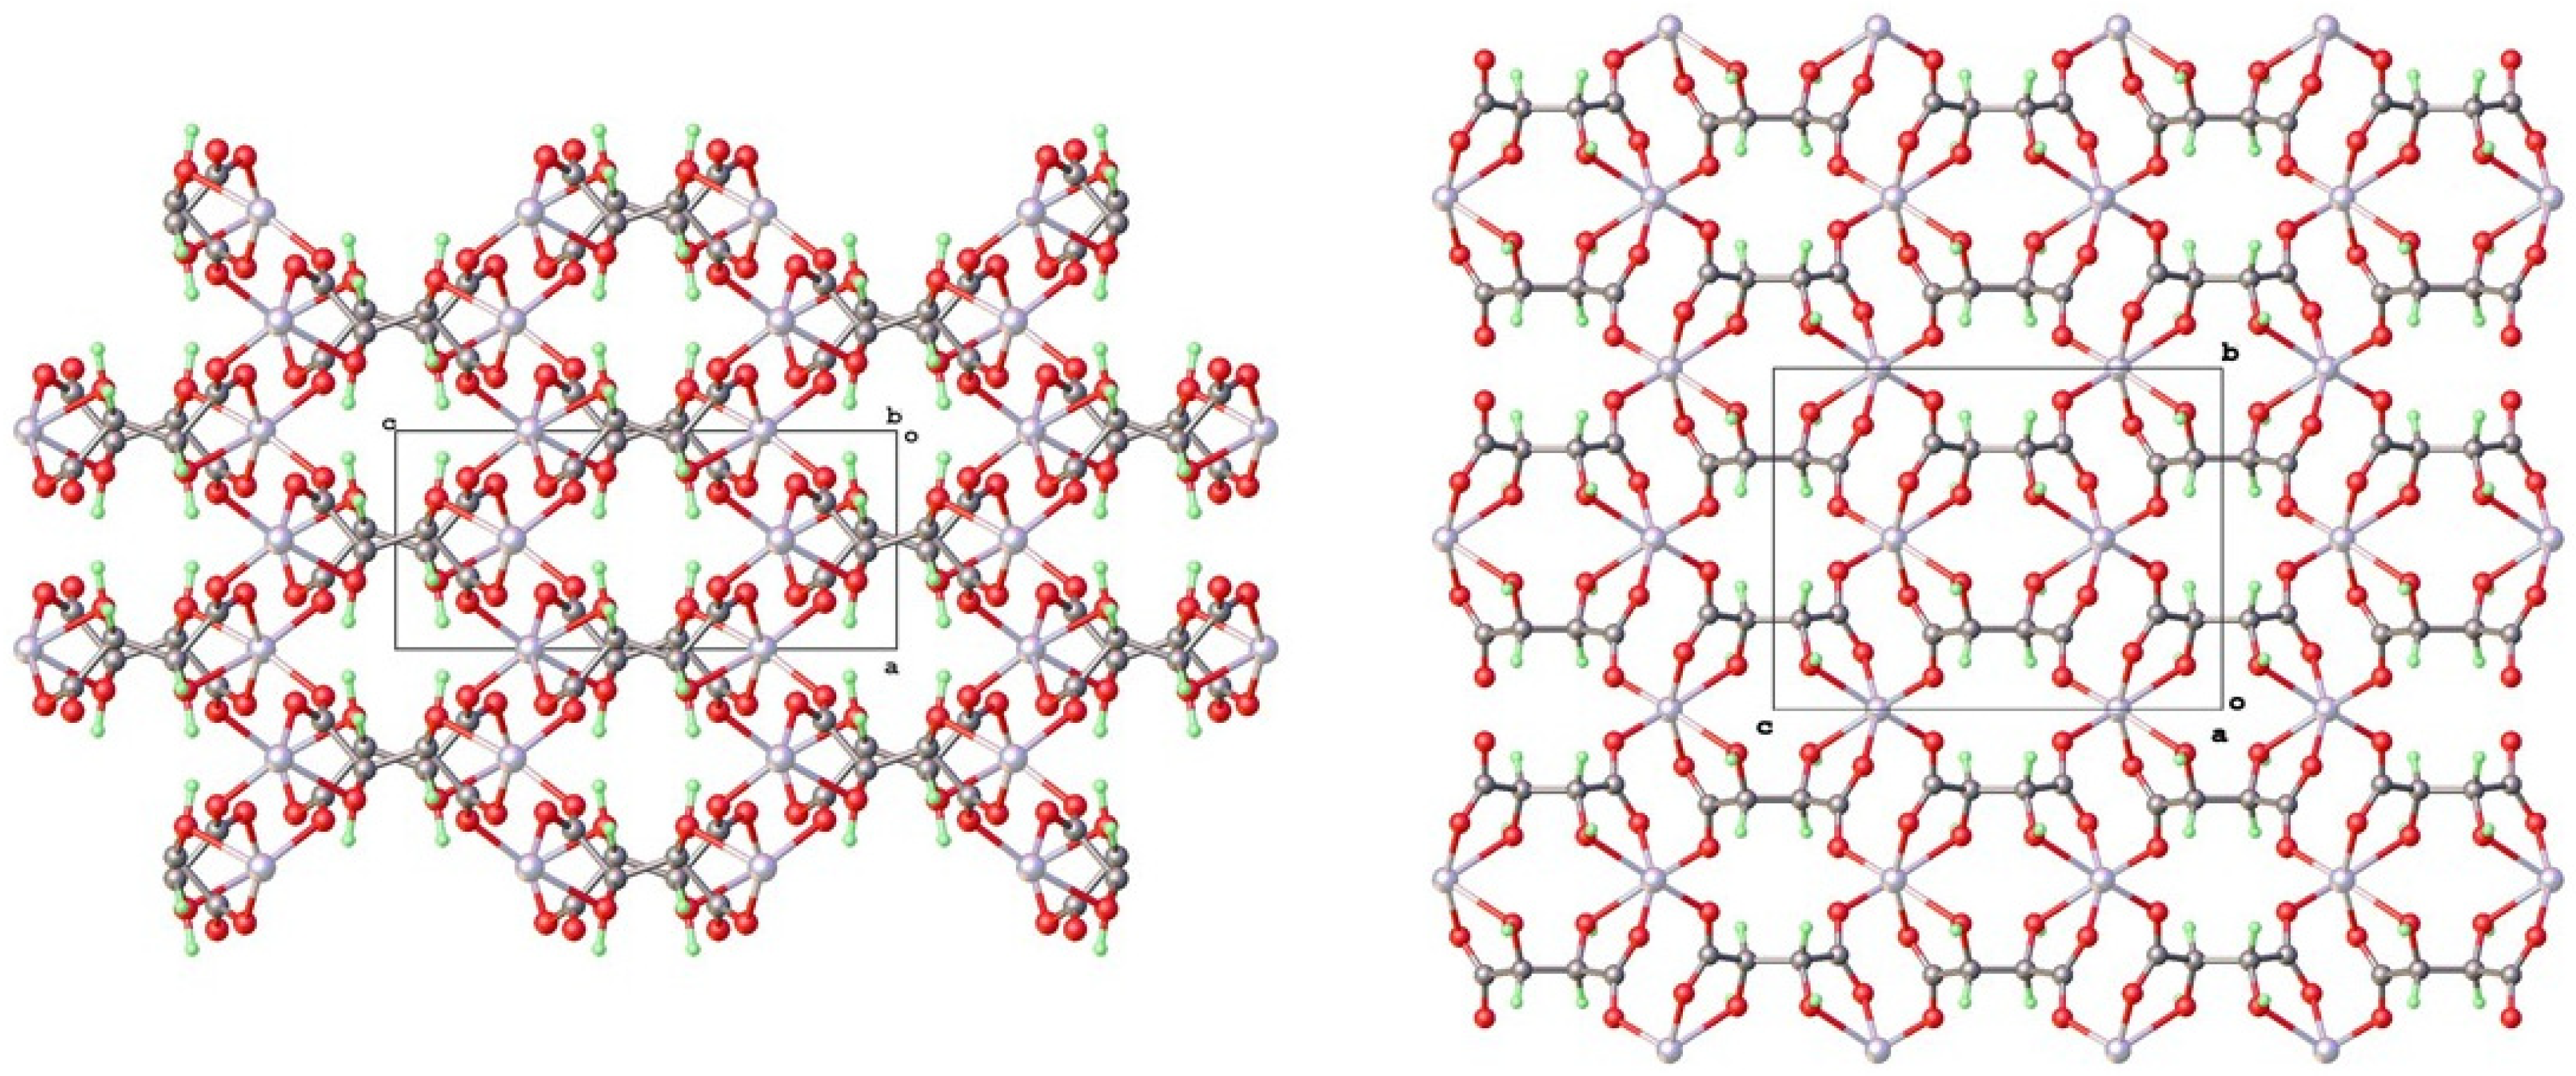
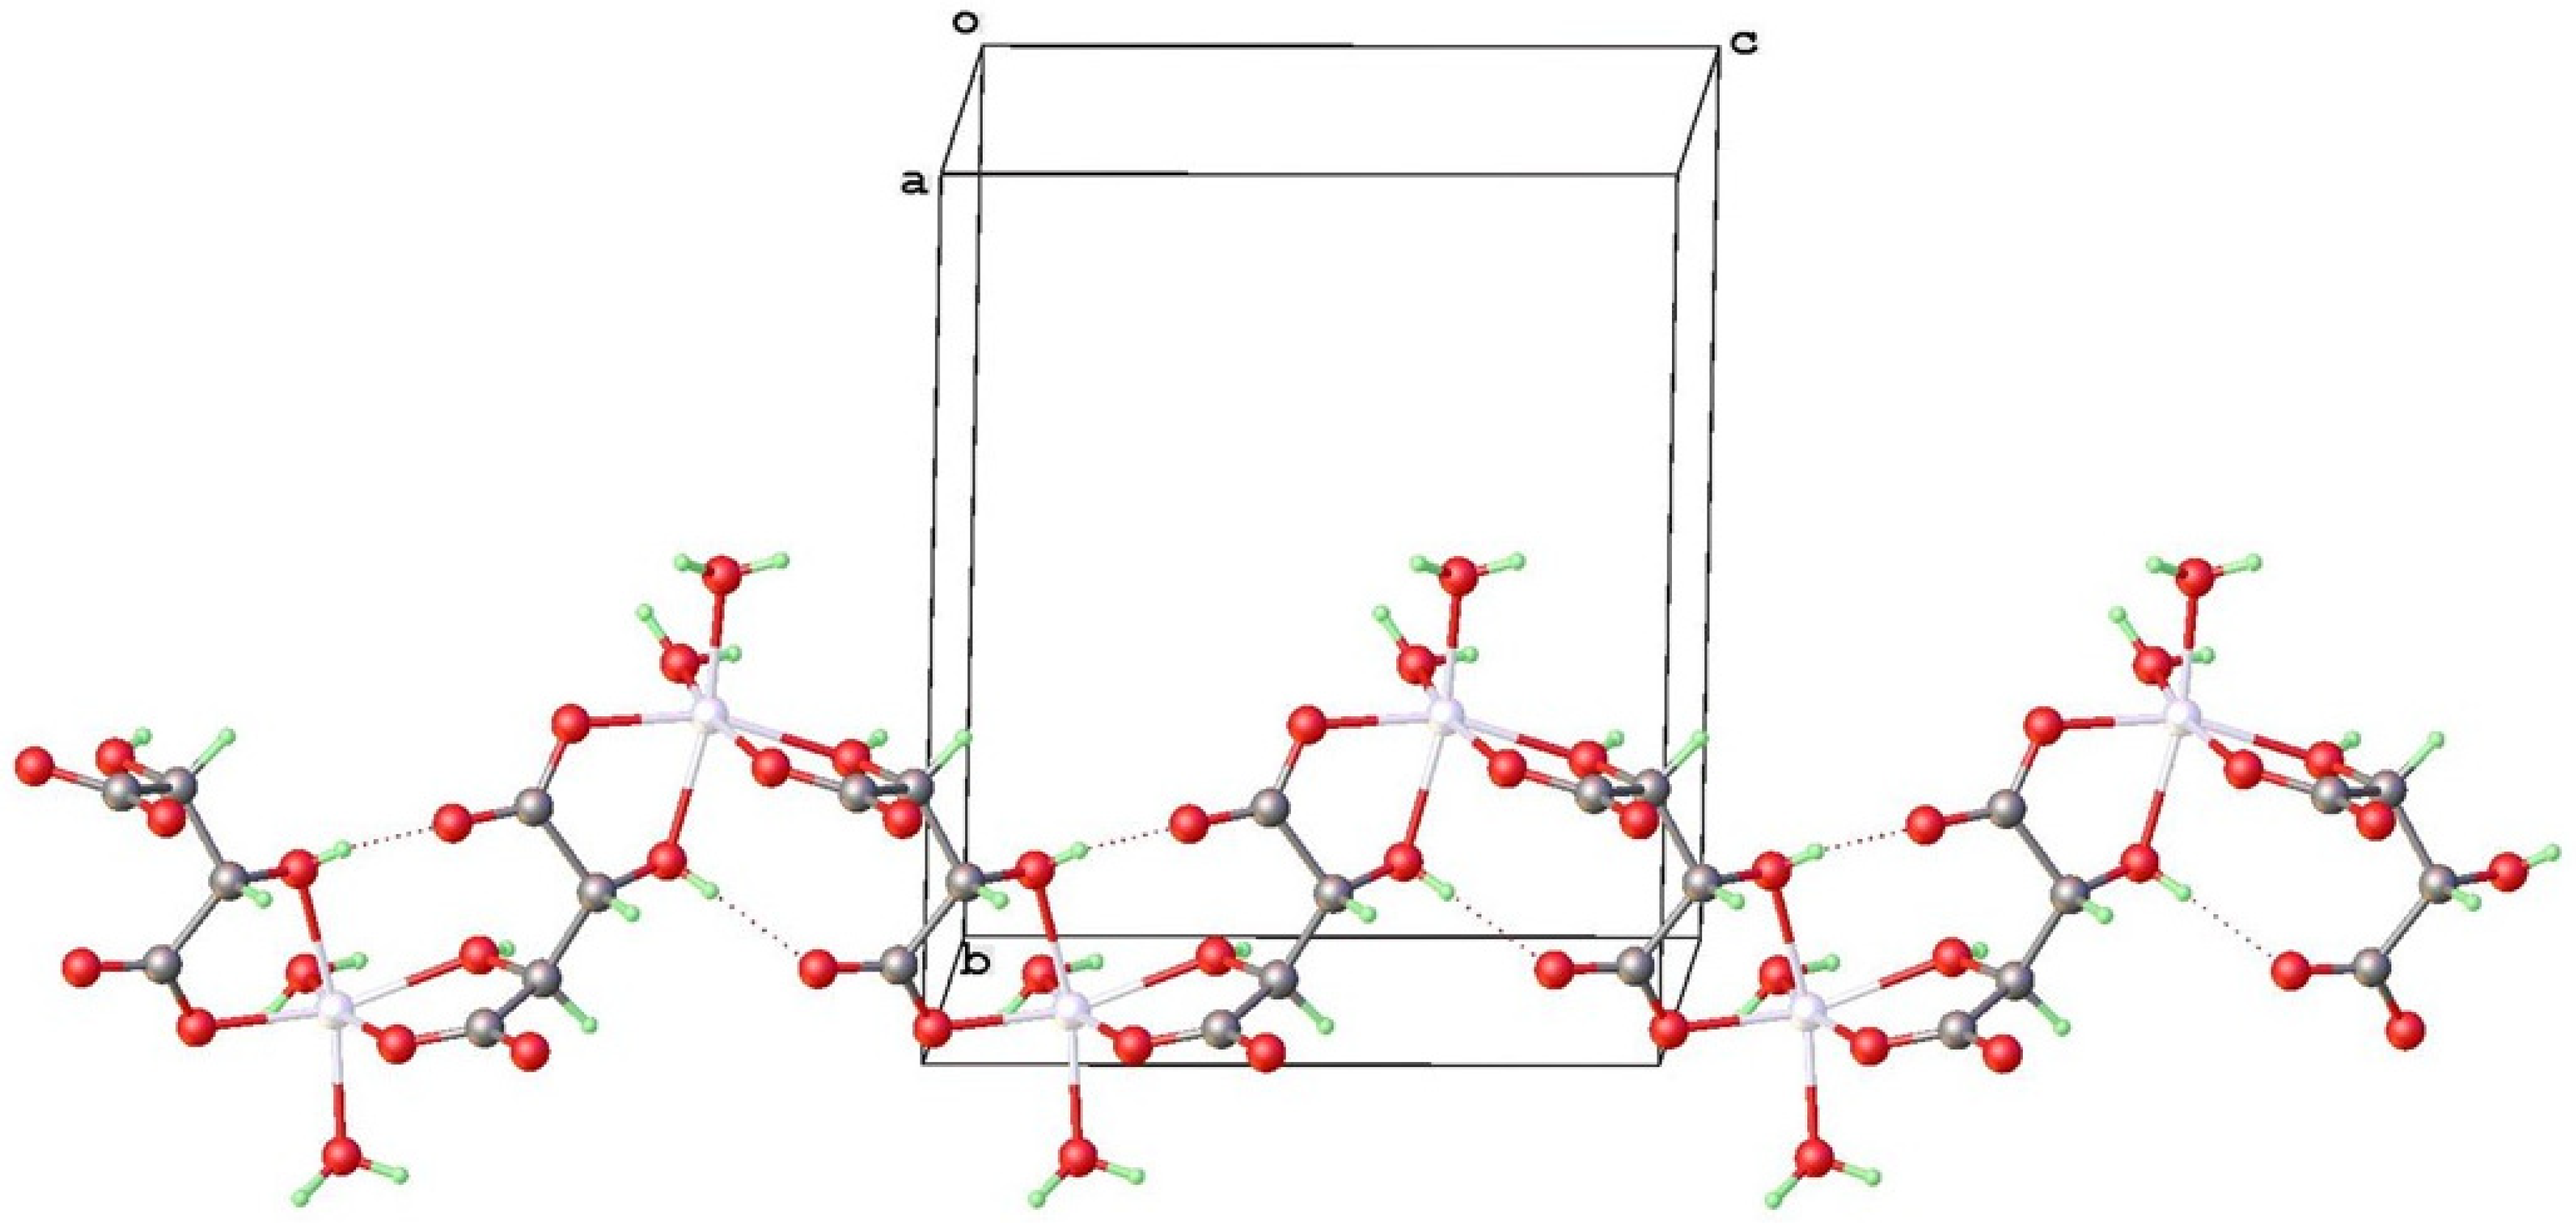
4.2. Topological Comparison of Zinc Tartrate Phases

The geometric details for the structure (metal–ligand and C-O bond lengths) are in general agreement with expectations (Table 3), but the bond length uncertainties are unavoidably higher for 3D-ED than for SC-XRD. The anhydrous phase can be briefly compared with the previously reported zinc tartrates reported in the Cambridge Structural Database [14,15,16,17].
The next level of structural comparison for these MOFs is the structural building block SBU. This is best seen as a molecular dimer comprising two octahedral M2+ dications and two bridging µ2-tartrate-dianion ligands. In the anhydrous phase both tartrates are µ4 and provide six coordination sites for the metal. In the hydrated phases CUJBAK and KURNOB the two tartrates are chemically distinct with one µ4- and one µ2-tartrate. The keto oxygens of one ligand are not coordinated and the two vacated sites are occupied by coordinated aqua groups. The distinction between the two hydrated frameworks is that they are diastereomeric—the water and keto coordination are reversed as may be seen in Figure 7. It may also be pointed out that the octahedral metal centers are also chiral and the designation of Δ can be ascribed for L-tartrate networks and Λ for D-tartrate analogues.
Finally, the overall assembly of the [M(TAR)] SBUs into the MOF framework can be considered. The I222 phase is completely 3D, whereas CUJBAK and KURNOB form 2D topological networks (see Figure 8) that are distinct from each other and also entrap different amounts of guest water molecules. The arrangement for I222 amounts to combining the connectivity found in the two 2D networks since the dimer unit is the same, but the keto ligation is the combination of what is found in the other two hydrated phases (see Figure 9).
The meso phase MUYPUU has two coordinated aqua molecules per Zn and this forms a 1D chain polymer, that packs in an efficient interdigitated manner with itself, entrapping no further water of crystallization (see Figure 10). This may hint at why this hydrated form persists to even higher temperatures than the L-tartrate hydrated phases, since hydrothermal preparation at 140 °C still yielded this hydrated phase type.

4.3. Isostructurality with Other Bivalent Metal Tartrates

Hydrothermal preparation of [M(L-TAR)] analogues with Zn were carried out under similar conditions for M2+ = Mg, Ca, Mn, Fe, Co, Ni, and Cu. In all cases microcrystalline powders resulted. Powder X-ray diffractograms indicated that isostructural or pseudo isostructural phases could be prepared for most of these metals with the exception of Ca and Fe. The preparation of [Fe(L-TAR)] using Fe(OAc)2 in a similar manner was unsuccessful, although [M(L-TAR)] phases M = Mn, Ni, Co, and Fe have been prepared and investigated for their magnetic properties [33]. The structures of [Ni(L-TAR)] [35] and [Cu(L-TAR)] [36] were obtained after dehydration of hydrated phases through single-crystal to single-crystal transformations. Calcium prefers to adopt a hydrated structure with higher coordination number [38].
Reactions with L-(2R,3R)-tartaric and D-(2S,3S)-tartaric acid afforded the mirror image chiral MOFs 1-L and 1-D. Notably tartaric acid has two other forms meso-2R,3S-tartaric acid and racemic D/L-(2R,3R/2S,3S)-tartaric acid. Corresponding reactions substituting these different stereochemical forms could allow for phase types with different crystal structures incorporating inversion symmetry. However, the Zn(D/L-TAR) reaction gives a powder XRD pattern that seems close to the L-TAR or D-TAR products indicating that a conglomerate of these crystals is favored. In the meso-case the centrosymmetric hydrated phase MUYPUU is still afforded at 110 °C. This phase also persists at 140 °C, but higher temperature may still result in an anhydrous phase. Table 5 gives the unit cell data for the phase types and corresponding entries that were retrieved from the CSD or PDF for the bivalent anhydrous metal tartrates mentioned above.
Investigations of structure property relations for various optical and electrooptical effects are in progress including chiro-photoluminescence of zinc tartrate.

5. Conclusions

The crystal structures of the 3D network coordination polymers [Zn(L-TAR)] and [Zn(D-TAR) have been investigated by 3D-ED and were solved and refined using conventional X-ray crystallography programs with both a kinematical and dynamical diffraction approach. The absolute structures could also clearly be discriminated. Symmetry analysis of the network in these 3D nets indicate that not only is the ligand chiral with two halves related by a two-fold axis, but the octahedral metal centers are chiral as well and can be classified as Δ or Λ configuration. The current work shows that valuable and detailed structural information on chiral nanocrystalline MOF materials can be provided by modern electron diffraction techniques.

Author Contributions

Conceptualization, I.D.W.; synthesis and methodology, P.K.C.P. and C.L.C.; validation, K.L. and C.W.; formal analysis, I.D.W. and C.J.; investigation, K.L., C.J. and G.S.; data curation, C.J.; writing—original draft preparation, I.D.W. and C.J.; writing—review and editing, All; supervision, I.D.W.; project administration, I.D.W. and P.S.; funding acquisition, I.D.W. All authors have read and agreed to the published version of the manuscript.

Funding

Funding support of the Research Grants Council of Hong Kong (C6022-20E) and the Hong Kong Branch of the Southern Marine Science and Engineering Guangdong Laboratory (Guangzhou) (grant No. SMSEGL-20SC01-D) are gratefully acknowledged.

Data Availability Statement

CCDC 2242890-2242895 contain the supplementary crystallographic data for this paper. These data are provided free of charge by the joint Cambridge Crystallographic Data Centre and Fachinformationszentrum Karlsruhe Access Structures Service www.ccdc.cam.ac.uk/structures (accessed on 22 February 2023).

Acknowledgments

We thank Jane Y C. Wu for help with the DSC measurements.

Conflicts of Interest

The authors declare no conflict of interest. The funders had no role in the design of the study; in the collection, analyses, or interpretation of data; in the writing of the manuscript; or in the decision to publish the results.

References

  1. Nannenga, B.L.; Gonen, T. The Cryo-EM Method Microcrystal Electron Diffraction (MicroED). Nat. Methods 2019, 16, 369–379. [Google Scholar] [CrossRef] [PubMed]
  2. Gruene, T.; Wennmacher, J.T.C.; Zaubitzer, C.; Holstein, J.J.; Heidler, J.; Fecteau-Lefebvre, A.; De Carlo, S.; Müller, E.; Goldie, K.N.; Regeni, I.; et al. Rapid Structure Determination of Microcrystalline Molecular Compounds Using Electron Diffraction. Angew. Chem. Int. Ed. 2018, 57, 16313–16317. [Google Scholar] [CrossRef] [PubMed]
  3. Jones, C.G.; Martynowycz, M.W.; Hattne, J.; Fulton, T.J.; Stoltz, B.M.; Rodriguez, J.A.; Nelson, H.M.; Gonen, T. The CryoEM Method MicroED as a Powerful Tool for Small Molecule Structure Determination. ACS Cent. Sci. 2018, 4, 1587–1592. [Google Scholar] [CrossRef] [PubMed]
  4. Gruene, T.; Holstein, J.J.; Clever, G.H.; Keppler, B. Establishing Electron Diffraction in Chemical Crystallography. Nat. Rev. Chem. 2021, 5, 660–668. [Google Scholar] [CrossRef]
  5. Huang, Z.; Grape, E.S.; Li, J.; Inge, A.K.; Zou, X. 3D Electron Diffraction as an Important Technique for Structure Elucidation of Metal-Organic Frameworks and Covalent Organic Frameworks. Coord. Chem. Rev. 2021, 427, 213583. [Google Scholar] [CrossRef]
  6. Huang, Z.; Willhammar, T.; Zou, X. Three-Dimensional Electron Diffraction for Porous Crystalline Materials: Structural Determination and Beyond. Chem. Sci. 2021, 12, 1206–1219. [Google Scholar] [CrossRef]
  7. Samperisi, L.; Jaworski, A.; Kaur, G.; Lillerud, K.P.; Zou, X.; Huang, Z. Probing Molecular Motions in Metal–Organic Frameworks by Three-Dimensional Electron Diffraction. J. Am. Chem. Soc. 2021, 143, 17947–17952. [Google Scholar] [CrossRef]
  8. Hovestreydt, E. Electron Diffraction: Accelerating Drug Development. Drug Discov. Today 2022, 27, 371–373. [Google Scholar] [CrossRef]
  9. Au-Yeung, A.S.-F.; Sung, H.H.-Y.; Cha, J.A.K.; Siu, A.W.-H.; Chui, S.S.-Y.; Williams, I.D. Hydrothermal Synthesis of Indium Tartrates: Structures of the Chiral Polymer [In(L-TAR)3−H2O]·0.5H2O Containing the Tartrate Trianion, and a Microporous Hybrid Solid [In(OH)(D/L-TAR)2−]·2H2O. Inorg. Chem. Commun. 2006, 9, 507–511. [Google Scholar] [CrossRef]
  10. Thushari, S.; Cha, J.A.K.; Sung, H.H.-Y.; Chui, S.S.-Y.; Leung, A.L.-F.; Yen, Y.-F.; Williams, I.D. Microporous Chiral Metal Coordination Polymers: Hydrothermal Synthesis, Channel Engineering and Stability of Lanthanide Tartrates. Chem. Commun. 2005, 5515–5517. [Google Scholar] [CrossRef]
  11. Lu, Y.; Zhang, H.; Chan, J.Y.; Ou, R.; Zhu, H.; Forsyth, M.; Marijanovic, E.M.; Doherty, C.M.; Marriott, P.J.; Holl, M.M.B.; et al. Homochiral MOF–Polymer Mixed Matrix Membranes for Efficient Separation of Chiral Molecules. Angew. Chem. Int. Ed. 2019, 58, 16928–16935. [Google Scholar] [CrossRef]
  12. Yoon, M.; Srirambalaji, R.; Kim, K. Homochiral Metal–Organic Frameworks for Asymmetric Heterogeneous Catalysis. Chem. Rev. 2012, 112, 1196–1231. [Google Scholar] [CrossRef]
  13. Hu, L.; Li, K.; Shang, W.; Zhu, X.; Liu, M. Emerging Cubic Chirality in γCD-MOF for Fabricating Circularly Polarized Luminescent Crystalline Materials and the Size Effect. Angew. Chem. Int. Ed. 2020, 59, 4953–4958. [Google Scholar] [CrossRef] [PubMed]
  14. Templeton, L.K.; Templeton, D.H.; Zhang, D.; Zalkin, A. Structure of Di-μ-(+)-Tartrato-Bis[Aquazinc(II)] Trihydrate, [Zn2(C4H4O6)2(H2O)2]·3H2O and Anomalous Scattering by Zinc. Acta Crystallogr. Sect. C 1985, 41, 363–365. [Google Scholar] [CrossRef]
  15. Lin, H.-Y.; Hu, H.-L.; Chen, B.-K.; Li, J. Synthesis and Characterization of a New Two-Dimensional Compound: {[Zn(C4H4O6)(H2O)]23H2O}n. Chin. J. Spectrosc. Lab. 2009, 26, 803–806. [Google Scholar]
  16. Liu, H.-T.; Lu, J.; Wang, D.-Q. Poly[[Diaqua(μ4-L-Tartrato)(μ2-L-Tartrato)Dizinc(II)] Tetrahydrate]. Acta Crystallogr. Sect. E 2010, 66, m374. [Google Scholar] [CrossRef]
  17. Li, M.-C.; Zhang, J.-R.; Yuan, S.-X.; Zhang, D. Crystal Structure of Catena-Poly[Diaqua-(μ2-Tartrato-κ4O,O′:O′′,O′′′)Zinc(II)], C4H8O8Zn. Z. Kristallogr.-N. Cryst. Struct. 2020, 235, 1221–1222. [Google Scholar] [CrossRef]
  18. Hynek, J.; Brázda, P.; Rohlíček, J.; Londesborough, M.G.S.; Demel, J. Phosphinic Acid Based Linkers: Building Blocks in Metal–Organic Framework Chemistry. Angew. Chem. Int. Ed. 2018, 57, 5016–5019. [Google Scholar] [CrossRef]
  19. Portolés-Gil, N.; Lanza, A.; Aliaga-Alcalde, N.; Ayllón, J.A.; Gemmi, M.; Mugnaioli, E.; López-Periago, A.M.; Domingo, C. Crystalline Curcumin BioMOF Obtained by Precipitation in Supercritical CO2 and Structural Determination by Electron Diffraction Tomography. ACS Sustain. Chem. Eng. 2018, 6, 12309–12319. [Google Scholar] [CrossRef]
  20. Brázda, P.; Palatinus, L.; Babor, M. Electron Diffraction Determines Molecular Absolute Configuration in a Pharmaceutical Nanocrystal. Science 2019, 364, 667–669. [Google Scholar] [CrossRef]
  21. Klar, P.; Krysiak, Y.; Xu, H.; Steciuk, G.; Cho, J.; Zou, X.; Palatinus, L. Chirality and Accurate Structure Models by Exploiting Dynamical Effects in Continuous-Rotation 3D ED Data. ChemRxiv 2021. [Google Scholar] [CrossRef]
  22. Dolomanov, O.V.; Bourhis, L.J.; Gildea, R.J.; Howard, J.a.K.; Puschmann, H. OLEX2: A Complete Structure Solution, Refinement and Analysis Program. J. Appl. Cryst. 2009, 42, 339–341. [Google Scholar] [CrossRef]
  23. ELDIX Software Suite, Version 0.14.0; ELDICO Scientific AG: Villigen, Switzerland, 2022.
  24. Apex Suite of Crystallographic Software, APEX4, Version 2022.1-1; Bruker AXS Inc.: Madison, WI, USA, 2022.
  25. SAINT, Version 8.40B; Bruker AXS Inc.: Madison, WI, USA, 2019.
  26. SADABS, Version 2016/2; Bruker AXS Inc.: Madison, WI, USA, 2016.
  27. Sheldrick, G.M. A Short History of SHELX. Acta Crystallogr. Sect. A 2008, 64, 112–122. [Google Scholar] [CrossRef]
  28. Sheldrick, G.M. Crystal Structure Refinement with SHELXL. Acta Crystallogr. Sect. C 2015, 71, 3–8. [Google Scholar] [CrossRef]
  29. Hübschle, C.B.; Sheldrick, G.M.; Dittrich, B. ShelXle: A Qt Graphical User Interface for SHELXL. J. Appl. Cryst. 2011, 44, 1281–1284. [Google Scholar] [CrossRef]
  30. Doyle, P.A.; Turner, P.S. Relativistic Hartree–Fock X-Ray and Electron Scattering Factors. Acta Crystallogr. Sect. A 1968, 24, 390–397. [Google Scholar] [CrossRef]
  31. Palatinus, L.; Brázda, P.; Jelínek, M.; Hrdá, J.; Steciuk, G.; Klementová, M. Specifics of the Data Processing of Precession Electron Diffraction Tomography Data and Their Implementation in the Program PETS2.0. Acta Crystallogr. Sect. B 2019, 75, 512–522. [Google Scholar] [CrossRef]
  32. Petříček, V.; Dušek, M.; Palatinus, L. Crystallographic Computing System JANA2006: General features. Z. Kristallogr.-Cryst. Mater. 2014, 229, 345–352. [Google Scholar] [CrossRef]
  33. Coronado, E.; Galán-Mascarós, J.R.; Gómez-García, C.J.; Murcia-Martínez, A. Chiral Molecular Magnets: Synthesis, Structure, and Magnetic Behavior of the Series [M(L-Tart)] (M = MnII, FeII, CoII, NiII.; L-Tart = (2R,3R)-(+)-Tartrate). Chem.–Eur. J. 2006, 12, 3484–3492. [Google Scholar] [CrossRef]
  34. Kam, K.C.; Young, K.L.M.; Cheetham, A.K. Chemical and Structural Diversity in Chiral Magnesium Tartrates and Their Racemic and Meso Analogues. Cryst. Growth Des. 2007, 7, 1522–1532. [Google Scholar] [CrossRef]
  35. Zhu, P.; Gu, W.; Zhang, L.-Z.; Liu, X.; Tian, J.-L.; Yan, S.-P. A Rare Thermally Induced Single Crystal to Single Crystal Transformation from a 2D Chiral Coordination Polymer to a 3D Chiral Coordination Polymer. Eur. J. Inorg. Chem. 2008, 2008, 2971–2974. [Google Scholar] [CrossRef]
  36. Liu, Y.-H.; Lee, S.-H.; Chiang, J.-C.; Chen, P.-C.; Chien, P.-H.; Yang, C.-I. Dehydration Induced 2D-to-3D Crystal-to-Crystal Network Re-Assembly and Ferromagnetism Tuning within Two Chiral Copper(II)–Tartrate Coordination Polymers. Dalton Trans. 2013, 42, 16857–16867. [Google Scholar] [CrossRef] [PubMed]
  37. Boultif, A.; Louer, D. Powder Pattern Indexing with the Dichotomy Method. J. Appl. Cryst. 2004, 37, 724–731. [Google Scholar] [CrossRef]
  38. Appelhans, L.N.; Kosa, M.; Radha, A.V.; Simoncic, P.; Navrotsky, A.; Parrinello, M.; Cheetham, A.K. Phase Selection and Energetics in Chiral Alkaline Earth Tartrates and Their Racemic and Meso Analogues: Synthetic, Structural, Computational, and Calorimetric Studies. J. Am. Chem. Soc. 2009, 131, 15375–15386. [Google Scholar] [CrossRef] [PubMed]
Figure 2. Thermal gravimetric analysis and differential scanning calorimetry for [Zn(L-TAR)] 1-L.
Symmetry 15 00983 g002
Figure 3. Powder X-ray diffractograms for [Zn(L-TAR)] 1-L, [Zn(D-TAR)] 1-D, and [Zn(D/L-TAR)].
Symmetry 15 00983 g003
Figure 4. Expanded molecular structures for Zn(L-TAR) 1-L and Zn(D-TAR) 1-D (kin = kinematical refinement, dyn = dynamical refinement), symmetry equivalents are marked by pale print.
Symmetry 15 00983 g004
Figure 5. Powder X-ray diffractograms for 1-L and Mn, Co, and Cu metal tartrates [M(L-TAR)].
Symmetry 15 00983 g005
Figure 6. Powder X-ray diffractograms for Mg and Ni metal tartrates [M(L-TAR)].
Symmetry 15 00983 g006
Figure 7. Metal dimer SBU in hydrated metal L-tartrate MOFs (CUJBAK left) and KURNOB right).
Symmetry 15 00983 g007
Figure 8. Two-dimensional sheet frameworks for CUJBAK left (viewed along [010]) and KURNOB right (viewed along [001]). Unit cell axes and origin labelled a, b, c and o.
Symmetry 15 00983 g008
Figure 9. Packing diagram for 1-L (from dynamical refinement) viewed along [010] left and [100], right.
Symmetry 15 00983 g009
Figure 10. Packing diagram for MUYPUU [Zn(m-TAR)(H2O)2] viewed close to [100].
Symmetry 15 00983 g010
Table 1. Three-dimensional-ED data collection details for the Zn tartrate samples (crystal size estimated from STEM images).
[Zn(L-TAR)][Zn(D-TAR)]
angular range [°]−60 to +80−65 to +25
rotation per frame [°]1.01.0
exposure time [s]1.01.0
total exposure [s]14090
frames collected14090
frames used1–801–70
crystal size [µm]2.5 × 0.6 × 0.55.0 × 0.5 × 0.4
Table 2. Crystal structure and refinement details for Zn(L-TAR) 1-L and Zn(D-TAR) 1-D (kin = kinematical refinement, dyn = dynamical refinement).
1-L1-D
kindynkindyn
CCDC number2,242,8902,242,8922,242,8912,242,894
chemical formulaC4H4O6Zn
formula weight [g mol−1]213.46
crystal systemorthorhombic
a [Å]5.14(6)5.16(6)
b [Å]8.97(10)9.00(10)
c [Å]11.82(13)11.78(13)
α, β, γ [°]90, 90, 9090, 90, 90
volume [Å3]545(11)547(11)
space groupI222
Z4
resolution [Å]0.790.680.790.74
completeness [%]65717085
Unique reflections (measured/observed)355/292808/509359/341674/616
parameters28652860
restraints1111
Rint11.4-4.6-
R1(obs)/MR1(obs) 116.711.8/11.617.214.2/14.4
wR2(all)42.622.643.727.2
ΔVmin, ΔVmax−0.29, 0.35−0.16, 0.20−0.32, 0.41−0.22, 0.49
1 MR: merged R factor for dynamical refinement based on post-refinement merging of reflections for better comparison with conventional R factor for kinematical refinement [21].
Table 3. Selected distances and angles for Zn(L-TAR) 1-L and Zn(D-TAR) 1-D (kin = kinematical refinement, dyn = dynamical refinement). Symmetry generated atoms marked by *.
1-L1-D
kindynkindyn
Zn-O12.02(3)2.02(2)2.02(3)2.04(2)
Zn-O2 *2.00(4)2.03(2)2.06(3)2.00(2)
Zn-O32.29(4)2.33(2)2.36(4)2.288(19)
C1-O11.24(3)1.273(17)1.24(4)1.189(19)
C1-O21.29(3)1.260(15)1.21(3)1.27(2)
C1-C21.51(3)1.51(3)1.59(4)1.56(3)
C2-O31.37(3)1.423(18)1.31(4)1.44(2)
C2-C2 *1.55(4)1.54(3)1.52(5)1.55(2)
O1-Zn1-O374.9(10)75.8(7)74.4(11)74.5(7)
Zn1-O1-C1120.5(15)118.6(9)121.3(18)118.9(10)
Zn1-O3-C2110.8(16)110.1(9)109(2)112.8(8)
Zn1 *-O2-C1130.4(18)128.3(14)125.2(19)128.5(12)
Table 4. Dynamical refinement results for enantiomorphic Zn(L-TAR) 1-L and Zn(D-TAR) 1-D.
Sample1-L1-D
enantiomorphL-formD-formL-formD-form
R1(obs)/MR1(obs)11.8/11.614.5/15.016.1/16.314.2/14.4
wR2(all)22.628.430.527.2
z-score 14.288σ3.502σ
probability 199.999%99.977%
1 z-score and corresponding probability for correct enantiomorph determination based on the observed statistics of reflections with better fit for the correct enantiomorph compared to a normal distribution of random differences [21].
Table 5. Crystal unit cell data for related anhydrous M(TAR) crystal phases.
Mg(D-TAR)Co(L-TAR)Ni(L-TAR)Cu(L-TAR)
reference[34][33][35][36]
CCDC number631943230223650895927769
empirical formulaC4H4O6MgC4H4O6CoC4H4O6NiC4H4O6Cu
formula weight172.38207207.78211.61
temperature [K]293120(2)113(2)200(2)
crystal systemorthorhombicorthorhombicorthorhombicorthorhombic
space groupI222I222I222P21212
a [Å]5.024(1)5.057(2)4.9740(11)4.9808(5)
b [Å]9.163(2)9.117(3)9.055(2)8.9689(11)
c [Å]11.455(2)11.631(3)11.472(2)11.7511(13)
α [°]90909090
β [°]90909090
γ [°]90909090
volume [Å3]527.2(2)536.2(3)516.68(19)524.95(10)
Disclaimer/Publisher’s Note: The statements, opinions and data contained in all publications are solely those of the individual author(s) and contributor(s) and not of MDPI and/or the editor(s). MDPI and/or the editor(s) disclaim responsibility for any injury to people or property resulting from any ideas, methods, instructions or products referred to in the content.

