Article

A New Model for Determining Factors Affecting Human Errors in Manual Assembly Processes Using Fuzzy Delphi and DEMATEL Methods

by
Fahad M. Alqahtani
,
Mohammed A. Noman
*,
Saad A. Alabdulkarim
,
Ibrahim Alharkan
,
Mohammed H. Alhaag
and
Faisal M. Alessa
Department of Industrial Engineering, College of Engineering, King Saud University, P.O. Box 800, Riyadh 11421, Saudi Arabia
*
Author to whom correspondence should be addressed.
Symmetry 2023, 15(11), 1967; https://doi.org/10.3390/sym15111967
Submission received: 19 September 2023 / Revised: 19 October 2023 / Accepted: 22 October 2023 / Published: 24 October 2023
(This article belongs to the Special Issue Recent Advances in Fuzzy Optimization Methods and Models)

Abstract

:
Human errors (HEs) are common problems in manual assembly processes, impacting product quality and resulting in additional costs. Based on expert judgments, this study aims to identify the most significant factors affecting HEs in manual assembly processes and explore the cause-and-effect relationships among those factors. In order to achieve this objective, a proposed model is constructed using two types of Multi-Criteria Decision-Making (MCDM) techniques. Firstly, using two rounds of the fuzzy Delphi method (FDM), twenty-seven factors with an influence score of 0.7 or higher were found to have a major impact on HEs during manual assembly processes, with at least a 75% consensus among experts. After that, the twenty-seven factors affecting HEs were given to experts in a third round to analyze the cause-and-effect relationships among those factors using the fuzzy decision-making trial and evaluation laboratory (DEMATEL) method. In MCDM techniques, symmetry refers to an important property that can be used to find relationships between variables. It is based on the principle that the relative importance or preference between two variables should remain the same regardless of their positions or roles. Therefore, symmetry is a factor that MCDM approaches take into account to ensure that the relationships between variables are accurately represented, leading to more reliable decision-making outcomes. The reliability and normality of the surveying data were examined using the SPSS 22.0 software program. The study results revealed that training level, poor workplace layout, a lack of necessary tools, and experience were the major factors affecting HEs as root causes. Moreover, a failure to address the error-causing problem, unintentional unsafe acts, fatigue, and poor error visual perception were found to be effect (dependent) factors. The findings of this study can help organizations make better-informed decisions on how to reduce worker errors and interest in the factors that contribute to assembly errors and provide a good basis for reaching the quality of final assembled parts.

1. Introduction

The term “manual assembly” refers to a process in which human operators use their innate dexterity, aptitude, and judgment to combine pre-existing parts to create a finished product or a unit of a finished product. According to Richardson et al. [1], the activity of manual assembly is a type of spatial problem-solving that requires workers to construct a mental model in order to interpret and engage with spatial input. Work instructions, their presentation, and the worker’s interaction with them are extremely important in manual assembly operations [2,3,4,5]. Work instructions must be clear and unambiguous about which parts to utilize and how they should be built in order to optimize the operators’ mental abilities [4]. It is generally accepted that assembly instructions must be provided in a way that allows everyone to read them and successfully complete the assembly [6]. In this manner, work instructions can help reduce the mental load on the operators, in particular by simplifying the complexity of the tasks. Today, most manual assembly instructions are provided digitally, on a computer display, and include text and visual content [2,3,4,5]. However, Mattsson et al. [7] believed that instructions should be highly perceptual, which necessitates providing the operator with more sophisticated and timely sensory inputs. Using three-dimensional models in work instructions improves their realism, accuracy, and legibility in depicting the assembly process. Perspectives and basic assembly guidelines might be included in these model-based instructions (MBI) [8,9].
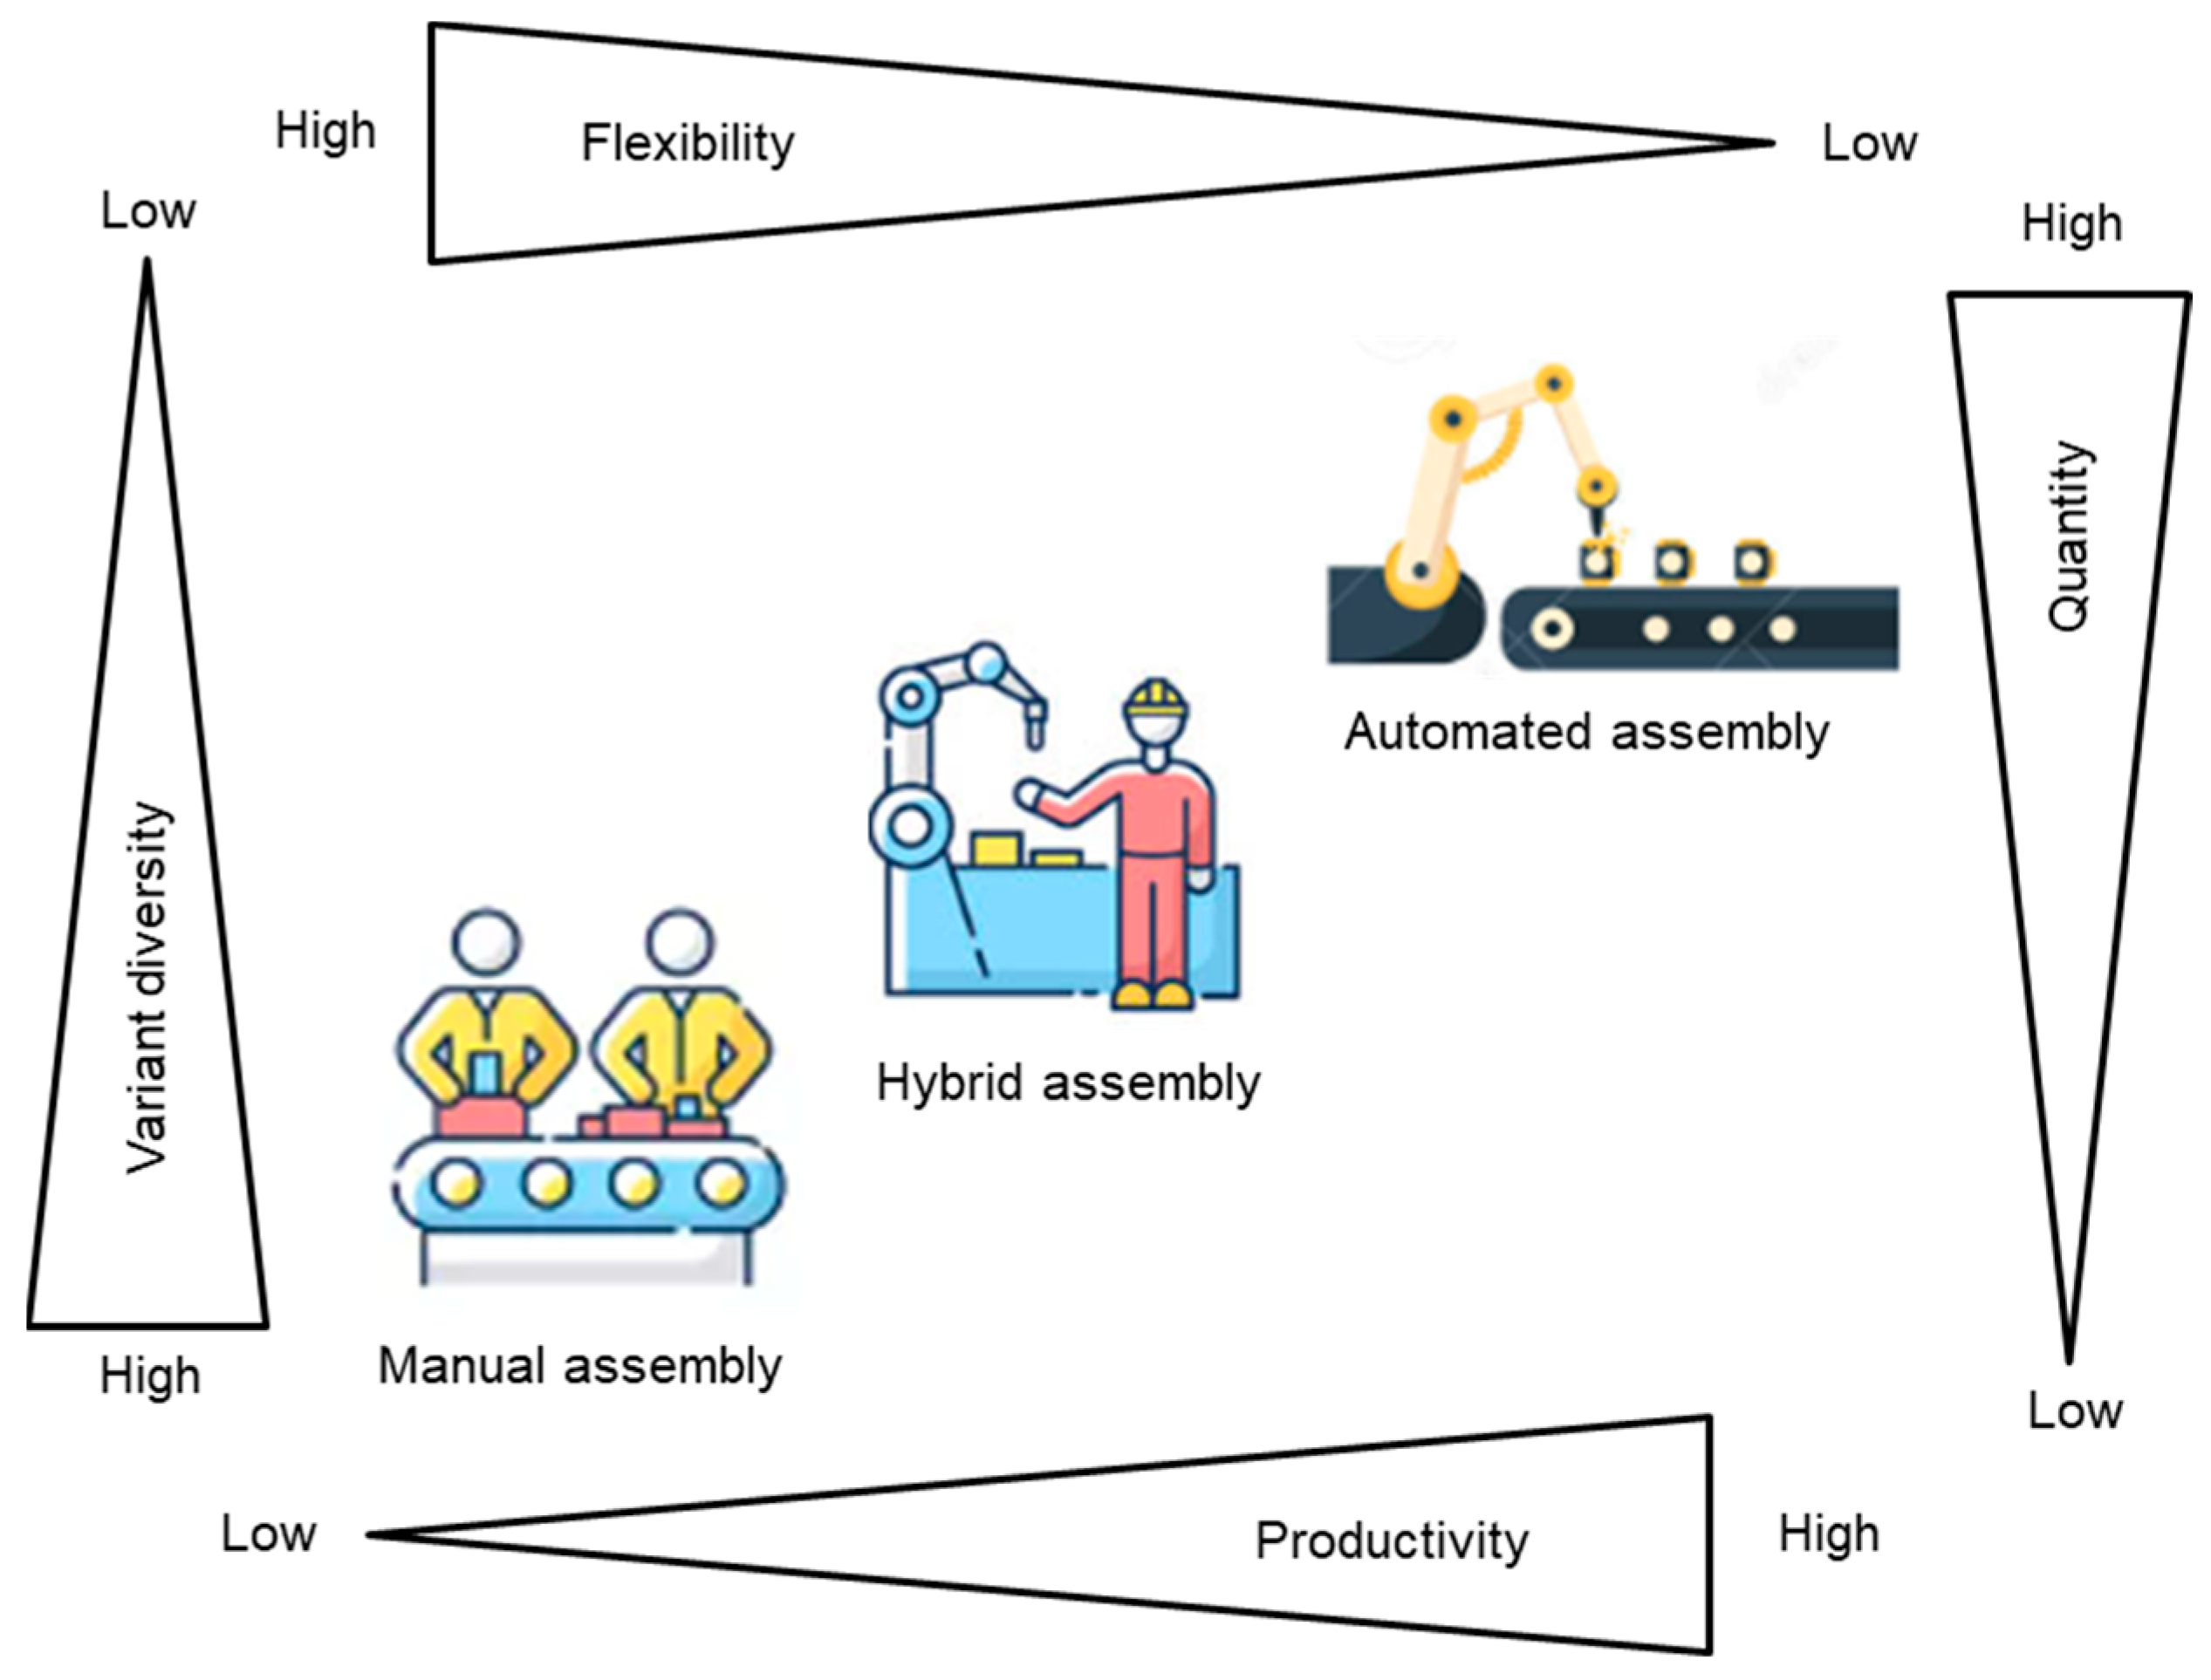
The assembly process is crucial to manufacturing because it guarantees that the final product meets the necessary quality standards. Several factors, such as flexibility, the variety of products, the volume of production, and productivity, are considered by engineers when selecting an appropriate assembly system [6,10]. Despite the lower productivity and production volume in manual assembly systems compared with automatic assembly systems, manual systems have an increased flexibility and variety of products. Worker productivity is a measure of the output or results achieved by an individual worker or a group of workers within a specific time. Figure 1 illustrates the impact of assembly system automation on these factors. Although industrial robots contribute greatly to the automation of manufacturing systems, including assembly systems, the complexity and diversity of the product still represent significant challenges in manufacturing; therefore, manual work remains a viable and irreplaceable alternative [6,11]. These manufacturing fields include electronics, aerospace, automotive, combustion engine assembly, and industrial machinery and equipment [12,13]. Manual assembly requires the precise execution of a number of steps in order to yield a finished product of the requisite quality. Torabi et al. [14] discussed the common human errors in the design, installation, and operation of variable air volume air handling unit systems. They identified that many types of faults can occur, including design, assembly, manufacturing, incorrect operation, maintenance, software, and operator’s faults, and the mistakes that humans directly cause may be referred to as errors. Park et al. [15] have designed a software tool called Foolproof Joint that simplifies the assembly of laser-cut 3D models to reduce assembly errors by modifying finger joint patterns. They [16] developed an intelligent detection approach to detect human errors in the maintenance and assembly of components of a nuclear power plant using artificial intelligence. Wang et al. [17] investigated the vibration characteristics of the spindle system and discovered that the vibrations were caused by assembly errors.
Furthermore, Miao et al. [18] and Wang et al. [19] mentioned that supporting bearing assembly errors have a significant impact on bearing operating performance and spindle vibration characteristics. Human error (HE) is one of the most common causes of accidents in many industries. Previous studies indicate that HE contributes to 30–90% of all accidents in work environments despite strict safety procedures in those industries [20]. Common types of human errors (HEs) in assembly processes include unsecured links, missing parts, improper part installation, the inadequate application of force to fasteners, breakage during assembly, and contamination by foreign object debris [21,22]. Inadequate cognitive and physical ergonomics have also been found to impact product quality and increase the frequency of errors [11,23].
Moreover, there are many other kinds of human errors that are capable of occurring throughout the assembly processes. Here are a few common examples:
(1)
Omission errors: These occur when a step or task in the assembly process is missed or skipped over entirely. For example, a worker might forget to install a specific component or tighten a screw;
(2)
Commission errors: Commission errors occur when a worker does an action incorrectly, such as installing a part backward or using the wrong tool;
(3)
Transposition errors: These errors occur when two similar-looking parts or components are confused with each other. For example, two screws of different lengths might look similar, and a worker might accidentally use the wrong one;
(4)
Timing errors: Timing errors occur when a worker completes tasks in the wrong order or sequence, which can cause problems down the line. For example, a worker might install a part before another part that should have gone in first;
(5)
Procedural errors: These errors occur when workers do not follow the correct procedures or instructions for a task. This could be due to a lack of training or understanding of the instructions;
(6)
Communication errors: Communication errors can occur when workers do not communicate effectively with each other or when instructions are unclear or misunderstood;
(7)
Fatigue-related errors: Errors can also occur due to factors such as fatigue or stress, affecting a worker’s attention and decision-making abilities.
It is essential to remember that these errors can frequently be connected to one another and exacerbate one another, which might result in more severe issues throughout the assembly processes. Therefore, it is important to identify these errors and know the factors causing them as early as possible to prevent more significant issues.
With the advent of Industry 4.0, increased product customization will occur in highly flexible production settings [6]. As a result of this widespread personalization, manufacturing is likely to become more complicated, possibly calling for more highly trained employees [23]. Reducing HEs in this situation depends critically on a well-optimized work system. A well-optimized work system refers to an effective arrangement of people, processes, resources, and technology that maximizes productivity, quality, and overall performance. It is designed to streamline workflows and reduce human errors to achieve desired outcomes. Identifying the aspects and factors influencing operator performance is crucial for optimizing assembly processes and minimizing errors. Many factors directly or indirectly influence the assemblers’ errors during the manual assembling processes. Identifying the most critical factors needs much research in the field, which is time-consuming and expensive; moreover, some previous studies focused on defining and identifying some of these factors and did not address identifying which factors are the most influential for these errors. Therefore, the main objective of this study is to determine the most important factors affecting HEs and identify the relationships between these factors in manual assembly processes using two types of Multi-Criteria Decision-Making (MCDM) techniques: the Fuzzy Delphi method (FDM) and Decision-Making Trial and Evaluation Laboratory (DEMATEL). Symmetry is a crucial characteristic that can be employed in MCDM studies to identify correlations between variables. It depends on the idea that, regardless of the two variables’ positions or roles, their relative importance or preference should remain constant. In other words, symmetry is a consideration that MCDM techniques make to help ensure that the relationships between variables are effectively represented, resulting in more accurate decision-making outcomes.

1.1. The Need and Motivation for the Study

This study needs to reduce worker errors and identify the factors contributing to assembly errors. Hence, this study benefits several stakeholders, including the following:
(1)
Businesses and Employers: This study can benefit companies and organizations that rely on assembly or manufacturing processes. By understanding the factors contributing to worker errors, businesses can implement strategies to reduce errors, enhance productivity, and improve overall product quality. This, in turn, can lead to cost savings, increased customer satisfaction, and improved competitiveness in the market;
(2)
Workers and Workforce: The study can directly benefit workers by improving their working conditions and reducing the chances of errors. By identifying factors contributing to assembly errors, interventions such as improved training programs, better equipment and tools, ergonomic improvements, and enhanced safety measures can be implemented to support workers in their tasks. This can lead to increased job satisfaction, reduced stress, and improved worker well-being;
(3)
Consumers: Consumers stand to benefit from the study as well. Reduced worker errors in assembly processes can lead to higher product quality and reliability. This means that consumers are more likely to receive products that meet their expectations, with fewer defects or issues. Improved quality control can also contribute to enhanced product safety features, reducing the risk of accidents or malfunctions.
(4)
Researchers and Academia: The study of reducing worker errors and identifying contributing factors can provide valuable insights and contribute to the body of knowledge in fields such as human factors engineering, industrial psychology, and manufacturing management. Researchers can build upon this knowledge to develop new theories, methodologies, and best practices for error reduction in various industries;
(5)
Therefore, the primary motivation for this study was to improve overall productivity, product quality, and worker well-being. By understanding the factors that contribute to assembly errors, interventions can be implemented to reduce errors, minimize waste, and optimize the assembly process. This leads to improved efficiency, cost savings, and enhanced business competitiveness while providing employees with a safer and more satisfying work environment. This study aims to contribute to scientific knowledge and advance the understanding of human factors in manufacturing and assembly processes.

1.2. Research Contributions

This research makes several contributions to the existing body of literature, including the following:
(1)
To the best of our knowledge, this study is considered one of the first to determine factors affecting HEs in manual assembly processes and identify the relationships between these factors using the MCDM techniques. Therefore, this research could theoretically add to the current body of knowledge and fill existing gaps in studies of factors driving manual assembly errors;
(2)
This study provides a cause-and-effect model in order to identify the interactions between factors affecting human errors in the manual assembly processes and analyze the root causes of those errors;
(3)
The proposed methodology allows managers and experts of manual assembly lines to know the factors that cause assembly errors, which helps them focus on improving the sources of those factors to reduce assembly errors.
This study is organized as follows: Section 2 describes the literature review, and Section 3 presents the research methodology. Section 4 describes the fuzzy Delphi and DEMATEL models. The results and discussion are described in Section 5; Section 6 specifies the conclusion and future work.

2. Literature Review

Human errors (HEs) refer to mistakes or deviations from intended actions made by individuals when implementing some tasks. These errors can occur due to various reasons, such as a lack of training, fatigue, poor work instructions, etc. Different types or categories of human errors include slips (unintended actions), lapses (omission), mistakes (knowledge-based errors), rule-based errors (applying incorrect rules), etc. The consequences or impacts of these errors on productivity include delays in production timelines and quality involving defects or rework, while in safety results, accidents lead to injuries.
In recent years, some studies have been conducted to find the influencing factors of human errors in different fields. Lopez et al. [24] classified the influence factors on design errors in construction into personal factors, such as adverse behavior, and organizational factors, such as poor training and quality. Iraj et al. [25] reported that factors affecting HEs in a mining process design are caused by individual factors (lack of knowledge and experience), task factors (multitasking and workload), organizational factors (poor management and training), and environmental factors (inadequate lighting, noise, and poor air quality). Noman et al. [26] have studied some factors affecting inspection and maintenance errors, such as unclear instructions and procedures, stress, task complexity, and lack of experience and training, in addition to other work environmental factors such as noise, lighting, etc., Yaniel et al. [27] analyzed human errors in a complex manual assembly line and identified 31 factors that caused those errors.
A comprehensive survey of the literature was conducted to summarize the main factors affecting HEs in the manual assembly processes, as well as the related sub-factors. These were then reviewed and discussed by academic and industry experts with at least ten years of experience in manual assembly processes. Through a literature review, 51 factors influencing human error were identified. The factors influencing human error were finally classified into five categories, namely individual factors, tool factors, task factors, organizational factors, and environmental factors, as shown in Table 1.
In the field of manufacturing, manual assembly processes play a crucial role in ensuring product quality and efficiency. However, human errors are an inherent risk factor that can significantly impact productivity, quality assurance, and worker safety. Therefore, it is essential to understand the determining factors that contribute to human errors in manual assembly processes in order to develop effective strategies for error prevention and process improvement. This study aims to apply two Multi-Criteria Decision-making (MCDM) techniques—Fuzzy Delphi (FDM) and DEMATEL methods—which can be used to accurately determine the factors affecting human errors in manual assembly processes and identify the relationships among them. These methods are often used to solve fuzzy complex issues based on experts’ opinions. Therefore, the MCDM techniques are analytical tools used to handle complex decision-making problems by simultaneously considering multiple criteria or factors. These techniques provide a systematic framework for evaluating alternatives based on various qualitative or quantitative attributes. In the context of determining factors affecting human errors in manual assembly processes, MCDM methods offer a structured approach for gathering expert opinions and constructing cause-and-effect models.
Many MCDM techniques have been used by researchers and decision-makers in the literature. The selection of an appropriate MCDM technique depends on the specific characteristics of the decision problem, the available data, decision-maker preferences, and the objectives of the decision-making process. According to the study of Taherdoost and Madanchian [51], the twenty most-cited MCDM methods from 2012 to 2022 (based on the “ScienceDirect” database) are shown in Table 2.
The DEMATEL method is one of the MCDM techniques employed for analyzing causal relationships among different criteria. It was first used by Lin in 2008 in a fuzzy environment study [72]. It involves constructing a cause-and-effect relationship model based on expert opinions gathered through a questionnaire-based survey. The fuzzy DEMATEL method uses the total-relation matrix to identify the criteria that are effective (cause) and affected (effect) and looks into how these criteria relate to each other [25].
In this study, the Fuzzy DEMATEL method was selected depending on the specific context and requirements of the decision problem at hand. While various MCDM techniques are available, the Fuzzy DEMATEL offers certain advantages that make it suitable for certain types of decision-making problems. The Fuzzy DEMATEL is particularly useful when the decision problem involves complex interdependencies among criteria or factors [25]. It allows decision-makers to analyze the cause-and-effect relationships between criteria and identify the strength and direction of these relationships [25,73]. This helps in understanding the interdependencies and their impact on the decision problem. Therefore, in this study, the Fuzzy DEMATEL was used to analyze the cause-and-effect relationships between the factors affecting human errors in the manual assembly processes and identify the factors that are effective (cause) and affected (effect).
The FDM is a potent instrument that helps researchers in a particular field of study obtain a consensus based on expert viewpoints [74]. It is considered to be one of the most common and reliable techniques for collecting expert opinions and carrying out questionnaires [75,76]. In addition, it is one of the most commonly utilized methodologies for solving an extensive variety of group decision-making problems through choosing and/or ranking factors, standards, questionnaire factors, or calculating index factors [77]. Combining the traditional Delphi method (DM) with fuzzy set theory led to the development of a more robust FDM [25]. The FDM has some advantages, such as the ability to combine expert opinions in order to establish a consensus [56], time and cost reduction compared with the DM [3], and the reduction in rounds of expert-opinion gathering [38].
Moreover, the most notable characteristics of the FDM are that the answers gathered are unexplored and unidentified, that it is dependent on a conditional phased statistical processing operation, and that it is based on processes that can be counted, limited, and repeated while being controlled and managed by a phase focused on a results feedback process. The FDM outputs also represent uniform, updated, and collective statistical scores. Its other distinguishing features are its ability to address qualitative difficulties depending on nature through multiple survey rounds, to develop consensus opinions, and to facilitate efficient decisions. As a result, the FDM has been extensively used in a wide variety of interdisciplinary research to compile a consistent and evolving set of responses from expert respondents in the course of numerous rounds of surveying [75,76,77].
Recently, in identifying factors affecting HEs, the Delphi method has been used in some studies. Iraj et al. [25] have used the FDM to determine the factors affecting HEs in a mining process design. In addition, they used the DEMATEL method to identify the relationships among those factors. In the studies of Adel et al. [36], the FDM was used to identify the influencing factors that lead to accidents as a result of HEs during the construction of industrial park projects. The results of the survey showed that the specific factors had a significant impact on the incidence of those accidents caused by HEs. In a similar study for determining the factors affecting HEs in the construction industry using the Delphi method, the study conducted by Daniel et al. [39] showed that most influencing factors affecting construction industry errors were evaluated from medium to strong. The study of Cheryl et al. [78] used a two-round Delphi technique to identify human factors affecting nursing errors.
Comparing the fuzzy Delphi and DEMATEL methods reveals their distinct strengths and limitations: The fuzzy Delphi method offers a systematic approach for expert consensus building, ensuring comprehensive coverage of potential influential factors through iterative feedback rounds. On the other hand, the DEMATEL method allows researchers to visualize complex cause-and-effect relationships among identified factors while highlighting key drivers or bottlenecks within the network. However, it is important to note that both methods heavily rely on expert opinions, which may introduce biases based on individual knowledge or experience levels.
From the literature, it can be found that there are a lack of in-depth studies to determine the factors affecting HEs in the field of manual assembly processes and identify the relationships between these factors using MCDM techniques. Previous studies focused mainly on factors affecting HEs in nursing [78], the construction of industrial park projects [36,39,79], and mining process design [25]. Previous researchers used either the FDM method for identifying factors affecting HEs or the DEMATEL method for identifying the relationships among the factors affecting HEs.
Therefore, this study aims to advance the body of knowledge and fill existing gaps relative to human error in manual assembly processes from the perspective of multiple factors. In addition, this study provides a cause-and-effect model to identify the interactions between factors affecting human errors in manual assembly processes and analyze the root causes of those errors. To accomplish this goal, the MCDM techniques are considered to determine the factors affecting HEs and identify the relationships among the factors affecting HEs. The research questions focused on what the factors affecting human errors are in manual assembly processes, how studies address those different types of factors, and how the proposed model reduces clustering errors related to those factors. Therefore, the main objectives of this study are as follows:
(1)
Identify and classify the factors affecting human errors in manual assembly processes from the literature review;
(2)
Determine the most significant factors affecting human errors in manual assembly processes using the FDM method;
(3)
Determine the cause-and-effect relationships among those factors using the DEMATEL method.

3. Research Methodology

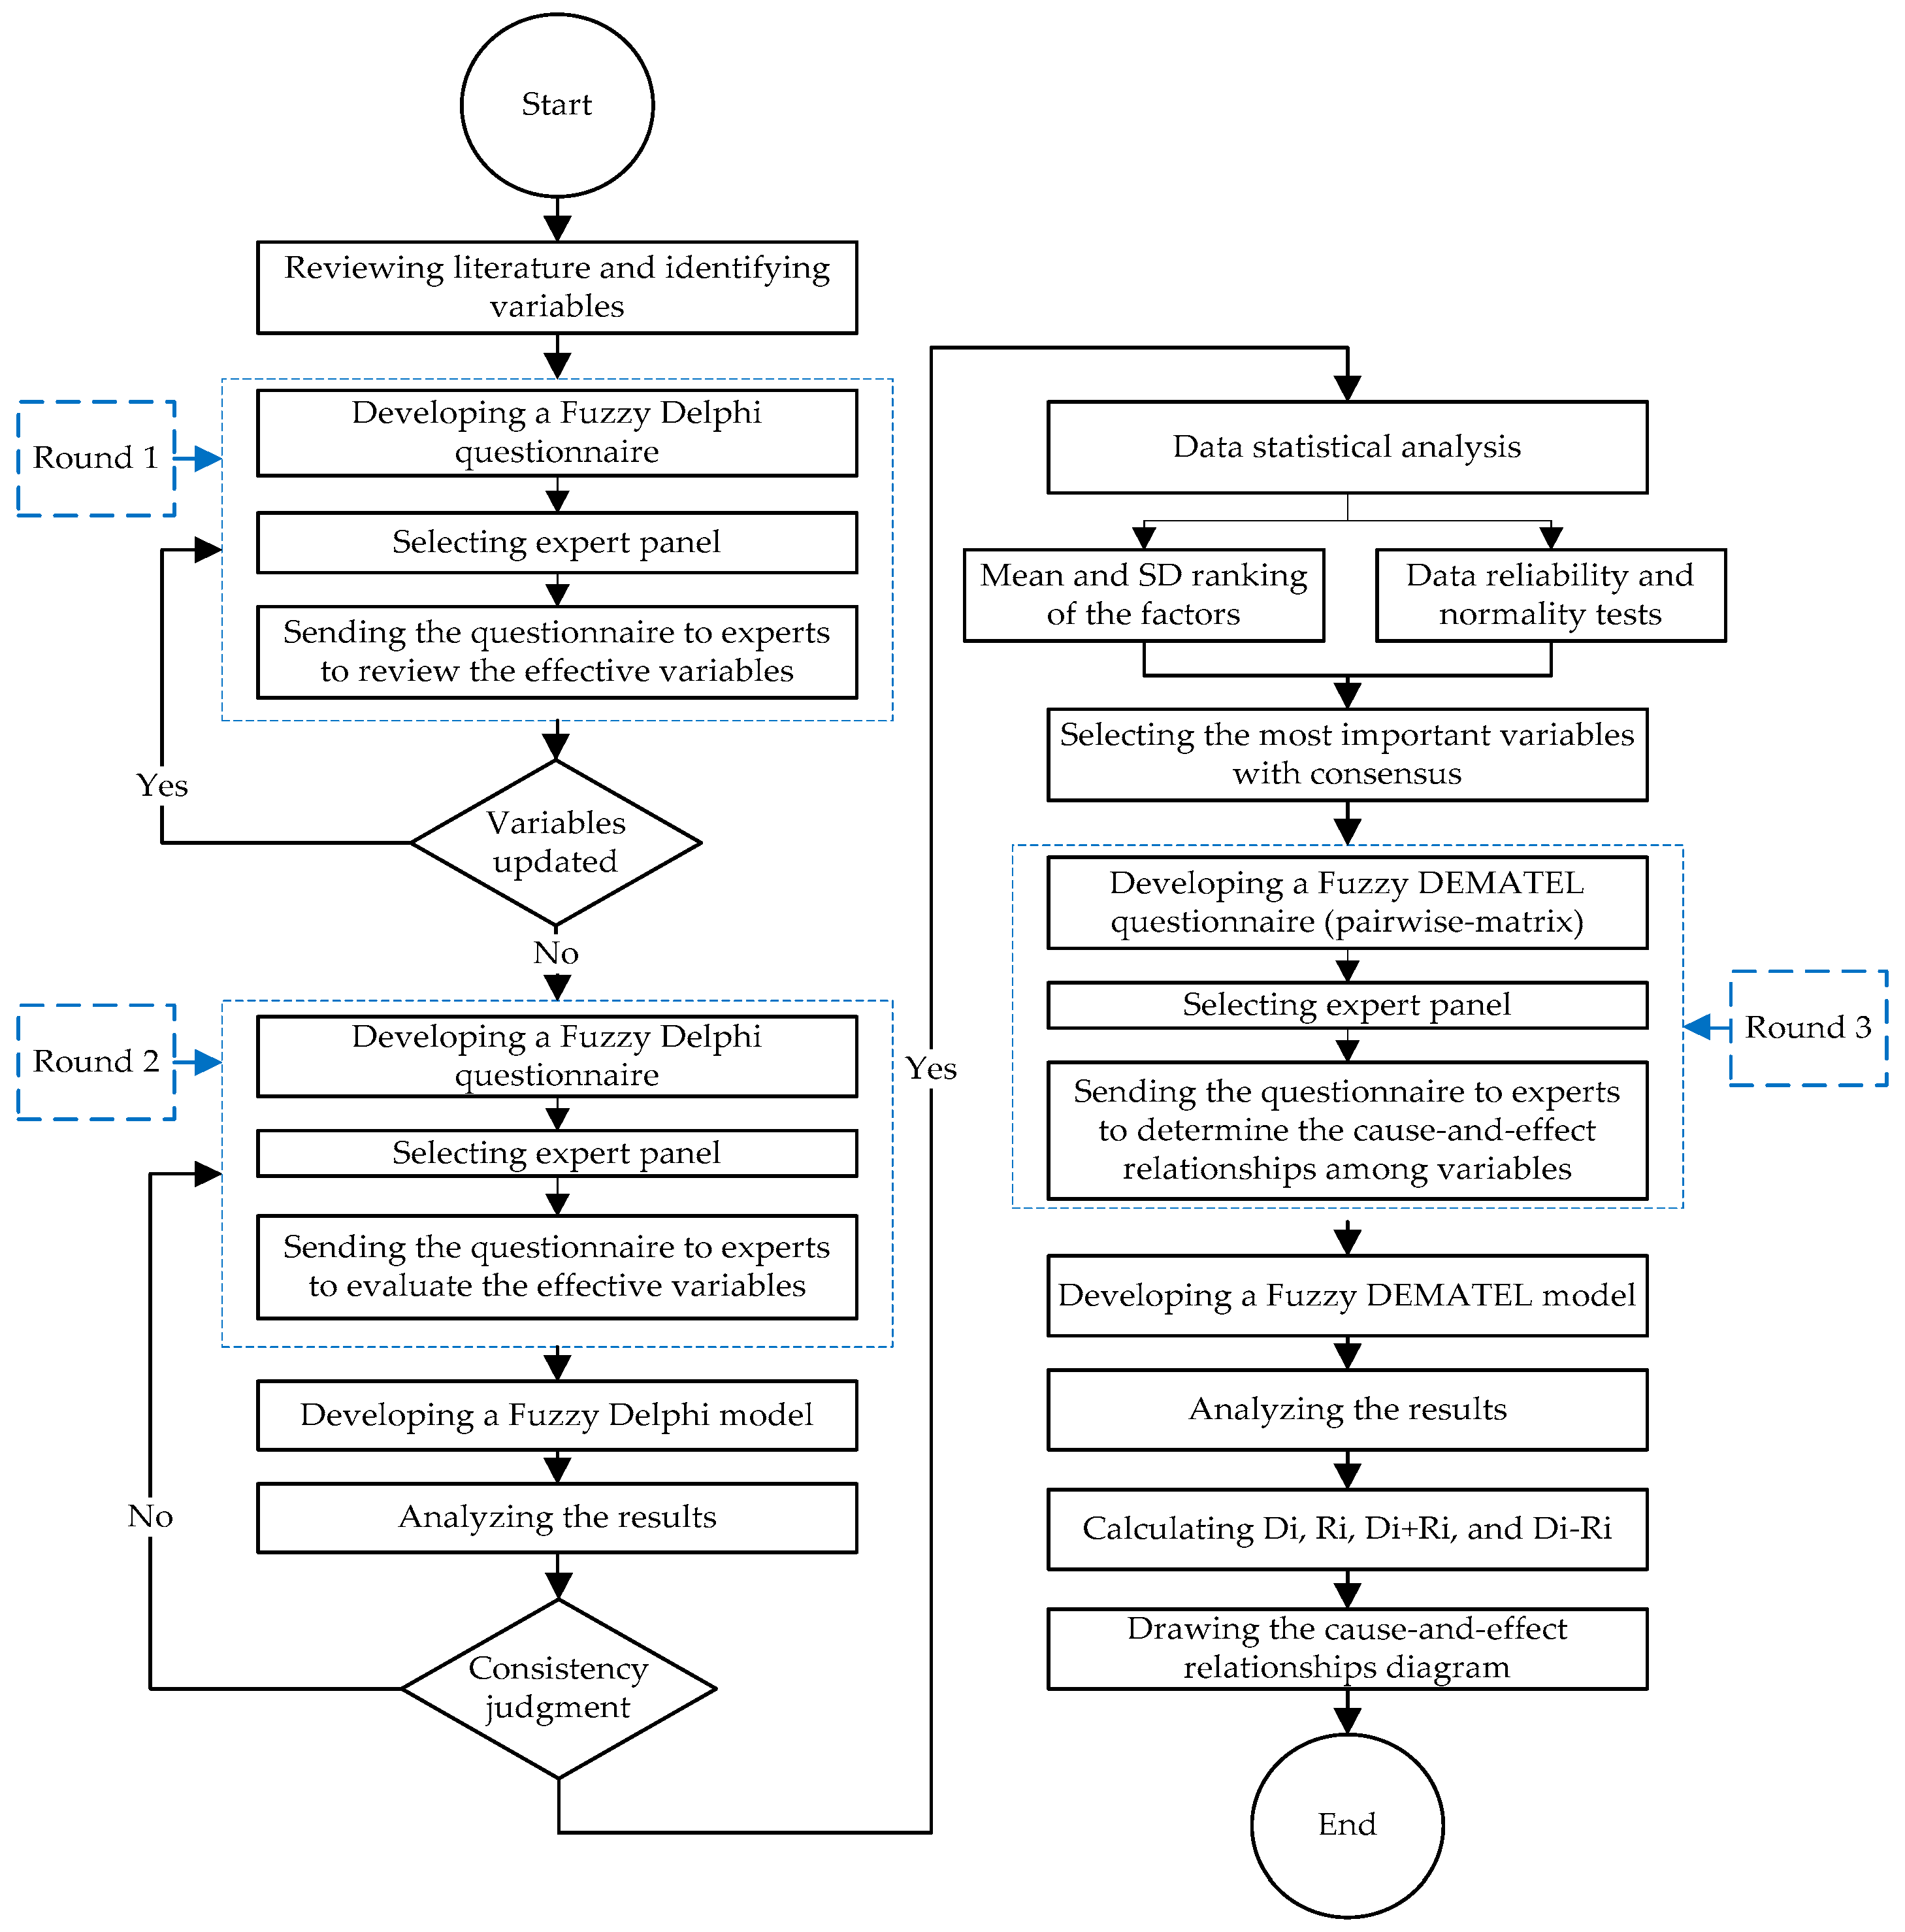
The flow chart of the research methodology and the steps involved in its implementation are shown in Figure 2.
Several steps were taken to implement the proposed methodology, and these are discussed and shown below.
Step 1: The literature was reviewed and factors affecting HEs in manual assembly processes were identified.
Step 2: This step is called round 1. In this step, an initial fuzzy Delphi questionnaire for factors affecting HEs in the manual assembly processes was developed. Experts with high experience were selected and then the fuzzy Delphi questionnaire was emailed to them to screen and classify the most important factors affecting HEs in manual assembly processes based on individual, tool, task, organizational, and environmental classifications. In addition, the experts were asked to review the influential factors and revise them by adding any essential missing factors. The study of John Baker et al. [80] recommended that researchers ensure accuracy in selecting experts for the fuzzy research by choosing experts with a minimum of ten years’ experience. In this research, a panel of experts was chosen based on their academic experience or level of knowledge in the field of manual assembly processes.
Step 3: This step is called round 2. In this step, a final fuzzy Delphi questionnaire for factors affecting HEs in manual assembly processes was developed and sent again to the experts to evaluate the effective factors. In both rounds of the Delphi study, thirty-two experts who have academic experience and a level of knowledge in the field of manual assembly processes responded to the questionnaire.
Step 4: A fuzzy Delphi model was developed that integrates the opinions of all the experts to identify the factors affecting HEs in manual assembly processes. In this step, the factors must be rated, and the ones with low scores were eliminated [25,77]. In this research, a factor with an evaluation score of 70% or more was accepted as an influencing factor on HEs.
Step 5: The results were analyzed and the most important factors affecting HEs in manual assembly processes based on expert opinions were selected with a consensus agreement rate of 75% or more. Based on each expert’s agreement rating, the expert group’s consensus needed to be derived for each factor [25,77].
Step 6: To ensure whether the number of experts was enough, a statistical analysis was undertaken for the surveying data collected from the experts and then the data reliability and normality was calculated using the SPSS 22.0 software program.
Step 7: This step is called round 3. In this step, the most important factors affecting HEs, which are the outputs of the fuzzy Delphi model, were selected, and then a fuzzy DEMATEL questionnaire was developed in the form of a pairwise matrix. After that, the expert panel was selected and the pairwise matrix questionnaires were emailed to them to evaluate the cause-and-effect relationships among the factors. In this round, fifteen experts responded to the fuzzy DEMATEL questionnaire. The demographic data of the experts in the fuzzy Delphi and DEMATEL studies are summarized in Table 3.
Step 8: A fuzzy DEMATEL model was developed to evaluate the cause-and-effect relationships among the factors.
Step 9: The outputs of the fuzzy DEMATEL model were analyzed to find the interaction between factors. After that, the cause-and-effect diagram, which shows the relationships among factors, must be drawn.

4. The Fuzzy Delphi and DEMATEL Models

4.1. The Fuzzy Delphi Model

In this study, the proposed model used fuzzy logic, which was suggested in 1955 by Lotfi A. Zadeh, and is a technique for evaluating uncertainty, dealing with ambiguity, and assisting human decision-making. The fuzzy method contains different types of fuzzy numbers used to convert expert opinions evaluation in the questionnaires from linguistic factors to fuzzy numbers, and Trigonometric Fuzzy Numbers (TFNs) have been used in this study. In this paper, the TFNs have used three real numbers, which are ( a ) as the smallest likely value, ( b ) as the most probable value, and ( c ) as the largest possible value of the expert opinion, as shown in Table 4.
In this study, the Fuzzy Delphi model consists of the following steps:

4.1.1. Determining Average Fuzzy Rating Scores

  • Calculate the average group decision fuzzy rating score for each possible factor. Assuming the estimation value of the importance of No. j factor provided by an expert No. i of n experts (total number) is measured in Equation (1):
    w ~ i j = a i j . b i j . c i j , i = 1,2 , n , j = 1,2 , m .
  • Obtain the average of fuzzy numbers ( w ~ j ) of No. j factor in Equation (2):
    w ~ j = a j . b j . c j = 1 n i = 1 n a i j . 1 n i = 1 n b i j . 1 n i = 1 n c i j , j = 1,2 , m .

4.1.2. Determine the Most Factors Affecting HEs

  • Specifying the defuzzification process: transforming the calculated average fuzzy rating score w ~ j of each factor j to its corresponding crisp values. Defuzzifying the aggregated fuzzy rating scores ( S j ) of factors using the simple center of gravity method as Equation (3) [25]:
    S j = a j + b j + c j 3 , j = 1,2 , m .
Evaluation rating scores ( S j ) were used to rank the importance of each factor. Therefore, if the factor has a score equal to 0.7 or higher based on expert judgments, the factor will be accepted as an affecting factor of human errors. If not, it will be removed from the study [25].
  • Examine the acceptability of the estimation domain.
    -
    For each factor j , compute the difference value ( D i j ) between the average fuzzy number ( w ~ j ), and each expert’s fuzzy estimation value ( w ~ i j ) as in Equation (4):
    D i j = 1 3 a j a i j 2 + b j b i j 2 + c j c i j 2 .
    -
    Calculate the threshold value ( d ) of each factor j by utilizing Equation (5):
    d = 1 n i = 1 n D i j .
    -
    Check the threshold value ( T h d ) of each estimation domain with the use of Equation (6):
    T h d = 1 n i = 1 m d j .
    The acceptability of the estimation domain can be established from the T h d value. In this research, an estimation domain is accepted if T h d 0.2 .
    -
    Test the expert group consensus ( E A j ) through calculating the expert agreement on each evaluated factor as Equation (7) [77]:
    E A j = E j n %
    where n represents the total number of experts, and E j represents the distance between their fuzzy estimation values w ~ i j on a specific factor j and the average fuzzy number of all experts on that factor w ~ j is 0.2 . The expert group consensus for each factor was screened out using the expert’s agreement with an E A j ≥ 75%. Otherwise, the factors with an expert consensus of less than 75% will be ignored [77].

4.2. The Fuzzy DEMATEL Model

The decision-making trial and evaluation laboratory (DEMATEL) was introduced in 1972 by Gabus et al. to analyze the interactions between variables [25]. Similar to the Delphi method, the DEMATEL method also relies on expert judgment and uses various fuzzy number types called Trigonometric Fuzzy Numbers (TFNs), which are described in Table 4, to evaluate expert judgment in a questionnaire by converting it from linguistic factors into fuzzy numbers in order to avoid ambiguity and achieve consensus among opinions. In 2008, the DEMATEL method was first used in a fuzzy environment by Lin [72]. The fuzzy DEMATEL technique looks into how criteria and sub-criteria relate to one another and uses the total-relation matrix to identify the criteria that are effective (cause) and affected (effect). In the DEMATEL method, the decision-making process is based on pairwise comparisons and the acceptance of relationships, which gives this method an advantage over other investigative techniques [82]. The fuzzy DEMATEL method is commonly employed in a variety of research areas, including risk analysis and assessment, safety management systems, and human resource management. The fuzzy DEMATEL model was implemented in this study using the steps listed below.

4.2.1. Determine the Initial Direct-Relation Fuzzy Matrix

The initial direct-relation fuzzy matrix ( Z ~ i j k ) is described as Equation (8) [83].
Z ~ i j k = 1 x 1 n k x n 1 k 1 , k = 1,2 , E .
where E represents the number of experts.
A triangular fuzzy number (TFN) can be defined as a triplet ( a ,   b ,   c ) as shown in Table 4; the membership function of the fuzzy number μ N x is defined as Equation (9) [83].
μ N x = 0 , x a x a b a , a x b c x c b , b x c 0 , x c
where a represents the left score, b is the medium score, and c is the correct score of the triangular fuzzy numbers.

4.2.2. Normalize the Triangular Fuzzy Numbers

The triangle fuzzy numbers are described as the following equations.
x a i j k = a i j k min a i j k m i n m a x  
x b i j k = b i j k min b i j k m i n m a x  
x c i j k = c i j k min c i j k m i n m a x  
m i n m a x   = max c i j k min a i j k
where   0 x i j 1

4.2.3. Calculate Left a s and Right c s Normalized Values

The left and right normalized values are described as Equations (14) and (15).
x a s i j k = x b i j k 1 + x b i j k x a i j k
x c s i j k = x c i j k 1 + x c i j k x b i j k

4.2.4. Calculate the Crisp Values

The crisp values ( x i j k ) are described as Equation (16) [83].
x i j k = x a s i j k × 1 x a s i j k + x c s i j k 2 1 x a s i j k + x c s i j k

4.2.5. Calculate the Total Normalized Crisp Values

The total normalized crisp values ( Z i j k ) are described as Equation (17).
Z i j k = min a i j k + x i j k × m i n m a x  

4.2.6. Generate the Direct Relation Matrix

The direct relation matrix ( Ã i j k ) has been generated by integrating the crisp values from all factors as shown in Equation (18).
à i j k = Z i j 1 + Z i j 2 + + Z i j n n

4.2.7. Generaet the Standardized Direct Influence Matrix

The standardized direct influence matrix T = t i j n × n , and 0 t i j 1 is described as Equation (19).
T = Ã i j k × S .
And   S = 1 max 1 i n j = 1 n à i j k , i , j = 1,2 , , n

4.2.8. Calculate the Total Relation Matrix X = x i j n × n

The element x i j indicates the indirect relationship of factors i and j . The total relation matrix X reflects the overall impact relationship between elements. The total relation matrix cab be calculated as Equation (21).
X = T × I T 1
where I is denoted as the identity matrix.

4.2.9. Calculate the D i -Value and R j -Value

D i and R i values can be calculated from the total relation matrix ( X ) as shown in Equations (22) and (23):
D i = j = 1 n x i j , j = 1 ,   2 ,   ,   n ,
R j = i = 1 n x i j , i = 1 ,   2 ,   ,   n .
where D i is the total number of elements in each row in the total-relation matrix. It shows the degree to which that factor affects other factors. And R j is the total number of elements in each column in the total-relation matrix. It shows the degree to which that factor is affected by other factors [25].

4.2.10. Drawing the Cause and Effect Diagram

To draw the cause and effect diagram: Firstly, use D i and R j values to calculate the values of D i + R j and D i R j . Secondly, mapping the dataset of D i + R j on the horizontal axis and D i R j on the vertical axis. The values of D i + R j show how much one factor affects and is affected by other factors. In other words, the higher value of D i + R j means there is a high interaction between the factor and other factors in a system. While the values of D i R j show how strongly one factor affects other factors in a system. Therefore, when the value of D i + R j is positive, the factor will be considered a cause factor. Similarly, when the value of D i + R j is negative, the factor will be considered an effect factor.

5. Results and Discussion

A literature review was conducted to identify and extract important factors influencing HEs during manual assembly processes. After that, these factors were analyzed by experts and classified into five groups: individual, tool, task, organizational, and environmental factors. Furthermore, a developed model was proposed by applying FDM and DEMATEL methods to accurately determine the factors affecting human errors in manual assembly processes and identify the relationships among them. The results and discussion are explained in detail in the following subsections.

5.1. Reliability and Validity Test of the Survey Data

To evaluate the reliability of the survey data, Cronbach’s α coefficients for each factor were calculated using the SPSS 22.0 software program, as shown in Table 5. It was noted that the subscale Cronbach’s α coefficients were all greater than 0.70; thus, the scale’s reliability is high [15]. Furthermore, the questionnaire’s overall reliability is 0.91, indicating that the survey data were reliable enough for further statistical analysis.

5.2. Factors Descriptive Statistics

Regarding experts’ responses, the descriptive statistics of the factors affecting HEs in manual assembly processes are shown in Table 6.
Statistical parameters such as mean, standard deviation, mode, median, and skewness were calculated in the descriptive statistics section. All of these parameters are used to describe the influence of these factors on human errors in assembly processes. For example, by asking the experts about the influence of individual factors on human errors in assembly processes, there were different answers ranging from 1 to 5. However, the mean of these answers was 3.715, indicating a high effect of individual factors on human errors in assembly processes. The variation answer of the answers was not high, as indicated by the standard deviation value for this response (0.224). In addition, most of the answers were greater than the mean since the mode was 3. The median and mean were very close to each other, which indicates a normal distribution of the data. This is also supported by the value of the skewness, which was close to zero.
Moreover, the tool and task factors had a high mean of more than four and have the same mode and median that are very close to their mean. In addition, they have a skewness close to zero. It is worth noting that the tool factor has a positive skewness, which means its distribution is on the right side but is close to zero. Finally, the organizational and work environment factors have a very close mean, and their mode and median are equal. In addition, they have a skewness very close to zero.

5.3. Normality Test of the Survey Data

The normality test of the survey data was performed to check whether the data are normally distributed or not and to check if the data can be analyzed using parametric or nonparametric statistical methods.
Additionally, normality tests can help to identify outliers, which are values that are significantly different from the rest of the data. Outliers can affect the results of statistical analyses and can lead to incorrect conclusions. By identifying outliers, researchers can decide how to handle them, either by removing them from the analysis or by using robust statistical methods that are less sensitive to outliers. Overall, normality tests are important in survey research to ensure that the data are appropriate for the statistical analyses being used and to identify any potential outliers that may affect the results.
Examining whether or not the survey data in this study follows a normal distribution was performed using the Shapiro–Wilk test. The Shapiro–Wilk test is a more powerful test when the sample size is small (less than 50 samples), and it is less sensitive to deviations from normality in the tails of the distribution [39]. The test statistic for the Shapiro–Wilk test is based on the correlation between the observed sample values and the expected normal distribution values, and it provides a p-value that indicates the probability of observing such a deviation from normality if the data were actually normally distributed. Hypothesis testing for the full survey (including individual factors, tool factors, task factors, organizational factors, and environmental factors) is shown in Table 7. The results showed a significance level of >0.05. Therefore, the data followed a normal distribution for the research factors, and the null hypothesis was accepted with a 95% confidence level.

5.4. One-Sample t-Test

In this section, the one-sample t-test was used as a statistical hypothesis test to determine whether the mean of a single sample of data is significantly different from a hypothesized value (a test value = 3) [39]. For the primary research factor (human errors during assembly processes), the means of the individual, tool, task, organizational, and environmental factors were 3.715, 4.093, 4.140, 3.580, and 3.644, respectively (Table 8). The mean of the overall questionnaire was 3.834. The difference with the test result was significant and above average because the p-values of all the factors were less than 0.05. In contrast, since both the upper and lower bounds of the confidence range are positive, it is possible that all of the factors under examination should be interpreted as “strong” human error factors generating assembly process errors.

5.5. Ranking Factors Influencing HEs Based on the Fuzzy Delphi Method

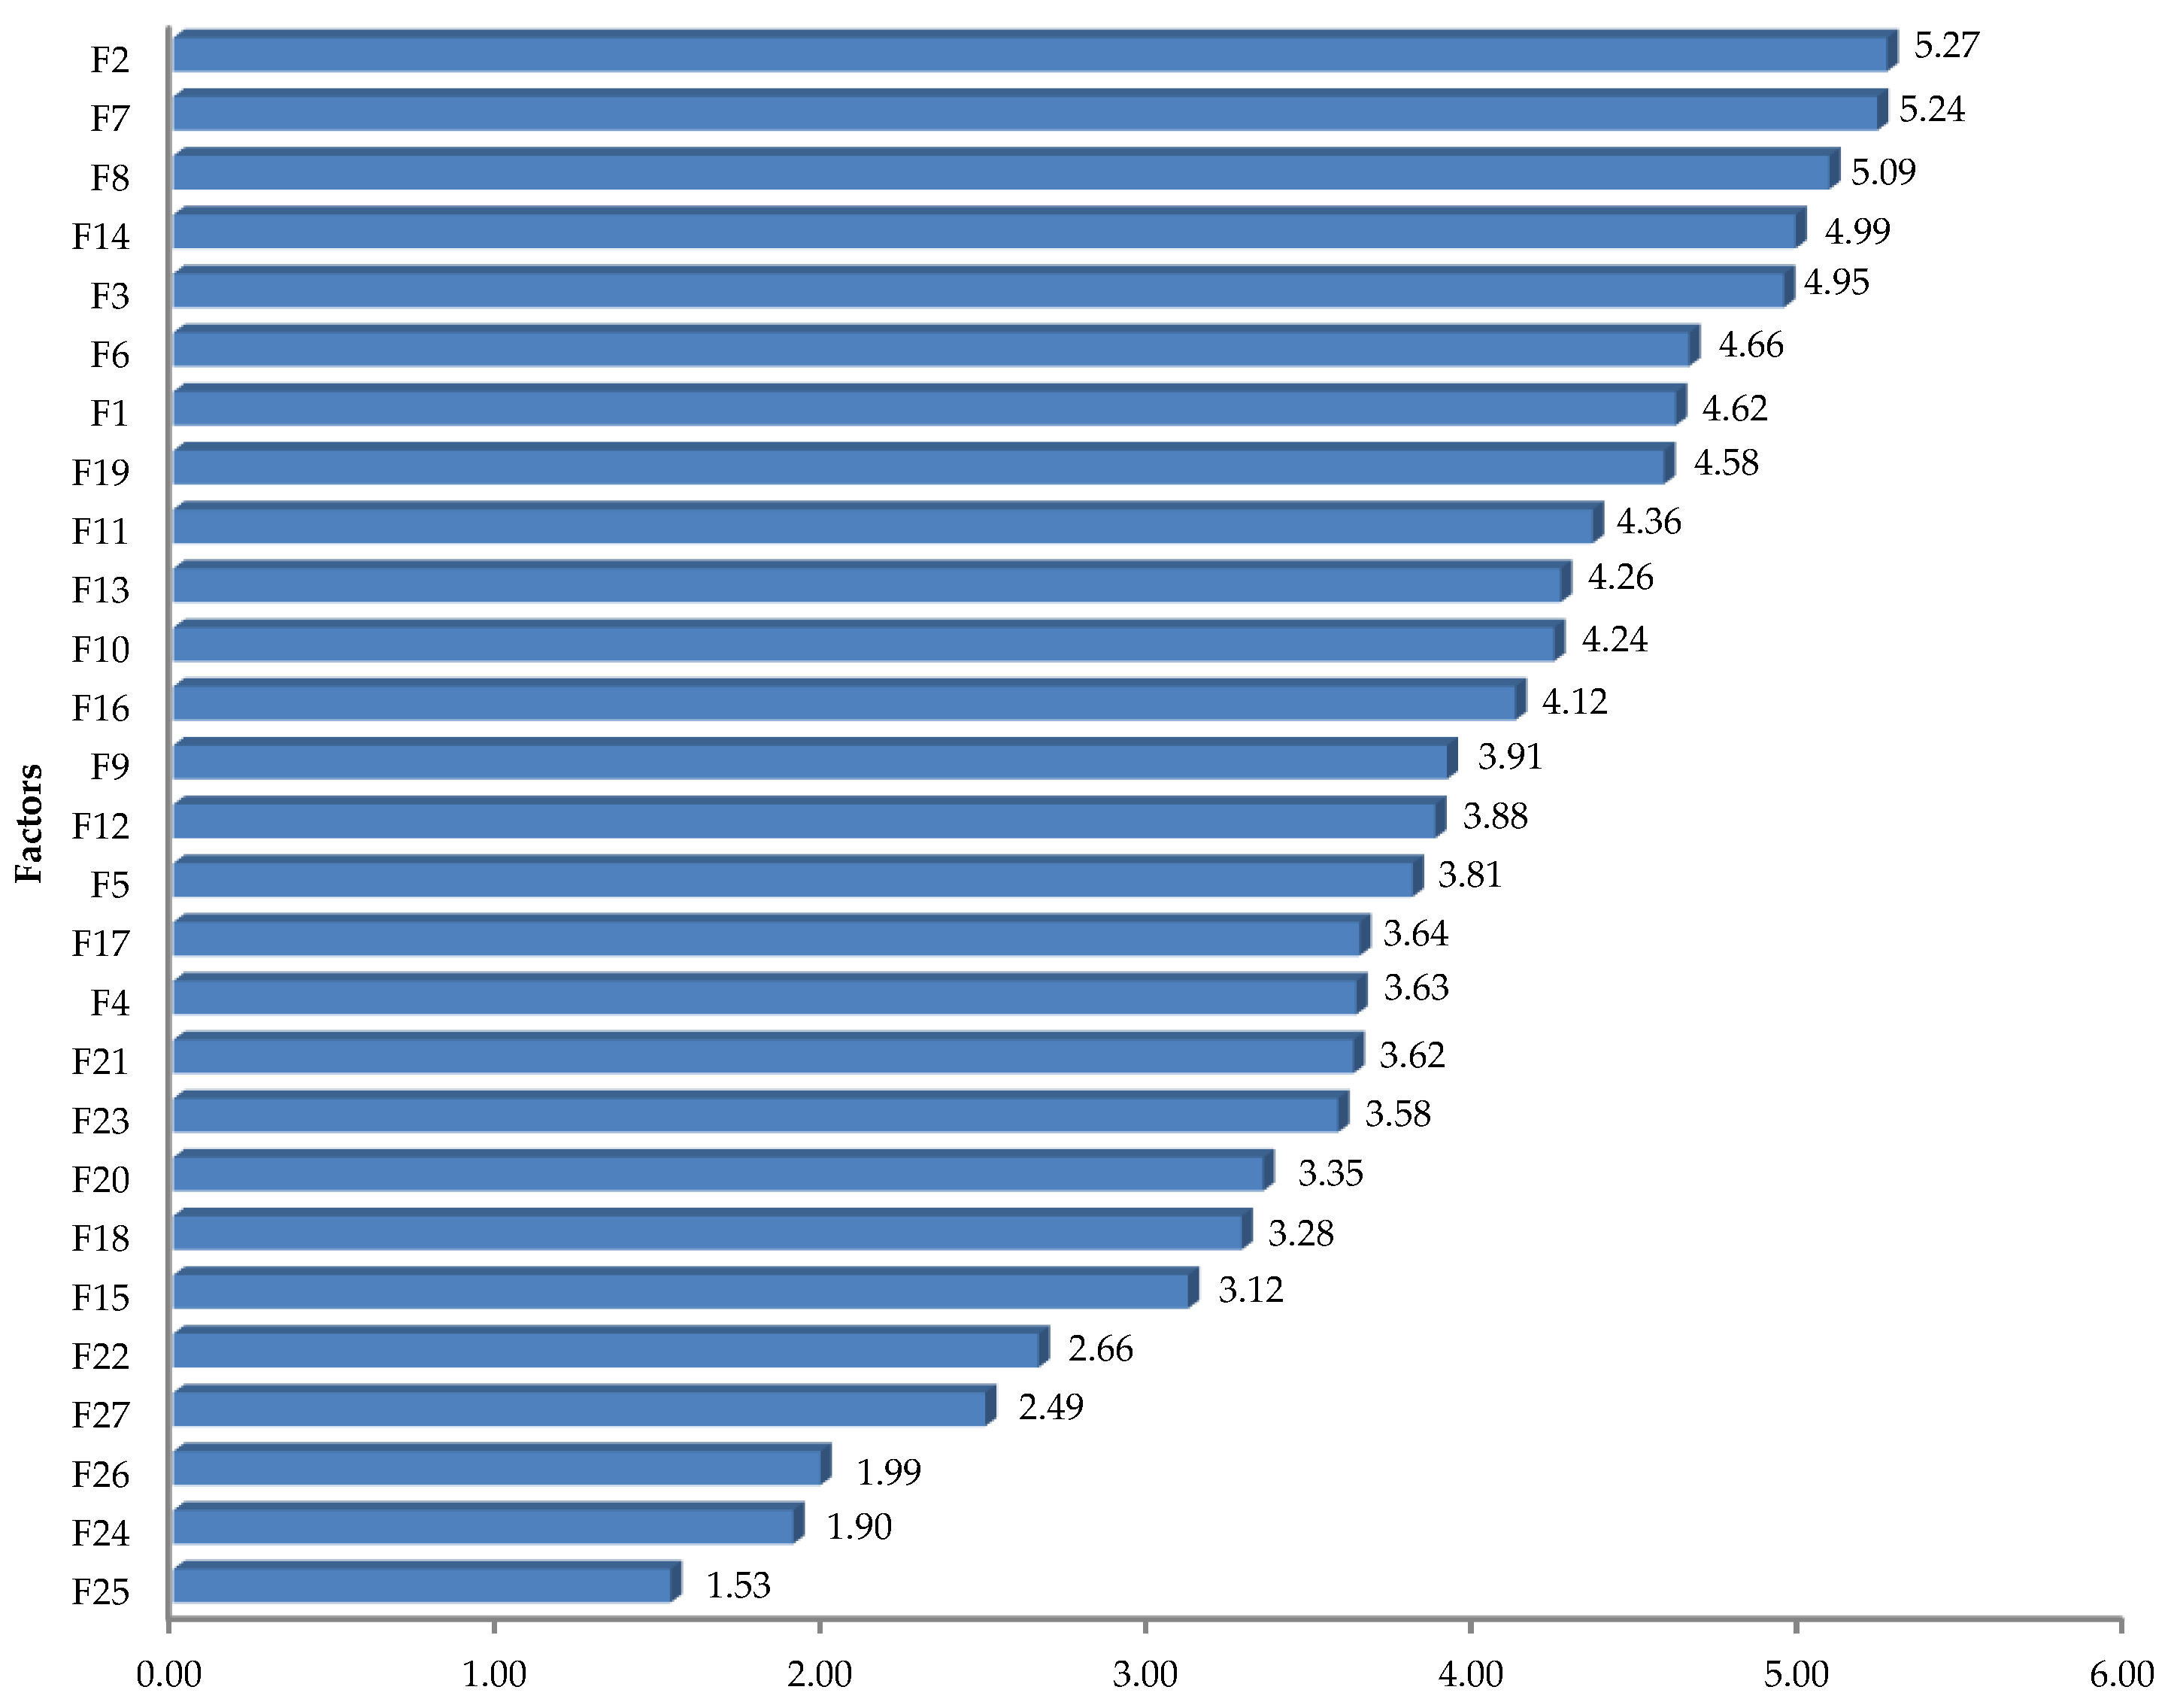
Based on the fuzzy Delphi method, the most factors affecting human errors in manual assembly processes were identified, as shown in Table 9. It is worth noting that the defuzzified evaluation rating scores ( S j ) were calculated for each factor based on Equation (3). Thus, if the score S j of the factor was found to be 0.7 or higher based on expert opinions, the factor was accepted as an affecting factor of human errors. Otherwise, it would be removed from the study. In addition, the expert group consensus for each factor was screened out using the expert’s agreement with an E A j 75 % based on Equation (7). The results revealed that the following factors strongly affected human error in manual assembly processes: a lack of experience, poor instructions and procedures, misunderstanding, a lack of knowledge, poor error visual perception, risk-taking, task complexity, and a lack of training. The tool factors, such as using inappropriate tools and a lack of necessary tools exerted the strongest effects on HEs. As for task factors, poor instructions and procedures, task complexity, and time pressure have strongly influenced HEs. For the organizational factors, the lack of training and the poor supervision were shown to have the strongest effects on HEs. Finally, the environmental factors, such as inappropriate lighting and noise, were found to be the strongest factors affecting HEs.

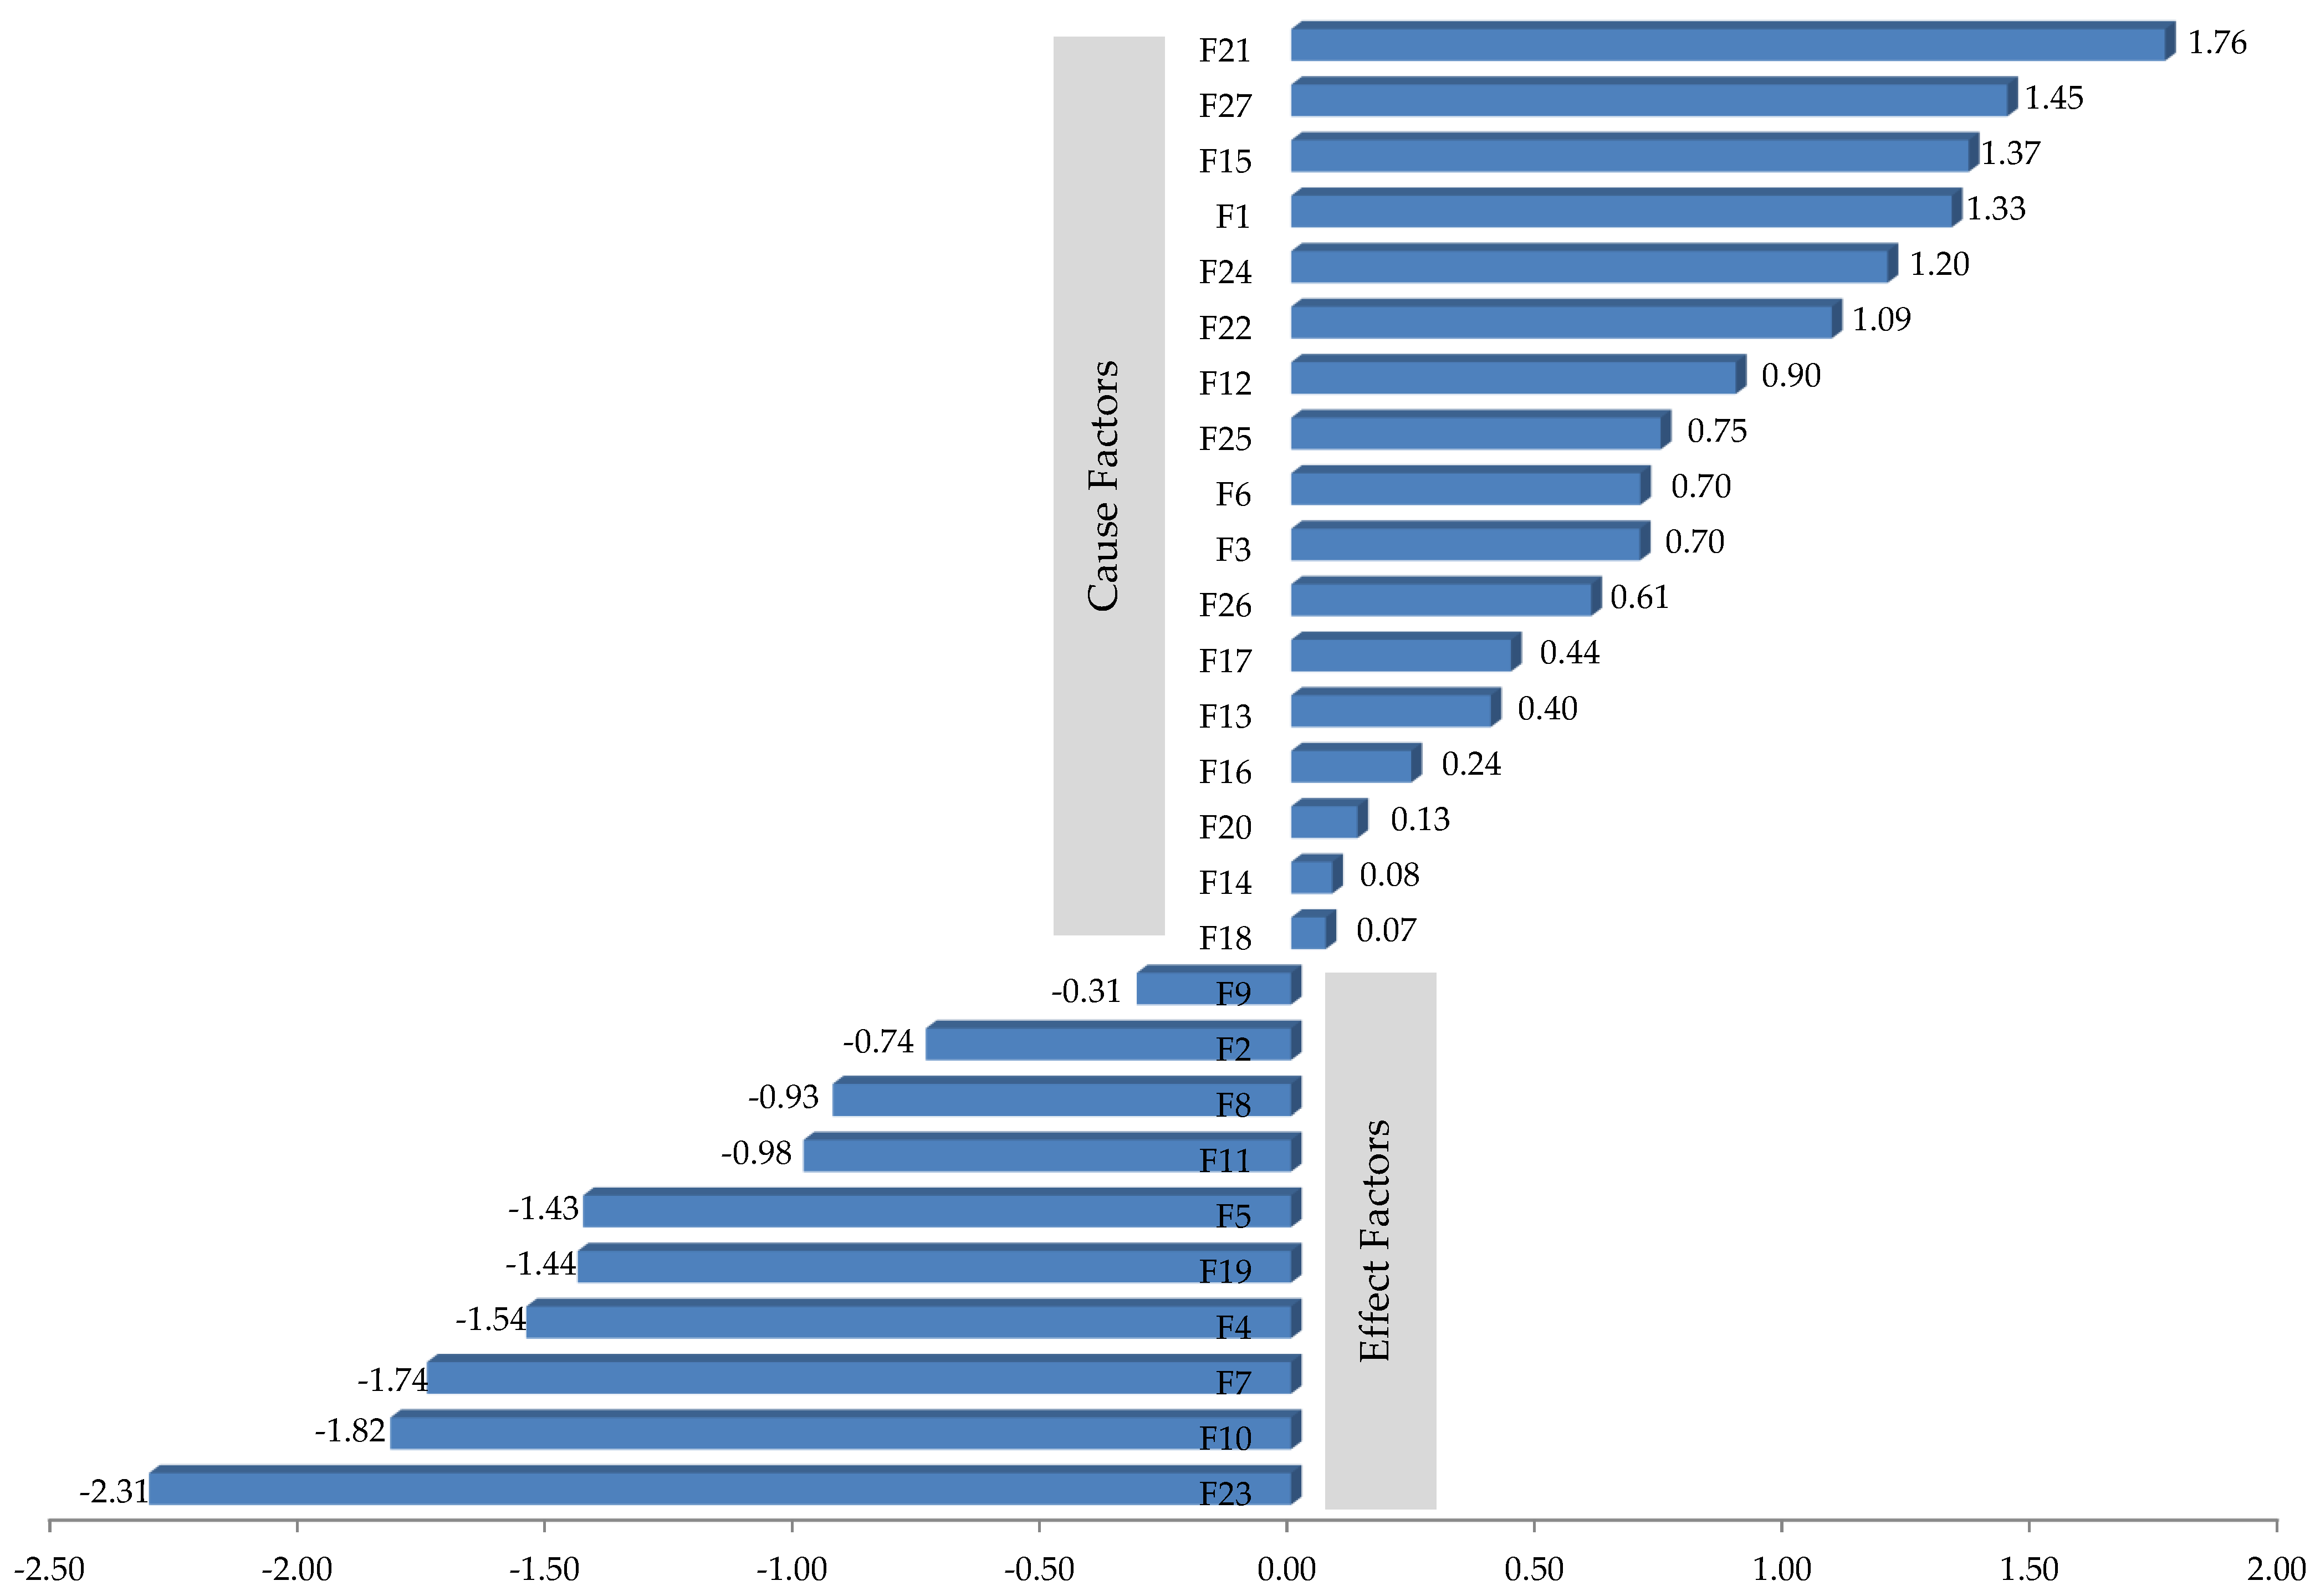
5.6. Determining Cause-and-Effect Relationships among Factors Affecting HEs Based on the Fuzzy DEMATEL Method

In this section, the twenty-seven factors with an influencing score of 0.7 or higher, which are shown in Table 9, were screened for the Fuzzy DEMATEL study and then given to the experts in the form of a pairwise-matrix questionnaire (Table 10) to analyze the cause-and-effect relationships among the factors. After expert opinions were collected, the direct-relation fuzzy matrix was created to acquire the mean of opinions. Next, the normalized direct-relation matrix was formed. Finally, the total relation matrix was created to describe the effects of factors on each other, as shown in Table 11. In the total relation matrix, the addition of factors in each row measured the D-value, which illustrates how the factor affects other factors, and the addition of factors in each column measured the R-value, which illustrates how the factor is impacted by other factors, as shown in Table 12. Then, the interaction of factors D i + R j , as shown in Figure 3 and the relationship between factors D i R j , as shown in Figure 4, were calculated using D i and R j values. A positive D i R j relationship indicated that a factor was effective (cause), whereas a negative D i R j relationship indicated that a factor was affected (effect). According to D i + R j values in Figure 3, misunderstanding, fatigue, and stress had the highest level of interaction with other factors; on the contrary, noise, inappropriate lighting, and a poor ergonomic design of the workplace had the lowest level of interaction with other factors.
Based on D i R j values in Figure 4, a lack of training, poor workplace layout, a lack of necessary tools, and a lack of experience were the most effective factors and were less affected by other factors. This indicates that these factors had a strong directing influence with minor dependence on other factors. Therefore, if these factors are strengthened, assembly-process errors are decreased, which results in a large decrease in human errors. On the contrary, the factors most affected (effects) by other cause factors were a failure to address the error-causing problem, unintentional unsafe acts, fatigue, and poor error visual perception.
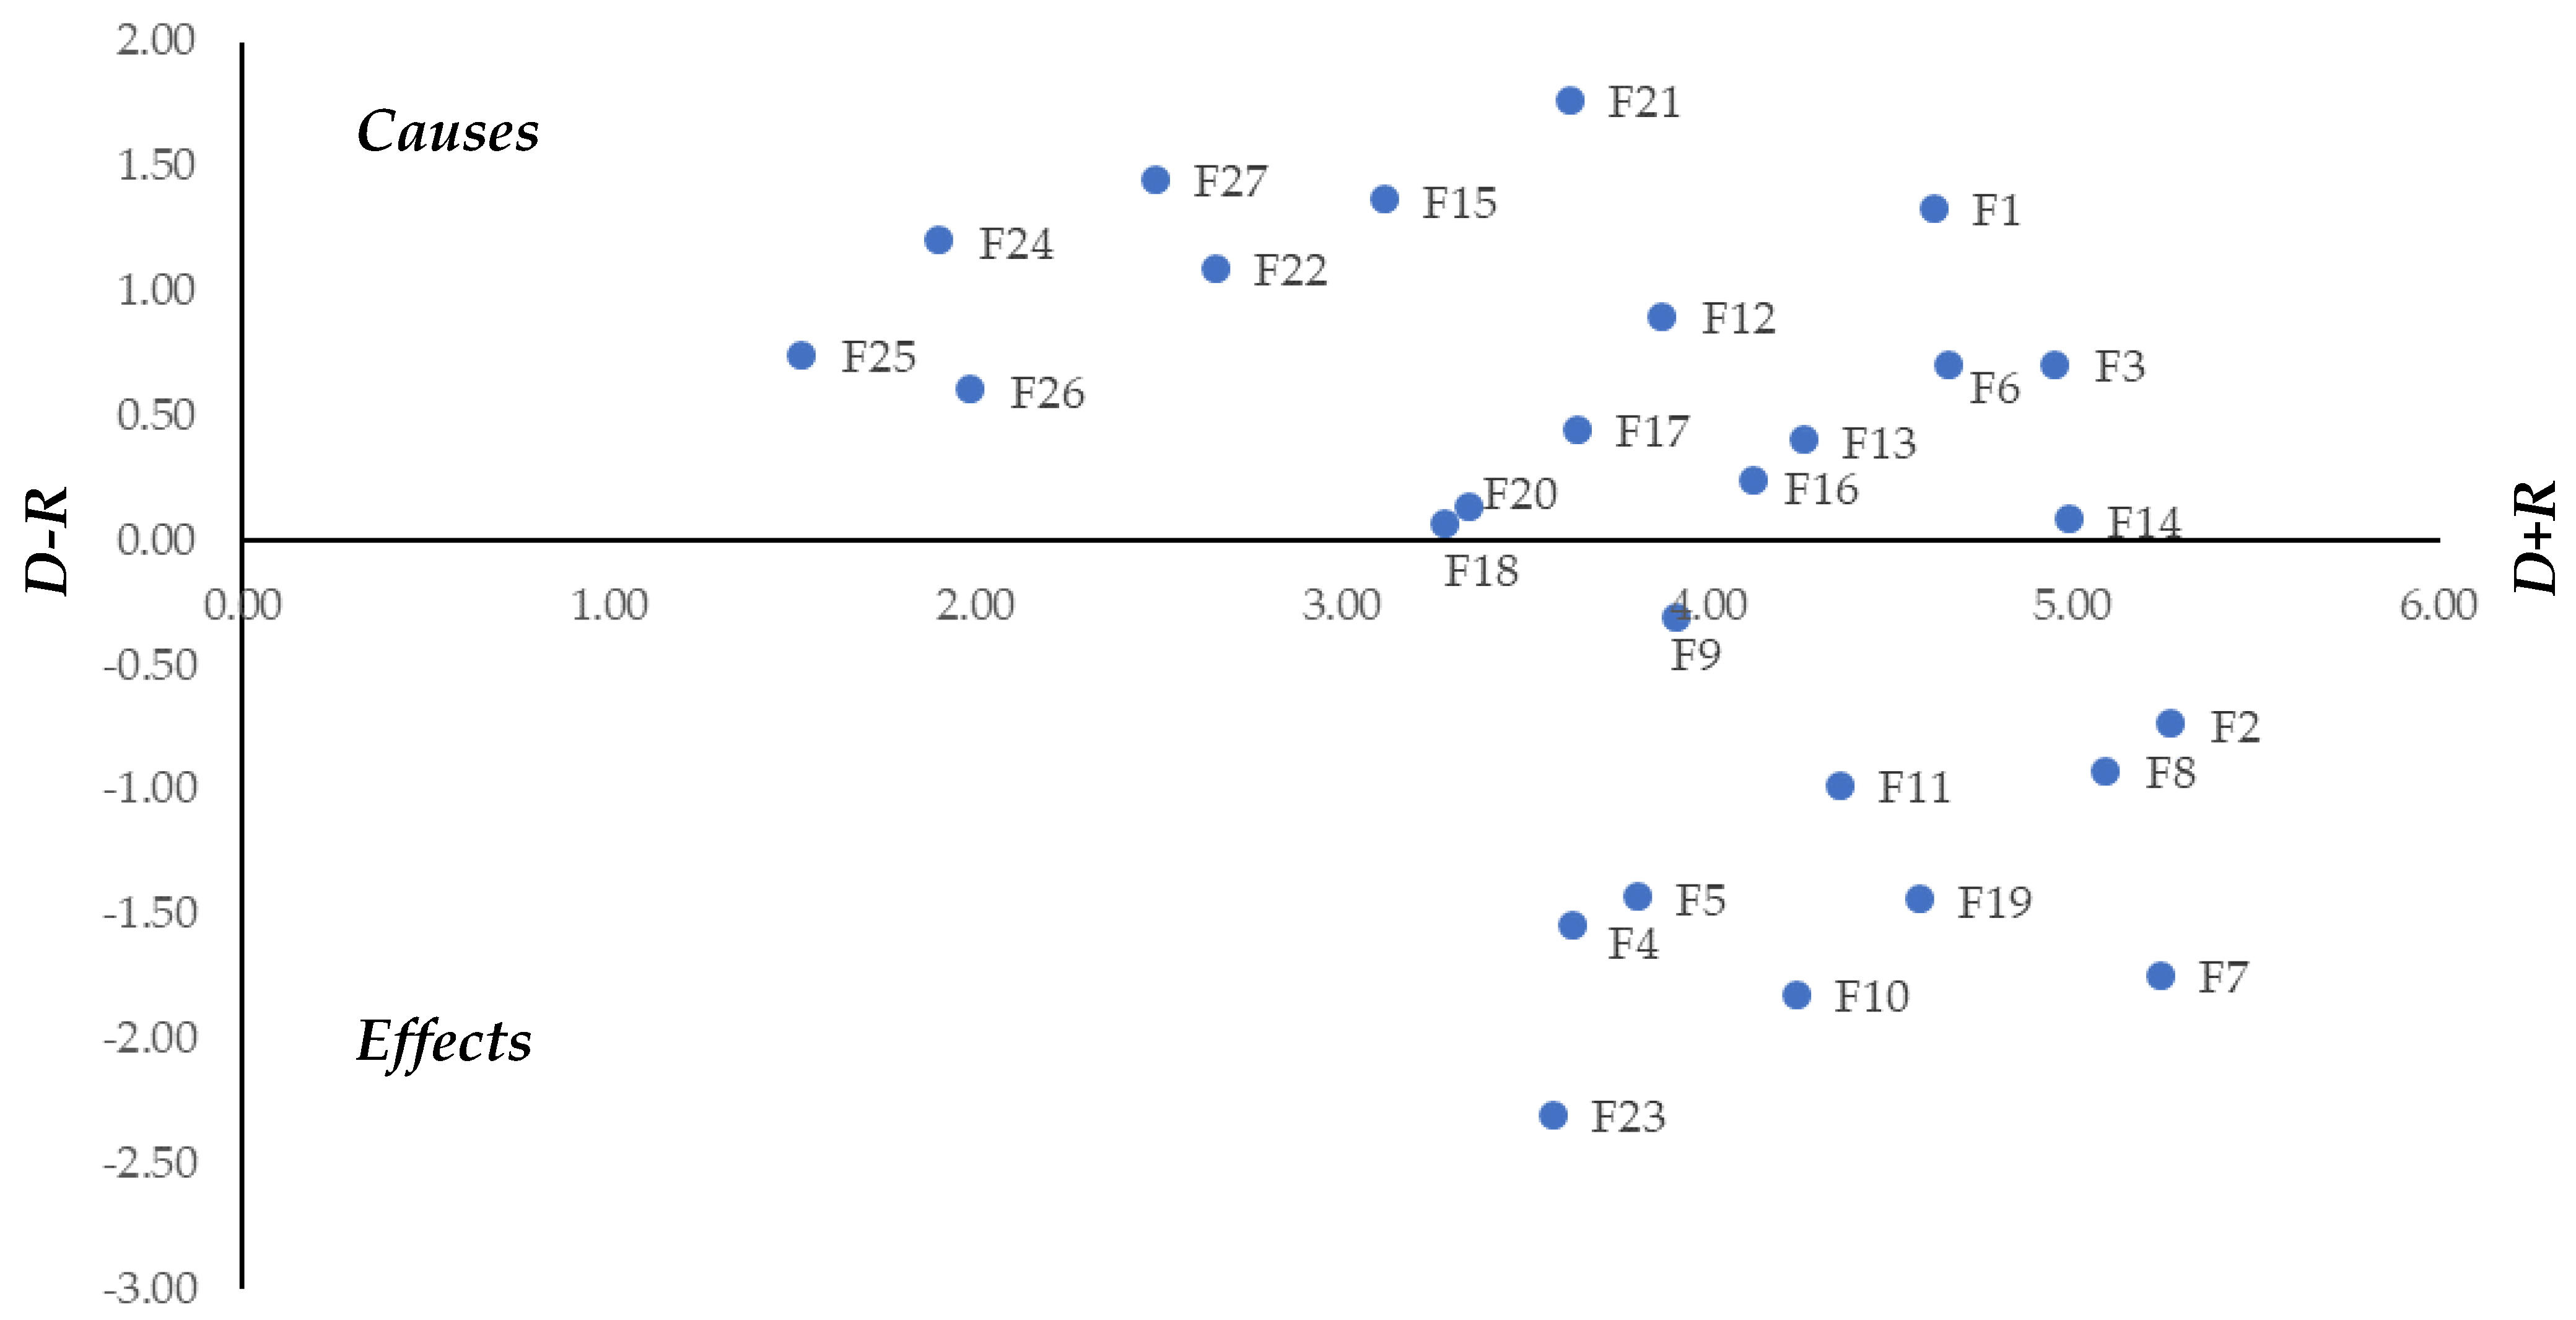
Based on the cause-and-effect relationship, as shown in Figure 5, the factors have been divided into two groups, which are causes and effects. It is worth noting that a lack of training (F21), poor workplace layout (F27), a lack of necessary tools (F15), and a lack of experience (F1) factors have the highest D i R j values with 1.76, 1.45, 1.37, and 1.33, respectively, among all the cause group factors. This indicates that these factors have more impact on the effect group factors. In other words, manual assembly organizations should focus and pay attention to these factors in order to reduce manual assembly errors. On the other hand, a failure to address the error-causing problem (F23)-, unintentional unsafe acts (F10)-, fatigue (F7)-, and poor error visual perception (F4)-affected factors have D i R j values with 2.31 , 1.82 , 1.74 , and 1.54 , respectively, among all the effect group factors. In addition, the results showed that the most influencing factors among the main factors are the individual factors, the organizational factors, the tool factors, the environmental factors, and the task factors. Based on the results, this study developed a useful framework for practitioners based on the identified cause-and-effect factors, as shown in Table 13. This framework illustrates how factors are affected by each other. From Table 13, it can be noticed that a lack of experience influences most other factors such as misunderstanding, knowledge level, poor error visual perception, etc., and it is affected by seven factors, which are knowledge level, memory, stress, health, intelligence, using tools, and training. In addition, it is noticable that some factors are only influencing and not affected by any factor; these factors are a lack of necessary tools, poor supervision, and all of the environmental factors. Therefore, the developed framework will help practitioners delve deeper into understanding the root causes of human errors related to manual assembly processes to develop effective strategies and make more informed, evidence-based decisions that will contribute to reducing assembly errors.
The findings of this study showed the importance of parameters, such as worker experience and knowledge, using appropriate tools, clear instructions of tasks, training, and good environmental work, in reducing worker errors in manual assembly processes. In previous research, some studies have confirmed the relationship between the parameters of this study and human errors in the manual assembly processes. The results of this study demonstrate that experience and technical knowledge are the root cause of human errors in manual assembly processes. Based on some previous studies [29], the experience factor is an important factor affecting human errors in assembly systems. Some studies, such as [30,31,32,33,34], demonstrated that the lack of experience and knowledge of the assembler were the most effective personal factors that led to assembly errors. In addition, some studies demonstrated many personal factors, such as misunderstanding [39], visual error perception [25,38,84], risk-taking [41], worker memory [35,36,39], fatigue [6,25,85,86,87], stress [2], understanding roles and responsibilities [25,38], unintentional unsafe acts and haste in doing work [39], worker health [36], and intelligence coefficient [25,38], were the root causes of human errors in manual assembly processes.
Moreover, many studies focusing on human error have emphasized tool factors, such as using necessary and appropriate tools [36,39], and task factors, such as instructions and procedures [42], task complexity [43], time pressure [2], workload [2], and multitasking [45,46,47,48]. Human errors have been studied extensively, with many previous studies concentrating on organizational factors such as training [25], a lack of supervision, and avoiding the root cause of the error [39]. Appropriate lighting and noiseing in environmental work improves awareness and cognitive performance [49,50]. The poor ergonomic design of the workplace [28] and poor workplace layout [25] led to increased human errors. The findings of this study will help organizations make better-informed decisions on how to reduce worker errors and the factors that contribute to assembly errors. In addition, the findings demonstrate a reasonable basis for reaching the quality of the final assembled parts.

6. Conclusions and Future Research

This study aimed to determine the factors influencing human errors in manual assembly processes and identify the cause-and-effect relationships among them using two types of MCDM techniques. Based on the literature and experts, five main factors affecting HEs in manual assembly processes were identified: individual, tool, task, organizational, and work environment factors. Related to the five main factors, fifty-one factors were recognized by analyzing earlier literature on factors affecting HEs in manual assembly processes. The fuzzy Delphi model has developed, and the fuzzy Delphi survey was built. Based on two rounds of the fuzzy Delphi study, twenty-seven factors with an affecting score of 0.7 and higher were selected as the most influencing HEs in manual assembly processes. After that, the DEMATEL method was used to analyze the cause-and-effect relationships among the twenty-seven factors affecting HEs.
The findings of this study indicated that the root causes of HEs in the manual assembly processes were as follows: level of training, poor workplace design, a lack of appropriate tools, and experience. Furthermore, a failure to address the error-causing problem, unintentional unsafe acts, fatigue, and poor error visual perception were found to be effect (dependent) factors. The practical implications of this study for organizations will be in identifying the factors that contribute to assembly errors; organizations can make decisions to control those factors to reduce worker errors, increase the quality of assembled parts, and save the costs associated with assembly errors.
There are some limitations related to this paper that should be taken into consideration for future work. They are as follows: This paper provides a summary of the factors that cause human errors during manual assembly processes and interactions between these factors. Future research should be undertaken using other methods, such as structure-equation modeling, to study the interrelationship between the factors affecting human errors. In addition, empirical studies should be investigated to verify the structural correlations revealed in the study model. It also encourages the researchers to perform some experiments to measure the mental and physical workloads of the workers while performing manual assembly processes to know the root causes of the factors affecting human errors that contribute to decreasing efficiency and the discomfort of humans in the workplace.

Author Contributions

Conceptualization, F.M.A. (Fahad M. Alqahtani), M.A.N., and S.A.A.; methodology, F.M.A. (Fahad M. Alqahtani), and M.A.N.; software, M.A.N.; validation, F.M.A. (Fahad M. Alqahtani), M.A.N. and S.A.A.; formal analysis, M.A.N. and M.H.A.; investigation, M.A.N., S.A.A., M.H.A. and F.M.A.; resources, F.M.A. (Fahad M. Alqahtani), S.A.A., I.A. and F.M.A. (Faisal M. Alessa); data curation, M.A.N. and M.H.A.; writing—original draft preparation, M.A.N.; writing—review and editing, F.M.A. (Fahad M. Alqahtani), M.A.N., S.A.A. and F.M.A. (Faisal M. Alessa); visualization, M.A.N.; supervision, F.M.A. (Fahad M. Alqahtani), S.A.A. and I.A.; project administration, F.M.A. (Fahad M. Alqahtani); funding acquisition, F.M.A. (Fahad M. Alqahtani). All authors have read and agreed to the published version of the manuscript.

Funding

This research was supported by Researchers Supporting Project number (RSPD2023 R803), King Saud University, Riyadh, Saudi Arabia.

Institutional Review Board Statement

Not applicable.

Informed Consent Statement

Not applicable.

Data Availability Statement

Not applicable.

Acknowledgments

The authors extend their appreciation to the Researchers Supporting Project number (RSPD2023 R803), King Saud University, Riyadh, Saudi Arabia.

Conflicts of Interest

The authors declare no conflict of interest.

References

  1. Richardson, M.; Jones, G.; Torrance, M.; Baguley, T. Identifying the task variables that predict object assembly difficulty. Hum. Factors 2006, 48, 511–525. [Google Scholar] [CrossRef] [PubMed]
  2. Brolin, A.; Thorvald, P.; Case, K. Experimental study of cognitive aspects affecting human performance in manual assembly. Prod. Manuf. Res. 2017, 5, 141–163. [Google Scholar] [CrossRef]
  3. Bavafa, A.; Mahdiyar, A.; Marsono, A.K. Identifying and assessing the critical factors for effective implementation of safety programs in construction projects. Saf. Sci. 2018, 106, 47–56. [Google Scholar] [CrossRef]
  4. Li, D.; Mattsson, S.; Salunkhe, O.; Fast-Berglund, Å.; Skoogh, A.; Broberg, J. Effects of information content in work instructions for operator performance. Procedia Manuf. 2018, 25, 628–635. [Google Scholar] [CrossRef]
  5. Bäckstrand, G.; Thorvald, P.; De Vin, L.J.; Högberg, D.; Case, K. The impact of information presentation on work environment and product quality: A case study. In Proceedings of the 40th Annual Conference of the Nordic Ergonomics Society, Reykjavík, Iceland, 11–13 August 2008. [Google Scholar]
  6. Torres, Y.; Nadeau, S.; Landau, K. Classification and quantification of human error in manufacturing: A case study in complex manual assembly. Appl. Sci. 2021, 11, 749. [Google Scholar] [CrossRef]
  7. Mattsson, S.; Fast-Berglund, Å.; Li, D. Evaluation of guidelines for assembly instructions. IFAC-PapersOnLine 2016, 49, 209–214. [Google Scholar] [CrossRef]
  8. Lichtner, D.; Senesac, C.J.; Hagan, R.J.; Gandhi, F. Three-dimensional model based manufacturing work instructions. In Proceedings of the 65th Annual Forum Proceedings-AHS International, Grapevine, TX, USA, 27–29 May 2009; pp. 2115–2120. [Google Scholar]
  9. Geng, J.; Zhang, S.; Yang, B. A publishing method of lightweight three-dimensional assembly instruction for complex products. J. Comput. Inf. Sci. Eng. 2015, 15, 031004. [Google Scholar] [CrossRef]
  10. Lotter, B.; Wiendahl, H.-P. Changeable and reconfigurable assembly systems. In Changeable and Reconfigurable Manufacturing Systems; Springer: Berlin/Heidelberg, Germany, 2009; pp. 127–142. [Google Scholar]
  11. Dinlersoz, E.; Wolf, Z. Automation, labor share, and productivity: Plant-level evidence from U.S. Manufacturing. Econ. Innov. New Technol. 2022. [Google Scholar] [CrossRef]
  12. BEUß, F.; Sender, J.; Flügge, W. Ergonomics simulation in aircraft manufacturing–methods and potentials. Procedia CIRP 2019, 81, 742–746. [Google Scholar] [CrossRef]
  13. Judt, D.; Lawson, C.; Lockett, H. Experimental investigation into aircraft system manual assembly performance under varying structural component orientations. Proc. Inst. Mech. Eng. Part B J. Eng. Manuf. 2020, 234, 840–855. [Google Scholar] [CrossRef]
  14. Torabi, N.; Gunay, H.B.; O’Brien, W.; Barton, T. Common human errors in design, installation, and operation of VAV AHU control systems–A review and a practitioner interview. Build. Environ. 2022, 221, 109333. [Google Scholar] [CrossRef]
  15. Park, K.; Lempert, C.; Abdullah, M.; Katakura, S.; Shigeyama, J.; Roumen, T.; Baudisch, P. FoolProofJoint: Reducing Assembly Errors of Laser Cut 3D Models by Means of Custom Joint Patterns. In Proceedings of the 2022 CHI Conference on Human Factors in Computing Systems, New Orleans, LA, USA, 29 April–5 May 2022; pp. 1–12. [Google Scholar]
  16. Gursel, E.; Reddy, B.; Khojandi, A.; Madadi, M.; Coble, J.B.; Agarwal, V.; Yadav, V.; Boring, R.L. Using artificial intelligence to detect human errors in nuclear power plants: A case in operation and maintenance. Nucl. Eng. Technol. 2023, 55, 603–622. [Google Scholar] [CrossRef]
  17. Wang, P.; Yang, Y.; Wen, B.; Ma, H.; Han, Q.; Luo, Z.; Li, X.; Wen, B. Numerical and experimental analysis of vibration characteristics of spindle system under bearing assembly errors. Mech. Based Des. Struct. Mach. 2023, 1–28. [Google Scholar] [CrossRef]
  18. Miao, H.; Wang, C.; Li, C.; Yao, G.; Zhang, X.; Liu, Z.; Xu, M. Dynamic modeling and nonlinear vibration analysis of spindle system during ball end milling process. Int. J. Adv. Manuf. Technol. 2022, 121, 7867–7889. [Google Scholar] [CrossRef]
  19. Xu, H.; Wang, P.; Ma, H.; Yang, Y.; Li, X.; Luo, Z.; Han, Q.; Wen, B. Dynamic behaviors and contact characteristics of ball bearings in a multi-supported rotor system under the effects of 3D clearance fit. Mech. Syst. Signal Process. 2023, 196, 110334. [Google Scholar] [CrossRef]
  20. Farhadi, S.; Mohammadfam, I.; Kalatpour, O.; Ghasemi, F. Determining performance shaping factors to assess human error in the emergency response team in chemical process industries: A case study. Int. J. Occup. Saf. Ergon. 2023, 29, 294–305. [Google Scholar] [CrossRef] [PubMed]
  21. Wong, Y.C.; Wong, K.Y.; Ali, A. Key practice areas of lean manufacturing. In Proceedings of the 2009 International Association of Computer Science and Information Technology-Spring Conference, Singapore, 17–20 April 2009; pp. 267–271. [Google Scholar]
  22. Weyer, S.; Schmitt, M.; Ohmer, M.; Gorecky, D. Towards Industry 4.0-Standardization as the crucial challenge for highly modular, multi-vendor production systems. IFAC-PapersOnLine 2015, 48, 579–584. [Google Scholar] [CrossRef]
  23. Thoben, K.-D.; Wiesner, S.; Wuest, T. “Industrie 4.0” and smart manufacturing-a review of research issues and application examples. Int. J. Autom. Technol. 2017, 11, 4–16. [Google Scholar] [CrossRef]
  24. Lopez, R.; Love, P.E.; Edwards, D.J.; Davis, P.R. Design error classification, causation, and prevention in construction engineering. J. Perform. Constr. Facil. 2010, 24, 399–408. [Google Scholar] [CrossRef]
  25. Mohammadfam, I.; Khajevandi, A.A.; Dehghani, H.; Babamiri, M.; Farhadian, M. Analysis of factors affecting human reliability in the mining process design using Fuzzy Delphi and DEMATEL methods. Sustainability 2022, 14, 8168. [Google Scholar] [CrossRef]
  26. Noman, M.A.; Alqahtani, F.M.; Al-Harkan, I.; Alabdulkarim, S.A.; Alasim, F. A New Integrated Risk-Assessment Model for Minimizing Human-Machine Error Consequences in a Preventive Maintenance System. IEEE Access 2023, 11, 25253–25265. [Google Scholar] [CrossRef]
  27. Torres, Y.; Nadeau, S.; Landau, K. Applying AcciMap and STAMP to the analysis of human error in complex manual assembly. Hum. Factors Ergon. Manuf. Serv. Ind. 2022, 32, 462–481. [Google Scholar] [CrossRef]
  28. Saptari, A.; Leau, J.X.; Mohamad, N.A. The effect of time pressure, working position, component bin position and gender on human error in manual assembly line. In Proceedings of the 2015 International Conference on Industrial Engineering and Operations Management (IEOM), Dubai, United Arab Emirates, 3–5 March 2015; pp. 1–6. [Google Scholar]
  29. Nordqvist, M.; Lindblom, J. Operators’ Experience of Trust in Manual Assembly with a Collaborative Robot. In Proceedings of the 6th International Conference on Human-Agent Interaction, Southampton, UK, 15–18 December 2018; pp. 341–343. [Google Scholar]
  30. Müller, B.C.; Reise, C.; Duc, B.M.; Seliger, G. Simulation-games for learning conducive workplaces: A case study for manual assembly. Procedia CIRP 2016, 40, 353–358. [Google Scholar] [CrossRef]
  31. Lavric, T.; Bricard, E.; Preda, M.; Zaharia, T. Exploring low-cost visual assets for conveying assembly instructions in AR. In Proceedings of the 2021 International Conference on INnovations in Intelligent SysTems and Applications (INISTA), Kocaeli, Turkey, 25–27 August 2021; pp. 1–6. [Google Scholar]
  32. Lavric, T. Methodologies and Tools for Expert Knowledge Sharing in Manual Assembly Industries by Using Augmented Reality. Ph.D. Thesis, Institut Polytechnique de Paris, Palaiseau, France, 2022. [Google Scholar]
  33. Miqueo, A.; Torralba, M.; Yagüe-Fabra, J.A. Lean manual assembly 4.0: A systematic review. Appl. Sci. 2020, 10, 8555. [Google Scholar] [CrossRef]
  34. Krugh, M.; Garimella, R.S.; Baburaj, A.; Wescoat, E.; Mears, L. Closed loop feedback mechanism effect pilot investigation on manual assembly time and process variation. Procedia Manuf. 2020, 48, 95–104. [Google Scholar] [CrossRef]
  35. Morais, C.; Estrada-Lugo, H.D.; Tolo, S.; Jacques, T.; Moura, R.; Beer, M.; Patelli, E. Robust data-driven human reliability analysis using credal networks. Reliab. Eng. Syst. Saf. 2022, 218, 107990. [Google Scholar] [CrossRef]
  36. Rafieyan, A.; Sarvari, H.; Beer, M.; Chan, D.W. Determining the effective factors leading to incidence of human error accidents in industrial parks construction projects: Results of a fuzzy Delphi survey. Int. J. Constr. Manag. 2022, 1–13. [Google Scholar] [CrossRef]
  37. Dhanalakshmi, C.S.; Madhu, P.; Hemachandran, M.N.; Muthukumar, M.V.; Arvinth, L.H. Design and Fabrication of Robotic Arm for the assembly of Phase Selector Switch. IOP Conf. Ser. Mater. Sci. Eng. 2021, 1059, 012032. [Google Scholar] [CrossRef]
  38. Mohammadfam, I.; Aliabadi, M.M.; Soltanian, A.R.; Tabibzadeh, M.; Mahdinia, M. Investigating interactions among vital variables affecting situation awareness based on Fuzzy DEMATEL method. Int. J. Ind. Ergon. 2019, 74, 102842. [Google Scholar] [CrossRef]
  39. Chan, D.W.; Baghbaderani, A.B.; Sarvari, H. An empirical study of the human error-related factors leading to site accidents in the Iranian urban construction industry. Buildings 2022, 12, 1858. [Google Scholar] [CrossRef]
  40. Liu, L.; Liu, Y.; Zhang, J. Learning-based hand motion capture and understanding in assembly process. IEEE Trans. Ind. Electron. 2018, 66, 9703–9712. [Google Scholar] [CrossRef]
  41. Winkelhake, U. Challenges in the digital transformation of the automotive industry. ATZ Worldw. 2019, 121, 36–43. [Google Scholar] [CrossRef]
  42. Wang, Z.; Bai, X.; Zhang, S.; Billinghurst, M.; He, W.; Wang, P.; Lan, W.; Min, H.; Chen, Y. A comprehensive review of augmented reality-based instruction in manual assembly, training and repair. Robot. Comput.-Integr. Manuf. 2022, 78, 102407. [Google Scholar] [CrossRef]
  43. Bläsing, D.; Bornewasser, M. Influence of increasing task complexity and use of informational assistance systems on mental workload. Brain Sci. 2021, 11, 102. [Google Scholar] [CrossRef] [PubMed]
  44. Fruggiero, F.; Fera, M.; Iannone, R.; Lambiase, A. Revealing a frame to incorporate safe human behaviour in assembly processes. IFAC-PapersOnLine 2018, 51, 661–668. [Google Scholar] [CrossRef]
  45. Pankok, C., Jr.; Zahabi, M.; Zhang, W.; Choi, I.; Liao, Y.-F.; Nam, C.S.; Kaber, D. The effects of interruption similarity and complexity on performance in a simulated visual-manual assembly operation. Appl. Ergon. 2017, 59, 94–103. [Google Scholar] [CrossRef]
  46. Turk, M.; Pipan, M.; Šimic, M.; Herakovič, N. Simulation-based time evaluation of basic manual assembly tasks. Adv. Prod. Eng. Manag. 2020, 15, 331–344. [Google Scholar] [CrossRef]
  47. Kolbeinsson, A.; Thorvald, P.; Lindblom, J. Coordinating the interruption of assembly workers in manufacturing. Appl. Ergon. 2017, 58, 361–371. [Google Scholar] [CrossRef]
  48. Ribbe, M.W.; Górecki, K.; Grosch, M.; Solomon, J.B.; Quechol, R.; Liu, Y.A.; Lee, C.C.; Hu, Y. Nitrogenase Fe Protein: A Multi-Tasking Player in Substrate Reduction and Metallocluster Assembly. Molecules 2022, 27, 6743. [Google Scholar] [CrossRef]
  49. Bläsing, D.; Bornewasser, M. Influence of complexity and noise on mental workload during a manual assembly task. In Proceedings of the Human Mental Workload: Models and Applications: 4th International Symposium, H-WORKLOAD 2020, Granada, Spain, 3–5 December 2020; Proceedings 4; pp. 147–174. [Google Scholar]
  50. Anghel, D.-C.; Niţu, E.-L.; Rizea, A.-D.; Gavriluţă, A.; Gavriluţă, A.; Belu, N. Ergonomics study on an assembly line used in the automotive industry. MATEC Web Conf. 2019, 290, 12001. [Google Scholar] [CrossRef]
  51. Taherdoost, H.; Madanchian, M. Multi-criteria decision making (MCDM) methods and concepts. Encyclopedia 2023, 3, 77–87. [Google Scholar] [CrossRef]
  52. Saaty, R.W. The analytic hierarchy process—What it is and how it is used. Math. Model. 1987, 9, 161–176. [Google Scholar] [CrossRef]
  53. Charnes, A.; Cooper, W.W.; Rhodes, E. Measuring the efficiency of decision making units. Eur. J. Oper. Res. 1978, 2, 429–444. [Google Scholar] [CrossRef]
  54. Zadeh, L.A. Fuzzy sets. Inf. Control 1965, 8, 338–353. [Google Scholar] [CrossRef]
  55. Hwang, C.-L.; Yoon, K. Methods for multiple attribute decision making. In Multiple Attribute Decision Making: Methods and Applications a State-of-the-Art Survey; Springer: Berlin/Heidelberg, Germany, 1981; pp. 58–191. [Google Scholar]
  56. Charnes, A.; Cooper, W.W. Management models and industrial applications of linear programming. Manag. Sci. 1957, 4, 38–91. [Google Scholar] [CrossRef]
  57. Kolodner, J.L. Understanding creativity: A case-based approach. In European Workshop on Case-Based Reasoning, Proceedings of the Topics in Case-Based Reasoning, First European Workshop, EWCBR-93, Kaiserslautern, Germany, 1–5 November 1993; Springer: Berlin/Heidelberg, Germany, 1994; pp. 1–20. [Google Scholar]
  58. Ju-Long, D. Control problems of grey systems. Syst. Control Lett. 1982, 1, 288–294. [Google Scholar] [CrossRef]
  59. Saaty, T.L. Decision Making with Dependence and Feedback: The Analytic Network Process; RWS Publications: Pittsburgh, PA, USA, 1996; Volume 4922. [Google Scholar]
  60. Van Laarhoven, P.J.; Pedrycz, W. A fuzzy extension of Saaty’s priority theory. Fuzzy Sets Syst. 1983, 11, 229–241. [Google Scholar] [CrossRef]
  61. Benayoun, R.; Roy, B.; Sussman, N. Manual de Reference du Programme Electre; Note de Synthese et Formation 25; Direction Scientifique SEMA: Paris, France, 1966. [Google Scholar]
  62. Brans, J.-P.; Nadeau, R.; Landry, M. L’ingénierie de la décision. Elaboration d’instruments d’aide à la décision. La méthode PROMETHEE. In L’Aide à la Décision: Nature, Instruments et Perspectives d’Avenir; Presses de l’Université Laval: Québec, QC, Canada, 1982; pp. 183–213. [Google Scholar]
  63. Opricovic, S. Multicriteria optimization of civil engineering systems. Fac. Civ. Eng. Belgrade 1998, 2, 5–21. [Google Scholar]
  64. Chen, C.-T. Extensions of the TOPSIS for group decision-making under fuzzy environment. Fuzzy Sets Syst. 2000, 114, 1–9. [Google Scholar] [CrossRef]
  65. Gabus, A.; Fontela, E. World problems, an invitation to further thought within the framework of DEMATEL. Battelle Geneva Res. Cent. Geneva Switz. 1972, 1, 12–14. [Google Scholar]
  66. Matarazzo, B. Preference ranking global frequencies in multicriterion analysis (PRAGMA). Eur. J. Oper. Res. 1988, 36, 36–49. [Google Scholar] [CrossRef]
  67. Churchman, C.W.; Ackoff, R.L. An approximate measure of value. J. Oper. Res. Soc. Am. 1954, 2, 172–187. [Google Scholar] [CrossRef]
  68. Keeney, R.L.; Raiffa, H.; Rajala, D.W. Decisions with multiple objectives: Preferences and value trade-offs. IEEE Trans. Syst. Man Cybern. 1979, 9, 403. [Google Scholar] [CrossRef]
  69. Rezaei, J. Best-worst multi-criteria decision-making method. Omega 2015, 53, 49–57. [Google Scholar] [CrossRef]
  70. Edwards, W. The engineering economic summer symposium series. Soc. Util. 1971, 6, 119–129. [Google Scholar]
  71. Mikhailov, L.; Singh, M.G. Fuzzy analytic network process and its application to the development of decision support systems. IEEE Trans. Syst. Man Cybern. Part C (Appl. Rev.) 2003, 33, 33–41. [Google Scholar] [CrossRef]
  72. Wu, W.-W.; Lee, Y.-T. Developing global managers’ competencies using the fuzzy DEMATEL method. Expert Syst. Appl. 2007, 32, 499–507. [Google Scholar] [CrossRef]
  73. Yazdi, M.; Moradi, R.; Pirbalouti, R.G.; Zarei, E.; Li, H. Enabling Safe and Sustainable Hydrogen Mobility: Circular Economy-Driven Management of Hydrogen Vehicle Safety. Processes 2023, 11, 2730. [Google Scholar] [CrossRef]
  74. Häder, M.; Häder, S. Delphi und Kognitionspsychologie: Ein Zugang zur theoretischen Fundierung der Delphi-Methode. ZUMA Nachrichten 1995, 19, 8–34. [Google Scholar]
  75. Skulmoski, G.J.; Hartman, F.T.; Krahn, J. The Delphi method for graduate research. J. Inf. Technol. Educ. Res. 2007, 6, 1–21. [Google Scholar] [CrossRef] [PubMed]
  76. Boulkedid, R.; Abdoul, H.; Loustau, M.; Sibony, O.; Alberti, C. Using and reporting the Delphi method for selecting healthcare quality indicators: A systematic review. PLoS ONE 2011, 6, e20476. [Google Scholar] [CrossRef] [PubMed]
  77. Alghawli, A.S.A.; Al-khulaidi, A.A.; Nasser, A.A.; AL-Khulaidi, N.A.; Abass, F.A. Application of the Fuzzy Delphi Method to Identify and Prioritize the Social-Health Family Disintegration Indicators in Yemen. Int. J. Adv. Comput. Sci. Appl. 2022, 13, 680–691. [Google Scholar] [CrossRef]
  78. Roth, C.; Brewer, M.; Wieck, K.L. Using a Delphi method to identify human factors contributing to nursing errors. Nurs. Forum 2017, 52, 173–179. [Google Scholar] [CrossRef] [PubMed]
  79. Rafieyan, A.; Sarvari, H.; Chan, D.W. Identifying and evaluating the essential factors affecting the incidence of site accidents caused by human errors in industrial parks construction projects. Int. J. Environ. Res. Public Health 2022, 19, 10209. [Google Scholar] [CrossRef] [PubMed]
  80. Baker, J.; Lovell, K.; Harris, N. How expert are the experts? An exploration of the concept of ‘expert’within Delphi panel techniques. Nurse Res. 2006, 14, 59–70. [Google Scholar] [CrossRef] [PubMed]
  81. Mabrouk, N. Green supplier selection using fuzzy Delphi method for developing sustainable supply chain. Decis. Sci. Lett. 2021, 10, 63–70. [Google Scholar] [CrossRef]
  82. Akyuz, E.; Celik, E. A fuzzy DEMATEL method to evaluate critical operational hazards during gas freeing process in crude oil tankers. J. Loss Prev. Process Ind. 2015, 38, 243–253. [Google Scholar] [CrossRef]
  83. Lin, R.-J. Using fuzzy DEMATEL to evaluate the green supply chain management practices. J. Clean. Prod. 2013, 40, 32–39. [Google Scholar] [CrossRef]
  84. Fang, W.; Fu, M.; Zheng, L. Continuous ergonomic risk perception for manual assembly operations using wearable multi-sensor posture estimation. Assem. Autom. 2021, 42, 209–217. [Google Scholar] [CrossRef]
  85. Xiao, H.; Duan, Y.; Zhang, Z.; Li, M. Detection and estimation of mental fatigue in manual assembly process of complex products. Assem. Autom. 2017, 38, 239–247. [Google Scholar] [CrossRef]
  86. Yonga, T.; Kanakana-Katumba, G.; Mpofu, K.; Monzambe, G. Prediction of postural discomfort impact on manual assembly: A workshop case study. Procedia Manuf. 2020, 43, 583–589. [Google Scholar] [CrossRef]
  87. Tilindis, J.; Kleiza, V. Impact of vibrations to the human fatigue and manual assembly performance. J. Vibroeng. 2015, 17, 3919–3927. [Google Scholar]
Figure 1. Manual, hybrid, and automated assembly systems.
Symmetry 15 01967 g001
Figure 2. Research methodology.
Symmetry 15 01967 g002
Figure 3. Interaction between factors D i + R j values.
Symmetry 15 01967 g003
Figure 4. Cause – and – effect roles of the factors D i R j values.
Symmetry 15 01967 g004
Figure 5. Cause – and – effect relation diagram.
Symmetry 15 01967 g005
Table 1. Identification and classification of factors influencing human error.
CategoryInfluencing Factors Affecting HEs
Individual factorsGender [28], age [28], lack of experience [29], lack of knowledge [30,31,32,33,34], fatigue [25], stress [2], body physique [35], poor health [36], poor memory [36], personal life problems [36], personality type [25], disappointment [25], lack of motivation [25], depression [25], fear of failure [37], poor error visual error perception [25], financial problems [25,38], haste in doing work [39], low intelligence coefficient [25,38], job dissatisfaction [39], lack of trust in performance [25], misunderstanding [39], unintentional unsafe acts [39], sleep deprivation/disorder [6,27,40], risk-taking [41], and understanding roles and responsibilities [25,38].
Tool factorsLack of necessary tools and using inappropriate tools [36,39].
Task factorsPoor instructions and procedures [42], task complexity [43], time pressure [28], workload [2], repetitive task [35,44], and multitasking [45,46,47,48].
Organizational factorsPoor management type [25], lack of training [25], poor planning [39], poor organization culture [25], failure to address the error-causing problem [39], poor resource allocation [25,39], poor supervision [25,39], improper quality control [39], and poor communication between worker and organization [36,39].
Environmental factorsNoise [49,50], inappropriate lighting [49,50], improper temperature and humidity [49,50], poor indoor air quality [25], poor ergonomics design of the workplace [28], accessibility problems [25], and poor workplace layout [25].
Table 2. The twenty most-cited MCDM methods during 2012–2022 [51].
MethodDescriptionReference
AHPIt decomposes complex decision problems into a hierarchical structure, allowing pairwise comparisons of criteria and alternatives.Saaty [52]
DEAIt is a non-parametric technique that evaluates the relative efficiency of alternatives in relation to multiple criteria.Charnes and William [53]
FSTDealing with decision-making in the presence of uncertainty and imprecise data by representing degrees of membership and non-membership using fuzzy sets.Zadeh [54]
TOPSISIt compares alternatives against ideal and anti-ideal solutions based on multiple criteria.Hwang et al. [55]
GPIt is an optimization-based technique aiming to simultaneously achieve multiple goals or objectives.Charnes and William [56]
CBRIt involves solving new decision problems by retrieving and adapting solutions from similar historical cases.Kolodner [57]
GRA/GRMMeasuring the relationship between alternatives and criteria by analyzing the grey correlation coefficients.Deng [58]
ANPIt extends the AHP to handle dependencies and feedback among criteria and alternatives.Thomas [59]
FUZZY AHPIt extends the AHP method by incorporating fuzzy logic to handle uncertainties and vagueness in decision-making.Laarhoven and Pedrycs [60]
ELECTREIt eliminates alternatives that do not meet certain criteria thresholds and ranks the remaining ones.Benayoun et al. [61]
PROMETHEEIt evaluates alternatives by considering criteria and decision-maker’s preferences.Brans et al. [62]
VIKORIdentifying the compromise solution among alternatives.Opricovic [63]
FUZZY TOPSISBased on TOPSIS under a fuzzy environment.Chen [64]
DEMATELAnalyzing causal relationships relationships/interdependence among different criteria.Gabus and Fontela [65]
PRAGMAIt aggregates individual preferences to determine a collective ranking of alternatives.Matarazzo [66]
SAWIt aggregates criteria scores by applying weights and sums them to obtain a total score for each alternative.Churchman and Ackoff [67]
MAUTIt quantifies the preferences of decision-makers by assigning utility functions to criteria and alternatives.Keeney et al. [68]
BWMIt is a technique for ranking and prioritizing criteria based on their relative importance or preference.Rezaei [69]
SMARTIt combines weighted scores of criteria to evaluate and rank alternatives.Edwards [70]
Fuzzy ANPFuzzy expression of criteria weights in ANP method.Ludmil and Madan [71]
Note: AHP: Analytic Hierarchy Process; DEA: Data Envelopment Analysis; FST: Fuzzy Set Theory; TOPSIS: Technique for Order of Preference by Similarity to Ideal Solution; GP: Goal Programming; CBR: Case-Based Reasoning; GRA/GRM: Grey Relational Analysis/Grey Relational Model; ANP: Analytic Network Process; ELECTRE: Elimination Et Choice Translating Reality; PRO-METHEE: Preference Ranking Organization Method for Enrichment of Evaluations; VIKOR: VIseKriterijumska Optimizacija I Kompromisno Resenje; DEMATEL: Decision-Making Trial and Evaluation Laboratory; PRAGMA: Preference Ranking Global Frequencies in Multicriterion Analysis; SAW: Simple Additive Weighting; MAUT: Multi-Attribute Utility Theory; BWM: Best–Worst Method; and SMART: Simple Multi-Attribute Rating Technique.
Table 3. The demographic data of the experts who participated in the study.
CharacteristicIdentifierDelphi StudyDEMATEL Study
Number (%)Number (%)
GenderMale25 (78.1)10 (66.7)
Female7 (21.9)5 (33.3)
Age<35 years old6 (18.7)5 (33.3)
36–50 years old23 (71.9)7 (46.7)
>50 years old3 (9.4)3 (20.0)
Education levelBachler14 (43.8)7 (46.7)
Master9 (28.1)6 (40.0)
Doctoral9 (28.1)2 (13.3)
Experience in manual assembly10–15 years24 (75)5 (33.3)
16–20 years3 (9.4)4 (26.7)
21–25 years2 (6.2)4 (26.7)
>25 years3 (9.4)2 (13.3)
Job positionAcademic16 (50.0)6 (40.0)
Assembly worker13 (40.6)6 (40.0)
Industrial engineer: production manager, safety manager, and production supervisor.3 (9.4)3 (20.0)
Table 4. Linguistic terms and corresponding TFNs [25,36,81].
SymbolLinguistic TermsTFNs ( a , b , c )
VLVery low influence(0, 0, 0.25)
LLow influence(0, 0.25, 0.5)
MModerate influence(0.25, 0.5, 0.75)
HHigh influence(0.5, 0.75, 1)
VHVery high influence(0.75, 1, 1)
Table 5. Reliability analysis of the questionnaire.
Main FactorsNumber of Items Cronbach s   α Value Cronbach s   α Value of
All Factors
Individual factors260.910.91
Tool factors20.79
Task factors60.71
Organizational factors90.86
Environmental factors80.83
Table 6. Descriptive statistics of the factors affecting HEs in the assembly processes.
Main FactorsMeanSDModeMedianSkewness
Individual factors3.7150.22434−0.33
Tool factors4.0930.447440.12
Task factors4.1400.26444−0.50
Organizational factors3.5800.34033−0.14
Environmental factors3.6440.23544−0.07
Table 7. Normality estimation of survey using the Shapiro–Wilk test.
Main FactorsShapiro–Wilk Test α Hypothesis ConfirmationNormal Distribution
Sig.Statistics
Individual factors0.0850.9420.05 H 0 Yes
Tool factors0.1200.9960.05 H 0 Yes
Task factors0.1100.9920.05 H 0 Yes
Organizational factors0.1000.9800.05 H 0 Yes
Environmental factors0.3800.9610.05 H 0 Yes
Table 8. One-sample t-test results of the factors affecting HEs in manual assembly processes.
Main FactorMeanSDTest Value = 3Lower LimitUpper Limit
dfTp-Value
Individual factors3.7150.2243118.0460.0010.6340.795
Tool factors4.0930.4473113.8140.0010.9321.255
Task factors4.1400.2643124.3720.0011.0451.236
Organizational factors3.5800.340319.6280.0010.4570.702
Environmental factors3.6440.2353115.4690.0010.5590.729
Table 9. The most important factors affecting HEs in the manual assembly processes.
SubgroupAffecting FactorsIndex S j E A j
Individual factorsLack of experienceF10.88100%
MisunderstandingF20.83100%
Lack of knowledgeF30.8294%
Poor error visual perceptionF40.8291%
Risk-takingF50.82100%
Poor memoryF60.8191%
FatigueF70.7888%
StressF80.7894%
Non-understanding roles and responsibilitiesF90.7894%
Unintentional unsafe actsF100.7888%
Haste in doing workF110.7684%
Poor healthF120.7581%
Low intelligence coefficientF130.7481%
Tool factorsUsing inappropriate toolsF140.7694%
Lack of necessary toolsF150.7581%
Task factorsPoor instructions and proceduresF160.8597%
Task complexityF170.8294%
Time pressureF180.8197%
WorkloadF190.7588%
MultitaskingF200.7178%
Organizational factorsLack of trainingF210.82100%
Poor supervisionF220.7488%
Failure to address the error-causing problemF230.7078%
Environmental factorsInappropriate lightingF240.7588%
NoiseF250.7375%
Poor ergonomics design of the workplaceF260.7278%
Poor workplace layoutF270.7278%
Table 10. A pairwise-matrix shows an example of original data from one of the experts.
FactorF1F2F3F4F5F6F7F8F9F10F11F12F13F14F15F16F17F18F19F20F21F22F23F24F25F26F27
F1 VHVHHHHVHHHHHLVHHLMHVLHVHHLVHLVLLL
F2VL VHHHVHHMLHHMVHHLLLVLHMLLVHVLVLLVL
F3VHVH HVHHVHHHHVHLVHHVLLHVLHHMMVHVLVLLL
F4LHL LLLLLVLVLVLLLLVLVLVLMMLVLHLLVLVL
F5LMHH LLLVLHHVLMLVLLVLVLLVLVLVLHVLVLVLVL
F6HVHHHH VHHVHHHHHHLMLVLHHLLVHVLVLVLVL
F7LMLHLM HMLMHMMMLVLVLMLLLVHVLVLLL
F8MHMHHHVH MHHMMHVLLVLLMLLLVHVLVLLL
F9LVHLVHHVLVHVH VHVHVLVLMVLMHMHVLVLVLVHVLVLVLVL
F10VLLVLLHLLLVL HHLMLMVLVLLLLLHVLVLVLVL
F11LLLHHLHHVLM LLHLHVLLHMLLHVLVLVLVL
F12HHHHHVHHMHMM VHMLMVLVLHMLLHVLVLVLVL
F13HHVHVHHHHHHHHL HLMLVLMLLLHVLVLVLVL
F14HMHVHMMHHMHLHH LHHHHLLLVHVLVLLL
F15LHLVHMMVHHVLHMLLH HHHHMLLVHVLVLLL
F16LHLVHHMHHVHHMLLHVL VHHHLVLVLVHVLVLVLVL
F17VLVHVLVHLLVHVHHVHMVLVLMLH VHVHHVLVLVHVLVLVLVL
F18VLVHVLVHVHVLVHVHMVHVHVLVLHVLVLVL VHVLVLVLVHVLVLVLVL
F19LHLHHMHVHVLMMLLLLLVLVL LVLVLVHVLVLLL
F20VLHLVHVLVLVHVHHHLVLLVLVLLVHVHVH VLVLHVLVLVLVL
F21HVHVHVHHHHHVHHMVLMHLLHVHHL LHVLVLVLVL
F22VLHMMMLMLVHHMLVLHLHHHVLVLL HVLVLVLVL
F23VLLVLMVLVLVLVLVLHLVLVLLLMVLVLLLVLVL VLVLVLVL
F24VLVLHVHLVLHMLMLVLVLHVLHMHHVLVLVLL VLML
F25VLVLHMVLVLMVHLVLVLVLVLVLVLVLLHHVLVLVLHVL HL
F26VLVLVLHVLVLVHHLLLHVLLVLLLHHVLVLVLHVLVL M
F27VLVLLHVLVLHMLMLMVLLLHLHHLHHHMHH
Table 11. The total relation matrix shows the relationships between factors.
FactorF1F2F3F4F5F6F7F8F9F10F11F12F13F14F15F16F17F18F19F20F21F22F23F24F25F26F27
F10.000.170.130.130.150.120.190.160.130.160.150.070.140.140.050.100.120.050.160.130.080.040.160.030.030.040.03
F20.060.000.120.110.130.120.150.110.070.130.130.070.130.120.040.070.050.040.130.080.040.040.130.010.010.020.01
F30.110.170.000.130.160.120.180.150.120.160.160.070.140.130.030.080.100.050.150.110.060.060.150.010.010.030.03
F40.040.090.040.000.050.040.060.060.040.040.030.020.040.040.030.020.020.020.070.050.030.010.070.020.020.010.01
F50.040.070.080.070.000.050.060.060.030.090.090.020.060.050.010.040.020.030.060.030.010.010.080.010.010.010.01
F60.110.170.120.120.140.000.180.150.140.150.140.100.120.130.050.090.060.040.150.100.050.040.150.010.010.020.02
F70.050.100.060.090.070.080.000.110.080.080.090.080.070.080.050.060.030.040.090.050.030.030.110.010.010.030.02
F80.070.120.090.100.120.100.150.000.080.120.120.070.090.110.020.060.040.040.100.060.040.030.120.010.010.030.03
F90.050.130.060.100.110.050.140.130.000.120.130.030.040.070.020.070.080.040.110.040.020.020.110.010.010.010.01
F100.030.060.030.040.090.050.060.060.030.000.090.070.050.070.030.060.020.030.060.040.030.020.080.010.010.010.01
F110.050.070.060.090.100.060.120.110.040.100.000.050.060.100.030.090.030.040.110.060.030.030.100.010.010.010.01
F120.100.140.120.110.130.130.150.120.110.120.110.000.130.100.040.090.050.040.130.080.040.040.120.010.020.020.02
F130.100.140.130.120.130.110.150.130.110.140.130.060.000.120.040.090.050.040.110.060.040.040.120.010.010.020.01
F140.100.130.110.130.120.100.160.140.110.150.100.100.110.000.040.110.100.090.140.070.040.040.140.010.010.030.03
F150.060.130.070.120.100.090.160.130.060.130.100.060.070.120.000.100.090.090.130.080.040.030.130.010.010.030.03
F160.060.130.070.120.120.080.140.130.120.130.110.060.070.110.020.000.100.080.130.060.020.020.130.010.010.010.01
F170.040.140.050.110.070.060.150.140.100.140.100.040.050.090.040.100.000.100.140.080.020.020.120.010.010.020.01
F180.040.120.050.090.110.040.130.120.070.110.120.030.040.080.020.040.030.000.120.030.020.010.100.010.010.010.01
F190.050.100.060.080.100.070.110.120.040.090.080.050.060.060.030.050.030.020.000.050.020.010.100.010.010.030.02
F200.040.120.050.100.060.040.140.130.090.120.070.030.050.050.020.050.090.100.130.000.020.010.100.010.010.010.01
F210.110.170.140.130.140.120.170.150.130.150.130.050.100.130.040.080.100.110.150.070.000.040.140.010.010.020.02
F220.050.120.080.080.090.060.110.080.110.120.100.050.040.110.040.100.090.080.070.040.030.000.100.010.010.020.01
F230.020.040.010.040.020.010.030.030.010.070.030.010.010.030.020.040.010.030.040.030.010.000.000.000.000.010.00
F240.040.060.080.090.070.040.120.080.050.090.070.030.040.090.020.080.060.080.110.030.020.010.060.000.010.040.03
F250.030.040.070.050.040.030.080.100.040.040.040.020.020.030.010.020.030.070.090.020.010.010.080.000.000.060.02
F260.030.050.030.080.040.030.120.100.050.060.060.070.030.050.010.040.040.080.100.020.010.010.080.000.010.000.03
F270.040.070.060.100.060.040.130.100.060.100.080.070.040.070.030.090.060.100.120.050.070.070.100.040.060.070.00
Table 12. The prominence and relation axis for the cause and effect group.
Affecting FactorsIndex D i R j D i + R j D i R j Category
Lack of experienceF13.1241.6164.7411.508Cause
MisunderstandingF22.6592.8435.502−0.184Effect
Lack of knowledgeF32.9592.0785.0370.881Cause
Poor error visual perceptionF41.2202.4343.655−1.214Effect
Risk-takingF51.1702.7193.890−1.549Effect
Poor memoryF62.9402.2165.1560.724Cause
FatigueF72.0003.5565.555−1.556Effect
StressF82.3623.0605.422−0.698Effect
Non-understanding roles and responsibilitiesF92.3513.3265.677−0.975Effect
Unintentional unsafe actsF101.2943.0274.322−1.733Effect
Haste in doing workF112.0382.4754.513−0.438Effect
Poor healthF122.5301.5304.0601.000Cause
Low intelligence coefficientF132.5081.9484.4560.560Cause
Using inappropriate toolsF142.5212.4895.0100.032Cause
Lack of necessary toolsF152.3470.9643.3111.384Cause
Poor instructions and proceduresF162.2182.1254.3430.093Cause
Task complexityF171.8432.9564.798−1.113Cause
Time pressureF182.1422.6794.822−0.537Cause
WorkloadF191.8563.0734.929−1.217Effect
MultitaskingF201.7691.6443.4130.125Cause
Lack of trainingF212.6920.9373.6301.755Cause
Poor supervisionF221.7070.8012.5070.906Cause
Failure to address the error-causing problemF230.7162.9113.627−2.195Effect
Inappropriate lightingF241.5650.3261.8921.239Cause
NoiseF251.2840.3901.6730.894Cause
Poor ergonomics design of the workplaceF261.3430.6521.9960.691Cause
Poor workplace layoutF272.1110.4962.6071.616Cause
Table 13. A framework of cause-and-effect relationships among factors.
FactorF1F2F3F4F5F6F7F8F9F10F11F12F13F14F15F16F17F18F19F20F21F22F23F24F25F26F27
F1Affects on
Affected by
F2Affects on
Affected by
F3Affects on
Affected by
F4Affects on
Affected by
F5Affects on
Affected by
F6Affects on
Affected by
F7Affects on
Affected by
F8Affects on
Affected by
F9Affects on
Affected by
F10Affects on
Affected by
F11Affects on
Affected by
F12Affects on
Affected by
F13Affects on
Affected by
F14Affects on
Affected by
F15Affects on
Affected by
F16Affects on
Affected by
F17Affects on
Affected by
F18Affects on
Affected by
F19Affects on
Affected by
F20Affects on
Affected by
F21Affects on
Affected by
F22Affects on
Affected by
F23Affects on
Affected by
F24Affects on
Affected by
F25Affects on
Affected by
F26Affects on
Affected by
F27Affects on
Affected by
Disclaimer/Publisher’s Note: The statements, opinions and data contained in all publications are solely those of the individual author(s) and contributor(s) and not of MDPI and/or the editor(s). MDPI and/or the editor(s) disclaim responsibility for any injury to people or property resulting from any ideas, methods, instructions or products referred to in the content.

