Article

Wind-Induced Vibrations and Gust Response Factors of the Cabin–Cable–Tower System

1
Faculty of Infrastructure Engineering, Dalian University of Technology, Dalian 116023, China
2
National Astronomical Observatories, Chinese Academy of Sciences, Beijing 100012, China
*
Author to whom correspondence should be addressed.
Symmetry 2023, 15(11), 1965; https://doi.org/10.3390/sym15111965
Submission received: 13 September 2023 / Revised: 16 October 2023 / Accepted: 19 October 2023 / Published: 24 October 2023
(This article belongs to the Special Issue Advances in Structural Mechanics and Symmetry/Asymmetry)

Abstract

:
A large-scale radio astronomical telescope is a typical complex coupled system, consisting of a feed cabin, cables, and supporting structures. The system is extremely sensitive to wind loads, especially the feed cabin, which has high requirements for vibration displacement during operation, and excessive vibration may affect normal operation. To investigate the wind-induced vibration characteristics of such coupled systems, this study takes the Five-hundred-meter Aperture Spherical Radio Telescope (FAST) as an example to conduct research. First, a refined finite element model of FAST is established, and a dynamic analysis using simulated random wind loads is conducted. The influence of the cable boundary on the time–frequency domain responses of the feed cabin is particularly considered. Then, the gust response factor (GRF) for different structural components within the coupled system is calculated. Finally, the evolution law of the GRF under various wind speeds and directions is revealed by parametric analysis. The parameter analysis only considers the wind directions ranging from 0° to 60°, because FAST is a symmetric structure. The results indicate that obvious differences are observed in both the rotational and translational displacements of the feed cabin under northward wind, especially the results along the east–west axis. When the supporting towers are considered, there is no change in the power spectral density (PSD) of the feed cabin in the low-frequency range. However, in the high-frequency range, taking the supporting towers into account leads to an increase in PSD and a resonance near the first-order natural frequency of the supporting tower. The GRF based on the dynamic response exhibits substantial deviations compared to those obtained from design codes, highlighting the need for an independent analysis when determining GRF for such coupled systems.

1. Introduction

To observe and investigate radio waves from celestial bodies, numerous radio astronomical telescopes have been constructed worldwide. The basic principles of classical radio telescopes are similar to those of optical reflecting telescopes. They reflect the electromagnetic waves from celestial bodies through mirror surfaces and make all electromagnetic waves converge at a focus. Typically, the farther the distance between the transmitter and receiver, the more signal attenuation there is. Therefore, if one wishes to capture signals emitted by celestial bodies at a considerable distance from Earth, it is necessary to build larger radio telescopes to enhance the captured signals. Currently, the well-known radio astronomical telescopes are the Arecibo Telescope in the U.S. and the Five-hundred-meter Aperture Spherical Radio Telescope (FAST) in China [1]. However, the suspension cables of the Arecibo Telescope were damaged due to hurricanes, which led to the collapse of the entire project [2]. This incident drew attention from scholars regarding the wind-resistance performance of such structures. For a large-scale radio astronomical telescope, lattice towers usually serve as the main supporting structure, and the feed cabin for receiving reflected signals is suspended on the focus of the reflecting surface by cables. The cables connect the feed cabin with the supporting tower to form a complex coupled system, that is, the cabin–cable–tower (CCT) system. Among them, the feed cabin is the most crucial component. Due to weight restrictions, the feed cabin exhibits relatively low rigidity [3], making it highly sensitive to wind loads. Simultaneously, the feed cabin has specific displacement requirements during operation because excessive wind-induced vibrations may affect its normal functioning [4]. From the aforementioned points, it can be concluded that a large-scale radio astronomical telescope belongs to the category of flexible spatial structures, and wind loads constitute the controlling load that impacts their normal operation and structural safety [5,6]. Moreover, the construction cost of such structures is typically significant, and any wind-induced damage would result in unacceptable catastrophic losses, underscoring the necessity to study the wind-induced vibration characteristics of the CCT system.
The supporting tower in the CCT system is a typical wind-sensitive structure. In recent years, scholars have conducted extensive research on the wind-resistance performance of such structures. Tian et al. [7] performed full-scale tests on a latticed steel tubular transmission tower with an emphasis on the failure mechanism of the tower under extreme wind load, and the results illustrated that the developed buckling and softening failure model can accurately reproduce the displacements, ultimate capacity, and failure mechanism of the transmission tower. Zhang et al. [8] developed a refined brace element to have the capacities of considering several failure modes in a member, such as the inelastic compression buckling, tension yielding, and fractures, which are helpful to accurately capture the nonlinear behavior of transmission towers subjected to downburst loading. Unlike a single tower, the CCT system connects several supporting towers through several cables, forming a complex coupled system. A similar structure to the CCT system is the transmission tower-line system, where the lattice towers are connected by conductors in a linear distribution, resulting in a tower-line coupled system. Liang et al. [9] developed a complete aeroelastic model for a 500 kV transmission tower-line system and found that the first natural frequency of the tower decreases significantly after installing conductors by identifying the modal parameters with and without power lines. Zhang et al. [10] investigated the evolution laws of modal parameters using the stochastic subspace identification algorithm, revealing that the conductor has a significant impact on the dynamic characteristic in the direction along the line but hardly affects the result in the direction along the transverse direction. The difference between the transmission tower-line system and the CCT system lies in the fact that the tower structure in the CCT system is only subjected to unilateral cable tension, resulting in significant initial imbalance forces, while the transmission line experiences symmetric loads, allowing the longitudinal tensions of adjacent conductors to balance each other. Although the CCT system has a good mechanical and geometric symmetry, it has many cables, leading to a more pronounced coupled effect than the tower-line system, making it necessary to study its coupled characteristics. However, there is currently limited research on the wind-induced vibration characteristics of such complex coupled systems, and existing studies have overlooked the influence of supporting towers on the system, which may introduce significant errors in wind-induced vibration analysis.
In practical wind-resistant design, engineers pay more attention to the design wind load. To account for the influence of random fluctuating wind loads in the static design, it is common to simplify the design wind load as the equivalent static wind load (ESWL). This approach assumes that the static response under ESWL equals the peak response under the actual dynamic wind load. Therefore, accurately estimating the mean wind load and the dynamic wind effect is crucial in determining the ESWL. Approaches for determining the ESWL include the load–response–correlation method [11], the gust load envelope method [12], and the gust response factor (GRF) method [13], among which the GRF method has been widely adopted due to its convenience. Generally, the GRFs for individual structures and coupled systems are not consistent. To shed light on the disparities between them, many scholars have conducted related research in recent years. Deng et al. [14] constructed an aeroelastic model of a transmission tower-line system and examined its wind-induced vibration characteristics through wind tunnel tests. The results revealed that the first-order natural frequency of a single tower was slightly higher than that of the tower-line system, but its damping ratio was smaller, and the GRF at the cross-arm significantly increased. However, there is currently no research on the ESWL of complex coupled systems such as the CCT system.
The aforementioned studies illustrated that scholars have conducted much research on the performance assessment of lattice towers and tower-line systems, providing valuable foundations for wind-resistance design. However, there is a gap in the research on the wind-induced vibration characteristics and GRFs of complex coupled systems, such as the radio astronomy telescope system. To address this challenge, this paper first established a refined finite element model (FEM) of the CCT coupled system in Section 2, during which the Five-hundred-meter Aperture Spherical Radio Telescope (FAST) is taken as an example. In Section 3, the response of the CCT coupled system under wind load is studied based on the stochastic simulation of the wind field, with a particular focus on the influence of coupled effects on the time–frequency domain responses of the feed cabin. Section 4 introduces the fundamental theory of the GRF method. In Section 5, a systematic parameter analysis of the GRFs of different components in the CCT system is conducted, revealing the evolutionary patterns under varying wind speeds and directions. Finally, Section 6 summarizes the findings and conclusions of this study. For the convenience of readers’ understanding, Figure 1 presents the flowchart of this study.

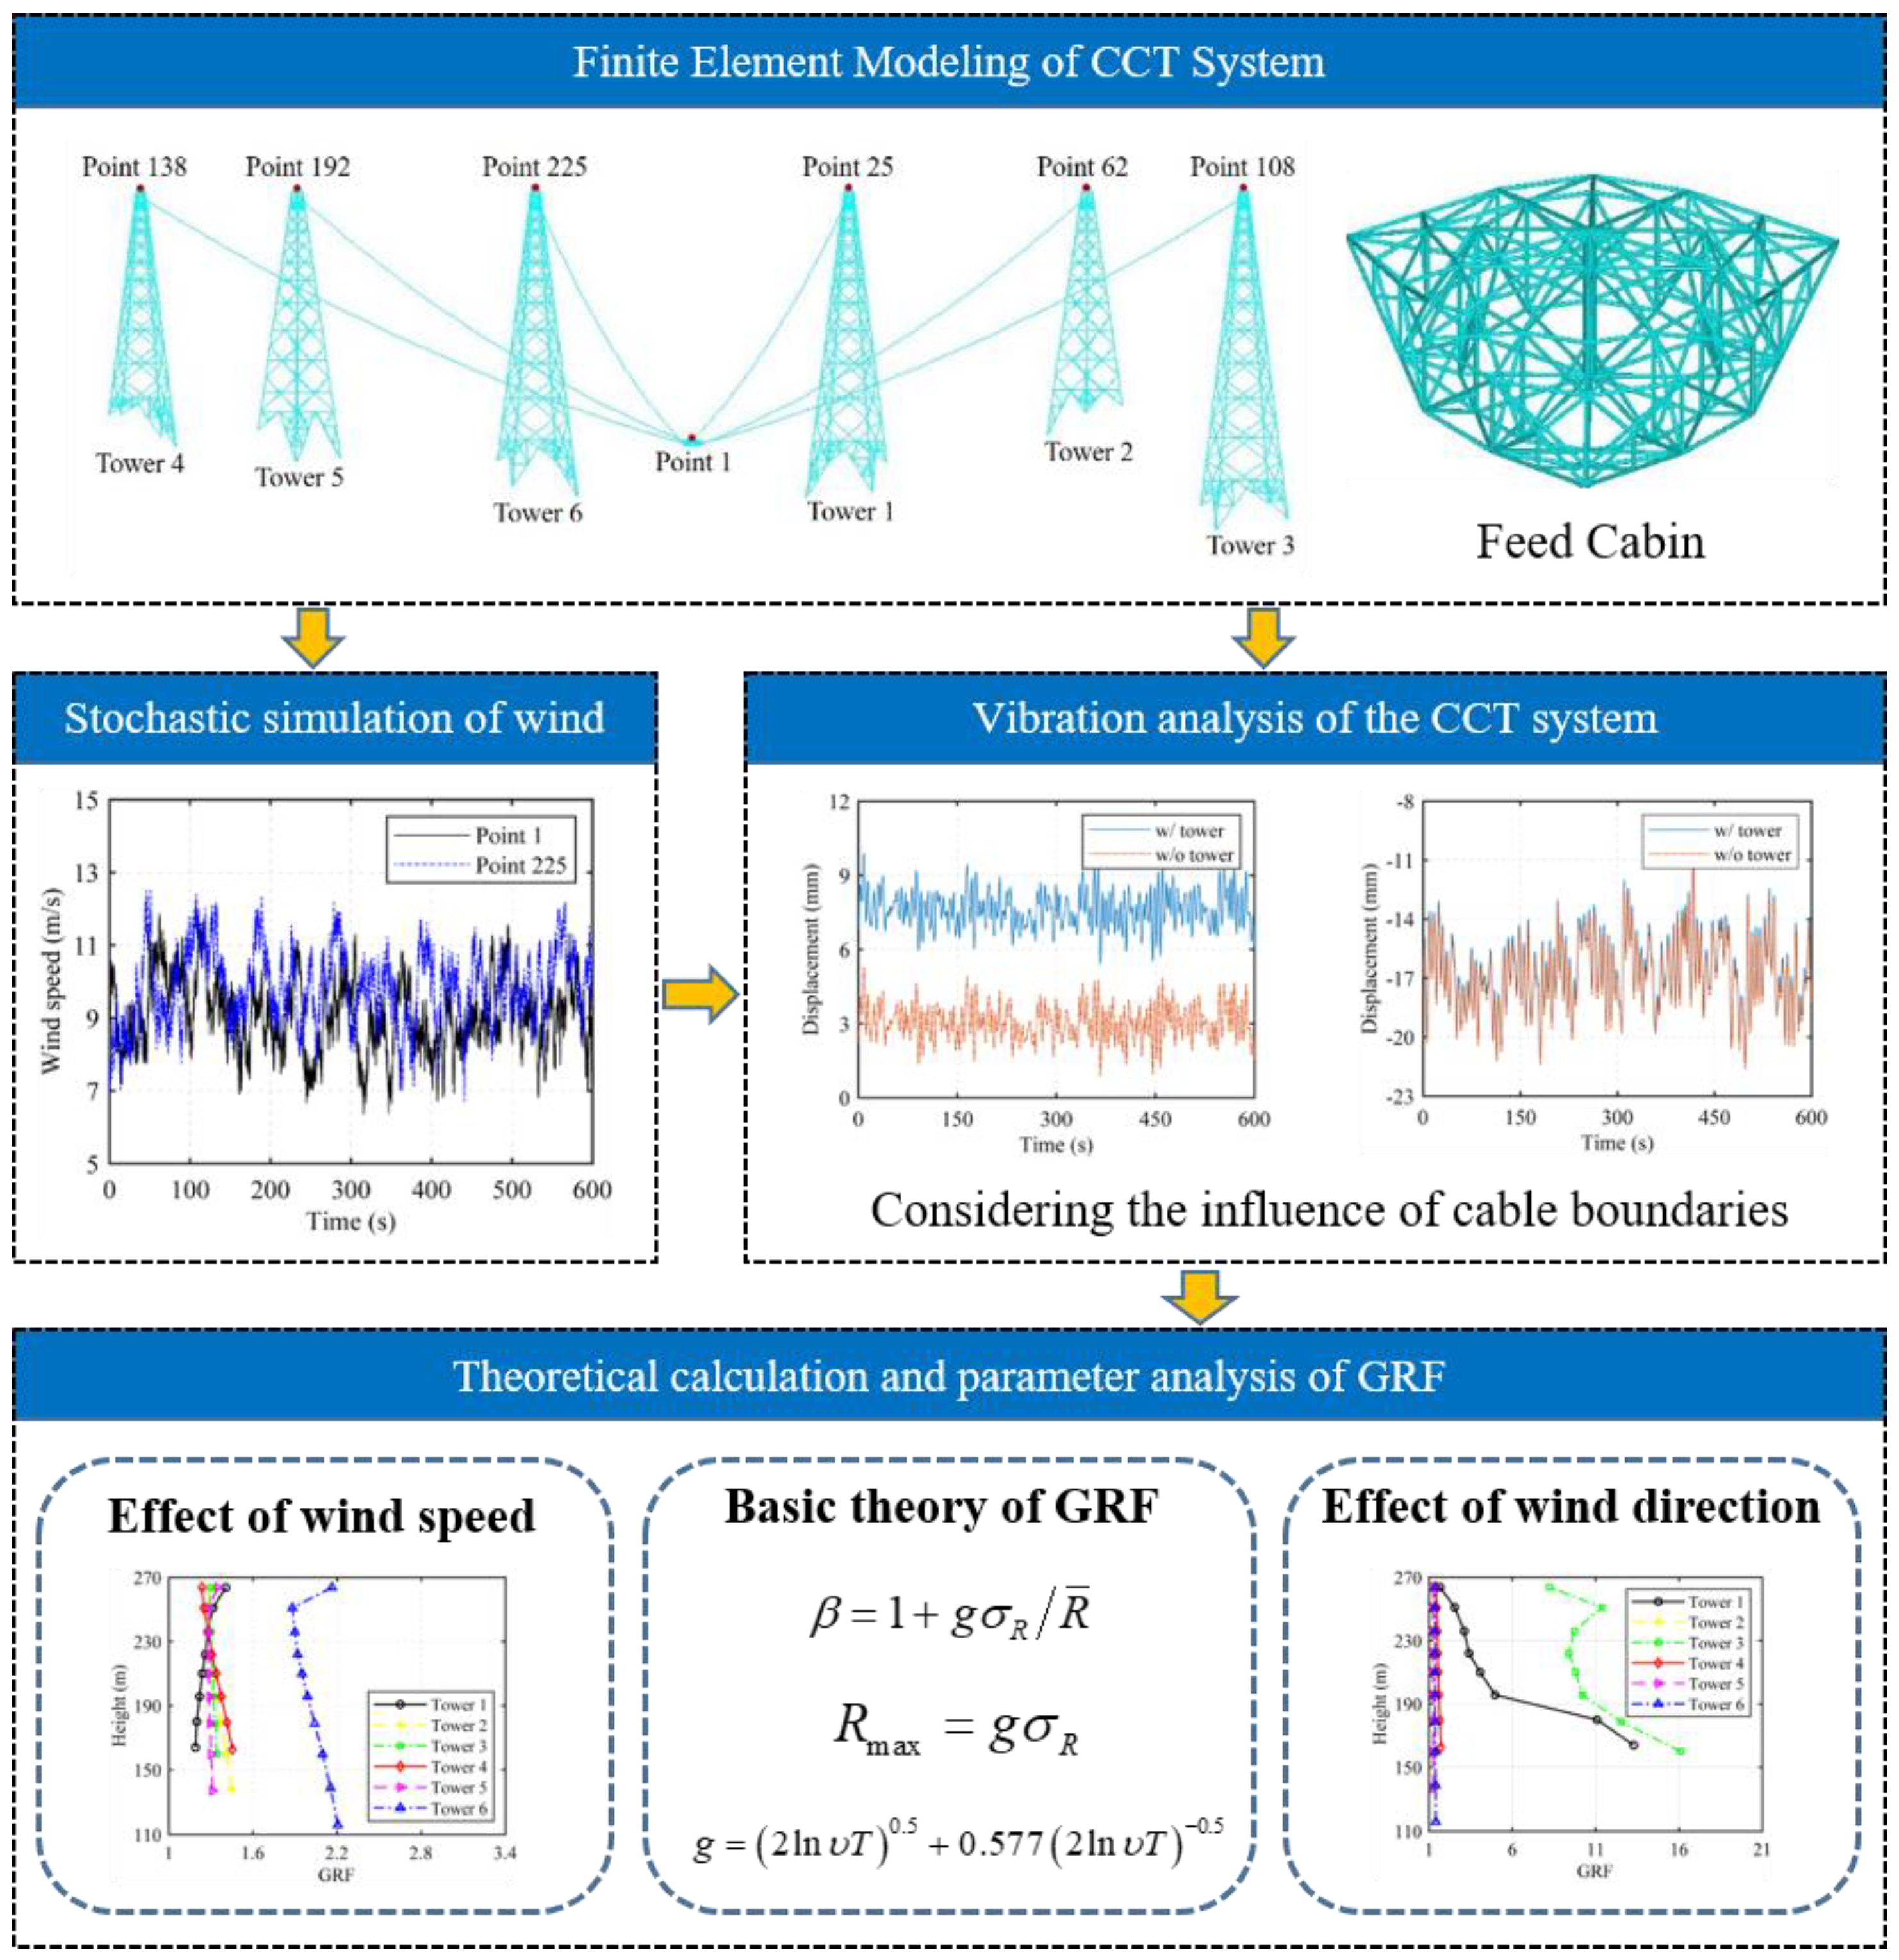
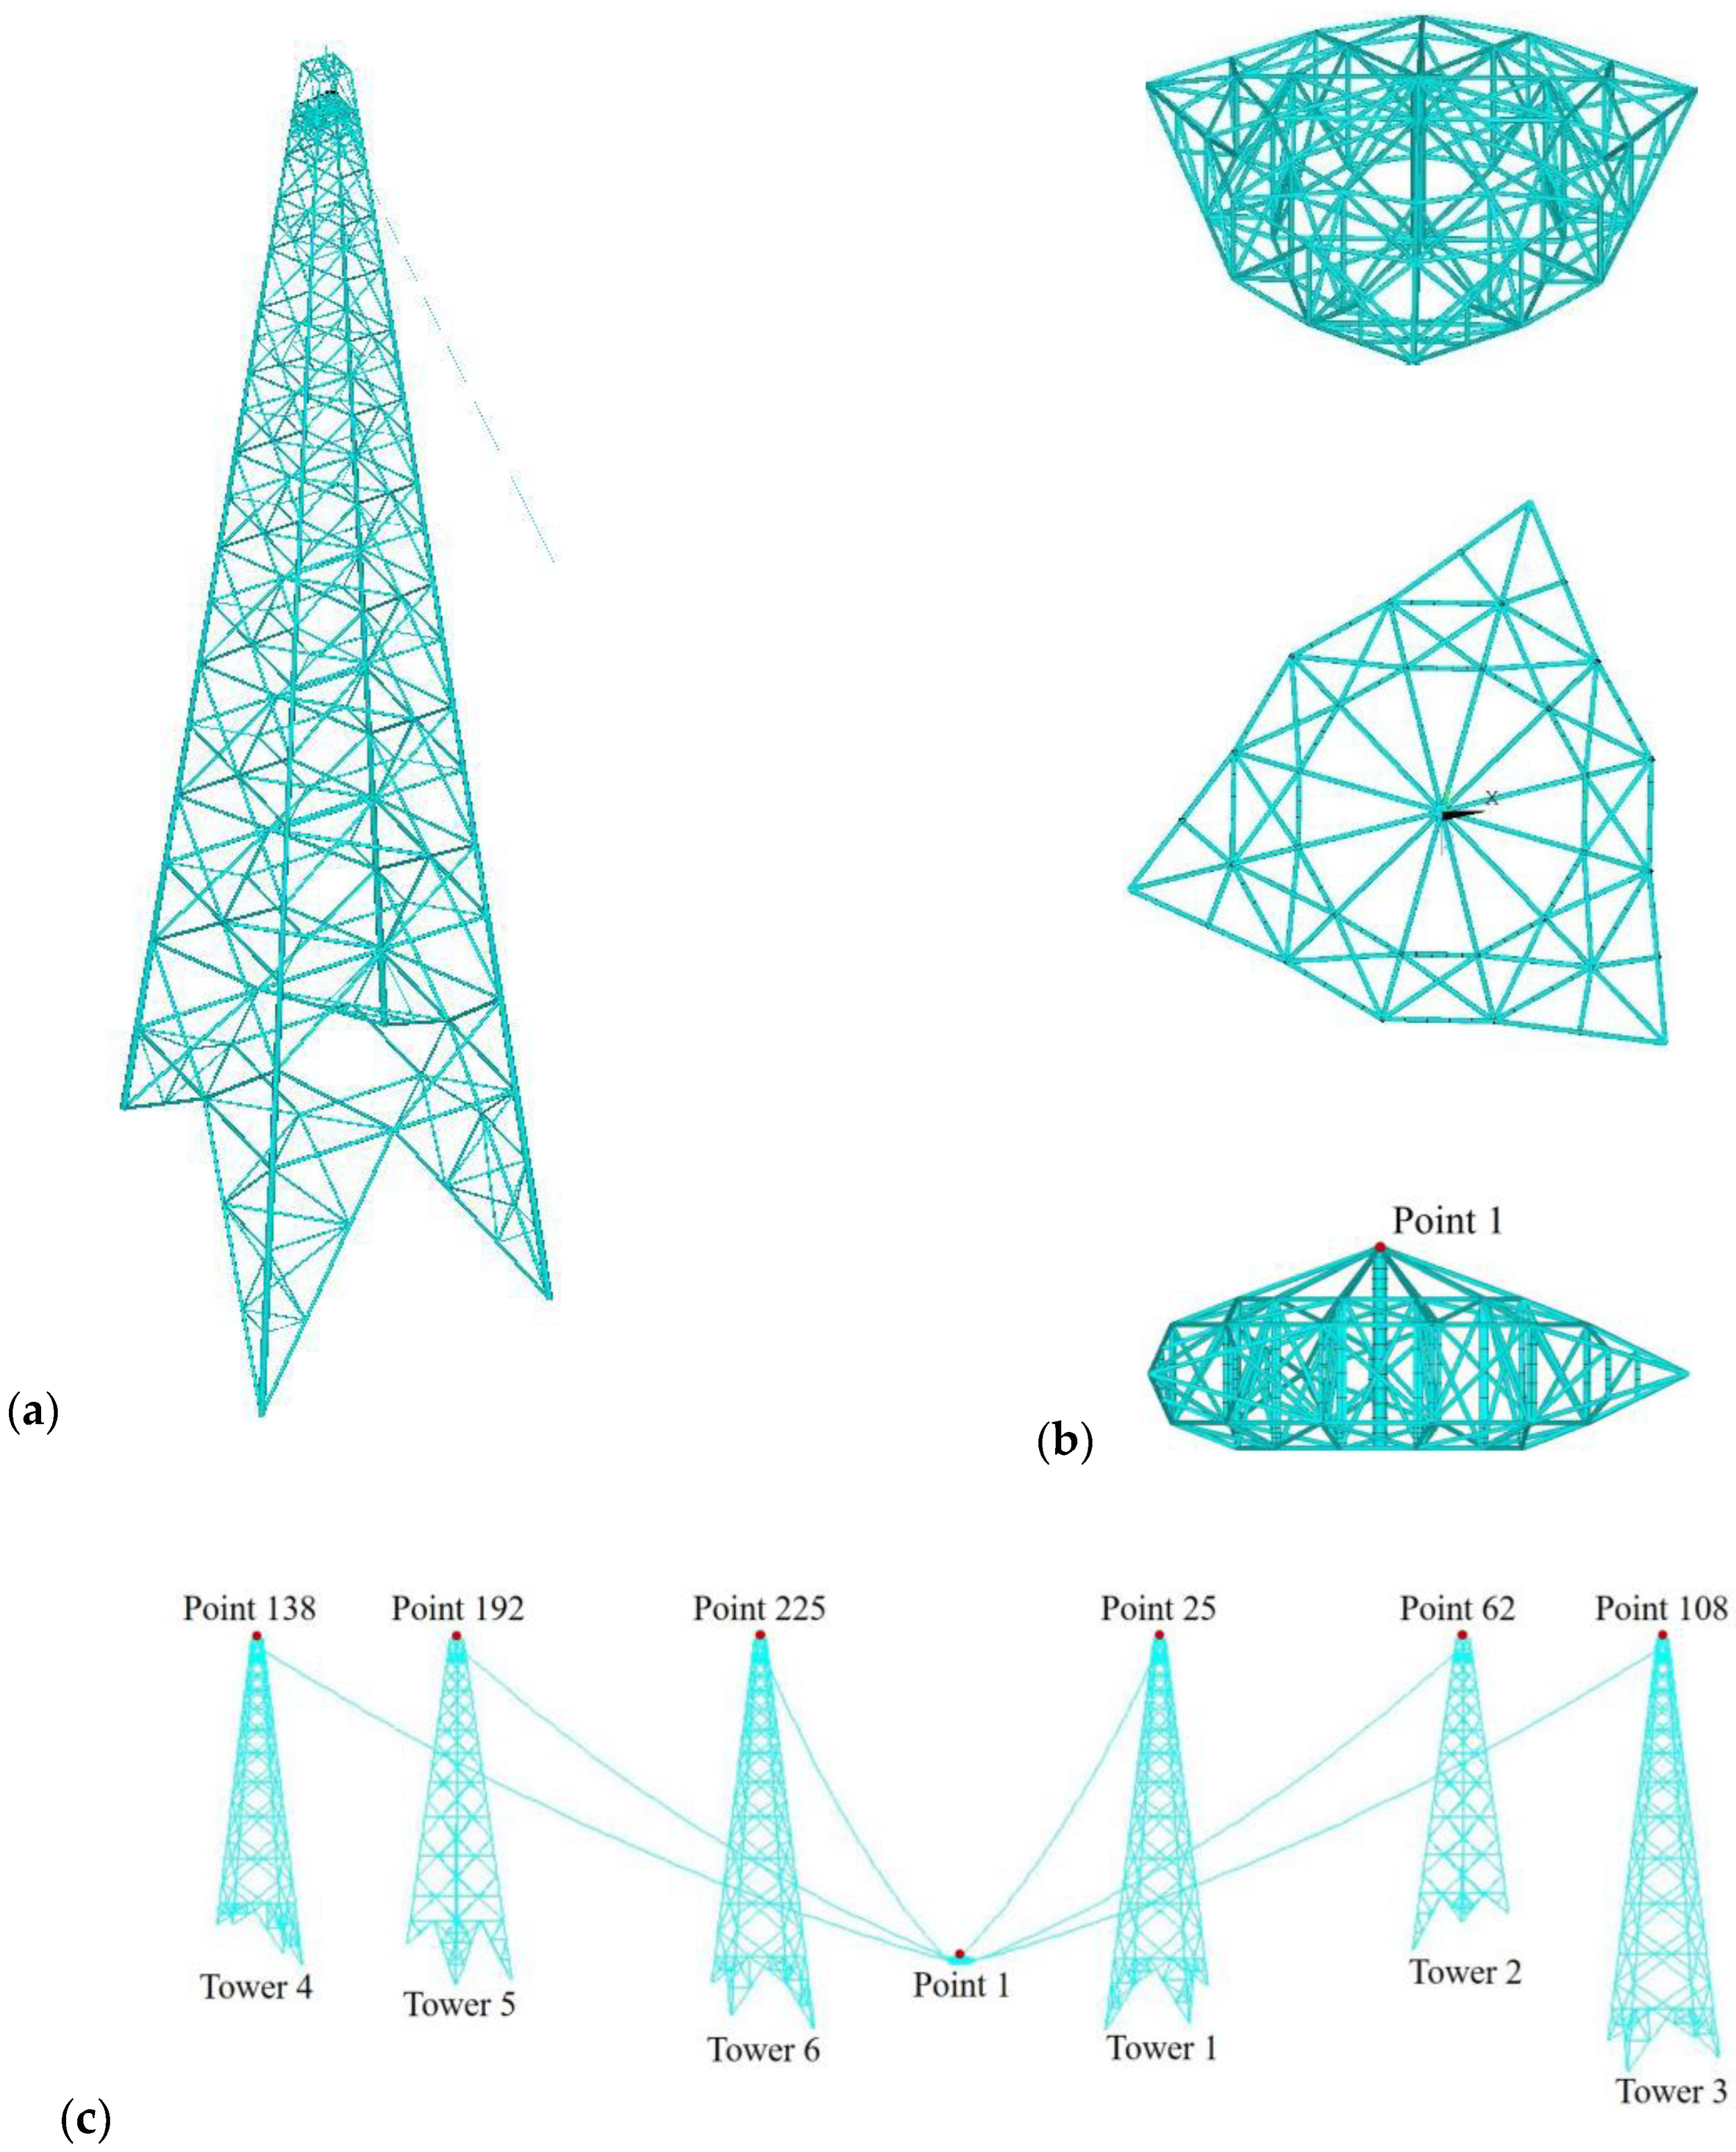
2. Project Overview and Finite Element Model of the CCT System

To investigate the wind-induced vibration characteristics of a large-scale radio astronomy telescope, this paper conducts a case study using the FAST as an example. FAST is currently the world’s largest and most sensitive radio astronomy telescope, which was completed in Guizhou Province, China, in 2020. The overall site image of the FAST is depicted in Figure 2. The main supporting structures of FAST are six steel lattice towers, evenly distributed around the feed cabin. The feed cabin, responsible for receiving reflected signals, is suspended on the focus of the reflecting surface by six steel cables. Considering the symmetric cross-section, a larger bending moment bearing capacity compared to the angle steel with the same cross-sectional area, as well as the lower drag force and structural stability under wind loading, steel tubes are adopted as the structural components for all the six supporting towers. Due to the location of the six support towers in the mountainous areas of Guizhou Province, their heights vary due to terrain limitations. For convenience, the six supporting towers are named Tower 1 to Tower 6, with respective heights of 107 m, 145 m, 112 m, 125 m, 147 m, and 168 m. Tower 6 stands as the tallest among them. The feed cabin, functioning as a crucial component within the entire FAST system, receives signals and will undergo slow movement at a height of 140 m [15,16].
Based on actual engineering drawings, a refined finite element model of the CCT system is established using ANSYS software. Unlike other types of structural analysis, the prestress has a significant influence on the vibration frequency of cable structures. Thus, it is necessary to accurately consider the tension and prestressing characteristics of the cables during the modeling process. In the modeling of cables, the coordinate of the feed cabin is set at the lowest point on the feed focal surface. First, based on the spatial positions of the cable ends, the cable angle at the connection point of the feed cabin is calculated using the catenary equation [17]. Then, the horizontal tension of the cable is calculated according to the equilibrium of the feed cabin. Subsequently, an iterative process is conducted to continuously adjust the cable angle and the horizontal tension until convergence is achieved, thereby determining the actual horizontal tension of the cable in this state. This forms the foundation of the finite element modeling of cables.
The LINK10 element is a three-dimensional axial element that experiences either tension or compression, which is utilized in this study to simulate the cables. In the modeling process, the circular shape-finding method [10] is employed to determine the initial strain and configuration. The BEAM188 element, a three-dimensional linear finite strain beam element, is used to model the feed cabin and supporting tower. Notably, it is crucial to appropriately distribute the densities of the structural elements to ensure that the simulation accurately represents real-world conditions. Although the modeling of the feed cabin solely considers its main framework structure and does not account for the skin structure on its surface, the aerodynamic characteristics of the feed cabin are considered, which can be retrieved from the previous study [18]. To ensure the accuracy of the response analysis of the supporting tower, the main members are divided into 10 elements and the secondary members are divided into 5 elements. The composition and material properties of various components are shown in Table 1. All six towers are rigidly connected to the ground. The finite element model of Tower 6 is shown in Figure 3a, and the details of the feed cabin from various views are depicted in Figure 3b. Finally, the overall finite element model is shown in Figure 3c.

3. Wind-Induced Vibration of the CCT System

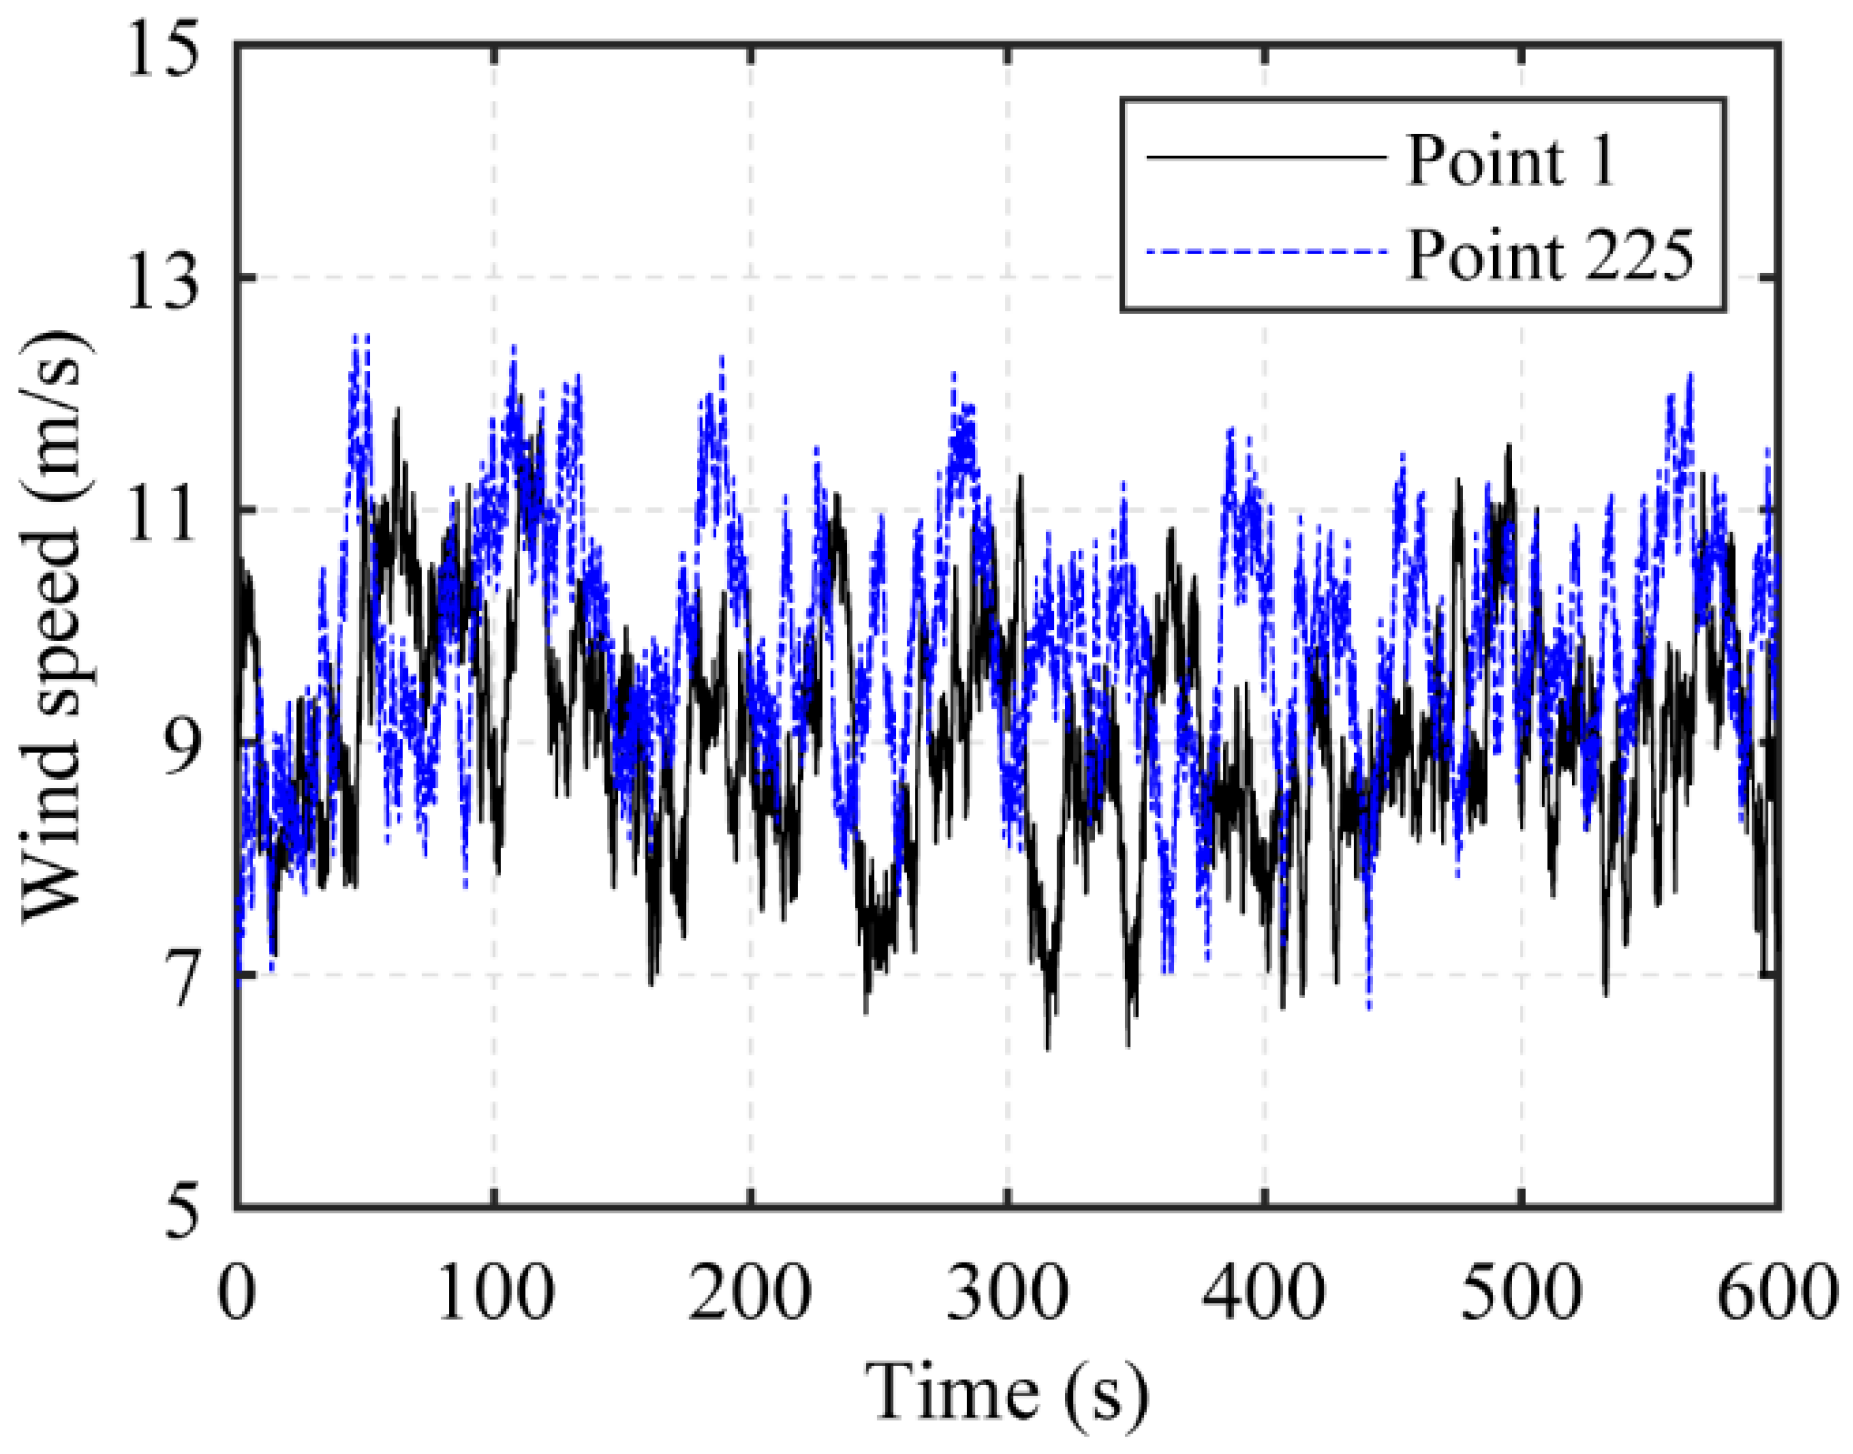
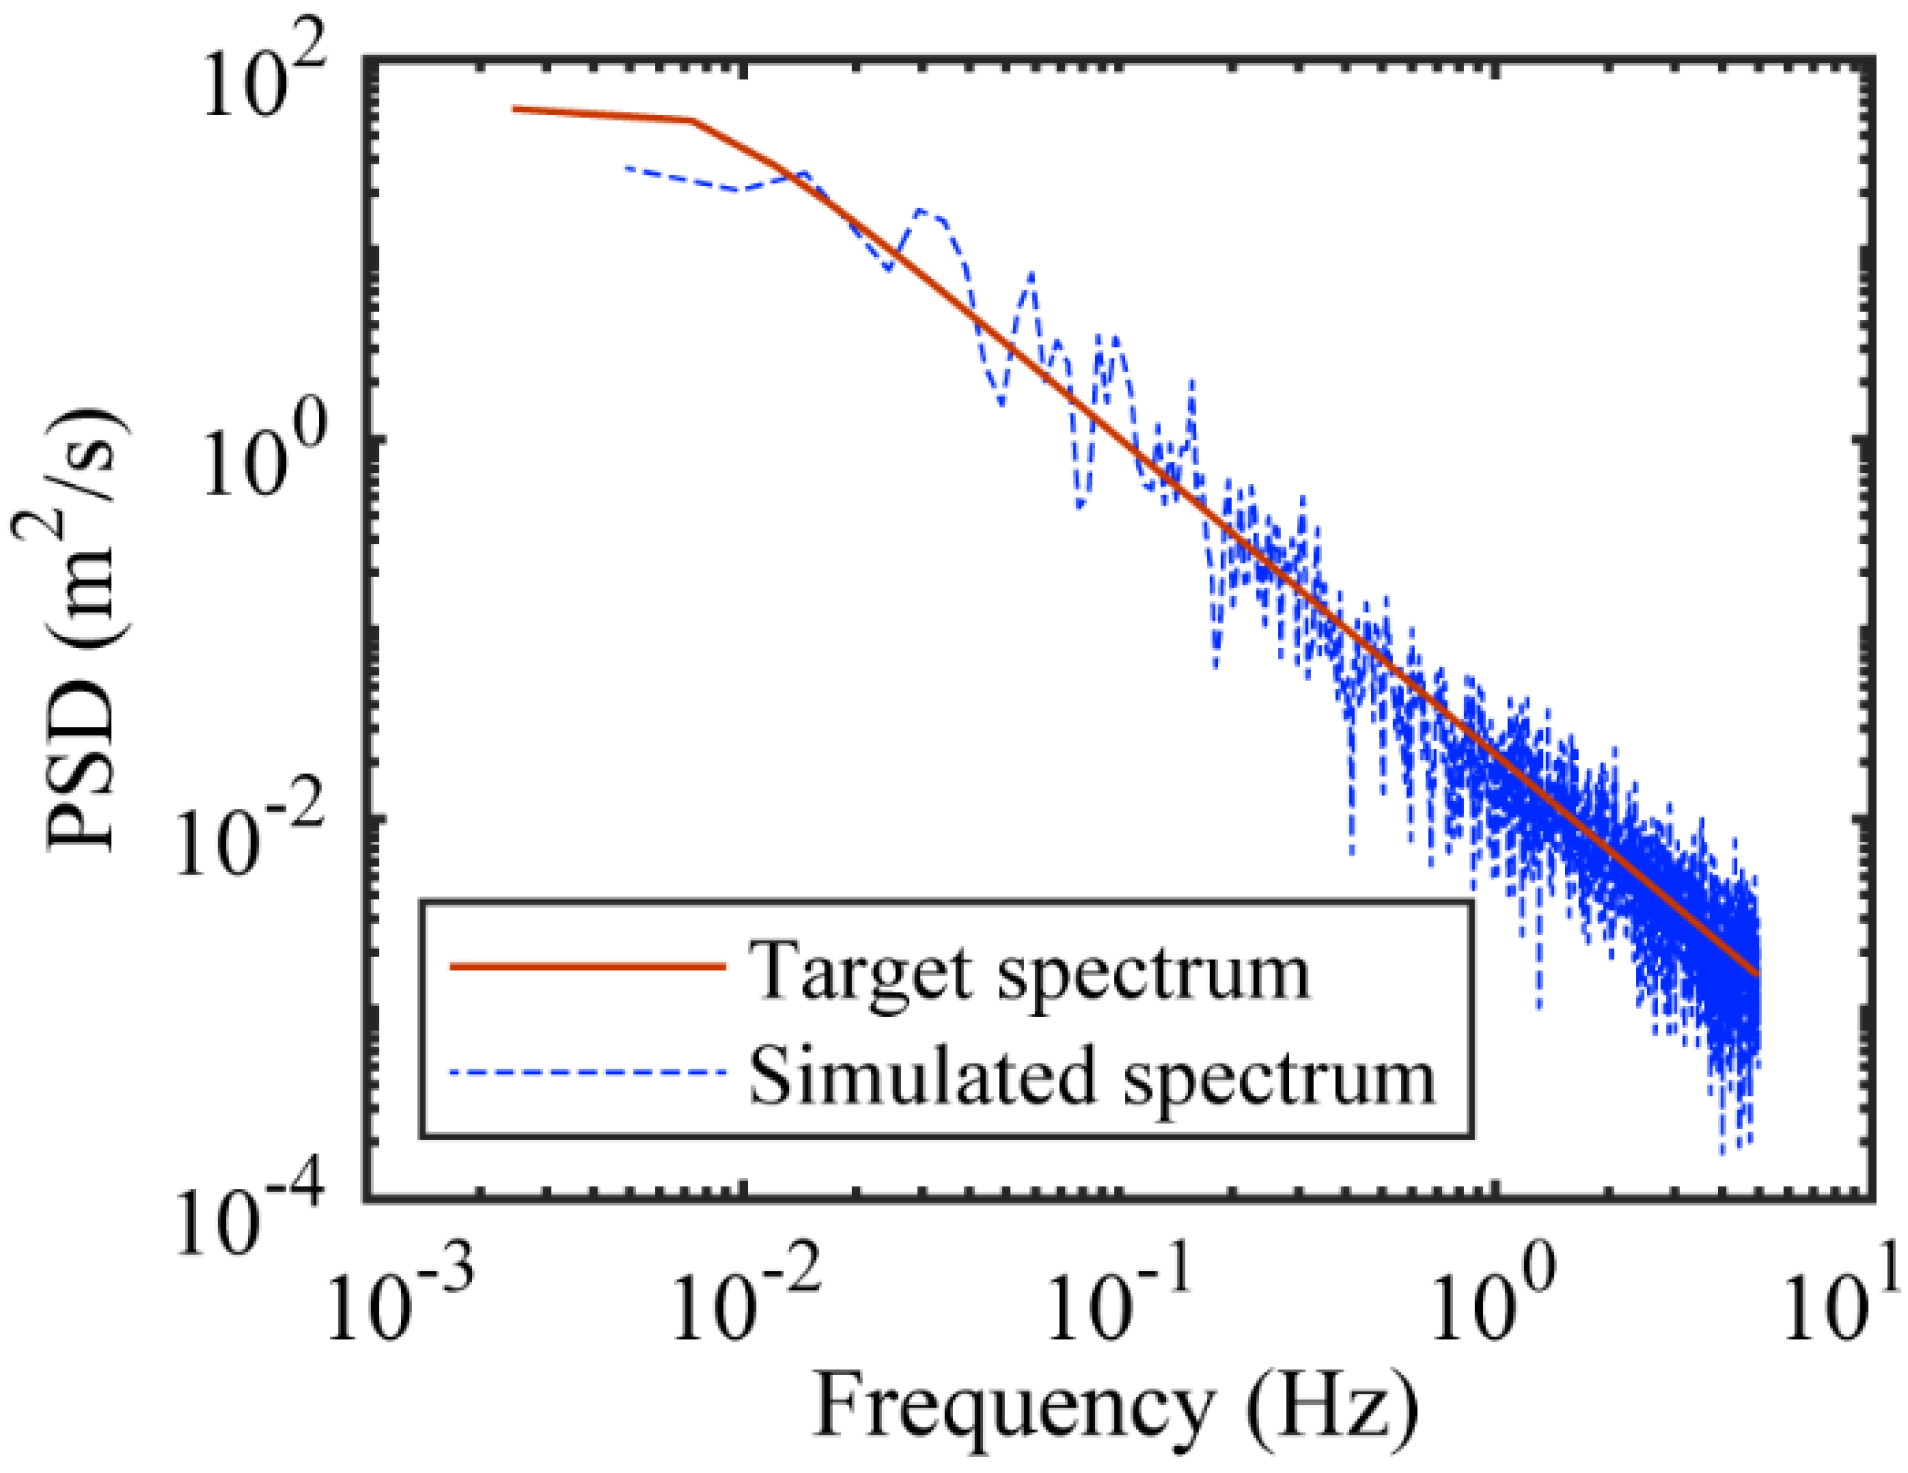
3.1. Stochastic Simulation of Wind Fields

To calculate the wind-induced response of the CCT system under various operating conditions, it is necessary to conduct a stochastic simulation of wind fields. The wind load is a kind of uniformly distributed load that will interact with the structural surface, and different components will experience varying wind loads. However, it remains a challenge to directly simulate such random and uniformly distributed loads due to current technological limitations. As a common approach in the field of structural wind engineering, wind loads are often simplified as concentrated loads acting on the nodes of numerical models. The wind speed at a specific point in space can be considered the sum of the mean wind and turbulent wind. For large-scale storms, the mean wind can be assumed to remain constant over a short period, and it is only a function of the height above the ground. The variation in the mean wind with height can typically be described by two types of profiles: the logarithmic law wind profile and the power law wind profile. In GB 50009-2012 [19], the power law wind profile is adopted to simulate the mean wind. Compared to the logarithmic law wind profile, the power law wind profile offers computational simplicity, while yielding similar results. Therefore, this study employs the power law wind profile to simulate the mean wind speed, which can be expressed as follows:
V ¯ j = V ¯ 10 z j 10 α
where V10 represents the basic wind speed; α represents the power index related to the ground roughness; and z j represents the height of the j-th simulated point above the ground.
In actual engineering, it is common to simulate the fluctuating characteristics of wind speed using stationary Gaussian processes that have experienced various states. These fluctuating characteristics are largely dependent on the power spectral density (PSD) and spatial coherence function of turbulent wind. The longitudinal turbulence effect is often a focal point in wind-induced vibration analysis. Hence, this paper selects the Davenport spectrum for simulating fluctuating wind speeds, which can be expressed as follows [20]:
S n = 4 K V ¯ 10 2 x 2 n 1 + x 2 4 / 3 ,   x = 1200 n V ¯ 10
where n represents the frequency of fluctuating wind and K represents the Karman constant, which can be 0.4.
The commonly employed spatial coherence functions include the Davenport coherence function [21] and the Shiotani coherence function [22], where the former is frequency-dependent but the latter is frequency-independent. In this study, the Davenport coherence function is adopted to consider the correlation of longitudinal turbulence in three directions at each point:
coh = exp 2 n C x 2 Δ x i j 2 + C y 2 Δ y i j 2 + C z 2 Δ z i j 2 V ¯ i + V ¯ j
where Δ x i j , Δ y i j , Δ z i j represent the longitudinal, transverse, and vertical spatial distances of any two points, respectively; C x , C y , C z are the delay coefficients in the corresponding directions, and the values are 16, 6, and 10, respectively; V ¯ i and V ¯ j represent the mean wind speed at point i and point j, respectively.
The cross-spectral density matrix can be determined by combining the PSD function and spatial coherence function of fluctuating wind speed. Furthermore, when the number of simulation points is m, the fluctuating wind speed time history at point j can be expressed as follows according to the double index frequency simulation method proposed by Deodatis [23]:
V ˜ j t = 2 Δ n k = 1 j l = 1 N H j k n k l cos n k l t θ j k n k l + φ k l
where j = 1, 2, …, m; Δ n is the frequency increment, N is the division number of the frequency, and n u is the cutoff frequency. n k l is the l-th frequency component; H j k n k l is the element of the lower triangular matrix of the cross-spectral density matrix after Cholesky decomposition; θ j k n k l is the complex angle of H j k n k l , that is, θ j k n k l = arctan Im H j k n k l / Re H j k n k l , Re and Im represent the real and imaginary parts of H j k n k l , respectively; φ k l is an independent random phase, uniformly distributed at [0, 2π].
Unless otherwise specified, the default parameters for generating fluctuating wind speed are as follows: (1) The ground roughness category is B; (2) The total simulation duration is 600 s with a time step of 0.1 s; (3) The cutoff frequency is 5 Hz, with a division number of 1024; (4) Taking the lowest point of the FAST as the reference height, the base wind speed is 6 m/s. The diagram of wind direction is shown in Figure 4.
The time histories of fluctuating wind speeds at the feed cabin (point 1) and the top of Tower 6 (point 225) are shown in Figure 5. The positions of the two points are shown in Figure 3. To validate the accuracy of the stochastic simulation, a comparison is made between the simulated spectrum and the target spectrum of fluctuating wind speeds at the feed cabin, as shown in Figure 6. It can be observed that the overall trend of the simulated spectrum is consistent with the Davenport target spectrum, indicating that the adopted method and programming for generating fluctuating wind speeds in this simulation are rational and effective.
Then, the wind speed at each point can be converted into wind load by the Bernoulli equation. According to GB 50009-2012, for closed terrains such as intermountain basins and valley floors, the correction of terrain should also be considered in the calculation of wind load. The correction factor η can be selected as between 0.75 and 0.85, and the middle value of 0.8 is taken in this paper. The total wind load at the j-th simulation point can be calculated according to the following formula:
F w j t = 1 2 ρ V t j 2 μ s A η
where V t j = V ¯ j + V ˜ j , V t represents the total wind speed; ρ represents the air density, taking 1.25 kg/m3; μ s is the drag coefficient; and A is the projection area of the structure.
Notably, the influence of aerodynamic damping cannot be disregarded for cable structures [24,25]. Typically, the wind load is computed by considering the relative velocity between the wind and the structure, thereby implicitly accounting for the aerodynamic damping effect [26]. Accordingly, the vibration velocity of the structure is extracted after each time step to subsequently modify the wind load for the next moment.

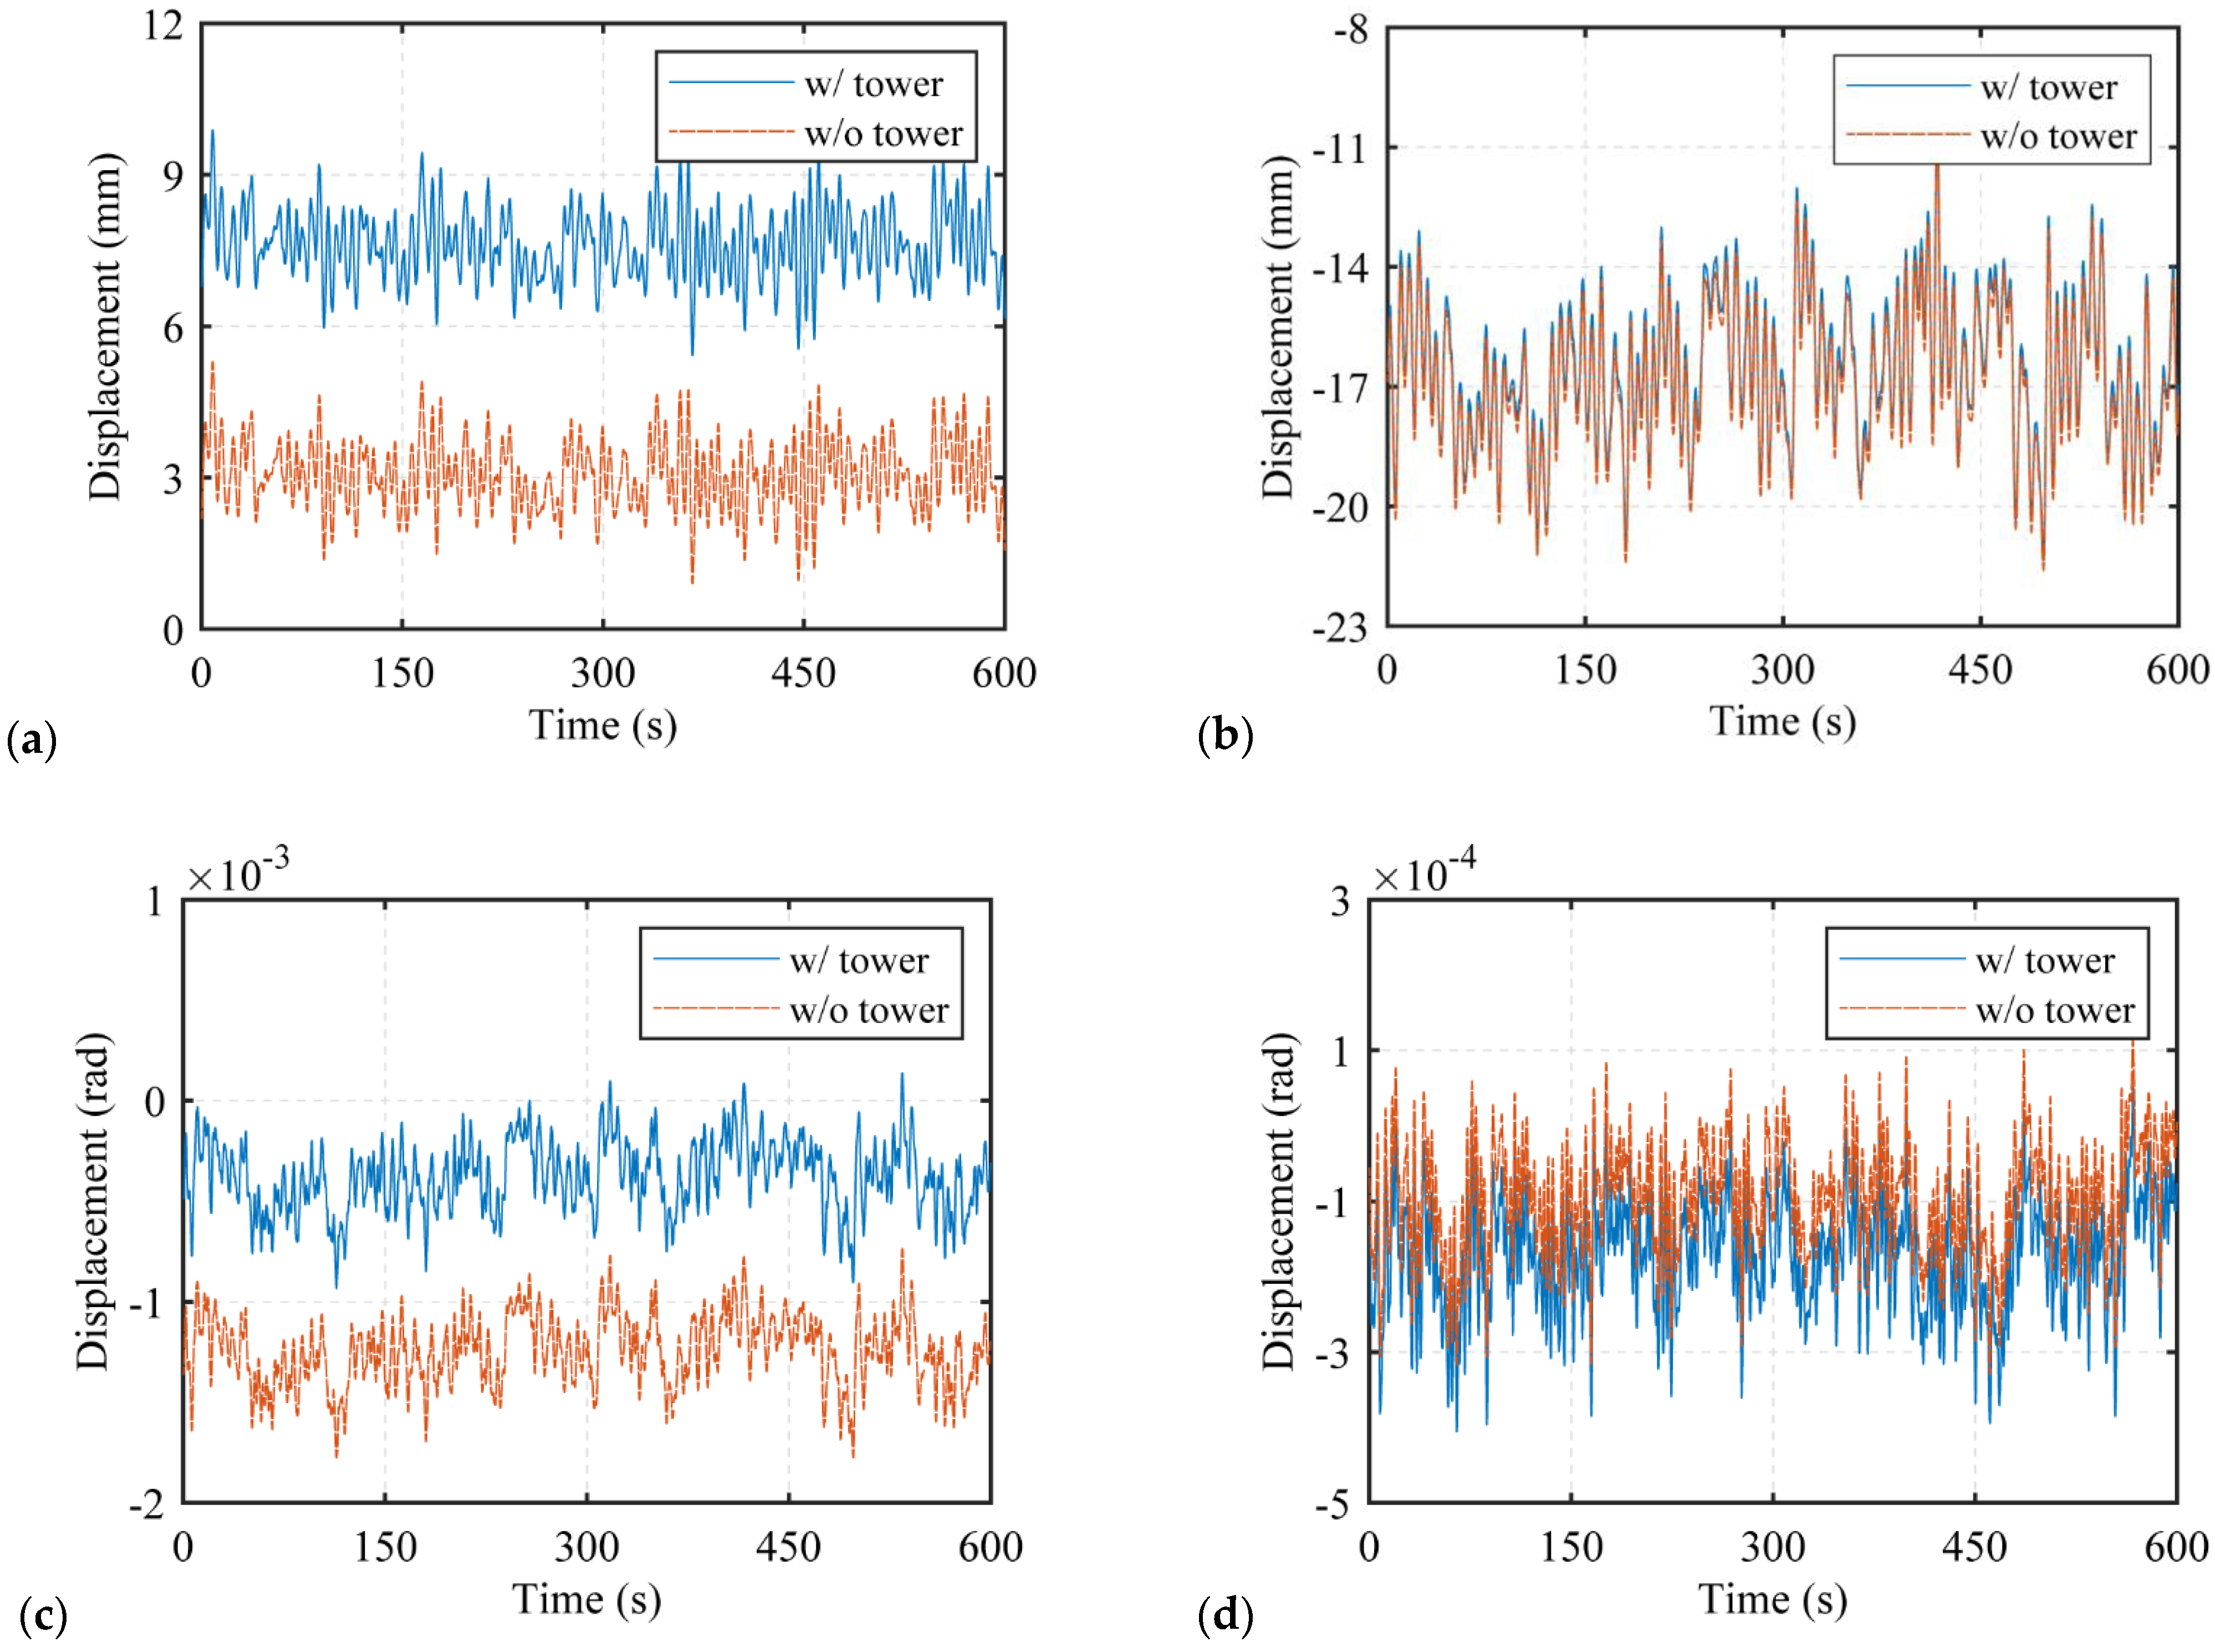
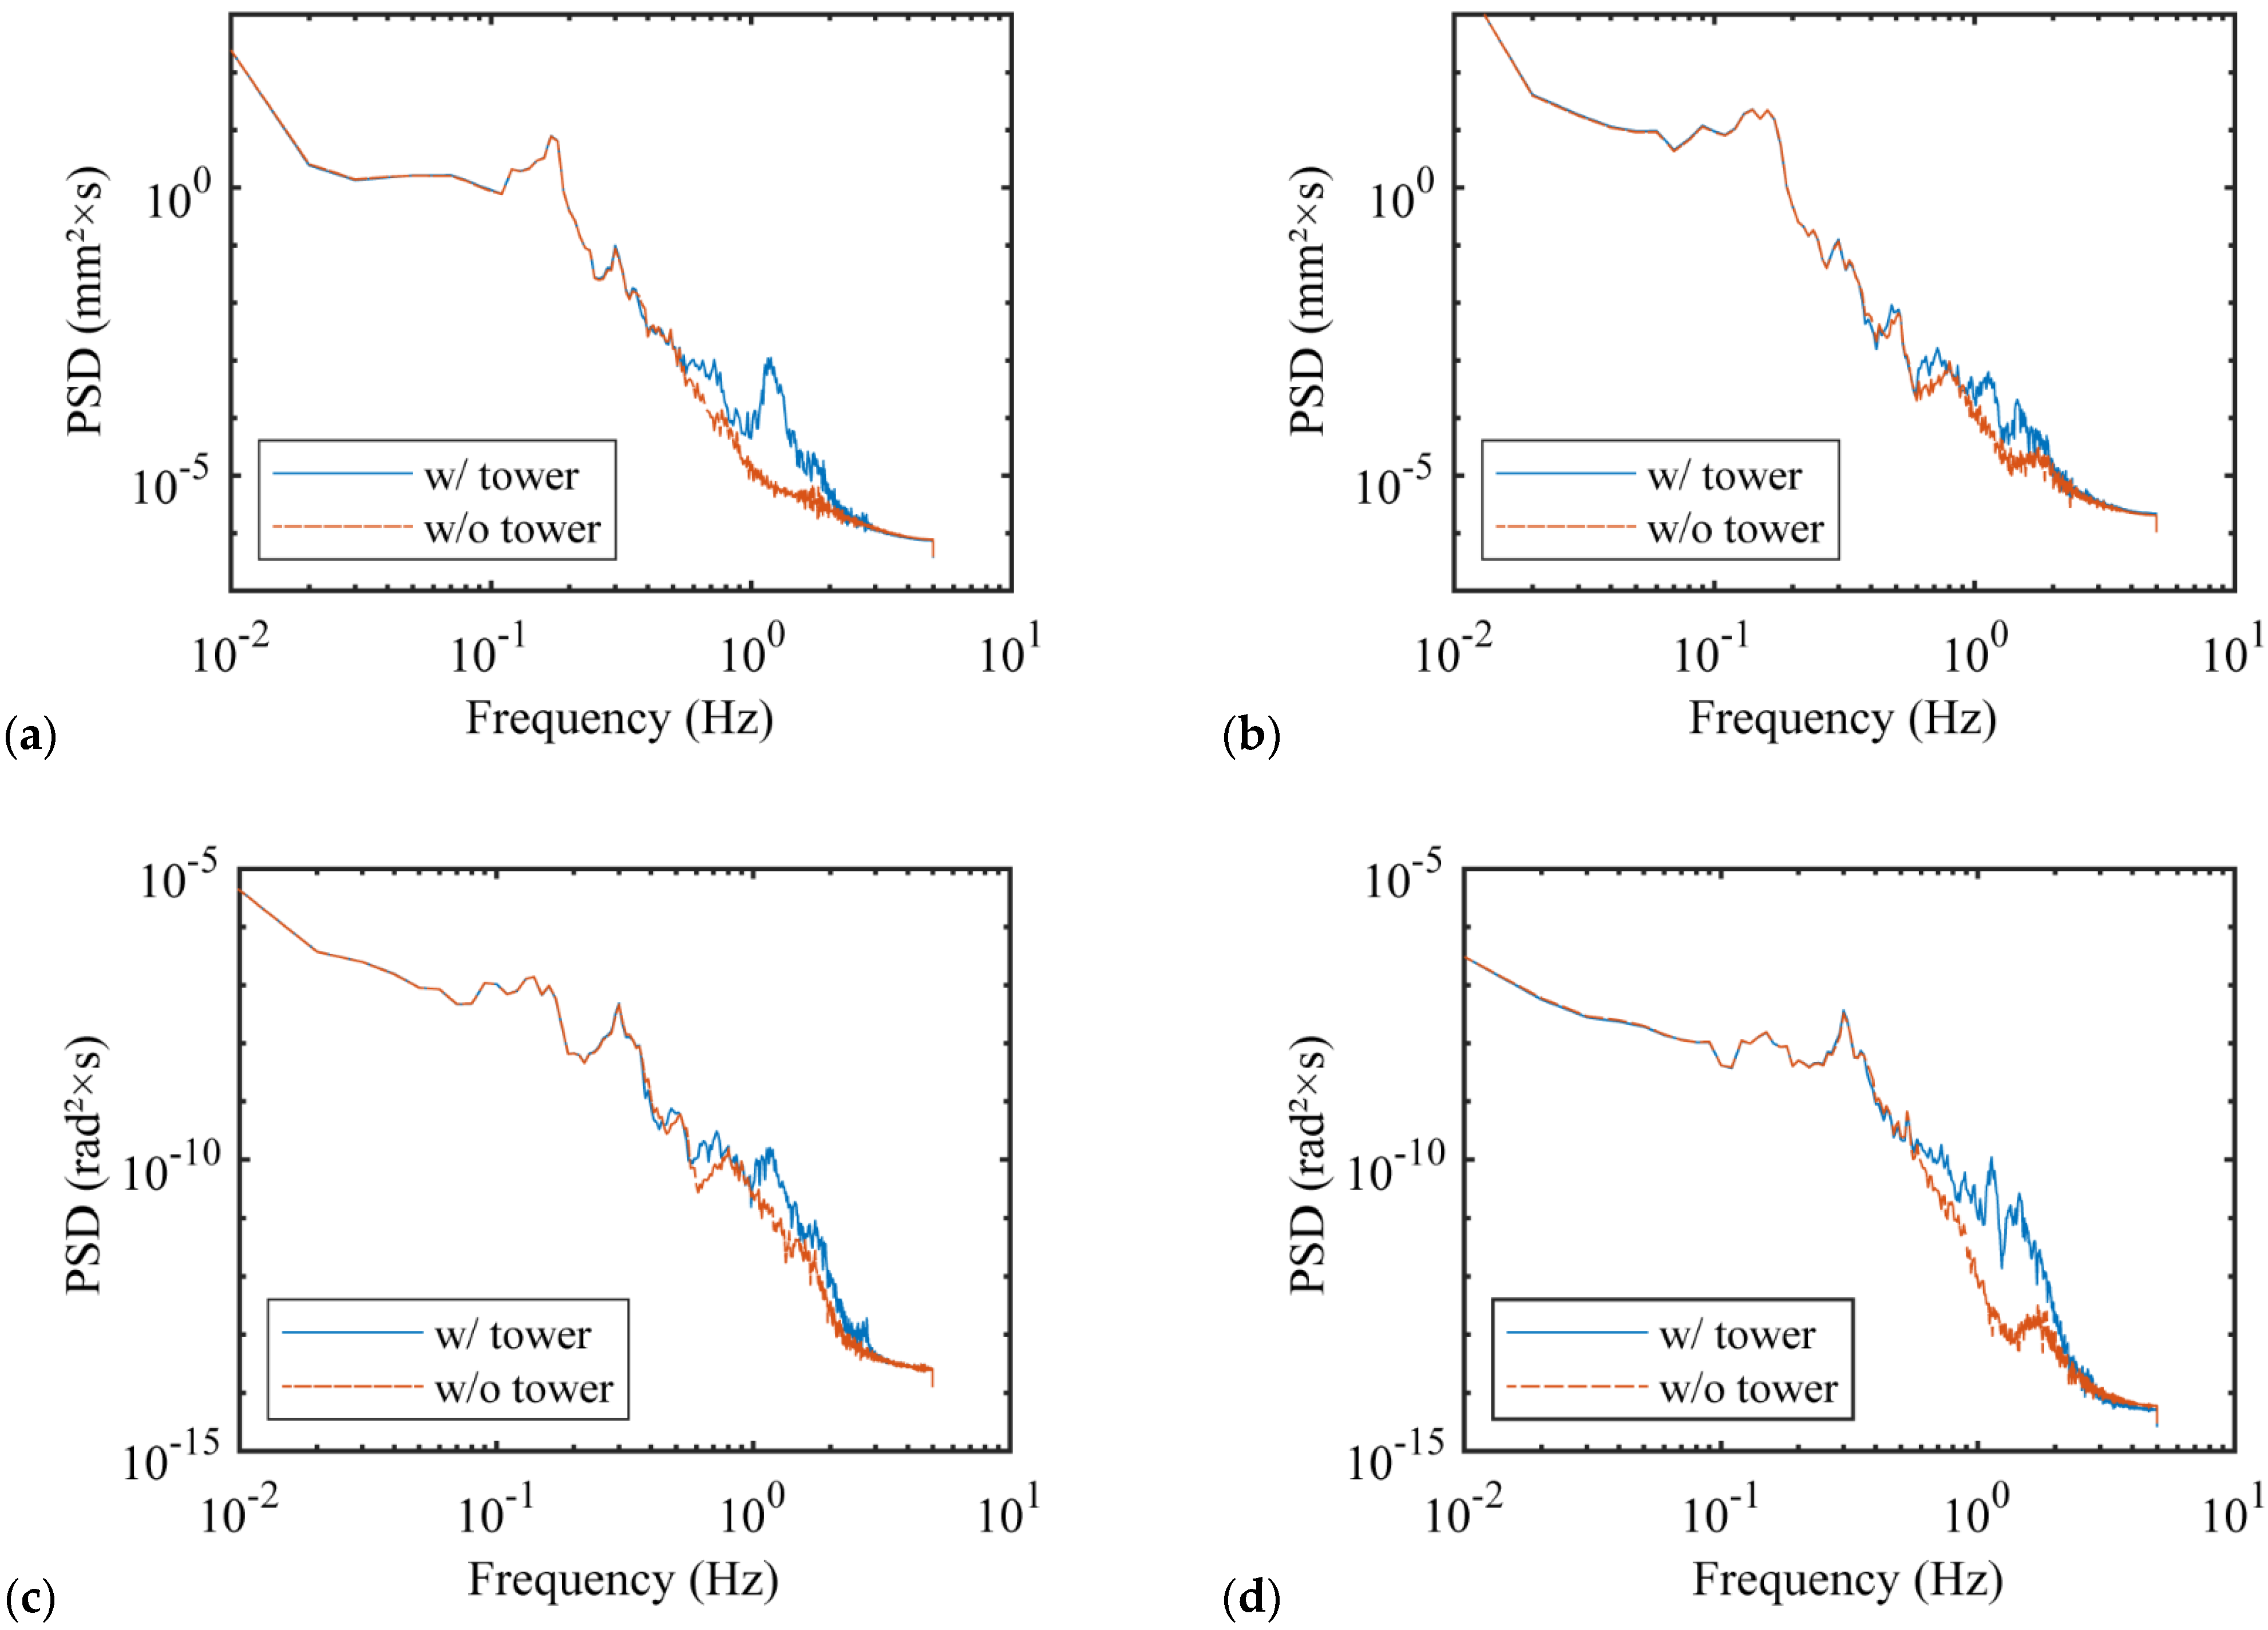
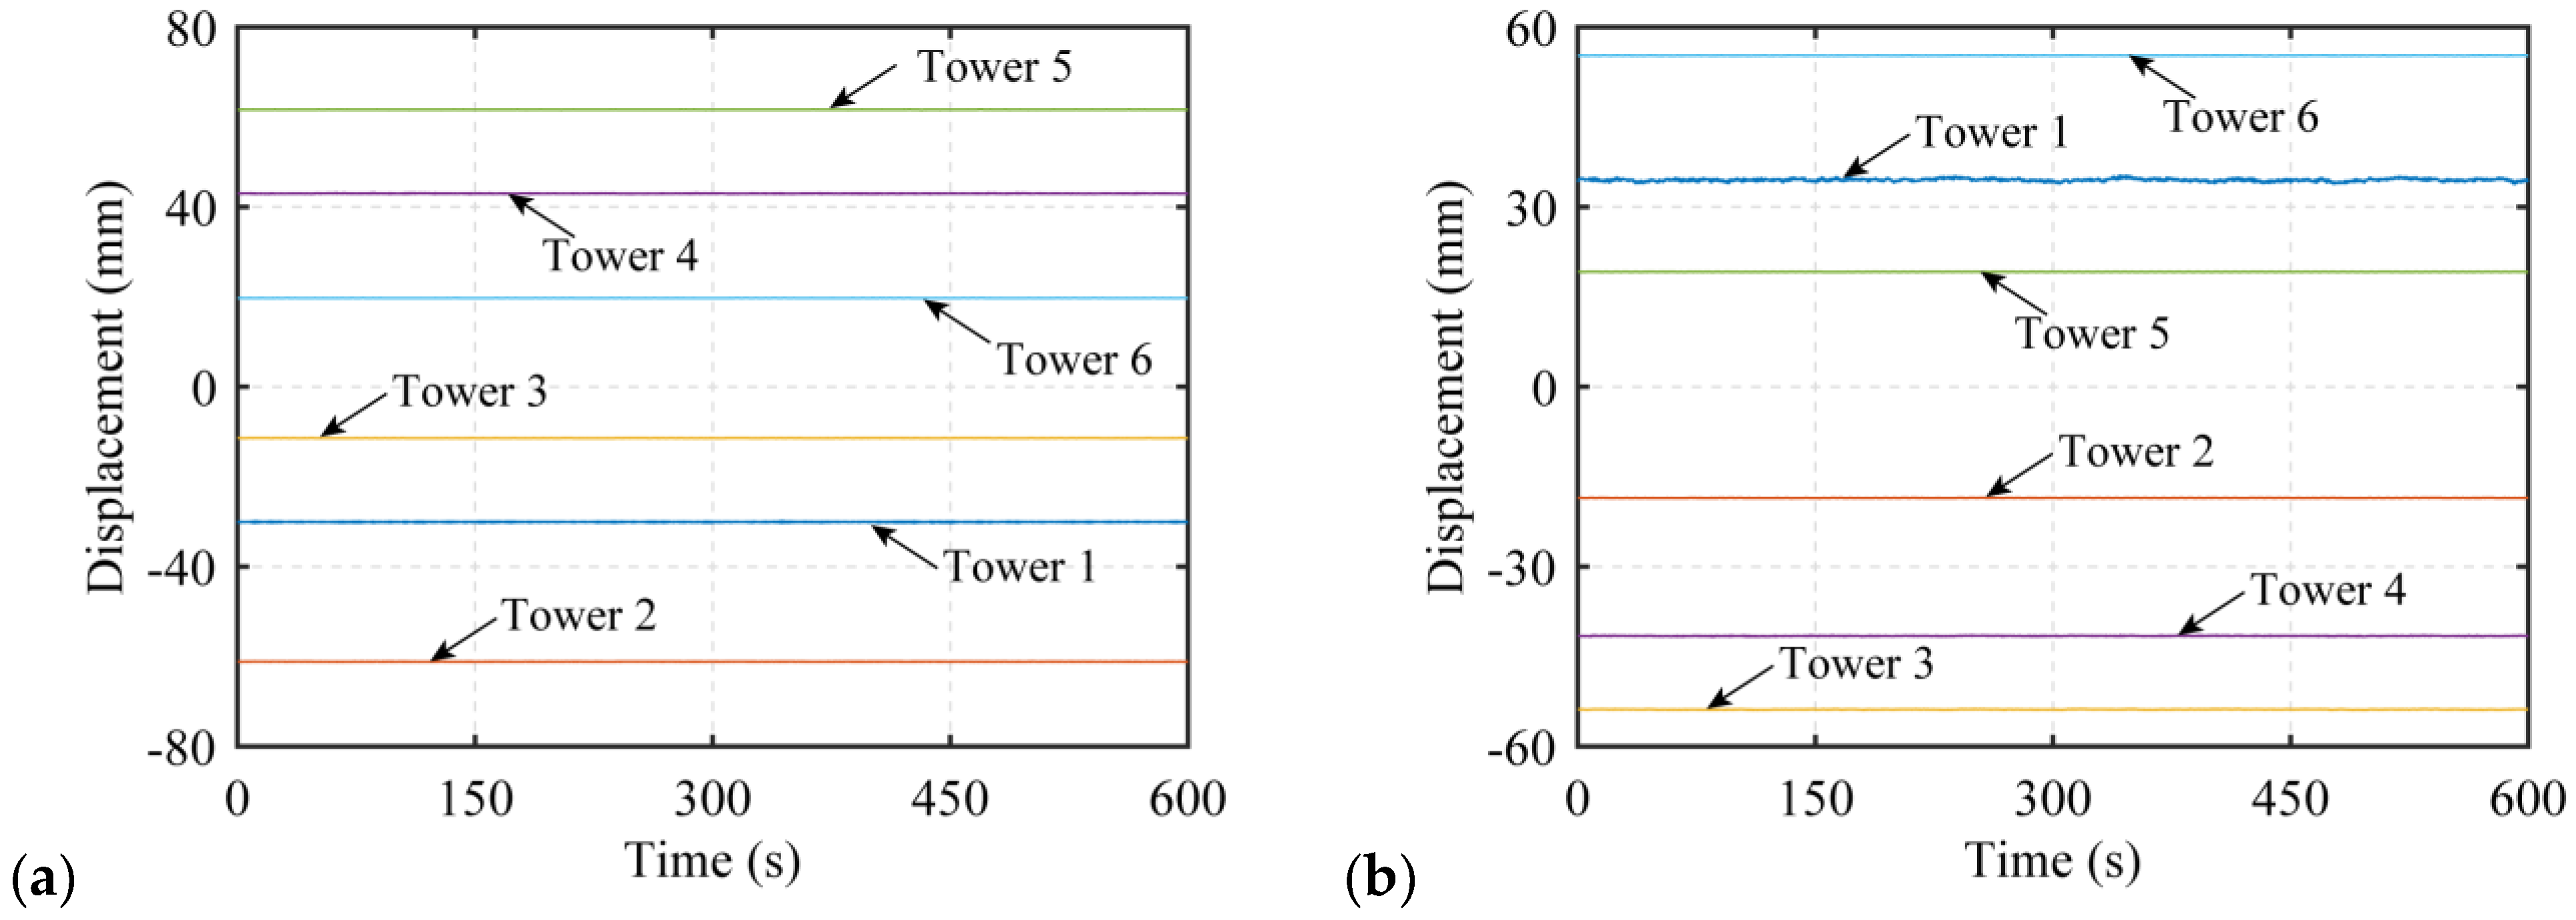
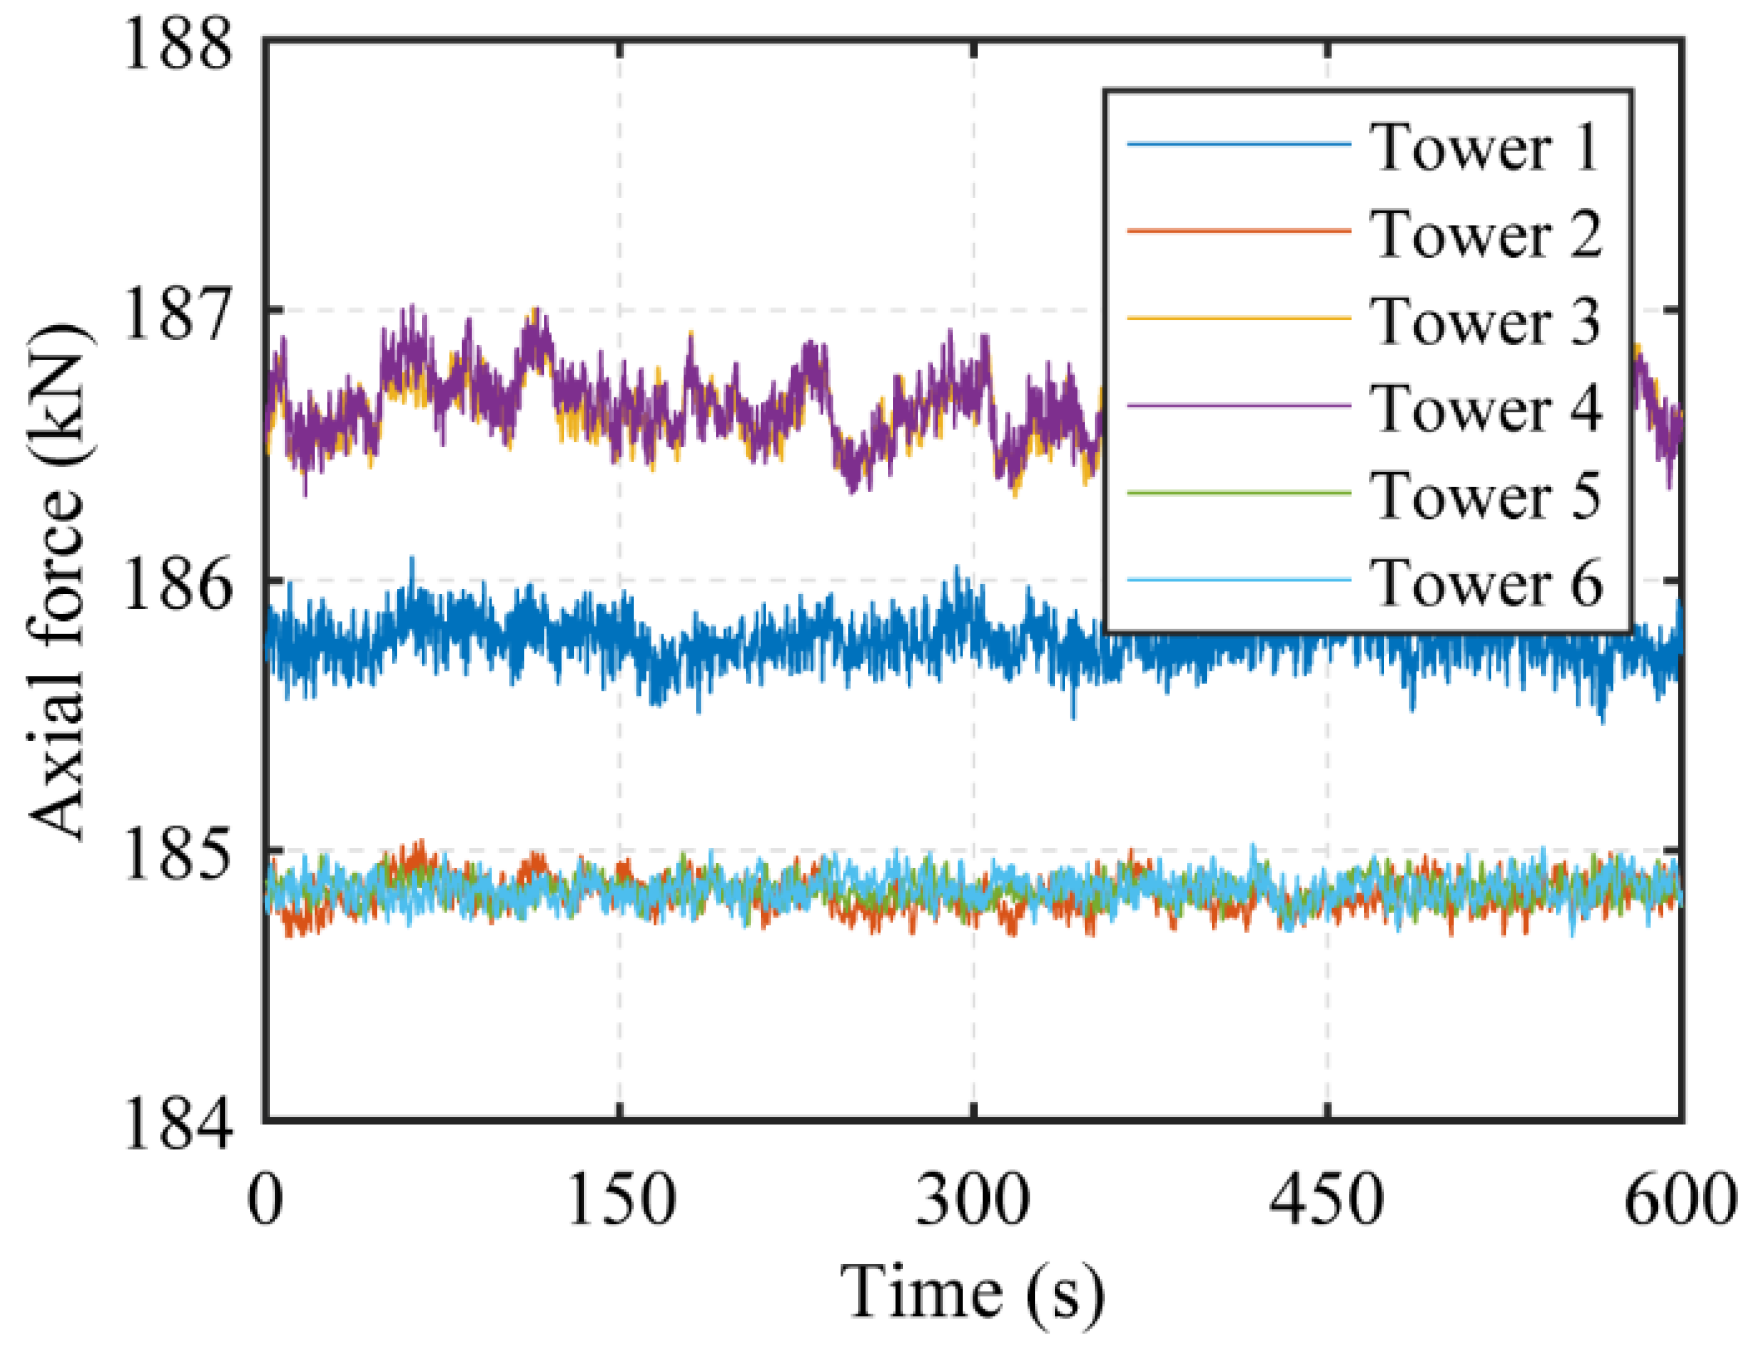
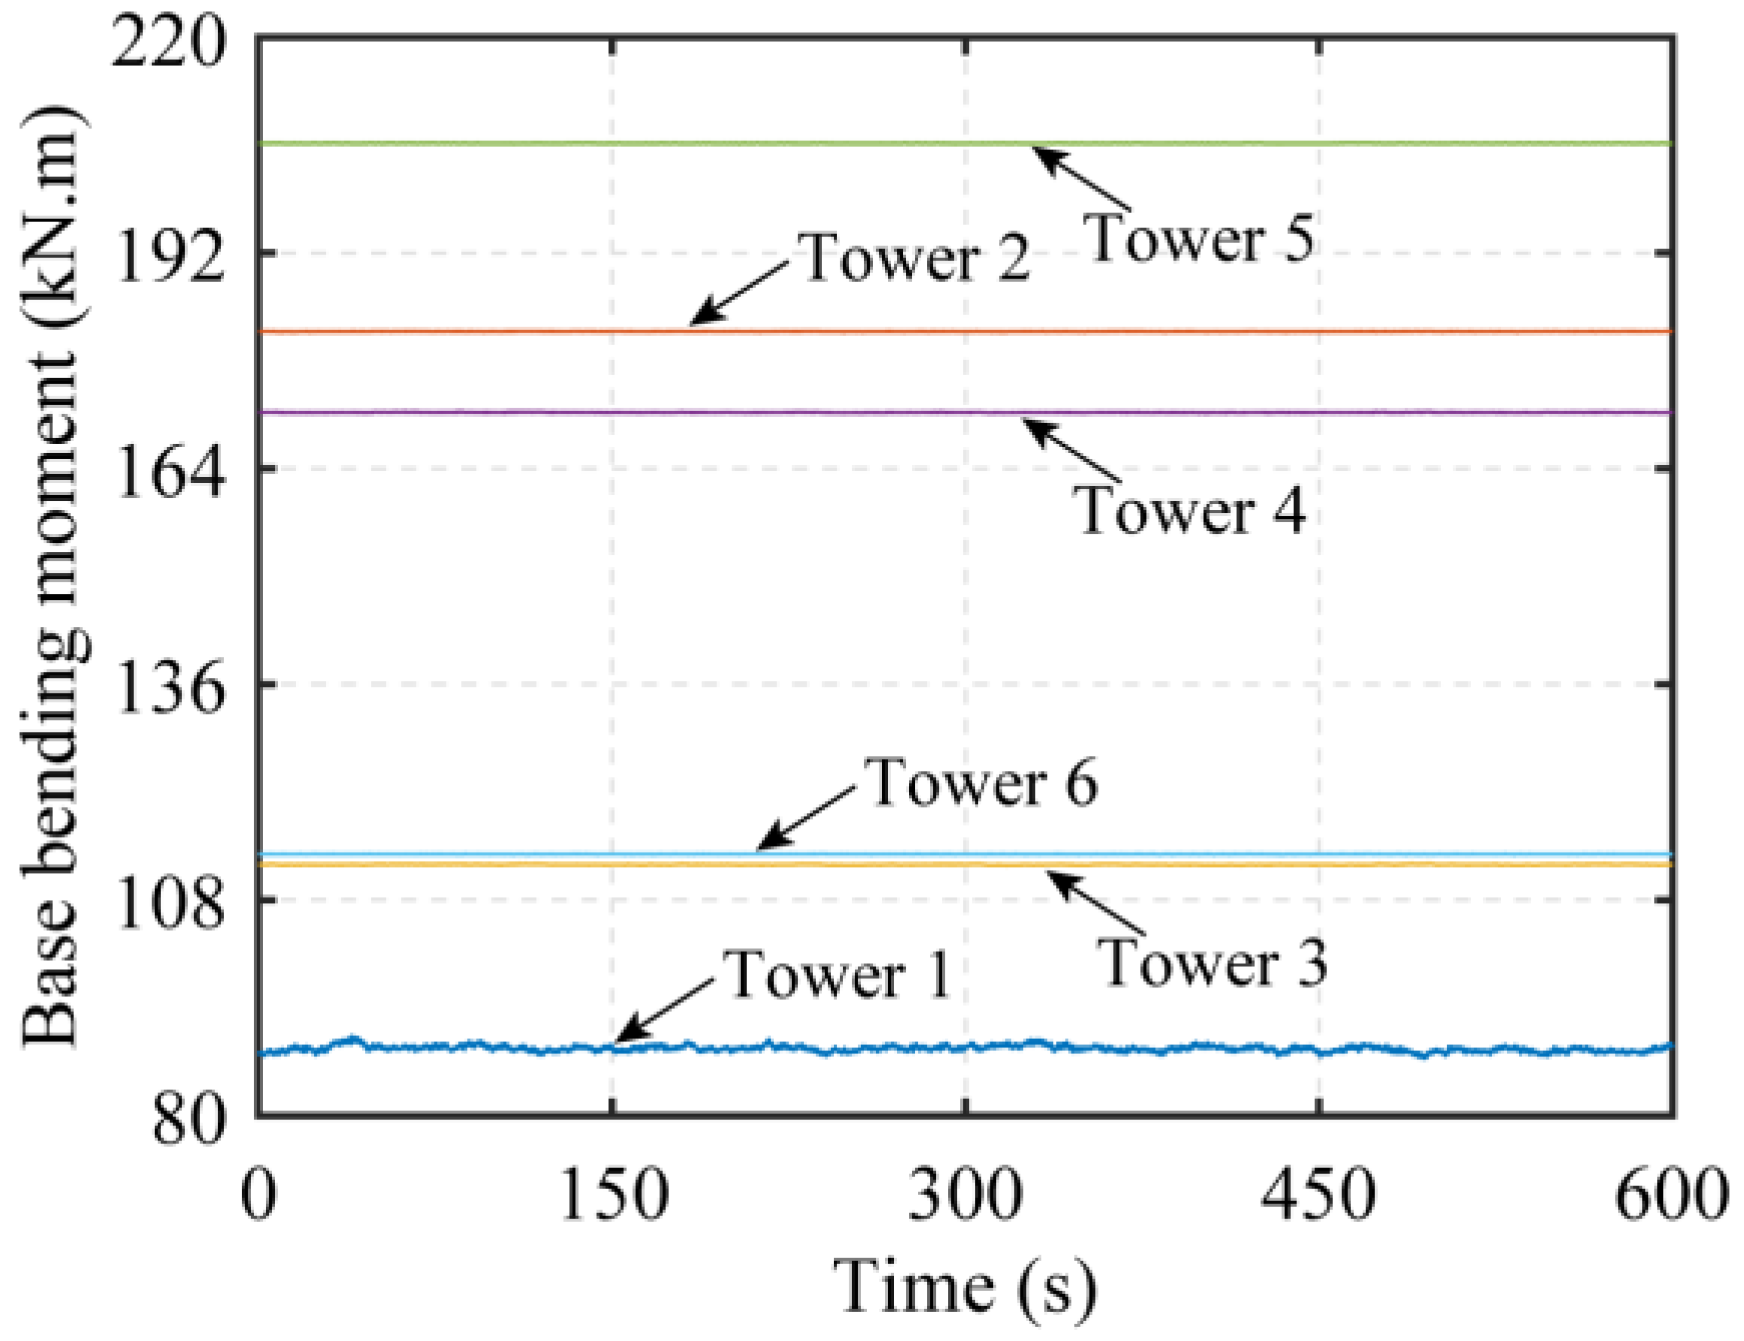
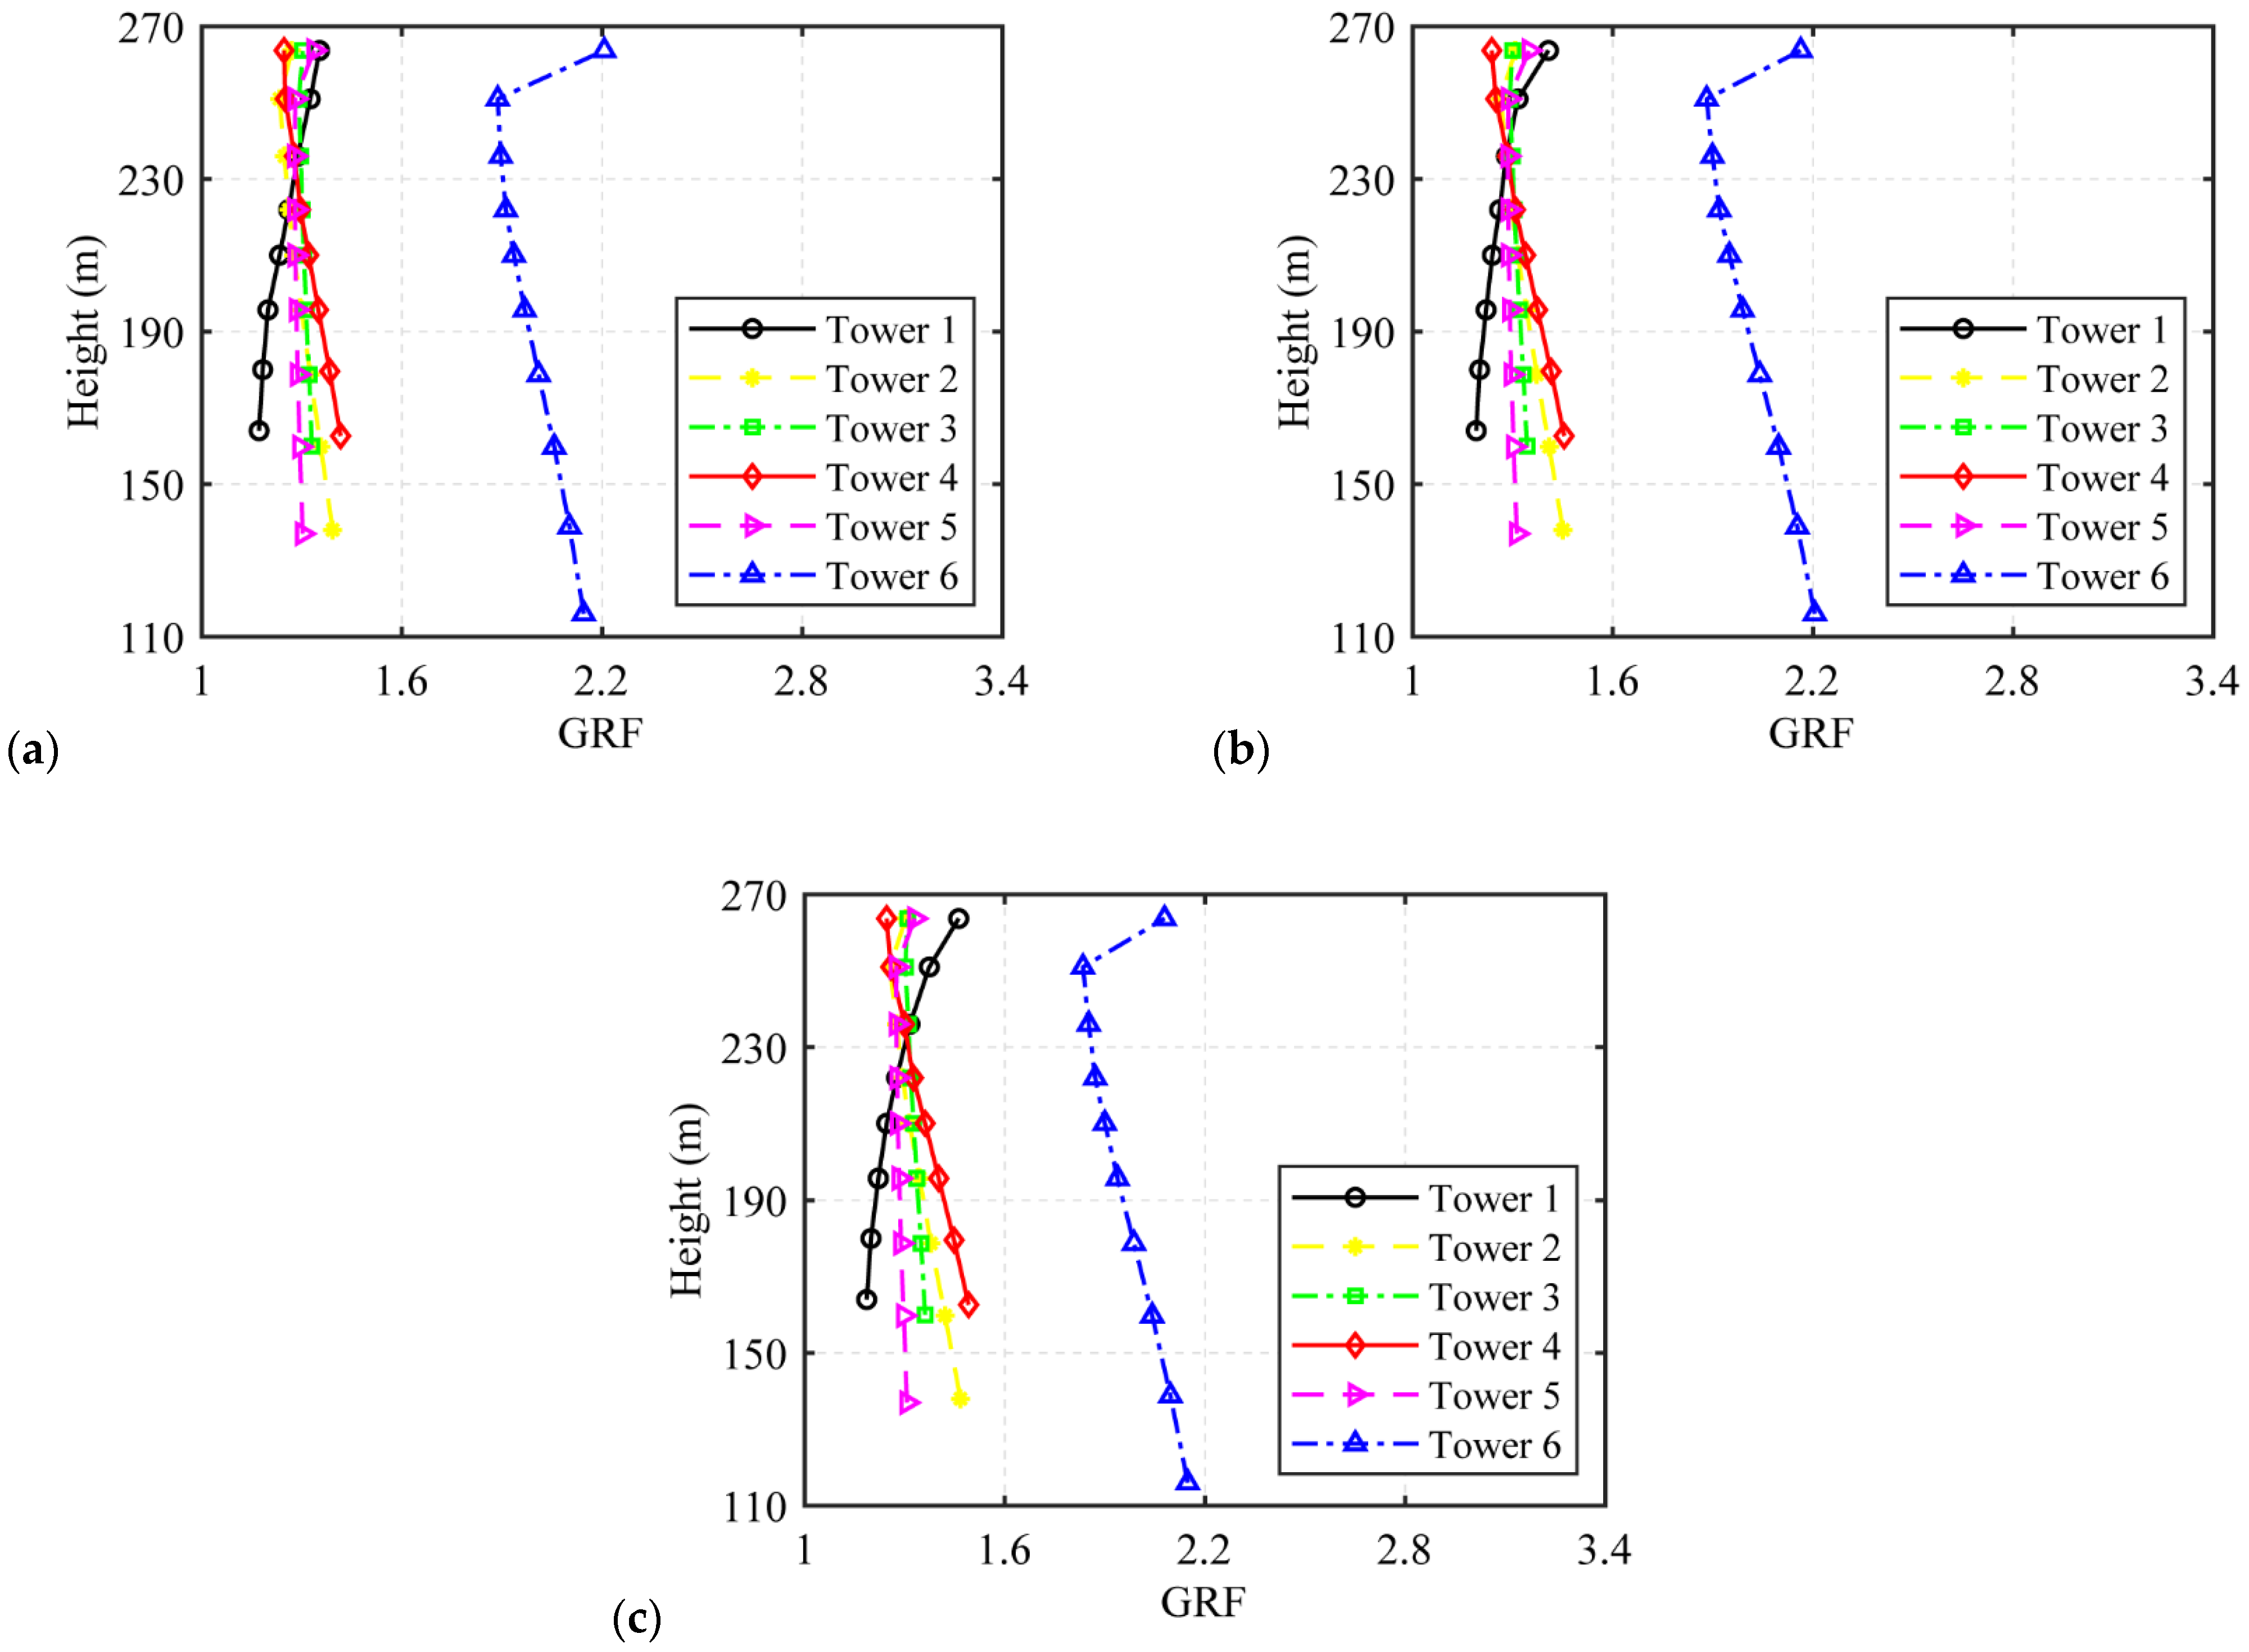
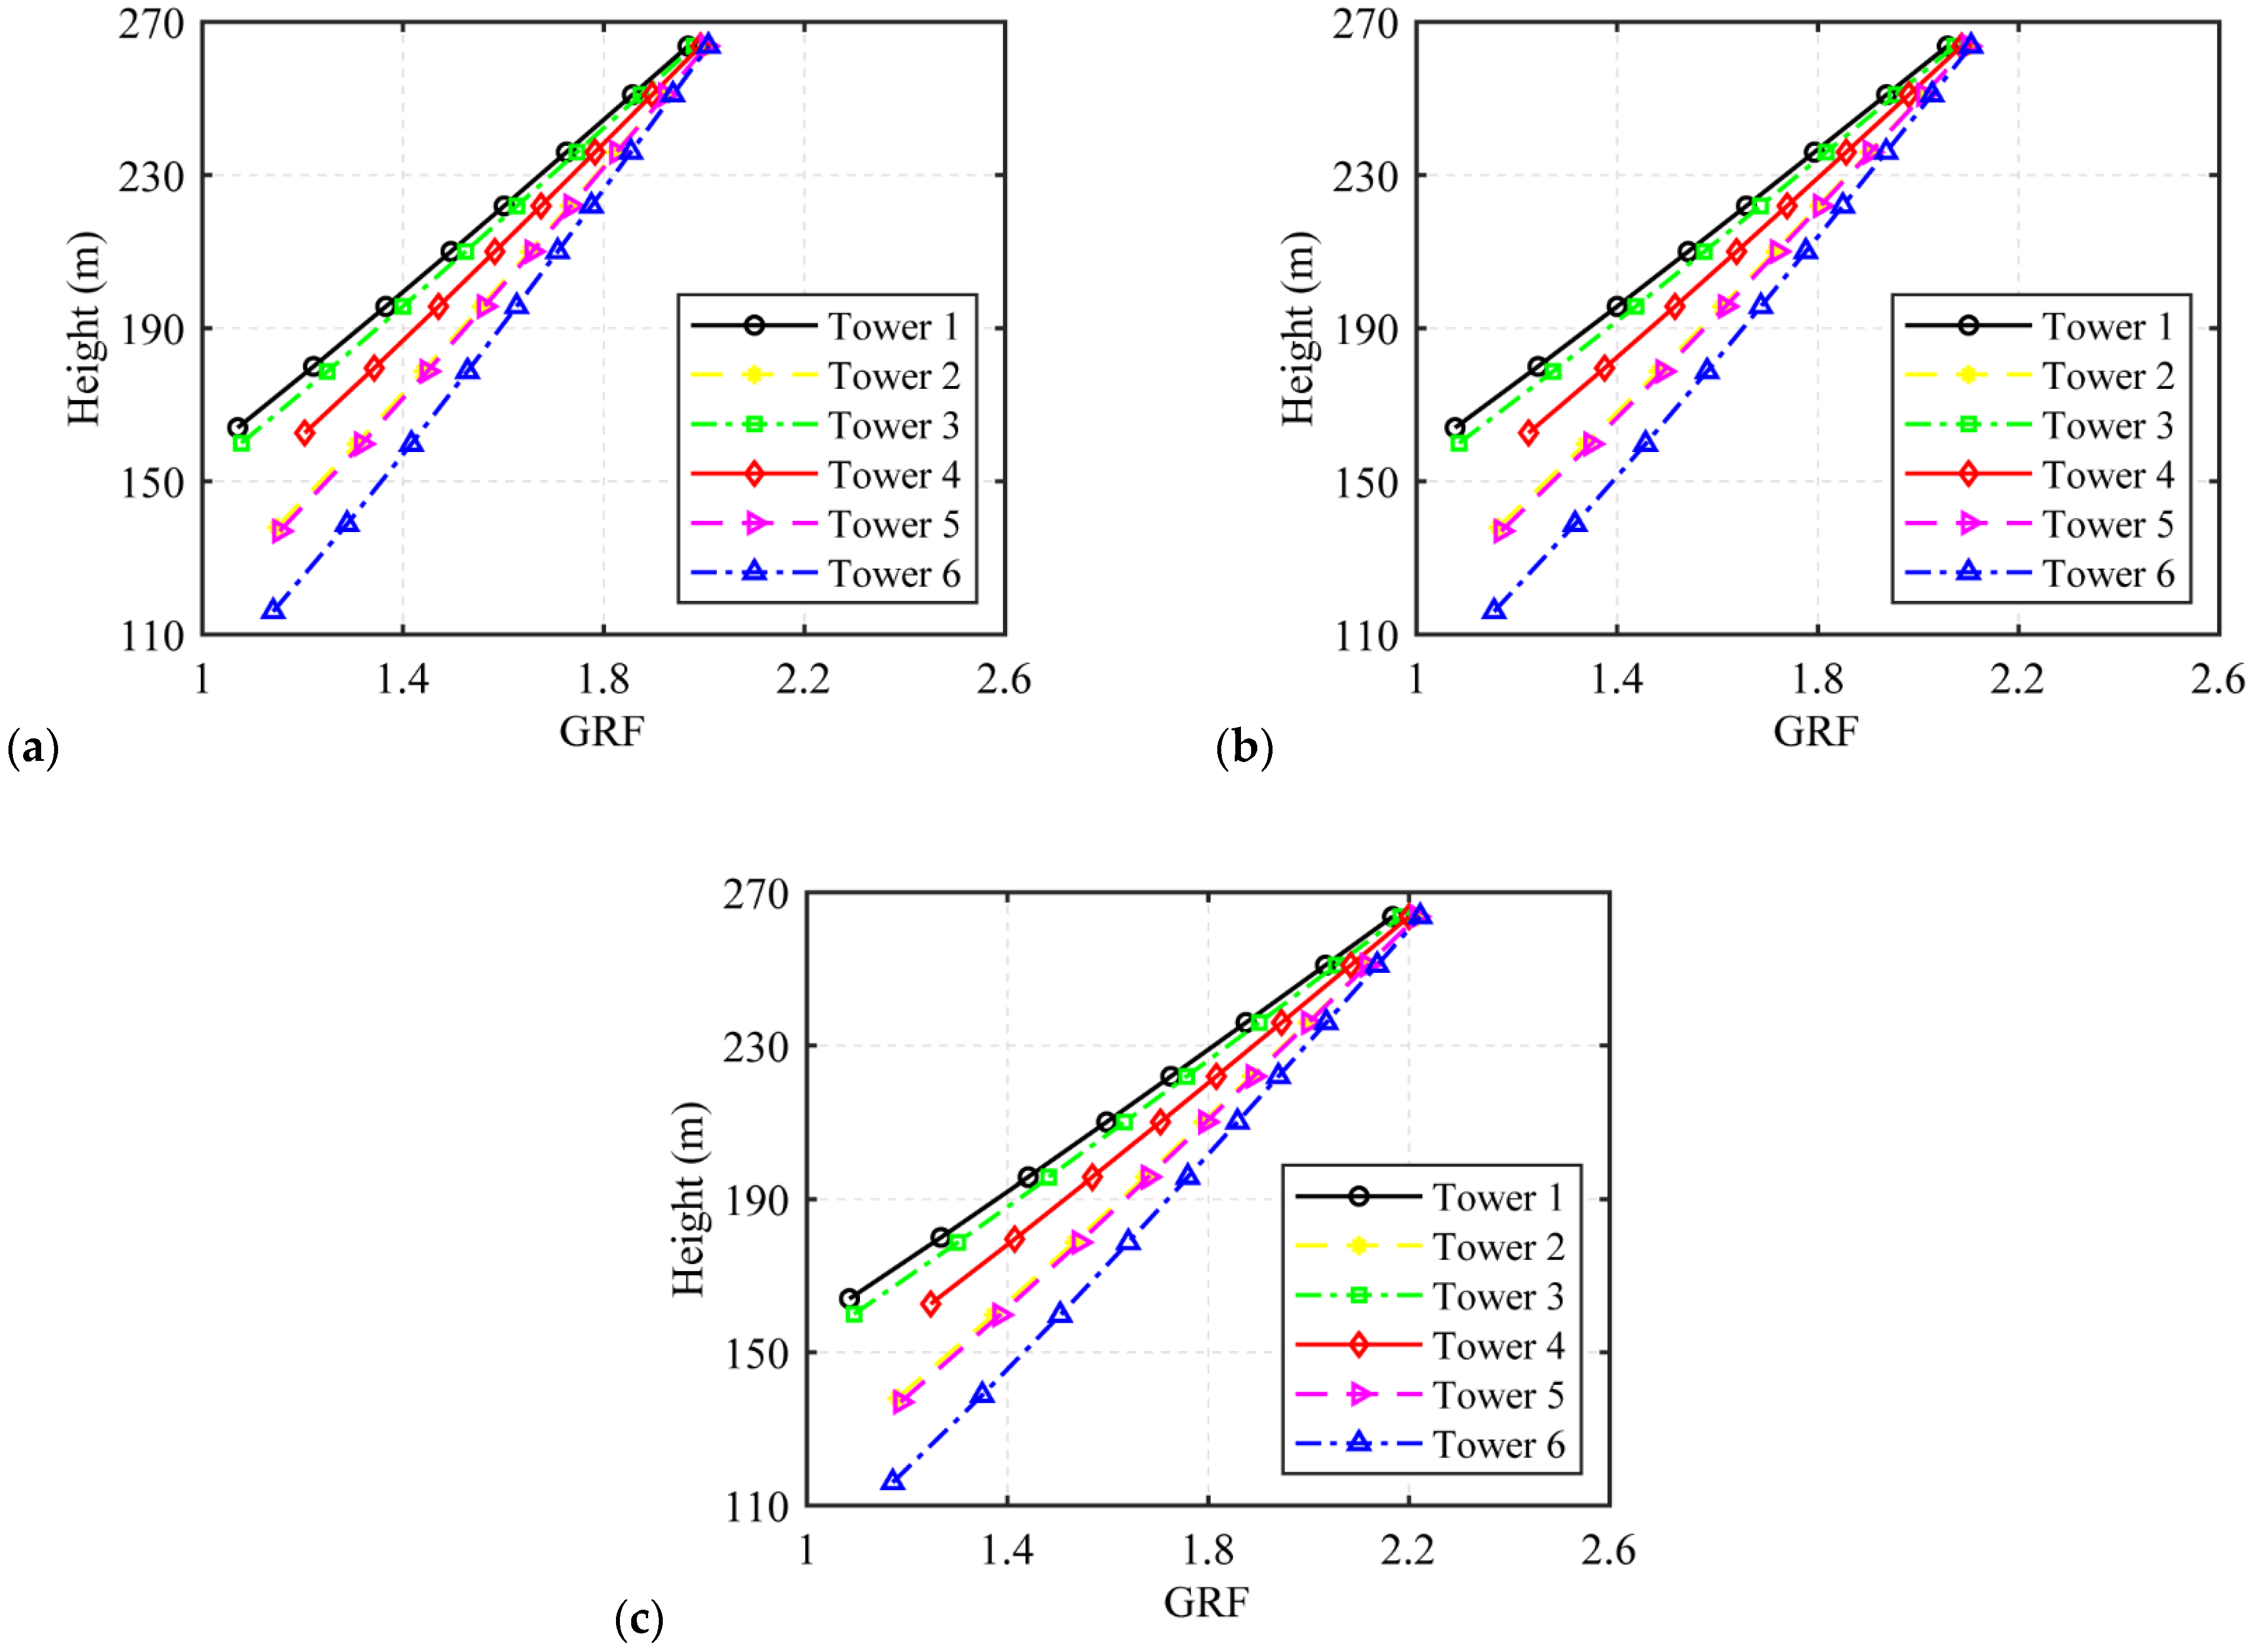
3.2. Vibration Analysis of the CCT System

This paper adopts a discretization scheme to conduct a wind-induced vibration analysis of the CCT system. The feed cabin is simplified into three loading points, where each cable is uniformly simplified into 30 loading points, and the supporting tower is simplified into 10–14 loading points according to the height. In total, there are 250 wind load simulation points in the CCT system. The coordinates of each loading point are extracted to be used as the reference for wind speed generation, and then the time series of wind loads are generated using the method described in Section 2. Subsequently, the load sequences are applied to the finite element model to perform a dynamic time history analysis of the cabin–cable–tower coupled system.
Figure 7 presents the displacement–time history curve of the feed cabin structure (Point 1) in the CCT system, specifically considering the influence of cable boundaries, including cases with flexible boundaries (with supporting towers) and rigid boundaries (without supporting towers). It should be noted that the east–west direction here refers to the x axis direction, while the north–south direction is the z axis direction. It can be observed from the displacement–time history of the feed cabin that the vibration belongs to the typical wind-induced forced vibration. First, the translational displacements along the two orthogonal directions are studied. Without considering the supporting towers, the mean values of the translational displacements along the east–west and north–south directions are 3 mm and −16.8 mm, respectively, as shown in Figure 7a,b. After considering the supporting towers, the translational displacement along the east–west direction obviously increases, while the translational displacement along the north–south direction remains almost unchanged. Similar observations can be made for the rotational displacements around the two axes, as shown in Figure 7c,d. Without considering the supporting towers, the mean values of the rotational displacements around the east–west and north–south axes are −1.4 × 10⁻³ rad and −1.0 × 10⁻⁴ rad, respectively. After considering the supporting towers, the rotational displacement around the east–west axis decreases significantly, while the rotational displacement around the north–south axis slightly increases. These phenomena indicate that the coupled effect in the east–west direction is more significant under the north wind, while the coupled effect in the north–south direction is relatively smaller.
Furthermore, the influence of the cable boundary on the translational and rotational displacement of the feed cabin is explored from the frequency domain. The PSD curves for four types of displacements are plotted in Figure 8. It is evident that each PSD curve exhibits multiple peaks, indicating that multiple vibration modes of the feed cabin are excited by the wind load. In the low-frequency range, all the PSD curves considering the supporting tower are coincident with those without considering the supporting tower, showing that the low-frequency wind components do not affect the coupled vibration of the CCT system. However, under the influence of high-frequency wind components, a significant disparity in the frequency domain is observed in the displacements of the feed cabin between the two conditions. Once the frequency exceeds 0.5 Hz, the PSD of the feed cabin considering the supporting towers is notably larger than that without considering the supporting towers. When accounting for the supporting towers, the response PSD curve of the feed cabin shows multiple peaks near 1 Hz, which corresponds to the first-order natural frequency of the towers, indicating that the supporting towers induce a resonance response of the feed cabin near the natural frequency of the towers, thus emphasizing the noteworthy impact of the supporting towers on the vibration of the feed cabin.
Subsequently, the translational displacements of the supporting tower tops, the cable tensions at the attachment points of the tower, and the total base moments of each supporting tower are extracted, as illustrated in Figure 9, Figure 10, and Figure 11, respectively. The response extraction point corresponding to each tower is shown in Figure 3, and the cable number corresponding each tower is shown in Figure 4. It can be observed that, at a basic wind speed of 6 m/s, there exists significant variation in the mean values of the translational displacements of supporting towers in both directions, as well as the total base moment. However, the fluctuation differences are minimal, mainly due to the predominant effect of self-weight. The mean values of the cable tensions are relatively close, primarily because the initial tensions in each cable are almost identical.

4. Gust Response Factor

4.1. Basic Theory

The ESWL makes the target response under static wind forces equal to the peak response under the actual dynamic wind load with a certain guarantee rate. The GRF method is commonly used for calculating the ESWL, which is defined as the ratio of the extreme response to the mean response [27]. The ESWL based on this method can be expressed as follows:
W eq = R ¯ + R max R ¯ W ¯ = β W ¯
where β is GRF; W ¯ is the mean wind load; and R ¯ is the mean value of the target response. It should be noted that the mean response here only considers the contribution of the wind load, so the initial contribution of gravity should be deducted; and R max is the maximum value of fluctuating responses.
The wind-induced response is a significant stochastic process, and the maximum values of the fluctuating response obtained in the time domain lack regularity. Thus, it should be described using statistical characteristics. It is usually assumed that the fluctuating response is a stationary Gaussian process, so R max can be associated with the root mean square (RMS) using the extreme value crossing theory [28]:
R max = g σ R
g = 2 ln υ T 0.5 + 0.577 2 ln υ T 0.5
where υ represents the average frequency of crossing zero with a positive slope; T represents the time range to obtain the maximum value; g is the peak factor; and σ R represents the RMS of the structural response. Therefore, the expression of GRF can be obtained by combining Equations (6) and (7):
β = 1 + g σ R R ¯
For each component in the CCT system, the equivalent target of the supporting towers can be selected as the displacement, axial force of the main members, and base bending moment; the equivalent target of the feed cabin can be chosen as the displacement; and the equivalent target of the cable can be selected as the tension.

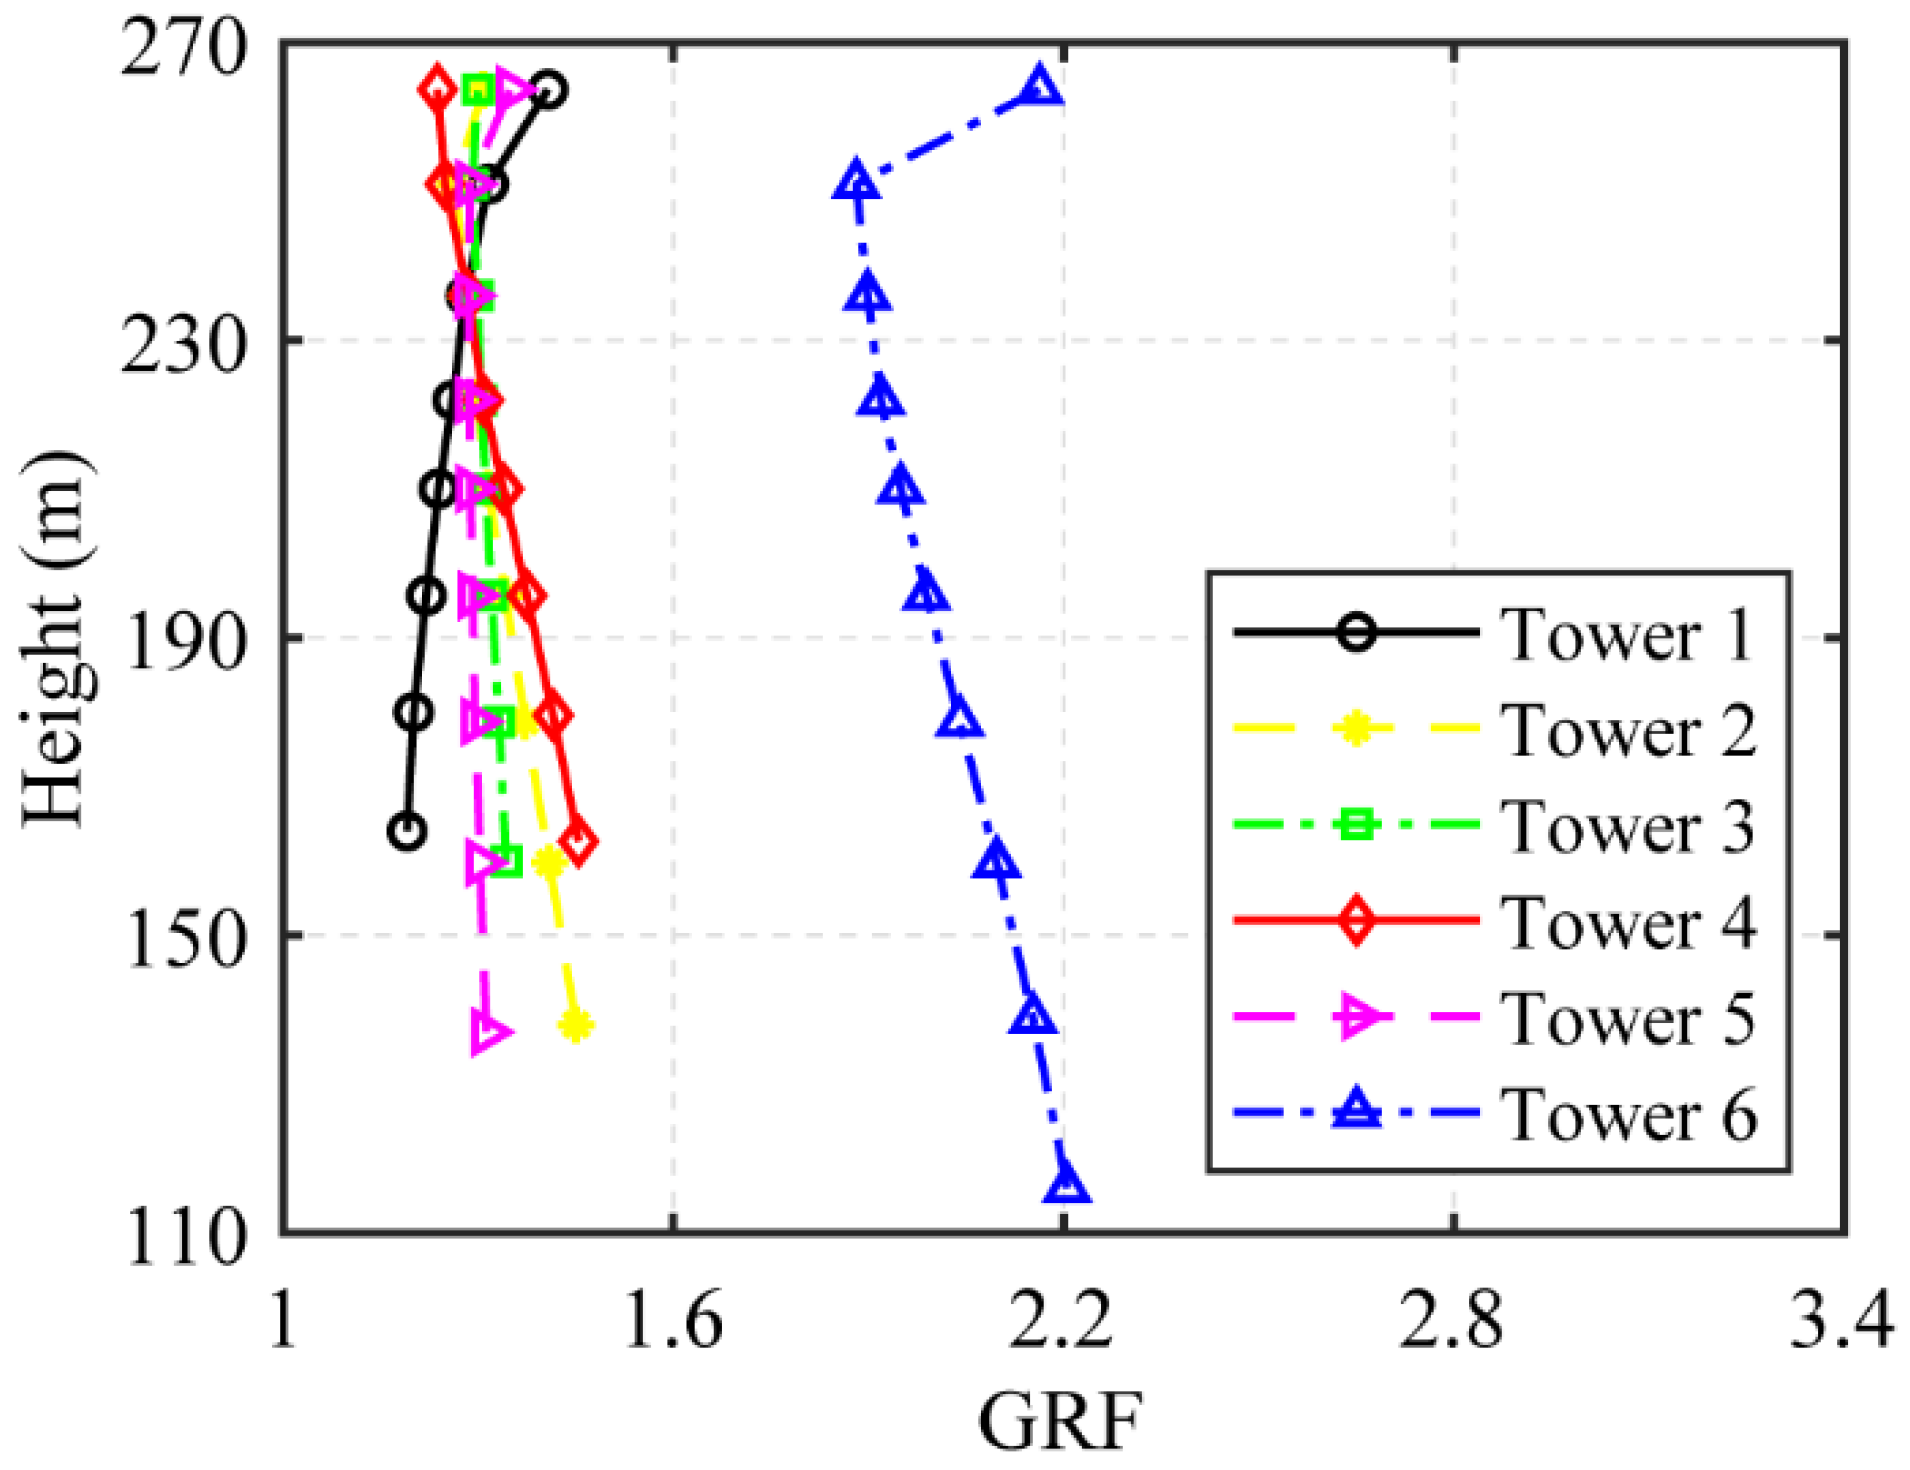
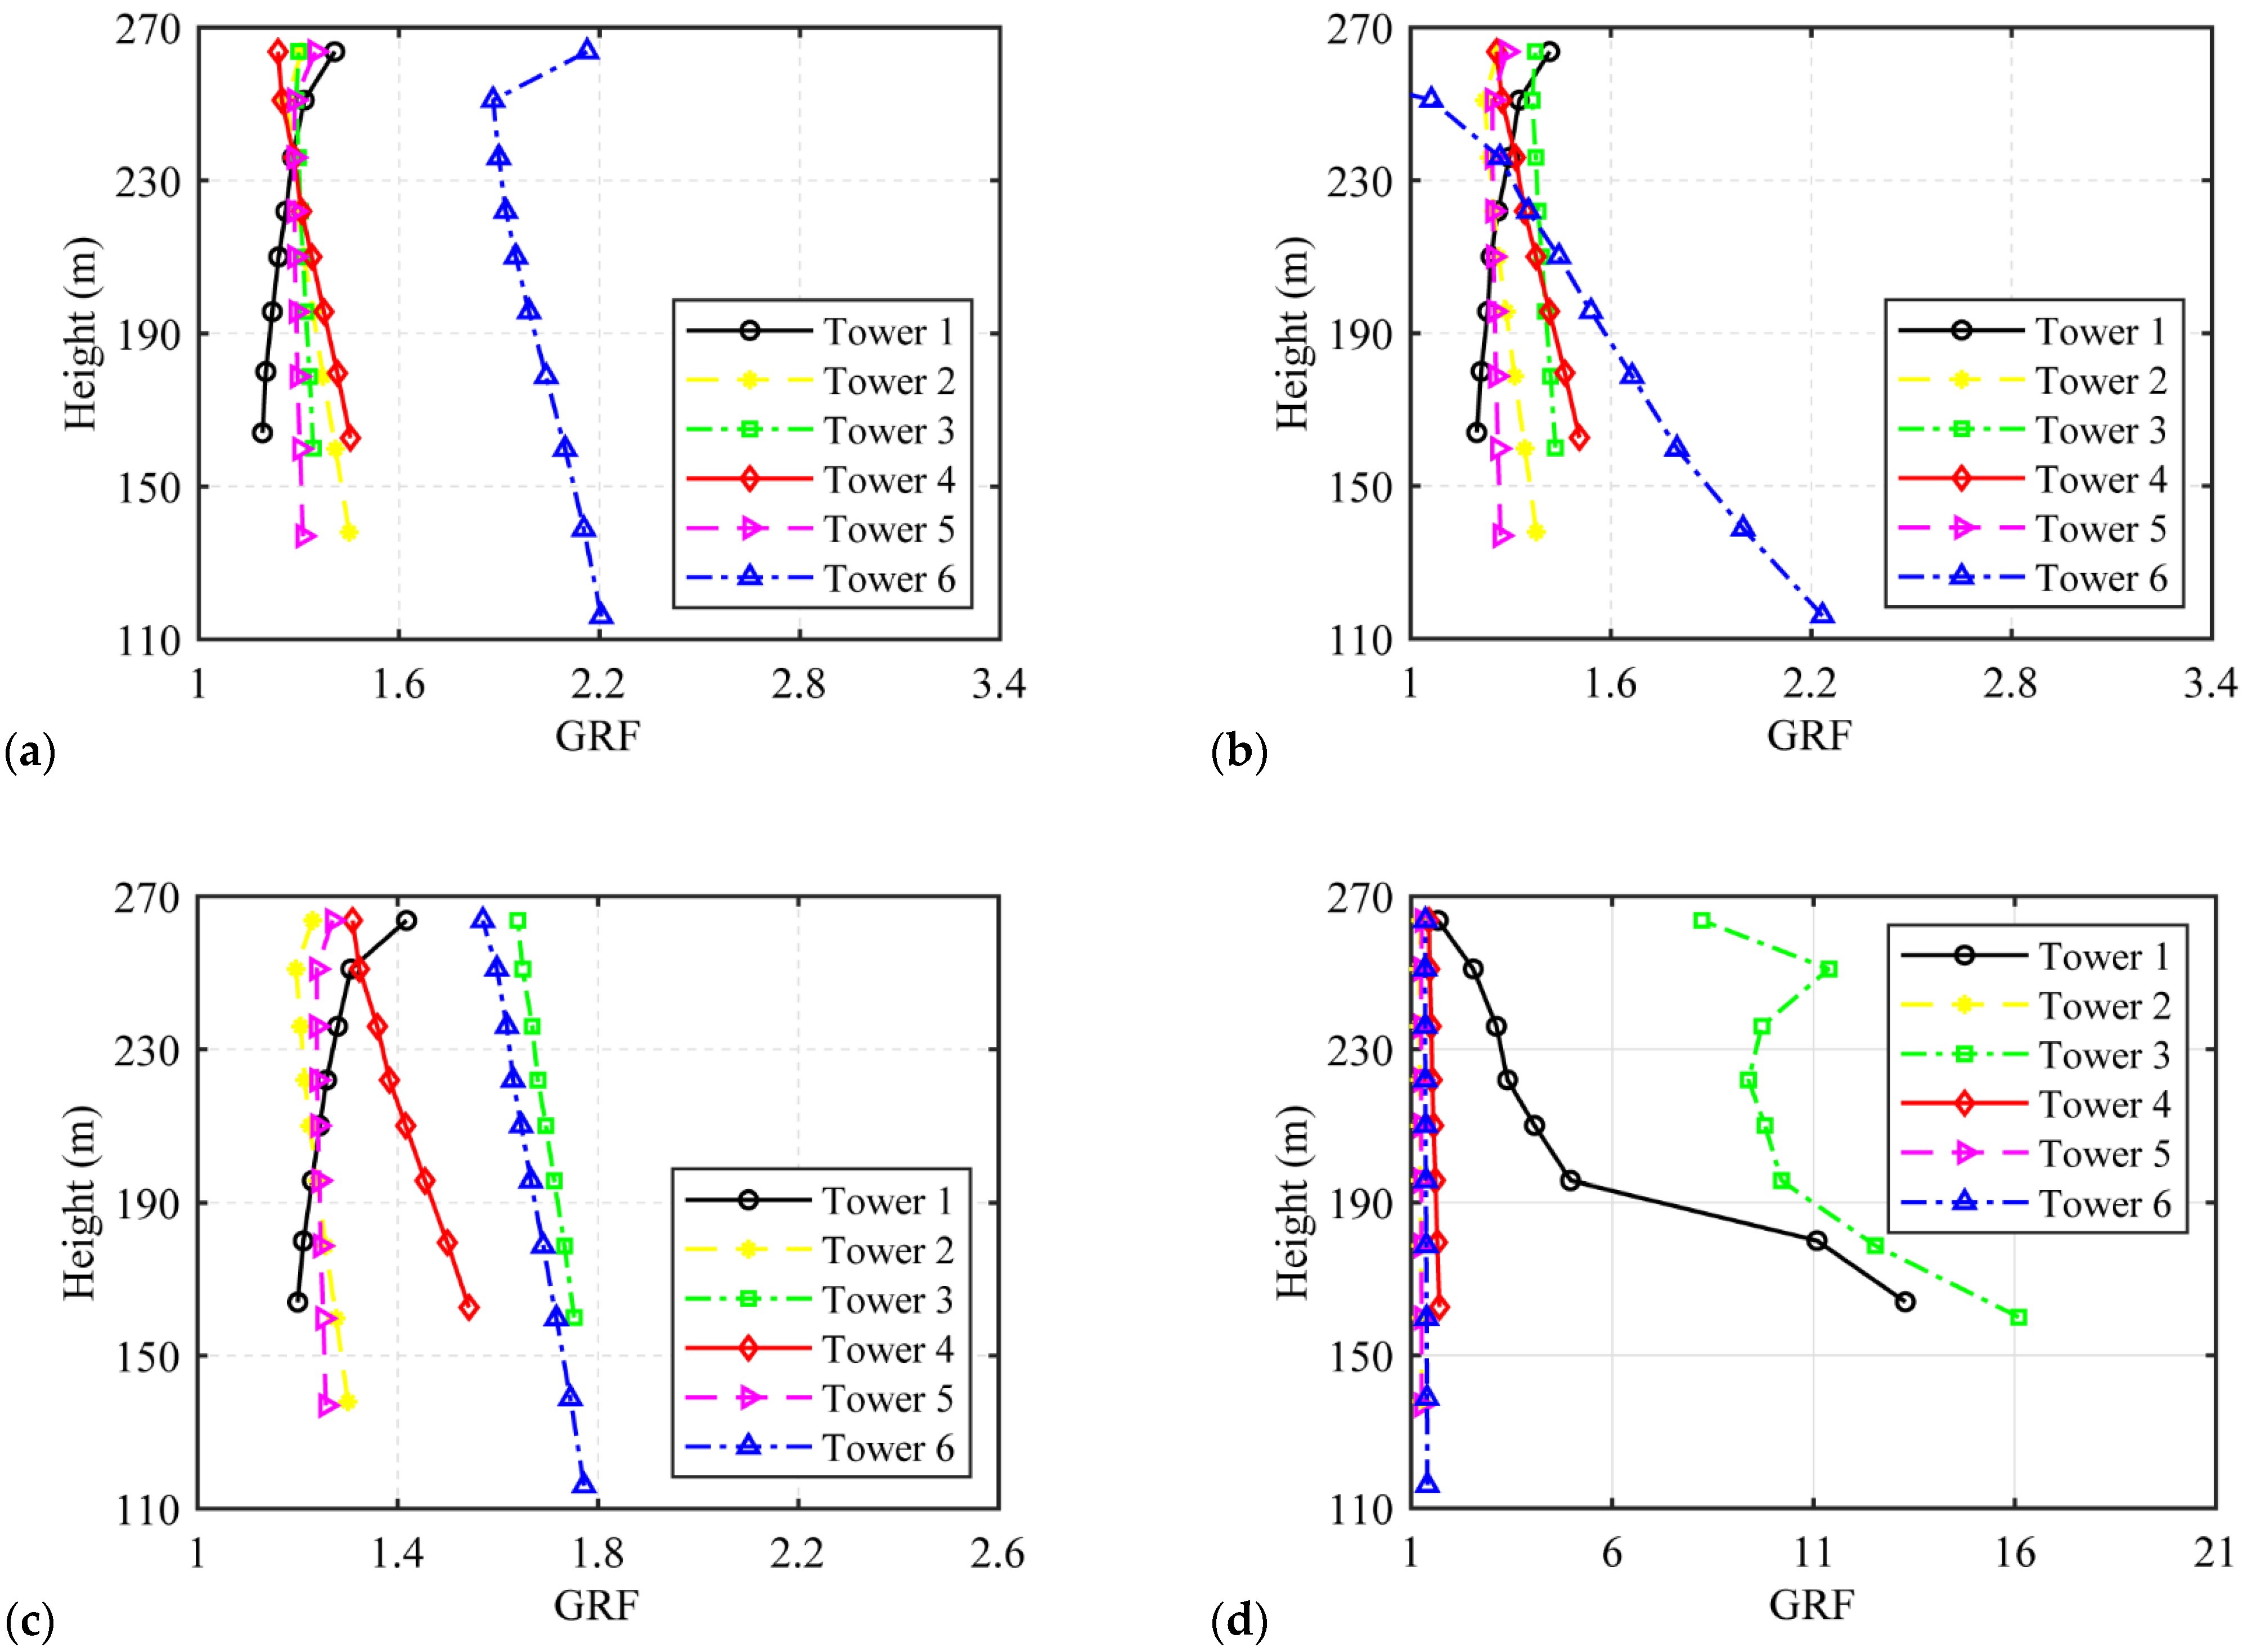
4.2. Calculation Results

Based on the above theory, the GRFs of each component in the CCT system are calculated separately. The GRFs based on the displacement of the feed cabin under the design wind speed in three directions are shown in Table 2. Both the along-wind and vertical GRFs are less than 2.0. However, the crosswind GRF exceeds 3.0, primarily due to the smaller mean displacement in the crosswind direction.
As the supporting tower bears the cable tension on one side, the cable tension is one of the main unbalanced forces affecting the structural safety of the supporting tower. Therefore, when calculating the GRF of cables, the tension at the cable attachment point of the supporting tower is taken as the equivalent target. Meanwhile, it is necessary to subtract the initial tension caused by the gravity load, and only consider the tension variation caused by the wind load. The GRFs based on the cable tension under design wind speed are computed, as shown in Table 3. The GRFs of Cable 1–Cable 5 show minimal differences, while the GRF of Cable 6 is much larger, mainly due to its smaller mean wind-induced response.
Furthermore, Table 4 provides the GRF based on the base-bending moment of the tower under design wind speed, which is basically consistent with the GRF based on the cable tension. The distribution law of the two GRFs shows a similar phenomenon, and the GRF of Tower 6 is much larger than those of the other five towers.
When calculating the GRF along the height of the tower, the displacement-based GRF needs to decompose the displacement onto the two principal axes of the tower, and such decomposition may introduce significant errors. Therefore, the axial force of the main members is used as the equivalent target, and the results are shown in Figure 12. The differences in GRFs between Tower 1 and Tower 5 are minimal, with values of approximately 1.3, while the GRF of Tower 6 increases significantly, also due to its smaller mean response.

5. Parametric Analysis on GRF

This section first discusses the influence of wind speed on the GRF of the CCT system. In the parametric analysis of wind speed, the wind direction is set to 0°. It should be noted that the wind comes from any direction in actual situations, so it is necessary to study the influence of wind direction on the GRF. In the parametric analysis of wind direction, the basic wind speed is set to 14 m/s, and four wind directions are considered: 0°, 15°, 30°, and 45°. A schematic diagram of the wind direction is shown in Figure 4.

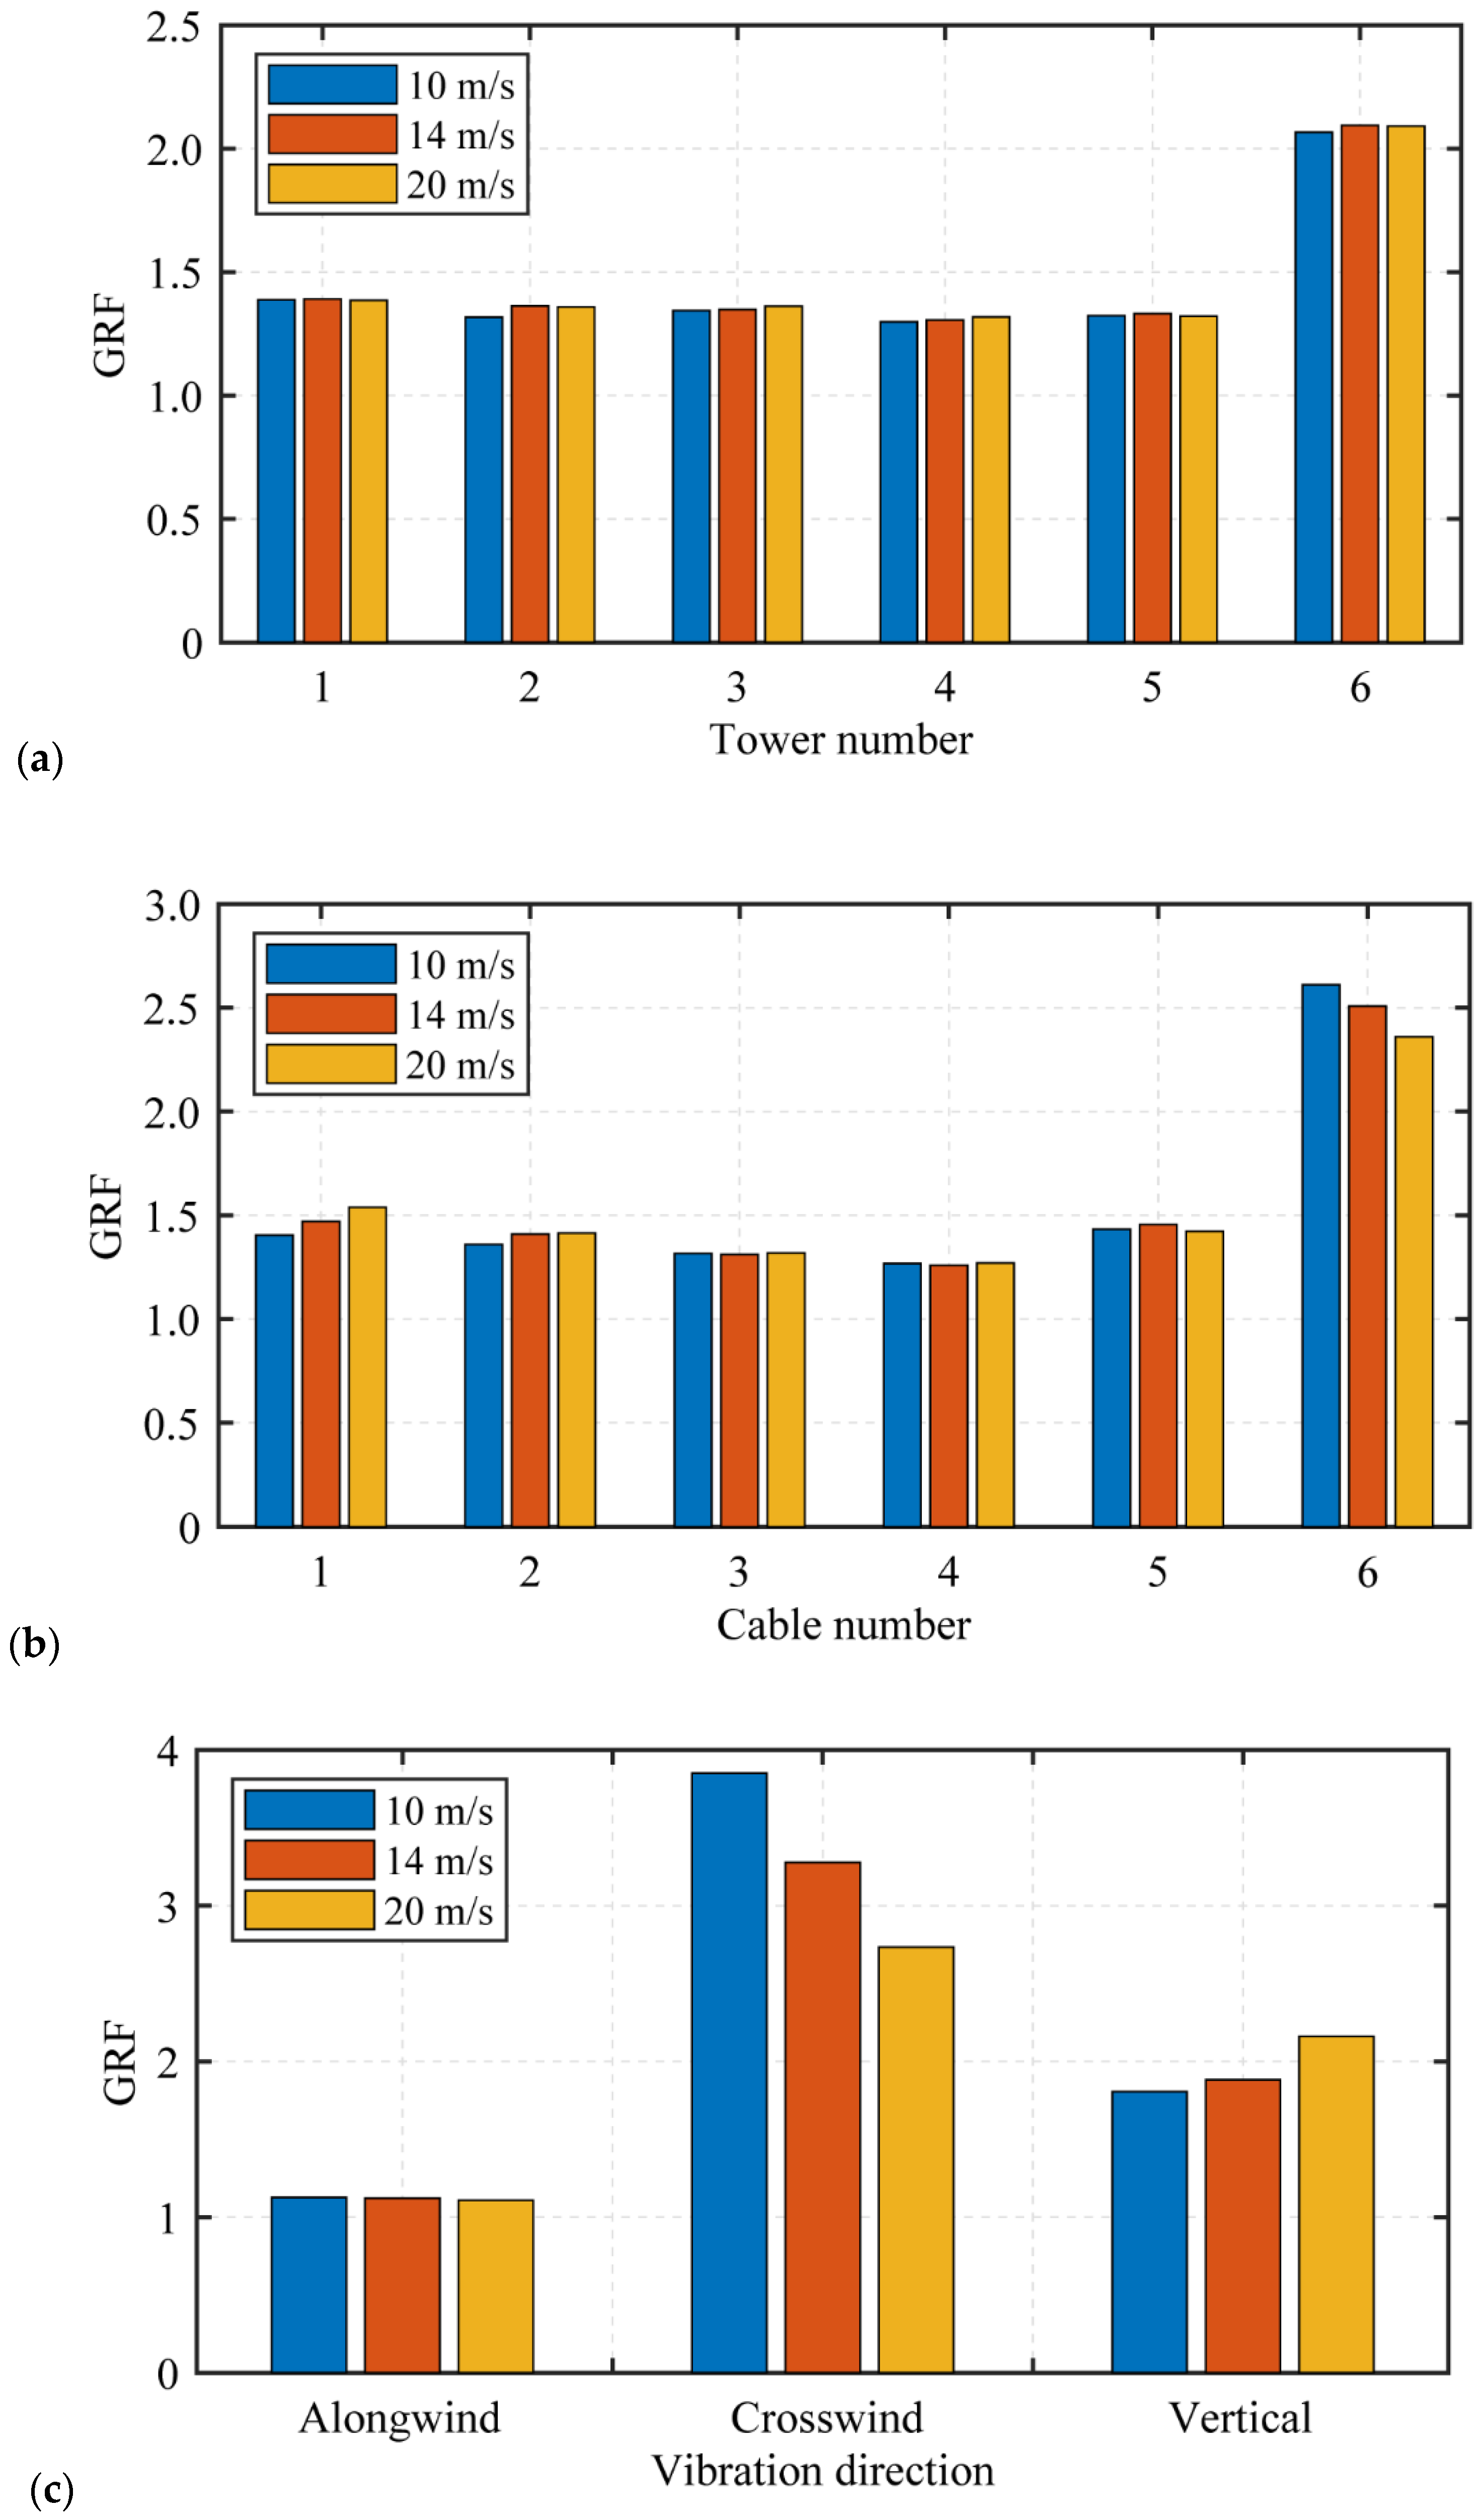
5.1. Influence of Wind Speed

Figure 13 presents GRFs based on different equivalent targets under different basic wind speeds. Under most conditions, the basic wind speed has no significant impact on the GRF based on the tower base-bending moment and cable tension, as shown in Figure 13a,b. For Tower 1 to Tower 5 and from Cable 1 to Cable 5, both the GRFs based on the base-bending moment and cable tension are approximately 1.4. However, the GRFs of Tower 6 and Cable 6 are much higher, with the GRF based on the base-bending moment being approximately 2.1, and the GRF based on cable tension being even larger and gradually decreasing with the increasing wind speed. Then, Figure 13c provides the three-dimensional GRFs of the feed cabin. The GRF based on the along-wind displacement is not sensitive to basic wind speed and its value is very small. In contrast, wind speed has a significant influence on the GRFs in the other two directions. The GRF based on the crosswind displacement significantly decreases with increasing basic wind speed. The GRF based on the vertical displacement gradually increases with an increasing basic wind speed, but the variation is limited. It should be noted that the GRFs based on the crosswind and vertical displacement are much larger than the result based on the along-wind displacement.
Finally, taking the axial force of the main members of the towers as the equivalent target, the GRFs based on both the simulation-based method and the code-based method are determined, as shown in Figure 14 and Figure 15, respectively. Due to the structural similarities between the supporting tower and the transmission tower, the Chinese code “Load code for the design of overhead transmission line” (DL/T 5551-2018) [29] is adopted as the reference for the GRF calculation. It is evident that the GRFs based on both methods are not sensitive to wind speed. The code-based GRF gradually increases from the bottom to the top of the tower in a linear manner as there is no sudden change in the mass of the supporting tower. In contrast, the simulated GRFs exhibit different trends for the six towers, indicating significant differences between the GRFs of the towers in the coupled system and those of the single towers. It should be noted that a sudden change in the simulated GRF occurs near the attachment point of the cable, suggesting that the cable has an obvious influence on the GRF of the towers.

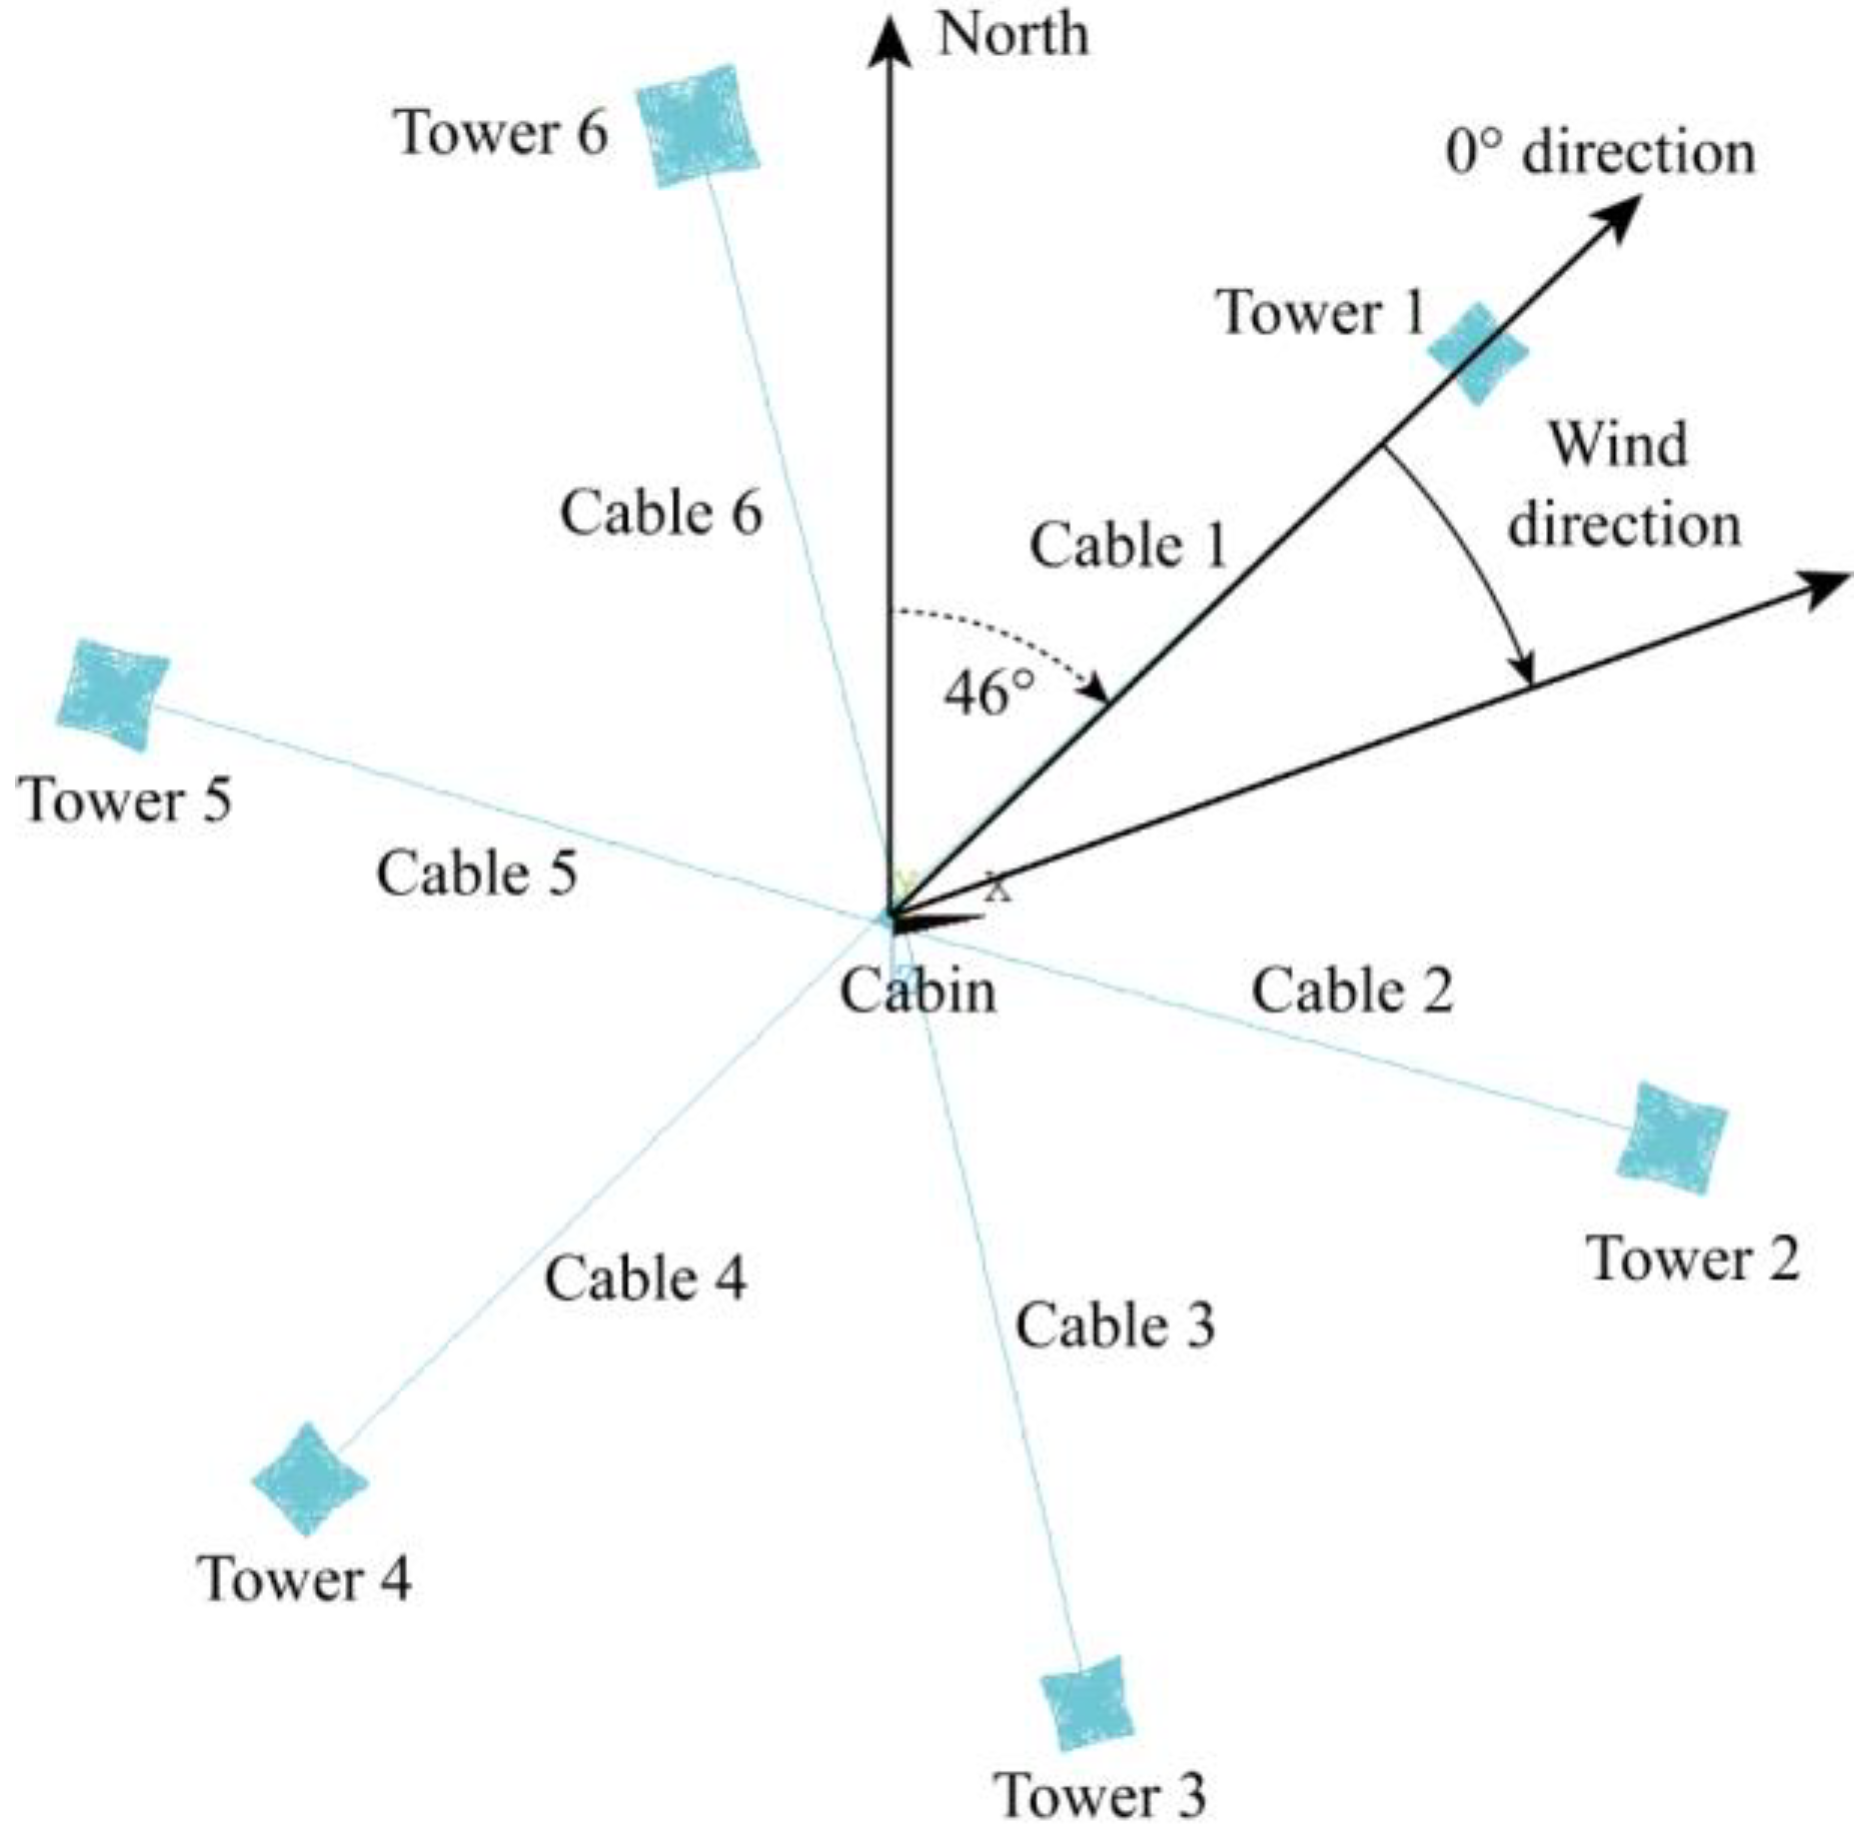
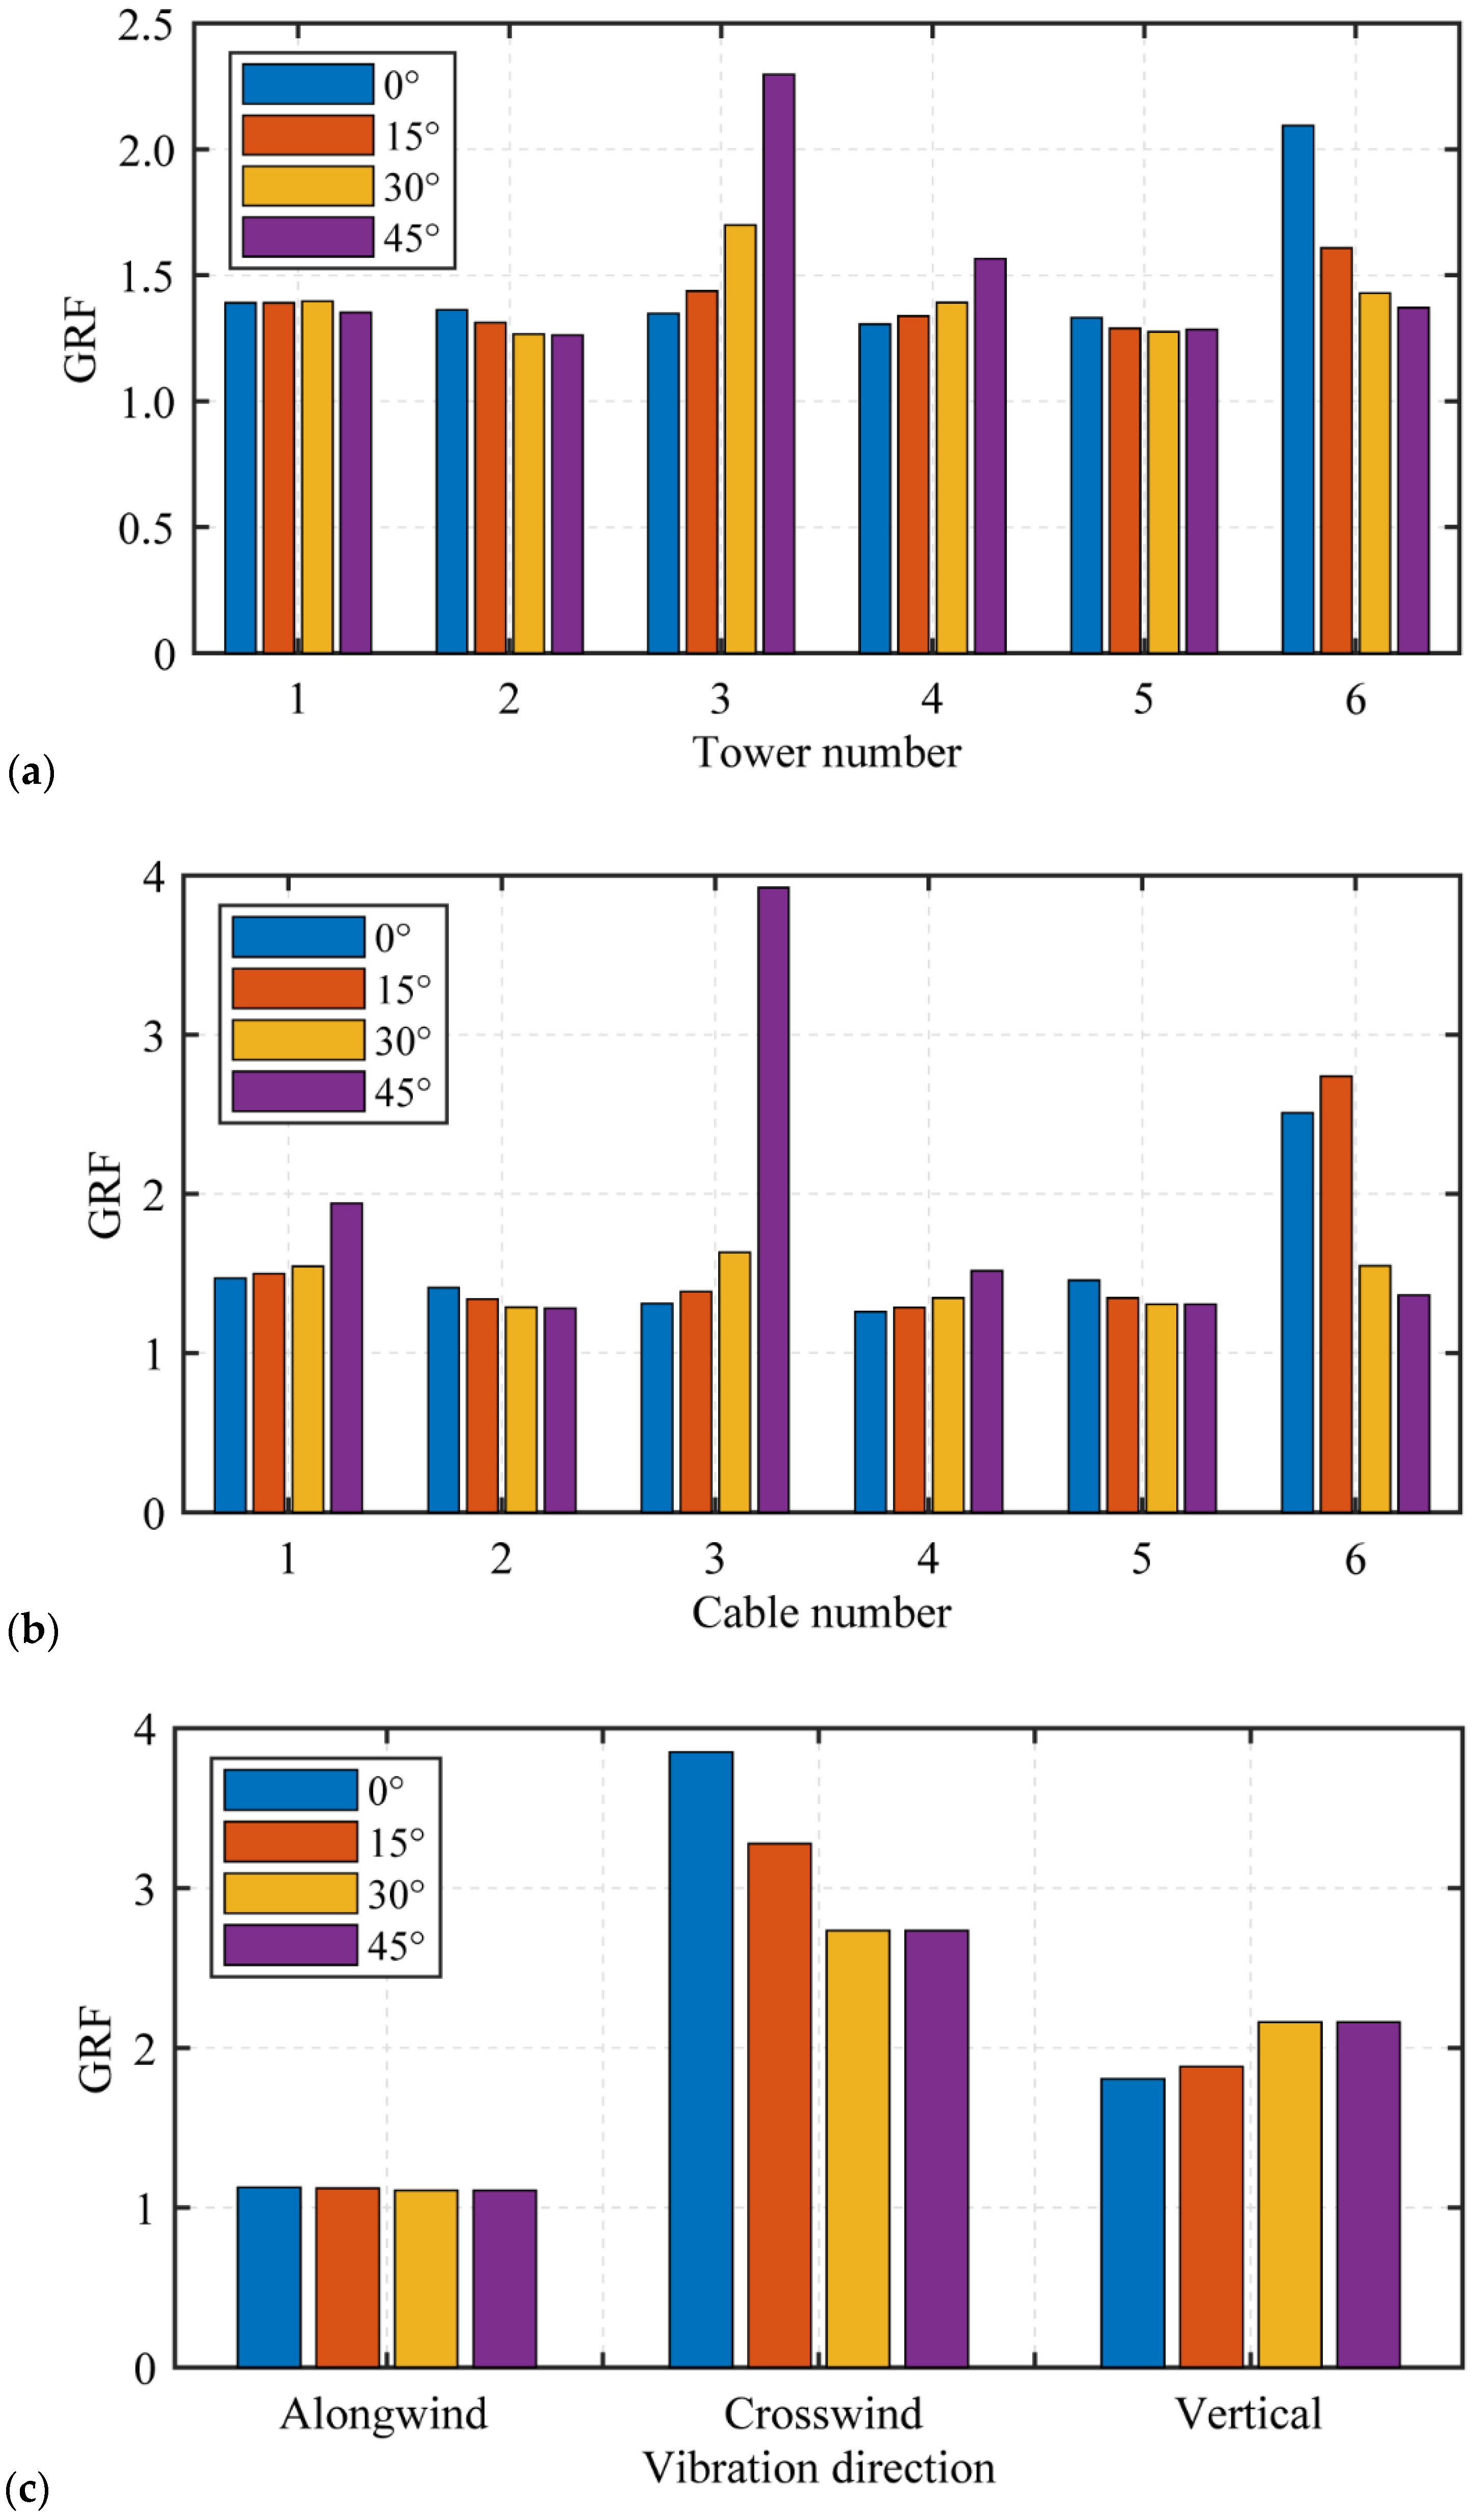
5.2. Influence of Wind Direction

This section examines the impact of the wind direction on various GRFs. Figure 16 displays the GRFs based on different responses under various wind directions. The parameter analysis only considers the wind directions ranging from 0° to 60° due to the structural symmetry of FAST. According to Figure 16a, the influence of wind direction on the GRF based on the base-bending moment varies among the towers. Tower 3 and Tower 4 exhibit a significant increase in GRF with an increasing wind direction, while Tower 6 shows a decrease. The effect of wind direction on the other three towers is not apparent. As shown in Figure 16b, the GRFs for Cable 1, Cable 3, and Cable 4 gradually increase as the wind direction increases, with Cable 3 experiencing a substantial increase. On the other hand, Cable 2 and Cable 5 show a gradual decrease in GRF with an increasing wind direction, while Cable 6 initially increases and then decreases, with a relatively large value. For the feed cabin, the wind direction has little impact on the GRF based on along-wind displacement. The GRF based on the crosswind displacement significantly decreases with increasing wind speed, and the values are relatively large. The GRF based on the vertical displacement gradually increases with increasing wind speed, but the variation is limited.
Furthermore, the GRFs based on the axial force of the main members of towers under different wind directions are also calculated, as illustrated in Figure 17. The change in GRF for the towers does not exhibit a specific law with a varying wind direction, except for Tower 6, which shows significant variation. The results for the other five towers are comparatively concentrated. These phenomena indicate that it is not applicable to directly calculate the GRF based on existing design specifications for such complex coupled systems.

6. Summary and Conclusions

This paper investigates the wind-induced vibration characteristics for the CCT coupled system of FAST. First, a refined finite element model of FAST is established, and wind-induced dynamic time history analysis is conducted based on the stochastic simulation of wind fields, particularly considering the influence of the cable boundary conditions on the time–frequency domain responses of the feed cabin. After that, the GRFs of different structural components in the coupled system are determined. Finally, the evolution laws of the GRF under different wind speeds and directions are revealed. The summarized conclusions of the study are as follows:
(1) Under the action of northerly wind, significant differences in rotational and translational displacements of the feed cabin are observed in the time domain before and after considering the supporting tower, with a more pronounced variation along the east–west direction.
(2) There is no change in the PSD of the feed cabin response in the low-frequency range considering or not considering the supporting tower. However, compared to the case without considering the supporting towers, the PSD with supporting towers increases significantly in the high-frequency range, showing certain resonance near the first-order natural frequency of the tower structure.
(3) Under a wind direction angle of 0°, the wind speed has no apparent impact on the GRF based on the base-bending moment of the tower or the GRF based on the cable axial force.
(4) For the feed cabin, the GRF based on the along-wind displacement shows no sensitivity to wind speed or wind direction. As the wind speed or wind direction increases, the GRF based on the cross-wind displacement decreases significantly, while the GRF based on the vertical displacement gradually increases.
It should be stated that there is no appropriate design standard that can be directly used to guide the engineering design for a complex coupled system like FAST, so the FEM-based nonlinear dynamic analysis method must be adopted for a special calculation, and this paper provided a reasonable analysis process. For similar structures, the results obtained in this study can be directly used for design.
Moreover, the advantage of the CCT system is that it helps to suspend the feed cabin, and more signals can be received for observing celestial bodies. However, the CCT system is a wind-sensitive structure, and the displacement of the feed cabin can easily exceed the limit under wind load, thereby affecting normal operation. In practice, a damper can be installed in the feed cabin to reduce the wind-induced vibration.

Author Contributions

Conceptualization, D.-X.M. and H.-N.L.; methodology, D.-X.M.; software, D.-X.M.; validation, D.-X.M., H.-N.L. and Q.-W.L.; formal analysis, D.-X.M.; investigation, D.-X.M.; resources, D.-X.M.; data curation, D.-X.M.; writing—original draft preparation, D.-X.M.; writing—review and editing, H.-N.L.; visualization, Q.-W.L.; supervision, H.-N.L.; project administration, H.-N.L.; funding acquisition, H.-N.L. All authors have read and agreed to the published version of the manuscript.

Funding

This research was funded by [National Natural Science Foundation of China] grant number [52027811 and 11973006] and The APC was funded by [National Natural Science Foundation of China].

Data Availability Statement

Data available on request due to restrictions eg privacy or ethical. The data presented in this study are available on request from the corresponding author.

Acknowledgments

This research was supported by the National Natural Science Foundation of China (grant nos. 52027811 and 11973006), as gratefully acknowledged by the authors.

Conflicts of Interest

The authors declare no conflict of interest.

References

  1. Zhu, W.X.; Sang, R.H.; Yang, L.; Lei, H. Optimizing the anchoring structure for a super large cable-net structure with improved fatigue resistance. Adv. Struct. Eng. 2020, 23, 657–669. [Google Scholar] [CrossRef]
  2. Lemonick, S. Arecibo telescope will be dismantled. Chem. Eng. News 2020, 98, 8. [Google Scholar] [CrossRef]
  3. Yao, R.; Fu, C.H.; Sun, C.H.; Zhu, W.B. Accuracy design of the stewart manipulator of the Five-hundred-meter Aperture Spherical radio Telescope. Adv. Mech. Eng. 2019, 11, 1687814019840840. [Google Scholar] [CrossRef]
  4. Yu, L.M.; Hock, F.T.E.; Suo, S.F.; Ren, G.X. Experimental research of first feed-support system of fast. Exp. Astron. 2003, 15, 113–122. [Google Scholar] [CrossRef]
  5. Xiao, Z.Z.; Liu, H.L.; Li, Z.L.; Yu, D.K.; Li, Y.G. Research on wind-induced reliability of double column suspended guyed tower in strong wind area. Int. J. Struct. Stab. Dyn. 2016, 16, 1640011. [Google Scholar] [CrossRef]
  6. Ma, T.T.; Zhao, L.; Ji, T.F.; Tang, T. Case study of wind-induced performance and equivalent static wind loads of large-span openable truss structures. Thin-Walled Struct. 2022, 175, 109206. [Google Scholar] [CrossRef]
  7. Tian, L.; Pan, H.Y.; Ma, R.S.; Zhang, L.J.; Liu, Z.W. Full-scale test and numerical failure analysis of a latticed steel tubular transmission tower. Eng. Struct. 2020, 208, 109919. [Google Scholar] [CrossRef]
  8. Zheng, H.D.; Fan, J. Progressive collapse analysis of a truss transmission tower-line system subjected to downburst loading. J. Constr. Steel Res. 2022, 188, 107044. [Google Scholar] [CrossRef]
  9. Liang, S.G.; Zou, L.H.; Wang, D.H.; Cao, H. Investigation on wind tunnel tests of a full aeroelastic model of electrical transmission tower-line system. Eng. Struct. 2015, 85, 63–72. [Google Scholar] [CrossRef]
  10. Zhang, Q.; Fu, X.; Ren, L.; Jia, Z.G. Modal parameters of a transmission tower considering the coupling effects between the tower and lines. Eng. Struct. 2020, 220, 110947. [Google Scholar] [CrossRef]
  11. Kasperski, M. Extreme wind load distributions for linear and nonlinear design. Eng. Struct. 1992, 14, 27–34. [Google Scholar] [CrossRef]
  12. Chen, X.Z.; Kareem, A. Equivalent static wind loads on buildings: New model. J. Struct. Eng. 2004, 130, 1425–1435. [Google Scholar] [CrossRef]
  13. Davenport, A.G. Gust response factors for transmission line loading. In Proceedings of the Fifth International Conference on Wind Engineering, Fort Collins, CO, USA, 8–13 July 1979; Pergamon: Tarrytown, NY, USA, 1980. [Google Scholar]
  14. Deng, H.Z.; Si, R.J.; Hu, X.Y.; Duan, C.Y. Wind tunnel study on wind-induced vibration responses of a UHV transmission tower-line system. Adv. Struct. Eng. 2013, 16, 1175–1185. [Google Scholar] [CrossRef]
  15. Jiang, P.; Yue, Y.L.; Gan, H.Q.; Yao, R.; Li, H.; Pan, G.F.; Sun, J.H.; Yu, D.J.; Liu, H.F.; Tang, N.Y.; et al. Commissioning progress of the FAST. Sci. China-Phys. Mech. Astron. 2019, 62, 959502. [Google Scholar] [CrossRef]
  16. Jiang, P.; Li, Q.W.; Nan, R.D. Research on design of adaptive connecting mechanisms for the cable-net and panels of FAST. Res. Astron. Astrophys. 2017, 17, 099. [Google Scholar] [CrossRef]
  17. Irvine, M. Cable Structures; The MIT Press: Cambridge, MA, USA, 1981. [Google Scholar]
  18. Li, H.N.; Zhang, H.Z.; Li, Q.W.; Fu, X. Research on the aerodynamic characteristics of FAST feed cabin structure and the wind-induced responses of the coupled system. Eng. Mech. 2023. Available online: https://kns.cnki.net/kcms/detail/11.2595.2503.20230423.20231715.20230002.html (accessed on 24 April 2023).
  19. GB 50009-2012; Load Code for the Design of Building Structures. China Architecture & Building Press: Beijing, China, 2012.
  20. Solari, G.; Tubino, F. A turbulence model based on principal components. Probab. Eng. Mech. 2002, 17, 327–335. [Google Scholar] [CrossRef]
  21. Solari, G.; Piccardo, G. Probabilistic 3-D turbulence modeling for gust buffeting of structures. Probab. Eng. Mech. 2001, 16, 73–86. [Google Scholar] [CrossRef]
  22. Shiotani, M.; Arai, H. Lateral Structures of Gusts in High Winds. In Proceedings of the International Research Seminar on Wind Effects on Buildings and Structures, Ottawa, ON, Canada, 11–15 September 1967; University of Toronto Press: Ottawa, ON, Canada, 1967. [Google Scholar]
  23. Deodatis, G. Simulation of ergodic multivariate stochastic processes. J. Eng. Mech. 1996, 122, 778–787. [Google Scholar] [CrossRef]
  24. Wang, D.H.; Chen, X.Z.; Xu, K. Analysis of buffeting response of hinged overhead transmission conductor to nonstationary winds. Eng. Struct. 2017, 147, 567–582. [Google Scholar] [CrossRef]
  25. Shehata, A.; El Damatty, A. Extensible catenary approach in analyzing transmission line’s conductors under downbursts. Eng. Struct. 2021, 234, 111905. [Google Scholar] [CrossRef]
  26. Lou, W.J.; Wu, D.G.; Xu, H.W. Wind-induced conductor response considering the nonproportionality of generalized aerodynamic damping. J. Mech. Sci. Technol. 2019, 33, 3075–3084. [Google Scholar] [CrossRef]
  27. Davenport, A.G.; Sparling, B.F. Dynamic gust response factors for guyed towers. J. Wind Eng. Ind. Aerodyn. 1992, 43, 2237–2248. [Google Scholar] [CrossRef]
  28. Davenport, A.G. Note on the distribution of the largest value of a random function with applications to gust loading. Proc. Inst. Civ. Eng. 1964, 28, 187–196. [Google Scholar] [CrossRef]
  29. DL/T 5551-2018; Load Code for the Design of Overhead Transmission Line. China Planning Press: Beijing, China, 2018.
Figure 1. Flowchart of this study.
Symmetry 15 01965 g001
Figure 2. Overall site image of FAST.
Symmetry 15 01965 g002
Figure 3. Finite element model of the FAST. (a) FEM of Tower 6; (b) Details of the feed cabin; (c) The overall FEM of the FAST.
Symmetry 15 01965 g003
Figure 4. Diagram of wind direction.
Symmetry 15 01965 g004
Figure 5. The simulated wind speed time histories.
Symmetry 15 01965 g005
Figure 6. The comparison between the simulated spectrum and the Davenport spectrum.
Symmetry 15 01965 g006
Figure 7. Displacement–time history curve of feed cabin structure with or without supporting tower. (a) Translation in the east–west direction (x axis); (b) Translation in the north–south direction (z axis); (c) Rotation around the east–west axis (x axis); (d) Rotation around the north–south axis (x axis).
Symmetry 15 01965 g007
Figure 8. PSD of the feed cabin with or without supporting tower. (a) Translation in the east–west direction (x axis); (b) Translation in the north–south direction (z axis); (c) Rotation around the east–west axis (x axis); and (d) Rotation around the north–south axis (x axis).
Symmetry 15 01965 g008
Figure 9. Translational displacement of the supporting tower top. (a) east–west direction (x axis); and (b) north–south direction (z axis).
Symmetry 15 01965 g009
Figure 10. Cable tension.
Symmetry 15 01965 g010
Figure 11. Base bending moment.
Symmetry 15 01965 g011
Figure 12. GRF based on the axial force of the tower under the design wind speed.
Symmetry 15 01965 g012
Figure 13. GRFs based on different equivalent targets under different wind speeds. (a) Based on the base-bending moment; (b) based on the cable tension; (c) based on the displacement of the feed cabin.
Symmetry 15 01965 g013
Figure 14. Simulation-based tower GRF under different wind speeds. (a) 10 m/s; (b) 14 m/s; and (c) 20 m/s.
Symmetry 15 01965 g014
Figure 15. Code-based tower GRF under different wind speeds. (a) 10 m/s; (b) 14 m/s; and (c) 20 m/s.
Symmetry 15 01965 g015
Figure 16. GRFs of different responses under different wind directions. (a) Based on the base-bending moment; (b) based on the cable tension; and (c) based on the displacement of the feed cabin.
Symmetry 15 01965 g016
Figure 17. GRF based on the tower axial force under different wind directions. (a) 0°; (b) 15°; (c) 30°; (d) 45°.
Symmetry 15 01965 g017
Table 1. Composition and material properties of various components.
Material of Feed CabinMaterial of Main MembersMaterial of Secondary Members Structural Type of CablesDiameter of CablesTensile Strength of Cables
Q345 steelQ345 steelQ235 steelSteel wire rope46 mm1960 MPa
Table 2. GRFs based on the displacement of the feed cabin under the design wind speed.
Vibration DirectionAlong WindCrosswindVertical
GRF1.12203.27771.8828
Table 3. GRFs based on cable tension under the design wind speed.
Cable Number123456
GRF1.46971.40921.31071.25901.45552.5090
Table 4. GRFs based on the base-bending moment of the tower under the design wind speed.
Tower Number123456
GRF1.39111.36331.34881.30611.33222.0951
Disclaimer/Publisher’s Note: The statements, opinions and data contained in all publications are solely those of the individual author(s) and contributor(s) and not of MDPI and/or the editor(s). MDPI and/or the editor(s) disclaim responsibility for any injury to people or property resulting from any ideas, methods, instructions or products referred to in the content.

